Untitled - socium.ge
Untitled - socium.ge Untitled - socium.ge
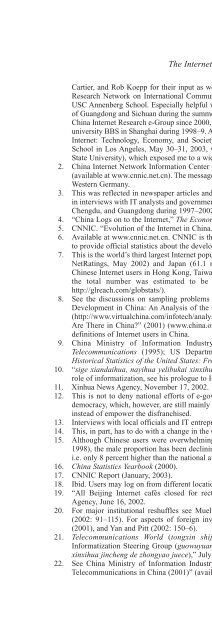
The digital divide in Detroit 257Table 11.3OLS and logistic coefficients from the regression of computerand Internet use on income, education, age, race, gender,employment status, location, and family structure(2)(1) No. of (3) (4) (5)Do you use computers Frequency Do you use Do you usea computer? used at of computer the Internet? the Internet atVariables (logistic) home (OLS) use (OLS) (logistic) home (logistic)Income 0.350*** 0.216*** 0.242*** 0.394*** 0.430***(0.070) (0.030) (0.035) (0.071) (0.112)Education 0.676*** 0.152** 0.412*** 0.745*** 0.286(0.124) (0.050) (0.058) (0.121) (0.175)Youth (18–25) 1.811*** 0.237 0.853*** 2.495*** –1.677*(0.442) (0.187) (0.218) (0.441) (0.736)Middle-aged 1.309*** 0.337* 0.696*** 1.799*** –1.439*(26–54) (0.342) (0.152) (0.177) (0.334) (0.735)African –0.285 0.081 –0.011 –0.737* 0.349 +American (0.381) (0.180) (0.210) (0.368) (0.641)Gender –0.031 –0.059 –0.080 0.173 –0.759*(female) (0.259) (0.110) (0.129) (0.251) (0.384)Currently 0.553* 0.170 0.409** 0.098 –0.461employed (0.268) (0.124) (0.144) (0.266) (0.437Lives in –0.218 0.201 –0.202 –0.409 1.859**suburbs (0.392) (0.187) (0.218) (0.383) (0.609)Children at –0.276 0.248* –0.189 –0.270 1.117**home (0.313) (0.124) (0.144) (0.291) (0.396)Constant –3.977*** –1.066*** –0.782* –4.878*** –1.738Adjusted r 2 or 0.396 0.237 0.328 0.454 0.298Nagelkerke r 2 *Correctly 80.8 n.a. n.a. 80.8 86.9classified (%)Weighted n of 508 508 507 508 346observations*** p
258 Wayne E. Baker and Kenneth M. ColemanAfrican Americans are not significantly less likely than others to use acomputer; similarly, race does not predict the number of computers used athome or the frequency of computer use, after controlling for the effects ofhousehold income, education, and other factors. African Americans are significantlyless likely to use the Internet, compared to non-blacks, but the effectsof income, education, and age are stronger than the effect of race on Internetuse. If African Americans do use the Internet, they are more likely to use itfrom home, once other predictors are controlled. While some analysts of thedigital divide might expect otherwise, race appears not to be the crucial variablein structuring Detroit’s digital divide.It is reasonable to suppose that computer use is a phenomenon of affluentsocial strata and, therefore, it might be structured in part by where one residesin a metropolitan area. Sheer propinquity to other computer users might havea social influence effect (for example, Lenhart, 2000; Goolsbee and Klenow,2002; DiMaggio et al., 2004). Consequently, suburban residents might behigher computer users. The multivariate analyses suggest otherwise (table11.3), with one exception. Most patterns of computer and Internet usage arenot significantly different for residents of the suburbs versus residents ofDetroit. Only use of the Internet at home distinguishes suburban residentsfrom those who live in the city of Detroit, with suburbanites more likely toconnect from home.Overall, gender is not a significant factor: men and women do not differ intheir patterns of computer and Internet usage, controlling for other factors,with one exception – connecting to the Internet from home, which women areless likely to do. Moreover, having children under the age of 18 at home issignificantly associated only with the number of computers in the householdand with connecting to the Internet from home.While not shown in table 11.3, a good way to judge the relative impact ofvarious independent variables on a dependent variable is to compare Betas, orstandardized regression coefficients. Comparing Betas for all variables inmodels 2 and 3, 5 we find that the Beta for income is the largest one in eachequation and education is second. That is, household income produces thegreatest amount of change in each indicator of Internet and computer usage,with education accounting for the second largest change in each indicator.These findings suggest that, to the extent that there is a digital divide inDetroit, it is structured primarily by income and education, age and workstatus, and to a much lesser extent by other variables, such as race or inner-citylocation. For example, returning to table 11.2, we see the odds ratios for whitesand others versus African Americans represent an increase of only 1.9 to 2.3times the probabilities of given computer-use outcomes. But the income variableproduces an increase in probabilities of certain outcomes by 10.0 to 14.7times, while the effects of education change the odds by 4.9 to 13.8 times. A
- Page 227 and 228: 206 Caitlin Zaloomadvantage of the
- Page 229 and 230: 208 Caitlin Zaloomletters to form w
- Page 231 and 232: 210 Caitlin Zaloom“reprogrammable
- Page 233 and 234: 212 Caitlin ZaloomCallon, Michel (1
- Page 236: PART IVSociability and social struc
- Page 239 and 240: 218 Keith N. Hampton“blasé attit
- Page 241 and 242: 220 Keith N. Hamptonerosion of the
- Page 243 and 244: 222 Keith N. Hamptonby the least ex
- Page 245 and 246: 224 Keith N. Hamptondid so to seek
- Page 247 and 248: 226 Keith N. Hamptonits ability to
- Page 249 and 250: 228 Keith N. Hamptonimmediately app
- Page 251 and 252: 230 Keith N. HamptonREFERENCESAngsi
- Page 253 and 254: 232 Keith N. HamptonSouthern Califo
- Page 255 and 256: 234 Manuel Castells et al.this stud
- Page 257 and 258: 236 Manuel Castells et al.On the ot
- Page 259 and 260: 238 Manuel Castells et al.friends a
- Page 261 and 262: 240 Manuel Castells et al.Table 10.
- Page 263 and 264: 242 Manuel Castells et al.way behin
- Page 265 and 266: 244 Manuel Castells et al.by radio.
- Page 267 and 268: 246 Manuel Castells et al.The six t
- Page 269 and 270: 248 Manuel Castells et al.that belo
- Page 271 and 272: 250 Wayne E. Baker and Kenneth M. C
- Page 273 and 274: 252 Wayne E. Baker and Kenneth M. C
- Page 275 and 276: 254 Wayne E. Baker and Kenneth M. C
- Page 277: 256 Wayne E. Baker and Kenneth M. C
- Page 281 and 282: 260 Wayne E. Baker and Kenneth M. C
- Page 283 and 284: Table 11.5Logistic coefficients fro
- Page 285 and 286: 264 Wayne E. Baker and Kenneth M. C
- Page 287 and 288: 266 Wayne E. Baker and Kenneth M. C
- Page 289 and 290: 268 Wayne E. Baker and Kenneth M. C
- Page 292 and 293: 12. The promise and the myths ofe-l
- Page 294 and 295: e-learning in post-secondary educat
- Page 296 and 297: e-learning in post-secondary educat
- Page 298 and 299: Public Dual-mode Institutionse-lear
- Page 300 and 301: e-learning in post-secondary educat
- Page 302 and 303: e-learning in post-secondary educat
- Page 304 and 305: • the courses are delivered globa
- Page 306 and 307: e-learning in post-secondary educat
- Page 308 and 309: e-learning in post-secondary educat
- Page 310 and 311: e-learning in post-secondary educat
- Page 312 and 313: e-learning in post-secondary educat
- Page 314 and 315: 13. e-health networks and socialtra
- Page 316 and 317: e-health networks and social transf
- Page 318 and 319: e-health networks and social transf
- Page 320 and 321: e-health networks and social transf
- Page 322 and 323: e-health networks and social transf
- Page 324 and 325: e-health networks and social transf
- Page 326 and 327: e-health networks and social transf
The digital divide in Detroit 257Table 11.3OLS and logistic coefficients from the regression of computerand Internet use on income, education, a<strong>ge</strong>, race, <strong>ge</strong>nder,employment status, location, and family structure(2)(1) No. of (3) (4) (5)Do you use computers Frequency Do you use Do you usea computer? used at of computer the Internet? the Internet atVariables (logistic) home (OLS) use (OLS) (logistic) home (logistic)Income 0.350*** 0.216*** 0.242*** 0.394*** 0.430***(0.070) (0.030) (0.035) (0.071) (0.112)Education 0.676*** 0.152** 0.412*** 0.745*** 0.286(0.124) (0.050) (0.058) (0.121) (0.175)Youth (18–25) 1.811*** 0.237 0.853*** 2.495*** –1.677*(0.442) (0.187) (0.218) (0.441) (0.736)Middle-a<strong>ge</strong>d 1.309*** 0.337* 0.696*** 1.799*** –1.439*(26–54) (0.342) (0.152) (0.177) (0.334) (0.735)African –0.285 0.081 –0.011 –0.737* 0.349 +American (0.381) (0.180) (0.210) (0.368) (0.641)Gender –0.031 –0.059 –0.080 0.173 –0.759*(female) (0.259) (0.110) (0.129) (0.251) (0.384)Currently 0.553* 0.170 0.409** 0.098 –0.461employed (0.268) (0.124) (0.144) (0.266) (0.437Lives in –0.218 0.201 –0.202 –0.409 1.859**suburbs (0.392) (0.187) (0.218) (0.383) (0.609)Children at –0.276 0.248* –0.189 –0.270 1.117**home (0.313) (0.124) (0.144) (0.291) (0.396)Constant –3.977*** –1.066*** –0.782* –4.878*** –1.738Adjusted r 2 or 0.396 0.237 0.328 0.454 0.298Na<strong>ge</strong>lkerke r 2 *Correctly 80.8 n.a. n.a. 80.8 86.9classified (%)Weighted n of 508 508 507 508 346observations*** p


