Climate change, impacts and vulnerability in Europe ... - MemoFin.fr
Climate change, impacts and vulnerability in Europe ... - MemoFin.fr Climate change, impacts and vulnerability in Europe ... - MemoFin.fr
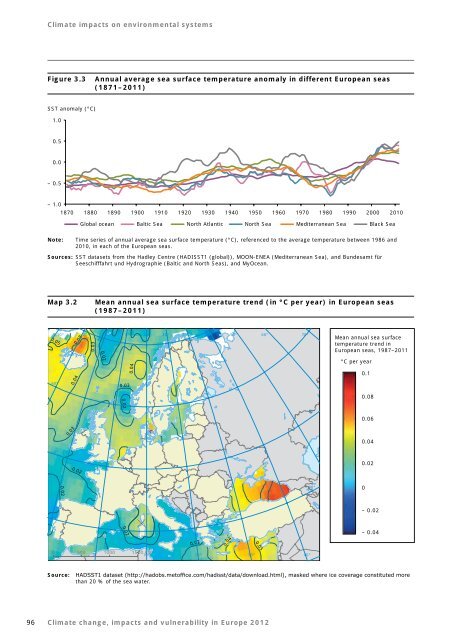
Climate impacts on environmental systemsFigure 3.3Annual average sea surface temperature anomaly in different European seas(1871–2011)SST anomaly (°C)1.00.50.0– 0.5– 1.01870 1880 1890 1900 1910 1920 1930 1940 1950 1960 1970 1980 1990 2000 2010Global ocean Baltic Sea North Atlantic North Sea Mediterranean Sea Black SeaNote:Time series of annual average sea surface temperature (°C), referenced to the average temperature between 1986 and2010, in each of the European seas.Sources: SST datasets from the Hadley Centre (HADISST1 (global)), MOON-ENEA (Mediterranean Sea), and Bundesamt fürSeeschifffahrt und Hydrographie (Baltic and North Seas), and MyOcean.Map 3.2Mean annual sea surface temperature trend (in °C per year) in European seas(1987–2011)0.05-30°0.08-20°0.03-10°0°10°20°30°40°50°60°70°Mean annual sea surfacetemperature trend inEuropean seas, 1987–20110.020.04°C per year0.160°0.040.030.080.0250°0.060.030.0450°0.020.020.0240°0– 0.0240°0.020.020.04– 0.040.050 500 1000 1500 km0°10°20°30°40°Source: HADSST1 dataset (http://hadobs.metoffice.com/hadisst/data/download.html), masked where ice coverage constituted morethan 20 % of the sea water.96 Climate change, impacts and vulnerability in Europe 2012
Climate impacts on environmental systems3.1.5 Phenology of marine speciesRelevancePhenology is the study of annually recurringlife-cycle events of species, such as the timing ofmigrations and flowering of plants. In the marineenvironment, phenology indicators include thetiming of the spring phytoplankton bloom andthe peak in abundance of other marine organisms.Change in phenology is one of the key indicatorsof the impacts of climate change on biologicalpopulations. Because marine species have differentsensitivities to changes in temperature, thesechanges may lead to large shifts in the marine foodweb that can ultimately affect the food available tofish, birds or marine mammals. Differing responseshave been seen across various levels of the food web(Thackeray et al., 2010).Changes in the phenology of different planktonspecies are seen as a factor contributing to thedecline in North Sea cod stocks, which was causedinitially by over-fishing, and they have probablyaffected other fish populations (such as sandeels) that are an essential food source for seabirds(Beaugrand et al., 2003; Edwards and Richardson,2004; Frederiksen et al., 2006).In the North Sea, work on pelagic phenology hasshown that plankton communities, includingfish larvae, are very sensitive to regional climatewarming. Responses to warming vary betweentrophic levels and functional groups, which maycreate a so-called 'trophic mismatch' betweenone species and their food source (Thackerayet al., 2010) (see also Section 3.4 for terrestrialecosystems). The sexual maturation of decapodalarvae has been found to be particularly sensitiveto water temperature and is therefore regardedas representative of phenological changes in theshelf-sea environments (Lindley, 2009). Other taxathat also have their seasonal development closelytriggered by temperature changes are also highlysensitive (e.g. echinoderm larvae, dinoflagellates,copepods).Past trendsThe zooplankton growing season indicator showsthe annual timing of peak seasonal abundanceof decapoda larvae from 1958–2009 in the centralNorth Sea (Figure 3.4 left). A shift towards an earlierseasonal peak is clearly visible, in particular since1988. Since the 1990s the seasonal development ofdecapoda larvae has occurred 4–6 weeks earlier thanthe long‐term average (baseline mean 1958–2009).This trend towards an earlier seasonal appearanceof decapoda larvae during the 1990s is highlycorrelated with SSTs (Figure 3.4 right). Even thoughdecapoda larvae are not routinely identified tospecies level, a recent study has shown that thesephenological shifts are a response at the specieslevel, and not simply different seasonal timings bydifferent species (Lindley and Kirby, 2010).Key messages: 3.1.5 Phenology of marine species• Temperature increases in the ocean have caused many marine organisms in European seas to appearearlier in their seasonal cycles than in the past. Some plankton species have advanced their seasonalcycle by 4–6 weeks in recent decades.• Projections of the phenological responses of individual species are not available, but phenologicalchanges are expected to continue with projected further climate change.• Changes in the plankton phenology have important consequences for other organisms within anecosystem and ultimately for the structure of marine food -webs at all trophic levels. Potentialconsequences include increased vulnerability of North Sea cod stocks to over-fishing; and changes inseabird populations.Climate change, impacts and vulnerability in Europe 201297
- Page 49 and 50: IntroductionThe term risk is also i
- Page 51 and 52: Changes in the climate system2 Chan
- Page 53 and 54: Changes in the climate systemdammin
- Page 55 and 56: Changes in the climate system2.1.4
- Page 57 and 58: Changes in the climate systemSelect
- Page 59 and 60: Changes in the climate systemPast t
- Page 61 and 62: Changes in the climate systemEurope
- Page 63 and 64: Changes in the climate systemSevera
- Page 65 and 66: Changes in the climate systemMap 2.
- Page 67 and 68: Changes in the climate systemMap 2.
- Page 69 and 70: Changes in the climate systemMap 2.
- Page 71 and 72: Changes in the climate systemMap 2.
- Page 73 and 74: Changes in the climate systemclosel
- Page 75 and 76: Changes in the climate system2.3 Cr
- Page 77 and 78: Changes in the climate systemPast t
- Page 79 and 80: Changes in the climate systemof up
- Page 81 and 82: Changes in the climate systemFigure
- Page 83 and 84: Changes in the climate systemFigure
- Page 85 and 86: Changes in the climate system2.3.5
- Page 87 and 88: Changes in the climate systemBox 2.
- Page 89 and 90: Changes in the climate systemFigure
- Page 91 and 92: Climate impacts on environmental sy
- Page 93 and 94: Climate impacts on environmental sy
- Page 95 and 96: Climate impacts on environmental sy
- Page 97: Climate impacts on environmental sy
- Page 101 and 102: Climate impacts on environmental sy
- Page 103 and 104: Climate impacts on environmental sy
- Page 105: Climate impacts on environmental sy
- Page 108 and 109: Climate impacts on environmental sy
- Page 110 and 111: Climate impacts on environmental sy
- Page 112 and 113: Climate impacts on environmental sy
- Page 114 and 115: Climate impacts on environmental sy
- Page 116 and 117: Climate impacts on environmental sy
- Page 118 and 119: Climate impacts on environmental sy
- Page 120: Climate impacts on environmental sy
- Page 123 and 124: Climate impacts on environmental sy
- Page 125 and 126: Climate impacts on environmental sy
- Page 127 and 128: Climate impacts on environmental sy
- Page 129 and 130: Climate impacts on environmental sy
- Page 131 and 132: Climate impacts on environmental sy
- Page 133 and 134: Climate impacts on environmental sy
- Page 135 and 136: Climate impacts on environmental sy
- Page 137 and 138: Climate impacts on environmental sy
- Page 139: Climate impacts on environmental sy
- Page 142 and 143: Climate impacts on environmental sy
- Page 144 and 145: Climate impacts on environmental sy
- Page 146 and 147: Climate impacts on environmental sy
<strong>Climate</strong> <strong>impacts</strong> on environmental systemsFigure 3.3Annual average sea surface temperature anomaly <strong>in</strong> different <strong>Europe</strong>an seas(1871–2011)SST anomaly (°C)1.00.50.0– 0.5– 1.01870 1880 1890 1900 1910 1920 1930 1940 1950 1960 1970 1980 1990 2000 2010Global ocean Baltic Sea North Atlantic North Sea Mediterranean Sea Black SeaNote:Time series of annual average sea surface temperature (°C), referenced to the average temperature between 1986 <strong>and</strong>2010, <strong>in</strong> each of the <strong>Europe</strong>an seas.Sources: SST datasets <strong>fr</strong>om the Hadley Centre (HADISST1 (global)), MOON-ENEA (Mediterranean Sea), <strong>and</strong> Bundesamt fürSeeschifffahrt und Hydrographie (Baltic <strong>and</strong> North Seas), <strong>and</strong> MyOcean.Map 3.2Mean annual sea surface temperature trend (<strong>in</strong> °C per year) <strong>in</strong> <strong>Europe</strong>an seas(1987–2011)0.05-30°0.08-20°0.03-10°0°10°20°30°40°50°60°70°Mean annual sea surfacetemperature trend <strong>in</strong><strong>Europe</strong>an seas, 1987–20110.020.04°C per year0.160°0.040.030.080.0250°0.060.030.0450°0.020.020.0240°0– 0.0240°0.020.020.04– 0.040.050 500 1000 1500 km0°10°20°30°40°Source: HADSST1 dataset (http://hadobs.metoffice.com/hadisst/data/download.html), masked where ice coverage constituted morethan 20 % of the sea water.96 <strong>Climate</strong> <strong>change</strong>, <strong>impacts</strong> <strong>and</strong> <strong>vulnerability</strong> <strong>in</strong> <strong>Europe</strong> 2012


