Climate change, impacts and vulnerability in Europe ... - MemoFin.fr
Climate change, impacts and vulnerability in Europe ... - MemoFin.fr
Climate change, impacts and vulnerability in Europe ... - MemoFin.fr

You also want an ePaper? Increase the reach of your titles
YUMPU automatically turns print PDFs into web optimized ePapers that Google loves.
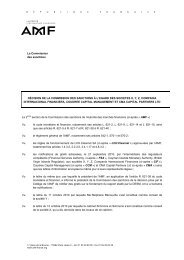
Changes <strong>in</strong> the climate systemclosely associated with atmospheric <strong>fr</strong>onts whichdel<strong>in</strong>eate <strong>change</strong>s <strong>in</strong> temperature, moisture, w<strong>in</strong>dspeed <strong>and</strong> direction, <strong>and</strong> atmospheric pressure. Innorthern <strong>and</strong> north-western <strong>Europe</strong> severe cyclonescan occur all year. In central <strong>Europe</strong> severe cyclonesoccur ma<strong>in</strong>ly between November <strong>and</strong> Februarywhereas weaker cyclones can also occur <strong>in</strong> otherseasons.north‐western <strong>Europe</strong>an dur<strong>in</strong>g the 1880s, followedby below average conditions between the 1930s <strong>and</strong>1960s, a pronounced <strong>in</strong>crease <strong>in</strong> storm<strong>in</strong>ess until themid-1990s, <strong>and</strong> average or below activity afterwards.Somewhat similar patterns were observed <strong>in</strong> otherparts of <strong>Europe</strong>.Studies of storm activity have <strong>in</strong>creased <strong>in</strong> recentyears as a result of improved observationaldatasets <strong>and</strong> the development of algorithms for theidentification <strong>and</strong> quantification of these phenomena(Ulbrich et al., 2009). In addition, high-resolutionGCM simulations for both present-day climate<strong>and</strong> climate <strong>change</strong> scenarios are <strong>in</strong>creas<strong>in</strong>glybecom<strong>in</strong>g available (van der L<strong>in</strong>den <strong>and</strong> Mitchell,2009). Nevertheless, there are still considerableuncerta<strong>in</strong>ties <strong>in</strong> our underst<strong>and</strong><strong>in</strong>g of the processes<strong>in</strong>fluenc<strong>in</strong>g current storm activity <strong>and</strong> how thesemay be affected by climate <strong>change</strong> (Bengtsson et al.,2006; P<strong>in</strong>to et al., 2007; Ulbrich et al., 2009).Storm events are associated with <strong>in</strong>tense w<strong>in</strong>ds <strong>and</strong>precipitation, which may lead to structural damage,flood<strong>in</strong>g <strong>and</strong> storm surges (see Section 3.2.3 <strong>and</strong>Chapter 5). These events can have large <strong>impacts</strong> onhuman health <strong>and</strong> on vulnerable systems, such asforests, <strong>and</strong> transport <strong>and</strong> energy <strong>in</strong><strong>fr</strong>astructures.Accord<strong>in</strong>g to the Munich Re NatCatSERVICE <strong>and</strong>the EM-DAT database, storms were the costliestnatural hazard (<strong>in</strong> terms of <strong>in</strong>sured losses) <strong>in</strong> <strong>Europe</strong>between 1998 <strong>and</strong> 2009; they ranked fourth <strong>in</strong> termsof the number of human casualties (EEA, 2011b).Map 2.966 o60 o54 o48 o42 oTrends <strong>in</strong> the extreme w<strong>in</strong>dspeeds <strong>in</strong> the period 1871–2008based on reanalysisPast trendsStudies of past <strong>change</strong>s <strong>in</strong> extra-tropical storms haveused a variety of methods for analys<strong>in</strong>g their activity<strong>in</strong> the storm track regions, mak<strong>in</strong>g it difficult tocompare the results of different studies or to assessif there is any underly<strong>in</strong>g climate <strong>change</strong> signal(Meehl et al., 2007; Ulbrich et al., 2009; Wang et al.,2011). Storm location <strong>and</strong> <strong>in</strong>tensity <strong>in</strong> <strong>Europe</strong> hasshown considerable variation over the past century.Locally, <strong>in</strong>creases <strong>in</strong> maximum gust w<strong>in</strong>d speedshave been observed over recent decades (Usbecket al., 2010) but there is evidence for decreases <strong>in</strong>storm <strong>fr</strong>equency s<strong>in</strong>ce the 1990s (Ulbrich et al.,2009). W<strong>in</strong>d data at the local or regional levels canshow a series of decreases <strong>and</strong> <strong>in</strong>creases cont<strong>in</strong>u<strong>in</strong>gover several decades. Long records of w<strong>in</strong>d speedfor various regions across <strong>Europe</strong> <strong>in</strong>dicate thatstorm<strong>in</strong>ess has not significantly <strong>change</strong>d overthe past 200 years (Matulla et al., 2007). They also<strong>in</strong>dicate relatively high levels of storm<strong>in</strong>ess <strong>in</strong>36 o 8 o W 0 o E 8 o 16 o 24 oTrends <strong>in</strong> the annual 95th percentile of daily maximumw<strong>in</strong>d speeds, 1871–2008Note:W<strong>in</strong>d speed (m/s) α = 0.05– 0.2 – 0.15 – 0.1 – 0.05 0 0.05 0.1 0.15 0.2Gale day trends> 0.075 > 0.070 > 0.065 > 0.060 > 0.055Trends <strong>in</strong> the annual 95th percentile of daily maximumw<strong>in</strong>d speeds <strong>in</strong> the 20th century reanalysis data set(ensemble mean) dur<strong>in</strong>g the period 1871–2008.The trend is given <strong>in</strong> the units of the <strong>in</strong>terannualst<strong>and</strong>ard deviation <strong>and</strong> plotted only when significant.The coloured circles <strong>in</strong>dicate trends <strong>in</strong> the number of'gale days' (an <strong>in</strong>dex that represents the number ofextremely w<strong>in</strong>dy days) over the period at the specificlocations.Source: Donat, Renggli, et al., 2011.<strong>Climate</strong> <strong>change</strong>, <strong>impacts</strong> <strong>and</strong> <strong>vulnerability</strong> <strong>in</strong> <strong>Europe</strong> 201271