Climate change, impacts and vulnerability in Europe ... - MemoFin.fr
Climate change, impacts and vulnerability in Europe ... - MemoFin.fr
Climate change, impacts and vulnerability in Europe ... - MemoFin.fr

Create successful ePaper yourself
Turn your PDF publications into a flip-book with our unique Google optimized e-Paper software.
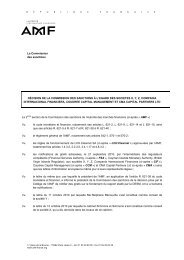
Changes <strong>in</strong> the climate system<strong>Europe</strong>:The decadal average temperature over <strong>Europe</strong>anl<strong>and</strong> areas <strong>in</strong>creased by approximately 1.3 °C(± 0.11 °C) between pre-<strong>in</strong>dustrial times <strong>and</strong> thedecade of 2002 to 2011 (Figure 2.7 upper). The<strong>in</strong>terannual temperature variability over <strong>Europe</strong> isgenerally much higher <strong>in</strong> w<strong>in</strong>ter (Figure 2.7 middle)than <strong>in</strong> summer. The relatively rapid warm<strong>in</strong>g trends<strong>in</strong>ce the 1980s is most clearly evident <strong>in</strong> the summer(Figure 2.7 lower).Particularly large warm<strong>in</strong>g has been observed<strong>in</strong> the past 50 years over the Iberian Pen<strong>in</strong>sula,across central <strong>and</strong> north-eastern <strong>Europe</strong>, <strong>and</strong> <strong>in</strong>mounta<strong>in</strong>ous regions. Over the past 30 years,warm<strong>in</strong>g was the strongest over Sc<strong>and</strong><strong>in</strong>avia,especially <strong>in</strong> w<strong>in</strong>ter, whereas the Iberian Pen<strong>in</strong>sulawarmed mostly <strong>in</strong> summer (Haylock et al., 2008)(Map 2.1).ProjectionsGlobal:The global average temperature will cont<strong>in</strong>ueto <strong>in</strong>crease throughout the 21st century as aresult of projected further <strong>in</strong>creases <strong>in</strong> GHGconcentrations (Figure 2.8). Forced by a range offuture possible emissions scenarios (IPCC SRESscenarios (Nakicenovic <strong>and</strong> Swart, 2000)), thecentral estimate for the warm<strong>in</strong>g averaged for thenear future (2011–2030) compared to 1980–1999 isbetween + 0.64 °C <strong>and</strong> + 0.69 °C (Solomon et al.,2007). By the mid‐century (2046–2065), projected<strong>in</strong>creases of between + 1.3 °C <strong>and</strong> + 1.8 °C for thesame models <strong>and</strong> scenarios were noted, <strong>and</strong> by thelate 21st century (2090–2099), these ranged between+ 1.8 °C <strong>and</strong> + 4.0 °C. When model uncerta<strong>in</strong>ty is<strong>in</strong>cluded, the likely range extends to 1.1 to 6.4 °C, asshown by the grey bars to the right of Figure 2.8.Figure 2.7<strong>Europe</strong>an average temperature (1850–2011) over l<strong>and</strong> areas for annual (upper),w<strong>in</strong>ter (middle) <strong>and</strong> summer (lower) periodsChange (°C)2Annual10– 121W<strong>in</strong>ter0– 12Summer10– 11850 1900 1950 2000Met Office Hadley Centre <strong>and</strong> UEA Climatic Research UnitNOAA National Climatic Data CenterNASA Goddard Institute for Space StudiesNote: Datasets, pre-<strong>in</strong>dustrial periods <strong>and</strong> techniques are the same as for Figure 2.5.Source:1) Black l<strong>in</strong>e — HadCRUT3 <strong>fr</strong>om the UK Met Office Hadley Centre <strong>and</strong> University of East Anglia <strong>Climate</strong> Research Unit,basel<strong>in</strong>e period 1850–1899 (Brohan et al., 2006). The grey area represents the 95 % confidence range.2) Red l<strong>in</strong>e — MLOST <strong>fr</strong>om the US National Oceanic <strong>and</strong> Atmospheric Adm<strong>in</strong>istration (NOAA) National Climatic Data Center,basel<strong>in</strong>e period 1880–1899 (Smith et al., 2008).3) Blue l<strong>in</strong>e — GISSTemp <strong>fr</strong>om the National Aeronautics <strong>and</strong> Space Adm<strong>in</strong>istration (NASA) Goddard Institute for SpaceStudies, basel<strong>in</strong>e period 1880–1899 (Hansen et al., 2010).<strong>Climate</strong> <strong>change</strong>, <strong>impacts</strong> <strong>and</strong> <strong>vulnerability</strong> <strong>in</strong> <strong>Europe</strong> 201259