- Page 2:
Visit the department’s website at
- Page 8 and 9:
Chief Executive ForewordChief Execu
- Page 10 and 11:
10Department Health and Families
- Page 12 and 13:
Dr Barbara PatersonCorporate Plan P
- Page 14 and 15:
Peter BeirneCorporate Plan Priority
- Page 16:
In comparing data between 1994-98 a
- Page 19 and 20:
Aboriginal Health and FamiliesProf.
- Page 21:
Corporate Plan 2009 - 2012Vision, M
- Page 25 and 26:
to detect, monitor, report and eval
- Page 27 and 28:
PRIORITY ACTION AREA 2Healthy Child
- Page 29 and 30:
to parents at key ages i.e. exclusi
- Page 31 and 32:
PRIORITY ACTION AREA 3Targeting Smo
- Page 33 and 34:
the health effects of smoking from
- Page 35 and 36:
PRIORITY ACTION AREA 4Connecting Ca
- Page 37 and 38:
The Chief Minister’s Youth Round
- Page 39 and 40:
Created four additional positions i
- Page 41 and 42:
PRIORITY ACTION AREA 5Safety, Quali
- Page 43 and 44:
essential to make sure that, wherev
- Page 45 and 46:
PRIORITY ACTION AREA 6Attract, Deve
- Page 47 and 48:
Established an Indigenous Nursing a
- Page 49 and 50:
Implement the Professional Practice
- Page 51 and 52:
The Integrated Maternity Services C
- Page 53 and 54:
Radiation Oncology Services
- Page 55 and 56:
Service Map DetailsDepartment Healt
- Page 57 and 58:
NT HEALTH FACILITIESDEPARTMENT OF H
- Page 59 and 60:
Through the East Arnhem Regionalisa
- Page 61 and 62:
very effective with the Alice Sprin
- Page 63 and 64:
Across the TerritoryDigital Regions
- Page 65 and 66: Our PeopleDepartment Health and Fam
- Page 67 and 68: Snapshot of our peopleFigure 1 show
- Page 69 and 70: National Indigenous Cadetship Progr
- Page 71 and 72: Supporting our PeopleHuman Resource
- Page 73 and 74: Managing AggressionAggression Manag
- Page 75 and 76: Eliminating bullying and harassment
- Page 77 and 78: Graduate ProgramThe Department has
- Page 79 and 80: GovernanceDepartment Health and Fam
- Page 81 and 82: NT Family & ChildrenAdvisory Counci
- Page 83 and 84: Royal Darwin Hospital Medical Evacu
- Page 85 and 86: Coronial FindingsThe Coroners Act e
- Page 87 and 88: NTFC options for a complaint outcom
- Page 89 and 90: Sentinel Eventsdeath or serious har
- Page 91 and 92: Human Research Ethics CommitteeThe
- Page 93 and 94: Department Health and Families 93
- Page 95 and 96: Table 16: Budget by Output groups20
- Page 97 and 98: NT Families and ChildrenDepartment
- Page 99 and 100: Key Achievementsfurther increases i
- Page 101 and 102: Key AchievementsAdditional funds of
- Page 103 and 104: The Youth Triage Team was formed in
- Page 105 and 106: Youth ServicesThe Northern Territor
- Page 107 and 108: Performance Measure2008-09Actual200
- Page 109 and 110: Acute CareDepartment Health and Fam
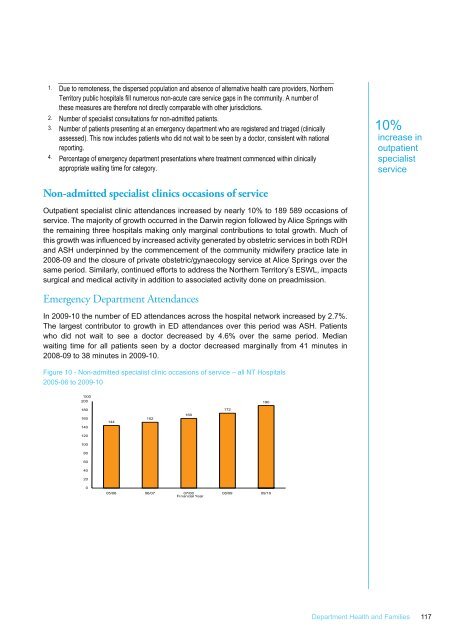
- Page 111 and 112: 1. “Due to remoteness, the disper
- Page 113 and 114: Figure 5 - Weighted Separations by
- Page 115: There are three types of treatment
- Page 119 and 120: HospitalsAlice Springs HospitalTota
- Page 121 and 122: Audiologist (visits from Darwin) Ce
- Page 123 and 124: Patients requiring services that ar
- Page 125 and 126: Health and Wellbeing ServicesDepart
- Page 127 and 128: in remote communities. Children are
- Page 129 and 130: Key AchievementsMore than 70 facili
- Page 131 and 132: Healthy Pregnancy Healthy Baby info
- Page 133 and 134: The core clinical and health promot
- Page 136 and 137: School Screening Services (SSS)The
- Page 138 and 139: increased access to after-hours med
- Page 140 and 141: Key AchievementsImplemented the NT
- Page 142 and 143: Community Support Services for Frai
- Page 144 and 145: Commenced development and implement
- Page 146 and 147: 146Department Health and Families
- Page 148 and 149: Public Health ServicesEnvironmental
- Page 150 and 151: Key AchievementsNo Germs on MeThe
- Page 152 and 153: Figure 13: NT Schedule 8 drug presc
- Page 154 and 155: 1. SHBBV 2009-10 data may not be co
- Page 156 and 157: of on-shore detections of exotic Ae
- Page 158 and 159: In July 2009 a National Coordinatio
- Page 160 and 161: Tuberculosis and Leprosy Unitwith a
- Page 162 and 163: 1 The Alcohol and Other Drugs Progr
- Page 164 and 165: other drugs nursing position is bas
- Page 166 and 167:
Father Flynn FellowshipThe Father F
- Page 168 and 169:
Sales of Goods &Services4%Other Rev
- Page 170 and 171:
Grants and Subsidies
- Page 172 and 173:
CERTIFICATION OF THE FINANCIAL STAT
- Page 174 and 175:
Balance SheetNOTE 2010$'0002009$'00
- Page 176 and 177:
Cash Flow StatementNOTE2010$’0002
- Page 178 and 179:
1. Objectives and fundingThe Depart
- Page 180 and 181:
c) Agency and Territory Itemsand eq
- Page 182 and 183:
Revenue in respect of Appropriation
- Page 184 and 185:
o) ReceivablesReceivables include a
- Page 186 and 187:
t) Employee Benefitsmeasured at pre
- Page 188 and 189:
3. Comrehensive operating statement
- Page 190 and 191:
2010$'0002009$'000Note 6 (cont)Unal
- Page 192 and 193:
10 PROPERTY, PLANT AND EQUIPMENT (C
- Page 194 and 195:
11c HERITAGE AND CULTURAL ASSETS201
- Page 196 and 197:
2010$’0002009$’00017. NOTES TO
- Page 198 and 199:
18. FINANCIAL INSTRUMENTS (continue
- Page 200 and 201:
18. FINANCIAL INSTRUMENTS (continue
- Page 202 and 203:
20. CONTINGENT LIABILITIES AND CONT
- Page 204 and 205:
24. SCHEDULE OF TERRITORY ITEMSThe
- Page 206 and 207:
Appendix IFunding to External Provi
- Page 208 and 209:
Appendix II2009-10 Capital and Mino
- Page 210 and 211:
New Works 2009-10Alice Springs Hosp
- Page 212 and 213:
Appendix IIILegislation Responsibil
- Page 214 and 215:
Appendix IVCouncils, Committees and
- Page 216 and 217:
7. Raise community awareness of the
- Page 218 and 219:
Northern Territory Family and Child
- Page 220 and 221:
Key areas from terms of reference:T
- Page 222 and 223:
Australian Manufacturing Workers’
- Page 224 and 225:
Members of the Council who left in2
- Page 226 and 227:
Meetings:The Committee met in July
- Page 228 and 229:
Appendix VEmployment InstructionsDe
- Page 230 and 231:
Employment Instruction No.5Medical
- Page 232 and 233:
Appendix VIAcronymsAASAustralian Ac
- Page 234 and 235:
DHFDepartment of Health andFamilies
- Page 236 and 237:
MHSMental Health ServicesMJDMachado
- Page 238 and 239:
TBCTBCHTuberculosis CommunityHealth


