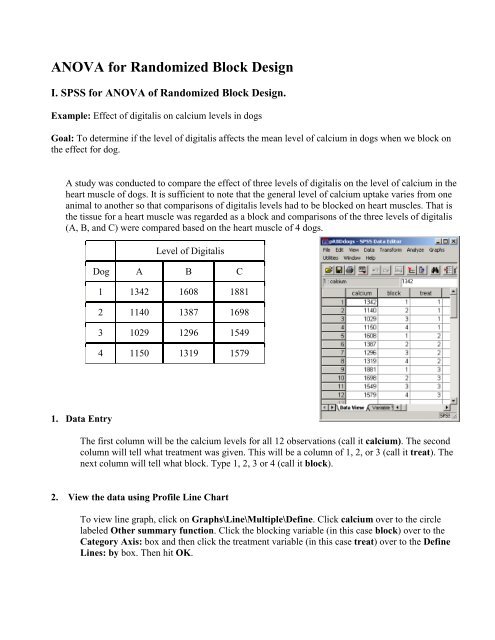
ANOVA for Randomized Block Design
ANOVA for Randomized Block Design
ANOVA for Randomized Block Design
- No tags were found...

Create successful ePaper yourself
Turn your PDF publications into a flip-book with our unique Google optimized e-Paper software.
<strong>ANOVA</strong> <strong>for</strong> <strong>Randomized</strong> <strong>Block</strong> <strong>Design</strong>I. SPSS <strong>for</strong> <strong>ANOVA</strong> of <strong>Randomized</strong> <strong>Block</strong> <strong>Design</strong>.Example: Effect of digitalis on calcium levels in dogsGoal: To determine if the level of digitalis affects the mean level of calcium in dogs when we block onthe effect <strong>for</strong> dog.A study was conducted to compare the effect of three levels of digitalis on the level of calcium in theheart muscle of dogs. It is sufficient to note that the general level of calcium uptake varies from oneanimal to another so that comparisons of digitalis levels had to be blocked on heart muscles. That isthe tissue <strong>for</strong> a heart muscle was regarded as a block and comparisons of the three levels of digitalis(A, B, and C) were compared based on the heart muscle of 4 dogs.Level of DigitalisDog A B C1 1342 1608 18812 1140 1387 16983 1029 1296 15494 1150 1319 15791. Data EntryThe first column will be the calcium levels <strong>for</strong> all 12 observations (call it calcium). The secondcolumn will tell what treatment was given. This will be a column of 1, 2, or 3 (call it treat). Thenext column will tell what block. Type 1, 2, 3 or 4 (call it block).2. View the data using Profile Line ChartTo view line graph, click on Graphs\Line\Multiple\Define. Click calcium over to the circlelabeled Other summary function. Click the blocking variable (in this case block) over to theCategory Axis: box and then click the treatment variable (in this case treat) over to the DefineLines: by box. Then hit OK.
2000There does appear tobe a difference in thethree treatmentssince the three linesare not on top ofeach other.1800160014001200Level of digitalisMean Calcium10008001234ABC<strong>Block</strong> of dogs3. State HypothesesTreatments: H 0 : µ 1 =µ 2 =µ 3 ; Ha: At least two of the means differ.If H 0 is rejected, then level of digitalis was affecting calcium levels.<strong>Block</strong>ing: H 0 : µ 1 =µ 2 =µ 3 =µ 4 ; Ha: At least two of the means differ.If H 0 is rejected, then blocking factor was important in this experiment.4. AnalysisTo per<strong>for</strong>m the <strong>Block</strong>ed <strong>ANOVA</strong>, click on Analysis(Statistics)\General LinearModel\Univariate.... Click calcium over to the Dependent Variable box. Click both treat andblock over to the Fixed Factor(s) box. Now click Model in the upper right hand corner. In thatdialogue box put the circle <strong>for</strong> Custom and then click both treat and block over to the right handbox. In the middle, click the down arrow to Main Effects. Then click off the arrow in the boxlabeled Include Intercept in Model. Then hit Continue and then hit OK.Dependent Variable: CalciumSourceModelBLOCKTREATErrorTotalTests of Between-Subjects EffectsType III Sumof Squares df Mean Square F Sig.24718632.5 a 6 4119772.083 4059.222 .000173415.000 3 57805.000 56.955 .000524177.167 2 262088.583 258.237 .0006089.500 6 1014.91724724722.0 12a. R Squared = 1.000 (Adjusted R Squared = 1.000)
5. Multiple ComparisonsRepeat the above, but click the Post Hoc button and click the treat (Treatment) variable over tothe box labeled Post Hoc Tests <strong>for</strong>: Then click the appropriate case (the output below is Tukey’sHSD).CalciumLevel of digitalisA4 1165.25Tukey HSD a,bBCSig.SubsetN 1 2 34 1402.504 1676.751.000 1.000 1.000Means <strong>for</strong> groups in homogeneous subsets are displayed.Based on Type III Sum of SquaresThe error term is Mean Square(Error) = 1014.917.a. Uses Harmonic Mean Sample Size = 4.000.b. Alpha = .05.The conclusion is that each pair is significantly different.II. Do An ExerciseUsing decoys is a common method of hunting waterfowl. A study compared the effectiveness of threedifferent decoy types – taxidermy-mounted decoys, plastic shell decoys, and full-bodied plastic decoys –in attracting Canada geese to sunken pit blinds. In order to account <strong>for</strong> an extraneous source of variation,three pit blinds were used as blocks in the experiment. Thus, a randomized block design with threetreatments (decoy types) and three blocks (pit blinds) was employed. The response variable was thepercentage of a goose flock to approach within 50 meters of the pit blind on a given day. The data aregiven in the following table.Blind Shell Full-Bodies Taxidermy-Mounted1 8.3 15.6 23.52 13.4 11.4 20.73 17.3 13.4 26.5Per<strong>for</strong>m the analysis using SPSS to compare the response means of the three decoy types. Write asummary of your analysis. You must have the problem briefly explained, state the hypothesis to betested, interpret the SPSS output and draw conclusion, and do at least what has been shown in theexample.III. Find and Read the Multiple Comparison Methods using SPSS Help.