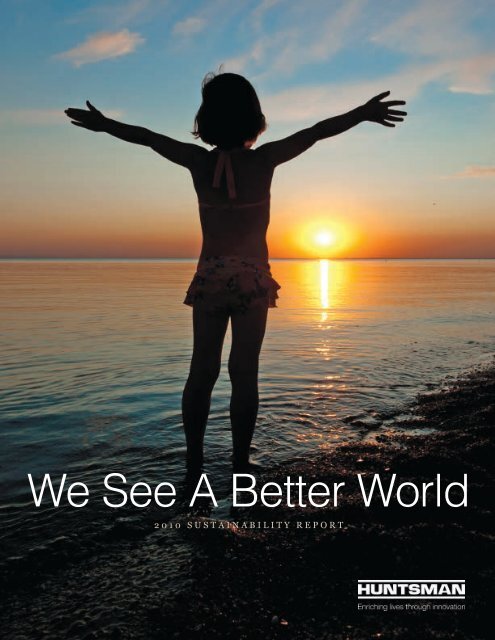
We See A Better World
We See A Better World
We See A Better World

Create successful ePaper yourself
Turn your PDF publications into a flip-book with our unique Google optimized e-Paper software.
<strong>We</strong> <strong>See</strong> A <strong>Better</strong> <strong>World</strong><br />
2 0 1 0 S u S t a i n a b i l i t y R e p o R t
Table of Contents<br />
Introduction<br />
A Clear Vision............................................1<br />
2010 Key Figures at a Glance ....................2<br />
A Letter from the President and CEO ........3<br />
Q&A with Corporate ..................................4<br />
Sustainability Officer<br />
Our 20:20 Vision........................................5<br />
Who <strong>We</strong> Are ..............................................6<br />
Recognizing Our Successes ......................8<br />
Corporate Leadership ................................9<br />
Sustainability in Action<br />
Protecting the Environment ....................11<br />
Developing Innovative Products..............12<br />
Creating a More Sustainable Business ......16<br />
Scorecard<br />
Report Parameters ..................................21<br />
Our Baseline ............................................34<br />
Appendix<br />
1.3<br />
liters<br />
222<br />
The total number of bird species<br />
identified at our Greatham, Teesside site in<br />
the United Kingdom, where conservation<br />
initiatives are enhancing wildlife habitats.<br />
United Kingdom<br />
The amount of fresh water per person per day<br />
that potentially could be saved in major Asian textile<br />
processing countries, such as China, India and<br />
Bangladesh, thanks to Huntsman’s AVITERA SE<br />
dyes (<strong>See</strong> page 13.)<br />
China, India & Bangladesh
240<br />
1,400<br />
Total number of classrooms built<br />
for community schoolchildren<br />
around Huntsman’s Umbogintwini<br />
plant in South Africa.<br />
South Africa<br />
The number of green turtle landings that<br />
were sighted at Geliga beach, which neighbors<br />
Huntsman’s Teluk Kalung (TK) factory in<br />
Malaysia, where green turtles lay their eggs<br />
each year. It was the most landings ever<br />
recorded at the site and more than double<br />
the population in 2009.<br />
Malaysia<br />
20%<br />
The amount of carbon dioxide emissions<br />
reduced through the implementation of<br />
environmentally conscious transportation<br />
distribution and logistics strategies in<br />
The Netherlands. (<strong>See</strong> page 18.)<br />
The Netherlands<br />
A Clear Vision<br />
At Huntsman, we see a better<br />
world – one in which our<br />
innovations help reduce<br />
consumption of natural<br />
resources and improve the<br />
quality of life for people<br />
around the world.<br />
<strong>We</strong> see a work environment that<br />
encourages our associates to improve<br />
their processes to reduce resource<br />
consumption and turn waste streams<br />
into profitable products and, as a<br />
result, create and sustain jobs and<br />
enhance the bottom line.<br />
<strong>We</strong> see a company that not only<br />
boasts a strong balance sheet, but is<br />
also an active contributor to society<br />
and a champion for protecting our<br />
environment.<br />
<strong>We</strong>’re on a journey to create a more<br />
sustainable business. <strong>We</strong> have a<br />
long-term strategy to get us there<br />
called our 20:20 Vision (see page 5).<br />
It’s helping us bring into focus what<br />
needs to be done to create a more<br />
sustainable future for our associates,<br />
our company and the communities<br />
where we live and work.<br />
Throughout these pages, we’ve<br />
highlighted examples of how we’re<br />
fostering innovation to protect and<br />
enhance people, planet and profits.<br />
<strong>We</strong> believe, after reading this report,<br />
you’ll see a better world, too.<br />
Huntsman 2010 Sustainability Report 1
2010 Key Figures at a Glance<br />
Field/Performance Indicator Unit 2010 2009 2008 2007 2006<br />
Economy<br />
Revenue 1 $ million 9,250 7,665 10,056 9,496 8,717<br />
Net Income (loss) 1 $ million 32 112 610 (181) 233<br />
Adjusted EBITDA 1,2 $ million 872 529 668 932 951<br />
Capital Expenditures 1,3 $ million 202 189 418 476 283<br />
Payroll $ million 168 166 101 142 120<br />
Income Taxes $ million 33 20 37 23 74<br />
Taxes Other Than Income $ million 77 72 72 79 80<br />
Total Products/Co-Products million tonnes 8.03 7.31 8.37 8.76 8.19<br />
Remediation and Closure Reserves 4 $ million 35 36 3 3 8<br />
EHS Capital Expenditures $ million 85 54 58 69 53<br />
Environment<br />
Total Energy TerraJoules (TJ) 52,604 50,105 52,207 53,412 53,764<br />
Total Greenhouse Gas Emissions mmt CO 2e 3.46 3.25 3.50 3.68 3.58<br />
Total Air Emissions 5 (excl GHG) tonnes 16,425 12,021 22,799 19,070 16,771<br />
Total Non-Hazardous Waste tonnes 982,492 976,765 1,227,334 1,220,023 1,130,911<br />
Total Hazardous Waste tonnes 129,059 125,907 138,601 167,386 146,849<br />
Society<br />
Regular Full-Time Associates 11,797 11,390 12,602 12,602 14,432<br />
US-Based Associates 2,139 2,068 2,214 2,184 3,069<br />
Non-US Associates 9,658 9,322 10,388 11,654 11,363<br />
Contractors 6 19,289 17,184 19,310 21,793 18,558<br />
Total Recordable Incidence Rate TRIR 0.60 0.49 0.61 0.74 0.85<br />
US Chemical Industry Average 2.40 2.30 2.70 3.10 2.90<br />
Fatal Work-Related Accidents Associates 0 0 0 0 0<br />
Fatal Work-Related Accidents Contractors 0 0 1 7 0 0<br />
1. 2006-2009 were adjusted to report results of operations from an asset base consistent with 2010.<br />
2. For a reconciliation, see page 32.<br />
3. Net of reimbursement of $34 million in 2010.<br />
4. Pursuant to SEC regulations, the Company accrues liabilities (reserves) relating to anticipated environmental cleanup obligations, site remediation/reclamation and closure costs,<br />
and material monetary sanctions (i.e. enforcement penalties), which are recorded and can be reasonably estimated.<br />
5. Air emissions are releases of volatile organic compounds (VOCs), carbon monoxide (CO), nitrogen oxides (NOx), sulfur oxides (SOx), particulate matter and other contaminants.<br />
6. Number of Full Time Equivalents based upon annual reported hours worked by contractors in our safety statistics program.<br />
7. Project contractor fatality.<br />
2 Huntsman 2010 Sustainability Report
Huntsman has been dedicated<br />
to building a sustainable<br />
future for many years. <strong>We</strong><br />
started as a family business<br />
some 40 years ago in Fullerton,<br />
California, USA, and have grown<br />
into an international company with a<br />
presence in 30 countries. While we’ve<br />
experienced tremendous growth – with<br />
more than 30 acquisitions since 1970 –<br />
our basic core values and strong<br />
business ethics continue to be the<br />
foundation for our business success.<br />
One of our key core values is excellence<br />
in environmental, health and safety (EHS)<br />
performance. It is deeply embedded in<br />
our culture and we have a track record of<br />
which we are extremely proud. While we<br />
have long captured metrics to measure<br />
our EHS performance, this first-ever 2010<br />
sustainability report follows through on<br />
our commitment to formalize and<br />
strengthen our sustainability efforts.<br />
During 2010, we launched our 20:20<br />
Vision – a new 10-year strategy for our<br />
EHS program that is aligned with our<br />
A L E T T E R F R O M T H E P R E S I D E N T A N D C E O<br />
rapidly evolving business needs and the<br />
dynamic market environments in which<br />
we operate. (<strong>See</strong> page 5.)<br />
Besides being committed to safe and<br />
reliable operations, we make products<br />
that have an enormous impact on society.<br />
Our high-efficiency insulation and<br />
building materials conserve energy and<br />
lower operating costs. Our products help<br />
build more efficient wind turbines, add<br />
solar reflective properties to paints and<br />
coatings and help conserve water in<br />
textile production. Our chemistries<br />
replace metals with lighter, energy-efficient<br />
composite materials and traditional<br />
fossil fuels with plant-based materials.<br />
As we continue to expand our presence<br />
around the world, we strive to continually<br />
improve our operations. For example,<br />
when an associate at one of our joint<br />
ventures in India reported compliance<br />
issues that pre-dated our involvement,<br />
we conducted an internal investigation<br />
that resulted in organizational improvements<br />
to safeguard against illegal or<br />
improper activity.<br />
Our 20:20 Vision defines a clear and compelling EHS vision<br />
statement to guide us through the next decade:<br />
<strong>We</strong> see a global marketplace that will<br />
continue to grow and evolve, yet be<br />
influenced by megatrends, including<br />
population growth, more costly fossil<br />
fuels and pressure on food and drinking<br />
water supplies. <strong>We</strong> believe we can<br />
make a sustainable difference with<br />
products and innovations that can<br />
provide solutions to many of the<br />
world’s needs.<br />
When I’m asked how Huntsman defines<br />
sustainability, I point to the words in<br />
our corporate logo: “Enriching lives<br />
through innovation.” <strong>We</strong> are driven<br />
by innovation. <strong>We</strong> believe new ideas,<br />
products and services can have a<br />
social, environmental and economic<br />
impact and help us contribute to a<br />
better world.<br />
peter R. Huntsman<br />
President and Chief Executive Officer<br />
“ provide innovative solutions which<br />
enrich lives and help create a sustainable<br />
future with no harm to people or to<br />
the environment.”<br />
Huntsman 2010 Sustainability Report 3
How <strong>We</strong> Approach<br />
Sustainability<br />
G E T T I N G T O T H E H E A R T<br />
O F T H E M A T T E R W I T H<br />
R O N G E R R A R D , H U N T S M A N<br />
C O R P O R A T E S U S T A I N A B I L I T Y<br />
O F F I C E R<br />
4 Huntsman 2010 Sustainability Report<br />
Why publish a sustainability<br />
Q: report?<br />
A:<br />
At Huntsman, we’re on a journey<br />
to establish a sustainability<br />
framework and program. <strong>We</strong>’ve been<br />
tracking and sharing some sustainability<br />
metrics for years through an annual<br />
Environmental, Health and Safety<br />
report. But we wanted to expand on<br />
those metrics and begin formally tracking<br />
our progress on other measures of<br />
sustainability, such as labor practices<br />
and human resources. This first report<br />
is a beginning. As our sustainability<br />
program matures, we expect to broaden<br />
our measurements to include those<br />
metrics deemed relevant by all our<br />
stakeholders.<br />
Q:<br />
How is sustainability<br />
incorporated into Huntsman’s<br />
business strategy?<br />
A:<br />
Sustainability is a fundamental<br />
part of our corporate and business<br />
strategies. <strong>We</strong>’re looking at how our<br />
products and applications can play<br />
a part in providing solutions to the<br />
challenges our markets face, such<br />
as higher energy prices and scarcer<br />
water sources.<br />
To help our businesses enhance<br />
their sustainable business strategies,<br />
we began formalizing our corporate<br />
sustainability program in 2010. <strong>We</strong><br />
created a Corporate Sustainability<br />
Office, which coordinates our<br />
program and annual reporting, and<br />
formed a Sustainability Leadership<br />
Council. The council is a senior-level<br />
group with representatives from every<br />
division and function. This council<br />
meets throughout the year to oversee<br />
and direct the development of the<br />
Huntsman sustainability program.<br />
They set clear objectives and forwardlooking<br />
targets; drive our recording,<br />
reporting and validating processes;<br />
and determine our involvement in<br />
external programs, such as the<br />
United Nations Global Compact.<br />
Q:<br />
A:<br />
Why is sustainability<br />
important to Huntsman?<br />
Because it is the right thing to<br />
do for our associates, investors<br />
and the global community.<br />
Operating in a responsible way is<br />
important to ensuring a long-term<br />
sustainable future for our business,<br />
associates and investors, and fundamentally<br />
critical for society as a whole.<br />
<strong>We</strong> believe it is a strategy that can<br />
have a direct impact on commercial<br />
success and future growth.<br />
Q:<br />
A:<br />
What is on the horizon?<br />
While we have accomplished a<br />
great deal so far, we now have<br />
a more structured program to enable<br />
us to do even more. Going forward,<br />
we will develop new programs for<br />
social, economic and environmental<br />
sustainability. This will help leverage<br />
our long-term commitment to community<br />
outreach projects, support our<br />
customers with innovative new products<br />
and applications, and ensure the<br />
sustained growth of our company for<br />
our shareholders and associates.
Process Safety<br />
Management<br />
Sustainability<br />
Health and<br />
<strong>We</strong>llness<br />
Our 20:20 Vision<br />
in 2010, Huntsman established a<br />
long-term strategy for achieving<br />
environmental, health and safety<br />
goals called our 20:20 Vision. This<br />
is a corporate-wide strategy owned<br />
collectively by all business divisions<br />
and functions, rather than simply an<br />
EHS functional strategy.<br />
In developing our 20:20 Vision, internal<br />
stakeholders assessed the scope of our<br />
current approach to EHS and we benchmarked<br />
our strengths and weaknesses<br />
against a series of opportunities and threats.<br />
<strong>We</strong> also completed a peer review to identify<br />
some of the “best practice” techniques<br />
being used by key competitors and other<br />
recognized industry leaders.<br />
<strong>We</strong> identified seven focus areas to which<br />
we will devote attention and resources to<br />
help us meet challenges today and into<br />
the future. Sustainability is one of them.<br />
20:20<br />
Vision<br />
Compliance Focus<br />
Product Stewardship<br />
Emerging Issue<br />
Management<br />
EHS Due Diligence<br />
in Mergers and<br />
Acquisitions<br />
The others are Compliance Focus, Emerging<br />
Issue Management, Mergers and Acquisitions,<br />
Product Stewardship, Health and <strong>We</strong>llness,<br />
and Process Safety Management.<br />
<strong>We</strong>’ve reorganized our EHS team to foster<br />
greater partnership with our businesses,<br />
to provide clarity of reporting and accountability<br />
and to ensure compliance. <strong>We</strong>’ve<br />
developed Centers of Excellence to<br />
support our businesses in the areas of<br />
sustainability, product stewardship and<br />
emerging issues management.<br />
With the foundations of an exceptional EHS<br />
platform already in place, the Huntsman<br />
20:20 Vision will further protect and enhance<br />
our company’s reputation, enabling us to<br />
achieve excellence in the management of<br />
facilities and the manufacture of products in<br />
a sustainable, environmentally and socially<br />
responsible manner.<br />
Huntsman 2010 Sustainability Report 5
30<br />
countries<br />
With manufacturing operations in<br />
30 countries worldwide, and technical<br />
centers and sales offices in several<br />
more countries, our products are manufactured<br />
for commercial customers<br />
in a wide array of industries, including:<br />
• Building and construction<br />
• Clothing and textiles<br />
• Electronics and entertainment<br />
• Healthcare and medical<br />
• Household goods and personal care<br />
• Industrial<br />
• Packaging, paper and publishing<br />
• Plastics<br />
• Transportation<br />
• Utilities<br />
• Water and process solutions<br />
over the past several years,<br />
we have expanded our international<br />
footprint. Supported by<br />
our strong balance sheet, we’re<br />
technologically and geographically<br />
poised to deliver value<br />
through five distinct business<br />
divisions.<br />
6 Huntsman 2010 Sustainability Report<br />
Who <strong>We</strong> Are<br />
A T H U N T S M A N , W E C R E A T E T H E B U I L D I N G B L O C K S<br />
F O R P R O D U C T S U S E D E V E R Y D A Y B Y C O N S U M E R S<br />
A R O U N D T H E G L O B E .<br />
Headquartered in The Woodlands, Texas, Huntsman Corporation has<br />
approximately 12,000 associates worldwide. <strong>We</strong> have identified four<br />
initial key stakeholder groups – shareholders, customers, associates<br />
and local communities – to direct our sustainability efforts. These<br />
stakeholders are closely linked with our business and we seek their<br />
input to drive the direction of our sustainability program. As our engagement with<br />
our stakeholders matures, we intend to reach out to additional interest groups<br />
that will help us enhance our performance and value.<br />
Pigments<br />
Our Pigments division manufactures<br />
and markets titanium dioxide – a<br />
white pigment that adds whiteness,<br />
brightness and opacity to products<br />
such as paints, plastics, paper,<br />
printing, inks, fibers and ceramics.<br />
Polyurethanes<br />
The Polyurethanes division manufactures<br />
MDI (methylene diphenyl<br />
diisocyanate)-based polyurethanes<br />
to provide energy efficiency, comfort<br />
and well being in a wide variety of<br />
consumer and industrial applications,<br />
from home insulation to adhesives<br />
and coatings.
During the 2010 reporting period, the<br />
company made several changes that enabled us to continue<br />
to strengthen our international presence. Our largest division,<br />
Polyurethanes, relocated its global headquarters from The<br />
Woodlands, Texas, to Hong Kong, China. And our Textile<br />
Effects division moved this past year from Basel, Switzerland,<br />
to Singapore.<br />
In 2010, we successfully started new operations or expanded<br />
manufacturing capabilities at a number of existing facilities,<br />
including Geismar, Louisiana; Jubail, Saudi Arabia; Jurong<br />
Island, Singapore; Huelva, Spain; Mahachai, Thailand; Vadodara<br />
(formerly known as Baroda), India; and Port Neches, Texas.<br />
Advanced Materials<br />
Our Advanced Materials division<br />
makes high-performance adhesives,<br />
sealants and composites for a variety<br />
of markets, including coatings,<br />
construction, electronics, adhesives,<br />
power transmission and distribution,<br />
general industry, aerospace, wind<br />
energy, automotive, and sports and<br />
leisure.<br />
Performance Products<br />
Huntsman Performance Products is a<br />
leading global producer of intermediate<br />
chemistries and technologies used in<br />
agrochemicals, home care, institutional<br />
and industrial, coatings and polymers,<br />
general industry and processing,<br />
lubricating and industrial resource<br />
chemicals, and beauty and personal<br />
care.<br />
Additional changes during the reporting period include:<br />
C L O S U R E S / D I V E S T I T U R E S<br />
In late 2009, Huntsman announced closure of our <strong>We</strong>st<br />
Footscray, Australia, base chemicals site. In early 2010,<br />
the closure was completed and the site ceased operation.<br />
A C Q U I S I T I O N S<br />
Huntsman completed a number of joint venture transactions<br />
in 2010, primarily in the Middle East and India. Because these<br />
joint ventures did not materially affect our environmental<br />
emissions, they are not included in our sustainability report.<br />
Textile Effects<br />
Huntsman Textile Effects manufactures<br />
and markets a broad range of chemical<br />
and dye products that enhance the<br />
performance properties and colors<br />
of finished textiles and materials.<br />
Our products and processes ensure<br />
brilliant colors with high fastness,<br />
easy care and durable protection.<br />
Huntsman 2010 Sustainability Report 7
Recognizing<br />
Our Successes<br />
W<br />
e believe every associate has a role to play in delivering<br />
a successful approach to sustainability.<br />
To recognize changes in the way we work and the products we’re developing to make a sustainable<br />
long-term effort, we created the Chief Executive’s Award for Innovation in Sustainability. In 2010, we<br />
had 52 entries from across all divisions and regions of the world.<br />
T R A N S F O R M I N G<br />
H U N T S M A N P I G M E N T S<br />
C A L A I S S I T E<br />
8 Huntsman 2010 Sustainability Report<br />
Top honors went to Huntsman Pigments Calais site in France for its transformation<br />
from a closure candidate to one of the strongest and most sustainable<br />
sulfate titanium dioxide (TiO 2) plants in the world. (<strong>See</strong> page 17.) Their efforts<br />
touched all three legs of sustainability – people, planet and profits. By converting<br />
a waste product to magnesium sulfate, a magnesium-rich soil conditioner,<br />
the site will sell a valuable new product, reduce waste and carbon emissions,<br />
and help secure a stronger future for the Calais operations.
2HigHly<br />
commended<br />
Two other entries were<br />
highly commended.<br />
The Rozenburg Polyurethanes<br />
site in The Netherlands helped<br />
reduce road miles traveled, costs<br />
and carbon emissions through a<br />
sustainable transportation logistics<br />
plan. (<strong>See</strong> page 18.)<br />
The Textile Effects Global<br />
AvITERA ® SE provides highly innovative<br />
reactive dyes that save water<br />
usage, energy consumption and<br />
labor costs. (<strong>See</strong> page 13.)<br />
Huntsman’s efforts in sustainability<br />
also have received recognition<br />
from outside the industry. In 2010,<br />
Huntsman was named in Newsweek<br />
magazine’s Green Ranking – 2010,<br />
which evaluates the environmental<br />
performance of America’s 500<br />
largest publicly traded companies.<br />
The Green Rankings assess companies<br />
based on a variety of environmental<br />
performance areas, including<br />
greenhouse gas emissions, water<br />
withdrawal, waste, emissions, and<br />
natural-resource use, and corporate<br />
environmental policies, programs<br />
and initiatives globally. The rankings<br />
also include an assessment of each<br />
company’s reputation among<br />
sustainability professionals.<br />
Corporate Leadership<br />
Huntsman’s highest governance body is our board of directors. Six of its nine<br />
members are independent, or “non-executive.” As executive chairman of<br />
the board, Jon M. Huntsman serves as an executive officer of the company<br />
and chairman of the board.<br />
As of the issuance of this report, the board was structured as follows:<br />
Board of Directors<br />
Board Member Title Independent<br />
Jon M. Huntsman Executive Chairman of the Board and Director No<br />
Peter R. Huntsman President, Chief Executive Officer and Director No<br />
Nolan D. Archibald Vice Chairman of the Board, Chairman of the Yes<br />
Compensation Committee and Lead Independent Director<br />
M. Anthony Burns Chairman of the Audit Committee and Director Yes<br />
Wayne A. Reaud Chairman of the Litigation Committee and Director Yes<br />
Patrick T. Harker Chairman of the Nominating and Corporate Governance Yes<br />
Committee and Director<br />
Sir Robert J. Margetts Director No<br />
Alvin V. Shoemaker Director Yes<br />
Mary C. Beckerle Director Yes<br />
The board appoints members of its independent Audit, Compensation and<br />
Governance committees. Each of these committees has a written charter<br />
approved by the board and available on the company’s website. Independent<br />
directors currently comprise in full the membership of each standing board<br />
committee described below.<br />
Audit Compensation Nominating & Corporate Governance<br />
M. Anthony Burns (Chair) Nolan D. Archibald (Chair) Patrick T. Harker (Chair)<br />
Patrick T. Harker Wayne A. Reaud M. Anthony Burns<br />
Alvin V. Shoemaker Alvin V. Shoemaker Mary C. Beckerle<br />
Stockholders and other interested parties are invited to communicate directly and<br />
confidentially with the board, the non-management directors, the independent<br />
directors or the lead independent director by email, CorporateSecretary@<br />
huntsman.com, or by mail, c/o Corporate Secretary, Huntsman Corporation,<br />
500 Huntsman Way, Salt Lake City, Utah 84108, USA.<br />
Stockholders, including Huntsman associates who own company stock, have the<br />
opportunity to nominate individuals for election to the board or make proposals<br />
to be addressed at the company’s annual meeting of stockholders.<br />
Huntsman 2010 Sustainability Report 9
S U S T A I N A B I L I T Y<br />
I N A C T I O N<br />
across the globe, Huntsman<br />
is demonstrating its commitment<br />
to sustainability<br />
by developing efficient<br />
new products, perfecting<br />
technologies that have less<br />
impact on the environment<br />
and reducing our carbon<br />
footprint. our activities<br />
touch all three legs of<br />
sustainability – people,<br />
planet and profits.<br />
10 Huntsman 2010 Sustainability Report
Protecting the<br />
Environment<br />
Nurturing biodiversity at global sites<br />
When a green turtle lays its eggs<br />
on Geliga beach in Malaysia, it<br />
doesn’t know that the beach neighbors<br />
the site of Huntsman’s Teluk Kalung<br />
(TK) Pigments factory. All that matters<br />
is that it’s a good spot to lay its eggs.<br />
And from the increasing number of turtle<br />
landings each year, it’s clear many<br />
turtles are finding the beach the perfect<br />
nesting ground. In 2010, more than<br />
1,400 turtle landings were recorded,<br />
the most ever at the site and more<br />
than double the number in 2009.<br />
The return of increasing numbers of<br />
adult turtles can be credited in part to<br />
the operation of the Geliga hatchery,<br />
set up with Huntsman’s support in the<br />
early 1990s. As green turtles only reach<br />
sexual maturity as they approach 20<br />
years of age, the increase in the number<br />
of landings in 2010 is a good sign<br />
the biodiversity efforts of Huntsman<br />
Pigments are working.<br />
With seven production plants in seven<br />
countries and with habitats ranging<br />
from reed beds to brackish lagoons and<br />
Mediterranean scrub to tropical forest,<br />
Huntsman Pigments makes a considerable<br />
contribution to the preservation<br />
of biodiversity on a global scale. That<br />
includes taking sediment samples and<br />
counting the number of microscopic<br />
animal species at our sites and then<br />
monitoring changes over time to ensure<br />
the environment remains healthy. Each<br />
Pigments site has developed a Biodiversity<br />
Action Plan to meet Huntsman’s<br />
sustainability goals. These efforts have<br />
been recognized by the European<br />
Chemical Industry Council.<br />
Huntsman 2010 Sustainability Report 11
Developing<br />
Innovative Products<br />
Using nature<br />
to clean clothes<br />
A clean<br />
shirt begins with a single seed<br />
from an oil palm. Sure, there are a<br />
lot of steps in between, but when it<br />
comes to providing some surfactants<br />
for use in laundry detergents, Huntsman<br />
Performance Products is using nature<br />
to provide the basic building blocks.<br />
Huntsman is providing the consumer<br />
products industry with surfactants<br />
derived from raw materials such<br />
as coconut, soybean and palm oils.<br />
Surfactants provide the cleaning power<br />
in household detergents. When a<br />
shirt is washed in laundry detergent,<br />
surfactants cling to dirt and oil and<br />
are flushed away from the garment<br />
with water.<br />
Huntsman creates naturally derived<br />
surfactants using a patented catalyst<br />
technology called G2. During the<br />
chemical reaction, methyl ester –<br />
the oil that is derived from palm nuts,<br />
soybeans and coconuts – is reacted<br />
with ethylene oxide using the G2<br />
catalyst. The resulting end product<br />
is methyl ester ethoxylate, a naturally<br />
derived surfactant.<br />
While the company began using this<br />
technology five years ago, it has been<br />
fine-tuning the process to improve the<br />
effectiveness of the end product to provide<br />
a novel, innovative solution that is<br />
environmentally friendly and effective.<br />
12 Huntsman 2010 Sustainability Report<br />
Reducing energy loss in buildings<br />
With the average home leaking anywhere between 30 percent and 50<br />
percent of its circulating air through cracks and crevices, insulation<br />
is key for reducing energy loss. Huntsman Polyurethanes manufactures<br />
the chemical components used in spray polyurethane foam (SPF), an<br />
insulation material that is taking the place of traditional fibrous insulation<br />
in homes and commercial buildings. SPF provides an effective, tight<br />
thermal and air barrier around the building envelope.<br />
The SPF insulation is sprayed in the walls, cathedral ceilings, attics and<br />
the underside of roof decks. Use of SPF can allow for smaller heating,<br />
ventilation and air conditioning (HVAC) systems and cost savings in new<br />
home construction. Additionally, SPF insulation improves air quality by<br />
restricting the infiltration of moisture, outdoor allergens and pollutants.<br />
In late 2010, SPF was used to insulate one of the first homes in Houston,<br />
Texas, being evaluated for LEED-H Platinum certification – the highest<br />
ranking in the LEED ® for Homes rating system developed by the U.S.<br />
Green Building Council.
A<br />
Saving water in<br />
the textile industry<br />
VITERA ® SE, from Huntsman Textile Effects,<br />
is contributing to the sustainability of one of<br />
the earth’s most precious resources – water. The<br />
product significantly reduces water and energy consumption,<br />
as well as carbon dioxide (CO2) emissions,<br />
during the dyeing and washing-off process.<br />
Textile-dyeing and finishing processes consume vast<br />
amounts of water – in the very parts of the world, such<br />
as China, India and Bangladesh, where it is most scarce.<br />
By 2030, the world demand for fresh water is expected to<br />
increase by 40 percent. As environmental awareness grows,<br />
so does the demand for textiles produced in more sustainable<br />
ways. Up to 26 gallons (100 liters) of water are needed to dye<br />
just two pounds (one kilogram) of cotton fabric.<br />
AVITERA SE dyes help significantly reduce water and energy consumption<br />
and CO 2 emissions since the dyeing and the washing-off<br />
process never exceed 60°C. With only five percent or less unfixed<br />
dye needing to be removed, instead of the usual 15 percent to 30<br />
percent, the number of rinsing baths to obtain the required fastness<br />
properties is greatly reduced.<br />
In the first six months after AVITERA SE was launched in October<br />
2010, Huntsman estimates water-savings potential amounts to<br />
one quart (1.3 liters) of fresh water per person per day in<br />
major Asian textile-processing countries.<br />
30X<br />
Growing greener<br />
cities one roof at<br />
a time<br />
Huntsman Polyurethanes has developed<br />
a polyurethane-based, lightweight<br />
foam, called VYDRO ® , which<br />
serves as an ideal planting medium for<br />
green roof applications. The product<br />
has very high water-retention capacity,<br />
is 70 percent lighter than existing<br />
technologies and can absorb up to<br />
30 times its weight in water.<br />
Green roofs – those either partially or<br />
completely covered in vegetation –<br />
are on the rise as governments look<br />
for green solutions to combat climate<br />
change. Green roofs assist with water<br />
management, improve a building’s<br />
insulating envelope, reduce the impact<br />
of urbanization, decrease the Urban<br />
Heat Island Effect (caused by the<br />
widespread use of heat-absorbing<br />
materials like concrete), improve<br />
biodiversity, counter urban sprawl and<br />
reduce building maintenance costs.<br />
In green roof applications using<br />
Huntsman’s VYDRO, the foam layer,<br />
which sits below the nutrient layer,<br />
captures, absorbs and retains rainfall,<br />
resulting in a ready source of water for<br />
plant roots. At 70 percent less weight<br />
than traditional technologies, VYDRO<br />
can be used in green roofs in applications<br />
where weight and structural<br />
strength are critical issues, as in<br />
older buildings.<br />
Huntsman 2010 Sustainability Report 13
Developing<br />
Innovative Products<br />
Making next-generation lighting possible<br />
imagine being able to unfold your cell phone to reveal a<br />
full-length touch screen, then folding it back up to put in<br />
your pocket or purse. The screen is powered by organic<br />
light-emitting diodes (OLEDs) encased not by glass, but<br />
coated with a thin, flexible barrier material.<br />
OLEDs, considered the next-generation of lighting, are<br />
paper-thin, flexible and lightweight devices that consume up<br />
to 70 percent less energy compared with conventional<br />
light sources. Huntsman Advanced Materials has developed<br />
a special process that allows its Araldite ® resins<br />
to bond and mechanically protect the OLEDs without<br />
compromising light-emitting capabilities.<br />
14 Huntsman 2010 Sustainability Report<br />
— Continued<br />
Bringing color to cool roofs<br />
H untsman-developed<br />
pigments used in paint formulations for metal, clay<br />
and concrete roofing systems are helping to keep the world cool – and<br />
colorful. The solar reflectance technology, called ALTIRIS ® , reflects the sun’s<br />
infrared light – considered the largest contributor to a building’s surface temperature.<br />
The technology, developed by Huntsman Pigments, dramatically<br />
cools the temperature of colored surfaces and roofing, thereby reducing both<br />
a building’s cooling requirements and the carbon dioxide emissions associated<br />
with that cooling.<br />
Cool roofs – those that can deliver high solar reflectance – combat the Urban<br />
Heat Island Effect, caused by widespread use of asphalt and concrete, which<br />
can make cities up to 10 degrees warmer than rural areas. Cool roofs, which<br />
use solar-reflectance technology like ALTIRIS, can reduce daily average energy<br />
use by up to 52 percent. The Lawrence Berkeley National Laboratory, a U.S.<br />
Department of Energy national laboratory operated by the University of California,<br />
estimates that the use of cool roofing could ultimately lead to $27 billion in<br />
worldwide energy savings. If 80 percent of the commercial buildings in<br />
the United States were retrofitted with cool roofs, more than $735 million<br />
in energy costs would be saved and 5.65 million tonnes of CO2 emissions<br />
reduced, per year. That’s the same amount of emissions as taking<br />
1.2 million cars off the road.<br />
70%<br />
Last year, Huntsman put its technology to the test by<br />
sponsoring a car in the 24 Hours of Le Mans race in France.<br />
The OLED rearview mirrors on the ORECA 01 were made<br />
with Araldite resins and provided effective protection for<br />
the OLED in extreme conditions. The Holst Centre, an independent<br />
research and development center for flexible and<br />
wireless electronics in The Netherlands, is now applying the<br />
results of this successful integration to its future research<br />
activities to further the development of encapsulation<br />
technologies and moisture barriers for flexible electronic<br />
devices.
Helping mills, brands and<br />
retailers get it right the first time<br />
When Zhejiang JiaYe Printing and Dyeing Co. Ltd, a leading<br />
manufacturer of knitted product and swimwear fabric<br />
in China, wanted innovative solutions to reduce water and<br />
energy consumption in its manufacturing process, it turned to<br />
Huntsman Textile Effects proprietary Productivity Improvement<br />
Program (PIP) software.<br />
The program helped identify ways to improve processes at the<br />
company’s dyeing mill for faster response to customers, while<br />
lowering energy, water and dyes/chemical costs. As a result, the<br />
manufacturer increased production by 23 percent and lowered<br />
production costs by 24 percent to improve productivity<br />
and increase its competitiveness.<br />
50%<br />
The PIP software helps identify areas for improvement<br />
in all aspects of the manufacturing process –<br />
pre-treatment, dyeing, printing and finishing – and is<br />
an example of Textile Effects’ commitment to provide<br />
total solutions to the textile industry.<br />
By using the PIP model, customers can expect to:<br />
• Reduce water consumption by as much as 50 percent<br />
• Reduce energy consumption by 30 percent or more<br />
• Save time and increase production by 30 percent or more<br />
• Increase Right First Time up to 95 percent or more<br />
• Increase production output without additional capital<br />
investment by more than 30 percent<br />
Advancing wind energy<br />
the global wind energy industry now represents<br />
2.5 percent of the global electricity demand. That’s<br />
more than enough energy to meet the electricity<br />
needs of the United Kingdom, the sixth-largest<br />
economy in the world. In fact, total installed wind<br />
now has the potential to power 9.7 million homes.<br />
As a leading supplier to the wind turbine industry<br />
since the 1980s, Huntsman has helped shape<br />
the industry, providing technology critical for<br />
making rotor blades. Huntsman Performance<br />
Products makes JEFFAMINE ® polyetheramines<br />
(PEAs) and supplies them to Huntsman’s Advanced<br />
Materials division for their Araldite ® epoxy resin<br />
systems and to other global and regional system<br />
formulators that manufacture their own epoxy resin<br />
systems needed to make the rotor blades on the<br />
wind-turbine generators.<br />
The range of Araldite resin products for the windturbine<br />
industry helps create rotor blades that are<br />
longer and more consistent in weight and have<br />
higher strength and fatigue properties.<br />
To meet the needs of offshore wind farms, which<br />
are on the rise worldwide, Huntsman is working to<br />
develop innovative resin systems that combine<br />
with high-performance glass and carbon fibers.<br />
This process enables blade manufacturers to<br />
produce larger blades with a long lifespan.<br />
Huntsman 2010 Sustainability Report 15
Creating a More<br />
Sustainable Business<br />
Going green in China<br />
W hen<br />
the Huntsman Polyurethanes division in Minhang,<br />
China, needed to renovate its 16-year-old building in<br />
the summer of 2010, the Asia-Pacific leaders and China<br />
management team decided it was the perfect opportunity<br />
to go green.<br />
The renovation team chose design elements such as a<br />
“sunshine ceiling” in the reception area – a double-glazed<br />
glass ceiling that can reflect 60 percent to 70 percent<br />
sunshine – and double-glazed glass throughout the building,<br />
which can reduce energy loss by 26 percent.<br />
16 Huntsman 2010 Sustainability Report<br />
Spray foam insulation, based on technology provided by<br />
Huntsman, was used to provide air and moisture barriers<br />
that last longer than traditional insulation. The renovated<br />
office building is equipped with 12 units of solar energy<br />
heaters, which can provide three tonnes of water heated to<br />
113ºF (45ºC) and has the potential to save 20,800 kilowatt<br />
hours (kwh) of power annually.<br />
The energy-efficient office building<br />
is projected to save 166,624 kwh of<br />
electrical power a year – equivalent<br />
to saving 57 tonnes of standard coal,<br />
or eliminating 115 tonnes of carbon<br />
discharge. Payback on capital is<br />
expected within three to five years, with<br />
the company projecting to save 10 percent<br />
to 15 percent a year on energy costs.<br />
57<br />
tonnes<br />
In addition to the green building in Minhang, Huntsman’s<br />
technology center in Shanghai went green in 2009, and construction<br />
is under way on a third green building. Additionally,<br />
the Huntsman European headquarters building in Everberg,<br />
Belgium, was recently remodeled to incorporate energysavings<br />
features such as a green roof.<br />
— Minhang Executive Team
From closure candidate<br />
to promising future<br />
A long-term<br />
sustainability plan is helping to reverse the<br />
fortunes of the Huntsman Pigments plant in Calais, France,<br />
transforming it into one of the strongest and most sustainable<br />
sulfate titanium dioxide (TiO2) plants in the world.<br />
In 2008, the Calais site had reached a crisis point. Despite<br />
significant efforts in cost reduction, financial results were<br />
dismal and the plant was a candidate for closure.<br />
A long-term sustainability plan was designed and Calais<br />
took the bold step to close the most problematic component<br />
of its site. Closure not only meant the end of a dangerous<br />
The results have<br />
been outstanding and<br />
underscore the value<br />
of sustainability in<br />
improving people,<br />
planet and profits.<br />
As a result of<br />
the Calais initiative,<br />
other sustainability<br />
benefits also have<br />
been achieved.<br />
In 2010, the site reported<br />
its best financial performance<br />
in more than 15 years.<br />
Site energy consumption<br />
has been reduced by 0.5m<br />
gigajoules (GJ) per year for<br />
a total savings of US $5<br />
million (€3.5m) per year –<br />
enough energy to heat and<br />
light 3,000 homes a year.<br />
and difficult job for plant operators, but also put a stop to<br />
ongoing and costly maintenance. The result? Significant<br />
energy savings and an important simplification of the<br />
process that positively influenced the site’s carbon footprint.<br />
The Calais team extended its sustainability plans to<br />
encompass further improvements to the site by exploring<br />
options to manufacture fertilizers.<br />
By early 2011, the project<br />
team had developed a<br />
strong business case for<br />
further development at<br />
the site.<br />
CO 2 emissions<br />
have been reduced by<br />
35,000 tonnes per year.<br />
In January 2011, the<br />
Huntsman board of<br />
directors announced the<br />
approval of an investment<br />
to build a new fertilizer<br />
plant at the Calais site.<br />
Discharge to sea was<br />
reduced by 50 percent.<br />
Huntsman 2010 Sustainability Report 17
Creating a More<br />
Sustainable Business<br />
— Continued<br />
18 Huntsman 2010 Sustainability Report<br />
Huntsman in<br />
The Netherlands<br />
cuts carbon<br />
emissions<br />
F or Huntsman in The Netherlands,<br />
being green is part of<br />
its very nature, with sustainability<br />
targets considered a smart part<br />
of its business plan.<br />
— the Lean and Green Award<br />
The management of Huntsman in The<br />
Netherlands has set itself the target<br />
of a further all-round reduction of five<br />
percent to 10 percent of CO 2 emissions<br />
in 2012, on top of the CO 2 savings<br />
already realized in previous years. The<br />
site is on target to achieving this goal,<br />
and its commitment has earned the<br />
Rozenburg site a Lean and Green<br />
award from Sustainable Logistics<br />
Innovation Connekt, a Dutch network<br />
of business and government departments<br />
that encourages sustainability<br />
in Netherlands-based companies in<br />
the areas of transport, supply chain<br />
and mobility.<br />
Launched by the Dutch Ministry of<br />
Infrastructure, the Lean and Green<br />
award recognizes enterprises that strive<br />
to achieve CO 2 reductions through<br />
careful planning, implementation<br />
and management of environmentally<br />
conscious distribution and logistics<br />
strategies. Huntsman is the first<br />
chemical company in The Netherlands<br />
to win a Lean and Green award and<br />
is considered an example for other<br />
chemical companies.
The team found ways to effectively<br />
move a large part of the<br />
products leaving the site for<br />
European destinations via truck<br />
to more environmentally friendly<br />
transport modes such as rail and<br />
barge. By doing so, the site<br />
dramatically reduced its reliance<br />
on road transportation and managed<br />
to reduce CO 2 emissions on<br />
specific high-volume trade lanes<br />
by 61.5 percent which equals<br />
to more than 6,000 tonnes of CO 2.<br />
In early 2011, the site started<br />
to use the inland waterway<br />
connections for movement of<br />
containers from the site to the<br />
deepsea terminal in the Rotterdam<br />
harbor, which is expected<br />
to deliver an additional savings<br />
of more than 50 percent, which<br />
equals to 39,000 kg of CO 2.<br />
90%<br />
Furthermore, the plant optimized<br />
its supply chain so that more<br />
than 90 percent of raw materials<br />
arrive on site via pipeline and<br />
a large proportion of outgoing<br />
product leaves by pipeline to<br />
a transport terminal, with the<br />
remainder sold and transported<br />
in bulk.<br />
Additional CO 2 reductions will be<br />
accomplished in the course of<br />
2012 as a result of Huntsman’s<br />
commitment to optimize its<br />
onsite logistics infrastructure,<br />
which will reduce the number of<br />
onsite movements and associated<br />
emissions up to 70 percent.<br />
Our pledge to<br />
save energy costs<br />
A two<br />
$8m<br />
percent reduction in annual energy<br />
usage may not sound like much, but when<br />
you spend more than $400 million a year in<br />
energy costs as Huntsman does, it adds up<br />
to $8 million a year in savings.<br />
Becoming more energy efficient and saving<br />
money are the two main reasons Huntsman<br />
has become a Save Energy Now ® LEADER, an<br />
initiative sponsored by the U.S. Department of<br />
Energy’s Industrial Technologies Program (ITP).<br />
The program’s goal is to drive a 25 percent<br />
reduction in industrial energy intensity – or the<br />
amount of energy per pound of production –<br />
over the next 10 years with a combination of<br />
proven and emerging energy technologies.<br />
As a Save Energy Now LEADER, Huntsman<br />
pledged to voluntarily reduce energy intensity<br />
by 25 percent or more over 10 years. In return,<br />
the company will have access to assessments<br />
by energy management experts to help develop<br />
baselines and plans and identify emerging<br />
technologies applicable to plant operations.<br />
The Save Energy Now goal is consistent with<br />
Huntsman’s current efforts to reduce energy<br />
usage by at least two percent every year over<br />
a 10-year period beginning in 2010.<br />
The company is already on its way to achieving<br />
its long-term energy-savings goal. <strong>We</strong> have<br />
completed energy baseline assessments on<br />
our U.S. sites and will begin reporting progress<br />
in the coming years.<br />
Huntsman 2010 Sustainability Report 19
K E Y M E T R I C S<br />
Huntsman is reporting<br />
on a number of key metrics<br />
from the Global Reporting<br />
initiative (GRi) Sustainability<br />
Reporting Guidelines for<br />
2010. as we continue to<br />
build our sustainability<br />
program and gain a better<br />
understanding of the key<br />
measurements of importance<br />
to our stakeholders,<br />
we expect to expand our<br />
metrics in future reports.<br />
20 Huntsman 2010 Sustainability Report
Report Parameters<br />
t<br />
his is Huntsman’s first sustainability report. <strong>We</strong> plan to follow a calendaryear<br />
reporting period as we did with our previous annual EHS reports.<br />
This report will replace the EHS report, although it will include some of<br />
the same reporting metrics. Our most recent EHS report was the 2009<br />
Environmental, Health and Safety Report, published in September 2010.<br />
Additional reports may be found on our website at www.huntsman.com.<br />
In this report, we pull information from third-party questionnaires, external ratings<br />
and general indices, as well as feedback from stakeholders consulted during<br />
the year. External consultants have helped to assist, guide and balance our<br />
sustainability initiative.<br />
The report includes data related to all Huntsman enterprises where we have<br />
operational control (more than 50 percent) and joint ventures where we have<br />
management control.<br />
The data reported has been primarily obtained from our financial management<br />
reporting systems, various human resources information management systems and<br />
the Huntsman corporate reporting systems for EHS performance indicators. <strong>We</strong> are<br />
confident in the overall reliability of the data reported, but recognize that some of<br />
these data are subject to a certain degree of uncertainty, inherent to limitations<br />
associated with measuring, calculating data and estimating data.<br />
New acquisitions within the calendar year are included in the report. Nonconsolidated<br />
joint ventures are not included in company data. For a comprehensive list of subsidiaries<br />
and principal nonconsolidated joint ventures of Huntsman Corporation,<br />
please see Exhibit 21 in the company’s most recent Annual Report on Form 10-K<br />
filed with the U.S. Securities and Exchange Commission. The basis for reporting on<br />
subsidiaries, joint ventures, leased facilities and other entities does not significantly<br />
affect comparability from period to period. Huntsman completed a number of joint<br />
venture transactions in 2010, primarily in the Middle East and India. These joint<br />
ventures did not materially affect our environmental emissions and are not included<br />
in our sustainability metrics.<br />
For More Information:<br />
Please direct any questions<br />
regarding the report or its contents<br />
to sustainability@huntsman.com.<br />
Huntsman 2010 Sustainability Report 21
Our Energy Use<br />
TOTAL ENERGY USE (TERA JOULES)<br />
80,000 ..............<br />
70,000 ..............<br />
60,000 ..............<br />
50,000 ..............<br />
40,000 ..............<br />
30,000 ..............<br />
20,000 ..............<br />
10,000 ..............<br />
H<br />
22 Huntsman 2010 Sustainability Report<br />
n Polyurethanes<br />
n Pigments<br />
T O T A L E N E R G Y C O N S U M P T I O N<br />
..............................................................................................................................................................................................................................<br />
Baseline<br />
2006 2007 2008 2009 2010<br />
n Performance Products<br />
n Advanced Materials<br />
n Textile Effects<br />
n HCCA<br />
untsman saw increased energy consumption<br />
of only five percent in 2010, while production<br />
increased by almost nine percent.
Energy Consumption<br />
How <strong>We</strong> Did<br />
Energy consumption increased only five percent in 2010,<br />
while production output increased by almost nine percent.<br />
Total energy usage remains below our baseline level.<br />
Huntsman has long understood that to stay competitive<br />
long term, we must continually strive to improve the<br />
energy efficiency of our operations. This was especially vital<br />
in the last few years. In 2008, the price of oil and natural<br />
gas hit record highs, while the global economy suffered a<br />
dramatic slowdown in the fourth quarter of 2008 and well<br />
into 2009.<br />
In 2010, amid lower fuel prices, we experienced an increase<br />
in product demand. Production output was nearly 10 percent<br />
higher than in 2009 and, in turn, our energy usage rose.<br />
Although we are producing more products, we are consuming<br />
proportionally less total energy. Energy efficiency initiatives<br />
and programs we began a few years ago are paying off with<br />
a measurable improvement in our overall energy efficiency.<br />
And while our 2010 total energy consumption was higher<br />
than in the previous two years, we are still below our baseline<br />
level for total energy usage.<br />
Despite an overall energy increase, we recorded some<br />
notable reductions in our energy consumption: for example,<br />
closure of our <strong>We</strong>st Footscray, Australia, styrenics plant and<br />
energy efficiency improvements at many of our U.S.-based<br />
Performance Products locations. <strong>We</strong>st Footscray was part of<br />
Huntsman Chemical Corporation Australia (HCCA), originally<br />
part of Base Chemicals and Polymers, which was divested<br />
in 2006 and 2007. <strong>We</strong>st Footscray was responsible for nearly<br />
all of the HCCA subdivision’s energy consumption. Closing<br />
the plant virtually eliminated HCCA’s contribution to our total<br />
energy use. Likewise, our Performance Products division made<br />
significant improvements to reducing its energy consumption<br />
while maintaining nearly identical production totals year on<br />
year. The division measures overall energy performance with<br />
a corporate energy database and has made a large number<br />
of validated energy performance improvements with the<br />
application of the Six Sigma methodology.<br />
TOTAL ENERGY (TJ) PER TONNES PRODUCTION<br />
0.0070 ........<br />
0.0068 ........<br />
0.0066 ........<br />
0.0064 ........<br />
0.0062 ........<br />
0.0060 ........<br />
0.0058 ........<br />
0.0056 ........<br />
E N E R G Y I N T E N S I T Y<br />
2006 2007 2008 2009 2010<br />
Energy Intensity (TJ) per tonnes production<br />
Huntsman 2010 Sustainability Report 23
Our Emissions<br />
CO 2e (MILLION TONNES)<br />
5.0 ..................<br />
4.5 ..................<br />
4.0 ..................<br />
3.5 ..................<br />
3.0 ..................<br />
2.5 ..................<br />
2.0 ..................<br />
1.5 ..................<br />
1.0 ..................<br />
0.5 ..................<br />
As a socially and ecologically responsible global corporation,<br />
we are committed to reducing the impact of our Greenhouse<br />
Gas (GHG) emissions. overall, Huntsman’s GHG generation<br />
is proportional to production levels and energy consumption.<br />
24 Huntsman 2010 Sustainability Report<br />
T O TA L D I R E C T A N D I N D I R E C T G H G E M I S S I O N S B Y W E I G H T<br />
..............................................................................................................................................................................................................................<br />
Baseline<br />
2006 2007 2008 2009 2010<br />
n Total Direct Greenhouse Gas Emissions (Tonnes)<br />
n Total Indirect Greenhouse Gas Emissions (Tonnes)
Total Direct and Indirect<br />
Greenhouse Gas Emissions 1<br />
How <strong>We</strong> Did<br />
While total greenhouse gas emissions in 2010 rose six<br />
percent from 2009 levels, our GHG intensity fell slightly,<br />
indicating we are more efficient. Further, compared to<br />
our 2006 baseline, we emitted three percent less carbon<br />
dioxide (CO2e), one of several greenhouse gases.<br />
the combustion of fossil fuels needed to manufacture chemicals<br />
and to generate electricity and steam releases carbon<br />
dioxide, methane and nitrous oxide – all greenhouse gases.<br />
Other GHGs that may be released during chemical processing<br />
operations are hydrofluorocarbons (HFC), perfluorocarbons<br />
(PFC) and sulphur hexafluoride (SF6). These are typically<br />
released from manufacturing equipment that uses these<br />
chemicals as refrigerants.<br />
Defined by various protocols, Scope 1 emissions are GHG<br />
emissions attributable to the combustion of fossil fuels at our<br />
sites or non-combustion greenhouse gases emitted from<br />
manufacturing processes or refrigeration units. Scope 1 GHG<br />
emissions from Huntsman are generally proportional to our<br />
direct energy consumption. Scope 2 emissions are associated<br />
with the generation of indirect energy, and are proportional to<br />
our indirect energy consumption (i.e., purchased electricity).<br />
Greenhouse gases are reported in standard units of million<br />
tonnes of CO 2 equivalents (MMT CO 2e) to describe the magnitude<br />
of GHG emissions or reductions. Therefore, our 2006<br />
greenhouse gases are reported in standard units of million<br />
tonnes of CO 2e equivalents (MMT CO 2e.) Our 2006 baseline<br />
year emissions were 3.58 MMT CO 2e. (Huntsman’s new<br />
baseline of 2006 emissions excludes the Base Chemicals and<br />
Polymers division, which was divested in 2006 and 2007.)<br />
1. The GHG Protocol defines direct and indirect emissions as follows:<br />
• Direct GHG emissions are emissions from sources that are owned or controlled by the<br />
reporting entity.<br />
• Indirect GHG emissions are emissions that are a consequence of the activities of the<br />
reporting entity, but occur at sources owned or controlled by another entity.<br />
The GHG Protocol further categorizes these direct and indirect emissions into three broad scopes:<br />
• Scope 1: All direct GHG emissions.<br />
• Scope 2: Indirect GHG emissions from consumption of purchased electricity, heat or steam.<br />
5.0 ........<br />
4.5 ........<br />
4.0 ........<br />
Baseline<br />
3.5 ........<br />
3.0 ........<br />
2.5 ........<br />
2.0 ........<br />
1.5 ........<br />
1.0 ........<br />
0.5 ........<br />
TOTAL GHG EMISSIONS BY WEIGHT<br />
(DIRECT & INDIRECT)<br />
CO 2e (MILLION TONNES) ................................................................................................................<br />
2006 2007 2008 2009 2010<br />
n Polyurethanes<br />
n Pigments<br />
n HCCA<br />
n Performance Products<br />
n Advanced Materials<br />
n Textile Effects<br />
Huntsman 2010 Sustainability Report 25
Emissions to Air<br />
on a routine basis, Huntsman monitors, tracks and reports<br />
chemical emissions to the atmosphere – whether specifically<br />
permitted, part of routine operations or accidental<br />
releases. Air emissions are releases of volatile organic<br />
compounds (VOCs), carbon monoxide (CO), nitrogen oxides<br />
(NOx), sulfur oxides (SOx), particulate matter and other contaminants<br />
1 . Permitted air emissions are typically generated<br />
during routine manufacturing operations, volatilization from<br />
chemical storage, wastewater treatment and equipment<br />
emissions.<br />
Compared to our 2006 baseline, air emissions have decreased<br />
two percent. Compared to last year, we increased our air<br />
emissions by 37 percent. The increase in air emissions is<br />
attributed primarily to increased production at our Greatham,<br />
UK, Pigments site, combined with two specific, severe cold<br />
weather-related outages that occurred there in December<br />
2010. There is a project in place at Greatham to address<br />
winterization issues.<br />
1. Greenhouse gases (GHG) are also monitored, but are reported separately.<br />
compared to our 2006 baseline,<br />
air emissions have decreased two percent.<br />
26 Huntsman 2010 Sustainability Report<br />
AIR EMISSIONS (TONNES)<br />
30,000 ........<br />
25,000 ........<br />
20,000 ........<br />
15,000 ........<br />
10,000 ........<br />
5,000 ........<br />
E M I S S I O N S T O A I R<br />
................................................................................................................<br />
Baseline<br />
2006 2007 2008 2009 2010<br />
n Polyurethanes<br />
n Pigments<br />
n HCCA<br />
n Performance Products<br />
n Advanced Materials<br />
n Textile Effects
Discharges to Water<br />
in environmental chemistry, the chemical oxygen<br />
demand (COD) test is commonly used to indirectly<br />
measure the amount of organic compounds in water.<br />
Most applications of COD determine the amount of<br />
organic pollutants found in surface water (e.g. lakes and<br />
rivers), making COD a useful measure of water quality.<br />
Wastewater quality indicators, such as the biochemical<br />
oxygen demand (BOD) and the COD, are essentially<br />
laboratory tests to determine whether a specific<br />
wastewater will have a significant adverse effect<br />
on fish or aquatic plant life.<br />
Wastewater discharges from Huntsman facilities are routinely<br />
monitored and reported in units of chemical oxygen<br />
demand. The reported discharge levels are measured at<br />
the point where the wastewater is discharged from the<br />
manufacturing facility, after receiving onsite pre-treatment.<br />
In some instances, Huntsman facilities discharge to thirdparty<br />
wastewater treatment plants (municipalities or<br />
other chemical companies). In these cases, subsequent<br />
treatment achieves further COD reductions beyond the<br />
levels reported by Huntsman.<br />
COD TONNES<br />
14,000 ........<br />
12,000 ........<br />
10,000 ........<br />
8,000 ........<br />
6,000 ........<br />
4,000 ........<br />
2,000 ........<br />
DISCHARGES TO WATER<br />
Baseline<br />
................................................................................................................<br />
2006 2007 2008 2009 2010<br />
n Polyurethanes<br />
n Pigments<br />
n HCCA<br />
n Performance Products<br />
n Advanced Materials<br />
n Textile Effects<br />
chemical oxygen demand levels rose<br />
significantly compared to 2009 levels<br />
but are flat against our 2006 baseline.<br />
Huntsman 2010 Sustainability Report 27
Our Waste<br />
TOTAL WASTE (MILLION TONNES)<br />
1.6 ..................<br />
1.4 ..................<br />
1.2 ..................<br />
1.0 ..................<br />
0.8 ..................<br />
0.6 ..................<br />
0.4 ..................<br />
0.2 ..................<br />
28 Huntsman 2010 Sustainability Report<br />
T O TA L H A Z A R D O U S A N D N O N - H A Z A R D O U S W A S T E B Y W E I G H T<br />
..............................................................................................................................................................................................................................<br />
Baseline<br />
2006 2007 2008 2009 2010<br />
n Total Non-Hazardous Waste (Tonnes) n Total Hazardous Waste (Tonnes)<br />
Huntsman increased waste generation in 2010<br />
by less than one percent, while increasing<br />
production by almost nine percent.
NON-HAZARDOUS WASTE (MILLION TONNES)<br />
1.8 ........<br />
1.6 ........<br />
1.4 ........<br />
1.2 ........<br />
................................................................................................................<br />
Baseline<br />
1.0 ........<br />
0.8 ........<br />
0.6 ........<br />
0.4 ........<br />
0.2 ........<br />
Total Waste by Type<br />
NON-HAZARDOUS WASTE<br />
2006 2007 2008 2009 2010<br />
n Polyurethanes<br />
n Pigments<br />
non-hazardous waste and hazardous waste, as defined<br />
by local laws, are strictly monitored and reported at each<br />
of our manufacturing facilities. Non-hazardous wastes and<br />
hazardous waste are tracked and reported separately. The<br />
reported waste generation includes wastes that are sent to<br />
an off-site landfill, injected into a deep underground well,<br />
sent to third-party treatment facilities or reclaimed/reused/<br />
recycled (including burned as fuel – waste “co-generation”).<br />
This category also includes waste generated during normal<br />
operation and maintenance activities.<br />
Non-hazardous waste generation has decreased some<br />
13 percent between 2006 and 2010. Waste reduction opportunities<br />
can often create multiple benefits by making plant<br />
processes more efficient and may also identify undiscovered<br />
markets for products Huntsman previously thought of as<br />
“waste material.” These multiple benefit projects can result in<br />
significant cost savings to Huntsman in addition to reducing<br />
waste generation.<br />
HAZARDOUS WASTE (TONNES)<br />
200,000 ........<br />
150,000 ........ Baseline<br />
................................................................................................................<br />
100,000 ........<br />
50,000 ........<br />
n Performance Products<br />
n Advanced Materials<br />
HAZARDOUS WASTE<br />
2006 2007 2008 2009 2010<br />
n Textile Effects<br />
n HCCA<br />
Since our baseline year, the majority of Huntsman’s total<br />
non-hazardous wastes are consistently made up of iron salts<br />
and gypsum, generated by the Pigments business during acid<br />
neutralization. Ongoing efforts by our Pigments businesses to<br />
reduce these wastes and improve environmental performance<br />
have been very successful at utilizing this resource, and turning<br />
potential wastes into co-products with potential beneficial uses.<br />
For example, while the Pigments business has seen increasing<br />
production levels, increases in secondary sales of iron salts and<br />
gypsum to water treatment, agriculture and building construction<br />
markets have more than outpaced production.<br />
Hazardous waste generation is 12 percent below 2006<br />
baseline. <strong>We</strong> recorded a one year increase of three percent in<br />
hazardous waste generation and disposal compared to 2009.<br />
Huntsman 2010 Sustainability Report 29
Our People<br />
Rates of Injury, Occupational<br />
Disease and Lost Days<br />
How <strong>We</strong> Did<br />
Huntsman's injury and illness rate rose slightly over<br />
2009's record low rate. Still, in 2010, we experienced<br />
the second-lowest injury and illness rate in our history.<br />
Sixty percent of our reporting sites experienced zero<br />
recordable injuries and illnesses, and 77 percent<br />
achieved an injury and illness rate of less than 1.0.<br />
Huntsman continues to drive EHS performance with a<br />
keen focus on our EHS management systems. When<br />
compared to the chemical industry average published<br />
by the U.S. Bureau of Labor and Statistics, our injury and<br />
illness rate has been significantly lower over the years.<br />
Our safety performance reflects a combined recordable<br />
injury and illness rate of both associates and contractors.<br />
By maintaining one combined rate, the importance of<br />
reducing injuries and illnesses is not diminished for either<br />
Huntsman associates or contractors and the rate reflects<br />
overall true performance. Since 2005, the combined<br />
incidence rate for Huntsman and its contractors has<br />
remained below 1.0.<br />
Average Hours of<br />
Training per Year<br />
30 Huntsman 2010 Sustainability Report<br />
Region Courses Average Total Active Average<br />
Completed Length Hours Employees Hours<br />
Americas 58,731 1 58,731 3,027 19.40<br />
APAC 1 16,648 1 16,648 2,877 5.79<br />
EAME 2 40,611 1 40,611 6,649 6.11<br />
TOTALS 115,990 1 115,990 12,553 9.24<br />
Average Length refers to the average length of time the training module took in hours. These training hours totals are for online,<br />
computer-based, and some group and workshop training. Actual training hours, which also include some in-person oral presentations,<br />
on-the-job training and off-site seminars and workshops, currently are not reflected in these totals.<br />
1. Asia/Pacific<br />
2. Europe/Africa/Middle East<br />
2.50 ........<br />
2009 Chemical<br />
Industry Average<br />
2.00 ........<br />
1.50 ........<br />
1.00 ........<br />
0.50 ........<br />
INJURY AND ILLNESS RATE OVER TIME<br />
......................................................................................................................<br />
2006 2007 2008 2009 2010<br />
Incidence rates are calculated using the U.S. Occupational<br />
Safety and Health Administration (OSHA) formula:<br />
Total Recordable # of Injuries and Illnesses x 200,000<br />
Incident Rate = # of work hours
Percentage of Associates<br />
Trained in Anti-Corruption<br />
How <strong>We</strong> Did<br />
As of the issuance of this<br />
report, 90 percent of Huntsman<br />
associates received training<br />
in anti-corruption through<br />
several modules which cover<br />
the topic.<br />
Breakdown<br />
by Region<br />
Huntsman has zero tolerance for illegal<br />
behavior. Our business guidelines outline<br />
the ethics and values of the company and are<br />
shared with all associates. <strong>We</strong> have an Ethics<br />
and Compliance office dedicated to implementing<br />
policies and procedures to guard<br />
against corruption. Compliance managers<br />
are located in each region to provide support<br />
and training. <strong>We</strong> offer online ethics and compliance<br />
training to associates in their local<br />
languages. At sites with low literacy rates or<br />
limited computer access, we conduct classroom-style<br />
training in local languages. As a<br />
global company, we have translated training<br />
into 22 different languages.<br />
Huntsman requires all newly hired associates to complete<br />
core compliance training modules within the first 30 to<br />
60 days of employment. In addition, current associates are<br />
required to take refresher training on a regular basis.<br />
Core compliance training modules include Respect in the<br />
Workplace, Antitrust Compliance and Guidelines, Code of<br />
Business Conduct, IT Security Awareness, Records Management,<br />
EHS Protection, International Trade Compliance,<br />
Insider Trading, Conflicts of Interest, Confidential Information,<br />
EU Competition, Global Competition, Global Anti-Bribery,<br />
and the Huntsman Privacy Program.<br />
Huntsman provides a confidential reporting<br />
service that enables associates to safely<br />
report suspected wrongdoing in the workplace<br />
or to seek clarification regarding<br />
ethical dilemmas. Associates can access<br />
this service in their local languages either<br />
by phone or online.<br />
<strong>We</strong> are in the process of updating our<br />
ethics and compliance guidelines to make<br />
them more user-friendly and easier to read.<br />
The guidelines will be available in the<br />
languages of our associates in print and<br />
online formats in 2012.<br />
88% 89% 91% 90%<br />
AMERICAS<br />
88 percent of our<br />
associates have<br />
completed the courses.<br />
APAC<br />
89 percent of our<br />
associates have<br />
completed the courses.<br />
EAME<br />
91 percent of our<br />
associates have<br />
completed the courses.<br />
Total Global Count<br />
90 percent of our<br />
associates have<br />
completed the courses.<br />
In late 2011, Huntsman will implement a global HR Information<br />
System that will provide more robust reporting capabilities,<br />
enabling the company to more accurately collect total training<br />
hours and provide demographic breakdowns by region, function,<br />
management level and gender. The new system will add<br />
transparency to our HR practices and enable us to identify<br />
areas for improvement.<br />
Huntsman 2010 Sustainability Report 31
Direct Economic value<br />
Generated and Distributed<br />
How <strong>We</strong> Did<br />
Huntsman had 2010 revenues of<br />
almost $9.3 billion and net income<br />
of $32 million. Our 2010 adjusted<br />
EBITDA (earnings before interest,<br />
taxes, depreciation and amortization)<br />
was $872 million. <strong>We</strong> employ<br />
approximately 12,000 associates<br />
and operate from more than<br />
80 locations worldwide.<br />
Reconciliation of Net Income (Loss) to Adjusted EBITDA<br />
32 Huntsman 2010 Sustainability Report<br />
Year Ended 31 December 2010 In millions<br />
Revenues ..............................................$ 9,250<br />
Cost of Goods Sold ..............................$ 7,789<br />
Operating Expenses 1 ............................$ 1,022<br />
Income Tax Expense ............................$ 29<br />
Net Income ..........................................$ 32<br />
Adjusted EBITDA ..................................$ 872<br />
Total Assets ..........................................$8,714<br />
Net Debt 2 ..............................................$ 3,173<br />
1. Operating expenses exclude $29 million of restructuring,<br />
impairment and plant closing costs incurred in 2010.<br />
2. Net debt calculated as total debt excluding affiliates less cash.<br />
As a publicly traded company,<br />
Huntsman’s total common<br />
stock outstanding as of<br />
December 31, 2010, was<br />
237 million shares. For more<br />
information, please see the<br />
Investor Relations section of our<br />
website, www.huntsman.com.<br />
2010 2009 2008 2007 2006<br />
Net income (loss) $ 32 $ 112 $ 610 $ (181) $ 233<br />
Net (income) loss attributable to noncontrolling interests (5) 2 (1) 9 (3)<br />
Net income (loss) attributable to Huntsman Corporation $ 27 $ 114 $ 609 $ (172) $ 230<br />
Interest expense - net 229 238 262 285 349<br />
Income tax expense (benefit) 29 444 190 (13) (50)<br />
Depreciation and amortization 404 440 396 379 361<br />
Income taxes, depreciation and amortization in discont. ops. 11 (78) 72 (104) 141<br />
EBITDA 700 1,158 1,529 375 1,031<br />
Loss on accounts receivable securitization program – 23 27 21 13<br />
Unallocated foreign currency (gain) loss (3) (16) 31 12 (10)<br />
Legal and contract settlement expense (income), net 8 – – 6 (9)<br />
Loss on early extinguishment of debt 183 21 1 2 27<br />
Other restructuring, impairment and plant closing costs 29 88 31 29 8<br />
Expenses (income) associated with the 4 (835) (780) 210 –<br />
Terminated Merger and related litigation<br />
Acquisition related expenses 3 – – – –<br />
Gain on disposition of assets – (1) (1) (69) (92)<br />
(Income) loss from discontinued operations, net of tax (53) 97 (156) 339 4<br />
Extraordinary loss (gain) on the acquisition of a business, net of tax 1 (6) (14) 7 (56)<br />
Adjusted EBITDA 872 529 668 932 916<br />
Acquisition - Textile Effects – – – – 45<br />
Sale of C4 business – – – – (9)<br />
Proforma Adjusted EBITDA $ 872 $ 529 $ 668 $ 932 $ 951
Total Training Hours on<br />
Policies Concerning Human Rights<br />
How <strong>We</strong> Did<br />
As of the issuance of this report, 88 percent<br />
of Huntsman associates have been trained in<br />
Huntsman’s human rights policies.<br />
Huntsman expects all of our associates to be<br />
aware of and understand the company’s core<br />
policies and procedures. All new associates are<br />
required to take core compliance training, which<br />
includes information on human rights policies and<br />
covers regulations on child labor and industrial<br />
labor laws. Huntsman associates are periodically<br />
required to complete online training on Respect<br />
in the Workplace, Code of Business Conduct and<br />
the Huntsman Privacy Program.<br />
0<br />
Significant Financial Assistance<br />
Received from Government<br />
How <strong>We</strong> Did<br />
<strong>We</strong> define significant financial<br />
assistance to mean assistance given<br />
to avoid bankruptcy. Huntsman<br />
has maintained a strong financial<br />
balance sheet through the recent<br />
economic recession, and did not<br />
receive significant financial assistance<br />
from government in 2010.<br />
Percentage of Associates Covered<br />
by Collective Bargaining<br />
How <strong>We</strong> Did<br />
As of the issuance of this report, 59 percent<br />
of Huntsman associates are covered under<br />
Collective Bargaining Agreements.<br />
Huntsman’s Human Resources (HR) department<br />
oversees the collection and management of<br />
this data via global HR contacts in the United<br />
States, Europe, Latin America, Asia and India.<br />
In late 2011, we will be implementing a global<br />
HR Information System that will provide real-time<br />
reporting of associate data.<br />
Huntsman 2010 Sustainability Report 33
Our Baseline<br />
strategic changes in our business<br />
profile over the past few years<br />
have had a significant effect on<br />
the composition of our total energy<br />
and environmental emissions metrics<br />
compared with our previous baseline<br />
of 1998.<br />
Our 2006 baseline energy and environmental<br />
emissions for energy consumption<br />
and greenhouse gas emissions are<br />
nearly half our 1998 original baseline<br />
levels. The revised baseline for our<br />
remaining environmental performance<br />
metrics is not nearly as dramatic, but<br />
nonetheless more accurately reflects<br />
our current company portfolio.<br />
Minor corrections in historic data<br />
may be due to data errors or other<br />
approved reasons. Each year, energy<br />
consumption and environmental emission<br />
estimates are recalculated and<br />
revised for all years in the EHS annual<br />
report, as attempts are made to<br />
improve both the analyses themselves,<br />
through the use of better methods or<br />
data, and the overall usefulness of the<br />
report. Huntsman follows the United<br />
Nations Intergovernmental Panel on<br />
Climate Change (IPCC) Good Practice<br />
Guidance (IPCC 2000), which states,<br />
regarding recalculations of the time<br />
series: “It is good practice to recalculate<br />
historic emissions when methods are<br />
changed or refined, when new source<br />
34 Huntsman 2010 Sustainability Report<br />
categories are included in the inventory,<br />
or when errors in the estimates are<br />
identified and corrected.”<br />
In general, recalculations are made<br />
to the energy and emission estimates<br />
either to incorporate new methodologies<br />
or, most commonly, to update recent<br />
historical data. As a result, figures and<br />
totals depicted in this year’s sustainability<br />
report may include small corrections in<br />
historic emissions as a result of routine<br />
auditing of our data.<br />
As reported in previous EHS annual<br />
reports, we completed the sale of<br />
our low-margin, energy-intensive Base<br />
Chemicals and Polymers operations<br />
near the end of 2007. Much of the<br />
decrease in our 2007 and 2008 energy,<br />
air and greenhouse gas emission<br />
metrics is a direct result of the sale of<br />
these Base Chemicals and Polymers<br />
sites. Conversely, over much the same<br />
time period, we acquired our Textile<br />
Effects business and have expanded<br />
some of our other business operations.<br />
These strategic changes in our business<br />
profile over the past few years<br />
have had a significant effect on the<br />
composition of our total energy and<br />
environmental metrics compared with<br />
our 1998 baseline year. <strong>We</strong> have subtracted<br />
Base Chemicals and Polymers’<br />
annual contribution to our 2006 and<br />
2007 environmental emissions and reset<br />
our baseline using 2006 as our new,<br />
lower level for all of our environmental<br />
performance indicators. Likewise,<br />
our energy and environmental charts<br />
clearly differentiate each business’<br />
relative contribution to our total<br />
emission metrics.<br />
<strong>We</strong> hope this added transparency<br />
better demonstrates our current global<br />
business profile, continued growth<br />
and resulting emissions.
Appendix per GRI Reporting Standards<br />
1.1 Report Contents..........................................Inside front cover<br />
2.1 Organization Name......................................................Page 6<br />
2.2 Primary Products ..................................................Pages 6, 7<br />
2.3 Operational Structure ............................................Pages 6,7<br />
2.4 Headquarters’ Location ..............................................Page 6<br />
2.5 Number of Countries for Operations ............................Page 6<br />
2.6 Nature of Ownership ..........................................Pages 9, 32<br />
2.7 Markets Served......................................................Pages 6,7<br />
2.8 Scale of Company ......................................................Page 6<br />
2.9 Significant Company Changes ....................................Page 7<br />
2.10 Awards ................................................................Pages 8, 9<br />
3.1 Reporting Periods ..............................................Pages 21,34<br />
3.2 Date of Most Recent Report ......................................Page 21<br />
3.3 Reporting Cycle ........................................................Page 21<br />
3.4 Contact for Questions ..............................................Page 21<br />
3.5 Report Scope and Boundary ......................................Page 21<br />
3.6 Boundary of Report ..................................................Page 21<br />
3.7 Limitations on Scope of Report..................................Page 21<br />
3.8 Joint Venture Reporting ............................................Page 21<br />
3.10 Restatements of Past- ..............................................Page 34<br />
Reported Information<br />
3.11 Changes from Previous Reports ................................Page 34<br />
3.12 Table of Standard Disclosures Location........Inside back cover<br />
4.1 Governance Structure ................................................Page 9<br />
4.2 Chair of Governance Body ..........................................Page 9<br />
4.3 Independent Members of Governance Body..................Page 9<br />
4.4 Mechanisms for Governance Direction ........................Page 9<br />
4.14 Stakeholder Groups ....................................................Page 6<br />
4.15 Stakeholder Selection Criteria ....................................Page 6<br />
Standard Disclosures: Performance Indicators<br />
EN-16 Total Direct and Indirect ....................................Pages 24, 25<br />
Greenhouse Gas Emissions<br />
EN-22 Total Waste by Type and Disposal Method ..........Pages 28, 29<br />
SO-03 Percentage of Associates Trained in ..........................Page 31<br />
Anti-Corruption<br />
HR-03 Total Training Hours on Policies..................................Page 33<br />
Concerning Human Rights<br />
LA-04 Percentage of Associates Covered by ........................Page 33<br />
Collective Bargaining<br />
LA-07 Rates of Injury, Occupational......................................Page 30<br />
Disease and Lost Days<br />
LA-10 Average Hours of Training per Year............................Page 30<br />
EC-01 Direct Economic Value Generated ..............................Page 32<br />
and Distributed<br />
EC-04 Significant Financial Assistance ................................Page 33<br />
Received from Government
Global headquarters<br />
Huntsman Corporation<br />
10003 Woodloch Forest Drive<br />
The Woodlands<br />
Texas 77380<br />
USA<br />
Telephone +1 281 719 6000<br />
Fax +1 281 719 6416<br />
www.huntsman.com<br />
Copyright © 2012 Huntsman Corporation or an affiliate thereof. All rights reserved.<br />
The use of the symbol ® herein signifies the registration of the associated trademark in one or more, but not all, countries.