Long term council community plan 2009.pdf - Hutt City Council
Long term council community plan 2009.pdf - Hutt City Council
Long term council community plan 2009.pdf - Hutt City Council
- No tags were found...

Create successful ePaper yourself
Turn your PDF publications into a flip-book with our unique Google optimized e-Paper software.
hutt city <strong>community</strong> <strong>plan</strong><strong>community</strong> <strong>plan</strong> 2009 ➔ 2019Welcome To <strong>Hutt</strong> <strong>City</strong> <strong>Council</strong>’s <strong>Long</strong> Term <strong>Council</strong> Community Plan 2009-2019 incorporating The 2009-2010 Annual Plan
contentsINTRODUCTIONMessage from the Mayor and Chief Executive 6Audit Report 7How the pieces fit together 10Welcome to <strong>Hutt</strong> <strong>City</strong> <strong>Council</strong>’s Community Plan 2009-2019 12THE FOUNDATIONS OF OUR WORKOur strategies, policies and <strong>plan</strong>s to promote social, economic,environmental and cultural wellbeingOUR COMMUNITY GOALSLooking ahead: our goals and priorities 30Our vision 31Community outcomes to achieve our vision 32HOW WE PLAN TO ACHIEVE OUR GOALSFive <strong>Council</strong> groups, 18 key activities 60Key performance indicators 60Looking ahead – our targets and performance measures for the next 10 years 63FINANCING OUR WORK 100ACHIEVING OUR COMMUNITY OUTCOMES: MEASURING PROGRESS 136OUR COMMUNITY 140<strong>Hutt</strong> <strong>City</strong> <strong>Council</strong> 141Community partnerships 148LEGISLATION AFFECTING LOCAL GOVERNMENT 15818APPENDICESSustainable Development Planning:➔➔Asset Management Planning164➔➔Summary of 2004 Waste Management Plan169➔➔Water and Sanitary Services Assessments171Financial Information:➔➔Forecast Financial Statements and Summary of Significant187Accounting Policies➔➔Funding Impact Statement213➔➔Rates for 2009/10214➔➔Fees and Charges218Policies:➔➔Revenue and Financing Policy236➔➔Significance Policy252➔➔Policy on Partnerships with the Private Sector255➔➔Development and Financial Contributions Policy257➔➔Liability Management Policy281➔➔Investment Policy285➔➔Policy on Remission and Postponement of Rates on Maori Freehold Land 286➔➔Rates Postponement Policy287➔➔Rates Remission Policy288➔➔Corporate Asset Management Policy294Definitions 297Contact Details 299
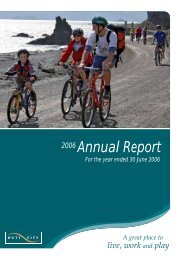
Living in the cycle cityThe Morris family is certainly making the most of living in cycle city , .Wayne Morris tells envious friends overseas that we just ride out thedoor and down the road to get to the river, where you can cycle safelyfor miles with the family and enjoy some of the best scenery around.Or you can take the bike up into the hills and get spectacular viewsof the city and the sea ,, .
Introduction
6Message from the mayor and chief executiveDavid OgdenWelcome to the 2009-2019 <strong>Long</strong>Term <strong>Council</strong> Community Plan,which sets out <strong>Hutt</strong> <strong>City</strong> <strong>Council</strong>’sbudget and work programmefor the next ten years.We have listened to residents and ratepayers who toldus through the consultation on the draft <strong>plan</strong> that weneed to balance the need for continued developmentwith keeping rate increases to a minimum. Manyhouseholds and businesses are struggling as we facethe toughest economic conditions since the 1930s.We are responding by reducing this year’s averagerates increase to 2.9%.We would like to thank everyone who had their sayon the draft <strong>plan</strong>, from members of the public to<strong>community</strong> boards and committees. We receivedaround 900 submissions and the information theyprovided was essential in guiding the decision-makingprocess. Our thanks also to <strong>council</strong>lors for theirdeliberations on the <strong>plan</strong>, and <strong>council</strong> staff for theirhard work.The key initiatives outlined in this <strong>plan</strong> will help us ensurethat <strong>Hutt</strong> <strong>City</strong> continues to be a great place to live, workand play.The <strong>plan</strong> reflects our commitment to continually enhanceour services and facilities including parks, libraries, andpools. A number of new projects are also included andwe are continuing to invest in infrastructure includingflood protection, water, waste and roads.David OgdenMayorTony StallingerChief ExecutiveTony Stallinger
hutt city <strong>community</strong> <strong>plan</strong> 7Audit reportReport to the readers of <strong>Hutt</strong> <strong>City</strong> <strong>Council</strong>’s <strong>Long</strong>-Term <strong>Council</strong> Community Plan for the ten years commencing 1 July 2009The Auditor General is the auditor of the <strong>Hutt</strong> <strong>City</strong><strong>Council</strong> (the <strong>City</strong> <strong>Council</strong>). The Auditor General hasappointed me, John O’Connell, using the staff andresources of Audit New Zealand, to report on the<strong>Long</strong>-Term <strong>Council</strong> Community Plan (LTCCP), onhis behalf.The Auditor-General is required by section 94(1) of theLocal Government Act 2002 (the Act) to report on:ÎÎthe extent to which the LTCCP complies with therequirements of the Act;ÎÎthe quality of information and assumptionsunderlying the forecast information provided inthe LTCCP; andÎÎthe extent to which the forecast information andperformance measures will provide an appropriateframework for the meaningful assessment of theactual levels of service provision.It is not our responsibility to express an opinion onthe merits of any policy content within the LTCCP.OpinionOverall OpinionIn our opinion the LTCCP of the <strong>City</strong> <strong>Council</strong>incorporating Volume 1 dated 30 June 2009 providesa reasonable basis for long-<strong>term</strong> integrated decisionmakingby the <strong>City</strong> <strong>Council</strong> and for participation indecision-making by the public and subsequentaccountability to the <strong>community</strong> about the activitiesof the <strong>City</strong> <strong>Council</strong>.In forming our overall opinion, we considered thespecific matters outlined in section 94(1) of the Actwhich we report on as follows.Opinion on Specific Matters Requiredby the ActIn our view:ÎÎthe <strong>City</strong> <strong>Council</strong> has complied with the requirementsof the Act in all material respects demonstratinggood practice for a <strong>council</strong> of its size and scalewithin the context of its environment;ÎÎthe underlying information and assumptions usedto prepare the LTCCP provide a reasonable andsupportable basis for the preparation of the forecastinformation; andÎÎthe extent to which the forecast information andperformance measures within the LTCCP providean appropriate framework for the meaningfulassessment of the actual levels of service provisionreflects good practice for a <strong>council</strong> of its size andscale within the context of its environment.Actual results are likely to be different from the forecastinformation since anticipated events frequently do notoccur as expected and the variation may be material.Accordingly, we express no opinion as to whether theforecasts will be achieved.Our report was completed on 30 June 2009, and is thedate at which our opinion is expressed.The basis of the opinion is explained below. In addition,we outline the responsibilities of the <strong>City</strong> <strong>Council</strong> andthe Auditor, and explain our independence.
8Basis of OpinionWe carried out the audit in accordance with theInternational Standard on Assurance Engagements3000: Assurance Engagements Other Than Auditsor Reviews of Historical Financial Information andthe Auditor-General’s Auditing Standards, whichincorporate the New Zealand Auditing Standards.We have examined the forecast financial informationin accordance with the International Standard onAssurance Engagements 3400: The Examination ofProspective Financial Information.We <strong>plan</strong>ned and performed our audit to obtain all theinformation and ex<strong>plan</strong>ations we considered necessaryto obtain reasonable assurance that the LTCCP doesnot contain material misstatements. If we had foundmaterial misstatements that were not corrected, wewould have referred to them in our opinion.Our audit procedures included assessing whether:ÎÎthe LTCCP provides the <strong>community</strong> with sufficientand balanced information about the strategic andother key issues, choices and implications it facesto provide an opportunity for participation by thepublic in decision-making processes;ÎÎthe <strong>City</strong> <strong>Council</strong>’s financial strategy, supported byfinancial policies as included in the LTCCP, isfinancially prudent and has been clearlycommunicated to the <strong>community</strong> in the LTCCP;ÎÎthe presentation of the LTCCP complies with thelegislative requirements of the Act;ÎÎthe decision-making and consultation processesunderlying the development of the LTCCP arecompliant with the decision-making and consultationrequirements of the Act;ÎÎthe information in the LTCCP is based on materiallycomplete and reliable asset or activity managementinformation;ÎÎthe agreed levels of service are fairly reflectedthroughout the LTCCP;ÎÎthe key <strong>plan</strong>s and policies adopted by the <strong>City</strong><strong>Council</strong> have been consistently applied in thedevelopment of the forecast information;ÎÎthe assumptions set out within the LTCCP are basedon best information currently available to the <strong>City</strong><strong>Council</strong> and provide a reasonable and supportablebasis for the preparation of the forecast information;ÎÎthe forecast information has been properly preparedon the basis of the underlying information and theassumptions adopted and the financial informationcomplies with generally accepted accountingpractice in New Zealand;ÎÎthe rationale for the activities is clearly presented;ÎÎthe levels of service and performance measuresare reasonable estimates and reflect the keyaspects of the <strong>City</strong> <strong>Council</strong>’s service delivery andperformance; andÎÎthe relationship of the levels of service, performancemeasures and forecast financial information hasbeen adequately explained within the LTCCP.We do not guarantee complete accuracy of theinformation in the LTCCP. Our procedures includedexamining on a test basis, evidence supportingassumptions, amounts and other disclosures inthe LTCCP and de<strong>term</strong>ining compliance with therequirements of the Act. We evaluated the overalladequacy of the presentation of information. Weobtained all the information and ex<strong>plan</strong>ations werequired to support our opinion above.
hutt city <strong>community</strong> <strong>plan</strong> 9Responsibilities of the <strong>Council</strong>and the AuditorThe <strong>City</strong> <strong>Council</strong> is responsible for preparing anLTCCP under the Act, by applying the <strong>City</strong> <strong>Council</strong>’sassumptions and presenting the financial information inaccordance with generally accepted accountingpractice in New Zealand. The <strong>City</strong> <strong>Council</strong>’sresponsibilities arise from Section 93 of the Act.We are responsible for expressing an independentopinion on the LTCCP and reporting that opinion to you.This responsibility arises from section 15 of the PublicAudit Act 2001 and section 94(1) of the Act.IndependenceWhen reporting on the LTCCP we followed theindependence requirements of the Auditor General,which incorporate the independence requirements ofthe Institute of Chartered Accountants of New Zealand.Other than this report and in conducting the audit of theStatement of Proposal for adoption of the LTCCP andthe annual audit, we have no relationship with orinterests in the <strong>City</strong> <strong>Council</strong>.John O’ConnellAudit New ZealandOn behalf of the Auditor-GeneralWELLINGTON, New Zealand
10How the pieces fit togetherThis diagram illustrates how the components of this 10-year <strong>plan</strong> work to achieve our vision – of making <strong>Hutt</strong> <strong>City</strong> a great place to live, work and play.Our <strong>community</strong> (p140)<strong>Hutt</strong> <strong>City</strong> <strong>Council</strong> (p141)<strong>Council</strong> governance (p142)Community boards and <strong>community</strong> committees (p143)Our management structure (p145)<strong>Council</strong>-controlled trading organisations (p146)Community Partnerships (p148)Business (p149)Maori (p150)Other local authorities (p152)Central government (p153)Our <strong>community</strong> (p154)Our <strong>community</strong> goals (p30)Community prosperity (p32)Connected (p35)Entrepreneurial & innovative culture (p37)Healthy environment (p39)Lifestyle (p43)Regional foundations (p47)Sense of place (p50)Strong and tolerant communities (p53)Healthy and educated <strong>community</strong> (p55)Vision for <strong>Hutt</strong> <strong>City</strong>: A GREAT PLACE TO LIVE, WORK AND PLAY (p31)How we <strong>plan</strong> to achieve our goals5 <strong>Council</strong> groups, 18 key activities (p60)Key performance indicators (p60)Targets and performance measures:–– Group People (p64)–– Group Utility Services (p76)–– Group Environment (p85)–– Group Economy (p90)–– Group Organisation (p94)Achieving our <strong>community</strong> outcomes: measuring progressProgress on achieving our <strong>community</strong> outcomes (p136)
hutt city <strong>community</strong> <strong>plan</strong> 11Legislation affecting local governmentAs a local authority, we and our work are governed by a large number of pieces of legislation (p158)The foundations of our workPromoting <strong>community</strong> wellbeing taking a sustainabledevelopment approach (p18)Working region-wide – Wellington Regional Strategy (p19)Planning for Lower <strong>Hutt</strong> – <strong>City</strong> of Lower <strong>Hutt</strong> District Plan (p19)Strengthening our financial position – HCC FinancialStrategy (p20)Managing our assets effectively – Asset ManagementPlans (p21 and 164)Working together to manage our waste – <strong>Hutt</strong> Valley WasteManagement Plan (p21 and 169)Managing our public health services – Water and SanitaryServices Assessments (p22 and 171)Protecting our environment – Environmental SustainabilityStrategy (p22)Enhancing business opportunities – Economic DevelopmentStrategy (p22)Other strategies, policies and <strong>plan</strong>s underpinning ouractivities (p23)Financing our workPrioritising our spending (p100)Types of expenditure (p100)Income for the whole of <strong>Council</strong> (p101)Capital and operating projects and cost and source of funds:–– Group People (p102)–– Group Utility Services (p113)–– Group Environment (p123)–– Group Economy (p126)–– Group Organisation (p129)Forecast Financial Statements (p187)Funding Impact Statement (p213)Rates for 2009/10 (p214)Fees and charges (p218)
12welcome to hutt city <strong>council</strong>’s <strong>community</strong> <strong>plan</strong> 2009–2019Welcome to the future of<strong>Hutt</strong> <strong>City</strong>!This <strong>plan</strong> for our <strong>community</strong> looks ahead to the next10 years. It reflects the views of the many <strong>Hutt</strong> <strong>City</strong>residents and ratepayers who’ve told us what outcomesthey want for our city now and in the future.Why have this <strong>plan</strong>?This ‘<strong>Long</strong> Term <strong>Council</strong> Community Plan’ (often referredto as the ‘Community Plan’ or ‘LTCCP’) is an importantdocument for our <strong>community</strong>. By looking ahead to thenext 10 years, it helps us to steer our direction, formulateour strategies, <strong>plan</strong>s and policies and take a long-<strong>term</strong>approach to all our activities.We produced the last <strong>plan</strong> in July 2007, covering the10 years to 2017. This <strong>plan</strong> covers the years 2009-2019,and through it we aim to:ÎÎenable <strong>Hutt</strong> <strong>City</strong> people to influence the decisionsthat affect themÎÎput in writing what we want to see happen in our<strong>community</strong>, and how we’re going to make it happenÎÎfocus on the long <strong>term</strong> to ensure that the decisionswe make now will benefit the <strong>community</strong> in the futureÎÎensure that we use <strong>Council</strong> and <strong>community</strong>resources effectivelyÎÎhave a framework that ensures the <strong>Council</strong> isaccountable to the <strong>community</strong> we serve.While this is the main document we use to <strong>plan</strong> ouractivities for the future, we also prepare an ‘Annual Plan’for each financial year containing our annual budget.<strong>Hutt</strong> <strong>City</strong> or <strong>Hutt</strong> Valley?In this document:ÎΑ<strong>Hutt</strong> <strong>City</strong>’ means the city of Lower <strong>Hutt</strong>ÎΑ<strong>Hutt</strong> Valley’ means the cities of Lower <strong>Hutt</strong>and Upper <strong>Hutt</strong>.What is ‘<strong>community</strong> wellbeing’?In this document, ‘<strong>community</strong> wellbeing’ means thesocial, economic, environmental and cultural welfareof our <strong>community</strong>. The <strong>term</strong> recognises that the fourcomponents are closely interlinked.What is ‘sustainable development’?When we undertake ‘sustainable development’, we’restriving to meet present needs without compromisingthe ability of future generations to meet their ownneeds. A holistic concept, ‘sustainable development’links the guiding principles of the Local GovernmentAct with those of the Resource Management Act.The importance of affordabilityAs you’re aware, this <strong>plan</strong> is being produced ata difficult time for New Zealand and for <strong>Hutt</strong> <strong>City</strong>.The global economic situation is affecting manyof our residents and businesses, and may continueto do so for some time.This makes it more important than ever that we manageour money sensibly. For this reason, the <strong>plan</strong> focuseson prudent financial management, providing highquality services and amenities, and maintaining ourexisting assets and infrastructure (a major componentof our annual budget). However, we’re also committedto allowing for some new development while makingsure we allocate our spending so that we deliver thebest possible services to our <strong>community</strong>.Our budgets are driven by our current ‘FinancialStrategy’, which was adopted in 2005 and aims toput us in a good position to fund the projects andprogrammes our <strong>community</strong> needs to achieve itsaspirations in the next 20 to 30 years. The Strategyincludes targets for the rates we collect and the costsof the services we provide, as well as details of howwe <strong>plan</strong> to manage debt and other financial risks andaccess the funding we need. You can read moreabout it on page 20.
hutt city <strong>community</strong> <strong>plan</strong> 13Key messages from this <strong>plan</strong>We are not proposing to make any changes to the levelof <strong>Council</strong> services that are currently delivered in our<strong>community</strong>. Through continuing our sensible approachto financial management, and focusing on maintainingexisting services and assets, we are confident that wecan continue to develop the city to meet the aspirationsof our citizens.We remain committed to delivering low rates increases,with the increase in rates revenue for 2009/10 set at3.4%, down from the 3.9% projected in the DraftCommunity Plan. This is an average rates increaseof 2.9%.We are also on track to reduce the city’s debt from thecurrent $80 million to under $30 million by 2015. Thiswill keep rates down, save significant amounts of moneyper annum in interest, and give the <strong>Council</strong> the flexibilityto borrow for major projects in the future.<strong>Council</strong> does however remain committed to meeting the<strong>community</strong>’s need for services and facilities, and thechanges made to the Community Plan as a result of theconsultation reflect this, including:ÎÎan additional $2.3 million to bring <strong>Council</strong>’scontribution to the Walter Nash Stadium upgradeto $4 millionÎÎan extra $100,000 for the Stokes Valley shoppingcentre upgrade in 2009/10ÎÎ$800,000 for Wainuiomata Hill summit pedestrian/cycling bridge in 2011/12ÎÎ$500,000 for Naenae subway improvements in2011/12ÎÎan additional $200,000 a year for cyclewaysÎÎgrants for Mitchell Park tennis courts ($200,000) andreplacement hockey turf at Fraser Park ($100,000)ÎÎ$2.15 million over 10 years for environmentalinitiativesÎÎ$150,000 to upgrade security cameras in the CBD,and to install new cameras in Wainuiomata from2009/10 to 2011/12ÎÎfunding for a part-time CBD retail coordinator, andfurther funding to retain a retail coordinator for theStokes Valley/Naenae/Taita shopping centresÎÎ$300,000 for the final stage of <strong>Hutt</strong> Parkredevelopment brought forward from 2014/15 to2009/10ÎÎ$500,000 for a synthetic turf at Memorial Parkbrought forward from 2015/16 to 2011/12, and anextra $10,000 budgeted for in 2009/10ÎÎ$50,000 for sound and lighting improvements toLittle Theatre in 2009/10ÎÎ$500,000 boost to events budget over 10 yearsÎÎ$300,000 for additional street trees to be <strong>plan</strong>tedbetween 2009 and 2019ÎÎan extra $185,000 to upgrade the Tutukiwi orchidhouse in 2009/10.Other key features include:ÎÎ$1.25 million to upgrade McKenzie Pool in 2010/11ÎÎ$1.1 million for a learn-to-swim pool at Huia Pool in2012/13ÎÎ$2.2 million for Korohiwa bus barn redevelopmentin 2009/10ÎÎ$24 million to earthquake strengthen the main<strong>Council</strong> building in 2016/17ÎÎ$18 million for the Cross Valley Link in 2015/16.Details of the major projects <strong>plan</strong>ned over the 10 yeartimeframe can be found from page 102.
14<strong>Council</strong> projectsAs well as the capital and operating projects listed frompage 102, <strong>Council</strong> is involved in many other activitiesand initiatives. Activities occurring during the 2009/10financial year include:ÎÎmaintaining our Building Act accreditation as aBuilding Control AuthorityÎÎde<strong>term</strong>ining <strong>Council</strong>’s future role in providingbroadband in the Wellington Region – see moreinformation below about thisÎÎcontinuing the <strong>Council</strong>’s Land Review Projectinvolving land managed as reserve, to formallyclassify the reserve status of land with high reservevalue and to identify land for possible disposalÎÎcontinuing with <strong>Council</strong>’s asset sales programmefor other land that is assessed as surplus to<strong>Council</strong>’s requirements.Wellington region broadbandAs part of the identified work streams in the WellingtonRegional Strategy, <strong>council</strong>s in the region have over thepast year been investigating their potential role in futurebroadband investment.The Government has announced that it intends makinga significant investment in this area with an ambitious<strong>plan</strong> for ultra-fast broadband with an emphasis onfibre-optic cabling to the home, the details of whichare still to be announced.<strong>Council</strong>’s future role could include some or all ofthe following:ÎÎas managers of the road corridor, where any newbroadband infrastructure is likely to be installedÎÎstreamlining the rules and processes around rollouttelecommunications infrastructureÎÎpromoting the use of broadband in the <strong>community</strong>ÎÎleveraging the existing buying power of <strong>council</strong>sas users of telecommunications servicesÎÎsponsorship of or investment in urban fibre networksdesigned to deliver on <strong>community</strong> objectives(<strong>Council</strong> currently has a minority shareholdinginvestment in Smartlinx3 Ltd, a company establishedto rollout a fibre network in the cities of Lower <strong>Hutt</strong>,Upper <strong>Hutt</strong> and Porirua)ÎÎallowing access to <strong>community</strong> assets on the basisthis is used to provide open access networksÎÎadvocating to government for investment in thisarea, including linkages from our region to the restof New Zealand and the world.Transport projectsBetween 23 March and 24 April 2009, GreaterWellington Regional <strong>Council</strong> undertook consultationon the Regional Land Transport Programme for theWellington region. This establishes the regional priorityfor many of our transport activities including statehighway activities, local road improvements, walkingand cycling and <strong>community</strong> road safety activities.There are two major local proposals that are likely toproceed to the detailed design stage over the nextthree years through the Regional Land TransportProgramme. These are:1. the State Highway 2 Melling Interchange andMelling Bridge Package, which addresses safetyand capacity issues at Melling and improvesaccess to the <strong>Hutt</strong> <strong>City</strong> centre, and2. the State Highway 2/State Highway 58 gradeseparation project which addresses safety andcapacity issues at the Haywards intersection.Other major projects proposed during the next 10 yearsare the State Highway 2 Kennedy Good Interchangeand the Grenada-Gracefield link.<strong>Hutt</strong> <strong>City</strong> <strong>Council</strong> has allocated funding for worksassociated with the State Highway 2 Melling Interchangeand Melling Bridge Package in 2015/16, and for thesecond stage of the Grenada-Gracefield link as an$18 million roading network improvement in 2015/16.The latter figure is the anticipated net cost to <strong>Council</strong>for the Cross Valley Link.The remaining major projects proposed over the10 year period are expected to be fully funded bythe NZ Transport Agency.More information is available on Greater Wellington’swebsite: www.gw.govt.nz
hutt city <strong>community</strong> <strong>plan</strong> 15Draft Community Plan 2009-2019Questionnaire ResultsA total of 938 submissions were received on the2009-2019 Draft Community Plan, with most of thesesubmitted on the questionnaire form. The results of thequestionnaire are available on the <strong>Council</strong>’s website:www.huttcity.govt.nz (Your <strong>Council</strong>/Meeting Calendar/Meetings can be viewed by Committee/CommunityPlan Committee Meetings/Community Plan CommitteeMeeting 3 June 2009/Draft LTCCP Consultation ResultsAppendix 2).
Creating a masterpieceTheNewDowse delivers a diverse range of exhibitions and events thatengage visitors and deliver experiences that are inspiring, accessible,adventurous and entrepreneurial. It , s all about enabling people to connectwith and experience creativity - from art and design to hip hop, fashionand science - and it can be a very ‘ hands on , business that sometimesinvolves creating your own masterpiece !
photo credit Joanne Honey ThomasThe Foundations Of Our Work
18As a leader in our <strong>community</strong>,<strong>Hutt</strong> <strong>City</strong> <strong>Council</strong> is committed tohelping those who live and workhere to lead healthy, prosperousand culturally enriched lives– and to creating a city to whichpeople are proud to belong.Promoting <strong>community</strong> wellbeing –key to our futureWe know that <strong>community</strong> wellbeing (that is, social,economic, environmental and cultural wellbeing) is vitalto our future as a strong, flourishing city. It’s a principlethat underlies all our work, and which you’ll seethreaded through every project we undertake.Social wellbeingAs well as a ‘Community Charter’, we’ve developeda number of strategies aimed at promoting socialwellbeing in our local <strong>community</strong>. You can read moreabout them from page 23.Economic wellbeingOur ‘Economic Development Strategy’ is the basisfor encouraging a strong, enterprising and diversebusiness and economic base for our city. You canread more about it on page 22.Environmental wellbeingWe appreciate that many of our activities affect theenvironmental wellbeing of the city, its residents andits businesses.We take our responsibilities seriously, and are committedto managing effectively the effects of our work on theland and associated natural and physical resources.Much of this work is covered in our ‘District Plan’(see page 19), while our ‘Environmental SustainabilityStrategy’ (see page 22) provides a framework for ourenvironmental sustainability initiatives, which aim toreduce the city’s impact on the environment.Cultural wellbeingWe contribute to our <strong>community</strong>’s cultural wellbeing inmany ways. For example, we:ÎÎprovide and support recreational activities andfacilities such as libraries, museums, swimmingpools, parks, reserves, sports grounds, <strong>community</strong>houses and halls, walkways and cyclewaysÎÎsupport arts, creative, cultural and heritage initiativesthrough our Community Support and Local UrbanEnvironment activities and our Arts and Culture PolicyÎÎrecognise history and heritage through ourenvironmental management and economicdevelopment activitiesÎÎpromote tourism, events and festivalsÎÎsupport people’s freedom to retain, interpret andexpress their arts, history, heritage and traditions,which all contribute to <strong>Hutt</strong> <strong>City</strong>’s cultural depthand richness.Taking a sustainable developmentapproachA major purpose of local government is to promote<strong>community</strong> wellbeing, taking a sustainable developmentapproach. This is reflected throughout all of <strong>Council</strong>’score business activities. In addition, the concept ofsustainability is at the heart of many of our strategies,policies and <strong>plan</strong>s. We’re committed to ensuring thatthe activities we undertake meet the needs of our<strong>community</strong> today without compromising on futuregenerations’ ability to meet their own needs.Strategies, policies and <strong>plan</strong>sunderpinning our activitiesThis focus on <strong>community</strong> wellbeing and sustainabledevelopment isn’t confined to <strong>Hutt</strong> <strong>City</strong>; it extends tolocal authorities in the greater Wellington region andthroughout New Zealand. It’s expressed in a number ofstrategies, policies and <strong>plan</strong>s – here’s a brief outline ofthe ones that are likely to have the most effect on thisCommunity Plan 2009-2019.
hutt city <strong>community</strong> <strong>plan</strong> 19Working region-wide<strong>Hutt</strong> <strong>City</strong> <strong>Council</strong> is one of nine local authorities in theWellington region that helped to develop the ‘WellingtonRegional Strategy’ (WRS) in 2007.Produced in tandem with central government andbusiness, education, research and voluntary sectorinterests, the WRS focuses on achieving sustainableeconomic growth in the region in three important areas:1. Investment in leadership and partnerships –ensuring we have the right governance andrelationships in place to achieve the WRS goals.2. Investment in growing our economy, especially ourexports, to help the region prosper and support ourquality of life. ‘Grow Wellington’, an economicdevelopment agency established in 2007, isresponsible for implementing the economic initiatives.3. Investment in good regional form, including thephysical arrangement of our urban and ruralcommunities and how they link together, e.g.transport, roading, urban design, housing choiceand density and open spaces.The WRS Committee, which oversees the strategy’simplementation, is chaired by Sir John Anderson andincludes the Chair of Greater Wellington Regional<strong>Council</strong> and the Mayors of <strong>Hutt</strong> <strong>City</strong> <strong>Council</strong>, KapitiCoast District <strong>Council</strong>, Porirua <strong>City</strong> <strong>Council</strong>, SouthWairarapa District <strong>Council</strong>, Upper <strong>Hutt</strong> <strong>City</strong> <strong>Council</strong> andWellington <strong>City</strong> <strong>Council</strong>. Five independent appointeesrepresent private sector and business interests.Planning for Lower <strong>Hutt</strong>Approved in 2003 and amended and updated sincethen, the ‘<strong>City</strong> of Lower <strong>Hutt</strong> District Plan’ is one ofour most important documents. Through it, we aimto promote the sustainable management of naturaland physical resources by:ÎÎmanaging the use, development and protectionof these resources carefully – and at a rate thatenables people in our <strong>community</strong> to provide fortheir social, economic and cultural wellbeing andfor their health and safety,while:ÎÎensuring these resources have the potential to meetthe reasonably foreseeable needs of future generationsÎÎprotecting the life-supporting capacity of air, water,soil and ecosystemsÎÎavoiding, remedying or mitigating any adverseeffects of activities on the environment.The District Plan is particularly relevant to people whoare <strong>plan</strong>ning to buy a property, thinking of makingalterations to their property, considering a change inland use or considering subdividing their land. It:ÎÎprovides objectives, policies and methods formanaging the effects of land use, developmentand protectionÎÎsets out the way development can happen in thecity – for example, how tall buildings can be andhow close to boundaries they can be built, andwhat kinds of activity are allowed in different areas(e.g. residential or commercial)ÎÎcovers both new developments and changes toexisting buildings or uses.Currently, we have two important proposed changesto the District Plan underway:ÎÎProposed Plan Change 12 proposes extendingthe ‘Higher Density Residential Area’ to includeareas within walking distance of the main suburbanshopping centres and the central business district.It also deals with some more minor amendmentsto the bulk and location rules. In addition it proposesa financial limit on the reserves contribution requiredwhen a subdivision is undertaken. Submissions andfurther submissions will be heard by <strong>Council</strong> inAugust/September 2009.ÎÎthe provisions in the District Plan relating to theCentral Commercial Activity Area have beenreviewed and a Proposed Plan Change will beprepared for <strong>Council</strong>’s consideration and formalpublic consultation by July 2009.In addition we will be reviewing <strong>plan</strong>ning provisionsfor Petone (consultation beginning in June 2009),temporary and filming activities across the city and we’llstart a review of the Seaview/Gracefield area provisions.The District Plan is available online at www.huttcity.govt.nzand for viewing at our main <strong>Council</strong> building and in allcity libraries.
20Strengthening our financial positionOur ‘Financial Strategy’ aims to strengthen the <strong>Council</strong>’s financial position, putting us in a good position for the anticipated projects and programmes required in the next 20 to30 years. It’s used as a framework for budget management when developing this 10-year <strong>plan</strong> and our Annual Plan and covers our rate charges, the costs of delivering ourservices, our financial position, our funding supply and our financial risks.Objectives Measures TargetsRate charges<strong>Council</strong> rate charges are controlled prudentlyand are competitive when compared withthose of peer local authoritiesRates per capita Annual increase below inflation + 0.5%Below our peers’ average by 2010 (achieved in 2008)Cost todeliverservicesWe deliver services at a cost below our peer<strong>council</strong>s’ averageWe allocate our service costs equitably(within the limits of the available chargingmechanisms)Total service cost per capitaSupport costs per capitaActual revenue vs indicative cost allocations in theRevenue & Financing Policy (see page 236):ÎÎPrivate vs public funding (user charges vs rates)ÎÎPublic funding by sectorBelow our peers’ averageBelow our peers’ averageIndividual activities generally within 5% of the policyWithin 1% of the policy by 2010FinancialpositionOur financial position is better than ourpeers’ averageNet debt levelNet debt per capitaNet debt/equity ratioOperating resultBelow our annual targetBelow $60 million by 2011Below $30 million by 2015Within our Treasury Policy limits at all timesBelow our peers’ averageBelow our peers’ averageProduce a surplus each yearFundingsupplyWe have secure and cost-effective fundingsources available to meet our financial needsLiquidity requirements of the Liability ManagementPolicy (see page 281)Overall cost of funds100% compliance with the policy requirementsBelow an independent benchmarkFinancial riskThe risk of our incurring a material financialloss is very lowUninsured risks in relation to the Risk Management PolicyInvestment and Liability Management Policies’ limits(see pages 285 and 281)All identified, considered and approved by ourStrategic Leadership Team100% compliance with the policies’ requirements
hutt city <strong>community</strong> <strong>plan</strong> 21Managing our assets effectivelyAs at 1 July 2008, <strong>Hutt</strong> <strong>City</strong>’s assets were worth$1,082,464,000. These include:ÎÎ5305 hectares of parks and reservesÎÎsix swimming poolsÎÎeight librariesÎÎ475 kilometres of roadsÎÎ728 kilometres of footpathsÎÎ13,747 street lightsÎÎ672 kilometres of wastewater pipesÎÎ528 kilometres of stormwater pipesÎÎ690 kilometres of water pipes.Our asset management <strong>plan</strong>s are key tools in ensuringwe manage and deliver asset-based services:ÎÎto the standards our customers expectÎÎat the most competitive cost to our customersÎÎin a way that’s sustainable in the long <strong>term</strong>ÎÎin compliance with legal requirements.Each <strong>plan</strong> has four key sections:1. The services to be delivered and the customerservice, legislative, technical and environmentalstandards the <strong>Council</strong> aims to achieve.2. The assets the <strong>Council</strong> will use to deliver theservices. This section covers the assets’ conditionand capabilities as well as a forecast of the futuredemand for the services.3. The asset management life cycle, with strategiesthat aim to maintain the capabilities of existingassets and to close any gaps between currentcapabilities and the target service standards.4. Quality assurance processes, to ensure our assetmanagement <strong>plan</strong>ning compares favourably withbest practice elsewhere in New Zealand.You can read more about our asset management<strong>plan</strong>ning processes on page 164.Working together to manage our wasteThe <strong>Hutt</strong> Valley ‘Waste Management Plan’ (WMP) wasdeveloped by <strong>Hutt</strong> <strong>City</strong> <strong>Council</strong> and Upper <strong>Hutt</strong> <strong>City</strong><strong>Council</strong> as a joint programme in 2004. It was preparedusing the New Zealand Waste Strategy’s (NZWS’s)policy framework – ‘Towards zero waste and asustainable New Zealand’ – and is consistent withNew Zealand’s international obligations under theKyoto Protocol, national policies, regional policies,and existing <strong>Council</strong> waste management policies.The WMP aims to:ÎÎpromote and encourage cost-effective, efficientand sustainable waste management practicesin the <strong>Hutt</strong> ValleyÎÎminimise the quantity of waste being generatedand disposed of within the <strong>Hutt</strong> Valley by providingstrategies and tactics to encourage waste reduction,reuse, recycling and recovery before disposing ofthe residue.In three sections it:ÎÎoutlines each <strong>Council</strong>’s current systems formanaging solid and liquid waste in the <strong>Hutt</strong> ValleyÎÎdetails the proposed <strong>Hutt</strong> Valley waste targets(which are the same as the NZWS targets) andreports on progress to date in meeting each targetÎÎexplores issues and opportunities to reduce wastefurther in the <strong>Hutt</strong> Valley.So far, we’ve made good progress in implementing the<strong>plan</strong>. This work is set to continue but, owing to a lack ofavailable solutions, we may not be able to meet theNZWS targets for organic wastes and construction anddemolition wastes within the set timeframes. Both<strong>council</strong>s are aware of the issues involved and are keento investigate options that are economically, sociallyand environmentally feasible.<strong>Hutt</strong> <strong>City</strong> and Upper <strong>Hutt</strong> <strong>City</strong> <strong>Council</strong>s are now reviewingthe WMP; the revised document will be made availableat www.huttcity.govt.nz when this work is complete. Inthe meantime, you can read more about it on page 169.
22Managing our public health servicesTo protect the health of everyone in Lower <strong>Hutt</strong>, weregularly assess our water and sanitary services toensure we can provide them to an acceptablestandard, and sustainably, into the future.Much of the information related to these assessmentsis already contained in asset management <strong>plan</strong>s andother documents and systems. You can also read moreabout our public health services (such as water supply,wastewater, stormwater, solid waste, cemeteries andcrematoria) from page 171.Protecting our environmentWhile sustainability is a key consideration in all of<strong>Council</strong>’s activities, we received a clear messagefrom our <strong>community</strong> that environmental sustainabilityshould be a top priority. In response to this weadopted our first ‘Environmental SustainabilityStrategy’ in November 2008.The strategy will guide our efforts to improve thesustainability and quality of our city’s environmentin the next five years. It builds on work we’re alreadydoing, such as beautification (which also promotesbiodiversity) and wastewater treatment (which alsoprotects public health and the water we use), andconcentrates mainly on our impacts on the naturalphysical environment and the use of natural resources.You can read more about the strategy at www.huttcity.govt.nz, including its detailed objectives and action<strong>plan</strong>s, along with medium- and longer-<strong>term</strong> targets forinitiatives we have <strong>plan</strong>ned. In summary, its main focusareas and the overall goal for each one are:Focus areaWasteTransportEnergyWaterUrban FormBiodiversity<strong>Council</strong>Our goalMove towards zero wasteTransport choices that reduce fueluse and offer better health andsafetyEnergy that does not compromisetomorrowEnsuring water for the futureA city that sustains us and theenvironmentFlourishing environments, thrivingwith local native <strong>plan</strong>ts and animalsAn environmental sustainabilityleader within the <strong>community</strong>The approach taken in the strategy is to stage theimplementation of the initiatives in order to ease thecosts. There are a range of options available to <strong>Council</strong>,in addition to rates, to help fund the strategy’simplementation. Overall, it is expected that between45% and 55% of the additional costs will be able to befunded from savings from <strong>Council</strong> energy efficiencyinitiatives and funding from central government.A number of key partners have been identified ascritical to the effective implementation of the strategy.A larger number of stakeholders are involved in someway with environmental sustainability, and all have thepotential to both contribute and benefit from thesuccessful implementation of the strategy.Enhancing business opportunitiesAs one of many players passionate about <strong>Hutt</strong> <strong>City</strong>’seconomic development, we’re committed to encouraginga strong, enterprising and diverse business <strong>community</strong>.Our work in this area is supported by our ‘EconomicDevelopment Strategy’, which was first implementedin 2002 then updated in 2008 to cover the period2009-2014.We’ve already made some good progress in attractingindustries and businesses to locate and stay in the city.For example, in the year to March 2008:ÎÎjob numbers increased by 2% to 45,870 jobs forthe yearÎÎ180 new businesses were createdÎÎour gross domestic product (GDP) rose by 0.4%.
hutt city <strong>community</strong> <strong>plan</strong> 23Our vision for 2009-2014 is to see more jobs in a more productive <strong>Hutt</strong> <strong>City</strong>. Together with our local business<strong>community</strong>, we’ve identified the results we’re looking for, and our strategies for getting there:We want to see…More business activity happeningin <strong>Hutt</strong> <strong>City</strong><strong>Hutt</strong> <strong>City</strong> recognised as a businesslocation and vibrant cityContinued investment in current and newbusiness activitiesA strongly entrepreneurial, skilled andavailable workforceA more environmentally sustainable <strong>Hutt</strong><strong>City</strong> business <strong>community</strong> and economyThrough…Current businesses staying and growingMore business co-operation and opportunities to use their successas a platform for encouraging othersA focus on growing and developing export-oriented businessesCommunication and marketingBuilding the profiles of our area and business sectors and throughstrategic <strong>plan</strong>ningBecoming a contributor to/leader of our regionInvestment <strong>plan</strong>ningInfrastructure developmentSkill developmentA strong entrepreneurial and management focusEnvironmental sustainabilitySocial responsibilityVisit www.huttcity.govt.nz for more information about the Economic Development Strategy, including its detailedobjectives.Other Strategies, Policies and PlansA number of other strategies, policies and <strong>plan</strong>s willguide us in achieving our goals and promoting our<strong>community</strong>’s social, economic, environmental andcultural wellbeing through a sustainable developmentapproach. The main documents are outlined below.Promoting social wellbeingAgeing Together StrategyOur work in developing an ‘Ageing Together Strategy’reflects our desire to understand the issues that affectolder people in <strong>Hutt</strong> <strong>City</strong>, and to work with the <strong>community</strong>in creating or supporting projects or actions to addressthe relevant issues.The Strategy’s development is being led by an‘Ageing Together Working Group’ of 12-15 key agencyrepresentatives and individuals with knowledge andexperience of older people. The group will hold publicmeetings four times a year, which will be open toanyone interested in contributing to the strategy, andfeature guest speakers and presentations. If you’d liketo be invited or involved, please contact Victor Pikari atvictor.pikari@huttcity.govt.nz or on 570 6923.
24Consultation PolicyThis policy describes our principles of, and generalapproach to, consultation with our <strong>community</strong>. We alsohave specific guidelines to ensure that consultation isalways methodical and consistent and complies withour legislative requirements.Gambling Venue and Board Venue PolicyAdopted in 2007 and due to be reviewed in early 2010,this policy aims to:ÎÎcontrol the growth of high-risk (Class 4) gamingmachines in <strong>Hutt</strong> <strong>City</strong>ÎÎestablish measures to reduce the harm caused byproblem gamblingÎÎencourage responsible gambling practices andattitudes in Class 4 gambling venuesÎÎhelp the <strong>community</strong> to access information aboutthe funds produced and distributed from Class 4gambling in the city.Housing PolicyOur 2008 Housing Policy aims to help ensure thatthe housing needs of people in <strong>Hutt</strong> <strong>City</strong> are metand to improve the affordability of housing in <strong>Hutt</strong> <strong>City</strong>,particularly for the elderly and socially disadvantaged.Safer <strong>City</strong> Strategy‘Safe Communities’ is an initiative of the World HealthOrganisation (WHO) that acknowledges the importanceof <strong>community</strong> participation in injury prevention andsafety promotion initiatives. It’s been adopted worldwide;since 1989, more than 140 communities with populationsranging from 2,000 to two million have been formallydesignated WHO Safe Communities.Our Annual Plan 2008-2009 included a commitmentto develop a ‘Safer <strong>City</strong> Strategy’. A steering groupcomprising representatives from <strong>Hutt</strong> <strong>City</strong> <strong>Council</strong>,New Zealand Police, the Accident CompensationCorporation, <strong>Hutt</strong> Valley District Health Board andRegional Public Health is driving the developmentof our Safe Community model, aiming to achieveWHO accreditation in 2010.Sale of Liquor PolicyThe 2008 Sale of Liquor Policy is designed to maintaina reasonable system of control over the sale and supplyof liquor to the public, with the aim of contributing to thereduction of alcohol-related harm.Settlement Support Strategic PlanThis 2007 <strong>plan</strong> aims to help migrants, refugees and theirfamilies to access appropriate information and servicesin the <strong>Hutt</strong> Valley. Settlement Support <strong>Hutt</strong> Valley has awell established Settlement Support Steering Groupcomprising representatives of the government agenciesand <strong>community</strong> groups and services that work withrefugees and migrants.Youth PolicyAdopted in 2005, the Youth Policy promotes a workingrelationship between young people in the city and<strong>Council</strong>, and clarifies our role in working with youngpeople. The policy is currently being reviewed.Promoting economic wellbeingCorporate Asset Management PolicyThe Corporate Asset Management Policy guides howwe use, develop and review our ‘asset management<strong>plan</strong>s’ to ensure our services continue to meet our<strong>community</strong>’s expectations of time, quality and valuefor money. The <strong>plan</strong>s show how we <strong>plan</strong> to use, maintainand invest in assets such as parks and reserves,libraries, roads, streetlights and drainage systems.You can read the policy from page 294.
hutt city <strong>community</strong> <strong>plan</strong> 25Development and Financial ContributionsPolicyThe Development and Financial Contributions Policyguides how we fund any new infrastructure (such asroads and drainage) that’s required to cope with growthin our area, such as new land subdivisions and buildingdevelopments. We use it to assess the financialcontributions required from property developerswhose projects increase demand for our services.You can read the policy from page 257.Funding Impact StatementThe Funding Impact Statement outlines all the fundingmechanisms we intend using and the amount of moneyeach mechanism will produce. See page 213 for a copy.Policy on Partnerships with the Private SectorThis policy outlines the circumstances under which we’llenter partnerships with private businesses, the relevantconditions and the consultation required. See page 255for a full copy.Policy for Remission and Postponementof Rates on Maori Freehold LandThis policy details how we remit and postpone rateson Maori freehold land (of which we have very little in<strong>Hutt</strong> <strong>City</strong>). See page 286 for a full copy of the policy.Rates Postponement PolicyThis policy covers how we treat applications forpostponement of rates. See page 287 for a full copy.Revenue and Financing PolicyThe Revenue and Financing Policy is key to workingout how we use our income from public and privatefunding sources (such as rates, fees, interest oninvestments, borrowing, grants and subsidies) topay for our spending.You can read the policy from page 236.Significance PolicyWe use the Significance Policy to establish the‘significance’ of proposals that others make and thedecisions that we make, and whether, for example, weneed to consult the <strong>community</strong> before making decisions.You can read the policy from page 252.Investment PolicyThis policy explains our approach to managinginvestments. See page 285 for a full copy.Liability Management PolicyThis policy explains our approach to managingour liabilities and controlling the associated risks.You can read the policy from page 281.Rates Remission PolicyThis policy covers situations in which it may be appropriateto reduce, postpone or cancel rate payments for people ororganisations. For example, it may be needed:ÎÎto help a new business enterprise or <strong>community</strong>or sporting organisationÎÎto help ease the burden of penalties on unpaid ratesÎÎfor land protected for natural, historic or culturalconservation purposesÎÎfor land affected by a natural disaster.See page 288 for a full copy of the policy.Suburban Shopping Centres Fund PolicyDeveloped in 2005, this policy outlines how weadminister the ‘Suburban Shopping Centres Fund’.It clarifies the roles of suburban shopping centresand helps us to establish the scope of any upgradeprojects. It also identifies centres that qualify forfunding and includes a model for ranking qualifyingcentres for future funding.
26Visitor StrategyAdopted in 2003, this strategy focuses on our roleand function in making <strong>Hutt</strong> <strong>City</strong> a great place forvisitors. However, its success does depend on otherorganisations’ willingness to contribute and collaborate.Promoting environmental wellbeingVision CBD 2030Vision CBD 2030 is a project that aims to produce a<strong>community</strong>-wide vision for the CBD, prioritising whatthe <strong>community</strong> considers important for its future.CBD Making PlacesCBD Making Places is a follow-up project to Vision CBD2030. By mid to late 2009 it will produce a practicalframework for ways to realise our <strong>community</strong>’s visionfor the CBD. This project has now superceded whatwas known as the CBD Master<strong>plan</strong>.Earthquake Prone, Dangerous andInsanitary Buildings PolicyAdopted in 2006, this policy describes how we treat andmanage dangerous, earthquake-prone and insanitarybuildings. It specifies our priorities and how the policyapplies to heritage buildings.Stormwater StrategyDevelopment of a Stormwater Strategy for <strong>Hutt</strong> <strong>City</strong>is underway, with a draft due for completion in June,to be finalised by September 2009.A high-level document, the strategy will identify the city’smain stormwater issues, assess and prioritise them andshow how we <strong>plan</strong> to address them where necessarythrough the Stormwater Asset Management Plan andother programmes described in this Community Plan.Promoting cultural wellbeingActive Recreation and SportStrategy 2007-2012This strategy focuses on how we’ll help <strong>Hutt</strong> <strong>City</strong>residents to meet their active recreation and sportneeds between 2007 and 2012. It takes into accountthat, while we’re not the only provider of recreationand sport opportunities for the city, our historic roleas a key provider of open space and facilities meanswe have a significant influence.Arts and Culture PolicyWe’re proud to take a lead role in supporting arts andculture, industry and business in <strong>Hutt</strong> <strong>City</strong> throughproviding TheNewDowse, the Petone Settlers Museum,libraries and other venues and programmes.This policy guides us in our work to:ÎÎstrengthen and promote our <strong>community</strong>’s identityby supporting the city’s artistic and cultural lifeÎÎwork in partnership with external agencies toexpand economic development.Community Halls PolicyThis 2007 policy requires that, whenever we review therole and purpose of a <strong>community</strong> hall, we establish:ÎÎthe extent to which it meets modern-day needsÎÎwhether it has management systems that areappropriate to meet the <strong>community</strong>’s needsÎÎthat its day-to-day running will work to providethe facilities the <strong>community</strong> requires.Cycling StrategyAdopted in 2006, this strategy guides our involvement inproviding for cycling in the city – managing our currentresources and <strong>plan</strong>ning for the future.Encroachment and DisposalPolicy on ReservesThis policy covers all land we own or manage asreserves, including the procedures required whenpeople or organisations propose to use reserve landprivately through easement, right of way, lease, saleor any other legal mechanism.
hutt city <strong>community</strong> <strong>plan</strong> 27Events Strategy 2007- 2012This strategy guides our approach to supporting eventsthat offer cultural, social and economic benefits to thecity. We actively support and encourage events withinthe city, recognising that they can contribute topromoting our diversity, strengths and opportunities.Heritage PolicyThe Heritage Policy 2008 promotes all forms of heritagewith an emphasis on built heritage, and includesincentives (such as advice and funding) to identify,document and protect heritage buildings, places,bridges, wharves and other structures.Policy on Private Useof <strong>Hutt</strong> <strong>City</strong> <strong>Council</strong> LandThis policy aims to:ÎÎdescribe our position on the private use of landwe own and manageÎÎoutline the situations when we will consider suchprivate useÎÎoutline the steps required when an organisationor an individual wants to use <strong>Council</strong> land fortheir own use on a long-<strong>term</strong> basis.Reserve Lands Acquisition andDisposal PolicyThis policy covers how we address the acquisitionand disposal of reserve land. It’s linked to the 10-yearReserves Strategic Directions document (see below)and is due to be reviewed by 2012.Reserves PolicyAdopted in 2004, this policy reflects the Reserves Act1977 and reserve management <strong>plan</strong>s, and is a guidefor people and organisations applying for concessions.It covers the commercial use of reserve land underour authority and establishes the process for grantingconcessions.Reserves Strategic DirectionsThis document is a 10-year <strong>plan</strong> for our reserves andis due to be reviewed by 2012.Sportsground PolicyAdopted in 1993, this policy addresses the use of<strong>Hutt</strong> <strong>City</strong>’s sportsgrounds. It will be updated as partof the Sportsground Review taking place during 2009.Swimming Pool StrategyThis 2005 strategy details our involvement in swimmingrelatedrecreation, and links our recreation aims withday-to-day swimming pool operations.Walking StrategyThe Walking Strategy 2006 guides our involvement inproviding walking facilities in the city. It recognises thesignificant benefits of increased participation in walking.
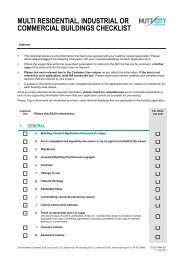
Making over High StThe upgrade of High Street has delivered a more pedestrian friendlyenvironment, with wider footpaths and new street furniture that allowsshoppers to take a breather.The new features were put to the test during the official opening on asunny November day.
Our Community Goals
30Our <strong>community</strong> goalsLooking ahead: our goals and prioritiesEvery six years, we consult widely with residents andspecial interest groups in our <strong>community</strong> on the goalswe’d like to achieve for the city’s wellbeing – in boththe medium and the long <strong>term</strong>. It’s an important andinvaluable exercise, as it helps us to <strong>plan</strong> and makedecisions on what we’ll do, on our own and withother organisations.Our first consultation exercise took place before weproduced our first 10-year <strong>plan</strong> in 2003. After that, webegan working with the eight other local authorities thatmake up the greater Wellington region, and with otherregional organisations, on a 50-year growth strategyfor the region.The resulting ‘Wellington Regional Strategy’ identifiednine ‘Wellington regional outcomes’ – and in 2005 wedecided to align our own goals with those outcomes,in a united effort for the good of the region as a whole.After extensive research and consultation with residents,businesses and other organisations, we came up withan updated set of goals (or ‘<strong>community</strong> outcomes’) for<strong>Hutt</strong> <strong>City</strong>, which were adopted in 2006 and will bereviewed no later than 2012.The next few pages describe:ÎÎour vision of making <strong>Hutt</strong> <strong>City</strong> a great placeto live, work and playÎÎthe Wellington regional outcomes to which ourwork is alignedÎÎour own <strong>community</strong> outcomes to achieve ourvision, and which complement the Wellingtonregional outcomesÎÎthe <strong>community</strong> partners that are involved inachieving the outcomes (you can read moreabout them in ‘Our <strong>community</strong>’ from page 140)ÎÎthe strategies, policies and <strong>plan</strong>s that apply toachieving the outcomes (these have beencovered in detail in ‘The foundations of our work’from page 18)ÎÎdetails of our own contribution to achieving theoutcomes (our many and varied roles includeadvocate, funder, service provider, regulator,facilitator and monitor)ÎÎthe key <strong>Hutt</strong> <strong>City</strong> <strong>Council</strong> activities involved inachieving the outcomes (you can read moreabout these from page 60)ÎÎmeasures we will use to assess our performanceÎÎthe indicators that will show whether we are workingtowards achieving the <strong>community</strong> outcomes (anumber of other indicators could also be chosenfor use in our integrated monitoring programme).
hutt city <strong>community</strong> <strong>plan</strong> 31Our visionWe have some exciting <strong>plan</strong>s – and they’re all aboutmaking <strong>Hutt</strong> <strong>City</strong> a great place to live, work and play.That’s our vision for the future. It’s the backbone toeverything we do, including all the activities in this10-year <strong>plan</strong>.We’ve already begun work to achieve this goal, throughcreating ‘visions’ for Petone and the Lower <strong>Hutt</strong> CBD.These visions are what the communities there see asessential for their future. And it’s just the beginning:Seaview/Gracefield’s vision will be finalised this year,and we’ll soon be extending the exercise to the restof the city.A vision for the futureThe Petone <strong>community</strong>’s vision is:ÎÎgrowth that is economically and environmentally sustainableÎÎdistinguishing Petone as a unique heritage place – re-establishing and celebrating IwiÎÎdeveloping an attractive and vibrant village culture at Petone’s heartÎÎretaining a strong sense of <strong>community</strong> and recognition of Petone as a real place for our peopleThe Lower <strong>Hutt</strong> CBD <strong>community</strong>’s vision is:ÎÎoffering an exceptional quality of lifeÎÎcreative, vibrant and cultural heartÎÎsustainable every day and in every wayÎÎcompact with choicesÎÎbalanced approach to prosperity and growthfor total wellbeingÎÎquality accessible environment<strong>Council</strong> is developing appropriate provisions in the District Plan directly related to the issues raised throughthese visioning exercises.In addition, to achieve the vision identified in Vision CBD 2030, <strong>Council</strong> is working on a high level design andimplementation project called CBD Making Places. CBD Making Places looks at the central business district tosee what is working, what could be done better, and what things we could be doing with reference to our vision.For example Vision CBD 2030 identified the <strong>Hutt</strong> River as a priority issue to consider in the future of the CBD.Therefore CBD Making Places will suggest projects that connect the CBD with the river to benefit publicaccessibility, leisure, business, sustainability, environment, cultural aspirations, and identity for Lower <strong>Hutt</strong>.Besides the river, Vision CBD 2030 has identified a number of other priorities which <strong>Council</strong> will be working onwith the <strong>community</strong> to design and promote projects that can be built over time in and around the CBD, eitherby <strong>Council</strong>, in partnerships, or by private developers. CBD Making Places is about building a better CBD thatover time matches with our long <strong>term</strong> vision.
32COMMUNITY OUTCOMES TO ACHIEVE OUR VISIONWellington regional outcome 1Community prosperity – To enjoy and prosper from a strong and growing economy that continues to attract and retain a highly skilled, productive population base andbusiness sector.<strong>Hutt</strong> <strong>City</strong> outcomesA local economy that is attractive to both businesses and residents.Retention of business achievers and people critical for business.Attraction and nurturing of high quality businesses.Local businesses being supported and promoted.A skilled workforce that meets local businesses’ needs.Our <strong>community</strong> partnersGrow Wellington, WelTec, Business <strong>Hutt</strong> Valley, New Zealand Trade and Enterprise, Work and Income, CBD+,Jackson Street Programme, <strong>Hutt</strong> Valley District Health BoardSee page 140 for information about how we work with our <strong>community</strong> partnersApplicable strategies, policies & <strong>plan</strong>sEconomic Development Strategy, Visitor Strategy, Events Strategy, Vision CBD 2030, CBD Making Places, SuburbanShopping Centres Fund Policy, Wingate Development Plan, Petone Vision Statement, Rates Remission Policy, District PlanOur contribution to achieving the outcomes The <strong>Council</strong> activities involved Measures used to assess our performanceWe manage the city’s roading network andmaintain and improve footpaths, road pavements/reconstructions, traffic signals, signs, street lighting,parking services, bridges and road safety activities,all of which contribute to the local economy’sdevelopment.Roading and TrafficEconomic DevelopmentResident satisfaction with identified services, the condition of the roadsurfaces, the roughness of the roads, accident trendsBusiness satisfaction with economic development programmes, residentsatisfaction with visitor information services and special events, the city’seconomic performance
hutt city <strong>community</strong> <strong>plan</strong> 33Our contribution to achieving the outcomes The <strong>Council</strong> activities involved Measures used to assess our performanceBy supporting the business sector, pursuingopportunities that benefit the city and promoting thecity, we build recognition of <strong>Hutt</strong> <strong>City</strong> as a businesslocation and vibrant place to live and work, benefitingbusinesses and residents alike.We aim to develop an urban environment that willenhance the city’s image, attracting people, businessand investment.Our recreational programmes and events help toreinforce the image of an attractive and vibrant cityfor people and businesses considering moving here.Basing our vision and strategy documents on<strong>community</strong> engagement helps to ensure ourdevelopments meet our <strong>community</strong>’s needs inthe long <strong>term</strong>.Local Urban EnvironmentAquatics and RecreationWater SupplyWastewaterStormwaterElected MembersAdvice and SupportResident and business pride in the way the city looks and feels, residentsatisfactionUser satisfaction with recreation programmes and events, use of recreationprogrammes and eventsResident satisfaction, compliance with NZ Drinking Water Standards, qualityof water, reliability of water supply, response to water supply disruptionsResident satisfaction, absence of resource consent-related infringementnotices, reliability of wastewater service, response to wastewater disruptionsResident satisfaction, reliability of stormwater service, water quality at mainrecreational beaches, response to stormwater disruptionsResident satisfactionSatisfaction with advice and responses to requests for helpGeneral indicatorsWe aim to measure the quantity and quality of economic changes each year and compare the skills of our workforcewith our economic capability to provide them with work.This Community Plan is the co-ordinating document for a number of strategies, of which many have economic or<strong>community</strong>-economic goals that require significant <strong>Council</strong> resources. It’s important that we use these resourceswisely and effectively, so we’ll be monitoring the effectiveness of our methods and the reactions they cause.In order to understand the state of the economy, we measure different aspects of it, its relative expansion orcontraction compared with those of our regional partners, and its performance.
34Specific indicators include:ÎÎthe ratio of registered employed to the total working-age population in <strong>Hutt</strong> <strong>City</strong>ÎÎthe number of businesses in <strong>Hutt</strong> <strong>City</strong>ÎÎthe number of Full Time Equivalent workers (FTEs)ÎÎthe number of businesses and FTEs in high-value sectorsÎÎthe number of unemployedÎÎany difficulties filling skilled vacanciesÎÎincreases in retail spend in <strong>Hutt</strong> <strong>City</strong>ÎÎGross Domestic Product (GDP) and GDP per capitaÎÎexports as a proportion of GDPÎÎ<strong>Hutt</strong> <strong>City</strong> GDP as a proportion of the region’sÎÎrecognition by businesses of <strong>Hutt</strong> <strong>City</strong> as a place to do businessÎÎawareness of <strong>Hutt</strong> <strong>City</strong> as a tourism destinationÎÎthe economic benefits of events to <strong>Hutt</strong> <strong>City</strong>ÎÎbusinesses involved in <strong>Council</strong> consultationsÎÎthe growth in value of commercial building consentsÎÎthe percentage of the population with higher qualificationsÎÎhousehold incomeÎÎper capita incomeÎÎthe AC Neilson national perceptions surveyÎÎthe area profile building improvement indexÎÎinvestments in strategic transport assets.
hutt city <strong>community</strong> <strong>plan</strong> 35Wellington regional outcome 2Connected – The region will be connected locally and globally by offering world-class accessibility and linkages. That includes high-capacity communication networks,top-quality air and sea ports, well functioning highways and local links and excellent public transport services.<strong>Hutt</strong> <strong>City</strong> outcomesEffective and efficient public transport that results in increased use of public transport.Enhanced roading systems, particularly State Highway 2, Cross Valley Link, State Highway 1 and the <strong>Hutt</strong> CBD.Continual upgrade and provision for growth to make <strong>Hutt</strong> <strong>City</strong> interesting and attractive.More investment in sustainable transportation solutions – public transport, car pools, bicycle lanes.Good telecommunications systems.Our <strong>community</strong> partnersGreater Wellington Regional <strong>Council</strong>, NZ Transport Agency, private sector contractors, Wellington <strong>City</strong> <strong>Council</strong>,Upper <strong>Hutt</strong> <strong>City</strong> <strong>Council</strong>, Porirua <strong>City</strong> <strong>Council</strong>, <strong>Hutt</strong> Mana Charitable Trust, Smartlinx3, Centreport Wellington,Wellington International AirportSee page 140 for information about how we work with our <strong>community</strong> partnersApplicable strategies, policies & <strong>plan</strong>sAsset Management Plans, Corporate Asset Management Policy, Cycling Strategy, Walking Strategy, EconomicDevelopment Strategy, Environmental Sustainability StrategyOur contribution to achieving the outcomes The <strong>Council</strong> activities involved Measures used to assess our performanceWe work closely with Greater Wellington Regional<strong>Council</strong> and the NZ Transport Agency to advocateon behalf of the city on public transport androading issues.Our Cycling and Walking Strategies help us tomanage our current resources and provide for thefuture through a prioritised implementation <strong>plan</strong>and annual funding.Roading and TrafficLocal Urban EnvironmentEconomic DevelopmentResident satisfaction with identified services, the condition of the roadsurfaces, the roughness of the roads, accident trendsResident and business pride in the way the city looks and feels, residentsatisfaction, use of the recycling service, access to recycling facilities,tonnes of recycling per annumBusiness satisfaction with economic development programmes, residentsatisfaction with visitor information services and special events, the city’seconomic performance
36Our contribution to achieving the outcomes The <strong>Council</strong> activities involved Measures used to assess our performanceWe aim to develop an urban environment that willenhance the city’s image, attracting people,business and investment.Our Environmental Sustainability Strategy guidesour contribution to improving the sustainabilityof the natural physical environment and the useof natural resources.Along with members of the local <strong>community</strong>,Upper <strong>Hutt</strong> <strong>City</strong> <strong>Council</strong>, Porirua <strong>City</strong> <strong>Council</strong> and<strong>Hutt</strong> Mana Charitable Trust, we support Smartlinx3in its work to establish a fast, open-accessbroadband network in the area.Advice and SupportSatisfaction with advice and responses to requests for helpGeneral indicatorsWe aim to measure and communicate an understanding to the public and policy-makers of the state and potentialof <strong>Hutt</strong> <strong>City</strong>’s internal, regional and international links.We have a number of initiatives to improve <strong>Hutt</strong> <strong>City</strong>’s ‘connectedness’, ranging from providing roads to advocatingfor an improved communications infrastructure. They often involve considerable ratepayers’ resources, so we needto monitor our <strong>plan</strong>s and methods to ensure we get a good return on our investment.As the way we connect to the world changes, so too does the infrastructure we use to make those connections.We must make sure that the infrastructure we need to connect continues to change and adapt to new technologies.As it does, we need to know the state of this infrastructure – so we know where to focus our resources and employways to encourage it.Specific indicators include:ÎÎpublic transport useÎÎconstruction of cycleways – physical worksÎÎincluding key regional transport issues in the Regional Land Transport StrategyÎÎinvestment in strategic transport assetsÎÎkilometres of open access fibre laid in <strong>Hutt</strong> <strong>City</strong>.
hutt city <strong>community</strong> <strong>plan</strong> 37Wellington regional outcome 3Entrepreneurial and innovative culture – We will be recognised as a place of new ideas. Innovation and creativity underpin the development of new fields of endeavour andbusiness, and drive strong, sustainable economic growth. We will capitalise on being the seat of government and our excellent educational and research institutions will fostercross-fertilisation.<strong>Hutt</strong> <strong>City</strong> outcomesA growing number of entrepreneurial companies located in <strong>Hutt</strong> <strong>City</strong>.Creation of an exciting, dynamic city so entrepreneurs want to live and work here.Encouragement of enterprise and innovation including incentives to attract research, development and application industries.Make the most of the Crown Research Institutes by attracting the kind of people with the entrepreneurial nous to build on these Research and Development outcomes.Our <strong>community</strong> partnersGrow Wellington, WelTec, Business <strong>Hutt</strong> Valley, Industrial Research Ltd, GNS Science, central government agencies,CBD+, Jackson Street ProgrammeSee page 140 for information about how we work with our <strong>community</strong> partnersApplicable strategies, policies & <strong>plan</strong>sEconomic Development Strategy, Vision CBD 2030, CBD Making Places, Suburban Shopping Centres Fund Policy,Wingate Development Plan, Petone Vision Statement, Rates Remission PolicyOur contribution to achieving the outcomes The <strong>Council</strong> activities involved Measures used to assess our performanceBy supporting the business sector, pursuingopportunities that benefit the city and promoting thecity, we build recognition of <strong>Hutt</strong> <strong>City</strong> as a businesslocation and vibrant place to live and work, benefitingbusinesses and residents alike.Our recreational programmes and events help toreinforce the image of an attractive and vibrant cityfor people and businesses considering moving here.We aim to develop an urban environment that willenhance the city’s image, attracting people,business and investment.Economic DevelopmentLocal Urban EnvironmentAquatics and RecreationBusiness satisfaction with economic development programmes, residentsatisfaction with visitor information services and special events, the city’seconomic performanceResident and business pride in the way the city looks and feels, residentsatisfaction, use of the recycling service, access to recycling facilities,tonnes of recycling per annumUser satisfaction with recreation programmes and events, use of recreationprogrammes and events
38General indicatorsWe aim to measure and quantify the contribution of creativity to <strong>Hutt</strong> <strong>City</strong>’s economy.We can’t provide an entrepreneurial and innovative culture in <strong>Hutt</strong> <strong>City</strong> the way we’d provide a road or a park. Instead,we must encourage, observe and at times lead by example, or reduce the risks for those able to act. We’ll judge our<strong>plan</strong>s effective if they give certainty to innovators and those engaging in new, creative activities in our city.As our national economy changes, so does the state of <strong>Hutt</strong> <strong>City</strong>’s. We need to stay up to date on these changesto ensure that people are aware of the opportunities available. By taking the ‘economic pulse’ every now and again,we can look at how our economy is progressing in comparison with those of our neighbours, our country and othersimilar cities in the world. Using this information, we can de<strong>term</strong>ine our strengths (for championing) and ourweaknesses (for addressing).Specific indicators include:ÎÎgrowth in the number of <strong>Hutt</strong> <strong>City</strong> businesses in innovative sectorsÎÎgrowth in the number of Full Time Equivalent workers (FTEs) in innovative businessesÎÎbusinesses and FTEs in high-value sectorsÎÎthe percentage of the workforce with higher qualificationsÎÎthe difficulties of filling skilled vacanciesÎÎthe value of successful research and development grant applicationsÎÎthe number of tertiary students studying in <strong>Hutt</strong> <strong>City</strong>ÎÎthe AC Neilson national perceptions surveyÎÎthe area profile building improvement index.
hutt city <strong>community</strong> <strong>plan</strong> 39Wellington regional outcome 4Healthy environment – The region will offer a beautiful, ecologically sustainable natural environment. That environment will offer numerous opportunities for recreation andhealthy living.<strong>Hutt</strong> <strong>City</strong> outcomesHaving clean air, water and land.Continued protection and conservation of our natural environment.Efficient use and conservation of energy resources.Our <strong>community</strong> partnersGreater Wellington Regional <strong>Council</strong>, Wellington Water Management Ltd, environmental groups, residents’ groups,Business Care, Maori, Department of ConservationSee page 140 for information about how we work with our <strong>community</strong> partnersApplicable strategies, policies & <strong>plan</strong>sDistrict Plan, Waste Management Plan, Environmental Sustainability StrategyOur contribution to achieving the outcomes The <strong>Council</strong> activities involved Measures used to assess our performanceWe develop, implement, monitor and reviewthe District Plan, relevant bylaws and otherenvironmental policies and <strong>plan</strong>s for the city’ssustainable development.Environmental ManagementResident satisfaction, Land Information Memoranda (LIMs) processedto statutory requirements, building consent/project information and resourceconsents processed to statutory and District Plan requirements, responseto requests for service, monitoring of resource consents, timely registrationand licensing of premises, Code of Compliance certificates issued to statutoryrequirements, response to dog complaints, response to noise complaints
40Our contribution to achieving the outcomes The <strong>Council</strong> activities involved Measures used to assess our performanceBy supplying high-quality, affordable water wecontribute to the <strong>community</strong>’s health, fire-fightingcapability and industrial and residential development.Wastewater collection, treatment and disposalsupports development in the city and protects thephysical environment and the <strong>community</strong>’s health.Effective stormwater control is necessary to protectthe health and safety of the <strong>community</strong> and tominimise property damage. Solid waste managementis necessary for the health and quality of life of the<strong>community</strong>, the local economy and the environment.We monitor resource and building consents toensure compliance.We undertake pollution and noise control and monitorhazardous substances, trade waste activities andbeaches to promote and protect public healthand safety.Our waste-minimisation programme promotes theconcept of ‘reduce, reuse, recycle’.Our Environmental Sustainability Strategy guidesour contribution to improving the sustainability ofthe natural physical environment and the use ofnatural resources.Parks and ReservesWater SupplyWastewaterStormwaterSolid WasteLocal Urban EnvironmentAdvice and SupportResident satisfaction with identified services, sports field standards,area of parks and reserves, household use of parks and reserves,standard of maintenance and development of facilitiesResident satisfaction, compliance with NZ Drinking Water Standards,quality of water, reliability of water supply, response to water supplydisruptions, average un-metered water consumptionResident satisfaction, absence of resource consent-related infringementnotices, reliability of wastewater service, response to wastewater disruptionsResident satisfaction, reliability of stormwater service, water quality at mainrecreational beaches, response to stormwater disruptionsResident satisfaction, absence of resource consent-related infringementnoticesResident and business pride in the way the city looks and feels, residentsatisfaction, use of the recycling service, access to recycling facilities,tonnes of recycling per annumSatisfaction with advice and responses to requests for help
hutt city <strong>community</strong> <strong>plan</strong> 41General indicatorsWe aim to measure and communicate our citizens’ ability to use and enjoy our natural environment to the generalpublic and policy-makers.We know that the provision and use of our physical infrastructure often come at an environmental cost – a cost thathas led to a wide range of design features aimed at reducing the effect of these works on the environment. It’simportant that we de<strong>term</strong>ine the true effectiveness of these design features in the <strong>Hutt</strong> <strong>City</strong> environment.By using environmental indicators, we have a base from which to compare the natural health of our city’s biologicalsystems with similar systems in other cities with similar environmental considerations. These monitoring criteria canalso be useful when comparing the relative position of the city from one year, two years or three years ago – effectivelyfinding out whether <strong>Hutt</strong> <strong>City</strong>’s environmental quality is improving or degrading.The intensity and density of development can also affect the surrounding environment. In turn, the state and healthof the environment affect the health of citizens, their quality of life and their ability to live, work and play. By monitoringthe state of the environment, we can get clues about why we’re experiencing some issues, and the factors we needto alter to address them.Specific indicators include:3ÎÎthe air quality (24-hour average PM10 concentration) – measured against a national guideline of 50ug/mÎÎthe <strong>Hutt</strong> River water quality (the Macroinvertebrate Community Index (MCI) and Water Quality Index (WQI))ÎÎthe Wainuiomata River water qualityÎÎresidential water consumption per capitaÎΑSoil Quality – Hazardous Waste Collection’, a measure of the amount of hazardous waste removed permanentlyfrom soil and the potentially harmful effects of spillageÎÎwaste to landfill per dollar of Gross Domestic Product (GDP)ÎÎcarbon dioxide emissions per dollar of GDPÎÎthe volume of recycling per capitaÎÎgreen waste diverted from landfillÎÎother waste diverted from landfillÎÎthe proportion of newly registered light vehicles in <strong>Hutt</strong> <strong>City</strong> with a fuel economy of six litres per 100 kilometresor betterÎÎfuel use per capita per annum
42Specific indicators include (contd):ÎÎthe proportion of driver vehicle trips made to workÎÎkilometres travelled by car on <strong>Council</strong> businessÎÎthe proportion of <strong>Council</strong> staff travelling to/from work in sole-occupancy carsÎÎpublic transport patronageÎÎthe kilometres of cyclewayÎÎthe number of consents for solar hot water heatingÎÎthe number of consents for small-scale local electricity production per annumÎÎthe proportion of <strong>Hutt</strong> <strong>City</strong> housing with floor and ceiling insulationÎÎthe proportion of <strong>Hutt</strong> <strong>City</strong> housing with efficient heating (heat pumps, natural gas and pellet fires)ÎÎthe <strong>Council</strong>’s energy consumption (electricity and gas)ÎÎ<strong>Council</strong>-owned and -administered land biomassÎÎthe urban (built-up area) biomassÎÎthe district biomassÎÎthe proportion of native forest to total biomass (district wide)ÎÎthe number of Environmental Sustainability Strategy actions completedÎÎour environmental accreditation to ISO 14001.
hutt city <strong>community</strong> <strong>plan</strong> 43Wellington regional outcome 5Lifestyle – The region will have an exceptional quality of life, where living is easy, safe and fun, and there is a wide range of affordable, healthy lifestyle options underpinninga strong <strong>community</strong> spirit. We will be celebrated for our arts, sports and entertainment scene.<strong>Hutt</strong> <strong>City</strong> outcomesA city that is safe.Affordable access to <strong>community</strong> facilities that include arts, cultural and recreational options.A diverse natural environment that is accessible, enjoyable and safe.Encouragement of arts, cultural and sports activities including local, national and international events.Attraction of tourists to <strong>Hutt</strong> <strong>City</strong>.Our <strong>community</strong> partnersPolice, Accident Compensation Corporation, <strong>Hutt</strong> Valley Health, Maori , Greater Wellington Regional <strong>Council</strong>,Department of Conservation, Upper <strong>Hutt</strong> <strong>City</strong> <strong>Council</strong>, tourism providersSee page 140 for information about how we work with our <strong>community</strong> partnersApplicable strategies, policies & <strong>plan</strong>sSafer <strong>City</strong> Strategy, Earthquake Prone, Dangerous and Insanitary Buildings Policy, Active Recreation and SportStrategy, Swimming Pool Strategy, Sportsground Policy, Arts and Culture Policy, Heritage Policy, Community HallsPolicy, Reserve Management Plans, Reserves Strategic Directions, Reserve Lands Acquisition and Disposal Policy,Environmental Sustainability Strategy, Events Strategy, Visitor Strategy, District PlanOur contribution to achieving the outcomes The <strong>Council</strong> activities involved Measures used to assess our performanceWe have initiated a whole-of-<strong>community</strong> approach toinjury prevention and safety promotion initiatives thatwill lead to the development of a Safer <strong>City</strong> Strategy.Our maintenance of the roading network andassociated footpaths, signage, lighting etccontributes to residents’ health and safety.Community SupportRoading and TrafficLibrariesCommunity satisfaction with support programmes, <strong>community</strong> organisationsatisfaction, residents’ perceptionsResident satisfaction with identified services, the condition of the roadsurfaces, the roughness of the roads, accident trendsUse of library services by residents, resident satisfaction, number of libraryvisits per year in person and via the internet, library stock turnover
44Our contribution to achieving the outcomes The <strong>Council</strong> activities involved Measures used to assess our performanceWe analyse road accident data to assist with thedevelopment of targeted <strong>community</strong> road safetyinitiatives and traffic safety improvements on theroad network, with the objective of improving safetyfor all road users.We provide a range of <strong>community</strong> facilities andactivities that are accessible to the <strong>community</strong>and positively affect people’s lives.We develop, implement, monitor and reviewthe District Plan, relevant bylaws and otherenvironmental policies and <strong>plan</strong>s for the city’ssustainable development.We monitor resource and building consentsto ensure compliance.We undertake pollution and noise control andmonitor hazardous substances, trade wasteactivities and beaches to promote and protectpublic health and safety.Our Environmental Sustainability Strategy guidesour contribution to improving the sustainability ofthe natural physical environment and the use ofnatural resources.We provide and maintain active and passiverecreational facilities and reserves for publicenjoyment and wellbeing, with a focus on retainingareas in their natural state where possible.MuseumsAquatics and RecreationParks and ReservesPropertyEnvironmental ManagementEconomic DevelopmentAdvice and SupportNumber of visits per year, resident satisfaction, education programmesdelivered to meet needs and expectations of school groupsResident satisfaction, use of pools, accreditation of holiday programmes,accreditation for swimming pool operation, cost per visit to pools, usersatisfaction with recreation programmes and events, use of recreationprogrammes and eventsResident satisfaction with identified services, sports field standards, area ofparks and reserves, household use of parks and reserves, standard ofmaintenance and development of facilitiesTenant satisfaction with <strong>Council</strong> accommodation, resident satisfactionResident satisfaction, compliance with statutory requirements, response torequests for service, monitoring of resource consents, response to dogcomplaints, response to noise complaintsBusiness satisfaction with economic development programmes, residentsatisfaction with visitor information services and special events, the city’seconomic performanceSatisfaction with advice and responses to requests for help
hutt city <strong>community</strong> <strong>plan</strong> 45Our contribution to achieving the outcomes The <strong>Council</strong> activities involved Measures used to assess our performanceBy promoting the city, we build recognition of it as abusiness location and vibrant place to live and work,and our recreational programmes and events help toreinforce the image of an attractive and vibrant city.Our promotion of the city, including events, issuccessful in attracting locals and their visitingfriends and relatives, and is being extended tocover cruise ship and coach tour operators withthe aim of attracting more tourists to the city.General indicatorsWe aim to measure <strong>Hutt</strong> <strong>City</strong> citizens’ quality of life and their ability to access and enjoy lifestyle opportunities.While we have an important role in protecting the natural environment of our city, we need the active engagementof our citizens if we’re to enhance and maintain it. As most of our citizens engage in our environment through theirlifestyle choices, we need to measure our effectiveness in getting people to engage with one another in thesepursuits, and in providing and maintaining the facilities required for these activities.In measuring this outcome there are two factors that can change substantially:ÎÎthe composition/size of the population and the recreational activities they enjoyÎÎthe environment in which they are enjoying these activities.If we are to respond effectively to the needs and desires of our citizens, we need a clear picture of both aspects.
46Specific indicators include:ÎÎthe percentage of residents who use poolsÎÎthe percentage of residents who use librariesÎÎthe percentage of residents who use sportsgroundsÎÎthe annual number of museum visitsÎÎthe percentage of residents who are satisfied with the city’s parks, reserves and gardensÎÎthe percentage of residents who feel safe in the city in generalÎÎthe percentage of residents who feel safe in the central cityÎÎthe number of crimes recorded in <strong>Hutt</strong> <strong>City</strong>ÎÎthe total number of crimes recorded in <strong>Hutt</strong> <strong>City</strong> in the areas of violence, sexual offences, drugs and antisocialbehaviour, dishonesty, property damage, property abuses, administrativeÎÎthe total number of ACC claims in <strong>Hutt</strong> <strong>City</strong> – the entitlement claim rate per 100,000 populationÎÎthe alcohol consumed – the Last Drinks SurveyÎÎNZ Transport Agency accident statistics.
hutt city <strong>community</strong> <strong>plan</strong> 47Wellington regional outcome 6Regional foundations – People and businesses will have high-quality, secure essential services for their everyday living. They will be retained and developed in a manner that isconsistent with the sustainable growth of the region.<strong>Hutt</strong> <strong>City</strong> outcomesEveryone has a quality standard of affordable housing.Roading, water and waste (including recycling) services are accessible to all.Maintenance and continual upgrade of services to allow for security and growth.Good information on how to be prepared for an emergency.Our <strong>community</strong> partnersUrbanPlus, Wellington Water Management Ltd, Housing New Zealand, <strong>Hutt</strong> Mana Charitable Trust, Greater WellingtonRegional <strong>Council</strong>, private sector contractors, Upper <strong>Hutt</strong> <strong>City</strong> <strong>Council</strong>, Ministry of Health, NZ Transport AgencySee page 140 for information about how we work with our <strong>community</strong> partnersApplicable strategies, policies & <strong>plan</strong>sHousing Policy, Asset Management Plans, Corporate Asset Management Policy, Waste Management Plan,Environmental Sustainability StrategyOur contribution to achieving the outcomes The <strong>Council</strong> activities involved Measures used to assess our performanceUrbanPlus, a <strong>Council</strong>-controlled trading organisation,owns and manages our social housing, and ourHousing Policy explains our expectations for socialrental housing.We manage the city’s roading network and maintainand improve footpaths, road pavements/reconstructions, traffic signals, signs, street lighting,parking services, bridges and road safety activities.PropertyRoading and TrafficWater SupplyTenant satisfaction with <strong>Council</strong> accommodation, resident satisfaction,occupancy rate of rental housingResident satisfaction with identified services, the condition of the roadsurfaces, the roughness of the roads, accident trendsResident satisfaction, compliance with NZ Drinking Water Standards, qualityof water, reliability of water supply, response to water supply disruptions
48Our contribution to achieving the outcomes The <strong>Council</strong> activities involved Measures used to assess our performanceWe provide a sustainable and high-quality watersupply to the <strong>community</strong> for domestic andcommercial use, bought from Greater WellingtonRegional <strong>Council</strong> and distributed through our watersupply system.We provide a piping network that takes householdand commercial effluent to the Seaview WastewaterTreatment Plant for treatment to meet public healthand environmental standards.We provide a stormwater drainage system to managesurface water run-off from urban catchments.We manage collection contracts for the city’s refuseand recycling, and own and operate two landfills toprovide for the disposal of residual waste.We develop, implement and monitor city-wideemergency management <strong>plan</strong>s and promote<strong>community</strong> preparedness for emergencies.WastewaterStormwaterSolid WasteEnvironmental ManagementEmergency ManagementResident satisfaction, absence of resource consent-related infringementnotices, reliability of wastewater service, response to wastewater disruptionsResident satisfaction, reliability of stormwater service, water quality at mainrecreational beaches, response to stormwater disruptionsResident satisfaction, absence of resource consent-related infringementnoticesResident satisfaction, Land Information Memoranda (LIMs) processed tostatutory requirements, building consent/project information and resourceconsents processed to statutory and District Plan requirements, responseto requests for service, monitoring of resource consents, timely registrationand licensing of premises, Code of Compliance certificates issued tostatutory requirementsPreparedness for emergencies, response to emergencies, responseto rural fires
hutt city <strong>community</strong> <strong>plan</strong> 49General indicatorsWe’re looking for good information on the quality and state of regionally important civic concerns for better, moreintegrated decision-making at local, cross-territorial and regional levels.The effectiveness of our <strong>plan</strong> for ‘regional foundations’ can be measured through:ÎÎOur effectiveness in implementing regional policy, as contained in Greater Wellington Regional <strong>Council</strong>’s policystatements.ÎÎOur effectiveness in ensuring that <strong>Hutt</strong> <strong>City</strong> issues and situations are considered in these policy statements andin cross-boundary issues with our neighbouring <strong>council</strong>s.These indicators enable us to understand <strong>Hutt</strong> <strong>City</strong>’s place in the region – an understanding that’s important to maintainingour role as a hub within the Wellington region and protecting our citizens’ interests in regional decision-making.Specific indicators include:ÎÎmedian house prices in the city relative to median incomeÎÎwaiting list numbers for Housing New Zealand/<strong>Council</strong> accommodationÎÎthe median rental price of accommodation as a percentage of average incomeÎÎthe number of complaints to <strong>Council</strong> about poor standards of accommodationÎÎthe percentage of residents who think there is enough access to affordable and quality housing in <strong>Hutt</strong> <strong>City</strong>ÎÎthe percentage of residents who say they are prepared for an emergency and have enough water stored.
50Wellington regional outcome 7Sense of place – We will have a rich, diverse sense of place as a sophisticated region encompassing the intimate urban core, capital city status, magnificent harbours, rivers,centres of learning, extensive coastlines, its rolling hinterland and diverse centres and neighbourhoods, which are all treasured by its citizens.<strong>Hutt</strong> <strong>City</strong> outcomesA built environment that is attractive, safe and healthy.A more attractive <strong>Hutt</strong> <strong>City</strong>.Developing the uniqueness of <strong>Hutt</strong> <strong>City</strong> including its history and culture.More and better focus on the harbour, river and recreation opportunities.Our <strong>community</strong> partnersMaori, developers, Greater Wellington Regional <strong>Council</strong>, WelTec, Department of ConservationSee page 140 for information about how we work with our <strong>community</strong> partnersApplicable strategies, policies & <strong>plan</strong>sDistrict Plan, Development and Financial Contributions Policy, Active Recreation and Sport Strategy, Heritage Policy,Environmental Sustainability StrategyOur contribution to achieving the outcomes The <strong>Council</strong> activities involved Measures used to assess our performanceOur maintenance of the roading network andassociated footpaths, signage, lighting etccontributes to residents’ health and safety.We analyse road accident data to assist with thedevelopment of targeted <strong>community</strong> road safetyinitiatives and traffic safety improvements on theroad network, with the objective of improvingsafety for all road users.Roading and TrafficEmergency ManagementPropertyLocal Urban EnvironmentResident satisfaction with identified services, the condition of the roadsurfaces, the roughness of the roads, accident trendsPreparedness for emergencies, response to emergencies, response torural firesTenant satisfaction with <strong>Council</strong> accommodation, resident satisfaction,occupancy rate of rental housingResident and business pride in the way the city looks and feels, residentsatisfaction, use of the recycling service, access to recycling facilities,tonnes of recycling per annum
hutt city <strong>community</strong> <strong>plan</strong> 51Our contribution to achieving the outcomes The <strong>Council</strong> activities involved Measures used to assess our performanceWe aim to develop an urban environment that willenhance the city’s image, attracting people, businessand investment.Our preservation of <strong>Hutt</strong> <strong>City</strong>’s heritage contributes toour point of difference from other cities, enhancinglocal culture and how we identify ourselves.We implement environmental policies and <strong>plan</strong>s forthe city’s sustainable development.We provide a range of <strong>community</strong> facilities andactivities that are accessible to the <strong>community</strong> andpositively affect people’s lives.Environmental ManagementLibrariesMuseumsAquatics and RecreationParks and ReservesCommunity SupportResident satisfaction, Land Information Memoranda (LIMs) processed tostatutory requirements, building consent/project information and resourceconsents processed to statutory and District Plan requirements, responseto requests for service, monitoring of resource consents, timely registrationand licensing of premises, Code of Compliance certificates issued tostatutory requirements, dog pound opening hours, response to dogcomplaints, response to noise complaintsUse of library services by residents, resident satisfaction, number of libraryvisits per year in person and via the internet, library stock turnoverNumber of visits per year, resident satisfaction, education programmesdelivered to meet needs and expectations of school groupsResident satisfaction, use of pools, accreditation of holiday programmes,accreditation for swimming pool operation, cost per visit to pools, usersatisfaction with recreation programmes and events, use of recreationprogrammes and eventsResident satisfaction with identified services, sports field standards, area ofparks and reserves, household use of parks and reserves, standard ofmaintenance and development of facilitiesCommunity satisfaction with support programmes, <strong>community</strong> organisationsatisfaction, residents’ perceptionsGeneral indicators‘Urban design’ is the process of improving the experience and functionality of the city centre or its neighbourhoods.Urban design indicators are not usually included in formal monitoring strategies as they are complex to construct, involvemeasuring public and private development, and often don’t fall neatly into Community Plan or District Plan monitoring.
52Specific indicators include:ÎÎthe percentage of open spaces relative to built-up spacesÎÎthe percentage of residents who are satisfied with the city’s parks, reserves and gardensÎÎthe percentage of residents who think <strong>Hutt</strong> <strong>City</strong> is better, about the same or worse than it was three years agoÎÎthe city’s urban footprintÎÎthe coverage of impervious surfacesÎÎthe composite urban form indexÎÎthe proportion of dwellings within a five-minute walk of commercial centres or main arterialsÎÎNZ Transport Agency accident statistics.
hutt city <strong>community</strong> <strong>plan</strong> 53Wellington regional outcome 8Strong and tolerant communities – We will have inclusive, caring, friendly and participative communities that embrace newcomers, are open and welcoming to differentlifestyles and celebrate diversity. The relationship with tangata whenua and ethnic communities will be important to the vibrancy of the <strong>community</strong> tapestry.<strong>Hutt</strong> <strong>City</strong> outcomesA city that is friendly and welcoming where people experience a sense of belonging.Encouraging <strong>community</strong> involvement and engagement with civic life.More celebration of tangata whenua and multiculturalism in the city.Migrants are well adapted to New Zealand way of living.Our <strong>community</strong> partnersMaori, Te Puni Kokiri, Ministry of Social DevelopmentSee page 140 for information about how we work with our <strong>community</strong> partnersApplicable strategies, policies & <strong>plan</strong>sSettlement Support Strategic Plan, Youth Policy, Consultation Policy, Significance Policy, Arts and Culture PolicyOur contribution to achieving the outcomes The <strong>Council</strong> activities involved Measures used to assess our performanceBy providing parking spaces, we encourage ourresidents to participate in social, economic andcivic activities.We have a policy of understanding and identifyingour communities and their issues, ensuring that wecan respond appropriately.Together with our <strong>community</strong> boards and <strong>community</strong>committees, we encourage <strong>community</strong> involvementin decision-making and other <strong>Council</strong> processes.We support our communities through <strong>community</strong> grantsand funding for <strong>community</strong> activities and events.Roading and TrafficParks and ReservesCommunity SupportElected MembersAdvice and SupportResident satisfaction with identified services, the condition of the roadsurfaces, the roughness of the roads, accident trendsResident satisfaction with identified services, sports field standards,area of parks and reserves, household use of parks and reserves,standard of maintenance and development of facilitiesCommunity satisfaction with support programmes, <strong>community</strong> organisationsatisfaction, residents’ perceptionsResident satisfactionSatisfaction with advice and responses to requests for help
54General indicatorsWe’re looking for information on our city’s effectiveness in attracting, retaining and growing migrants and their communities.The lower North Island is generally experiencing a population loss and a decline in urban centre populations.The Wellington region is the exception to this, largely through the success of its constituent cities and our actionsin attracting migrants.Migration brings diversity, with affects the structure and feel of our city. This relationship between diversity and urbansystems means that if we are to understand how our migrants are adapting to life in <strong>Hutt</strong> <strong>City</strong> we need to see howthey are, or are not, changing its face and state.Specific indicators include:ÎÎthe percentage of residents who think the <strong>community</strong> works together and people support each otherÎÎthe percentage of residents who believe that increasing diversity in the city is a positive factor.
hutt city <strong>community</strong> <strong>plan</strong> 55Wellington regional outcome 9Healthy and educated <strong>community</strong> – Our physical and mental health is protected. Living and working environments are safe, and everyone has access to health care. Everyopportunity is taken to recognise and provide for good health. Lifelong learning and education opportunities are world class, contributing to an internationally competitiveworkforce and reinforcing the region as a desirable place to live.<strong>Hutt</strong> <strong>City</strong> outcomesEveryone has access to a wide range of excellent education services.Everyone has affordable access to services that improve health.There is a seamless integration of health services.Residents have a high standard of living.Our <strong>community</strong> partnersMinistry of Education, <strong>Hutt</strong> Valley Health, UrbanPlus, <strong>Hutt</strong> Mana Charitable Trust, schools, WelTec, Open PolytechnicSee page 140 for information about how we work with our <strong>community</strong> partnersApplicable strategies, policies & <strong>plan</strong>sSafer <strong>City</strong> Strategy, Housing Policy, Active Recreation and Sport Strategy, Sportsground Policy, Cycling Strategy,Walking StrategyOur contribution to achieving the outcomes The <strong>Council</strong> activities involved Measures used to assess our performanceWe provide a range of <strong>community</strong> facilities andactivities that are accessible to the <strong>community</strong> andpositively affect people’s lives.We have initiated a whole-of-<strong>community</strong> approach toinjury prevention and safety promotion initiatives thatwill lead to the development of a Safer <strong>City</strong> Strategy.UrbanPlus owns and manages our social housing,and our Housing Policy explains our expectationsfor social rental housing.LibrariesMuseumsAquatics and RecreationUse of library services by residents, resident satisfaction, number of libraryvisits per year in person and via the internet, library stock turnoverNumber of visits per year, resident satisfaction, education programmesdelivered to meet needs and expectations of school groupsResident satisfaction, use of pools, accreditation of holiday programmes,accreditation for swimming pool operation, cost per visit to pools, usersatisfaction with recreation programmes and events, use of recreationprogrammes and events
56Our contribution to achieving the outcomes The <strong>Council</strong> activities involved Measures used to assess our performanceParks and ReservesCommunity SupportPropertyAdvice and SupportResident satisfaction with identified services, sports field standards, areaof parks and reserves, household use of parks and reserves, standardof maintenance and development of facilitiesCommunity satisfaction with support programmes, <strong>community</strong> organisationsatisfaction, residents’ perceptionsTenant satisfaction with <strong>Council</strong> accommodation, resident satisfaction,occupancy rate of rental housingSatisfaction with advice and responses to requests for helpGeneral indicatorsWe’re looking for information on our citizens’ health and wellbeing in a simple and understandable form as the basisfor further co-operation with the <strong>Hutt</strong> Valley District Health Board.One of <strong>Hutt</strong> <strong>City</strong>’s defining qualities is our citizens’ ability to have a great quality of life. Our <strong>plan</strong>s and actions aim topromote this in everything we do, whether it’s building recreation centres or ensuring adequate provisions for sunlightin the District Plan.The state of health and education in our city is important to us. If we’re to be prompt and useful in addressing ourcitizens’ collective health and wellbeing, we need to know the city’s state of health. When we have that, we can moveto address issues quickly while they are small, or target larger issues more effectively.
hutt city <strong>community</strong> <strong>plan</strong> 57Specific indicatorsIndicators that we can measure include:ÎÎthe percentage of the population currently enrolled with <strong>Hutt</strong> <strong>City</strong> Primary Health Organisations (PHOs) and thecomparative rates of ethnic groups enrolledÎÎthe number of Full Time Equivalent General Practitioners in <strong>Hutt</strong> <strong>City</strong>ÎÎthe number of publicly funded beds available for the elderlyÎÎthe percentage of three- to five-year-olds enrolled in early childhood education (including kohanga reo andPacific Island language nests)ÎÎthe percentage of three- to five-year-olds enrolled in early childhood education compared with the national averageÎÎthe percentage of school leavers who leave school without qualificationsÎÎthe percentage of students with qualifications enrolling in tertiary institutions.Indicators that we’d like to measure include:ÎÎthe number of school health visits by school nurses each yearÎÎthe number of preventable (total/via primary care) hospital admissions per year (young, old, men, women, Maori,Pacific, Asian, European)ÎÎthe number of notifiable disease cases per year.The rest of this document talks about how we’re going to achieve <strong>Hutt</strong> <strong>City</strong>’s <strong>community</strong> outcomes:ÎΑHow we <strong>plan</strong> to achieve our goals’ describes what we do, why we do it and how it affects <strong>community</strong> wellbeing (page 60).ÎΑFinancing our work’ looks at the financial aspects of the major projects we have <strong>plan</strong>ned (page 100).ÎΑAchieving our <strong>community</strong> outcomes: measuring progress’ outlines how we’ll track progress towards the achievement of <strong>community</strong> outcomes (page 136).ÎΑOur <strong>community</strong>’ describes the <strong>council</strong> and our <strong>community</strong> partners (page 140).ÎΑLegislation affecting local government’ covers the laws according to which we work (page 158).
Getting goingThe Get Going programme promotes physical activities and social eventsthroughout the city to the over 50s. The physical activities range fromtai chi and walking to aerobics and petanque, while the popular <strong>Hutt</strong><strong>City</strong> Seniors bus trip programme transports participants to gardens,concerts, exhibitions and more.
How We Plan ToAchieve Our Goals
60How we <strong>plan</strong> to achieve our goalsIt’s all very well to decide on themedium- and long-<strong>term</strong> goals forour <strong>community</strong> (our ‘<strong>community</strong>outcomes’), but how do we makethem happen?That’s where it’s important to have a strong <strong>Council</strong>structure that develops, allocates, manages andmonitors the work. Working together and with othersin our <strong>community</strong>, we can make sure we know whatwe’re doing, why we’re doing it and the kinds ofservice we need to deliver.Five <strong>Council</strong> groups, 18 key activitiesTo help us to achieve the <strong>community</strong> outcomesidentified in the previous sections, we’ve dividedour organisation into five <strong>Council</strong> groups, andallocated 18 key activities among them:1. Group People is responsible for Libraries,Museums, Aquatics and Recreation, Parks andReserves, Community Support, and Property.2. Group Utility Services is responsible forRoading and Traffic, Water Supply, Wastewater,Stormwater, and Solid Waste.3. Group Environment is responsible forEnvironmental Management andEmergency Management.4. Group Economy is responsible for Local UrbanEnvironment and Economic Development.5. Group Organisation is responsible forElected Members, Advice and Support,and Managing Services.Key performance indicatorsFor each activity, we’ve also developed five ‘keyperformance indicators’ so we can track andassess our performance. They are:1. Budget management2. Customer satisfaction3. Staff perceptions4. Project completion5. Compliance with the law, contracts, consents,employment agreements, health and safetyrequirements and <strong>Council</strong> policy.
hutt city <strong>community</strong> <strong>plan</strong> 61So how are we doing so far?budget managementkeyBudget managementOur Financial Strategy (see page 20) establishesthe foundation for all our budgeting. With this keyperformance indicator, our results are comparedwith the budget.As you can see in the graph, we’ve deliveredoperating and capital surpluses compared withbudget every year since 1998. However, thesefavourable results are typically the result of timingdifferences on project completion.favourable variance $M1098765432101998 1999 2000 2001 2002 2003 2004 2005 2006 2007 2008operatingcapitalCustomer satisfactionWe monitor customer satisfaction levels with ourservices every year, through an independentlyconducted survey.customer satisfaction10090best practiceThis graph shows that we’ve achieved steadyresults that are above the average of our peers.Our budgets aim to:ÎÎmaintain satisfaction levels that are equalto the previous year’s resultspercentage8070peer averageÎÎmaintain an overall performance averagethat is at least our peers’ averageÎÎachieve results in the long <strong>term</strong> that areregarded as ‘best practice’.601995 1996 1997 1998 1999 2000 2001 2002 2003 2004 2005 2006 2007 2008
62Staff perceptionsStaff perceptionskeyWe measure staff perceptions using the John Robertson& Associates’ `Best Places to Work’ survey.The graph indicates that our staff perceive <strong>Hutt</strong> <strong>City</strong><strong>Council</strong> to be a better place to work than the averagelocal authority. Emphasis is placed on OrganisationDevelopment initiatives that support making <strong>Hutt</strong> <strong>City</strong>a great place to work. These initiatives includeimproving our leadership capability, a strong internalcommunications strategy, training and developmentopportunities that support our values and vision, andopportunities for flexible work wherever possible.percentage7169676563615957552005 2006 20072008hutt city <strong>council</strong>localgovernmentbenchmarkProject completionEvery year we commit to 200-300 projects throughour 10-year <strong>plan</strong>.Inevitably, some of these projects can’t be completedowing to a variety of reasons, so we usually carry theminto the next financial year and complete them then.For this reason we have a target of completing at least90% of projects scheduled for the financial year.project completion300target1009025080200150 50100500 01999 2000 2001 2002 2003 2004 2005 2006 2007 2008706040302010percentagekeynumber of <strong>plan</strong>nedprojects (lhs)percentagecompleted (rhs)
hutt city <strong>community</strong> <strong>plan</strong> 63ComplianceAs we’re a significant and complex business operatingin a wide variety of areas, it’s vital that our staff,contractors and other business associates comply withthe law, contracts, consents, employment agreements,health and safety requirements and <strong>Council</strong> policy.We monitor this compliance on a monthly basis, witha target of having no significant non-complianceinstances. We’ve achieved this every year since 2004,with the several minor breaches identified having beenremedied with no significant impact on our operations.Looking ahead – our targets andperformance measures for thenext 10 yearsOn the following pages, you’ll find descriptions of our18 activities, along with targets for their performanceand the ways in which we’ll measure progress.YearNon-compliance instancesInsignificantSignificant2004 9 –2005 6 –2006 1 –2007 3 –2008 1 –
64Group PeopleGroup People is responsiblefor managing the <strong>community</strong>’scultural, social and recreationalassets in the form of the librarynetwork, TheNewDowse and PetoneSettlers Museums including theircollections, swimming poolsand the network of parks andreserves to the agreed servicelevels described in our assetmanagement <strong>plan</strong>s.Activity 1: LibrariesWhat we doWe provide, maintain and manage eight libraries acrossthe city. Run as a single city-wide service, their primaryrole is to provide written and recorded material such asbooks, audiovisual resources and access to electronicinformation. We regard this as our core business.Why we do itPeople use library services for many purposes, includinglearning, research and entertainment. By providinglibraries, we enable all citizens to access information,knowledge and learning opportunities. The services andfacilities are a collective resource that is greater thanany individual or family could afford or accommodate.They support <strong>community</strong> learning, literacy and recreation.The Libraries Activity supports the city’s outcomesrelated to Lifestyle (page 43), Sense of Place (page 50)and Healthy and Educated Community (page 55).Effects on <strong>community</strong> wellbeingThe Libraries Activity promotes cultural wellbeing inparticular through our Arts and Culture Policy. Lookingat the potential for negative effects associated withthis activity, the libraries are places where peoplecongregate and are vulnerable to the risks associatedwith any public space.Projects <strong>plan</strong>ned to maintain currentservice levels over the next ten yearsÎÎannual funding of $700,000 to $900,000 to replacelibrary stockÎÎprogrammes to replace furniture, equipment andlibrary shelving.
hutt city <strong>community</strong> <strong>plan</strong> 65How we measure the service providedMeasure Achieved 2006/07 Achieved 2007/08 Target 2008/09 Target 2009/10to 2018/19Percentage of residents who have used library servicesduring the year (measured by independent survey)81% 78% 80% ≥ 80%Residents’ satisfaction with library services (measuredby independent survey)97%(peer average 98%)98%(peer average 97%)≥ 97% ≥ 97%Number of physical visits per year (measured bymanagement reports)1,124,969 1,042,825 1,200,000 1,200,000Number of visits via the Internet per year (measuredby management reports)683,320 83,647 online cataloguetransactions426,921 website visits700,000 120,000 online cataloguetransactions230,000 website visitsLibrary stock turnover (measured by New Zealand PublicLibrary Statistics) (Note: a number greater than or equalto the National Mean shows that our library stock turnoveris at least equal to or better than is achieved nationally)5.85(national mean 3.82)(average annualcirculation per item)5.69(national mean 4.3)(average annualcirculation per item)≥ National mean≥ National meanNote: Survey percentages exclude those who responded ‘Don’t Know’.
66Activity 2: MuseumsWhat we doWe operate two museums, which are open to the publicat no charge other than for special exhibitions:ÎÎTheNewDowse collects and displays fine art as wellas decorative and applied arts, and is a conduit for<strong>community</strong> engagement and participation in thecreative arts, underpinned by innovative exhibitions,education and associated <strong>community</strong> programmes.ÎÎThe Petone Settlers Museum specialises inshowcasing the social history of the early Maoriand European settlement of the lower <strong>Hutt</strong> Valleyand Petone area.We regard this as our core business.Why we do itBy providing museums we enable people to freelyaccess arts and cultural facilities which enrich, inspireand offer a range of lifelong learning opportunities.The museums act as a focal point for the <strong>community</strong>,enhance cultural life and diversity, and promote civicpride and <strong>community</strong> values. The Museums Activitysupports the city’s cultural outcomes related to Lifestyle(page 43), Sense of Place (page 50) and Healthy andEducated Community (page 55).Effects on <strong>community</strong> wellbeingThe Museums Activity promotes cultural wellbeing in ourcommunities by increasing opportunities for people toaccess the arts and cultural production, strengtheningpartnerships with tangata whenua, and celebratingdiversity – objectives identified in our Arts and CulturePolicy. Looking at the potential for negative effectsassociated with this activity, the museums are placeswhere people congregate and are vulnerable to therisks associated with any public space.Projects <strong>plan</strong>ned to maintain currentservice levels over the next ten yearsÎÎbuilding and <strong>plan</strong>t maintenance funding forTheNewDowseÎÎfunding for carpets, soft furnishings, collectiondevelopment, gallery lighting, office furnitureand equipment at TheNewDowseÎÎPetone Settlers Museum building and <strong>plan</strong>tmaintenance, exhibition furniture and fittingsÎÎa new permanent, highly experiential exhibition atthe Petone Settlers Museum focusing on the Maoriand European settlement of the Lower <strong>Hutt</strong> area.
hutt city <strong>community</strong> <strong>plan</strong> 67How we measure the service providedMeasureAchieved2006/07Achieved2007/08Target2008/09Target2009/10 to 2018/19Number of museum visits per year (measured bymanagement reports)107,799 271,801 120,000 (baseline andincreasing)200,000Residents’ satisfaction with TheNewDowse museum(measured by independent survey)91%(peer average 92%)93%(peer average 93%)≥ 91% ≥ 93%Residents’ satisfaction with Petone Settlers Museum(measured by independent survey)89%(peer average 92%)95%(peer average 93%)≥ 89% ≥ 93%Education programmes delivered that meet the needs andexpectations of school groups (measured by managementreports and participant evaluation forms)New measure for 2008/09 New measure for 2008/09 Education programmesdelivered to 11,000students90% satisfactionEducation programmesdelivered to 11,000students90% satisfactionNote: Survey percentages quoted exclude those who responded ‘Don’t Know’.
68Activity 3: Aquatics and RecreationWhat we doWe provide and maintain six swimming poolsin <strong>Hutt</strong> <strong>City</strong>, and provide quality and accessibletuition in essential water safety and life skills.Our recreational programmes are <strong>community</strong>based and designed to encourage residentsto engage in a range of recreational activities.We regard this as our core business.Why we do itPeople’s lives are positively affected by participation inrecreation, sports, fitness and cultural activities – andproviding these high-quality services at a low user costmakes them available to the whole <strong>community</strong>. Aquaticsand recreational programmes also make an importantcontribution to creating an attractive area for peopleand businesses considering moving to <strong>Hutt</strong> <strong>City</strong>. TheAquatics and Recreation Activity supports the city’soutcomes related to Community Prosperity (page 32),Lifestyle (page 43), Sense of Place (page 50) andHealthy and Educated Community (page 55).Effects on <strong>community</strong> wellbeingThe activity promotes cultural wellbeing in particularthrough our Active Recreation and Sport Strategy,Arts and Culture Policy, Events Strategy, SwimmingPool Strategy, Cycling Strategy and Walking Strategy.Looking at the potential for negative effects associatedwith this activity, the swimming pools are places wherepeople congregate and are vulnerable to the risksassociated with any public space. There is also a riskof drowning occurring. The recreational programmesoffered could potentially expose participants to therisk of injuring themselves. These risks are mitigatedthrough the presence of trained staff.Projects <strong>plan</strong>ned to maintain currentservice levels over the next ten yearsÎÎongoing swimming pool maintenance projectsÎÎWalter Nash Stadium repainting, maintenanceand upgrading projects.
hutt city <strong>community</strong> <strong>plan</strong> 69How we measure the service providedMeasureAchieved2006/07Achieved2007/08Target2008/09Target2009/10 to 2018/19Residents’ satisfaction with pools (measured byindependent survey)93%(peer average 88%)95%(peer average 88%)≥ 93% ≥ 93%Residents’ use of pools (measured by independent survey) 65%(peer average 61%)67%(peer average 61%)≥ 65% ≥ 65%Out of School Care and Recreation (OSCAR) accreditationof quality standards for holiday programmes (measuredby external audit)POOLSAFE accreditation for swimming pool operation,including quality standards for health and safety, waterquality, supervision, pool building and operation, signageand other standards (measured by external audit)Cost per visit to <strong>Council</strong> of aquatic services provided(measured by management reports)Accreditation maintained Accreditation maintained Accreditation maintained Accreditation maintainedAccreditation maintained Accreditation maintained Accreditation maintained Accreditation maintained$3.70 $3.84 $3.96 2009/10 $4.072010/11 $4.182011/12 $4.312018/19 $5.28User satisfaction with ‘Leisure Active’ programmes andevents (measured by independent survey)New measure for2009/10 onwardsNew measure for2009/10 onwardsNew measure for2009/10 onwards≥ 92%Residents’ use of ‘Leisure Active’ programmes andevents (measured by independent survey)New measure for2009/10 onwardsNew measure for2009/10 onwardsNew measure for2009/10 onwards≥ 30%Note: Survey percentages quoted exclude those who responded ‘Don’t Know’.
70Activity 4: Parks and ReservesWhat we doWe provide and maintain active and passiverecreational facilities in <strong>Hutt</strong> <strong>City</strong> for public enjoymentand wellbeing. With access largely free of charge,our recreation areas are both natural and developed.Most of our work is targeted at maintaining developedareas and retaining bush land in its natural state.‘Parks and Reserves’ also includes <strong>Council</strong> cemeteries.We regard these activities as our core business.Why we do itIn providing and maintaining parks, reserves and streetgardens, we help to create a pleasant environment inwhich people can live, work and play. Providing andmaintaining these areas at high quality and low usercost makes them available to the whole <strong>community</strong>.The Parks and Reserves Activity supports the city’soutcomes related to Lifestyle (page 43), Sense of Place(page 50), Strong and Tolerant Communities (page 53)and Healthy and Educated Community (page 55).Effects on <strong>community</strong> wellbeingThe Parks and Reserves Activity promotes culturalwellbeing in particular through our Active Recreationand Sport Strategy, Reserve Lands Acquisition andDisposal Policy, Reserves Policy, Reserves StrategicDirections, Sportsground Policy, Cycling Strategyand Walking Strategy. Looking at the potential fornegative effects associated with this activity, parks,reserves and sportsgrounds are places where peoplecongregate to play and this could result in noise,vandalism and injury. There could also be impacts onsecurity, privacy and traffic volumes for neighbouringproperties. Weed spraying of gardens could affectnearby residents. The cemeteries activity can causeenvironmental effects. Mitigation measures are inplace to address these possibilities.Projects <strong>plan</strong>ned to maintain currentservice levels over the next ten yearsÎÎannual sportsgrounds building maintenanceÎÎannual maintenance of parks hard surfaces,playgrounds, seats and bins, signage andinterpretation, street trees and tracksÎÎwharf survey and maintenance.
hutt city <strong>community</strong> <strong>plan</strong> 71How we measure the service providedMeasure Achieved 2006/07 Achieved 2007/08 Target 2008/09 Target 2009/10 to2018/19Residents’ satisfaction with:Peer averagePeer averageÎÎsportsgrounds98%94%98%94%≥ 95%≥ 95%ÎÎparks, reserves and gardensÎÎcemeteries98%95%97%91%98%93%97%91%≥ 95%≥ 90%≥ 95%≥ 90%(measured by independent survey)Sports fields meet the standard agreed with sports codes(measured by audits and complaints received)98% 98% ≥ 95% ≥ 95%Area of parks and reserves per 1000 of population 53 hectares 54 hectares ≥ 24.9 hectares ≥ 24.9 hectaresPercentage of households that have used or visitedparks, reserves or gardens in the previous 12 months(measured by independent survey)89% 87% ≥ 89% ≥ 89%Maintain a high standard of maintenance anddevelopment of playgrounds, parks, reserves,gardens and cemeteries (measured by audits)100% 100% 95% of contract andasset management <strong>plan</strong>requirements met95% of contract andasset management <strong>plan</strong>requirements metNote: Survey percentages quoted exclude those who responded ‘Don’t Know’.
72Activity 5: Community SupportWhat we doWe support our <strong>community</strong> through services such asfacilitation, advocacy and consultation and throughproviding grants to <strong>community</strong> organisations andgroups. These services are provided through ourCommunity Development and Youth Development teamsor private contracts. We’ve also increased our focus onworking with government agencies and using fundingfrom externally sourced contracts to provide servicesto our <strong>community</strong>. We regard this as our core business.Why we do itWe’ve always been committed to identifying andunderstanding our communities so that we can respondappropriately to issues affecting them. Our support helps<strong>community</strong> groups to achieve their goals where theycan’t do it themselves because of a lack of resources.The Community Support Activity supports the city’soutcomes related to Lifestyle (page 43), Sense of Place(page 50), Strong and Tolerant Communities (page 53)and Healthy and Educated Community (page 55).Effects on <strong>community</strong> wellbeingThe Community Support Activity promotes socialwellbeing in particular through our Ageing TogetherStrategy, Safer <strong>City</strong> Strategy, Settlement SupportStrategic Plan and Youth Policy, and cultural wellbeingthrough our Community Halls Policy. Looking at thepotential for negative effects associated with this activity,there are conflicting public perspectives about theextent of the role that <strong>council</strong>s should take in this area.Projects <strong>plan</strong>ned to maintain currentservice levels over the next ten yearsÎÎcontinuing to work with government agencies andaccess funding externallyÎÎcontinuation of the Community Grants schemes.
hutt city <strong>community</strong> <strong>plan</strong> 73How we measure the service providedMeasureAchieved2006/07Achieved2007/08Target2008/09Target2009/10 to 2018/19Community satisfaction with support programmesdelivered by Community and Youth Development teams(measured by independent survey)Community organisations’ satisfaction with the availabilityand quality of our support, advice and funding (measuredby survey of <strong>community</strong> organisations)New measure for 2009/10 New measure for 2009/10 New measure for 2009/10 ≥ 90%New measure for 2009/10 New measure for 2009/10 New measure for 2009/10 ≥ 90%Residents’ perceptions of <strong>Hutt</strong> <strong>City</strong> in <strong>term</strong>s of: New measure for 2009/10 New measure for 2009/10ÎÎtheir sense of <strong>community</strong> in their local neighbourhood60% ≥ 60%ÎÎtheir sense of safety at home, in their neighbourhood79% ≥ 79%and in the city centreÎÎtheir sense of the positive impacts of our59% ≥ 59%population’s diversity(measured by various surveys)(Source: Quality of Life2007 Survey of NewZealand’s 12 largest cities)Note: Survey percentages quoted exclude those who responded ‘Don’t Know’.
74Activity 6: PropertyWhat we doWe manage a variety of properties for our <strong>community</strong>’suse – mainly <strong>community</strong> and civic halls and venues,public toilets, <strong>community</strong> houses and the <strong>Council</strong>Administration Building. We review these facilitiesregularly for their efficiency and ability to meetchanging public requirements.We also have a 100% shareholding in Urban PlusLimited (trading as UrbanPlus), a <strong>Council</strong>-controlledtrading organisation that owns and manages housingunits on our behalf – mainly for the elderly andsocially disadvantaged.UrbanPlus aims to increase the number of rentalproperties available to residents, and is also involvedin developing and selling land within the city, both onits own account and on our behalf, to meet the city’sgrowing and changing needs.We regard these activities as our core business.Why we do itWe provide <strong>community</strong> and civic halls and venuesbecause they offer an environment for a diverse rangeof social, cultural and <strong>community</strong>-based activities,including clubs, indoor sports, band practices, arts andtheatre. We provide public toilets to safeguard publichealth – and ensure they are physically accessible,appropriately located, designed and built, and cleanedand maintained to appropriate standards.Regular assessments of the property we own andoccupy can result in property upgrades and salesof surplus assets.The Property Activity supports the city’s outcomesrelated to Lifestyle (page 43), Sense of Place (page 50)and Healthy and Educated Community (page 55).Effects on <strong>community</strong> wellbeingThe Property Activity promotes social wellbeing inparticular through our Housing Policy and culturalwellbeing through our Community Halls Policy. Lookingat the potential for negative effects associated with thisactivity, there are conflicting public perspectives aboutthe extent of the role that <strong>council</strong>s should take withrespect to <strong>community</strong> property. Halls have the potentialto cause negative effects such as noise and trafficeffects on neighbouring properties. Public toilets can betargets for graffiti and anti-social behaviour. Wastewaterdischarges could cause environmental effects andpublic health risks if not effectively managed.Projects <strong>plan</strong>ned to maintain currentservice levels over the next ten yearsÎÎ<strong>community</strong> halls maintenanceÎÎmaintenance of the Administration Building, AvalonPark Pavilion, CBD Community Resource Centre,<strong>community</strong> houses, Horticultural Hall, Korohiwa BusBarn, Library buildings, Little Theatre, MinohFriendship House and rental houses.
hutt city <strong>community</strong> <strong>plan</strong> 75How we measure the service providedMeasure Achieved 2006/07 Achieved 2007/08 Target 2008/09 Target 2009/10 to2018/19Tenants’ satisfaction with <strong>Council</strong> accommodation(measured by internal survey)Not measured 93% 90% 90%Residents’ satisfaction with:ÎÎpublic hallsÎÎpublic toilets94%58%Peer average91%76%95%69%Peer average91%77%≥ 94%≥ 58%≥ 94%≥ 58%(measured by independent survey)Occupancy rate of <strong>Council</strong> rental housing (measured bymanagement reports)94% 97% 90% 90%Note: Survey percentages quoted exclude those who responded ‘Don’t Know’. We work to meet these measures through UrbanPlus.
76Group Utility ServicesGroup Utility Services isresponsible for managing the<strong>community</strong>’s infrastructuralassets in the form of the roading,water supply, wastewater andstormwater networks, thewastewater treatment systemand the city’s landfills. Theseassets are maintained to agreedlevels of service set out inour asset management <strong>plan</strong>s.Activity 7: Roading and TrafficWhat we doOur ‘Roading and Traffic’ Activity includes:ÎÎthe professional and technical work involvedin managing the city’s roading networkÎÎthe improvement and day-to-day operation andmaintenance of footpaths, road pavement/reconstruction/upgrades, traffic signals, signs,street lighting, parking services, bridgemaintenance and various road safety activities.We support this work through policy development,forward <strong>plan</strong>ning, road safety co-ordination, andvarious quality and safety management systems.We regard this as our core business.Why we do itHaving the road corridor in public ownership ensures thatall our residents have appropriate access to property andfreedom of travel throughout <strong>Hutt</strong> <strong>City</strong>. We provide sealedroads, footpaths and street lights so that motor vehicles,bicycles and pedestrians can travel efficiently and safely.The Roading and Traffic Activity supports the city’soutcomes related to Community Prosperity (page 32),Connected (page 35), Lifestyle (page 43), RegionalFoundations (page 47), Sense of Place (page 50) andStrong and Tolerant Communities (page 53).Effects on <strong>community</strong> wellbeingThe Roading and Traffic Activity promotes economicwellbeing in particular through encouraging growth anddevelopment of the city, and promotes cultural wellbeingthrough our Road Safety Programme along with ourCycling Strategy and Walking Strategy.Looking at the potential for negative effects associatedwith this activity, our work in building new, and maintainingexisting, roads can potentially cause noise, dust andtraffic congestion, while road accidents can and willhappen even on the most efficient road network.All our roading contracts are governed by strict health,safety and quality requirements to keep the effects ofroad works to a minimum. This Community Plan includesfunding for programmes that have been designed topromote traffic safety and reduce accident numbersand severity.Projects <strong>plan</strong>ned to maintain currentservice levels over the next ten yearsÎÎannual carpark and footpath resurfacingÎÎannual road and footpath construction andpavement surfacingÎÎannual safety worksÎÎpedestrian crossing, street name sign,street lighting and traffic signal maintenance.
hutt city <strong>community</strong> <strong>plan</strong> 77MeasureAchieved2006/07Achieved2007/08Target2008/09Target2009/10 to 2018/19Residents’ satisfaction with:Peer averagePeer averageÎÎstreet lighting87%89%90%89%≥ 87%≥ 89%ÎÎroads and gutters being free of litter86%76%89%76%≥ 86%≥ 86%ÎÎtraffic control82%–87%–≥ 82%≥ 82%ÎÎfootpaths81%79%81%79%≥ 81%≥ 79%ÎÎroads74%80%80%80%≥ 74%≥ 80%ÎÎparking in and around <strong>Hutt</strong> <strong>City</strong>71%61%80%61%≥ 71%≥ 72%ÎÎthe safety and convenience of movementaround city streets82%–87%–≥ 82%≥ 82%(measured by independent survey)‘Road Condition Index’, which measures the condition ofthe road surface (measured by the NZ Transport Agency)‘Smooth Travel Exposure’, which is a nationallyaccepted measure of road roughness (measuredby the NZ Transport Agency)2.7 2.7 Hold or improve rating Hold or improve rating75% 76% Hold or improve rating Hold or improve ratingAccident trend (measured by the NZ Transport Agency) See graph See graph Contribute to a reducingtrend over 10 yearsContribute to a reducingtrend over 10 yearsNote: Survey percentages quoted exclude those who responded ‘Don’t Know’.
78How all reported we measure injury the crashes service provided within lower hutt local roads excludingstate highwaysNo. reported injury crashes300250200150100500178141 144 149 1531999 2000 2001 2002 2003 2004 2005 2006 2007 2008Activity 8: Water SupplyWhat we do163119151242214keyNumber of injurycrashes reportedtrend of reportedcrashesThe Water Supply Activity supports the city’s outcomesrelated to Community Prosperity (page 32), HealthyEnvironment (page 39) and Regional Foundations(page 47).Effects on <strong>community</strong> wellbeingThe Water Supply Activity promotes economic andenvironmental wellbeing in particular through providingfor the growth and development of the city. Looking at thepotential for negative effects associated with this activity,we work closely with Greater Wellington Regional <strong>Council</strong>to ensure that the amount of water we take remains withinresource consent limits. We also have programmes andprojects to ensure our water quality meets New Zealand’sDrinking Water Standards. We continue to promote waterconservation and are currently working on ways to ensurethat our available water supplies keep pace with projectedregional growth and demand.We provide a sustainable and high-quality water supply to our <strong>community</strong> for domestic and commercial use.We buy bulk water from Greater Wellington Regional <strong>Council</strong>, and then distribute it to the <strong>community</strong> through ourwater supply system. We regularly monitor the water quality and <strong>plan</strong> for the city’s future water supply, includingany maintenance and upgrades needed to maintain the required service. We regard this as our core business.Why we do itProjects <strong>plan</strong>ned to maintain currentservice levels over the next ten yearsÎÎongoing water main, rider and services maintenanceÎÎwater supply maintenance projectsÎÎreservoir upgrades.In supplying high-quality, affordable water, we contribute to:ÎÎour <strong>community</strong>’s healthÎÎ<strong>community</strong> safety (through the water supply system’s fire-fighting capability)ÎÎindustrial and residential development.
hutt city <strong>community</strong> <strong>plan</strong> 79How we measure the service providedMeasure Achieved 2006/07 Achieved 2007/08 Target 2008/09 Target 2009/10 to2018/19Residents’ satisfaction with the city water supply(measured by independent survey)97%(peer average 94%)96%(peer average 94%)≥ 95% ≥ 95%Compliance with New Zealand Drinking Water StandardsAchieved full compliancewith New ZealandDrinking Water StandardsAchieved full compliancewith New ZealandDrinking Water StandardsFull compliance withNew Zealand DrinkingWater StandardsFull compliance withNew Zealand DrinkingWater StandardsQuality of water (measured by Ministry of Health)Note: ‘b’ grading means a satisfactory, low level of riskAchieved a ‘b’ grading forthe <strong>Hutt</strong> <strong>City</strong> water supplyAchieved a ‘b’ grading forthe <strong>Hutt</strong> <strong>City</strong> water supplyAchieve ‘b’ grading fromthe Ministry of Health forthe <strong>Hutt</strong> <strong>City</strong> water supplyAchieve ‘b’ grading fromthe Ministry of Health forthe <strong>Hutt</strong> <strong>City</strong> water supplyProvide a reliable water supply service (measured bycontract reports)Achieved fewer than 0.2un<strong>plan</strong>ned supply cutsper 1000 connectionsAchieved fewer than 1.48un<strong>plan</strong>ned supply cutsper 1000 connectionsFewer than fourun<strong>plan</strong>ned supply cutsper 1000 connectionsFewer than fourun<strong>plan</strong>ned supply cutsper 1000 connectionsRespond promptly to water supply disruptions (measuredby contract reports)99% 99% 97% of requestsresponded to within onehour of notification97% of requestsresponded to withinone hour of notificationMaintain the average un-metered water consumptionin <strong>Hutt</strong> <strong>City</strong>Achieved less than 325litres per head per dayAchieved less than 339litres per head per day– Less than 350 litresper head per dayNote: Survey percentages quoted exclude those who responded ‘Don’t Know’. We work to meet these measures through Capacity.
80Activity 9: WastewaterWhat we doWe provide a piping network that takes householdand commercial effluent to the Seaview WastewaterTreatment Plant, which treats it to public health andenvironmental standards. Opened in November 2001,the resource consents under which the Treatment Plantnow operates ensure that all relevant standards areadhered to, and that full compliance with the ResourceManagement Act 1991 is achieved. The Plant’s operationhas led to a significant improvement to the environment.We regularly undertake maintenance and upgrades tomaintain the required service levels. We regard this asour core business.Why we do itThe Wastewater Activity supports the city’s outcomesrelated to Community Prosperity (page 32), HealthyEnvironment (page 39) and Regional Foundations(page 47).By collecting, treating and disposing of wastewater,we provide a service to residents and businesses thatsupports development in the city and protects thephysical environment and our <strong>community</strong>’s health.Effects on <strong>community</strong> wellbeingThe Wastewater Activity promotes economic andenvironmental wellbeing in particular through providingfor the growth and development of the city. Looking atthe potential for negative effects associated with thisactivity, the capacity of our existing wastewater drainagesystems may be exceeded in extreme weather eventsand result in wastewater overflows. This Community Planincludes initiatives designed to improve drainagecapacity and performance across the city and targetidentified problem areas.Projects <strong>plan</strong>ned to maintain currentservice levels over the next ten yearsÎÎsewer renewals and replacementÎÎLocal Pumping Station annual maintenanceÎÎwastewater network cyclic replacement.
hutt city <strong>community</strong> <strong>plan</strong> 81How we measure the service providedMeasureAchieved2006/07Achieved2007/08Target2008/09Target2009/10 to 2018/19Residents’ satisfaction with the city wastewater service(measured by independent survey)96%(peer average 94%)97%(peer average 94%)≥ 95% ≥ 95%No resource consent-related infringement notices receivedfrom Regional <strong>Council</strong>100% compliance 100% compliance No infringement notices No infringement noticesProvide a reliable wastewater service (measured bycontract reports)Respond promptly to wastewater disruptions (measuredby contract reports)Achieved 0.7 incidents Achieved 1.01 incidents Fewer than 1.2 wastewaterincidents reported perkilometre of wastewaterreticulation pipeline99% 99% 97% of requestsresponded to withinone hour of notificationFewer than 1.2 wastewaterincidents reported perkilometre of wastewaterreticulation pipeline97% of requestsresponded to withinone hour of notificationNote: Survey percentages quoted exclude those who responded ‘Don’t Know’. We work to meet these measures through Capacity.
82Activity 10: StormwaterWhat we doWe provide a stormwater drainage system to manage the surface water run-off fromurban catchments. Our objective is to achieve the best possible balance betweenthe level of protection and the cost to our <strong>community</strong>. This includes maintainingand upgrading assets to maintain the required service levels. We regard this asour core business.Why we do itThe Stormwater Activity supports the city’s outcomes related to Community Prosperity(page 32), Healthy Environment (page 39) and Regional Foundations (page 47).Most of the development in <strong>Hutt</strong> <strong>City</strong> is concentrated on flat valley plains with thepotential for flooding. We need to control stormwater to protect our <strong>community</strong>’shealth and safety and minimise property damage. A comprehensive stormwatersystem is the most efficient way to do this.Effects on <strong>community</strong> wellbeingThe Stormwater Activity promotes economic wellbeing in particular through providingfor the growth and development of the city, and promotes environmental wellbeingthrough our Stormwater Strategy. Looking at the potential for negative effectsassociated with this activity, the capacity of our existing stormwater drainage systemsmay be exceeded in extreme weather events and result in flooding and damage toproperty. This Community Plan includes initiatives designed to improve our drainagecapacity and performance and target identified problem areas.Projects <strong>plan</strong>ned to maintain current service levels over the nextten yearsÎÎstormwater maintenance worksÎÎstormwater network renewalsÎÎstormwater utilities renewals.
hutt city <strong>community</strong> <strong>plan</strong> 83How we measure the service providedMeasureAchieved2006/07Achieved2007/08Target2008/09Target2009/10 to 2018/19Residents’ satisfaction with the city stormwater service(measured by independent survey)80%(peer average 89%)86%(peer average 89%)≥ 80% ≥ 80%Provide a reliable stormwater service (measured bycontract reports)Achieved 0.12 incidents Achieved 0.075 incidents Fewer than onestormwater incidentreported per kilometreof stormwater pipelineFewer than 0.5stormwater incidentreported per kilometreof stormwater pipelineAchieve water quality at main recreational beaches(measured by contract reports)Achieved RecreationalWater Quality StandardsAchieved RecreationalWater Quality Standards90% of sampling dayswhen water quality meetsMinistry for theEnvironment guidelines90% of sampling dayswhen water quality meetsMinistry for theEnvironment guidelinesRespond promptly to stormwater disruptions (measuredby contract reports)99% 98% 97% of requestsresponded to withinone hour of notification97% of requestsresponded to withinone hour of notificationNote: Survey percentages quoted exclude those who responded ‘Don’t Know’. We work to meet these measures through Capacity.
84Activity 11: Solid WasteWhat we doWe manage contracts for the collection of the city’srefuse and recycling, and own and operate two landfillswhere people and businesses can dispose of residualwaste. We’re working on ‘Silverstream Stage Two’, whichwill enable us to maintain current service levels whenthe area currently being used at Silverstream is full.We regard these activities as our core business.Why we do itThe Solid Waste Activity supports the city’s outcomesrelated to Healthy Environment (page 39) and RegionalFoundations (page 47). Solid waste management isnecessary for the health and quality of life of the<strong>community</strong>, the local economy and the environment.Effects on <strong>community</strong> wellbeingThe Solid Waste Activity promotes environmentalwellbeing in particular, as uncontained refuse and littercan have detrimental health and environmental effects.We also have a number of educational programmesto promote waste reduction, reuse and recycling, andfor the disposal of residual waste. We also own andoperate landfills that fully comply with resource consentconditions and are managed and operated to ‘bestpractice’ standards. Looking at the potential for negativeeffects associated with this activity, environmental effectscaused through failure to comply with resource consentconditions has been identified as a possible risk that isaddressed through our management techniques and‘best practice’ standards. Poor recycling services couldpotentially lead to increased volumes of solid waste fordisposal and the associated costs.Projects <strong>plan</strong>ned to maintain currentservice levels over the next ten yearsÎÎcleanfill site developmentÎÎannual funding for Silverstream Landfill Stage 2ÎÎWainuiomata Landfill closure.How we measure the service providedMeasureAchieved2006/07Achieved2007/08Target2008/09Target2009/10 to 2018/19Residents’ satisfaction with:Peer averagePeer averageÎÎrubbish collection93%89%94%88%≥ 93%≥ 93%ÎÎrefuse disposal87%83%92%82%≥ 87%≥ 87%(measured by independent survey)No resource consent-related infringement noticesreceived from Regional <strong>Council</strong>100% compliance 100% compliance 100% compliance 100% complianceNote: Survey percentages quoted exclude those who responded ‘Don’t Know’.
hutt city <strong>community</strong> <strong>plan</strong> 85Group EnvironmentActivity 12: Environmental ManagementWhat we doThis activity includes:ÎÎdeveloping, implementing and monitoring theDistrict Plan, relevant bylaws and otherenvironmental policies and <strong>plan</strong>s for <strong>Hutt</strong> <strong>City</strong>’ssustainable developmentÎÎproviding resource management and buildingconsents and inspections, and environmentalhealth and animal servicesÎÎregular monitoring to ensure compliance withlegislative requirements, the District Plan,resource and building consent conditionsand bylaw requirementsÎÎinspections of business and food premises,certifications, liquor licensing law complianceand pollution and trade waste control, andmonitoring beaches to promote and protectpublic health and safetyÎÎmonitoring and controlling noise andhazardous substances.We regard these activities as our core business.Why we do itThe Environmental Management Activity supportsthe city’s outcomes related to Healthy Environment(page 39), Lifestyle (page 43), Regional Foundations(page 47) and Sense of Place (page 50). This activityis fundamental to achieving a clean, healthy, attractiveand sustainable environment. It’s also a legalrequirement for <strong>Hutt</strong> <strong>City</strong> <strong>Council</strong>.Effects on <strong>community</strong> wellbeingThe Environmental Management Activity promotesenvironmental wellbeing in particular through our DistrictPlan and Earthquake Prone, Dangerous and InsanitaryBuildings Policy. Looking at the potential for negativeeffects associated with this activity, people’s perceptionsof personal freedom can be reduced through the need forregulatory activities for the benefit of the wider <strong>community</strong>.Regulatory activities can also be interpreted as causingcosts and delays by the users of those services.Projects <strong>plan</strong>ned to maintain currentservice levels over the next ten yearsÎÎongoing operational projects.
86How we measure the service providedMeasureAchieved2006/07Achieved2007/08Target2008/09Target2009/10 to 2018/19Residents’ satisfaction with:Peer averagePeer averageÎÎanimal services82%79%87%79%≥ 82%≥ 87%ÎÎinspection services (eg. licences)ÎÎrequests for service78%88%67%89%75%84%67%89%≥ 78%≥ 88%≥ 75%≥ 84%(measured by independent surveys)Land Information Memoranda (LIMs) processed tocomply with statutory requirements (measured bymanagement reports)92% processed withinnine working days96% processed withinnine working days90% processed withinnine working days90% processed withinnine working daysBuilding consent/project information and resourceconsents processed to comply with the Building Code,Resource Management Act (RMA) and District Planrequirements (measured by computer database records)87% of building consentsprocessed within15 working days85% of non-notified landuse consents processedwithin 18 working days88% of building consentsand 78% of non-notifiedland use consentsprocessed within18 working days80% of building andnon-notified land useconsents processedwithin 18 working days80% of building andnon-notified land useconsents processedwithin 18 working daysRequests for service referred to RMA Monitoringand Enforcement team responded to within requiredtimeframes (measured by management and computerdatabase reports)Resource consents granted by <strong>Council</strong> are monitoredin a timely manner (measured by management reports)New measure for 2008/09 New measure for 2008/09 80% acknowledgedwithin 48 hoursNew measure for 2008/09 New measure for 2008/09 Monthly target of resourceconsents that requiremonitoring is set at 6080% acknowledgedwithin 48 hoursMonthly target of resourceconsents that requiremonitoring is set at 65Building consents for fireplaces are processed in a timelymanner (measured by computer database records)New measure for 2009/10 New measure for 2009/10 New measure for 2009/10 100% processed withinfive working days
hutt city <strong>community</strong> <strong>plan</strong> 87MeasureAchieved2006/07Achieved2007/08Target2008/09Target2009/10 to 2018/19Building consents for solar panels are processed in atimely manner (measured by computer database records)Premises (eg, food outlets and liquor outlets) registeredor licensed within 30 days of application (measured bycomputer database records)New measure for 2009/10 New measure for 2009/10 New measure for 2009/10 100% processed withinfive working days97% 98% 90% 90%Code of compliance certificates issued within 20 workingdays to comply with statutory requirements in the BuildingAct, or notices to fix issued (measured by computerdatabase records)98% 100% 100% issued within20 working days100% issued within20 working days80% issued within18 working daysDog pound open 300 days per year (measured bymanagement reports)Six days per week exceptfor public holidays300 days 300 days 300 daysDog complaints are responded to within 30 minutes fordog attacks and 24 hours for other complaints (measuredby management reports)Noise complaints are responded to within 30 minutes(measured by management reports)100% 100% 95% 95%84% 85% 85% 85%Note: Survey percentages quoted exclude those who responded ‘Don’t Know’.
88Activity 13: Emergency ManagementWhat we doThis activity includes:ÎÎdeveloping, implementing and monitoring city-wide emergency management <strong>plan</strong>sÎÎpromoting <strong>community</strong> preparedness for emergenciesÎÎworking with other authorities in the region to <strong>plan</strong> for and respond to hazards,risks and emergencies.We also have <strong>plan</strong>s for dealing with and preventing rural fires, and maintain anin-house capacity to co-ordinate responses to civil defence and rural fire emergencies.We regard these activities as our core business.Why we do itEffects on <strong>community</strong> wellbeingThe Emergency Management Activity promotes economic and social wellbeing inparticular through encouraging preparedness to cope in the event of a Civil Defenceemergency. Looking at the potential for negative effects associated with this activity,emergency equipment such as sirens can create temporary noise effects. Emergencymanagement response and recovery activities may also have a temporary adverseeffect on <strong>community</strong> and environmental wellbeing while social systems andinfrastructure are being rebuilt following an emergency event.Projects <strong>plan</strong>ned to maintain current service levels over the nextten yearsÎÎongoing operational projectsÎÎWainuiomata Bush Fire Force vehicle and headquarters.The Emergency Management Activity supports the city’s outcomes related to RegionalFoundations (page 47) and Sense of Place (page 50). This activity is fundamental tomaking sure our city is prepared for emergencies. We work according to the principlesof ‘reduce, readiness, response and recovery’.
hutt city <strong>community</strong> <strong>plan</strong> 89How we measure the service providedMeasureAchieved2006/07Achieved2007/08Target2008/09Target2009/10 to 2018/19Percentage of households that are prepared for a civildefence emergency (measured by independent survey)We respond to emergencies in accordance with theWellington Region Civil Defence Emergency ManagementGroup Plan and the Civil Defence EmergencyManagement Act 2002 (measured by managementreports and debrief notes)We respond to rural fires in accordance with the <strong>Hutt</strong> <strong>City</strong>Rural Fire Plan and the Forest and Rural Fires Act 1977and the Forest and Rural Fires Regulations 2005(measured by Wellington Regional Rural Fire Committee)56% 56% 60% 60%100% 100% 100% 100%100% 100% 100% 100%Note: Survey percentages quoted exclude those who responded ‘Don’t Know’.
90Group EconomyActivity 14: Local Urban EnvironmentWhat we doWe work to develop an urban environment that will enhance the city’s image, attractingpeople, businesses and investment, and meet our <strong>community</strong>’s needs and aspirations,while recognising the important role of our heritage and features.We:ÎÎimplement environmental policies and <strong>plan</strong>s for <strong>Hutt</strong> <strong>City</strong>’s sustainabledevelopment, including environmental education and promotionÎÎrun an annual waste-minimisation programme to promote the conceptof ‘reduce, reuse, recycle’ to businesses and residents.We regard these activities as our core business.Why we do itThe Local Urban Environment Activity supports the city’s outcomes related toCommunity Prosperity (page 32), Connected (page 35), Entrepreneurial andInnovative Culture (page 37), Healthy Environment (page 39) and Sense of Place(page 50). We recognise that our urban design and infrastructure must supportour changing business and <strong>community</strong> environment. We manage and develop<strong>Hutt</strong> <strong>City</strong>’s public spaces and preserve our heritage buildings because this benefitsboth businesses and our <strong>community</strong>. It contributes to our point of difference fromother cities, supporting local cultures and enhancing how we identify ourselves.We manage our waste (through promoting recycling and waste reduction) tomaintain our <strong>community</strong>’s health and quality of life.Effects on <strong>community</strong> wellbeingThe Local Urban Environment Activity promotes social, economic, environmental andcultural wellbeing through encouraging development of our urban environment whileat the same time promoting sustainability through our Environmental SustainabilityStrategy. In particular the Vision CBD 2030 and CBD Making Places (incorporatingthe CBD Master<strong>plan</strong>) projects are working to improve the local urban environmentand make it sustainable into the future. Looking at the potential for negative effectsassociated with this activity, urban design activities could result in temporary disruptionsduring any construction phase. Poor recycling services could potentially lead toincreased volumes of solid waste for disposal and the associated costs.Projects <strong>plan</strong>ned to maintain current service levels over the nextten yearsÎÎongoing operational projectsÎÎannual maintenance of Seaview/Gracefield banners.
hutt city <strong>community</strong> <strong>plan</strong> 91How we measure the service providedMeasure Achieved 2006/07 Achieved 2007/08 Target 2008/09 Target 2009/10 to2018/19Residents feel a sense of pride in the way the city looksand feels (measured by independent survey)Businesses feel a sense of pride in the way the city looksand feels (measured by independent survey)86% 90% ≥ previous results ≥ previous results76% 67% ≥ previous results ≥ previous resultsResidents’ satisfaction with:Peer averagePeer averageÎÎlitter control86%76%89%76%≥ 86%≥ 89%ÎÎrecycling86%91%91%91%≥ 86%≥ 91%ÎÎgraffiti levels84%Not available82%Not available≥ 84%≥ 82%(measured by independent survey)Percentage of households that have used the recyclingservice in the previous 12 months (measured byindependent survey)All residents have access to <strong>community</strong> recyclingfacilities (measured by management reports)Tonnes of recycling per annum (measured bymanagement reports)79% 86% ≥ 79% ≥ 86%100% 100% 100% 100%7129 7479 Increasing IncreasingNote: Survey percentages quoted exclude those who responded ‘Don’t Know’.
92Activity 15: Economic DevelopmentWhat we doWe take a lead role in encouraging <strong>Hutt</strong> <strong>City</strong>’s growth through:ÎÎcreating a business-friendly environmentÎÎfacilitating the expansion and creation of local businesses and employmentÎÎincreasing tourism and events in <strong>Hutt</strong> <strong>City</strong>ÎÎcontributing to regional growth through regional economic development.We regard these activities as our core business.Why we do itEffects on <strong>community</strong> wellbeingThe Economic Development Activity promotes economic wellbeing in particularthrough our Economic Development Strategy, Visitor Strategy and Suburban ShoppingCentres Fund Policy. Looking at the potential for negative effects associated with thisactivity, any focus on one area of the local economy could divert attention away fromother equally important areas.Projects <strong>plan</strong>ned to maintain current service levels over the nextten yearsÎÎongoing operational projects.The Economic Development Activity supports the city’s outcomes relatedto Community Prosperity (page 32), Connected (page 35), Entrepreneurialand Innovative Culture (page 37) and Lifestyle (page 43). We know thatindividual businesses generally lack incentives to explore opportunitiesthat benefit <strong>Hutt</strong> <strong>City</strong> as a whole, as well as themselves. By supportingthe business sector and promoting <strong>Hutt</strong> <strong>City</strong> as a business location andvibrant city, we generate benefits for local enterprises and our residents.
hutt city <strong>community</strong> <strong>plan</strong> 93How we measure the service providedMeasureAchieved2006/07Achieved2007/08Target2008/09Target2009/10 to 2018/19Businesses’ satisfaction with economic developmentprogrammes (measured by business survey)Residents’ satisfaction with the Visitor Information Centre(measured by independent survey)85% 90% ≥ 85% ≥ 85%91% Not measured ≥ 91% ≥ 91%<strong>Hutt</strong> <strong>City</strong>’s economic performance according to theannual Economic Development Strategy report to<strong>Council</strong>, which includes measures such as:Improvement in relativeranking with other citiesmeasured.Improvement in relativeranking with other citiesmeasured.ÎÎnumber of businessesÎÎnumber of full-time equivalents (FTEs) in the workforceÎÎGross Domestic Product (GDP)(measured by Business Economic Research Ltd)ÎÎup 1.9%ÎÎup 2.0%ÎÎup 3.6%ÎÎsixth ranked numberof businesses growthÎÎseventh rankedjob growthÎÎsecond rankedGDP growthWorking towards a10-15% increase innumber of businesses,number of FTEs andGDP by 2014.Working towards a10-15% increase innumber of businesses,number of FTEs andGDP by 2014, and a 30%increase by 2019.Note: Survey percentages quoted exclude those who responded ‘Don’t Know’.
94Group OrganisationActivity 16: Elected MembersWhat we doElected members of <strong>Hutt</strong> <strong>City</strong> <strong>Council</strong> have an important role in the <strong>community</strong>. They:ÎÎprovide a governance role for the cityÎÎset <strong>Council</strong>’s strategic direction, including de<strong>term</strong>ining the activities we undertake(within legal parameters)ÎÎmonitor our performance on behalf of the city’s residents and ratepayers.Our governance structure includes <strong>community</strong> boards and <strong>community</strong> committees,which provide local input into our decision-making. You can read more about themin ‘Our <strong>community</strong>’ on page 140.Effects on <strong>community</strong> wellbeingThe Elected Members Activity promotes social wellbeing in particular through ourConsultation Policy, but also promotes social, economic, environmental and culturalwellbeing through contributing to projects <strong>Council</strong>-wide. Looking at the potential fornegative effects associated with this activity, there is a risk that some portions of thepopulation are not represented adequately. This is mitigated through our consultationand engagement practices.Projects <strong>plan</strong>ned to maintain current service levels over the nextten yearsÎÎongoing operational projects.Why we do itThe Elected Members Activity supports the city’s outcomes related to Strong andTolerant Communities (page 53). This ensures sound governance and robustdecision-making within <strong>Hutt</strong> <strong>City</strong>.
hutt city <strong>community</strong> <strong>plan</strong> 95How we measure the service providedMeasureAchieved2006/07Achieved2007/08Target2008/09Target2009/10 to 2018/19Residents’ satisfaction with the Mayor’s and <strong>council</strong>lors’performance (measured by independent survey)88%(peer average 89%)94%(peer average 89%)≥ 88% ≥ 90%Residents’ satisfaction with the way we spend their rates(measured by independent survey)81%(peer average 79%)86%(peer average 79%)≥ 81% ≥ 83%Residents’ satisfaction with our public consultation(measured by independent survey)New measure for2009/10 onwardsNew measure for2009/10 onwardsNew measure for2009/10 onwardsImprovementNote: Survey percentages quoted exclude those who responded ‘Don’t Know’.Activity 17: Advice and SupportWhat we doThis activity comprises the processes that support our decision-making, such asstrategic <strong>plan</strong>ning, policy development and monitoring and reporting.Why we do itThe Advice and Support Activity supports the city’s outcomes related to CommunityProsperity (page 32), Lifestyle (page 43), Strong and Tolerant Communities (page 53)and Healthy and Educated Community (page 55). Professional advice and supportare necessary to help us and <strong>community</strong> boards and committees to make informeddecisions on behalf of our <strong>community</strong>.Effects on <strong>community</strong> wellbeingThe Advice and Support Activity promotes social, economic, environmental andcultural wellbeing through contributing to projects <strong>Council</strong>-wide. Looking at thepotential for negative effects associated with this activity, there is a possibilitythat providing advice that balances the needs and wants of the local <strong>community</strong>in the interests of the public good will cause a negative effect on individualsor groups.Projects <strong>plan</strong>ned to maintain current service levels over the nextten yearsÎÎongoing operational projects.
96How we measure the service providedMeasureAchieved2006/07Achieved2007/08Target2008/09Target2009/10 to 2018/19<strong>Council</strong>lors are satisfied or more than satisfied with theformal advice they receive from officers (measured byinternal survey)<strong>Council</strong>lors are satisfied or more than satisfied withresponses to requests for help from officers (measuredby internal survey)Community board and <strong>community</strong> committee members aresatisfied or more than satisfied with the formal advice theyreceive from officers (measured by internal survey)Community board and <strong>community</strong> committee members aresatisfied or more than satisfied with responses to requestsfor help from officers (measured by internal survey)100% 100% 80% 80%New measure for 2008/09 New measure for 2008/09 80% 80%72.5% 75% 80% 80%New measure for 2008/09 New measure for 2008/09 80% 80%Note: Survey percentages quoted exclude those who responded ‘Don’t Know’.
hutt city <strong>community</strong> <strong>plan</strong> 97Activity 18: Managing ServicesWhat we do‘Managing Services’ incorporates the organisational support functions that help us toprovide our other activities efficiently and effectively.Why we do itThe Managing Services Activity contributes to all <strong>community</strong> outcomes by supportingall our other activities.Effects on <strong>community</strong> wellbeingThe Managing Services Activity promotes social, economic, environmental and culturalwellbeing through providing services which support all other activities across theorganisation, such as Human Resources Management, Financial Management,Corporate Strategy and Risk, Corporate Counsel and Information Services, and bycontributing to projects <strong>Council</strong>-wide. Any potential negative effects associated withsupporting all the <strong>Council</strong>’s other activities have been identified under each activity.Projects <strong>plan</strong>ned to maintain current service levels over the nextten yearsÎÎcore system replacement/upgradesÎÎcorporate application/hardware replacement and software purchasesÎÎcomputer and network maintenance projectsÎÎserver replacement, IT storage and disaster recovery capabilityÎÎinternet and intranet maintenance projects.How we measure the service providedMeasureAchieved2006/07Achieved2007/08Target2008/09Target2009/10 to 2018/19Staff turnover (measured by management reports) 12% 13.7% Less than 15% Less than 14%Legal and policy requirements (measured bymanagement reports)No significant instancesof non-complianceNo significant instancesof non-complianceNo significant instancesof non-complianceNo significant instancesof non-complianceWork-related accidents(measured by management reports)Five work-relatedaccidents resulted intime off workFour work-relatedaccidents resulted intime off workFewer than six resultingin time off workFewer than six resultingin time off workNote: Survey percentages quoted exclude those who responded ‘Don’t Know’.
Cycle safety child-sizeYoung bikers can now learn all about cycle safety at Avalon Park , sFulton Hogan cycle park. The park has all the road signs and markingsyou , d find on a normal road but on a child-size scale and without thedanger of vehicle traffic. There , s even a rail crossing where the LionsClub model train intersects the cycle track. James and mum Sarahchecked out the park over the summer holidays.
Financing Our Work
100Financing our workNow that we’ve set some targetsfor our work in the next 10 years,we need to consider how we’regoing to pay for it.That’s what this section is about. It shows you how we<strong>plan</strong> to manage our money between 2009 and 2019according to each <strong>Council</strong> group and the 18 keyactivities for which they are responsible. It covers ourcapital and operating projects, our estimated incomeand expenditure, and the costs and sources of funds.Prioritising our spendingIt’s always a challenge to balance requests for newfunding with the need to keep going on projects thatwill help us to achieve the goals our <strong>community</strong> believesshould be our priorities. We typically provide for 200-300projects every year – and of course we’re always awareof the effect of rate increases to fund our spending.Our Financial Strategy aims to:ÎÎmaintain general rate increases at below therate of inflation every year, plus half a percentto account for growth in the rating base throughnew developments in the cityÎÎreduce net debt to below $60 million by 2011and below $30 million by 2015.As we’ve already discussed, this is all with the goalof strengthening our financial position so we’ll be wellplaced for the anticipated projects and programmesthat will need funding in the next 20 to 30 years.Types of expenditureWe have two types of spending:ÎΑcapital expenditure’, which is spending that willincrease the value of our assetsÎΑoperating expenditure’, which goes on significantprojects that don’t result in either the creation ofnew <strong>Council</strong> assets or an increase in the valuesof existing assets.The projects funded by these two types of expenditure(capital projects and operating projects) are coveredin the tables that follow.The capital projects are those we’ve identified in ourasset management <strong>plan</strong>s to maintain and improve ourexisting services while meeting future service needs.Capital expenditure will be funded by loans, capitalcontributions, transfers from reserves, rate fundeddepreciation charges and asset sales. More detailis provided in the Funding Impact Statement (seepage 213).You’ll find the estimated cost of each project in theForecast Financial Statements (see page 187). Notethat some project costs include a component to coveranticipated future increases in demand for our facilities asa result of growth in the city. Our Policy on Developmentand Financial Contributions (see page 257) summarisesthis type of capital expenditure and how it is to be funded.Road projects in Activity 7 (Roading and Traffic) willqualify for subsidies from the NZ Transport Agency.The base subsidy rate that applies to operating andcapital maintenance works is 47% and 57% for NZTAapproved capital development projects.You’ll find the rationale for our funding decisionsin relation to each key activity in our Revenue andFinancing Policy on page 236.
hutt city <strong>community</strong> <strong>plan</strong> 101Income: for the whole of <strong>Council</strong>Whole of <strong>Council</strong> – Prospective Income StatementFor the year ending 30 JuneEstimate2009$000Budget2010$000Forecast2011$000Forecast2012$000For the year ending 30 JuneEstimate2009$000Budget2010$000Forecast2011$000Forecast2012$000REVENUEGeneral rates & other rate charges 77,570 80,087 82,260 84,409User charges 26,565 30,100 29,858 30,367Operating contributions 3,477 3,555 3,666 3,767Upper <strong>Hutt</strong> CC operatingcontribution 2,458 2,481 2,538 2,489Capital contributions 5,096 5,460 5,672 14,504Interest on investments 152 150 (33) 35Other revenue 2,281 2,347 2,197 2,118Total revenue 117,599 124,180 126,158 137,689EXPENDITUREEmployee costs 23,496 25,710 26,379 27,048Support costs – – – –Operating costs 60,509 63,133 63,979 65,092Interest expense 5,602 4,418 3,685 3,020Depreciation 23,976 27,459 27,182 27,521OPERATING SURPLUS BEFOREREVALUATION GAINS 4,016 3,460 4,933 15,008Revaluation gains/(losses) (4,000) 800 800 1,000SURPLUS BEFORE TAX 16 4,260 5,733 16,008Taxation – – – –SURPLUS AFTER TAX 16 4,260 5,733 16,008Gains on Asset Revaluation 109,644 – – –SURPLUS AFTER REVALUATIONGAINS AND LOSSES 109,660 4,260 5,733 16,008Total expenditure 113,583 120,720 121,225 122,681
102Group PeopleCAPITAL PROJECTSFor the year ending 30 June 2010$0002011$0002012$0002013$0002014$0002015$0002016$0002017$0002018$0002019$0001. LIBRARIESMaintenanceLibrary Stock Replacement $733 $757 $783 $801 $821 $840 $860 $880 $902 $924Library Furniture & Equipment Maintenance $75 $41 $43 $44 $45 $46 $47 $48 $49Library Shelving Replacement $80 $27New/ImprovementsDigitisation $20 $10 $11Eastbourne Library Refurbishment $60 $10Community Libraries Security System $75 $52 $53 $55Wainuiomata Library Refurbishment $962. MUSEUMSMaintenanceDowse Museum Building, Fittings & Equipment Maintenance $2 $13 $117 $22 $29 $38 $56 $35 $35Settlers Museum Building, Fittings & Equipment Maintenance $3 $6 $9 $11 $10 $37New/ImprovementsDowse Museum Deck Barrier $35Dowse New Artworks $15 $15 $16 $16 $17 $17 $18 $18Petone Settlers Museum Collection Acquisitions $3 $3 $3 $3 $3 $3 $4 $4Petone Settlers Museum New Gallery Lighting $27 $303. AQUATICS & RECREATIONMaintenanceHuia Pool Replace Boiler $52Naenae Pool Replace Filters $346Other Projects $354 $420 $344 $411 $427 $442 $459 $546 $566 $592Stokes Valley Pool Replace Heat Coil, Ducting & Supply Fan $49Wainuiomata Pool Replace Filters $273Walter Nash Stadium Building, Fittings & Equipment Maintenance $90 $35 $217 $148 $95 $109 $136 $66 $173 $66
hutt city <strong>community</strong> <strong>plan</strong> 103For the year ending 30 June 2010$0002011$0002012$0002013$0002014$0002015$0002016$0002017$0002018$0002019$000New/ImprovementsHuia Pool Learn To Swim $1,093Huia Pool Replace Movable Floor $615McKenzie Pool Replacement $1,240Naenae Pool Refurbish Reception and Entrance $207Other Pools Projects $96 $101 $105 $111 $116 $153 $164 $175Walter Nash Stadium Upgrade (Subsidy: 64% Plus Part Funding fromReserve Fund) $5,927 $6,0664. PARKS & RESERVESMaintenanceBuilding Maintenance (Sportsgrounds) $150 $154 $158 $164 $168 $172 $177 $183 $187 $192Korokoro Gateway Landscape Renovation $112Carparks & Footpath Surfaces Maintenance $60 $51 $158 $164 $168 $172 $177 $183 $187 $192Percy Scenic Reserve: Interpretation Signage $30Playgrounds $110 $113 $127 $131 $134 $138 $142 $158 $162 $166Seats and Bins $26 $27 $29 $29 $31 $32 $34 $35 $36 $37Signage and Interpretation $20 $22 $23 $25 $26 $29 $30 $33 $34 $38Street Tree Infrastructural Repairs $35 $36 $195 $38 $39 $40 $41 $43 $44 $45Street Tree Replacements & Additional Street Trees $93 $96 $99 $102 $105 $106 $109 $114 $116 $119Track Maintenance $130 $31 $32 $33 $34 $34 $35 $37 $37 $38Wharf Survey & Maintenance $45 $164 $168 $52 $177 $183New/ImprovementsAvalon Park Development [Funded from Reserve Fund] $236Bollards to Prevent Vehicle Access to Reserves $5 $5 $5 $5 $6 $6 $6 $6 $6 $6Days Bay Wharf Entrance Development [Funded from Reserve Fund] $111Holborn Drive Reserve Drainage [Funded from Reserve Fund] $177Hugh Sinclair Park – BMX Track [Funded from Reserve Fund] $75<strong>Hutt</strong> Park Development Final Stage [Funded from Reserve Fund] $300
104For the year ending 30 June 2010$0002011$0002012$0002013$0002014$0002015$0002016$0002017$0002018$0002019$000Kelson Reserve Development [Funded from Reserve Fund] $211Korohiwa Recreation Area [Funded from Reserve Fund] $100Memorial Park Synthetic Turf [Funded from Reserve Fund] $10 $528Mountain Bike Park [Funded from Reserve Fund] $140 $31 $32 $33 $34 $34 $35 $37 $37 $38New Cemetery Development, Akatarawa Road $97New Tracks/Track Upgrades [Funded from Reserve Fund] $112 $115 $118 $122Otonga School Site Development [Funded from Reserve Fund] $211Percy Scenic Reserve Development [Funded from Reserve Fund] $225 $112Petone Foreshore Improvements [Funded from Reserve Fund] $344 $365Poto Road Reserve Development [Funded from Reserve Fund] $211Rugby World Cup <strong>Hutt</strong> Rec Improvements [Funded from Reserve Fund] $350Sportsgrounds Artificial Training Areas [Funded from Reserve Fund] $448Te Whiti Park New Changing Rooms [Funded from Reserve Fund] $61 $1,249Trafalgar Park Bollards [Funded from Reserve Fund] $20Trafalgar Park New Toilets/Fence [Funded from Reserve Fund] $74 $172Tutukiwi Orchid House Improvements [Funded from Reserve Fund] $185Wainuiomata Garden of Remembrance Development $262Walter Mildenhall Park Upgrade [Funded from Reserve Fund] $106 $109Walter Nash Reserve Upgrade [Funded from Reserve Fund] $23 $355Whiorau Reserve Development [Funded from Reserve Fund] $79 $1366. PROPERTYMaintenanceAdmin Building Maintenance $65 $31 $106 $109 $90 $172 $183 $87 $256Avalon Park Pavilion Maintenance $51 $57 $73 $102CBD Community Resource Centre Maintenance $28 $33 $38Community Halls Maintenance $160 $139 $211 $273 $218 $69 $177 $225 $256Community Houses Maintenance $35 $15 $34 $59 $75 $192Horticultural Hall Maintenance $108 $27 $157 $115 $24 $122 $62Korohiwa Bus Barn Maintenance $172 $230
hutt city <strong>community</strong> <strong>plan</strong> 105For the year ending 30 June 2010$0002011$0002012$0002013$0002014$0002015$0002016$0002017$0002018$0002019$000Libraries Building Maintenance $30 $41 $42 $34 $165 $87 $192Little Theatre Maintenance $15 $31 $11 $165 $62Minoh Friendship House Maintenance $20 $10 $56 $95 $97 $115Miscellaneous Rentals Maintenance $20 $21 $63 $27 $69 $49 $154Singles Houses (Reserves) Maintenance $44 $21 $65 $118 $75 $115New/ImprovementsAdmin Building Improvements $211Admin Building Strengthening $24,360Avalon Park Maintenance $20Community Halls Improvements $114 $288 $317 $44 $112 $115 $35 $97 $125 $128Community Resource Centre $56Halls Upgrade Men’s Shed $10Horticultural Hall Improvements $71Korohiwa Bus Barn Redevelopment $2,200Library Buildings Improvements $9 $41 $65 $90 $46 $61 $62 $90Little Theatre Improvements $123 $33 $77Little Theatre Sound & Lighting Improvements $50Minoh Friendship House Improvements $130Taita Hall Improvements $20The Pavilion Improvements $134Toilets Upgrade $50 $359 $422 $436 $125Town Hall Improvements $123 $158 $164
106OPERATING PROJECTSFor the year ending 30 June 2010$0002. MUSEUMSSettlers Museum Feasibility Study $393. AQUATICS & RECREATIONEvents Funding $299Sportsville <strong>Hutt</strong> <strong>City</strong> $120Walter Nash Feasibility $444. PARKS & RESERVESCanopy Weed Control $38Fraser Park Hockey Turf Grant $100<strong>Hutt</strong> River Trail $12Mitchell Park Tennis Courts Grant $200NI Brown Kiwi $5Problem Tree Removal $265Waiwhetu Stream Working Group $32For the year ending 30 June 2010$0005. COMMUNITY SUPPORTArts & Culture Funding $89Citizens Advice Bureau Funding $64Cadet Unit Support $15Community Grants Contestable Fund $176Community Houses Funding $255International Year of the Volunteer $2Marae Funding $120Men’s Shed Grant $20Safety Initiatives $197Scholarships $10Social Development Projects $30Youth Centre $158Youth Infusion $106. PROPERTYReview of Community Halls $60
hutt city <strong>community</strong> <strong>plan</strong> 1071. LibrariesPROSPECTIVE INCOME STATEMENTPROSPECTIVE FUNDING REQUIREMENTFor the year ending 30 JuneEstimate2009$000Budget2010$000Forecast2011$000Forecast2012$000For the year ending 30 JuneEstimate2009$000Budget2010$000Forecast2011$000Forecast2012$000REVENUEUser charges 479 676 698 722Total revenue 479 676 698 722EXPENDITUREEmployee costs 3,443 3,669 3,764 3,860Support costs 2,236 2,075 2,143 2,218Operating costs 704 907 937 968Interest expense 51 38 32 27Depreciation 681 763 734 755Total expenditure 7,115 7,452 7,610 7,828DEFICIT BEFORE TAX (6,636) (6,776) (6,912) (7,106)RATES FUNDING REQUIREMENTSurplus/(deficit) (6,636) (6,776) (6,912) (7,106)Total rates funding requirement (6,636) (6,776) (6,912) (7,106)LOAN FUNDING REQUIREMENTCapital expenditure –maintaining services (825) (808) (799) (906)Capital expenditure –improving services (490) (155) (72) (160)Less depreciation 681 763 734 755Total loan funding surplus (634) (200) (137) (311)TOTAL FUNDING REQUIREMENT (7,270) (6,976) (7,049) (7,417)
1082. museumsPROSPECTIVE INCOME STATEMENTPROSPECTIVE FUNDING REQUIREMENTFor the year ending 30 JuneEstimate2009$000Budget2010$000Forecast2011$000Forecast2012$000For the year ending 30 JuneEstimate2009$000Budget2010$000Forecast2011$000Forecast2012$000REVENUEUser charges 263 189 195 202Other revenue 443 215 222 230Total revenue 706 404 417 432EXPENDITUREEmployee costs 1,151 1,153 1,184 1,214Support costs 544 628 648 672Operating costs 994 937 884 850Interest expense 78 58 49 39Depreciation 346 384 375 369Total expenditure 3,113 3,160 3,140 3,144RATES FUNDING REQUIREMENTSurplus/(deficit) (2,407) (2,756) (2,723) (2,712)Total rates funding requirement (2,407) (2,756) (2,723) (2,712)LOAN FUNDING REQUIREMENTCapital expenditure –maintaining services (116) (2) (13) (117)Capital expenditure –improving services (58) (53) (19) (46)Less depreciation 346 384 375 369Total loan funding surplus 172 329 343 206TOTAL FUNDING REQUIREMENT (2,235) (2,428) (2,380) (2,506)DEFICIT BEFORE TAX (2,407) (2,756) (2,723) (2,712)
hutt city <strong>community</strong> <strong>plan</strong> 1093. aquatics and recreationPROSPECTIVE INCOME STATEMENTPROSPECTIVE FUNDING REQUIREMENTFor the year ending 30 JuneEstimate2009$000Budget2010$000Forecast2011$000Forecast2012$000For the year ending 30 JuneEstimate2009$000Budget2010$000Forecast2011$000Forecast2012$000REVENUEUser charges 1,967 2,273 2,359 2,439Capital contributions – – – 7,583Other revenue 465 673 695 718Total revenue 2,432 2,946 3,054 10,740EXPENDITUREEmployee costs 2,544 2,916 2,992 3,068Support costs 639 644 664 688Operating costs 2,768 2,808 2,867 2,964Interest expense 80 60 50 40Depreciation 658 843 852 1,036Total expenditure 6,689 7,271 7,425 7,796SURPLUS/(DEFICIT) BEFORE TAX (4,257) (4,325) (4,371) 2,944RATES FUNDING REQUIREMENTSurplus/(deficit) (4,257) (4,325) (4,371) 2,944Add capital contributions – – – (7,583)Total rates funding requirement (4,257) (4,325) (4,371) (4,639)LOAN FUNDING REQUIREMENTCapital expenditure –maintaining services (206) (444) (556) (561)Capital expenditure –improving services (175) – (1,446) (6,024)Less capital contributions – – – 7,583Less depreciation 658 843 852 1,036Total loan funding surplus 277 399 (1,150) 2,034TOTAL FUNDING REQUIREMENT (3,980) (3,926) (5,521) (2,605)
1104. PARKS AND RESERVESPROSPECTIVE INCOME STATEMENTPROSPECTIVE FUNDING REQUIREMENTFor the year ending 30 JuneEstimate2009$000Budget2010$000Forecast2011$000Forecast2012$000For the year ending 30 JuneEstimate2009$000Budget2010$000Forecast2011$000Forecast2012$000REVENUEUser charges 937 971 1,003 1,037Capital contributions 604 550 568 587Other revenue 46 19 19 20Total revenue 1,587 1,540 1,590 1,644EXPENDITUREEmployee costs 651 940 965 989Support costs 522 546 562 582Operating costs 7,026 8,379 8,127 8,356Interest expense 625 469 395 317Depreciation 857 1,075 1,068 1,072Total expenditure 9,681 11,409 11,117 11,316DEFICIT BEFORE TAX (8,094) (9,869) (9,527) (9,672)RATES FUNDING REQUIREMENTSurplus/(deficit) (8,094) (9,869) (9,527) (9,672)Add capital contributions (604) (550) (568) (587)Total rates funding requirement (8,698) (10,419) (10,095) (10,259)LOAN FUNDING REQUIREMENTCapital expenditure –maintaining services (647) (699) (530) (820)Capital expenditure –improving services (1,020) (1,410) (36) (1,568)Less capital contributions 604 550 568 587Less depreciation 857 1,075 1,068 1,072Total loan funding surplus (206) (484) 1,070 (729)TOTAL FUNDING REQUIREMENT (8,904) (10,903) (9,025) (10,988)
hutt city <strong>community</strong> <strong>plan</strong> 1115. COMMUNITY SUPPORTPROSPECTIVE INCOME STATEMENTPROSPECTIVE FUNDING REQUIREMENTFor the year ending 30 JuneEstimate2009$000Budget2010$000Forecast2011$000Forecast2012$000For the year ending 30 JuneEstimate2009$000Budget2010$000Forecast2011$000Forecast2012$000REVENUEUser charges 20 20 21 21Other revenue 158 243 251 259Total revenue 178 263 272 280EXPENDITUREEmployee costs 614 709 727 746Support costs 460 586 605 626Operating costs 1,396 1,420 1,422 1,471RATES FUNDING REQUIREMENTSurplus/(deficit) (2,292) (2,452) (2,482) (2,563)Total rates funding requirement (2,292) (2,452) (2,482) (2,563)TOTAL FUNDING REQUIREMENT (2,292) (2,452) (2,482) (2,563)Total expenditure 2,470 2,715 2,754 2,843DEFICIT BEFORE TAX (2,292) (2,452) (2,482) (2,563)
1126. PROPERTYPROSPECTIVE INCOME STATEMENTPROSPECTIVE FUNDING REQUIREMENTFor the year ending 30 JuneEstimate2009$000Budget2010$000Forecast2011$000Forecast2012$000For the year ending 30 JuneEstimate2009$000Budget2010$000Forecast2011$000Forecast2012$000REVENUEUser charges 751 959 1,036 1,066Capital contributions 350 350 – –Total revenue 1,101 1,309 1,036 1,066EXPENDITURESupport costs (1,211) (1,303) (1,345) (1,393)Operating costs 2,733 2,675 2,708 2,784Interest expense 375 282 237 190Depreciation 1,356 1,878 1,779 1,752Total expenditure 3,253 3,532 3,379 3,333DEFICIT BEFORE TAX (2,152) (2,223) (2,343) (2,267)RATES FUNDING REQUIREMENTSurplus/(deficit) (2,152) (2,223) (2,343) (2,267)Add capital contributions (350) (350) – –Total rates funding requirement (2,502) (2,573) (2,343) (2,267)LOAN FUNDING REQUIREMENTCapital expenditure –maintaining services (599) (417) (467) (422)Capital expenditure –improving services (1,470) (2,473) (935) (1,109)Less capital contributions 350 350 – –Less depreciation 1,356 1,878 1,779 1,752Less asset sales 2,400 6,870 12,403 2,831Total loan funding surplus 2,037 6,208 12,780 3,052TOTAL FUNDING REQUIREMENT (465) 3,635 10,437 785
hutt city <strong>community</strong> <strong>plan</strong> 113Group Utility servicesCAPITAL PROJECTSFor the year ending 30 June 2010$0002011$0002012$0002013$0002014$0002015$0002016$0002017$0002018$0002019$0007. ROADING AND TRAFFICMaintenanceCarpark Resurfacing $51 $53 $54 $56 $57 $58 $60 $61 $63 $64Footpath Resurfacing & Replacement $205 $212 $218 $223 $229 $235 $240 $246 $252 $258Minor Road & Footpath Construction $72 $74 $76 $78 $80 $82 $84 $86 $88 $91Minor Safety Works (Subsidy: 58%) $51 $53 $54 $56 $57 $58 $60 $61 $63 $64Pavement Surfacing (Subsidy: 48%) $4,640 $4,705 $4,328 $3,673 $3,764 $3,855 $3,943 $4,041 $4,142 $4,243Pavements – Area Wide Pavement Treatment (Subsidy: 48%) $1,255 $1,526 $2,201 $2,453 $2,513 $2,574 $2,633 $2,698 $2,765 $2,833Pavements – Road Smoothing (Subsidy: 58%) $867 $888 $909 $930 $953 $977 $1,001Pavements – Wainuiomata Hill Rd Safety Seal (Subsidy: 58%) $570 $578 $615 $600 $614 $629 $644 $659 $676 $692Parking Pay & Display Extension $335 $343 $351Pedestrian Crossing Renewal (Subsidy: 58%) $31 $32 $33 $34 $35 $35 $36 $37 $38 $39Road Reconstruction (Heretaunga Street) (Subsidy: 18%) $431Road Reconstruction (Outyears) (Subsidy: 18%) $462 $455 $466 $488 $500Street Name Sign Replacement (Subsidy: 48%) $20 $21 $21 $22 $22 $23 $23 $24 $25 $25Streetlight Lantern Replacement Programme (Subsidy: 48%) $51 $53 $54 $56 $57 $58 $60 $61 $63 $64Streetlight Standard Replacement (Subsidy: 48%) $20 $21 $21 $22 $22 $23 $23 $24 $25 $25Traffic Signal Replacement (Subsidy: 48%) $150 $155 $159 $164 $184 $194 $199 $204 $209 $214New/ImprovementsBridge Seismic Strengthening (<strong>Hutt</strong> Road Overbridge) (Subsidy: 58%) $531Bridge Seismic Strengthening (Wingate/ Wainui Rd/Seaview Rd) (Subsidy: 58%) $402Broadband Ducting $21 $22 $22 $23 $23 $24 $25 $25 $26 $26Connolly Street Stopbank Project (NZTA Subsidy) (Subsidy: 100%) $258 $477 $327Cycleway Network Development (Subsidy: 58%) $351 $363 $372 $383 $392 $402 $411 $421 $431 $442Eastern Bays Walkway (Subsidy: 58%) $279 $76 $78 $80 $82 $84 $86 $88 $91Land Purchase for Roads $85 $10 $11 $11 $11 $11 $12 $12 $12 $13
114For the year ending 30 June 2010$0002011$0002012$0002013$0002014$0002015$0002016$0002017$0002018$0002019$000Local Area Traffic Management (Subsidy: 58%) $51 $53 $54 $56 $57 $58 $60 $61 $63 $64Melling/SH 2 Interchange Upgrade – Associated Works (Subsidy: 58%) $4,797New Pedestrian Crossings (Subsidy: 58%) $51 $53 $54 $56 $57 $58 $60 $61 $63 $64Reconstruction Improvements $83 $85 $89 $92 $96 $98Roading Network Improvements $17,971State Highway 2 Upgrade $50Substandard Road Upgrading (Subsidy: 13%) $450 $517 $273 $279 $286 $293 $300 $307 $315Traffic Safety Improvements (Subsidy: 58%) $350 $413 $424 $436 $447 $458 $468 $480 $492 $504Wainuiomata Hill Summit Bridge (Subsidy: 58%) $849Witako/Waterloo Rd Intersection Improvements (Subsidy: 58%) $2798. WATER SUPPLYMaintenanceBledisloe Crescent Wa<strong>term</strong>ain, Ridermain and Services Renewal Stage 1– Wainuiomata $255Buller Wilkie Wa<strong>term</strong>ain Renewal – Naenae $72Konini Reservoir Roof Upgrade Work $260Main Road Wa<strong>term</strong>ain and Services Renewal Stage 3 – Wainuiomata $347Minor Works – Non Discrete Asset Renewals $150Other Maintenance Projects beyond 2009/10 $1,470 $1,699 $1,798 $1,904 $2,007 $2,059 $2,115 $2,169 $2,701Pharazyn Street Pumping Station Renewal $150 $153Pumping Stations Minor Works $43 $47 $52 $53 $54 $56 $57 $59 $60 $62Reservoir Hatch Security $25Reservoir Minor Works $67 $36 $52 $39 $214 $126 $54 $43 $48 $62Scada Renewal $26 $26 $26 $27 $27 $28 $29 $176 $30 $37Woodvale Grove Wa<strong>term</strong>ain, Ridermain and Services Renewal – Eastern <strong>Hutt</strong> $120New/ImprovementsReservoir Construction Eastern Bays Stage 1 – Design and Consents Fees $181Emergency Supply Point (Valving) $85Emergency Water Storage Tanks $163Trunk Wa<strong>term</strong>ain Connection – Kelson/Fairway $372
hutt city <strong>community</strong> <strong>plan</strong> 115For the year ending 30 June 2010$0002011$0002012$0002013$0002014$0002015$0002016$0002017$0002018$0002019$000Reservoir Upgrade – Normandale $153 $361 $1,606Trunk Wa<strong>term</strong>ain Connection – Petone/<strong>Hutt</strong> (Tama North) $573Reservoir Seismic Strengthening – Delaney Reservoir $726Reservoir Seismic Strengthening – Kingsley Reservoir $573Reservoir Seismic Strengthening – Konini Reservoir $690Reservoir Seismic Strengthening – Taita Reservoir $708Reservoir Upgrade – Sweetacres $1,187Wa<strong>term</strong>ain Upgrade – Sweetacres Drive $6149. WASTEWATERMaintenanceCambridge Terrace Sewer Renewal $94Leighton Avenue Sewer Renewal $1,600Leighton Avenue Sewer Renewal Carryover $380Local Pumping Stations Minor Works $82 $82 $83 $85 $87 $89 $92 $94 $96 $99Minor Works Non Discrete Asset Renewals $170Pressure Testing of Sewers $300Scada – Renewal $27 $27 $27 $28 $28 $29 $30 $235 $31 $32Other Maintenance Projects beyond 2009/10 $2,246 $2,305 $2,407 $2,598 $2,901 $3,355 $3,948 $4,348 $4,459Trunk DBO Asset Replacement Fund (Subsidy: 25%) $740 $1,133 $1,156 $1,179 $1,209 $1,206 $859 $881 $904 $927Trunk DBO Network Cyclic Replacement (Subsidy: 31%) $306 $312 $319 $327 $335 $344 $705 $371Trunk Non DBO Minor Works Asset Renewals (Subsidy: 30%) $10Trunk Resource Consent Renewals (Subsidy: 30%) $52 $106 $54 $124Waiwhetu Stream Syphon Crossing Sewer Renewal (In Association with theWaiwhetu Project) $90New/ImprovementsMalone Road Catchment Capacity Improvement $300Pumping Station Mahina Bay Flowmeter Installation $18Resource Consent – Malone Road & Hinemoa Street $41
116For the year ending 30 June 2010$0002011$0002012$0002013$0002014$0002015$0002016$0002017$0002018$0002019$000Trunk DBO Pipeline Cyclic Replacement $90Trunk Non-DBO Pumping Station Te Marua Flow Meter Installation (Subsidy: 32%) $18Trunk Type A Asset Development (Subsidy: 32%) $350 $357 $364 $212 $218 $223 $229 $235 $301 $803Trunk Type B Network Development (Subsidy: 32%) $350 $266 $708 $503 $3,265 $235 $241 $247Type A Network Development Carryover (Subsidy: 37%) $300Type B Network Development Carryover (Subsidy: 37%) $25010. STORMWATERMaintenanceMinor Works Non Discrete Asset Renewals $120Pine Tree Lane/Korokoro Stormwater Renewal $110Scada Renewal $26 $36 $26 $27 $27 $28 $29 $176 $30 $31Other Maintenance Projects beyond 2009/10 $475 $503 $539 $584 $637 $698 $772 $792 $757Pumping Stations Minor Works $77 $77 $78 $80 $82 $84 $86 $88 $90 $93Udy Street (Richmond Street to Britannia Street) Stormwater Renewal $165Waiwhetu Stream Stormwater Outlets Renewals (In Association with theWaiwhetu Project) $68New/ImprovementsAdelaide Street Stormwater Upgrade $473Ariki Street Stormwater Upgrade $321Awamutu Stream Stormwater Upgrade $431 $1,399 $849 $2,098 $1,819 $45 $286Beach Stormwater Outlets Upgrade $482Black Creek Stage 3 Bridges Upgrade $206 $1,634 $802Boulcott Stopbank Project – HCC Contribution $255 $260 $319East Street/Petone Stormwater Upgrade $103Es<strong>plan</strong>ade Stormwater Upgrade $411Heketara Street/Pukatea Street Stormwater Upgrade $736<strong>Hutt</strong> River Backflow Electrical Stormwater Upgrade $218 $229 $241<strong>Hutt</strong> River Floodplain Stormwater Outlets Upgrade $289 $272 $286Jessie Street/Petone Stormwater Upgrade $368Manuka Street Stormwater Upgrade $625
hutt city <strong>community</strong> <strong>plan</strong> 117For the year ending 30 June 2010$0002011$0002012$0002013$0002014$0002015$0002016$0002017$0002018$0002019$000Melling Road Pumping Station Installation $618Moera Street Stormwater Upgrade $422Percy Cameron Stormwater Upgrade $411Queen Street Stormwater Upgrade $744Rutherford Street Pumping Station Installation $618Victoria Street/Humes Street Stormwater Upgrade $392 $235Waiwhetu Stream Contribution to Remediation (In Association with theWaiwhetu Project) $1,500 $1,532Walter Road Stormwater Upgrade $35311. SOLID WASTENew/ImprovementsCleanfill Site Development $20 $21Silverstream Landfill Stage Two $600 $1,673 $1,869 $1,640 $767 $1,427 $950 $1,207 $1,993 $1,474Wainuiomata Landfill – Closure Costs $383OPERATING PROJECTSFor the year ending 30 June 2010$0007. ROADING AND TRAFFICCross Valley Link Study $1509. WASTEWATERDBO Main Outfall Leak Invest & Repairs $300
1187. ROADING AND TRAFFICPROSPECTIVE INCOME STATEMENTPROSPECTIVE FUNDING REQUIREMENTFor the year ending 30 JuneEstimate2009$000Budget2010$000Forecast2011$000Forecast2012$000For the year ending 30 JuneEstimate2009$000Budget2010$000Forecast2011$000Forecast2012$000REVENUEUser charges 3,177 3,194 3,299 3,388Operating contributions 3,127 3,351 3,461 3,555Capital contributions 3,430 4,012 4,446 5,488Other revenue 530 520 537 552Total revenue 10,264 11,077 11,743 12,983EXPENDITUREEmployee costs 1,034 1,089 1,117 1,145Support costs 2,064 2,214 2,284 2,366Operating costs 9,818 10,030 10,185 10,461Interest expense 1,985 1,490 1,254 1,007Depreciation 7,294 8,688 8,618 8,653Total expenditure 22,195 23,511 23,458 23,632RATES FUNDING REQUIREMENTSurplus/(deficit) (11,931) (12,434) (11,715) (10,649)Add capital contributions (3,430) (4,012) (4,446) (5,488)Total rates funding requirement (15,361) (16,446) (16,161) (16,137)LOAN FUNDING REQUIREMENTCapital expenditure –maintaining services (6,398) (7,116) (7,482) (8,265)Capital expenditure –improving services (1,124) (1,409) (2,049) (2,956)Less capital contributions 3,430 4,012 4,446 5,488Less depreciation 7,294 8,688 8,618 8,653Total loan funding surplus 3,202 4,175 3,533 2,920TOTAL FUNDING REQUIREMENT (12,159) (12,271) (12,628) (13,217)DEFICIT BEFORE TAX (11,931) (12,434) (11,715) (10,649)
hutt city <strong>community</strong> <strong>plan</strong> 1198. WATER SUPPLYPROSPECTIVE INCOME STATEMENTPROSPECTIVE FUNDING REQUIREMENTFor the year ending 30 JuneEstimate2009$000Budget2010$000Forecast2011$000Forecast2012$000For the year ending 30 JuneEstimate2009$000Budget2010$000Forecast2011$000Forecast2012$000REVENUEUser charges 2,295 2,260 2,307 2,354Capital contributions 48 115 124 137Total revenue 2,343 2,375 2,431 2,491EXPENDITURESupport costs 326 306 316 327Operating costs 8,987 9,406 9,604 9,796Interest expense 685 515 433 348Depreciation 2,615 2,923 2,872 2,841Total expenditure 12,613 13,150 13,225 13,312DEFICIT BEFORE TAX (10,270) (10,775) (10,794) (10,821)RATES FUNDING REQUIREMENTSurplus/(deficit) (10,270) (10,775) (10,794) (10,821)Add capital contributions (48) (115) (124) (137)Total rates funding requirement (10,318) (10,890) (10,918) (10,958)LOAN FUNDING REQUIREMENTCapital expenditure –maintaining services (907) (1,515) (1,732) (1,829)Capital expenditure –improving services (665) – – –Less capital contributions 48 115 124 137Less depreciation 2,615 2,923 2,872 2,841Total loan funding surplus 1,091 1,523 1,264 1,149TOTAL FUNDING REQUIREMENT (9,227) (9,367) (9,654) (9,809)
1209. WASTEWATERPROSPECTIVE INCOME STATEMENTPROSPECTIVE FUNDING REQUIREMENTFor the year ending 30 JuneEstimate2009$000Budget2010$000Forecast2011$000Forecast2012$000For the year ending 30 JuneEstimate2009$000Budget2010$000Forecast2011$000Forecast2012$000REVENUEUser charges 742 788 804 820Capital contributions 195 260 331 454Upper <strong>Hutt</strong> CC operating contribution 2,154 2,165 2,211 2,151Total revenue 3,091 3,213 3,346 3,425EXPENDITURESupport costs 582 520 536 555Operating costs 9,715 9,964 10,174 10,065Interest expense 1,281 962 810 650Depreciation 5,771 6,174 6,184 6,136Total expenditure 17,349 17,620 17,704 17,406DEFICIT BEFORE TAX (14,258) (14,407) (14,358) (13,981)RATES FUNDING REQUIREMENTSurplus/(deficit) (14,258) (14,407) (14,358) (13,981)Add capital contributions (195) (260) (331) (454)Total rates funding requirement (14,453) (14,667) (14,689) (14,435)LOAN FUNDING REQUIREMENTCapital expenditure –maintaining services (3,314) (3,113) (3,794) (3,936)Capital expenditure –improving services (1,689) (2,061) (393) (364)Less capital contributions 195 260 331 454Less UHCC capital contribution 578 629 524 529Less depreciation 5,771 6,174 6,184 6,136Total loan funding surplus 1,541 1,889 2,852 2,819TOTAL FUNDING REQUIREMENT (12,912) (12,778) (11,837) (11,616)
hutt city <strong>community</strong> <strong>plan</strong> 12110. STORMWATERPROSPECTIVE INCOME STATEMENTPROSPECTIVE FUNDING REQUIREMENTFor the year ending 30 JuneEstimate2009$000Budget2010$000Forecast2011$000Forecast2012$000For the year ending 30 JuneEstimate2009$000Budget2010$000Forecast2011$000Forecast2012$000REVENUEUser charges 2 2 – –Operating contributions 7 7 7 7Capital contributions 101 166 196 248Total revenue 110 175 203 255EXPENDITURESupport costs 317 296 305 316Operating costs 2,596 2,560 2,614 2,666Interest expense 767 576 485 389Depreciation 2,240 2,534 2,540 2,570Total expenditure 5,920 5,966 5,944 5,941DEFICIT BEFORE TAX (5,810) (5,791) (5,741) (5,686)RATES FUNDING REQUIREMENTSurplus/(deficit) (5,810) (5,791) (5,741) (5,686)Add capital contributions (101) (166) (196) (248)Total rates funding requirement (5,911) (5,957) (5,937) (5,934)LOAN FUNDING REQUIREMENTCapital expenditure – maintainingservices (488) (566) (587) (607)Capital expenditure – improvingservices (998) (2,426) (4,819) (2,536)Less capital contributions 101 166 196 248Less depreciation 2,240 2,534 2,540 2,570Total loan funding surplus 855 (292) (2,670) (325)TOTAL FUNDING REQUIREMENT (5,056) (6,249) (8,607) (6,259)
12211. SOLID WASTEPROSPECTIVE INCOME STATEMENTPROSPECTIVE FUNDING REQUIREMENTFor the year ending 30 JuneEstimate2009$000Budget2010$000Forecast2011$000Forecast2012$000For the year ending 30 JuneEstimate2009$000Budget2010$000Forecast2011$000Forecast2012$000REVENUEUser charges 11,810 13,901 12,693 12,686Total revenue 11,810 13,901 12,693 12,686EXPENDITURESupport costs 116 125 129 134Operating costs 6,451 6,341 6,551 6,773Depreciation 769 393 406 447Total expenditure 7,336 6,859 7,086 7,354SURPLUS BEFORE TAX 4,474 7,042 5,607 5,332RATES FUNDING REQUIREMENTSurplus/(deficit) 4,474 7,042 5,607 5,332Total rates funding requirement 4,474 7,042 5,607 5,332LOAN FUNDING REQUIREMENTCapital expenditure –improving services (620) (620) (1,694) (1,869)Less depreciation 769 393 406 447Total loan funding surplus 149 (227) (1,288) (1,422)TOTAL FUNDING REQUIREMENT 4,623 6,815 4,319 3,910
hutt city <strong>community</strong> <strong>plan</strong> 123group EnvironmentCapital ProjectsFor the year ending 30 June 2010$0002011$0002012$0002013$0002014$0002015$0002016$0002017$0002018$0002019$00012. ENVIRONMENTAL MANAGEMENTMaintenanceParking Handhelds Replacement $3613. EMERGENCY MANAGEMENTMaintenanceWainuiomata Bush Fire Force Vehicle $93 $98New/ImprovementsWainuiomata Bush Fire Force Headquarters $413OPERATING PROJECTSFor the year ending 30 June 2010$00012. ENVIRONMENTAL MANAGEMENTDistrict Plan Projects $25
12412. ENVIRONMENTAL MANAGEMENTPROSPECTIVE INCOME STATEMENTPROSPECTIVE FUNDING REQUIREMENTFor the year ending 30 JuneEstimate2009$000Budget2010$000Forecast2011$000Forecast2012$000For the year ending 30 JuneEstimate2009$000Budget2010$000Forecast2011$000Forecast2012$000REVENUEUser charges 3,939 3,704 4,239 4,383Other revenue 137 176 181 187Total revenue 4,076 3,880 4,420 4,570EXPENDITUREEmployee costs 4,228 4,993 5,123 5,253Support costs 1,676 1,724 1,779 1,843Operating costs 2,015 2,077 2,120 2,192Depreciation 4 2 2 2Total expenditure 7,923 8,796 9,024 9,290RATES FUNDING REQUIREMENTSurplus/(deficit) (3,847) (4,916) (4,604) (4,720)Total rates funding requirement (3,847) (4,916) (4,604) (4,720)LOAN FUNDING REQUIREMENTCapital expenditure –maintaining services (32) – – –Less depreciation 4 2 2 2Total loan funding surplus (28) 2 2 2TOTAL FUNDING REQUIREMENT (3,875) (4,914) (4,602) (4,718)DEFICIT BEFORE TAX (3,847) (4,916) (4,604) (4,720)
hutt city <strong>community</strong> <strong>plan</strong> 12513. EMERGENCY MANAGEMENTPROSPECTIVE INCOME STATEMENTPROSPECTIVE FUNDING REQUIREMENTFor the year ending 30 JuneEstimate2009$000Budget2010$000Forecast2011$000Forecast2012$000For the year ending 30 JuneEstimate2009$000Budget2010$000Forecast2011$000Forecast2012$000REVENUEOperating contributions 52 52 54 56Upper <strong>Hutt</strong> CC operating contribution 304 316 327 338Total revenue 356 368 381 394EXPENDITUREEmployee costs 425 422 433 444Support costs 288 226 233 242Operating costs 313 352 364 376Depreciation 21 26 54 79Total expenditure 1,047 1,026 1,084 1,141DEFICIT BEFORE TAX (691) (658) (703) (747)RATES FUNDING REQUIREMENTSurplus/(deficit) (691) (658) (703) (747)Total rates funding requirement (691) (658) (703) (747)LOAN FUNDING REQUIREMENTCapital expenditure –maintaining services – – (93) –Capital expenditure –improving services – – (413) –Less depreciation 21 26 54 79Total loan funding surplus 21 26 (452) 79TOTAL FUNDING REQUIREMENT (670) (632) (1,155) (668)
126GROUP ECONOMYCAPITAL PROJECTSFor the year ending 30 June 2010$0002011$0002012$0002013$0002014$0002015$0002016$0002017$0002018$0002019$00014. LOCAL URBAN ENVIRONMENTMaintenanceSeaview/Gracefield Banners $31 $32 $33 $34 $35 $35 $36 $37 $38 $39New/ImprovementsCBD Making Places $130 $961 $566CCTV Upgrades Central Area, & Installation Wainuiomata $50 $52 $53Naenae Subway Improvements (up to 50% contribution) $534Suburban Shopping Centre Improvements $586 $213 $220 $225 $231 $236 $242 $247 $253 $260Suburban Shopping Centre Improvements (Stokes Valley) $100Wingate Development Plan $294OPERATING PROJECTSFor the year ending 30 June 2010$00014. LOCAL URBAN ENVIRONMENTBusiness Programmes $36Energy Efficient Projects $98Heritage Incentives $130Heritage Project Fund $25Rapid Response Anti-Graffiti Service $150School Programmes $38Urban Form $10Waste Minimisation Projects $59For the year ending 30 June 2010$00015. ECONOMIC DEVELOPMENTBusiness <strong>Hutt</strong> Valley $254CBD Coordinator $30International Co-operating Cities $30Jackson Street Programme $100Positively Wellington Tourism $20Retail Co-ordinator $55
hutt city <strong>community</strong> <strong>plan</strong> 12714. LOCAL URBAN ENVIRONMENTPROSPECTIVE INCOME STATEMENTPROSPECTIVE FUNDING REQUIREMENTFor the year ending 30 JuneEstimate2009$000Budget2010$000Forecast2011$000Forecast2012$000For the year ending 30 JuneEstimate2009$000Budget2010$000Forecast2011$000Forecast2012$000REVENUECapital contributions 7 7 7 7Other revenue – 360 – –Total revenue 7 367 7 7EXPENDITUREEmployee costs 111 450 461 473Support costs 165 178 183 190Operating costs 731 649 351 363Interest expense 6 4 4 3Depreciation 280 310 330 390Total expenditure 1,293 1,591 1,329 1,419DEFICIT BEFORE TAX (1,286) (1,224) (1,322) (1,412)RATES FUNDING REQUIREMENTSurplus/(deficit) (1,286) (1,224) (1,322) (1,412)Add capital contributions (7) (7) (7) (7)Total rates funding requirement (1,293) (1,231) (1,329) (1,419)LOAN FUNDING REQUIREMENTCapital expenditure –maintaining services (31) (31) (32) (33)Capital expenditure –improving services (1,281) (1,160) (1,225) (1,373)Less capital contributions 7 7 7 7Less depreciation 280 310 330 390Total loan funding surplus (1,025) (874) (920) (1,009)TOTAL FUNDING REQUIREMENT (2,318) (2,105) (2,249) (2,428)
12815. ECONOMIC DEVELOPMENTPROSPECTIVE INCOME STATEMENTPROSPECTIVE FUNDING REQUIREMENTFor the year ending 30 JuneEstimate2009$000Budget2010$000Forecast2011$000Forecast2012$000For the year ending 30 JuneEstimate2009$000Budget2010$000Forecast2011$000Forecast2012$000REVENUEUser charges 275 303 312 323Operating contributions 155 139 144 149Other revenue 12 13 14 14Total revenue 442 455 470 486RATES FUNDING REQUIREMENTSurplus/(deficit) (1,713) (1,605) (1,610) (1,658)Total rates funding requirement (1,713) (1,605) (1,610) (1,658)TOTAL FUNDING REQUIREMENT (1,713) (1,605) (1,610) (1,658)EXPENDITUREEmployee costs 609 572 586 601Support costs 409 408 422 437Operating costs 1,120 1,067 1,061 1,097Interest expense 17 13 11 9Total expenditure 2,155 2,060 2,080 2,144DEFICIT BEFORE TAX (1,713) (1,605) (1,610) (1,658)
hutt city <strong>community</strong> <strong>plan</strong> 129group organisationCapITal projectsFor the year ending 30 June 2010$0002011$0002012$0002013$0002014$0002015$0002016$0002017$0002018$0002019$00018. MANAGING SERVICESMaintenanceArchives Accommodation Changes $160 $240Core Financial & Regulatory System Replacement/Upgrade $200 $107 $229 $469 $120Corporate Application/Hardware Replacement $185 $460 $491 $284 $218 $315 $452 $1,081 $633 $617Desktop Operating System Upgrade $150 $168 $185Enterprise/Technical Architecture $40 $41 $43 $22 $22 $23 $59 $24 $25 $25General Office Expenditure $30 $31 $32 $33 $34 $34 $35 $36 $37 $38LIS Aerial Photos Renewal $31 $295 $34 $324 $38Network Replacement $30 $36 $5 $5 $6 $69 $23 $24 $25 $25Online Service Delivery to <strong>Council</strong> Staff $40 $26 $27 $27 $28 $29 $29 $30 $31 $32Other IS Projects $344 $352 $360 $369 $378PC Replacement Programme $225 $269 $240 $246 $291 $258 $264 $312 $277 $284Printer Replacement Programme $68 $29 $43 $32 $33Replace/Upgrade Library System $55 $504 $115 $126Server Replacement, IT Storage & Disaster Recovery $115 $119 $37 $164 $78 $40 $41 $84 $43 $44Software Purchases $103 $62 $43 $44 $45 $46 $70 $48 $49 $50Telecommunications $40 $62 $128 $22 $11 $11 $23 $144 $12 $13New/ImprovementsAdditional Network Requirements $10 $10 $11 $11 $11 $11 $12 $12 $12 $13Core Business Applications Enhancements $820 $331 $256 $219 $224 $229 $235 $240 $246 $252Digitisation of <strong>Council</strong> Core Information $1,093 $57 $2 $11 $2 $63 $3 $3 $3 $69Internet – Online Services $210 $62 $85 $87 $56 $92 $94 $96 $98 $101Mobile Devices $50 $75 $53 $56 $76 $81 $16 $107 $81 $57Telecommunications Upgrade $10
130OPERATING PROJECTSFor the year ending 30 June 2010$00018. MANAGING SERVICESInternet Design $40Quality of Life Study $15Research – Monitoring & Evaluation of Outcomes $7016. ELECTED MEMBERSPROSPECTIVE INCOME STATEMENTFor the year ending 30 JuneEstimate2009$000Budget2010$000Forecast2011$000Forecast2012$000REVENUEUser charges – 4 4 4Total revenue – 4 4 4EXPENDITUREEmployee costs 943 914 938 962Support costs 533 704 727 753Operating costs 181 197 203 210Total expenditure 1,657 1,815 1,868 1,925DEFICIT BEFORE TAX (1,657) (1,811) (1,864) (1,921)PROSPECTIVE FUNDING REQUIREMENTFor the year ending 30 JuneEstimate2009$000Budget2010$000Forecast2011$000Forecast2012$000RATES FUNDING REQUIREMENTSurplus/(deficit) (1,657) (1,811) (1,864) (1,921)Total rates funding requirement (1,657) (1,811) (1,864) (1,921)TOTAL FUNDING REQUIREMENT (1,657) (1,811) (1,864) (1,921)
hutt city <strong>community</strong> <strong>plan</strong> 13117. ADVICE AND SUPPORTPROSPECTIVE INCOME STATEMENTPROSPECTIVE FUNDING REQUIREMENTFor the year ending 30 JuneEstimate2009$000Budget2010$000Forecast2011$000Forecast2012$000For the year ending 30 JuneEstimate2009$000Budget2010$000Forecast2011$000Forecast2012$000REVENUEOperating contributions (6) 6 – –Other revenue – – 145 –Total revenue (6) 6 145 –EXPENDITURESupport costs 3,710 3,868 3,991 4,134Operating costs 70 35 346 37RATES FUNDING REQUIREMENTSurplus/(deficit) (3,786) (3,897) (4,192) (4,171)Transfers from/(to) funds – operating (50) 103 (53) (54)Total rates funding requirement (3,836) (3,794) (4,245) (4,225)TOTAL FUNDING REQUIREMENT (3,836) (3,794) (4,245) (4,225)Total expenditure 3,780 3,903 4,337 4,171DEFICIT BEFORE TAX (3,786) (3,897) (4,192) (4,171)
13218. MANAGING SERVICESPROSPECTIVE INCOME STATEMENTPROSPECTIVE FUNDING REQUIREMENTFor the year ending 30 JuneEstimate2009$000Budget2010$000Forecast2011$000Forecast2012$000For the year ending 30 JuneEstimate2009$000Budget2010$000Forecast2011$000Forecast2012$000REVENUEGeneral rates & other rate charges 77,570 80,087 82,260 84,409User charges (92) 856 888 922Operating contributions 142 – – –Capital contributions 361 – – –Interest on investments 152 150 (33) 35Other revenue 490 128 133 138Total revenue 78,623 81,221 83,248 85,504EXPENDITUREEmployee costs 7,743 7,883 8,089 8,293Support costs (13,376) (13,745) (14,182) (14,690)Operating costs 2,891 3,329 3,461 3,663Interest expense (348) (49) (75) 1Depreciation 1,084 1,466 1,368 1,419Total expenditure (2,006) (1,116) (1,339) (1,314)RATES FUNDING REQUIREMENTSurplus/(deficit) 80,629 82,337 84,587 86,818Add capital contributions (361) – – –Rate funded debt repayment 1,130 1,895 792 (450)Total rates funding requirement 81,398 84,232 85,379 86,369LOAN FUNDING REQUIREMENTCapital expenditure –maintaining services (1,197) 429 (1,045) (1,198)Capital expenditure –improving services (1,686) (897) (607) 29Less capital contributions 361 – – –Less depreciation 1,086 1,465 1,368 1,419Less rate funded debt repayment (1,130) (1,895) (792) 450Total loan funding surplus (2,566) (898) (1,076) 700TOTAL FUNDING REQUIREMENT 78,832 83,334 84,303 87,068SURPLUS BEFORE TAX(INCL RATES) 80,629 82,337 84,587 86,818
hutt city <strong>community</strong> <strong>plan</strong> 133Forecast FinancialStatementsFunding ImpactStatementRates for 2009/10Information about <strong>Council</strong>’s Forecast FinancialStatements can be found from page 187.This includes:ÎÎsignificant assumptionsÎÎsignificant risksÎÎcommitments and contingenciesÎÎ<strong>Council</strong> net debtÎÎ<strong>Council</strong> rates incomeÎÎfull financial tablesÎÎa summary of significant accounting policies toaccompany the Forecast Financial Statements.The Funding Impact Statement outlines all thefunding mechanisms we intend using and theamount of money each mechanism will produce.You can read it on page 213.A schedule of rates for 2009/10 including the amountfor each rate and charge, and examples of rates ona range of typical properties, can be found frompage 214.fees and chargesA schedule of user fees and charges can be foundfrom page 218.
A <strong>community</strong> approach makes a differenceMore than 80 volunteers from the Naenae <strong>community</strong> joined <strong>Council</strong>staff for Big Splash Naenae’ , , a challenge to paint 20 local shops in12 hours. The Naenae shops needed a good spruce-up, and we thought thepaintathon would be a great way to get the <strong>community</strong> together to createsomething positive. The shops are very much the heart of the <strong>community</strong>and it was a great way for people to have a good time while making adifference in Naenae ,, explains <strong>Council</strong> staffer Joanna.
Achieving Our CommunityOutcomes: Measuring Progress
136Achieving our <strong>community</strong> outcomes: measuring progressOnce our <strong>plan</strong>s are finalised and projects and programmes are underway, it’s vital that we track theirprogress to check that they’re helping us to achieve our <strong>community</strong> outcomes.We already have a well established process formonitoring each of our 18 key activities. Every year,once the annual budgeting process is complete, eacharea of <strong>Council</strong> produces and finalises a Business Plan.The Plans include key tasks and objectives for the year,and a range of performance measures and targets foreach activity.We use a number of techniques to monitor progress.For example:ÎÎwe commission public perception surveys such asthe NRB Communitrak Survey and the Quality ofLife Survey. We use the results to help report on theperformance measures and targets for each activity.ÎÎour officers report monthly, quarterly and annually onprogress towards our ‘key performance indicators’and other targets and measures. You can read thequarterly and annual reports at www.huttcity.govt.nz.Progress on achieving our <strong>community</strong>outcomes 2003-2006Every local authority is required to monitor and, atleast once every three years, report on the progressits <strong>community</strong> has made in achieving its <strong>community</strong>outcomes. We produced our first report in 2007(covering 2003 to 2006).Here’s a quick summary of the 2007 report; if you’d liketo read the full version, please visit www.huttcity.govt.nz.As this was our first report on progress towardsachieving <strong>community</strong> outcomes, the detailed resultswill be used as our baseline data against which futurereporting will be undertaken.Clean air, water and landResidents’ perceptions indicated that they wereconcerned about air pollution, and to a greaterextent water pollution.Air quality monitoring indicated issues in Wainuiomata,particularly during the winter months, and confirmedthat pollution incidents relating to odour were the mostcommon. Water quality monitoring also identified someissues, although drinking water quality was assessed assatisfactory, with a very low level of risk when the waterleft the treatment <strong>plan</strong>t.Access to services that improve health<strong>Hutt</strong> <strong>City</strong> had fewer general practitioners (GPs) per100,000 of population compared with the rest ofNew Zealand, but the introduction of primary healthorganisations (PHOs) had made primary health carein the <strong>Hutt</strong> Valley considerably more affordablethan previously.The meningococcal B campaign achieved well abovethe national average coverage rate. The number ofbeds available for elderly care increased over theprevious four years, although the elderly populationhad also increased in this time.Safety in the cityThe road toll for <strong>Hutt</strong> <strong>City</strong> reduced. While recordedcrime appeared to rise between 2005 and 2006, thesefigures were still declining when compared with 2003and 2004.Results from the closed circuit television project in theCBD were very promising. The perception of safety inthe <strong>community</strong> falls dramatically after dark. Sixty percent of residents agreed they felt a sense of <strong>community</strong>in their local neighbourhood, and most felt that greatercultural diversity had made the city a better place.
hutt city <strong>community</strong> <strong>plan</strong> 137The number of residents gaining citizenship increasedconsiderably, but voter turnout decreased from the2001 to the 2004 elections from 46% to 39%.Affordable access to educational servicesIn most education categories the highest qualificationlevel attained was higher than the national average.<strong>Hutt</strong> <strong>City</strong> compared favourably with its neighbours (withthe exception of Wellington <strong>City</strong>) in the percentage ofschool leavers qualified to attend university. Earlychildhood education attendance was higher thanthe national average, with the percentage of nonattendancein <strong>Hutt</strong> <strong>City</strong> lower than the national average.Standard of affordable housingThere was a steady rise in the median house sale pricein <strong>Hutt</strong> <strong>City</strong>, an increase in the mean rent for properties,and a decline in home affordability. Private landlordsowned most of the rental housing in <strong>Hutt</strong> <strong>City</strong>. HousingNew Zealand Corporation owned just under 30% of therental properties, providing guaranteed income-relatedrents for the most needy of <strong>Hutt</strong> <strong>City</strong>’s residents.The local economyThe number of businesses in <strong>Hutt</strong> <strong>City</strong> increasedsignificantly, with a considerable rise in the numberof employees, apart from those in the educationsector. There was a sharp decline in unemployment.Affordable access to <strong>community</strong> facilities<strong>Council</strong>-provided facilities (including arts, culturaland recreational options) enjoyed high levels of useand satisfaction.A diverse, accessible, enjoyable and safenatural environmentAlmost all residents found it easy to access a local parkor other green space. A range of biodiversity-relatedprojects had been started and were ongoing.Balancing natural and built environmentsSixty per cent of residents felt a sense of pride in thecity, with 88% satisfied with its overall look and feel.Progress on achieving our <strong>community</strong>outcomes: 2006 onwardsWhen <strong>Hutt</strong> <strong>City</strong>’s <strong>community</strong> outcomes were realignedto the Wellington regional outcomes in 2006, they werealso updated. At the same time, we reviewed ourmeasurement tools (indicators) and introduced somenew ones. These were used in preparing our firstmonitoring report in 2007 and our EnvironmentalSustainability and Economic Development Strategies,and include the key performance indicators that willbe used to assess progress against the targets setfor these two key strategies.We’re now developing an ‘integrated monitoringprogramme’ based on the ‘Anticipated EnvironmentalResults’ (AER) identified in each chapter of ourDistrict Plan and the <strong>community</strong> outcomes fromour 10-year <strong>plan</strong>.Our next report will use this integrated approachand we’ll use the information in it when <strong>plan</strong>ningand prioritising projects for the future. It will alsocontribute to the next review of <strong>community</strong> outcomes,which is required no later than 2012.
Getting fit at the swim-gymA member of the Fitness Suite at Naenae Pool since August 2008,Haruru Ward is already feeling the benefits of being part of the ‘swim-gym , . He , s lost 20 kilos and improved his mobility and overallhealth. I used to come in here with my walking frame because my kneeswere shot - Losing the weight has made a huge difference to how I feel ,, .
Our Community
140Our <strong>community</strong>A huge number of people andorganisations are workingto make <strong>Hutt</strong> <strong>City</strong> a great placeto live, work and play. Here’san introduction to the cityand to the key <strong>Council</strong>-relatedparticipants who workindividually and together.The Lower <strong>Hutt</strong> <strong>community</strong>One of the purposes of local government is to enabledemocratic local decision-making and action by, andon behalf of, communities.We’re delighted that so many residents and ratepayerschoose to work with us on our city’s direction. We usuallyreceive around 1000 submissions on our annual and10-year <strong>plan</strong>s, and residents and ratepayers alsoparticipate in consultation exercises that we organise.It’s a great way to get local contributions to the decisionsthat affect the city’s current and future wellbeing.Let’s take a closer look at the people who make upour city.The New Zealand Census provides a snapshot of how we looked in 2006:PopulationNumber of householdsNorthern Ward 15,288 Northern Ward 5,259Eastern Ward 16,920 Eastern Ward 6,180Western Ward 12,402 Western Ward 4,437Central Ward 18,642 Central Ward 7,209Harbour Ward 17,235 Wainuiomata Ward 5,802Wainuiomata Ward 17,214 Harbour Ward 6,837Total population 97,701 Total households 35,724AgeEthnicity:Under 15 22.9% European 65.0%15 to 24 13.7% Maori 17.0%25 to 44 29.1% Pacific Peoples 11.0%45 to 64 23.4% Asian 9.0%65 and over 10.9% Middle Eastern, Latin American and African 1.0%Other 10.0%Other information from the Census includes gender, highest qualification, personal income and its sources,household income, family types, landlord types, household composition, weekly rent paid, means of transportationto work, cigarette smoking behaviour, household access to motor vehicles, access to telecommunications and arange of other information, all broken down by ward. If you’d like to read it, please contact us.
hutt city <strong>community</strong> <strong>plan</strong> 141<strong>Hutt</strong> <strong>City</strong> <strong>Council</strong>‘<strong>Hutt</strong> <strong>City</strong> <strong>Council</strong>’ was established in 1989 after the amalgamation of the former Lower<strong>Hutt</strong> <strong>City</strong>, Eastbourne Borough, Petone Borough and Wainuiomata District <strong>Council</strong>s,and the <strong>Hutt</strong> Valley Drainage Board. The <strong>Council</strong> area covers the city of Lower <strong>Hutt</strong>.Our purpose is to enable democratic local decision-making in order to promote thesocial, economic, environmental and cultural wellbeing of the city and its residentsin the present and for the future.Our roles include:ÎÎproviding leadership for the cityÎÎadvocating with other agencies on behalf of the local <strong>community</strong>ÎÎadministering and enforcing various pieces of legislation (see page 178)ÎÎensuring the sustainable development of local resourcesÎÎmanaging our local infrastructure sustainablyÎÎenvironmental managementÎÎ<strong>plan</strong>ning for the future needs of the city and its people by developing a strategic visionÎÎtaking responsibility and accountability for the direction and control of our activitieswhile pursuing the outcomes the <strong>community</strong> has identified as priorities.<strong>Hutt</strong> <strong>City</strong> <strong>Council</strong> is governed by a Mayor and 12 <strong>council</strong>lors, with the Mayor electedon a city-wide basis. The city is divided into six wards – Northern, Eastern, Central,Western, Harbour and Wainuiomata – and each has two <strong>council</strong>lors. The <strong>council</strong>lorselected to represent those wards are required to exercise their powers in the bestinterests of the city as a whole.<strong>Council</strong> also works with three <strong>community</strong> boards covering the communities ofEastbourne, Petone and Wainuiomata, and two <strong>community</strong> committees coveringthe Northern & Eastern, and Central & Western wards. You can read more aboutthem on page 143.
142<strong>council</strong>’s committee structureCOUNCILSPECIAL AND JOINT COMMITTEESCOMMUNITY PLAN COMMITTEECivic Honours CommitteeWellington Regional Strategy Committee (GWRC)<strong>Hutt</strong> Valley Services Committee (with UHCC)Regional Land Transport Committee (GWRC)<strong>Hutt</strong> River Advisory Subcommittee (GWRC)Waiwhetu Stream Advisory Subcommittee (GWRC)COMMUNITY BOARDSEastbournePetoneWainuiomataCOMMUNITY COMMITTEESCentral/West Community CommitteeNorth/East Community CommitteeGOVERNANCE COMMITTEESTRATEGY AND POLICY COMMITTEEOPERATIONS AND COMPLIANCE COMMITTEEFINANCE AND AUDIT COMMITTEEdistrict <strong>plan</strong> committeehearings committee<strong>community</strong> grants committee
hutt city <strong>community</strong> <strong>plan</strong> 143<strong>Council</strong> governanceA Code of Conduct applies to <strong>Council</strong> and ourcommittees and subcommittees, and the three<strong>community</strong> boards have also agreed to a code ofconduct. This provides guidance on the standardsof behaviour expected from elected and appointedmembers in their dealings with each other, the ChiefExecutive, staff, the media and the public.<strong>Council</strong> meets approximately six weekly throughoutthe year to monitor management activities and to ensurethat our affairs are being conducted in accordance withlegal requirements and our organisational objectives.The diagram on page 142 shows the committeestructure we’ve set up to monitor and help us withour work. We’re also represented on joint committeesestablished for specific purposes with Upper <strong>Hutt</strong> <strong>City</strong><strong>Council</strong> and Greater Wellington Regional <strong>Council</strong>.We publicly advertise meetings each month; most areopen to the public. Agendas for the meetings of <strong>Council</strong>,our committees, <strong>community</strong> boards and <strong>community</strong>committees are available at www.huttcity.govt.nz andfrom the main <strong>Council</strong> building and city libraries.You can contribute to the meetings by presentingpetitions, being part of deputations and through thepublic comment section, which is generally held forup to 30 minutes at the beginning of each meeting.Community boards and <strong>community</strong>committeesEach <strong>community</strong> board has six members elected bythe <strong>community</strong>, plus two <strong>council</strong>lors from that wardappointed by <strong>Council</strong>. The only exception is theEastbourne Community Board, which has agreedto have only five elected members.The role of a <strong>community</strong> board is to:ÎÎrepresent and act as an advocate for the interestsof its <strong>community</strong>ÎÎconsider and report on any matter referred by<strong>Council</strong> and any issues of interest or concernÎÎmake an annual submission to <strong>Council</strong> onprojects and expenditure in the <strong>community</strong>ÎÎmaintain an overview of services provided by<strong>Council</strong> within the local <strong>community</strong>ÎÎbe a channel of communication between the<strong>community</strong> and <strong>Council</strong>ÎÎundertake any other responsibilities delegatedby <strong>Council</strong>.From now until the 2010 election, we’ve also appointedtwo ‘<strong>community</strong> committees’ covering the Northern andEastern wards, and the Central and Western wards.Non-statutory bodies with similar roles to <strong>community</strong>boards, each committee has five members appointedfrom the <strong>community</strong> plus the four ward <strong>council</strong>lors.Members are appointed according to their skills andexperience, including their ability to support existingresidents’ associations and similar <strong>community</strong> groupsin their areas and engage positively with <strong>Council</strong>.Local Community PlansDuring 2008/09 the <strong>community</strong> boards and <strong>community</strong>committees consulted their local communities anddeveloped initial ‘Local Community Plans’ for theirareas. The process enabled communities to identifyimportant local issues for their longer-<strong>term</strong> <strong>plan</strong>ning.In turn it’s helped us in preparing this 10-year <strong>plan</strong> toclarify the relative priorities of various activities andprojects by affected local communities.The priorities identified in the Local Community Plans areoutlined below. Information has been compiled about thework being done by <strong>Council</strong> to progress these items.The <strong>community</strong> boards and <strong>community</strong> committeeswill regularly discuss this at their scheduled meetings,and public participation is welcomed.Eastbourne Community BoardA <strong>plan</strong> has been developed that sets the scene inEastbourne as it is now, how the <strong>community</strong> perceivesits attributes and values, how it sees itself in 2020 andhow it will achieve this. An action <strong>plan</strong> has beendeveloped identifying activities that will promote thenatural, built, social, business and cultural environmentcovering the period until 2020. The <strong>plan</strong> prioritises theactions required, identifies the agencies involved andincludes cost estimates.
144Plans to promote the natural environment addressbeach management, East Harbour Regional Park, urbantrees, pest <strong>plan</strong>t control, pines and pine removal, andsustainable management of the coastal ecosystem.Plans addressing the built environment includemonitoring the District Plan, completing the EasternBays Walkway, completing the Whiorau Reserveupgrade, advancing the Village Square concept,undergrounding services, upgrading stormwatersystems, implementing a zero plastic bag policy,completing the Eastbourne Community Board <strong>plan</strong>for Korohiwa, investigating Days Bay, and upgradingthe Eastbourne wharf and shelter.Plans to promote the social environment includeinstituting an elderly in place programme, establishingan Eastbourne Youth Forum, implementing the“Communityville” project, and implementingNeighbourhood Watch.Plans addressing the business environment includeupgrading the Eastbourne CBD, transport from DaysBay to Eastbourne, rates relief for commercial properties,and revamping the Days Bay commercial precinct.Petone Community BoardA Petone Community Action Plan has been developedoutlining activities that will move Petone, Moera,Gracefield, Seaview and Waiwhetu South closerto achieving goals of managing growth that isenvironmentally and economically sustainable,developing Petone as a unique heritage place,and developing a vibrant village culture and<strong>community</strong> place.Activities promoting the management of growth includea safe <strong>community</strong>; recognising Korokoro issues;enhancing the Petone foreshore, Es<strong>plan</strong>ade and rivermouth; developing our sportsgrounds, parks andreserves; promoting a wider range of housing choice;protection from flooding; attracting more visitors;reducing pollution; controlling commercial development;protecting small businesses; continuing the artesianand unfluoridated water supply; safeguarding viewshifts; and reopening the Gracefield Railway.Activities promoting heritage include celebratingPetone’s heritage; promoting the historic commercialprecinct; protecting the residential areas; protectinghistoric and geologic landmarks; and developing aclose working relationship with Iwi and a widerknowledge in the <strong>community</strong> of Maori history.Activities promoting culture include constructing anew swimming pool that meets the needs of the<strong>community</strong>; providing housing that meets the needsof the <strong>community</strong>; developing a busy, creative artsand crafts scene; promoting the centre of excellence ineducation; having an active <strong>community</strong> board; developinga vibrant Petone Town Centre; supporting youth andyoung families; and continuing the Anzac Day celebrations.Wainuiomata Community BoardA <strong>community</strong> <strong>plan</strong> has been developed that identifieskey economic, environmental, social and infrastructuralissues, methods of addressing these, timeframesand indicators.The key issues include developing and marketingtourism opportunities; developing an employment pool;promoting an attractive, tidy environment; developing asafe, inclusive <strong>community</strong> in which all members, youngand old, will feel included and will have a sense of prideand belonging in their <strong>community</strong>; providing safeaccess within and out of Wainuiomata for pedestriansand cyclists including safe access across WainuiomataHill Road; developing a self-sustaining <strong>community</strong> inthe case of emergency; providing sufficient publictoilets; and developing additional road access inand out of Wainuiomata.
hutt city <strong>community</strong> <strong>plan</strong> 145Central/West Community CommitteeFour top priorities have been highlighted for action in2009/10. These are improvements to Avalon Park,upgrading of Manor Park, minor upgrading of thefootpath in Miromiro Road and construction of aroundabout at the intersection of Harbourview Roadand Viewmont Drive.An analysis of each area within the Central and WesternWards has been undertaken to identify works requiredwithin a one year timeframe and a two year or longertimeframe. This includes works in Alicetown, Maungaraki,Normandale, Harbourview, Belmont, Kelson, ManorPark/Haywards, Avalon, Boulcott, Epuni, Park Avenueand the central city.North/East Community CommitteeSeparate <strong>community</strong> <strong>plan</strong>s have been developedcovering Stokes Valley, Taita/Pomare, Naenae andWaiwhetu/Fairfield/Waterloo.The Stokes Valley <strong>plan</strong> outlines projects and initiativesto promote <strong>community</strong> safety including increasing safetyand surveillance measures in the Stokes Valley CBD,upgrading lighting in the CBD, promoting safe streets,encouraging neighbourhood support, promoting theCombined Adolescent Training Unit and SupportProgramme, and implementing an age limit curfew inthe Stokes Valley shopping centre. Projects promotingyouth include developing a playground for under fives,new aquatic attractions at the Stokes Valley swimmingpool, establishing a fitness suite at the Stokes Valleyswimming pool, building an adventure playground,providing more youth events, and providing carparksfor mums and babies outside the Plunket Rooms.Environmental initiatives include reducing noisepollution, street washing and pavement cleaning,beautification of public areas and private gardens,and holding an inorganic rubbish collection. Projectspromoting a <strong>community</strong> heart include library/hall/publictoilet redevelopment, CBD signage, sale of <strong>Council</strong>land at 24 Evans Street, public artworks, andsportsground development at 158 Holborn Drive.The Taita/Pomare <strong>plan</strong> promotes environmental projectsincluding an inorganic rubbish collection, street washingand pavement cleaning, cleaning the Taita shoppingcentre, cleaning up the Taita subway, providingcarparking and beautification in Eastern <strong>Hutt</strong> Road,and beautification of public areas and private gardens.Projects promoting a <strong>community</strong> heart includedeveloping <strong>community</strong> leaders, promoting the Taita<strong>community</strong> hall, and developing a new vision for theTaita CBD. Projects promoting youth address thedevelopment of indoor and outdoor spaces foryoung people.The Naenae <strong>plan</strong> promotes a draft Naenae Master<strong>plan</strong>to upgrade the Naenae shopping centre, upgradingof the Naenae subway, promoting more privateownership of housing in Naenae, development ofhousing for older persons, providing opportunitiesfor growth in new housing, establishing a <strong>community</strong>resource centre, rationalising <strong>community</strong> halls,enhancing leisure and recreational facilities in Naenae,and providing opportunities for older persons to engagein <strong>community</strong> activities.The Waiwhetu/Fairfield/Waterloo <strong>plan</strong> highlights issuesinvolving the shopping centres, transport links, housing,the Waiwhetu Stream and <strong>community</strong> facilities. The <strong>plan</strong>recommends that four key issues be addressed in thenext financial year. These are to clean and wherenecessary repair the footpaths around Waterloo,Waiwhetu and Fairfield shops; install bollards or a fencearound Trafalgar Park; investigate with GreaterWellington Regional <strong>Council</strong> opportunities to expandparking at Waterloo Station; and take care with thereview of the residential provisions in the District Planto minimise the number of pockets of low densityhousing squeezed between high density pockets.Our management structureIn <strong>Hutt</strong> <strong>City</strong> <strong>Council</strong>, the elected members of <strong>Council</strong> setthe broad strategic direction and policies for the ChiefExecutive and staff to implement, and audit the results.The Chief Executive is the sole employee of the electedmembers of <strong>Council</strong>, and in turn is the employer of allother <strong>Council</strong> staff members. He is responsible to<strong>Council</strong> for:ÎÎimplementing its decisionsÎÎadvising <strong>Council</strong>, <strong>community</strong> board and <strong>community</strong>committee membersÎÎensuring that all functions delegated to any employeesare carried out.
146<strong>Hutt</strong> <strong>City</strong> <strong>Council</strong> monitors the Chief Executive’s performance through a series ofperformance measures and the Chief Executive is accountable to <strong>Council</strong> througha quarterly reporting process.<strong>Hutt</strong> <strong>City</strong> <strong>Council</strong> management, through its Strategic Leadership Team, focuses onfive priority areas:We’ve recently been recognised for business excellence, winning:ÎÎthe ‘Local Government’ award in the 2008 Vero Excellence in BusinessSupport AwardsÎÎa 2006 Achievement Award (Silver) from the New Zealand BusinessExcellence Foundation.Priority areaOrganisational objectives<strong>Council</strong>-controlled trading organisationsCore Servicesand CommunityEngagementStaffGrowth andDevelopmentEnvironmentRegionalCo-operationÎÎDelivering excellent and innovative services that providevalue for moneyÎÎEngaging with residents to ensure our key projects anddecisions reflect our communities’ valuesÎÎStaff will have the skills, information and tools they needto do their jobsÎÎLeading the city’s growth and development to ensure avibrant and thriving <strong>Hutt</strong> <strong>City</strong>ÎÎBeing an environmental sustainability leader andresponding to the changing social and economic climateÎÎWorking in partnership with others to deliver sharedservices and contribute to regional initiativesWe’ve identified key performance indicators for these areas (see page 60), which areadditional to the performance measures and targets for each of the 18 key activitiesdescribed from page 64.As part of our commitment to achieving and maintaining service excellence,we undergo independent assessments according to the Baldridge Criteria forPerformance Excellence. These and other assessments help us to identify areasfor improvement, and gauge our performance relative to other local authoritiesand best practice private sector organisations.We operate three <strong>Council</strong>-controlled trading organisations (CCTOs): Wellington WaterManagement Limited (Capacity), Seaview Marina Limited and Urban Plus Limited(UrbanPlus).These organisations help in achieving our <strong>community</strong> outcomes by independentlymanaging facilities, delivering services and undertaking developments on behalf ofthe Lower <strong>Hutt</strong> <strong>community</strong>. We have at least a 50% shareholding in these CCTOs,which are operated as businesses for the purpose of making a profit.The Statements of Intent for the three CCTOs (outlining their performance measuresand targets for 2009/10) are set out below and will be finalised by 30 June 2009.Wellington Water Management Limited (trading as Capacity)Capacity was established in 2004 to manage water assets and provide water servicesto its shareholders, <strong>Hutt</strong> <strong>City</strong> <strong>Council</strong> and Wellington <strong>City</strong> <strong>Council</strong>.Its activities include:ÎÎproviding high-quality, safe and environmentally sustainable services to itsshareholding <strong>council</strong>s and other customersÎÎensuring that all work is managed for customers according to the higheststandards and with regard to the health and safety of employees, contractorsand the general public.
hutt city <strong>community</strong> <strong>plan</strong> 147Its principal objectives are to:ÎÎundertake long <strong>term</strong> <strong>plan</strong>ning, managementand delivery of the shareholding <strong>council</strong>s’ water,stormwater and wastewater assetsÎÎoperate as a successful business, returning anybenefits to shareholdersÎÎcontribute to achieving the co-operative deliveryof integrated water services in the Wellingtonmetropolitan regionÎÎexhibit a sense of social and environmentalresponsibility by having regard to the interestsof the <strong>community</strong> and to conduct its affairs inaccordance with sound business practice.The company’s performance measures and keyperformance targets are to:ÎÎdevelop and complete Asset ManagementPlans annuallyÎÎdeliver budgeted capital expenditure projectsÎÎdeliver budgeted operating and maintenanceactivitiesÎÎmanage and operate Capacity within its2009/10 budgetÎÎmanage Capacity labour productivity rate to be80% or more at year endÎÎachieve annual increases in operating cost perproperty benchmarks for <strong>Hutt</strong> <strong>City</strong> <strong>Council</strong>’s water,stormwater and wastewater networks at or belowAuckland Water Industry averagesÎÎmeet key performance measures as set outin Service Level AgreementsÎÎcomply with financial, technical and regulatorystandards.Seaview Marina LimitedSeaview Marina Limited owns and operates themarina facilities known as the Seaview Marina.Its key objectives are to:ÎÎoperate as a successful and profitable undertakingÎÎprovide a berth operation and associated servicesthat are as safe and efficient as possibleÎÎprovide public marine recreation facilities for theenjoyment of the <strong>Hutt</strong> <strong>City</strong> <strong>community</strong> withoutcompromising its commercial objectives andenvironmental responsibilitiesÎÎpursue and promote the development of relatedcommercial opportunities and undertakings withother landowners in the areaÎÎcomply with all legislative and regulatory provisionsrelating to its operation and performanceÎÎensure all assets are maintained to the bestapplicable standardsÎÎmaintain an effective business continuance <strong>plan</strong>ÎÎmaintain and enhance relationships with usersof the marina.The company’s performance measures and keyperformance targets are to:ÎÎachieve a rate of return on shareholders’ fundsof 6.5% before taxation in the 2009/10, 2010/11and 2011/12 financial yearsÎÎachieve the following capital developmentprogramme targets for the marina complexbefore 30 June 2010:ÆÆComplete the development of the MarineServices CentreÆÆInvestigate the replacement of the marinaboat hoistÆÆReview the Business Plan for the next five years(1 July 2009 – 1 July 2014)ÎÎcomply with financial, building, technical andregulatory standardsÎÎensure property and asset maintenance is carriedout in accordance with asset management <strong>plan</strong>sand to the best applicable trade standardsand practiceÎÎdevelop a strategy that will encourage the publicto use the current beach and monitor and reportthat use back to <strong>Hutt</strong> <strong>City</strong> <strong>Council</strong>.
148Urban Plus Limited (trading as UrbanPlus)On 1 May 2007, the <strong>Council</strong> transferred most of itssocial housing assets and property managementfunctions to UrbanPlus.The company’s main objectives are to:ÎÎown and operate a portfolio of rental housing toprovide <strong>community</strong> housing for the elderly andsocially disadvantaged according to normalcommercial guidelines and <strong>Council</strong>’s Housing PolicyÎÎdevelop property in preparation for sale or leasewhere it is surplus to <strong>Council</strong>’s needs or to fulfil ahousing public work requirement, and where thisactivity provides an appropriate return for the costsand risks of developmentÎÎmanage <strong>Council</strong> property and building assetsaccording to <strong>Council</strong>’s policies (as applicable)and the <strong>term</strong>s and conditions of the contract forservices agreed between the company and <strong>Council</strong>.UrbanPlus’s performance measures and key performancetargets are:Property management:ÎÎNet capital and operational expenditure within budgetÎÎResident satisfaction with public halls greater than orequal to the peer average, subject to <strong>Council</strong> fundingÎÎResident satisfaction with public toilets greater thanor equal to the peer average within five years,subject to <strong>Council</strong> fundingÎÎTenant satisfaction with <strong>Council</strong>-owned <strong>community</strong>buildings greater than or equal to 90%ÎÎ<strong>Council</strong> satisfaction with building management 90%.Rental housing:ÎÎNet capital and operational expenditure within budgetÎÎA return on investment in line with market norms forthe nature and condition of the property portfolioÎÎTenant satisfaction with the provision of the company’srental housing greater than or equal to 90%ÎÎPercentage of total housing units occupied by elderly/socially disadvantaged greater than or equal to 85%ÎÎRetain at least 180 housing units with the objectiveof growing this number to a minimum of 210 by 2013.Our <strong>community</strong> partnershipsWe’ve forged a number of close and highly productiveworking relationships with people and groups in our<strong>community</strong>, including:ÎÎcontractors, service suppliers, consultantsand advisorsÎÎbusinesses and their representative organisationsÎÎlocal mana whenua and maraeÎÎlocal and central government agenciesÎÎvolunteer organisationsÎÎ<strong>community</strong> groups.Examples of our partnerships include:ÎÎTamaiti Whangai, a five-year contract in which wework with a range of government agencies andTe Rūnanganui o Taranaki Whānui to improve the<strong>community</strong> wellbeing of Wainuiomata, Naenae,Pomare and Taita by providing a range of health,education and social services. Governmentagencies involved in the project include the Ministryof Social Development, Te Puni Kokiri, the Ministryof Education, the <strong>Hutt</strong> Valley District Health Board,ACC and WelTec
hutt city <strong>community</strong> <strong>plan</strong> 149ÎÎthe Disability Advisory Group, a joint project in whichwe work with Upper <strong>Hutt</strong> <strong>City</strong> <strong>Council</strong>, the <strong>Hutt</strong> ValleyDistrict Health Board and <strong>community</strong> representativeswho can advise on issues of concern for people withdisabilities within the regionÎÎfostering a more inclusive society and promoting theinterests of organisations including the Departmentof Labour, the <strong>Hutt</strong> Ethnic <strong>Council</strong>, the <strong>Hutt</strong> ValleyNew Settlers Centre, the <strong>Hutt</strong> Valley Youth WorkersNetwork and our youth <strong>council</strong> (Youth Infusion)ÎÎthe Safer Streets Action Plan 2007-12, the resultof work with the Ministry of Justice, New ZealandPolice and other agencies to improve the safetyand perception of safety in Lower <strong>Hutt</strong>ÎÎinitiatives that help young people to accesseducation, training and work opportunities, forexample working with WelTec and Trade Start(funded by the Ministry of Social Development)ÎÎparticipating in the Healthy Housing Steering Group,whose members include Housing New Zealand,EnergySmart, the <strong>Hutt</strong> Mana Charitable Trust and theWellington School of Medicine. The group’s ‘HealthyHomes Healthy People’ programme, launched inFebruary 2008, has been incorporated into a largerjoint initiative involving Housing New ZealandCorporation and the <strong>Hutt</strong> Valley District HealthBoard. Up to 1700 households in Naenae, Taita andPomare will be included in the programme overthree years, and a joint assessment covering theirhousing, health and social needs will be undertakenÎÎthe Road Safety Action Plan, with partners includingNew Zealand Police, ACC, the New ZealandTransport Agency and Greater Wellington Regional<strong>Council</strong>. Regular meetings address the engineering,education and enforcement measures available toinfluence road safety problems or causes andde<strong>term</strong>ine the actions required.Partnerships with businessWe have a number of initiatives designed to strengthenour relationships with businesses in <strong>Hutt</strong> <strong>City</strong>:ÎÎour quarterly business newsletter, ‘Thrive’, coversissues of interest to business and highlightsbusinesses in the cityÎÎour ‘Creating Business Success – <strong>Hutt</strong> <strong>City</strong>’ brochureoutlines the benefits of living, playing and operatinga business in <strong>Hutt</strong> <strong>City</strong>. The brochure is being usedby our staff and commercial agents in attractingnew business to the cityÎÎour ‘Business Communication Programme’ includesvisits to businesses by the Mayor and senior staff,mayoral functions, and presentations by senior<strong>Council</strong> staff to business groups. We provideregular updates to the real estate industry and otherprofessional groups, and <strong>Council</strong> staff have a regularmeeting programme with businesses in the cityÎÎwe support the Wellington Region Gold Awardsto business and the Wellingtonian of the YearAwards, and are a major sponsor of the <strong>Hutt</strong> <strong>City</strong>Business AwardsÎΑBusiness <strong>Hutt</strong> Valley’, a joint venture between the<strong>Hutt</strong> Valley Chamber of Commerce and CBD+,has a broad representation of the city’s business<strong>community</strong> and offers a Business After 5 programmethat regularly attracts large numbers of attendeesÎÎwe continue to help the ‘Jackson Street Programme’to achieve its priorities for funding and operationseach year.In working to achieve our <strong>community</strong> outcomes, ourpartner business organisations fulfil a range of roles.This is done in the course of carrying out their corebusiness in areas that can contribute to the <strong>community</strong>’sachievement of these outcomes.
150Organisation/ProgrammeBusinessCare/EnviroSmartAdvocate Funder ServiceproviderRegulator FacilitatorMonitorPartnerships with MaoriWe’re committed to the principles of the Treaty of Waitangi – Te Tiriti O Waitangi – andto maintaining and improving opportunities for Maori to contribute to local governmentdecision-making. We also recognise and provide for the special relationship betweenMaori and their culture, traditions, land and taonga.Business <strong>Hutt</strong>Valley CBD+ GrowWellington(the regionaleconomicdevelopmentagency) Our commitment to consulting Maori includes recognising those who have manawhenua, or inherited rights of land ownership. Within <strong>Hutt</strong> <strong>City</strong> these are represented by:ÎÎNgā Tekau o Pōneke – the Wellington Tenths TrustÎÎTe Rūnanganui o Taranaki Whānui ki te Upoko o te Ika a Maui.Both these groups represent Te Atiawa and the Taranaki tribes within the Wellingtonregion. We also consult urban Maori now resident in <strong>Hutt</strong> <strong>City</strong>, including (but notlimited to) Te Taurahere o Te Awakairangi and the seven marae within the city –Koraunui Marae, Te Mangungu Marae, Wainuiomata Marae, Te Kakano o te ArohaMarae, Waiwhetu Marae, Kokiri Seaview Marae and Te Tatau o te Po Marae.Jackson StreetProgrammePrivate sectorcontractorsSustainableBusinessNetworkThe key principles of our partnership with Maori are to:ÎÎconsider the principles of the Treaty of Waitangi – Te Tiriti O WaitangiÎÎcontinue the established contractual agreements with Te AtiawaÎÎcontinue to work alongside established, and develop relationships with other,Maori organisations and the seven maraeÎÎpursue our statutory obligations under Part II of the Resource ManagementAct 1991 and Section 4 of the Local Government Act 2002.WelTec
hutt city <strong>community</strong> <strong>plan</strong> 151Our goals are to:ÎÎprovide opportunities for Maori to contribute to our decision-makingÎÎenable greater information flows on activities of mutual interest to bothus and MaoriÎÎfoster the city’s cultural life in which we and Maori will play our partsin a bicultural partnershipÎÎmaintain consultation and involvement with Te AtiawaÎÎconsult Te Taurahere o Te AwakairangiÎÎconsult the seven marae within <strong>Hutt</strong> <strong>City</strong>.Our programme includes:ÎÎongoing promotion of memoranda of understanding with key Maori stakeholdersÎÎworking to maintain longstanding relationships with Te Rūnanganui o TaranakiWhānui ki te Upoko o te Ika a Maui, Ngā Tekau o Pōneke – the Wellington TenthsTrust, Te Taurahere o Te Awakairangi and the seven marae within <strong>Hutt</strong> <strong>City</strong>ÎÎworking to maintain existing and developing relationships with other Maori<strong>community</strong> organisationsÎÎensuring that all parties are kept informed of our developments and given theopportunity to take part in our affairsÎÎproviding quality advice and support for capacity and capability strengtheningÎÎproviding <strong>Council</strong> grants to each of the seven city marae.In working to achieve our <strong>community</strong> outcomes, our partner Maori organisations fulfila range of roles. This is done in the course of carrying out their core business in areasthat can contribute to the <strong>community</strong>’s achievement of these outcomes.Organisation Advocate Funder ServiceproviderNgā Tekau oPōneke – theWellingtonTenths TrustTe Rūnanganuio TaranakiWhānui ki teUpoko o te Ikaa MauiTe Taurahere oTe AwakairangiRegulator Facilitator MonitorExamples of joint initiatives include:ÎÎjoint management of Te Whiti Park with Te Rūnanganui o Taranaki Whānui ki teUpoko o te Ika a MauiÎÎOwhiti UrupaÎÎTe Puni Street UrupaÎÎpreservation of the prow of a Maori waka discovered at the Opahu Pumping Stationconstruction site in 2006 as a co-operative venture with Ngā Tekau o Pōneke – theWellington Tenths Trust and the Ministry for Culture and Heritage.
152Partnerships with other local authoritiesWe’re committed to working with other local authoritieswhere there are benefits to the city in doing so – forexample in promoting or achieving priorities and goals,and making efficient use of resources.We work co-operatively and collaboratively with theother <strong>council</strong>s within the Wellington region to ensurewe maintain appropriate levels of consultation andco-ordination, and contribute to the strengtheningof regional relationships.Examples of our work with other local authorities include:Regional initiatives:ÎÎworking to build an internationally competitiveWellington region while enhancing our qualityof life through the Wellington Regional Strategy(see page 19)ÎÎjointly funding ‘Grow Wellington’, the regionaleconomic development agency, through GreaterWellington Regional <strong>Council</strong>, to facilitate, promoteand foster the development of a dynamic economyin the Wellington regionÎÎthe joint ‘Triangle’ roading study with GreaterWellington Regional <strong>Council</strong>, Wellington <strong>City</strong><strong>Council</strong> and the NZ Transport AgencyÎÎthe Wellington and Wairarapa International MarketingAlliance with Positively Wellington Tourism, Porirua<strong>City</strong> <strong>Council</strong>, Upper <strong>Hutt</strong> <strong>City</strong> <strong>Council</strong>, EnterpriseCoast and Destination WairarapaÎÎan Intersectoral Group with Greater WellingtonRegional <strong>Council</strong>, Upper <strong>Hutt</strong> <strong>City</strong> <strong>Council</strong> and<strong>Hutt</strong> Valley District Health Board.With Wellington <strong>City</strong> <strong>Council</strong>:ÎÎoperating CapacityÎÎproviding an after hours telephone answering serviceÎÎprevious joint roading tenders.With Upper <strong>Hutt</strong> <strong>City</strong> <strong>Council</strong>:ÎÎa combined ‘whole of valley’ shared wastewatertreatment and disposal systemÎÎcombined ‘whole of valley’ access to the SilverstreamLandfill, operated by <strong>Hutt</strong> <strong>City</strong> <strong>Council</strong>ÎÎa combined Waste Management Plan for the<strong>Hutt</strong> ValleyÎÎa combined cemetery service for the <strong>Hutt</strong> Valleyat AkatarawaÎÎcombined emergency management servicesfor the <strong>Hutt</strong> Valley at Lower <strong>Hutt</strong>ÎÎcombined <strong>community</strong>-related advisory andgovernance groups, including the <strong>Hutt</strong> ValleyGovernance Group, the Alcohol Advisory Group,the Youth Workers Network, the Settlement SupportSteering Group and the Healthy Housing ProjectÎÎjoint tourism marketing, including www.huttvalleynz.comÎÎworking together/providing services for environmentalhealth, animal control, trade waste, liquor licensingand public safety issuesÎÎYouth Transition Services (funded by the Ministry ofSocial Development)ÎÎprevious joint roading tenders.In working to achieve <strong>community</strong> outcomes, localand regional government organisations with whichwe partner fulfil a range of roles. This is done in thecourse of carrying out their core business in areasthat can contribute to the <strong>community</strong>’s achievementof these outcomes.
hutt city <strong>community</strong> <strong>plan</strong> 153Organisation Advocate Funder ServiceproviderRegulator FacilitatorMonitorOrganisation Advocate Funder ServiceproviderRegulator FacilitatorMonitor<strong>Hutt</strong> <strong>City</strong><strong>Council</strong>GreaterWellingtonRegional<strong>Council</strong><strong>Hutt</strong> ValleyDistrict HealthBoardPorirua <strong>City</strong><strong>Council</strong>Upper <strong>Hutt</strong><strong>City</strong> <strong>Council</strong>Wellington<strong>City</strong> <strong>Council</strong> ACC Child, Youthand FamilyCreative NewZealandDepartment ofConservationDepartment ofLabourEnergyEfficiencyConservationAuthorityMinistry for theEnvironment Partnerships with central governmentMinistry ofHealthWe are pleased to work with central government where there are benefits to the city indoing so – for example in promoting or achieving priorities and goals, and makingefficient use of resources.Ministry ofJusticeIn working to achieve <strong>community</strong> outcomes, central government organisations withwhich we have partnerships fulfil a range of roles. This is done in the course ofcarrying out their core business in areas that can contribute to the <strong>community</strong>’sachievement of these outcomes.
154Organisation Advocate Funder ServiceproviderMinistry ofSocialDevelopment(Work andIncome NewZealand)New ZealandTrade andEnterpriseNZ TransportAgencyNew ZealandPoliceQuotableValueRegulator Facilitator Te Puni Kokiri Tourism NewZealandMonitorPartnerships with our <strong>community</strong>In working to achieve our <strong>community</strong> outcomes, <strong>community</strong> and voluntary organisationsfulfil a range of roles. This is done in the course of carrying out their core activities inareas that can contribute to the <strong>community</strong>’s achievement of these outcomes.Organisation Advocate Funder ServiceproviderEnvironmentalgroupsEnviroschoolsResidents’andratepayers’groupsVolunteersand volunteerorganisationsCharitabletrustsRegulator FacilitatorMonitor Individuals also play an important role through their participation in our consultationprocesses and other initiatives, leading to decisions that affect the current and futurewellbeing of the city and its communities.
hutt city <strong>community</strong> <strong>plan</strong> 155
Learn to swimEach year, thousands of <strong>Hutt</strong> <strong>City</strong> residents from six monthsof age through to older adults participate in our Swim <strong>City</strong>Learn to Swim programmes. For beginners like these tiny tots,the parent-assisted programmes focus on learning the basics,building confidence, and safety in and around the water.
Legislation AffectingLocal Government
158Legislation affecting local governmentAs a local authority, we and ourwork are governed by a largenumber of pieces of legislation– many with a focus on the keyconcepts of <strong>community</strong> wellbeingand sustainable development.Here’s a description of the main ones, in alphabeticalorder. Note it’s not an exhaustive list as we’re alsobound by general legislation, but it highlights themajor pieces of legislation that govern our activities.Building Act 2004The Building Act covers:ÎÎthe regulation of building workÎÎa licensing regime for building practitionersÎÎthe setting of performance standards for buildingsto ensure users’ health and safety, physicalindependence and wellbeing and ability toescape in a fire, and the design, constructionand use of buildings in ways that promotesustainable development.Bylaws Act 1910The Bylaws Act covers the validity of bylaws introducedby <strong>council</strong>s.Civil Defence Emergency ManagementAct 2002The Civil Defence Emergency Management Act:ÎÎpromotes the sustainable management of hazardsto contribute to the social, economic, cultural andenvironmental wellbeing and safety of the publicand protection of propertyÎÎprovides for <strong>plan</strong>ning and preparation foremergencies and for response and recoveryin emergenciesÎÎrequires local authorities to co-ordinate regional<strong>plan</strong>ning, programmes and activities related tocivil defence emergency managementÎÎprovides for the integration of national and localcivil defence emergency management <strong>plan</strong>ningand activityÎÎencourages the co-ordination of emergencymanagement, <strong>plan</strong>ning and activities relatedto civil defence emergency management.Dog Control Act 1996The Dog Control Act covers the care and control ofdogs by:ÎÎrequiring them to be registeredÎÎmaking special provisions for dangerous andmenacing dogsÎÎimposing on dog owners obligations to ensurethat dogs do not cause a nuisance, injure, endangeror cause distress to any person, stock, poultry,domestic animal or protected wildlifeÎÎmaking provision for damage caused by dogs.Forest and Rural Fires Act 1977The Forest and Rural Fires Act aims to safeguard lifeand property by preventing, detecting, controlling,restricting, suppressing and extinguishing fire in forestand rural areas and other areas of vegetation.<strong>Hutt</strong> Valley Drainage Act 1967The <strong>Hutt</strong> Valley Drainage Act covers sewage and tradewaste disposal.
hutt city <strong>community</strong> <strong>plan</strong> 159Local Authorities (Members Interests)Act 1968The Local Authorities (Members Interests) Act restrictscontract-making between local authorities and theirmembers, and restricts members’ actions when a<strong>Council</strong> is considering matters in which they havea pecuniary interest.Local Electoral Act 2001The Local Electoral Act:ÎÎgoverns the conduct of local elections and pollsthrough uniform rules for elections, rights ofindividuals to participate, the appointment ofofficials, the compilation of electoral rolls, theprocedures for the conduct of elections andpolls, offences and penalties, disputed elections,electoral expenses and vacanciesÎÎallows local decision-making on the electoralsystem to be used, the review of representationarrangements and the voting method to be used.Local Government Act 2002The Local Government Act:ÎÎprovides for democratic and effective localgovernment that recognises the diversity ofNew Zealand communitiesÎÎenables democratic local decision-makingand action by, and on behalf of, communitiesÎÎpromotes communities’ social, economic,environmental and cultural wellbeing, in thepresent and for the future.Local Government Act 1974 (part)This Act outlines <strong>council</strong>s’ general powers in respectof roads, service lanes and access ways, requirementsfor private drains and <strong>council</strong> land drainage works.Local Government OfficialInformation and Meetings Act 1987The Local Government Official Informationand Meetings Act:ÎÎmakes official information held by localauthorities more freely availableÎÎprovides for public attendance at localauthorities’ meetingsÎÎprotects official information held by localauthorities, and their deliberations, to theextent consistent with the public interestand the preservation of personal privacy.Local Government (Rating) Act 2002This Act promotes the purpose of local government by:ÎÎproviding local authorities with flexible powers to set,assess and collect rates to fund their activitiesÎÎensuring that rates are set through decisions madein a transparent and consultative wayÎÎproviding for processes and information to enableratepayers to identify and understand their liabilitiesfor rates.Reserves Act 1977The Reserves Act:ÎÎcovers the preservation and management, forthe benefit and enjoyment of the public, of thoseareas of New Zealand possessing recreationaluse or potential, wildlife, indigenous flora or fauna,environmental and landscape amenity or interest,or natural, scenic, historic, cultural, archaeological,biological, geological, scientific, educational,<strong>community</strong> or other special features or valueÎÎensures the survival of all indigenous species of floraand fauna in their natural communities and habitatsÎÎensures the preservation of public access to thecoast, lakeshores and riverbanks, and promotesthe preservation of their natural character andtheir protection from unnecessary subdivisionand development.
160Resource Management Act 1991The Resource Management Act promotes thesustainable management of natural and physicalresources by:ÎÎmanaging the use, development and protectionof natural and physical resources in a way, orat a rate, that enables people and communitiesto provide for their social, economic and culturalwellbeing and for their health and safety,while:ÎÎsustaining the potential of natural and physicalresources to meet the reasonably foreseeableneeds of future generationsÎÎsafeguarding the life-supporting capacity of air,water, soil, and ecosystemsÎÎavoiding, remedying or mitigating any adverseeffects of activities on the environment.Sale of Liquor Act 1989The Sale of Liquor Act established a system of controlover the sale and supply of liquor to the public with theaim of contributing to a reduction of liquor abuse, as faras that can be achieved by legislative means.Other key pieces of legislation that conferpowers on <strong>Hutt</strong> <strong>City</strong> <strong>Council</strong> and regulateits functions are listed below.Local statutes<strong>Hutt</strong> Valley And Bays Metropolitan Milk Board ValidationAct 1952<strong>Hutt</strong> Valley Electric Power Board Empowering Act 1950Lower <strong>Hutt</strong> <strong>City</strong> <strong>Council</strong> (<strong>Hutt</strong> Park) Act 1982Lower <strong>Hutt</strong> <strong>City</strong> Empowering Act 1951Lower <strong>Hutt</strong> <strong>City</strong> (Free Ambulance Site) Act 1977Lower <strong>Hutt</strong> <strong>City</strong> (Name Of <strong>City</strong> <strong>Council</strong>) Act 1991Petone Borough <strong>Council</strong> Empowering Act 1956Petone Borough Empowering Act 1905Petone Water Supply Conservation Act 1907General statutesArts <strong>Council</strong> of New Zealand Toi Aotearoa Act 1994Biosecurity Act 1993Building Research Levy Act 1969Burial and Cremation Act 1964Commerce Act 1986Companies Act 1993Conservation Act 1987Consumer Guarantees Act 1993Copyright Act 1994Crimes Act 1961District Courts Act 1947Earthquake Commission Act 1993Electricity Act 1992Employment Relations Act 2000Environment Act 1986Fair Trading Act 1986Fencing Act 1978Fencing of Swimming Pools Act 1987Financial Reporting Act 1993Fire Service Act 1975Fisheries Act 1996Food Act 1981Foreshore and Seabed Act 2004Forests Act 1949
hutt city <strong>community</strong> <strong>plan</strong> 161Gambling Act 2003Goods and Services Tax Act 1985Hazardous Substances and New Organisms Act 1996Health Act 1956Health (Drinking Water) Amendment Act 2007Health and Safety in Employment Act 1992Historic Places Act 1993Housing Act 1955Housing Corporation Act 1974Human Rights Act 1993Impounding Act 1955Income Tax Act 2004Insolvency Act 1967Insolvency Act 2006Interpretation Act 1999Land Act 1948Land Drainage Act 1908Land Transfer Act 1952Land Transport Act 1998Land Transport Management Act 2003Litter Act 1979Local Authority Reorganisation (Property Transfers)Act 1990Machinery Act 1950Minimum Wage Act 1983Municipal Insurance Act 1960New Zealand Bill of Rights Act 1990New Zealand Geographic Board Act 1946New Zealand Library Association Act 1939New Zealand Walkways Act 1990Oaths and Declarations Act 1957Ombudsmen Act 1975Privacy Act 1993Property Law Act 1952Prostitution Reform Act 2003Public Finance Act 1989Public Records Act 2005Public Works Act 1981Railway Act 2005Rating Valuations Act 1998Rates Rebate Act 1973Receiverships Act 1993Residential Tenancies Act 1986River Boards Act 1908Secret Commissions Act 1910Securities Act 1978Securities Transfer Act 1991Smoke-free Environments Act 1990Soil Conservation and Rivers Control Act 1941Standards Act 1988Summary Offences Act 1981Telecommunications Act 2001Transport Act 1962Treaty of Waitangi Act 1975Trespass Act 1980Trustee Act 1956Unit Titles Act 1972Wages Protection Act 1983Waste Minimisation Act 2008Wild Animal Control Act 1977Wildlife Act 1953
Escape to another worldDiscover new worlds and travel to faraway lands all from your own couch.Whether you , re after a lazy weekend read or want to expand your mind,there , s always something to whet the appetite at your local library. Bookson CD for the car and regular children , s storytimes are just a few waysthat stories come alive.
Appendices
164Sustainable development <strong>plan</strong>ningASSET MANAGEMENT PLANNINGThe Asset Management Plans set out how <strong>Council</strong> delivers itsasset-based services:ÎÎ to the standards expected by customers;ÎÎ at the most competitive cost to customers;ÎÎ through management of assets in a way that is sustainablein the long <strong>term</strong>;ÎÎ in compliance with legal requirements.The Asset Management Plans comprise four key elements:ÎÎ the service standards which <strong>Council</strong> aims to achieve;ÎÎ the asset system used to achieve the service standards;ÎÎ the life cycle of asset management strategies (which setout how <strong>Council</strong> manages the assets); andÎÎ quality assurance processes.Service standards set out the services to be delivered and thetargets <strong>Council</strong> aims to achieve in their delivery. Target servicestandards include:ÎÎ customer service standards;ÎÎ legislative standards;ÎÎ technical standards; andÎÎ environmental standards.Customer service standards look at services from a customer’sperspective. <strong>Council</strong> customers have been consulted aboutsome standards, major projects and issues such as thefluoridation of the Petone water supply, and the TrunkWastewater System (which includes the Seaview WastewaterTreatment Plant and network operations).Technical and environmental service standards are de<strong>term</strong>inedby legislation, industry and environmental best practice and inconsultation with local <strong>community</strong> special interest groups, iwiand Central Government agencies.The asset system describes the assets <strong>Council</strong> uses to deliverthe services. It includes a high level summary of the asset’scondition, an assessment of the asset’s service capabilitiesand a forecast of the future demand for the services.Life cycle management covers the four key strategiesnecessary to deliver the required service standards.ÎÎ Management/Monitoring Strategy.ÎÎ Maintenance/Operations Strategy.ÎÎ Asset Renewal Strategy.ÎÎ Asset Development Strategy.The first three strategies maintain the service capability ofexisting assets, while the Asset Development Strategy aimsto close gaps between the current service capability andtarget service standards.Financial programmes associated with the four strategies arefed into <strong>Council</strong>’s long <strong>term</strong> financial <strong>plan</strong>ning. For example,the Asset Renewal Strategy feeds into the “MaintainingServices” category of projects in the Community Plan, andthe Asset Development Strategy feeds into the “ImprovingServices” category.Quality assurance sets out how <strong>Council</strong> evaluates its assetmanagement <strong>plan</strong>ning processes against industry bestpractice. This can be through evaluation of <strong>Council</strong>’s assetmanagement <strong>plan</strong>ning against accepted criteria, and/orthrough internal and external reviews. Recent evaluationshave indicated that <strong>Council</strong>’s asset management <strong>plan</strong>ninggenerally compares favourably with best practice elsewherein New Zealand.Climate Change ConsiderationsProjections in the Asset Management Plans of the futuredemand for asset-based services include assessments of theimpacts of predicted climate change on these services wherethese may be significant. For example, allowance has beenmade for a hotter and drier climate in projections of the futuredemand for water supplies in the city.
hutt city <strong>community</strong> <strong>plan</strong> 165Groups of Assets Managed By <strong>Council</strong>Community Assets<strong>Council</strong> manages the <strong>community</strong>’s cultural, social andrecreational assets in the form of libraries, pools, parks,<strong>Council</strong>-owned property, and museums. These assets aremaintained to agreed levels of service set out in the AssetManagement Plan.Swimming PoolsThe provision of public swimming pools throughout the cityhelps contribute to Community Outcome 5 – Lifestyle:ÎÎ Affordable access to <strong>community</strong> facilities that includearts, cultural and recreational options.With six pool complexes available, <strong>Council</strong> endeavours tomaximise benefit to a wide cross-section of the <strong>community</strong> byproviding aquatic recreational, learning and fitness programmes.The Asset Management Plan aims to maintain these importantrecreational facilities to meet <strong>community</strong> need and demand.The Plan identifies maintenance and replacement programmes,aimed at ensuring the continued running of safe, efficient andenjoyable aquatic facilities.PropertyThe property activities contribute to Community Outcomes 5 –Lifestyle and 6 – Regional Foundations:ÎÎ A city that is safe.ÎÎ Affordable access to <strong>community</strong> facilities that include arts,cultural and recreational options.ÎÎ A quality standard of affordable housing.On 1 May 2007, the <strong>Council</strong> transferred most of its socialhousing assets and property management functions toUrban Plus Limited, a <strong>Council</strong>-Controlled Trading Organisation.The company has three principal functions.These are:ÎÎ Ownership and management of the social rental housing.ÎÎ Property management of other <strong>Council</strong> property.ÎÎ Property development in preparation for sale or lease,where property is surplus to <strong>Council</strong>’s needs or to fulfila housing public work requirement, and where thisactivity provides an appropriate return for the costsand risks of development.<strong>Council</strong> provides <strong>community</strong> buildings such as libraries, hallsand toilets as well as social rental housing through Urban PlusLimited to:ÎÎ Ensure local communities have access to venues forrecreational, cultural and governance activities.ÎÎ Provide well maintained and safe living environmentsfor tenants that are affordable and meet their needs.ÎÎ Be a contributor to the <strong>community</strong>’s housing needs.The portfolio comprises the following:ÎÎ Community and civic halls and venues.ÎÎ Library buildings.ÎÎ Public toilets.ÎÎ Community houses.ÎÎ <strong>Council</strong>’s administrative building and suburbanservice centres.ÎÎ Housing units for the elderly and socially disadvantaged.ÎÎ Vacant land.The portfolio is progressively reviewed to ensure that it isused efficiently and meets the needs of identified internaland external clients.Vacant land properties identified by <strong>Council</strong> for possibledisposal go through the appropriate consultation and statutoryprocesses, and <strong>Council</strong> approvals. Following these processesand approvals, those properties de<strong>term</strong>ined by <strong>Council</strong> to beavailable for sale will either be transferred to Urban PlusLimited for development and/or disposal, or sold to otherparties in accordance with the relevant statutory processesand <strong>Council</strong> decisions.The company undertakes Condition Assessment Surveysannually to:ÎÎ Review the condition of the asset for assessing capitalexpenditure and maintenance costs.ÎÎ De<strong>term</strong>ine whether the asset can maintain the requiredlevel of service.ÎÎ Collect information for development of financial forecastsfor Community Plan and associated funding applications.ÎÎ Update and improve the Asset Management Plan.ÎÎ Deliver ongoing service to internal and external customers.ÎÎ Adhere to Risk Management processes.The financial programme for capital expenditure, renewalsand operating expenditure is based on these inspectionsand the projection of each asset’s remaining useful life.
166Parks and ReservesParks and Reserves help contribute to Community Outcome 5– Lifestyle:ÎÎ Affordable access to <strong>community</strong> facilities that include arts,cultural and recreational options.The city has 5,305 hectares of parks and reserves, 54 children’splaygrounds and 29 sports grounds which the <strong>community</strong> utilises.<strong>Council</strong> has reached agreement with Greater WellingtonRegional <strong>Council</strong> whereby Greater Wellington will assume themanagement responsibility for <strong>Council</strong>-owned land that fallswithin the boundaries of a regional park.The purpose of this arrangement is to allow the integratedmanagement of land forming part of the East HarbourRegional Park and the Belmont Regional Park.Infrastructural Assets Managed by <strong>Council</strong><strong>Council</strong> manages the <strong>community</strong>’s infrastructural assetsincluding roading networks, landfills, water supply, stormwaterand wastewater collection and treatment. These assets aremaintained to agreed levels of service set out in the AssetManagement Plan.Roading and TrafficThe roading and traffic activity primarily contributes toCommunity Outcomes 2 – Connected and 7 – Sense of Place:ÎÎ Enhanced roading system.ÎÎ A built environment that is attractive, safe and healthy.The road network provides for safe, reliable and efficienttravel throughout the city. Levels of service are defined inthe Asset Management Plan and achievement against theseis measured through the Communitrak survey. The assetcomprises roads, bridges, footpaths, street lights, trafficimprovements (for example, traffic lights, roundabouts,kerb extensions) and barriers.The overall condition of the network can be de<strong>term</strong>inedaccurately owing to the “visible” nature of the assets.Specialist consultants carry out annual condition ratingsurveys, the results of which are used to identify currentmaintenance needs. Pavement deterioration modellingis also undertaken to ensure levels of service will bemaintained over the longer <strong>term</strong>.Extensions and improvements to the network are achievedthrough:ÎÎ Subdivisional development work, primarily around theperimeter of the current network.ÎÎ Improvement projects within the existing network that areranked in <strong>term</strong>s of benefit/cost analysis, the benefits beingachieved through travel-time savings or safetyenhancements.A seismic review has been undertaken on the city’s bridgesto de<strong>term</strong>ine which would be damaged in the WellingtonLifelines Group’s one in 250 year regional earthquake. Withthe completion of seismic strengthening work on the Estuaryand Melling bridges, all four bridges across the <strong>Hutt</strong> Rivernow meet the required standard. Attention has shifted to theremaining smaller bridges that have been identified as being“at risk”. It is hoped that this work would significantly reducethe disruption to movement around the city in the event of amajor earthquake.Water SupplyThe supply of high quality, affordable water for domestic andcommercial use contributes primarily to Community Outcomes1 – Community Prosperity and 4 – Healthy Environment:ÎÎ A local economy that is attractive to businessesand residents.ÎÎ Clean air, water and land.Through the supply of water to residents and businesses,<strong>Council</strong> contributes to the health of the <strong>community</strong>, and to<strong>community</strong> safety through the fire-fighting capability of thewater supply system.
hutt city <strong>community</strong> <strong>plan</strong> 167<strong>Council</strong> purchases bulk water from Greater Wellington Regional<strong>Council</strong> and distributes it to the <strong>community</strong> through the watersupply system, which comprises 24 reservoirs, 13 pumpingstations and 690 km of underground pipelines. The watersupply network throughout the city is in satisfactory conditionand performs well even at peak demand periods.The areas that require improvement are as follows:ÎÎ Additional capacity for subdivision or development of land.ÆÆ Additional capacity in the network is required forsubdivision or development of land throughout the city.The recent upgrading works in Upper Belmont/Sweetacres will provide water to the new subdivision,improve supply to existing customers and facilitatefurther development.ÎÎ Improving emergency response and contingency <strong>plan</strong>ning.This comprises:ÆÆ Maintaining storage in reservoirs.There is an ongoing programme to upgrade andimprove the structural integrity of reservoirs to meetminimum seismic requirements identified in recentand continuing seismic investigation studies. Thework will help improve the availability of supply afteran earthquake. There is an ongoing programme toinstall auto shut-off valves at key reservoirs.ÎÎ Improving reliability of the water supply.ÆÆ There is an ongoing programme to install bulk link mainsin the city to improve the reliability of water supply tocustomers. Stage One of a link main connecting the<strong>Hutt</strong> Road and Western <strong>Hutt</strong> Road water supply systemswas installed in Petone in 2003/04. Stage Two has beencompleted in conjunction with the upgrading of SH2 bythe NZ Transport Agency. Link mains in Kelson/FairwayDrive and Tama Street/North Street are proposed in theCommunity Plan for 2012/13 and 2015/16 respectively.StormwaterThe stormwater activity primarily contributes to CommunityOutcomes 1 – Community Prosperity and 4 – HealthyEnvironment:ÎÎ A local economy that is attractive to both businessesand residents.ÎÎ Having clean air, water and land.Through the provision of a stormwater drainage systemto manage surface water run-off from urbanisedcatchments <strong>Council</strong>:ÎÎ Contributes to the safety of the <strong>community</strong> by minimisingthe incidence of flooding.ÎÎ Minimises property damage from flooding and thussupports the economy of <strong>Hutt</strong> <strong>City</strong>.ÎÎ Provides a cost-effective stormwater system, whichsupports development in <strong>Hutt</strong> <strong>City</strong>.The stormwater network comprises a primary system of 528 kmof pipes, 24 km of open drains and canals, 13 pumpingstations and five retention dams, streams, and a secondarysystem of overland flowpaths. The pump stations and retentiondams generally provide a satisfactory level of flood protection.The majority of the open watercourses maintained by <strong>Council</strong>perform satisfactorily. The capacity of the Opahu Stream,however, has been significantly reduced over the years by thefilling of much of the original floodplain, narrowing of the streamchannel, landscaping and fencing in private properties.Extensive work has been carried out on the stream, providingimproved capacity, and a major pumping station on thestream’s outlet to the <strong>Hutt</strong> River was completed in 2007/08.Management of the stormwater system is focused on therenewal of existing assets that have reached the end oftheir useful lives and the provision of new assets to providean increase in the stormwater levels of protection forthe <strong>community</strong>.ÎÎ Renewal of pipes: The renewal of piping assets, whileensuring that the stormwater infrastructure is beingmaintained at an acceptable level, also enables <strong>Council</strong>to provide increased piping capacity in line with currenturban design standards. Traditionally stormwater pipingstandards, within <strong>Hutt</strong> <strong>City</strong> and throughout the country,have been designed with sufficient capacity for a fiveyearlyrainfall storm. Current design standards, however,are aimed at providing stormwater piping to have sufficientcapacity for a 10-year rainfall storm. Therefore, as the piperenewal work progresses the standard of stormwaterprotection will gradually increase across the city.ÎÎ <strong>Hutt</strong> <strong>City</strong> <strong>Council</strong> proposes to carry out upgrading ofstormwater drains affected by major upgrading of the<strong>Hutt</strong> River floodplain by Greater Wellington Regional<strong>Council</strong>. This work will be ongoing with $289,000budgeted in the 2009/10 year.ÎÎ Major upgrading of the Awamutu Stream will be carriedout between 2009/10 and 2013/14 at an estimated costof just over $6m.ÎÎ Upgrading projects will be considered annually to mitigateflooding hot spots throughout the city.
168WastewaterThe wastewater activity primarily contributes toCommunity Outcomes 1 – Community Prosperity and4 – Healthy Environment:ÎÎ A local economy that is attractive to both businessesand residents.ÎÎ Having clean air, water and land.Through collecting, treating and disposing of wastewater,<strong>Council</strong> provides a service to residents and businesses whichsupports development in the city and protects the physicalenvironment and health of the <strong>community</strong>.Wastewater is collected by the local wastewater system(which consists of 568 km of pipes and 24 pump stations)and delivered to the Trunk Wastewater System.The Trunk Wastewater System comprises 104 km of trunkpipes, 19 pump stations, two peak flow storage tanks, thewastewater <strong>plan</strong>t at Seaview and the outfall at Pencarrow.The wastewater treatment <strong>plan</strong>t at Seaview, commissionedin 2001, has produced significant improvements for thecity environment.Parts of the wastewater network, however, are still subjectto overloading with inflow of stormwater and infiltration ofgroundwater during heavy rain. This can result in overflowsof diluted wastewater from the system. These overflowscan be detrimental from health, environment and socialperspectives. They are also culturally unacceptable.<strong>Council</strong> has a comprehensive strategy in place to reduceincidences of overflow from the system. This comprises:ÎÎ Reducing wet weather flows by reducing:ÆÆ Infiltration in <strong>Council</strong> drains. There are ongoingprogrammes to replace every pipe in the city overthe life cycle of the pipe.ÆÆ Inflow and infiltration from private drains. Private drainsare a significant contributor to wet weather overloadingand <strong>community</strong> co-operation is required to resolvethe issue.ÎÎ Providing additional capacity to convey higher flows. Workto further increase the capacity of the wastewater systemin the Leighton Avenue catchment will be undertaken inthe 2009/10 year.ÎÎ Providing storage to accommodate wet weather loading.A 10,000 cubic metre storage tank at Silverstream toeliminate the Welcon Scour (wastewater overflow)overflows into the <strong>Hutt</strong> River and minimise the quantityand improve the quality of overflows into the <strong>Hutt</strong> Riverhas been operational since August 2006. The cost ofthis facility was approximately $10 million.Assumptions, Uncertainties and Risk forFinancial EstimatesThe financial programme for renewal of water supply,stormwater and wastewater assets is based on projectionsof useful lives and the replacement value of the system.For above ground assets physical inspection can be carriedout to ascertain the useful lives. Useful lives of undergroundassets are de<strong>term</strong>ined by a combination of physical inspectionand condition modelling.Significant errors in asset valuation could lead to the assetrenewal programme being under- or over-funded. Significanterrors in assessing useful lives of assets will impact on thetiming of renewal works but not on the total renewal programmeover the life cycle of the assets.To minimise the risk, a quality assurance system is in placeto ensure the accuracy of the asset register. In addition,asset valuations are carried out by independent valuersand are subject to audit.Generally the useful lives of assets are consistent with theInternational Asset Management Manual. But in some casesadjustments have been made when experience shows that theremaining lives are shortened or extended by local conditions.
hutt city <strong>community</strong> <strong>plan</strong> 169Summary OF 2004 WASTE MANAGEMENTPLANThe <strong>Hutt</strong> Valley Waste Management Plan (WMP) outlines thehigh level strategy for the future by which the <strong>Hutt</strong> <strong>City</strong> <strong>Council</strong>and the Upper <strong>Hutt</strong> <strong>City</strong> <strong>Council</strong> will jointly manage waste.The WMP breaks new ground for both <strong>Council</strong>s for thefollowing reasons:ÎÎ It is the first time both <strong>council</strong>s have worked together toproduce a WMP for the <strong>Hutt</strong> Valley.ÎÎ It addresses both solid and liquid waste.ÎÎ The WMP has been prepared using the policy frameworkestablished by the New Zealand Waste Strategy (NZWS) –Towards zero waste and a sustainable New Zealand. Priorto this Strategy there were no national standards or targetsconcerning the management of waste.The NZWS outlines a series of national targets for wastemanagement and waste reduction. At this stage the NZWS isnot legally binding on territorial local authorities – providedpositive progress is made to meet targets. If not, governmentmay consider this as an option.The WMP comes in three sections. The first section outlineswhat each <strong>Council</strong> currently has in place, with respect to themanagement of solid and liquid waste in the <strong>Hutt</strong> Valley. Thesecond section outlines the proposed <strong>Hutt</strong> Valley waste targets(which are the same as the NZWS targets) and reports onprogress to date in meeting each target. The third sectionprojects into the future and explores issues and opportunitiesto further reduce waste in the <strong>Hutt</strong> Valley.Positive progress has been made on several fronts to manageand reduce waste in the <strong>Hutt</strong> Valley. This work is set tocontinue. However, it is possible that the NZWS targets fororganic wastes and construction and demolition wastes willnot be met within the set timeframes. While there are noavailable solutions at this point, both <strong>Council</strong>s are aware ofthe issues involved and are keen to investigate options thatare economically, socially and environmentally feasible.A copy of the full 2004 Waste Management Plan can beobtained by contacting <strong>Council</strong> on ph: (04) 570 6666 orgoing to: www.huttcity.govt.nz/<strong>council</strong>-services/rubbish-andrecycling.<strong>Hutt</strong> <strong>City</strong> and Upper <strong>Hutt</strong> <strong>City</strong> <strong>Council</strong>s are currentlyin the process of reviewing the WMP incorporating therequirements of the Waste Minimisation Act. The reviseddocument called the Waste Minimisation and ManagementPlan will be made available on the <strong>Council</strong> website whenthis work has been completed.Document PurposeThe vision for managing waste in the <strong>Hutt</strong> Valley is to movetowards zero waste and a sustainable New Zealand. Theobjectives for the WMP are as follows:ÎÎ To promote and encourage cost-effective, efficient andsustainable waste management practices within the<strong>Hutt</strong> Valley.ÎÎ To minimise the quantity of waste being generated anddisposed of within the <strong>Hutt</strong> Valley by providing strategiesand tactics to encourage waste reduction, reuse, recycling,and recovery before residual disposal.The Local Government Act 2002 continues the originalrequirements of the 1996 Local Government Amendment ActNo 4. This legislation requires that <strong>Council</strong>s effectively andefficiently manage waste from the point of generation throughto disposal. The legislation also requires that the WMP take intoconsideration the waste management hierarchy that involvesa combination of methods including reduction, reuse,recycling, recovery, treatment and disposal.The Plan focuses on the management of solid and liquid wastein the <strong>Hutt</strong> Valley. The Plan does not specifically addressgaseous waste, as this is outside the role of both <strong>Council</strong>s.Both <strong>Council</strong>s will also include details in their respectiveAnnual Reports about the progress achieved during thereporting period.The WMP is consistent with New Zealand’s internationalobligations under the Kyoto Protocol, national policies, regionalpolicies, and existing <strong>Council</strong> waste management policies.Under the Kyoto Protocol New Zealand’s commitment is to limitits total emissions of greenhouse gases to 1990 levels, onaverage, over the period 2008-2012.Within New Zealand emissions of methane from landfills areprojected to decrease, given the trend towards building larger,better designed landfills and a continuing increase in thecollection of landfill gas for energy.With respect to wastewater, total gas emissions were projectedto increase after 2000, but are projected to remain below 1990levels in 2020.
170Linkage to the Community PlanEach city’s Community Plan is put together by the respective<strong>community</strong> and <strong>Council</strong>, and sets the city’s strategic directionfor the next 10 years. The Community Plan is reviewed onceevery three years, and the Community Outcomes containedwithin the document must be reviewed and evaluated onceevery six years to ensure that <strong>Council</strong> is on track.<strong>Hutt</strong> <strong>City</strong> <strong>Council</strong>’s Community Plan notes that:1. <strong>Council</strong>’s Solid Waste Division contributes to strategicgoals and Community Outcomes by:ÆÆ Encouraging waste minimisation and environmentallyfriendly practices.ÆÆ Ensuring refuse is managed and disposed of in a safe,efficient and sustainable manner that maintains thecity’s natural and aesthetic values.New Zealand Waste Strategy (NZWS)The WMP has been prepared in accordance with therequirements of the NZWS.The NZWS is the result of a process involving LocalGovernment New Zealand and the Ministry for the Environment.Together they developed a new national vision for minimisingand better managing waste. The NZWS covers solid, liquidand gaseous waste, and recognises that moving towards zerowaste and a sustainable New Zealand is a long <strong>term</strong> challenge.It has three core goals:ÎÎ Lowering the social costs and risks of waste.ÎÎ Reducing the damage to the environment fromwaste generation and disposal.ÎÎ Increasing economic benefit by more efficient useof materials.Up to now waste policies have focused on end of pipesolutions by dealing with disposal rather than prevention.Yet there is a direct link between New Zealand’s rate ofeconomic growth and the amount of waste we produce.The long <strong>term</strong> challenge is to break this link and achievesustainable growth by learning how to use resources moreefficiently – to produce more with less.The NZWS sets challenging national targets, which areaddressed in Section 3.0 of the full Plan available onwww.huttcity.govt.nz. While the NZWS was reviewed in2003 and 2006, no targets were revised as a result ofthose reviews.2.<strong>Council</strong>’s Wastewater Division contributes to strategic goalsand Community Outcomes by:ÆÆ Contributing to the health of the <strong>community</strong> throughthe efficient collection, treatment and disposal ofwastewater in an environmentally sustainable manner.ÆÆ Providing a high quality, cost-effective wastewatersystem, which supports development in <strong>Hutt</strong> <strong>City</strong>.New Zealand’s waste problem is large, and growing. Wastereduction cannot succeed without a system that manageswaste from the point of generation through to disposal.A more effective, integrated approach to material andresource efficiency is needed at every stage of productionand consumption.
hutt city <strong>community</strong> <strong>plan</strong> 171Water and Sanitary services assessmentsAll territorial authorities are required to carry out assessments of Water and Sanitary Servicesunder Part 7 of the Local Government Act 2002. The primary purpose of an assessment ofsanitary services is to ensure that public health is adequately protected. The legislativerequirement reflects concerns expressed by government agencies in recent years that in someparts of New Zealand little thought has been given to the ability to provide water and sanitaryservices of an acceptable standard sustainably into the future.Although much of the information required to be included in assessments is already contained inasset management <strong>plan</strong>s and other documents and systems, the Local Government Act 2002requires that this information is brought together in a form suitable for consideration by electedmembers of <strong>Council</strong>s and by their communities. The assessments were prepared in 2005 andpublished in the <strong>Council</strong>’s <strong>Long</strong> Term <strong>Council</strong> Community Plan 2005-2015, and the informationhas been updated for inclusion in each subsequent LTCCP.The <strong>Hutt</strong> <strong>City</strong> <strong>Council</strong> assessments of Water and Sanitary Services are summarised below,with a full assessment for each service available from <strong>Council</strong> on ph: (04) 570 6666.Assessments have been prepared for the following water services:ÎÎ Water Supply.ÎÎ Wastewater.ÎÎ Stormwater.The following sanitary services assessments are also included:ÎÎ Cemeteries and Crematoria.ÎÎ Solid Waste.ÎÎ Public Toilets.Water Supply AssessmentUrban areas of <strong>Hutt</strong> <strong>City</strong> are serviced by a reticulated water supply system comprisingapproximately 690 km of pipes, 24 water storage reservoirs and 13 pumping stations.This system distributes water purchased from Greater Wellington Regional <strong>Council</strong> tohomes and businesses across the city.The table below shows the source of water supply to urban areas of <strong>Hutt</strong> <strong>City</strong>.Area of Supply Source of Water Is ChlorineUsuallyAdded?<strong>Hutt</strong> Valley and Eastbourne(excluding Petone,Korokoro, Stokes Valley,Manor Park and Haywards)Petone, KorokoroStokes Valley, Manor Park,HaywardsWainuiomata<strong>Hutt</strong> Valley ArtesianSystem<strong>Hutt</strong> Valley ArtesianSystemTe Marua(Headwaters of <strong>Hutt</strong> River)Wainuiomata (Headwatersof Wainuiomata andOrongorongo Rivers)NoNoYesIs FluorideAdded?The reticulated water supply in <strong>Hutt</strong> <strong>City</strong> is graded Bb (B for the bulk supply and b for the waterdistribution) by the Ministry of Health. This grading indicates that the Ministry of Health assessesthe <strong>Hutt</strong> <strong>City</strong> <strong>Council</strong> water supply as being “satisfactory, low level of risk”. It is probable that anAa grading (“completely satisfactory, very low level of risk”) or an A1a grading (“completelysatisfactory, negligible level of risk, demonstrably high quality”) would be achieved if chlorinewas added to the artesian water supply.YesYesNoYesYes
172In addition to the reticulated water supply, <strong>Hutt</strong> <strong>City</strong> <strong>Council</strong>provides a supply of untreated artesian water extracted directlyfrom the aquifer, which is available to the <strong>community</strong> from“Te Puna Wai Ora”, an artesian water facility and sculpturesituated in the business area of Petone.The majority of properties in rural areas obtain their watersupplies from roof water run-off or from streams on theirproperties, although there is a small number of rural/residentialareas that have a limited (not meeting normal urban standardsfor pressure and flow) water supply from the reticulated watersupply system as an alternative to roof water or stream supplies.Year round inflows can be expected into private water supplieson account of the temperate climate in <strong>Hutt</strong> <strong>City</strong>, althoughshortages can still occur over summer months depending onweather patterns and the amount of water storage built intoeach system. Most rural parts of <strong>Hutt</strong> <strong>City</strong> are within 15 minutesdriving time of the reticulated <strong>Hutt</strong> <strong>City</strong> water supply systemand tanker services are available which can provide waterinto private systems if shortages occur.The quality of water in private water supplies depends onthe quality of the source water, the design of the water supplysystem, including treatment systems, and the way the watersupply system is maintained and operated. These factorsvary between individual systems. Risks can be managedto acceptable levels in well designed, maintained andoperated private water supplies. There is no known historyof significant health problems associated with private watersupplies in <strong>Hutt</strong> <strong>City</strong>.Public Health Risk Management PlanThe Public Health Risk Management Plan which wasdeveloped in 2008 addresses specific risks in relation tothe delivery of drinking water to the residents of <strong>Hutt</strong> <strong>City</strong>.The <strong>plan</strong> has been approved by the Regional Health Boarddrinking water assessors as per the Health (Drinking Water)Amendment Act 2007.The Amendment Act sets out criteria for water suppliers tofollow in order to minimise or mitigate any risks to the watersupply. This covers a wide range of scenarios and uses riskmanagement processes as set out in the New ZealandStandard on Risk Management (AS/NZS 4360:2004).Within the <strong>plan</strong> are the steps involved in delivering high qualitywater from the bulk supply to the end user. It is believed thatalmost all conceivable risks to the water supply have beenidentified within the <strong>plan</strong>. However, in order to provide theresilience that is needed in the water supply activity, triggersand reviews have been built into the <strong>plan</strong> to deal with anynew scenarios.Future DemandThere is not expected to be a significant change in waterconsumption in <strong>Hutt</strong> <strong>City</strong> over the next 20 years unlessmeasures such as water metering are introduced.
hutt city <strong>community</strong> <strong>plan</strong> 173Key Issues and <strong>Hutt</strong> <strong>City</strong> <strong>Council</strong> ProposalsIssues associated with the water supply to the different communities in <strong>Hutt</strong> <strong>City</strong> have been identified in <strong>term</strong>s of their potential to compromise the achievement of health and environmental aspects of<strong>Hutt</strong> <strong>City</strong> <strong>community</strong> outcomes.IssueNon-chlorination of Artesian Water SupplyThe artesian water supply in <strong>Hutt</strong> <strong>City</strong> is not chlorinated. This means that there is no disinfectingagent in the water to counteract contaminants that may enter the water system. It also meansthat the water is free from the odour and taste of chlorine and from chlorine by-products.The <strong>Hutt</strong> <strong>City</strong> artesian water supply system is managed to high standards which recognise that,although the likelihood of contamination of the <strong>Hutt</strong> <strong>City</strong> water supply system is lower than formost other public water supplies, the potential consequences of contamination are greaterthan for chlorinated water supplies.Despite a history of satisfactory performance there remains a higher risk associated with the<strong>Hutt</strong> Valley artesian water supply (with respect to the consequences of contamination of the water)than for chlorinated water supplies. This is reflected in the Bb grading by the Ministry of Health forthe <strong>Hutt</strong> Valley artesian water supply. It is likely that an Aa or A1a grading could be achieved if thesupply was chlorinated.The level of <strong>community</strong> awareness of the low level of the risk associated with the current nonchlorinatedwater supply is uncertain and <strong>community</strong> acceptance or otherwise of thisrisk has not been de<strong>term</strong>ined.Non-fluoridation of Petone Water SupplyFluoride is added to most public water supplies in New Zealand as a dental health measure.It is not necessary to add fluoride in order to produce water suitable for consumption. The watersupply system is simply used as a means of distributing fluoride efficiently and cost-effectivelyto communities. Fluoridation of water supplies is therefore not a water supply issue but a publichealth issue.<strong>Hutt</strong> <strong>City</strong> <strong>Council</strong> ProposalThat <strong>Hutt</strong> <strong>City</strong> <strong>Council</strong> carries out a process of consultation to inform the <strong>community</strong> of therisks associated with the non-chlorination of the public water supply and to obtain <strong>community</strong>views on:ÎÎAcceptance of a higher level of risk and retention of an un-chlorinated artesian water supply.ÎÎRejection of a higher level of risk and acceptance of chlorination of the artesian water supply.The possible fluoridation of the Petone water supply was the subject of an extensive publicconsultation process with the Petone <strong>community</strong>. This process showed that there was astrong preference for the retention of the un-fluoridated water supply that Petone hasreceived (with some temporary short-<strong>term</strong> interruptions) since a reticulated water supplywas first provided. No further action is proposed.
174IssueLevel of Security of Bulk Water Supply Against Water ShortagesThe current level of security (1 in 50 year drought) against bulk water shortages could be eroded bygrowth in the demand for water. Although significant population growth in <strong>Hutt</strong> <strong>City</strong> is not expectedover the next 20 years, recent growth over the wider Wellington region has exceeded projections.This is likely to necessitate either:ÎÎThe construction of additional bulk water supply infrastructure (with a possible increase in bulkwater costs to <strong>Hutt</strong> <strong>City</strong>), orÎÎA reduction in the average per capita water consumption from the public water supply if thecurrent level of security of supply is to be maintained.Heavy Metals Leaching out of PlumbingSome plumbing fittings contain heavy metals such as lead, which can leach into the water supply.Eastbourne – Security of SupplyThe water supply to Eastbourne flows in a southwards direction from Point Howard through twopipelines in Marine Drive (one of which will need to be decommissioned in the future). In the eventof a failure of these pipelines the water supply to Eastbourne south of the point of any failure will beimmediately disrupted owing to an inability for Eastbourne to be supplied from an alternative source.Silverstream Bulk Water Supply PipelineThe main bulk water supply pipeline from Te Marua Treatment Plant passes over the SilverstreamRoad Bridge and may be vulnerable in a major earthquake or major flood in the <strong>Hutt</strong> River. Thiswould shut off the bulk water supply to Manor Park and Haywards (and the primary supply toPorirua <strong>City</strong> and much of Wellington <strong>City</strong>).<strong>Hutt</strong> <strong>City</strong> <strong>Council</strong> ProposalThat a co-operative approach between the <strong>Council</strong>s in the Wellington area to reducingaverage water consumption as an alternative to expansion of the bulk water systembe supported.This issue is not confined to <strong>Hutt</strong> <strong>City</strong>. It is proposed that <strong>Hutt</strong> <strong>City</strong> <strong>Council</strong> request theMinistry of Health to produce material to inform communities in New Zealand of this risk,of the advantages of not using the “first flush” of water for consumption, and to considerlimits on some metal levels in fittings for potable (drinking water) plumbing.<strong>Hutt</strong> <strong>City</strong> will investigate the need for a reservoir at the southern end of Eastbourne to improvethe security of the water supply to Eastbourne.Greater Wellington Regional <strong>Council</strong> has carried out investigations into the security of thispipeline and into alternatives. Security of this pipeline has been improved as a result of thestrengthening of the Silverstream Bridge although it would be unlikely to survive a majormovement of the Wellington faultline.
hutt city <strong>community</strong> <strong>plan</strong> 175IssuePrivate Water SuppliesMost private water supplies are sourced from roof water run-off or from streams. A degree ofcontamination of water from these sources is inevitable. Contaminants may also be able to enteron-site water storage tank(s). Private water supply systems may not incorporate treatment capableof removing or mitigating the effects of contaminants that are likely to enter the water supply andmay not have water quality testing programmes, <strong>plan</strong>ned maintenance programmes or keepsystem records.<strong>Hutt</strong> <strong>City</strong> <strong>Council</strong> Proposal<strong>Hutt</strong> <strong>City</strong> <strong>Council</strong> will provide information on the risks associated with on-site water suppliesand how these can be managed. This information may be developed in association withhealth authorities.<strong>Hutt</strong> <strong>City</strong> <strong>Council</strong> will develop guidelines for new on-site water supply installations.<strong>Hutt</strong> <strong>City</strong> <strong>Council</strong> will establish a database of private water supply systems in <strong>Hutt</strong> <strong>City</strong>. It will carryout inspections of a proportion of on-site water supplies as part of maintaining this database,also <strong>Hutt</strong> <strong>City</strong> <strong>Council</strong> will establish a system to track new on-site water supply systems.Roles of <strong>Hutt</strong> <strong>City</strong> <strong>Council</strong> – Public Water Supply<strong>Hutt</strong> <strong>City</strong> <strong>Council</strong> is responsible for ensuring the public watersupply in <strong>Hutt</strong> <strong>City</strong> is managed in a way that contributestowards the achievement of <strong>community</strong> outcomes for the city.This involves:ÎÎ Setting standards to be achieved in the provision of thewater supply.ÎÎ Setting water supply policy.ÎÎ Managing the interface with consumers.ÎÎ Monitoring the performance of the water supply activity.ÎÎ Advocating to and working with Greater WellingtonRegional <strong>Council</strong> to ensure that the bulk water supplyto <strong>Hutt</strong> <strong>City</strong> meets the requirements of the <strong>community</strong>.ÎÎ Managing the interface with Capacity – the <strong>Hutt</strong> <strong>City</strong><strong>Council</strong> and Wellington <strong>City</strong> <strong>Council</strong> jointly-owned wa<strong>term</strong>anagement entity.ÎÎ Approving budgets for the water supply activity includingthe setting of water supply charges through the CommunityPlan process.ÎÎ Carrying out an assessment of water supply in <strong>Hutt</strong> <strong>City</strong>as required by the Local Government Act 2002.Capacity is responsible to <strong>Hutt</strong> <strong>City</strong> <strong>Council</strong> for:ÎÎ Making recommendations on standards and policy.ÎÎ Managing the water supply system through the assetmanagement <strong>plan</strong> process to achieve required outcomes.ÎÎ Ensuring risks are identified and managed withinacceptable limits.ÎÎ Managing the maintenance and operation of the watersupply system.ÎÎ Developing and implementing programmes for theprogressive replacement of the water supply system.ÎÎ Developing and implementing programmes to upgradeand extend the water supply system to meet future demand.ÎÎ Ensuring new water supply infrastructure is designed andconstructed to required standards.ÎÎ Monitoring the performance of the water supply activityincluding the quality of water supplied.Roles of <strong>Hutt</strong> <strong>City</strong> <strong>Council</strong> – Private WaterSuppliesThe roles of <strong>Hutt</strong> <strong>City</strong> <strong>Council</strong> with respect to private watersupplies reflect that both private and public water suppliescontribute towards the achievement of <strong>community</strong> outcomes.ÎÎ Advisory – Providing advice to property owners on risksassociated with on-site water supplies and on themanagement of on-site water supply systems. (Note thatthis role is not mandatory but is recommended reflectingthe customer focus of <strong>Hutt</strong> <strong>City</strong> <strong>Council</strong>.)ÎÎ Regulatory – Setting requirements for servicing of newdevelopments including requirements for on-site watersupplies and managing compliance with New ZealandBuilding Code Requirements for Water Supply.ÎÎ Assessments – Carrying out an assessment of groupingsof private water supplies as part of a wider assessmentof water supply in <strong>Hutt</strong> <strong>City</strong> as required by the LocalGovernment Act 2002.ÎÎ Partial Service Provider – Providing water supply fortankers to enable on-site water supplies to be replenished.
176Wastewater AssessmentUrban areas of <strong>Hutt</strong> <strong>City</strong> are serviced by a reticulatedwastewater system that is intended to provide for the effectiveand reliable disposal of domestic and industrial wastewaterfrom residential properties and the business <strong>community</strong>.The local wastewater reticulation to which each servicedproperty is connected comprises a network of approximately568 km of relatively small diameter pipes (typically 150 mmto 225 mm in diameter). The local wastewater reticulationdischarges into a system of 104 km of trunk sewers (rangingup to 1,350 mm in diameter) which convey wastewater to thetreatment <strong>plan</strong>t at Seaview.Most wastewater pipelines operate by gravity drainage (theyrun downhill) although there are 43 pumping stations whichpump wastewater to higher levels when gravity drainage isnot practical.The trunk wastewater system services both <strong>Hutt</strong> <strong>City</strong> andUpper <strong>Hutt</strong> <strong>City</strong>. Wastewater from reticulated areas of <strong>Hutt</strong> <strong>City</strong>and Upper <strong>Hutt</strong> <strong>City</strong> is treated at the Seaview WastewaterTreatment Plant. An 18 km long 1,350 mm diameter pressurisedpipeline conveys disinfected effluent from the SeaviewTreatment Plant to an outfall at Pencarrow Head a shortdistance beyond the eastern entrance to Wellington Harbour.A by-product of the treatment process is bio-solids, which arethe stabilised material extracted from the wastewater duringthe treatment process. The bio-solids produced by the SeaviewTreatment Plant are dried before being disposed of by landfill.The flow through the treatment <strong>plan</strong>t in 2008 was approximately55,600 cubic metres per day averaged over the entire year andapproximately 41,000 cubic metres per day during dry weather.The following table summarises the characteristics of the untreated wastewater and of the effluent from the Seaview Treatment Plant.cBOD5 (g/m 3 ) (Carbonaceous Biochemical Oxygen Demand over5 days – a measure of the potential for carbonaceous material inthe wastewater to deplete levels of dissolved oxygen)Suspended solids (g/m 3 ) (A measure of the level of finely suspendedmaterial)Faecal coliforms (cfu/100ml) (A measure of levels of bacteriaoriginating from the gut of animals including humans)*Average Values over the period December 2007 – November 2008UntreatedWastewater*TreatedEffluentfromTreatmentPlant*ResourceConsentLimit forTreatedEffluent194 8 50244 13 505,000,000 284 1,000Wastewater from properties in rural areas of <strong>Hutt</strong> <strong>City</strong> is generally disposed of by means of conventional septic tanks and on-siteeffluent disposal fields. Solids that accumulate in septic tanks must be removed periodically and disposed of. A septic tank cleaningservice is provided by several companies and usually involves pumping the contents of the septic tank into a tanker for subsequentcontrolled disposal into the <strong>Hutt</strong> <strong>City</strong> wastewater system.The adequacy of on-site disposal systems depends on their initial design and construction, the ability of effluent disposal fields toaccommodate the volumes of effluent discharged, and the ongoing maintenance and operation of the systems. These factors varybetween individual systems. Environmental and health risks can be managed to acceptable levels in on-site wastewater systems thatare designed, constructed, operated and maintained to appropriate standards.There is no known history of significant health or environmental problems associated with the remaining private on-site wastewatersystems in <strong>Hutt</strong> <strong>City</strong> although further environmental monitoring is recommended.Future DemandThe population is projected to increase slightly across the <strong>Hutt</strong> Valley over the period 2006 to 2031, with a medium average annualincrease of 0.1%. Demand forecasts estimate a slight increase in total wastewater flows over the next 20 years, in accordance withgrowth projections.
hutt city <strong>community</strong> <strong>plan</strong> 177Key Issues and <strong>Hutt</strong> <strong>City</strong> <strong>Council</strong> ProposalsIssues associated with wastewater disposal from the different communities in <strong>Hutt</strong> <strong>City</strong> have been identified in <strong>term</strong>s of their potential to compromise the achievement of health and environmentalaspects of <strong>community</strong> outcomes for <strong>Hutt</strong> <strong>City</strong>.IssueFuture Effluent Disposal from the Seaview Treatment PlantThe Main Outfall Sewer that conveys effluent from the Seaview Treatment Plant to the outfall to theocean at Pencarrow Head has an estimated remaining life of 20 years. Either rehabilitation of thepipeline or an alternative means of effluent disposal (which could be a replacement pipeline) willbe necessary.Treated and disinfected effluent is discharged at Pencarrow Head from an outfall located near theshoreline. The effects of the effluent discharge are being monitored. Any adverse effects mayinfluence a decision on future effluent disposal.Wastewater Overflows to the Waiwhetu StreamThere are wastewater discharges to the Waiwhetu Stream during heavy rainfall owing to excessivestormwater entry to the wastewater system in the Leighton Avenue area.<strong>Hutt</strong> <strong>City</strong> <strong>Council</strong> ProposalA 25 year Resource Consent was granted by Greater Wellington Regional <strong>Council</strong> inAugust 2006 for the ongoing disposal of effluent from the Seaview Treatment Plant at thePencarrow outfall.A Management Plan for the Main Outfall Pipeline has been prepared and ongoing monitoringof the condition of the pipeline is being undertaken.To continue implementation of a comprehensive strategy of integrated measures to reduce thewet weather loading on the wastewater system to acceptable levels. This strategy includes:ÎÎReducing direct discharges of stormwater to the wastewater system through inflowreduction programmes.ÎÎProgrammes for the replacement of defective public drains.ÎÎDevelopment of a policy on the replacement of private drains identified as not meetingrequired standards.ÎÎProvision of storage for peak wet weather flows.ÎÎProvision of additional system capacity to reduce localised constrictions in thewastewater system (taking account of effects of the additional flows on the wastewatersystem downstream).
178IssueWet Weather Overloading of the Wastewater SystemProblems are also experienced with overloading of the wastewater system in other areas of the cityowing to excessive stormwater entry to the wastewater system during heavy or prolonged rainfall.At other times the wastewater system generally operates very well. Areas where high wet weatherflows are a particular problem include Wainuiomata, Stokes Valley, Naenae and to a lesser extentparts of Eastbourne, <strong>Hutt</strong> Central and the Western Hills.Coliform Levels – South End of EastbourneRelatively high coliform levels have been recorded in the sea in the vicinity of a property at the endof Eastbourne that retains a septic tank for wastewater disposal.On-Site Wastewater Disposal SystemsThe inadequate design, operation and/or maintenance of on-site wastewater disposal systemscan lead to health and environmental problems.Wet Weather Discharges from the Western Hills Trunk SewerHigh wet weather flows from Upper <strong>Hutt</strong> and to a lesser extent from Stokes Valley can causeoverloading of the Western Hills trunk sewer and downstream infrastructure leading to overflowsto the <strong>Hutt</strong> River south of Manor Park.<strong>Hutt</strong> <strong>City</strong> <strong>Council</strong> ProposalTo continue implementation of a comprehensive strategy of integrated measures to reduce thewet weather loading on the wastewater system to acceptable levels. This strategy includes:ÎÎReducing direct discharges of stormwater to the wastewater system through inflowreduction programmes.ÎÎProgrammes for the replacement of defective public drains.ÎÎThe adoption and implementation of a policy on the replacement of private drainsidentified as not meeting required standards.ÎÎProvision of storage for peak wet weather flows.ÎÎProvision of additional system capacity to reduce localised constrictions in thewastewater system (taking account of effects of the additional flows on the wastewatersystem downstream).Investigations into possible links between the septic tank and coliform levels have beencarried out and no link has been established. <strong>Hutt</strong> <strong>City</strong> <strong>Council</strong> will investigate the possibilityof providing a reticulated wastewater connection to this property in conjunction with anyalterations to the wastewater infrastructure as part of the proposed redevelopment of theKorohiwa area.<strong>Hutt</strong> <strong>City</strong> <strong>Council</strong> has commenced the preparation of a database of on-site wastewaterdisposal systems in the city. It is proposed that this be aligned with a similar regionaldatabase being prepared by Greater Wellington Regional <strong>Council</strong>.It is further proposed that a programme to monitor health and environmental effects of on-sitewastewater disposal in <strong>Hutt</strong> <strong>City</strong> be developed in conjunction with Greater WellingtonRegional <strong>Council</strong>. This programme would include site inspections of a proportion of on-sitewastewater systems. <strong>Hutt</strong> <strong>City</strong> <strong>Council</strong> will establish a system to track new on-site wastewaterdisposal systems.A wet weather peak flow storage facility has been constructed at Silverstream to reducethese overflows and provide them with partial treatment during these extreme events.This $8.3 million facility has been operational since August 2006.
hutt city <strong>community</strong> <strong>plan</strong> 179Roles of <strong>Hutt</strong> <strong>City</strong> <strong>Council</strong> – Public WastewaterSystem<strong>Hutt</strong> <strong>City</strong> <strong>Council</strong> is responsible for ensuring the publicwastewater system is managed in a way that contributestowards the achievement of <strong>community</strong> outcomes for the city.This involves:ÎÎ Setting standards to be achieved in the managementof wastewater disposal.ÎÎ Setting wastewater policy.ÎÎ Public education on wastewater management issues.ÎÎ Managing the interface with the <strong>community</strong>.ÎÎ Monitoring the environmental effects of wastewater (andeffluent) discharges.ÎÎ Managing the interface with Upper <strong>Hutt</strong> <strong>City</strong> <strong>Council</strong>through the <strong>Hutt</strong> Valley Services Committee.ÎÎ Managing the interface with Capacity – the <strong>Hutt</strong> <strong>City</strong><strong>Council</strong> and Wellington <strong>City</strong> <strong>Council</strong> jointly-owned wa<strong>term</strong>anagement entity.ÎÎ Approving budgets for the wastewater activity throughthe Community Plan process.ÎÎ Monitoring the performance of the wastewater activity.ÎÎ Carrying out an assessment of wastewater managementin <strong>Hutt</strong> <strong>City</strong> as required by the Local Government Act 2002.Capacity is responsible to <strong>Hutt</strong> <strong>City</strong> <strong>Council</strong> for:ÎÎ Making recommendations on standards and policy.ÎÎ Managing the wastewater system through the assetmanagement <strong>plan</strong> process to achieve required outcomes.ÎÎ Ensuring risks are identified and managed withinacceptable limits.ÎÎ Managing the maintenance and operation of thewastewater system.ÎÎ Developing and implementing programmes for theprogressive replacement of parts of the wastewatersystem as they reach the end of their useful life.ÎÎ Developing and implementing programmes to upgradeand extend the wastewater system as required to meetfuture demand.ÎÎ Ensuring new wastewater infrastructure is designedand constructed to required standards.ÎÎ Monitoring performance as an input to the monitoringof the wastewater activity by <strong>Hutt</strong> <strong>City</strong> <strong>Council</strong>.Roles of <strong>Hutt</strong> <strong>City</strong> <strong>Council</strong> – Private WastewaterSystemsThe roles of <strong>Hutt</strong> <strong>City</strong> <strong>Council</strong> with respect to private wastewatersystems reflect that both private and public wastewater systemscontribute towards the achievement of <strong>community</strong> outcomes.ÎÎ Advisory – Providing advice to property owners on risksassociated with septic tank systems and on the operationand management of septic tank systems.ÎÎ Regulatory – Setting requirements for servicing of newdevelopments including verifying compliance of newinstallations with required standards (normally AS/NZS1547:2000).ÎÎ Monitoring – Maintaining records of septic tank systemsand monitoring health and environmental issues associatedwith groupings of these systems.ÎÎ Assessments – Carrying out an assessment of groupings ofprivate wastewater systems as part of a wider assessmentof wastewater management in <strong>Hutt</strong> <strong>City</strong> as required by theLocal Government Act 2002.ÎÎ Possible Future Service Provider – Monitoring developmentin areas serviced by septic tanks and the performance ofgroupings of on-site wastewater systems to de<strong>term</strong>ine if andwhen reticulated wastewater systems may be appropriate.
180Stormwater AssessmentResidential properties and the business <strong>community</strong> indeveloped areas of <strong>Hutt</strong> <strong>City</strong> are serviced by a reticulatedstormwater system comprising approximately 528 km ofstormwater pipes, over 11,200 manholes, five retention damsand 13 pumping stations which convey stormwater to receivingwatercourses. The stormwater pipelines in the <strong>Hutt</strong> <strong>City</strong> systemrange in size from 100 mm to 1,800 mm in diameter with 65%of the pipes being between 225 mm and 450 mm in diameter.Most of the <strong>Hutt</strong> <strong>City</strong> stormwater reticulation operates bygravity drainage. This means that the pipes run downhill andare not intended to operate under pressure. The 13 stormwaterpumping stations provide drainage from localised low-lyingareas when gravity drainage is not effective.Greater Wellington Regional <strong>Council</strong> is responsible formanaging the major watercourses throughout the Wellingtonregion including the <strong>Hutt</strong> River, the Wainuiomata River, theWaiwhetu Stream (from below Naenae) and the lower sectionof the Stokes Valley Stream. The majority of stormwater from<strong>Hutt</strong> <strong>City</strong> discharges into these watercourses.Every stormwater pipe and channel has a finite capacity.Most of the stormwater pipelines in <strong>Hutt</strong> <strong>City</strong> were designed toaccommodate rainfall with a 20% chance of occurring annually(a 5-year average return period). It is not practical to providestormwater drains that can accommodate all foreseeablerainfall and the risk of blockages in stormwater systemscannot be eliminated. Stormwater systems in “greenfields”developments are now required to comprise both a primarysystem consisting of pipes and open channels intended tocater for more frequent rainfall events and a secondary systemto cater for higher intensity rainfall events. The secondarysystem consists of overland floodpaths, which conveyfloodwaters safely when the primary system is unable to cope.New stormwater pipelines are now designed to accommodaterainfall with an average return period between 10 years (10%chance of occurring annually) and 50 years (2% chance ofoccurring annually) depending on the risk in specific situations.It is expected that changing rainfall patterns will continue to bereflected in an increase in the frequency of severe rainstormsthat exceed the original design capacity of the stormwatersystem. Stormwater systems in <strong>Hutt</strong> <strong>City</strong> are now designed toaccommodate more intense rainfall to reflect climate change.In rural areas of <strong>Hutt</strong> <strong>City</strong> stormwater run-off from roof areas isoften diverted to storage tanks as a source of water for on-sitewater supply systems. Stormwater not used for water supplypurposes is generally disposed of to land or to watercourses.The quality of stormwater is highly variable. Stormwater run-off,and in particular the “first flush” of stormwater run-off followinga dry period, often contains many contaminants. These caninclude sediments, oils, greases, metals and organic materialwashed from roads and other impervious areas together withrubbish and contaminants illegally discharged into thestormwater system. Contamination of stormwater can alsoarise from overflows from the wastewater system (generallyowing to wet weather overloading of the wastewater system– see wastewater assessment).Many contaminants entering the stormwater system aresubsequently discharged to watercourses. There is expectedto be a greater focus on the effects of stormwater dischargeson watercourses and on ways that these effects can practicallybe reduced.The quality of water at popular swimming beaches in the cityis monitored. This monitoring indicates that beach water isusually of a good standard that is suitable for swimmingalthough water quality usually falls for a period followingheavy rainfall.Future DemandDevelopment in the city is not expected to be of a scale whichwill substantially increase stormwater run-off overall, althoughit may be significant in localised areas. The focus of stormwa<strong>term</strong>anagement in the future is likely to shift away from simplyproviding pipes to convey stormwater, towards the developmentof an integrated range of measures to manage the potentiallyadverse effects of stormwater run-off including flooding,environmental degradation and pollution.
hutt city <strong>community</strong> <strong>plan</strong> 181Key Issues and <strong>Hutt</strong> <strong>City</strong> <strong>Council</strong> ProposalsIssues associated with stormwater management in the different communities in <strong>Hutt</strong> <strong>City</strong> have been identified in <strong>term</strong>s of their potential to compromise the achievement of health and environmentalaspects of <strong>Hutt</strong> <strong>City</strong> <strong>community</strong> outcomes.IssueManaging Adverse Effects of Stormwater Run-offFlooding owing to overloading of the stormwater system.Climate change eroding the level of protection against flooding provided by the stormwater system.Degradation of watercourses owing to contaminated stormwater run-off.Adequacy of Black Creek Channel – WainuiomataOvertopping of the Black Creek Channel during severe rainfall.Secondary FloodpathsLack of secondary floodpaths to convey floodwater safely when the primary stormwater systemis blocked or overloaded.Obstruction of Stormwater Outlets on BeachesA build-up in beach levels may restrict the ability of stormwater outlets to discharge.<strong>Hutt</strong> <strong>City</strong> <strong>Council</strong> Proposal<strong>Hutt</strong> <strong>City</strong> has adopted a range of measures in response to these issues. With the flooding thathas occurred in recent years the point has now been reached where it is proposed that thesemeasures and additional measures that may be appropriate are formalised in a comprehensivestormwater strategy for <strong>Hutt</strong> <strong>City</strong>. This will be developed with input from, and as a basis forconsultation with, the <strong>community</strong> and will enable the approach to stormwater managementadopted by <strong>Hutt</strong> <strong>City</strong> <strong>Council</strong> to be more clearly communicated to the <strong>community</strong>. The strategywill include environmental as well as flood-related aspects of stormwater management.Stage 1 of a programme of major upgrading of the Black Creek channel was completedin 2005/06. Stage 2 was carried out in 2006/07, with the replacement of the Best StreetBridge works completed in 2007/08. Further works to continue the upgrading areproposed from 2010/11.It is proposed to continue to require the provision of secondary stormwater floodpaths in new(greenfields) developments to safely convey floodwater when the stormwater pipes areoverloaded. Providing secondary stormwater floodpaths is often not possible in well-developedareas although they are provided where they are reasonably practical. The capacity provided innew pipes will reflect the adequacy of secondary floodpaths. Information on the provision ofstormwater floodpaths will be incorporated in a stormwater strategy for the city.It is proposed to continue to improve stormwater outlets on beaches where practical. This isde<strong>term</strong>ined on a case-by-case basis. The approach taken to stormwater outlets will be setout in a stormwater strategy for the city.
182IssueOvertopping and Maintenance of Private StreamsOverflows from private streams and accumulation of debris following severe storms.Stormwater Capacity in Areas of Stokes ValleyThe capacity of some of the main stormwater pipelines which convey stormwater from areasof Stokes Valley to the Stokes Valley Stream is less than desirable leading to backing up andoverflowing of stormwater drains during severe rainfall. The issue is compounded by a lacksof secondary floodpaths.State Highway 2 Obstructing Overland Flow of FloodwaterThere are several low lying areas between State Highway 2 (SH2) and the base of the Western Hillswhere floodwater may be trapped behind the State Highway.High Floodwater Levels in the Awamutu StreamFlooding has been experienced owing to high water levels in the Awamutu Stream.High Floodwater Levels in the Waiwhetu StreamFlooding has been experienced owing to high water levels in the Waiwhetu Stream.<strong>Hutt</strong> <strong>City</strong> <strong>Council</strong> Proposal<strong>Hutt</strong> <strong>City</strong> <strong>Council</strong> will continue to investigate measures such as the provision of secondarystormwater floodpaths and the provision of peak flow bypasses to reduce the flood riskassociated with private streams. The practicality of these measures must be de<strong>term</strong>ined ona case-by-case basis. The management of private watercourses including responsibilitiesof the various parties will be formalised in a stormwater strategy for the city.It is proposed that the provision of new main stormwater pipelines in areas where repeatedproblems have been experienced will be investigated as an option in a stormwater strategyfor <strong>Hutt</strong> <strong>City</strong>.A detailed assessment of the level of risk in low lying areas between SH2 and the WesternHills is being carried out and options to mitigate any significant risks are being identified.It is proposed that the assessment be incorporated into a comprehensive stormwaterstrategy for <strong>Hutt</strong> <strong>City</strong>.Water levels in the Awamutu Stream depend significantly on levels in the Waiwhetu Stream.Options for upgrading of the Awamutu Stream channel and lowering downstream water levelsare being investigated as part of the modelling of the Awamutu and Waiwhetu Streams.Upgrading of the Awamutu Stream will be carried out from 2009/10.Greater Wellington Regional <strong>Council</strong>, which is responsible for the majority of the WaiwhetuStream, is preparing a floodplain management <strong>plan</strong> for the Waiwhetu Stream. This will defineoptions for reducing the flood risk associated with the stream as a basis for a programme ofupgrading works.<strong>Hutt</strong> <strong>City</strong> <strong>Council</strong> is continuing investigations into options beyond the Waiwhetu Stream corridorfor mitigating the effects of high levels in the Waiwhetu Stream. A stormwater pumping stationand a delivery main have been constructed in 2007/08 to improve stormwater drainage in theGracefield industrial area adjacent to the Waiwhetu Stream.
hutt city <strong>community</strong> <strong>plan</strong> 183IssueFlooding From the <strong>Hutt</strong> RiverThe <strong>Hutt</strong> River represents the major flood risk to the <strong>Hutt</strong> Valley. Failure of the <strong>Hutt</strong> River flooddefences would lead to major flooding in the <strong>Hutt</strong> Valley.Backflows from the <strong>Hutt</strong> RiverA backflow from the <strong>Hutt</strong> River up the stormwater system could cause significant flooding.Flooding in the <strong>Hutt</strong> River Coinciding With Heavy Rainfall in the <strong>Hutt</strong> ValleyFloodgates on stormwater outlets to the <strong>Hutt</strong> River will be closed when the <strong>Hutt</strong> River is in flood.Stormwater is unable to discharge at these times (except for some localised areas provided withpumping stations). The backup of stormwater may be significant and lead to flooding if there isheavy rainfall in the <strong>Hutt</strong> Valley when the outlets are closed.High Flood Levels in the Opahu StreamHigh flood levels in the Opahu Stream can lead to flooding in adjacent areas.Overland Flows in Rural AreasProblems have been experienced with overland flows of floodwater resulting from the overtoppingof the Wainuiomata Stream.<strong>Hutt</strong> <strong>City</strong> <strong>Council</strong> ProposalThe flood risk associated with the possible failure of the <strong>Hutt</strong> River flood defences is beingaddressed through an $80 million programme of works being implemented by GreaterWellington Regional <strong>Council</strong>.Additional backflow protection has been provided on several critical stormwater outlets to the<strong>Hutt</strong> River. It is proposed that an assessment of risks associated with the possibility ofbackflows through stormwater drains be carried out as a basis for establishment of definedcriteria/policy on backflow protection and that the outcome is incorporated into acomprehensive stormwater strategy for <strong>Hutt</strong> <strong>City</strong>.An assessment of risks associated with the closure of floodgates preventing stormwateroutflow will be carried out as a basis for the establishment of defined criteria/policies onbackflow protection. The outcome will be incorporated into a comprehensive stormwaterstrategy for <strong>Hutt</strong> <strong>City</strong>.Major works have substantially increased the capacity of the lower sections of the Opahu Streamchannel. A major pumping station on the outlet from the stream to the <strong>Hutt</strong> River has beenconstructed. This will enable the stream to discharge into the <strong>Hutt</strong> River when the river is in flood.The remaining flood risk associated with the Opahu Stream channel was assessed in 2008/09and the results of the assessment will be included in a stormwater strategy for <strong>Hutt</strong> <strong>City</strong>.Investigations into measures to alleviate this problem have identified a combination ofremedial measures that are being implemented. During heavy rainfall stormwater run-off inrural areas will follow natural flowpaths which may include overland flows. It is proposed thatflowpaths in rural areas during severe rainfall be required to be identified and documentedon <strong>plan</strong>s as part of development proposals. This will assist the de<strong>term</strong>ination of measuresnecessary to ensure that acceptable levels of protection against the flooding of buildingsare achieved.
184Roles of <strong>Hutt</strong> <strong>City</strong> <strong>Council</strong> –Stormwater Management<strong>Hutt</strong> <strong>City</strong> <strong>Council</strong> is responsible for ensuring that the effectsof stormwater run-off are managed in a way that contributestowards the achievement of <strong>community</strong> outcomes for the city.This involves:ÎÎ Setting standards to be achieved in the managementof stormwater runoff.ÎÎ Setting the stormwater policy.ÎÎ Public education on stormwater management issues.ÎÎ Managing the interface with the <strong>community</strong>.ÎÎ Monitoring the environmental effects (such as streamhealth) of stormwater run-off.ÎÎ Regulating surface water drainage from new buildingsin <strong>term</strong>s of the New Zealand Building Code.ÎÎ Providing advice on stormwater management.ÎÎ Managing the interface with Capacity – the <strong>Hutt</strong> <strong>City</strong><strong>Council</strong> and Wellington <strong>City</strong> <strong>Council</strong> jointly-owned wa<strong>term</strong>anagement entity.ÎÎ Approving budgets for the stormwater activity throughthe Community Plan process.ÎÎ Monitoring the performance of the stormwater activity.ÎÎ Carrying out an assessment of stormwater management in<strong>Hutt</strong> <strong>City</strong> as required by the Local Government Act 2002.Capacity is responsible to <strong>Hutt</strong> <strong>City</strong> <strong>Council</strong> for:ÎÎ Making recommendations on standards and policy.ÎÎ Managing the stormwater run-off through the assetmanagement <strong>plan</strong> process to achieve required outcomes.ÎÎ Ensuring risks are identified and managed withinacceptable limits.ÎÎ Managing the maintenance and operation of thestormwater system.ÎÎ Developing and implementing programmes for theprogressive replacement of the stormwater system.ÎÎ Developing and implementing programmes to upgradeand extend the stormwater system as required to meetrequired standards.ÎÎ Ensuring new stormwater infrastructure is designedand constructed to required standard.ÎÎ Monitoring performance as an input to the monitoringof the stormwater activity by <strong>Hutt</strong> <strong>City</strong> <strong>Council</strong>.Cemetery Services AssessmentLocal authorities are not legally required to provide publiccemeteries and crematoria; however, they are required toensure that provision is made. <strong>Hutt</strong> <strong>City</strong> <strong>Council</strong> (along withmost other <strong>Council</strong>s) does provide cemeteries for the<strong>community</strong>. The only other organisations providing cemeteriesare churches, the Rununga and Nga Tekau o Poneke – theWellington Tenths Trust. There is no crematorium provided inthe territory managed by the <strong>Hutt</strong> <strong>City</strong> <strong>Council</strong>.<strong>Hutt</strong> <strong>City</strong> <strong>Council</strong> owns and operates one working cemetery,Taita Lawn Cemetery (including ashes in<strong>term</strong>ent) and oneashes in<strong>term</strong>ent facility, Wainuiomata Garden of Remembrance.The <strong>Hutt</strong> <strong>City</strong> <strong>Council</strong> is responsible for the maintenance ofthree historic cemeteries: St James Churchyard, the WesleyanCemetery in Bridge Street and Korokoro Cemetery. Thisassessment primarily concentrates on the provision of servicesand plots at Taita Lawn Cemetery.<strong>Council</strong> manages its cemeteries to match the policies outlinedin <strong>Council</strong>’s Bylaw and Cemetery Business Review 1997.A contract is in place for the maintenance, administrationand in<strong>term</strong>ent services at <strong>Council</strong>’s cemeteries.This assessment considers issues relating to public health andprovision of cemeteries by analysing population, customersatisfaction survey results, and requests for service frommembers of the public, as well as comments from contractorsand local funeral directors.Population is projected to remain fairly stable over the period2006 to 2031, with a medium projected average annualincrease of 0.1%. The forecast for in<strong>term</strong>ents indicates thatthe number of in<strong>term</strong>ents will generally rise between 2005and 2015. Statistics also predict a change in the balance ofashes in<strong>term</strong>ents and burials (body in<strong>term</strong>ents) taking placeat Taita Lawn Cemetery. It is likely that the number ofin<strong>term</strong>ents taking place in the form of ashes will increase,while burials will decrease.The assessment of future demand indicates that TaitaLawn Cemetery will cater for first in<strong>term</strong>ents (burial)until approximately 2012. The Wainuiomata Garden ofRemembrance facility has recently been expanded and isprojected to cater for in<strong>term</strong>ents up until 2018 with furtherexpansion possibilities. There is no practical opportunity forfurther expansion to provide for additional first in<strong>term</strong>ents atTaita Lawn Cemetery. Given this situation <strong>Council</strong> has enteredinto an agreement to provide a joint service with the Upper<strong>Hutt</strong> <strong>City</strong> <strong>Council</strong> at its site on Akatarawa Road, with <strong>Hutt</strong> <strong>City</strong><strong>Council</strong> to provide additional land adjacent to the currentcemetery for future development.The Sanitary Services Assessment has not identified any healthissues related to the <strong>Hutt</strong> <strong>City</strong> <strong>Council</strong>’s provision of cemeteries.
hutt city <strong>community</strong> <strong>plan</strong> 185Solid Waste Services Assessment<strong>Hutt</strong> <strong>City</strong> <strong>Council</strong> provides waste and recycling collection,and waste disposal services, to the <strong>community</strong>.The <strong>Hutt</strong> <strong>City</strong> <strong>Council</strong> Bylaw 2008, Refuse Collection andDisposal, sets out the services provided by <strong>Council</strong>. Privateorganisations also provide waste disposal and recyclingservices to the <strong>community</strong>.<strong>Hutt</strong> <strong>City</strong> <strong>Council</strong> owns two landfills, which are open to thepublic – one in Wainuiomata and the other in Silverstream.<strong>Council</strong> manages the landfill assets, including lifecyclemanagement and renewal of facilities as demand requires.The landfills are operated under contract, as are waste andrecycling collection services. Additional private recyclingand waste collection services are provided for the <strong>Hutt</strong> <strong>City</strong><strong>community</strong>. All of these facilities are considered when assessingthe level of provision of waste disposal services in the city.This assessment considers issues relating to public healthand the provision of waste management services, by analysingpopulation and business projections, customer satisfactionsurvey results, requests for service from members of the public,as well as staff and contractor interviews, health and safetyrequirements, contract management and quality assuranceprocesses and asset management <strong>plan</strong> information.<strong>Hutt</strong> <strong>City</strong> population is projected, by Statistics New Zealand, toremain fairly stable over the period 2006 to 2031, with a mediumprojected average annual increase of 0.1%. Business numbersare expected to rise. <strong>Council</strong> initiatives to reduce, reuse and recyclerefuse are in place. It is assumed that any increase in wasteproduced by residents and businesses in the short <strong>term</strong> will beoffset by the updated various waste minimisation programmes.<strong>Council</strong> has systems in place to attend to any issues thatpose a risk to public health as a priority. No public healthor future demand issues have been identified for <strong>Hutt</strong> <strong>City</strong>solid waste services.Additional landfill capacity is being developed at the Silverstreamlandfill to accept waste for the next 50 years. A new privaterecycling facility has been constructed to meet additionaldemand. These new facilities, along with current wastemanagement services and <strong>Council</strong> initiatives to reuse,reduce and recycle waste, are expected to be adequatefor current and future demand.ProposalsThis assessment of solid waste services proposes that <strong>Council</strong>undertake ongoing improvements to services. These proposalsare listed below:ÎÎ Continuing improvement of performance levels with regardto landfill operation, health and safety and asset condition.ÎÎ Improvement of service levels by monitoring customersatisfaction, and advice from contractors and consultants.Public Toilet Services Assessment<strong>Hutt</strong> <strong>City</strong> <strong>Council</strong> owns/operates 27 toilet facilities that areavailable to the public on a daily basis (three of these areopen during summer only). Additional toilets are provided forusers of public facilities, such as sportsgrounds, swimmingpools, libraries and museums. Private and other governmentorganisations also provide toilets to the public and to customers.There is also one private wastewater disposal site for caravans/campervans in <strong>Hutt</strong> <strong>City</strong>. All of these facilities are consideredwhen assessing the level of provision of public toilet servicesin the city.<strong>Council</strong> manages its public toilet assets, considering upgrade,renewal and additional facilities, as demand requires. Contractsare in place for regular maintenance, security and cleaning.This assessment considers issues relating to public healthand provision of toilets by analysing population, businessand visitor projections, customer satisfaction survey results,requests for service from members of the public, as well asstaff and contractor interviews.Population is projected to remain fairly stable while businessand visitor projections are expected to rise. There are currentlyno signs of overuse of <strong>Council</strong>-owned toilets, and <strong>Council</strong> hassystems in place to attend to any issues that pose a risk topublic health as a priority.The assessment of future demand indicates that the currentlocation and capacity of facilities is adequate for current andfuture demand over the next five years.Further to the assessment, <strong>Council</strong> is investigating aprogramme for the replacement of older style toilets in highvisitor areas to raise standards in presentation in line withvisitor expectations.
186ProposalsThis assessment of public toilets proposes that <strong>Council</strong>undertake ongoing monitoring, upgrade and construction ofnew public toilet facilities. These proposals are listed below:Monitoring of Toilet Condition and Performance<strong>Council</strong> will continue to monitor the condition of public toiletsthrough <strong>Council</strong> officers and contractor reports. Serviceperformance is monitored through feedback from the publicdirectly to <strong>Council</strong>, through <strong>community</strong> boards, <strong>community</strong>committees and Communitrak surveys.Ongoing Consultation with Community<strong>Council</strong> will continue conducting Communitrak surveys toascertain customer satisfaction with service. Consultationwith the <strong>community</strong> will continue when new toilet facilitiesare proposed.Provision of New Toilet FacilitiesWhere a shortage of toilets is identified in the future, <strong>Council</strong>will consider seeking agreement with local businesses toprovide facilities, where <strong>Council</strong> would contribute to themaintenance and upkeep of the toilet, and the businesscould provide additional security.Ongoing Upgrade Programme to AddressDeficiencies<strong>Council</strong> will continue to upgrade public toilets as they arerequired, in consultation with the <strong>community</strong> through theCommunity Plan process or as required.Raising Public Awareness<strong>Council</strong> will assess and improve the signage of public toiletsfrom main through routes and shopping areas if required.More information will be provided on <strong>Council</strong> public toiletlocations on the <strong>Council</strong> website and through the VisitorInformation Centre.
hutt city <strong>community</strong> <strong>plan</strong> 187FORECAST FINANCIAL STATEMENTSSummaryOverall <strong>Council</strong> is in a strong financial position. It has presenteda 10 year <strong>plan</strong> that keeps the rates increase below forecastannual CPI plus 0.5% as well as reporting significant reductionsin debt. The debt reduction is largely achieved through smalloperating surpluses per annum as well as anticipated proceedsfrom assets sales. Existing and forecast debt levels are wellwithin <strong>Council</strong>’s own Liability Management Policy and areconsidered to be commercially very reasonable.Forecast Financial Statements 2009/10to 2018/19These are the Forecast Financial Statements which <strong>Council</strong> hasadopted to meet the requirements of Clause 8 of Schedule 10of the Local Government Act 2002.Every three years it is a requirement of the Local GovernmentAct 2002 to present Forecast Financial Statements that span10 years. This provides an opportunity for ratepayers andresidents to assess the appropriateness of the financial actions<strong>plan</strong>ned by <strong>Council</strong>. The Forecast Financial Statements outlinehow <strong>Council</strong> will be funded for the next 10 years and how thatmoney will be spent. It is intended to ensure proper and prudentfinancial and asset management in the long <strong>term</strong>. The informationcontained in the Forecast Financial Statements may not beappropriate for other purposes.<strong>Council</strong> has Asset Management Plans for its assets. These<strong>plan</strong>s have provided the basis for the development of theForecast Financial Statements.The Forecast Financial Statements are based on New Zealandgenerally accepted accounting practice and comply withNew Zealand equivalents of International Financial ReportingStandards.The Forecast Financial Statements are based on estimatesof costs and revenues into the future. The degree ofuncertainty surrounding these estimates increases asthe Forecast Financial Statements look out further into thefuture. Key assumptions and risks are outlined below.The Forecast Financial Statements include:ÎÎ An “Estimate” of the results of the current financial year(2008/09) based on the budget adjusted for expectedvariances.ÎÎ The “Budget” <strong>Council</strong> proposes adopting for the comingfinancial year.ÎÎ “Forecast” results for the following nine years.A <strong>Long</strong> Term <strong>Council</strong> Community Plan may include forecastfinancial statements for any <strong>Council</strong>-Controlled TradingOrganisation or other entity under the <strong>Council</strong>’s control.We have not included these due to timing issues associatedwith the availability of the information, and in the interests ofnot making the document any longer than necessary.Significant AssumptionsThe following assumptions have been adopted by <strong>Council</strong> inpreparing the Forecast Financial Statements:ÎÎ Service levels are generally assumed to remain the samefor the period covered by the Forecast FinancialStatements. Minor service level improvements are <strong>plan</strong>nedin relation to certain areas of <strong>Council</strong> activity as a result ofcapital projects.ÎÎ Population is assumed to remain static, or change onlymarginally (0.1% per annum). Residential and commercialdevelopment is assumed to occur at the equivalent of 200additional household units each year. Capital expenditure<strong>plan</strong>s in some areas include an allowance for modest futurecapacity increases to help ensure that service standardsremain sustainable.ÎÎ Provision has been made for inflation based on theprojections below that were provided by Business andEconomic Research Limited (BERL) for the input costindices used by <strong>Council</strong> and the Treasury in relation to theConsumers Price Index. The annual inflation projectionsbeyond 2010 average 2.52%.
1882010/11 2011/12 2012/13 2013/14 2014/15 2015/16 2016/17 2017/18 2018/19Staff 2.63% 2.47% 2.41% 2.71% 2.64% 2.58% 2.59% 3.10% 3.16%Road & Transport 3.33% 2.67% 2.78% 2.45% 2.39% 2.33% 2.44% 2.46% 2.48%Property, Reserves& Parks 2.74% 2.76% 3.33% 2.69% 2.44% 2.98% 3.06% 2.57% 2.43%Water 2.10% 2.00% 2.00% 2.55% 2.55% 2.55% 2.55% 2.55% 2.55%Other costs 3.30% 3.38% 2.39% 2.42% 2.36% 2.30% 2.41% 2.44% 2.45%ÎÎ The average interest rate on debt is assumed to be 5.5% in 2009/10. The assumptions that lie beneath the fluctuating interestrate swaps are based on an average rate on the total debt portfolio including taking into account swaps.ÎÎ Asset sale proceeds will be used to repay debt or fund asset purchases.ÎÎ Depreciation and interest costs will be fully funded from rates and other operating revenue.ÎÎ Adjustments have been made for revised Asset Revaluations. <strong>Council</strong> major asset categories have been revaluedas at 1 July 2008.ÎÎ The Government will continue to pay NZ Transport Agency subsidies at the current level of 47%, with a 10% premiumon Capital Development projects, and not alter between 2009/10 and 2011/12. The amount is de<strong>term</strong>ined by <strong>Council</strong>’sexpenditure that attracts subsidies.ÎÎ We have assumed no significant changes in societal make up, and climate change assumptions have been addressedthroughout our Asset Management Plans and Environmental Sustainability Strategy.None of these assumptions are considered high risk.ASSET REVALUATIONS<strong>Council</strong> has completed full asset revaluations for its major assetcategories. This was last completed in 2006. Overall asset valueshave increased by 11%. The depreciation forecasts have alsobeen adjusted accordingly resulting in a significant increase.Under the Local Government Act depreciation should befully funded by rates. Whilst the increase in the depreciationforecast is significant, given the forecast surpluses per annumacross the 10 years this has had no immediate impact on rates,i.e. the forecast surpluses have exceeded the increase indepreciation expense.Some forecasts for various capital projects (replacements) werealso reviewed when the asset revaluations were completed. Thenew asset values have had no significant impact on forecastcapital replacement costs.Significant RisksActual results achieved for each reporting period are likely tovary from the information presented, and the variations may bematerial. In particular, there are several significant risks thatcould have a material impact on whether <strong>Council</strong> is able toachieve the financial results indicated in the Forecast FinancialStatements, although these risks are not considered to be high.ÎÎ <strong>Council</strong> has estimated the likely proceeds from the sale ofassets. The estimates are based on notional values of<strong>Council</strong>’s total reserve estate. There is a risk that the valuesindicated in the Prospective Statement of ComprehensiveIncome will not be realised. This is considered to be a low
hutt city <strong>community</strong> <strong>plan</strong> 189to medium risk. <strong>Council</strong> has a much more robust forecastfor assets sales now based on a full review of <strong>Council</strong>owned land throughout the city. The forecast is extremelyconservative. Given the current economic conditions assetsales in the short-<strong>term</strong> are more difficult to predict and thismay impact on debt in the short-<strong>term</strong> only.ÎÎ Expenditure items relating to major projects have beenestimated. These include timing and amounts for capitalexpenditure and operating costs. The outcome of tenderevaluation and negotiation processes on these projectsmay have a material impact on the Forecast FinancialStatements.ÎÎ In particular, provisions for capital expenditure on certainmajor projects that are being considered by <strong>Council</strong> havebeen included in these Forecast Financial Statements.It is not possible to reliably estimate the timing and theamount of <strong>Council</strong>’s share of the related costs. Projects inthis category are the proposed earthquake strengtheningof <strong>Council</strong>’s main Administration Building, the Cross ValleyLink, roading improvements in the CBD and certainadditional flood prevention works.ÎÎ The rate of inflation and interest rates may differsignificantly from the assumptions used in preparing theseForecast Financial Statements. These differences couldmaterially alter the actual results achieved in future years.ÎÎ Arguably the most significant risk facing <strong>Council</strong> at presentin relation to its Financial Forecasts is the current nationaland global economic situation. This has been consideredin preparing the Financial Forecasts but a more severetightening of consumer spending and unemploymentmay have an adverse impact on <strong>Council</strong> user chargesrevenues and also give rise to increasing aged debtors,including rates.ÎÎ Should a significant unforeseen event require substantialadditional expenditure, <strong>Council</strong> is in a strong financialposition to respond. <strong>Council</strong>’s current and forecast Statementof Financial Position is relatively strong and supported bya Standard and Poors credit rating of AA. This essentiallymeans that if additional funding (debt) was required then<strong>Council</strong> has significant ability to access funding throughvarious financial arrangements. <strong>Council</strong> also has anextremely robust insurance programme in place providingconsiderable cover to fund losses.FUTURE UNCERTAINTYThere are a number of possible areas of future uncertaintyrelated to legislative or government policy changes, depreciationon <strong>plan</strong>ned asset acquisitions, resource consents, currencymovements and related asset values, and external funding.Our response to these uncertainties is outlined below:ÎÎ Changes to <strong>Council</strong>’s business dictated by as yet unknownor unconfirmed legislation or central government policychange – we have assumed no significant unknown changesin legislation. There is obviously some uncertainty aroundthis as unanticipated legislation changes may be introducedin future.ÎÎ Depreciation rates on <strong>plan</strong>ned asset acquisitions – we haveassumed the same depreciation rates as per our currentrates applied to existing asset categories. There is minimaluncertainty around this assumption.ÎÎ Resource consents – we have assumed existing volumesof resource consents will continue. There is some degree ofuncertainty around this given current economic conditions.ÎÎ Currency movements and related asset values – currencymovements generally have only an indirect impact on assetvalues in <strong>term</strong>s of possibly impacting on capital expenditure.The majority of our assets are able to be valued on the NZmarket so currency movements will have very little, if any,impact on asset values.ÎÎ Renewability or otherwise of external funding – we havegenerally assumed that various external fundingarrangements will continue unless there is already a fixeddate of expiry. There is some degree of uncertainty aroundthis given current economic conditions, but the financialimpact of funding not being renewed is insignificant –rather it is the funded service that would likely discontinue.Commitments and ContingenciesThe Forecast Financial Statements provide for all the materialcapital and operating commitments known to <strong>Council</strong>. Prudentprovisions have also been made in these Forecast FinancialStatements for probable future obligations of <strong>Council</strong>.
190<strong>Council</strong> Net DebtThe graph shows the forecast level of net debt in the ForecastFinancial Statements. <strong>Council</strong> <strong>plan</strong>s to achieve a significantreduction in net debt.<strong>Council</strong> Rates IncomeThe graph shows the forecast level of rates income in theForecast Financial Statements. <strong>Council</strong> <strong>plan</strong>s to increase ratesincome by no more than 0.5% above the rate of inflation eachyear. Rates per capita increase in a similar manner. However,after allowing for the additional rates contributed as a resultof growth in the rating base when new or existing propertiesare developed, this is expected to equate to a real reduction(excluding inflation) in rates paid by the average ratepayerof at least 0.4% per year.Net debt at end of the year10080Amount ($M)60402002009 2010 2011 2012 2013 2014 2015 2016 2017 2018 2019rates per capitakeyAuthorisationThese Forecast Financial Statements were authorised for issueby <strong>Hutt</strong> <strong>City</strong> <strong>Council</strong> on 30 June 2009.<strong>Hutt</strong> <strong>City</strong> <strong>Council</strong> is responsible for these Forecast FinancialStatements, including the appropriateness of the assumptionsunderlying the Forecast Financial Statements and all otherdisclosures.Total rates revenue ($M)120 12001008060402010008006004002000 02009 2010 2011 2012 2013 2014 2015 2016 2017 2018 2019rates per person ($)rates REvenue ($M)rates per capita
hutt city <strong>community</strong> <strong>plan</strong> 191FORECAST FINANCIAL STATEMENTS –PROSPECTIVE OPERATING COST OF ACTIVITIESFor the year ending 30 June Estimate2009$000Budget2010$000Forecast2011$000Forecast2012$000Forecast2013$000Forecast2014$000Forecast2015$000Forecast2016$000Forecast2017$000Forecast2018$000Forecast2019$000PEOPLELibraries 7,115 7,452 7,610 7,828 7,980 8,241 8,491 8,707 8,917 9,160 9,468Museums 3,113 3,160 3,140 3,144 3,188 3,276 3,358 3,433 3,513 3,598 3,703Aquatics and Recreation 6,689 7,271 7,425 7,796 8,388 8,822 9,048 9,195 9,345 9,539 9,836Parks and Reserves 9,681 11,409 11,117 11,316 10,713 11,017 11,260 11,550 11,939 12,256 12,569Community Support 2,470 2,715 2,754 2,843 2,900 2,978 3,057 3,138 3,216 3,303 3,396Property 3,253 3,532 3,379 3,333 3,368 3,440 3,452 3,412 4,467 5,395 5,424Total operating cost of people activities 32,321 35,539 35,425 36,260 36,537 37,774 38,666 39,435 41,397 43,251 44,396UTILITY SERVICESRoading and Traffic 22,195 23,511 23,458 23,632 23,927 24,816 25,538 26,139 27,028 27,576 28,522Water Supply 12,613 13,150 13,225 13,312 13,737 14,454 15,139 15,759 16,519 17,272 18,187Wastewater 17,349 17,620 17,704 17,406 17,515 18,101 18,587 18,870 19,348 19,709 20,344Stormwater 5,920 5,966 5,944 5,941 5,980 6,218 6,368 6,420 6,590 6,710 6,920Solid Waste 7,336 6,859 7,086 7,354 7,557 7,567 7,779 7,967 8,157 8,368 8,631Total operating cost of utilityservices activities 65,413 67,106 67,417 67,645 68,716 71,156 73,411 75,155 77,642 79,635 82,604ENVIRONMENTEnvironmental Management 7,923 8,796 9,024 9,290 9,484 9,741 10,004 10,277 10,540 10,842 11,173Emergency Management 1,047 1,026 1,084 1,141 1,158 1,190 1,214 1,236 1,258 1,285 1,319Total operating cost ofenvironment activities 8,970 9,822 10,108 10,431 10,642 10,931 11,218 11,513 11,798 12,127 12,492
192FORECAST FINANCIAL STATEMENTS –PROSPECTIVE OPERATING COST OF ACTIVITIES (contd)For the year ending 30 June Estimate2009$000Budget2010$000Forecast2011$000Forecast2012$000Forecast2013$000Forecast2014$000Forecast2015$000Forecast2016$000Forecast2017$000Forecast2018$000Forecast2019$000ECONOMYLocal Urban Environment 1,293 1,591 1,329 1,419 1,468 1,512 1,554 1,573 1,593 1,617 1,671Economic Development 2,155 2,060 2,080 2,144 2,101 2,155 2,210 2,268 2,327 2,390 2,457Total operating cost ofeconomy activities 3,448 3,651 3,409 3,563 3,569 3,667 3,764 3,841 3,920 4,007 4,128ORGANISATIONElected Members 1,657 1,815 1,868 1,925 2,097 2,015 2,072 2,133 2,188 2,252 2,324Advice and Support 3,780 3,903 4,337 4,171 4,212 4,681 4,486 4,641 5,125 4,899 5,064Managing Services 1,293 1,344 1,200 1,311 1,330 1,360 1,401 1,441 1,485 1,532 1,579Consolidated cost adjustments (3,299) (2,460) (2,539) (2,625) (2,687) (2,753) (2,817) (2,883) (2,952) (3,023) (3,097)Total operating cost oforganisation activities 3,431 4,602 4,866 4,782 4,952 5,303 5,142 5,332 5,846 5,660 5,870TOTAL OPERATINGCOST OF ACTIVITIES 113,583 120,720 121,225 122,681 124,416 128,831 132,201 135,276 140,603 144,680 149,490
hutt city <strong>community</strong> <strong>plan</strong> 193FORECAST FINANCIAL STATEMENTS –PROSPECTIVE CAPITAL COST OF ACTIVITIESFor the year ending 30 June Estimate2009$000Budget2010$000Forecast2011$000Forecast2012$000Forecast2013$000Forecast2014$000Forecast2015$000Forecast2016$000Forecast2017$000Forecast2018$000Forecast2019$000PEOPLELibraries 1,315 963 871 1,066 927 866 886 907 928 951 924Museums 174 55 32 163 45 55 68 87 97 72 –Aquatics and Recreation 381 444 2,002 6,585 8,092 627 1,008 711 766 1,518 833Parks and Reserves 1,667 2,109 566 2,388 1,133 1,696 1,471 1,852 1,917 2,097 873Community Support – – – – – – – – – – –Property 2,069 2,890 1,402 1,531 1,288 980 815 1,040 25,042 986 1,945Total capital cost of people activities 5,606 6,461 4,873 11,733 11,485 4,224 4,248 4,597 28,750 5,624 4,575UTILITY SERVICESRoading and Traffic 7,522 8,525 9,531 11,221 10,685 10,750 11,015 33,464 11,588 11,465 11,132Water Supply 1,572 1,515 1,732 1,829 3,064 3,070 2,943 3,344 3,732 3,464 4,468Wastewater 5,003 5,174 4,187 4,300 4,602 5,230 5,287 8,173 6,333 5,921 7,061Stormwater 1,486 2,992 5,406 3,143 3,805 3,851 1,027 1,935 2,226 2,530 2,853Solid Waste 620 620 1,694 1,869 2,022 767 1,427 950 1,207 1,993 1,474Total capital cost ofutility services activities 16,203 18,826 22,550 22,362 24,178 23,668 21,699 47,866 25,086 25,373 26,988ENVIRONMENTEnvironmental Management 32 – – – – 36 – – – – –Emergency Management – – 506 – 98 – – – – – –Total capital cost ofenvironment activities 32 – 506 – 98 36 – – – – –
194FORECAST FINANCIAL STATEMENTS –PROSPECTIVE CAPITAL COST OF ACTIVITIES (contd)For the year ending 30 June Estimate2009$000Budget2010$000Forecast2011$000Forecast2012$000Forecast2013$000Forecast2014$000Forecast2015$000Forecast2016$000Forecast2017$000Forecast2018$000Forecast2019$000ECONOMYLocal Urban Environment 1,312 1,191 1,257 1,406 259 266 272 278 284 291 299Economic Development – – – – – – – – – – –Total capital cost ofeconomy activities 1,312 1,191 1,257 1,406 259 266 272 278 284 291 299ORGANISATIONElected Members – – – – – – – – – – –Advice and Support – – – – – – – – – – –Managing Services 3,033 3,351 1,671 1,722 1,649 1,805 2,024 2,177 3,330 2,158 2,193Consolidated cost adjustments (150) (2,883) (19) (553) 43 860 258 (2,613) (74) 2,510 17Total capital cost oforganisation activities 2,883 468 1,652 1,169 1,692 2,665 2,282 (436) 3,256 4,668 2,210TOTAL CAPITAL COST OF ACTIVITIES 26,036 26,946 30,838 36,670 37,712 30,859 28,501 52,305 57,376 35,956 34,072
hutt city <strong>community</strong> <strong>plan</strong> 195FORECAST FINANCIAL STATEMENTS –PROSPECTIVE STATEMENT OF COMPREHENSIVE INCOMEFor the year ending 30 June Estimate2009$000Budget2010$000Forecast2011$000Forecast2012$000Forecast2013$000Forecast2014$000Forecast2015$000Forecast2016$000Forecast2017$000Forecast2018$000Forecast2019$000REVENUERates funding 77,570 80,087 82,260 84,409 86,615 89,356 92,183 95,100 98,108 101,211 104,412User charges 26,565 30,100 29,858 30,367 30,841 31,285 31,732 32,191 33,049 33,542 34,047Operating contributions 5,935 6,036 6,204 6,256 6,408 6,569 6,729 6,889 7,061 7,238 7,418Capital contributions 5,096 5,460 5,672 14,504 6,659 6,286 6,439 9,007 7,283 7,429 7,616Other revenue 2,433 2,497 2,164 2,153 2,194 2,404 2,307 2,369 2,604 2,506 2,579Total revenue 117,599 124,180 126,158 137,689 132,717 135,900 139,390 145,556 148,105 151,926 156,072EXPENDITUREEmployee costs 23,496 25,710 26,379 27,048 27,691 28,435 29,182 29,952 30,723 31,674 32,677Support costs – – – – – – – – – – –Operating costs 60,509 63,133 63,979 65,092 66,007 67,922 69,555 71,754 74,229 76,008 78,294Interest expenditure 5,602 4,418 3,685 3,020 2,754 2,570 1,903 1,860 2,634 2,980 2,554Depreciation & Amortisation 23,976 27,459 27,182 27,521 27,964 29,904 31,561 31,710 33,017 34,018 35,965Total expenditure 113,583 120,720 121,225 122,681 124,416 128,831 132,201 135,276 140,603 144,680 149,490
196FORECAST FINANCIAL STATEMENTS –PROSPECTIVE STATEMENT OF COMPREHENSIVE INCOME (contd)For the year ending 30 June Estimate2009$000Budget2010$000Forecast2011$000Forecast2012$000Forecast2013$000Forecast2014$000Forecast2015$000Forecast2016$000Forecast2017$000Forecast2018$000Forecast2019$000OPERATING SURPLUS BEFOREREVALUATION GAINS AND LOSSES 4,016 3,460 4,933 15,008 8,301 7,069 7,189 10,280 7,502 7,246 6,582(Loss)/Gain on revaluation offinancial instruments (4,000) 800 800 1,000 300 300 500 – – – –SURPLUS/(DEFICIT) BEFORE TAX 16 4,260 5,733 16,008 8,601 7,369 7,689 10,280 7,502 7,246 6,582Tax expense – – – – – – – – – – –SURPLUS AFTER TAX 16 4,260 5,733 16,008 8,601 7,369 7,689 10,280 7,502 7,246 6,582OTHER COMPREHENSIVE INCOMEGains On Asset Revaluation 109,644 – – – – 142,546 – – – – 163,731Total Other Comprehensive Income 109,644 – – – – 142,546 – – – – 163,731TOTAL COMPREHENSIVE INCOME 109,660 4,260 5,733 16,008 8,601 149,915 7,689 10,280 7,502 7,246 170,313
hutt city <strong>community</strong> <strong>plan</strong> 197FORECAST FINANCIAL STATEMENTS –PROSPECTIVE STATEMENT OF CHANGES IN EQUITYFor the year ending 30 June Estimate2009$000Budget2010$000Forecast2011$000Forecast2012$000Forecast2013$000Forecast2014$000Forecast2015$000Forecast2016$000Forecast2017$000Forecast2018$000Forecast2019$000Surplus after tax 16 4,260 5,733 16,008 8,601 7,369 7,689 10,280 7,502 7,246 6,582OTHER RECOGNISED REVENUESAND EXPENSESChange in asset revaluation reservesand other movements 109,644 – – – – 142,546 – – – – 163,731Total recognised revenue andexpenses for the year 109,660 4,260 5,733 16,008 8,601 149,915 7,689 10,280 7,502 7,246 170,313Equity at beginning of the year 972,167 1,081,827 1,086,087 1,091,820 1,107,828 1,116,429 1,266,344 1,274,033 1,284,313 1,291,815 1,299,061EQUITY AT END OF THE YEAR 1,081,827 1,086,087 1,091,820 1,107,828 1,116,429 1,266,344 1,274,033 1,284,313 1,291,815 1,299,061 1,469,374
198FORECAST FINANCIAL STATEMENTS –PROSPECTIVE statement of financial positionFor the year ending 30 June Estimate2009$000Budget2010$000Forecast2011$000Forecast2012$000Forecast2013$000Forecast2014$000Forecast2015$000Forecast2016$000Forecast2017$000Forecast2018$000Forecast2019$000EQUITYAccumulated funds 730,372 734,735 740,415 756,369 765,079 772,391 780,022 790,420 797,861 805,044 811,753Restricted reserves 57 57 57 57 57 57 57 57 57 57 57<strong>Council</strong> created reserves 16,950 16,847 16,900 16,954 16,845 16,902 16,960 16,842 16,903 16,966 16,839Revaluation reserves 334,448 334,448 334,448 334,448 334,448 476,994 476,994 476,994 476,994 476,994 640,725Total Equity 1,081,827 1,086,087 1,091,820 1,107,828 1,116,429 1,266,344 1,274,033 1,284,313 1,291,815 1,299,061 1,469,374Represented by:CURRENT ASSETSCash and cash equivalents – – 386 594 388 960 1,519 2,504 3,115 3,752 4,223Trade and other receivables 13,171 14,171 10,904 9,795 10,525 10,772 10,982 10,962 11,200 11,457 11,555Interest rate swaps and options 2,119 1,319 919 419 319 219 819 819 819 819 819Assets held for sale 6,870 12,403 2,831 – – – – – – – –Other assets 1,145 1,145 1,145 1,145 1,145 1,145 1,145 1,145 1,145 1,145 1,145Total current assets 23,305 29,038 16,185 11,953 12,377 13,096 14,465 15,430 16,279 17,173 17,742NON–CURRENT ASSETSProperty, <strong>plan</strong>t and equipment 1,131,296 1,117,387 1,114,142 1,123,761 1,132,379 1,276,026 1,273,260 1,284,038 1,294,218 1,296,881 1,459,445Assets under construction 24,754 26,064 29,977 30,174 30,701 30,581 29,912 39,442 53,679 52,501 51,828Intangible assets 1,412 1,200 1,300 1,500 1,200 1,100 1,400 1,450 1,300 1,650 1,912Investment in subsidiariesand associates 14,769 14,769 14,769 14,769 14,769 14,769 14,769 14,769 14,769 14,769 14,769Other assets 675 675 675 675 675 675 675 675 675 675 675Total non–current assets 1,172,906 1,160,095 1,160,863 1,170,879 1,179,724 1,323,151 1,320,016 1,340,374 1,364,640 1,366,476 1,528,629Total assets 1,196,211 1,189,133 1,177,048 1,182,832 1,192,101 1,336,247 1,334,481 1,355,804 1,380,919 1,383,649 1,546,371
hutt city <strong>community</strong> <strong>plan</strong> 199For the year ending 30 June Estimate2009$000Budget2010$000Forecast2011$000Forecast2012$000Forecast2013$000Forecast2014$000Forecast2015$000Forecast2016$000Forecast2017$000Forecast2018$000Forecast2019$000CURRENT LIABILITIESBank overdraft 5,807 6,912 – – – – – – – – –Borrowings 31,775 35,932 22,252 23,562 25,009 18,895 18,646 28,961 45,818 40,510 32,035Trade and other payables 16,742 16,742 20,393 21,084 21,578 22,111 22,624 23,157 23,710 24,283 24,875Interest rate swaps and options 5,267 3,667 2,467 967 567 167 267 267 267 267 267Other liabilities 6,207 6,207 6,412 5,561 4,598 4,712 4,809 4,914 5,023 5,141 5,301Total current liabilities 65,798 69,460 51,524 51,174 51,752 45,885 46,346 57,299 74,818 70,201 62,478NON–CURRENT LIABILITIESBorrowings 45,000 30,000 30,000 20,000 20,000 20,000 10,000 10,000 10,000 10,000 10,000Provisions (Rounding applied) 2,953 2,953 3,050 3,154 3,228 3,309 3,378 3,453 3,530 3,613 3,721Other liabilities 633 633 654 676 692 709 724 739 756 774 798Total non–current liabilities 48,586 33,586 33,704 23,830 23,920 24,018 14,102 14,192 14,286 14,387 14,519Total liabilities 114,384 103,046 85,228 75,004 75,672 69,903 60,448 71,491 89,104 84,588 76,997NET ASSETS 1,081,827 1,086,087 1,091,820 1,107,828 1,116,429 1,266,344 1,274,033 1,284,313 1,291,815 1,299,061 1,469,374
200FORECAST FINANCIAL STATEMENTS –PROSPECTIVE CASH FLOW STATEMENTFor the year ending 30 June Estimate2009$000Budget2010$000Forecast2011$000Forecast2012$000Forecast2013$000Forecast2014$000Forecast2015$000Forecast2016$000Forecast2017$000Forecast2018$000Forecast2019$000CASH FLOWS FROM OPERATING ACTIVITIESCash was provided from:Rates 76,570 79,087 82,760 84,909 87,115 89,356 92,183 95,350 98,108 101,211 104,412User charges and other income 36,677 43,209 46,161 52,724 44,362 45,590 46,337 48,894 49,185 50,070 50,456Interest received 152 150 37 35 25 23 32 41 51 63 74Tax received – – – – – – – – – – –Regional <strong>Council</strong> rates 13,000 13,260 13,525 13,796 14,072 14,353 14,640 14,933 15,232 15,536 15,847126,399 135,706 142,483 151,464 145,574 149,322 153,192 159,218 162,576 166,880 170,789Cash was applied to:Payments to suppliers and employees 85,665 88,843 86,384 92,440 93,302 95,614 98,022 100,961 104,181 106,883 110,145Interest paid 5,602 4,418 3,685 3,020 2,754 2,570 1,903 1,860 2,634 2,980 2,554Regional <strong>Council</strong> rates 13,000 13,260 13,525 13,796 14,072 14,353 14,640 14,933 15,232 15,536 15,847Net GST paid to IRD – – – – – – – – – – –104,267 106,521 103,594 109,256 110,128 112,537 114,565 117,754 122,047 125,399 128,546Net cash flows fromoperating activities 22,132 29,185 38,889 42,208 35,446 36,785 38,627 41,464 40,529 41,481 42,243
hutt city <strong>community</strong> <strong>plan</strong> 201For the year ending 30 June Estimate2009$000Budget2010$000Forecast2011$000Forecast2012$000Forecast2013$000Forecast2014$000Forecast2015$000Forecast2016$000Forecast2017$000Forecast2018$000Forecast2019$000CASH FLOWS FROM INVESTING ACTIVITIESCash was provided from:Sale of property, <strong>plan</strong>t and equipment 2,400 6,870 12,403 2,831 – – – – – – –Other receipts and investments – – – – – – – – – – –Dividends received – – – – – – – – – – –2,400 6,870 12,403 2,831 – – – – – – –Cash was applied to:Purchase and construction of property,<strong>plan</strong>t and equipment 26,036 26,946 30,838 36,670 37,712 30,859 28,501 52,305 57,376 35,956 34,072less UHCC capital contribution (578) (629) (524) (529) (613) (760) (682) (1,511) (601) (420) (775)Other investments and payments – – – – – – – – – – –25,458 26,317 30,314 36,141 37,099 30,099 27,819 50,794 56,775 35,536 33,297Net cash flows frominvesting activities (23,058) (19,447) (17,911) (33,310) (37,099) (30,099) (27,819) (50,794) (56,775) (35,536) (33,297)
202FORECAST FINANCIAL STATEMENTS –PROSPECTIVE CASH FLOW STATEMENT (contd)For the year ending 30 June Estimate2009$000Budget2010$000Forecast2011$000Forecast2012$000Forecast2013$000Forecast2014$000Forecast2015$000Forecast2016$000Forecast2017$000Forecast2018$000Forecast2019$000CASH FLOWS FROM FINANCING ACTIVITIESCash was provided from:Funds raised from borrowing 138,916 114,411 126,333 75,536 89,602 85,817 55,371 72,338 115,636 159,868 134,466138,916 114,411 126,333 75,536 89,602 85,817 55,371 72,338 115,636 159,868 134,466Cash was applied to:Repayment of borrowings 143,600 125,254 140,013 84,226 88,155 91,931 65,620 62,023 98,779 165,176 142,941143,600 125,254 140,013 84,226 88,155 91,931 65,620 62,023 98,779 165,176 142,941Net cash flows from financingactivities (4,684) (10,843) (13,680) (8,690) 1,447 (6,114) (10,249) 10,315 16,857 (5,308) (8,475)Net (decrease)/increase in cash (5,610) (1,105) 7,298 208 (206) 572 559 985 611 637 471Plus cash balance at beginningof the year (197) (5,807) (6,912) 386 594 388 960 1,519 2,504 3,115 3,752Cash balance at end of the year (5,807) (6,912) 386 594 388 960 1,519 2,504 3,115 3,752 4,223Cash balance at endof the year comprises:Cash and on call deposits (5,807) (6,912) 386 594 388 960 1,519 2,504 3,115 3,752 4,223Short <strong>term</strong> deposits – – – – – – – – – – –Bank overdraft – – – – – – – – – – –Cash balance at end of the year (5,807) (6,912) 386 594 388 960 1,519 2,504 3,115 3,752 4,223
hutt city <strong>community</strong> <strong>plan</strong> 203Summary of Significant Accounting PoliciesIntroductionSchedule 10(8) of the Local Government Act 2002 requiresforecast financial statements to be included in a <strong>Long</strong> Term<strong>Council</strong> Community Plan. These Forecast Financial Statementshave been prepared in accordance with generally acceptedaccounting practice as required by section 111 of that Act.<strong>Council</strong> is designated as a public benefit entity for purposesof complying with generally accepted accounting practice.The Forecast Financial Statements are in full compliance withNew Zealand equivalents to International Financial ReportingStandards. They comply with Financial Reporting StandardNo. 42 – Prospective Financial Statements.This Summary of Significant Accounting Policies supports theForecast Financial Statements and other budgetary informationincluded in the <strong>Long</strong> Term <strong>Council</strong> Community Plan.Reporting Entity and Statutory BaseThe <strong>Hutt</strong> <strong>City</strong> <strong>Council</strong> (referred to as “<strong>Council</strong>”) is a territoriallocal authority governed by the Local Government Act 2002.<strong>Council</strong> was first formed as Lower <strong>Hutt</strong> <strong>City</strong> <strong>Council</strong> on1 November 1989 by the amalgamation of five local authorities.The name was changed to “The <strong>Hutt</strong> <strong>City</strong> <strong>Council</strong>” by a specialAct of Parliament on 8 October 1991.The primary objective of <strong>Council</strong> is to provide goods or servicesfor the <strong>community</strong> or social benefit rather than making a financialreturn. Accordingly, <strong>Council</strong> has designated itself as a publicbenefit entity for the purposes of New Zealand equivalents toInternational Financial Reporting Standards (NZ IFRS).Group prospective financial statements have not been presentedas they would not differ significantly from the Forecast FinancialStatements presented to <strong>Council</strong>.BASIS OF PREPARATIONMeasurement BaseThe financial statements have been prepared on a historicalcost basis, modified by the revaluation of land and buildings,certain infrastructural assets, and financial instruments(including derivative instruments).Functional and presentation currencyThe financial statements are presented in New Zealand dollarsand all values are rounded to the nearest thousand dollars ($’000).The functional currency of the <strong>Council</strong> is New Zealand dollars.Foreign currency transactions are translated into the functionalcurrency using the exchange rates prevailing at the dates ofthe transactions. Foreign exchange gains and losses resultingfrom the settlement of such transactions are recognised in theProspective Statement of Comprehensive Income.Specific Accounting PoliciesRevenueRevenue is measured at the fair value of considerationreceived or receivable.Rates revenueRates are set annually by a resolution from <strong>Council</strong> andrelate to a financial year. All ratepayers are invoiced withinthe financial year to which the rates have been set. Ratesrevenue is recognised when payable.Rates collected on behalf of Greater Wellington Regional<strong>Council</strong> (GWRC) are not recognised in the financial statements(except for the statement of cash flows) as the <strong>Council</strong> isacting as an agent for GWRC.Revenue from water rates by meter is recognised on an accrualbasis. Unbilled usage, as a result of unread meters at year end,is accrued on an average usage basis.Government grants<strong>Council</strong> receives government grants from Land TransportNew Zealand, which subsidises part of the <strong>Council</strong>’s costsin maintaining the local roading infrastructure. The subsidiesare recognised as revenue upon entitlement as conditionspertaining to eligible expenditure have been fulfilled.Provision of servicesRevenue from the rendering of services is recognised byreference to the stage of completion of the transaction atbalance date, based on the actual service provided asa percentage of the total services to be provided.Vested assetsWhere a physical asset is acquired for nil or nominalconsideration the fair value of the asset received is recognisedas revenue. Assets vested in <strong>Council</strong> are recognised asrevenue when control over the asset is obtained.
204Sale of goodsSales of goods are recognised when a product is sold to thecustomer. The recorded revenue is the gross amount of thesale, including credit card fees payable for the transaction.Such fees are included in other expenses.Traffic and parking infringementsTraffic and parking infringements are recognised whentickets are issued.Interest and dividendsInterest income is recognised using the effectiveinterest method.Dividends are recognised when the right to receivepayment has been established.Development contributionsThe revenue recognition point for development and financialcontributions is at the later of the point when <strong>Council</strong> is readyto provide the service for which the contribution was levied,or the event that will give rise to a requirement for adevelopment or financial contribution under the legislation.Acting as AgentWhen revenue is derived by action as an agent for anotherparty, the revenue that is recognised is the commission orfee on the transaction.Construction contractsContract revenue or Contract costs are recognised asrevenue and expenses respectively by reference to the stageof completion of the contract at balance date. The stage ofcompletion is measured by reference to the contract costsincurred up to balance date as a percentage of total estimatedcosts for each contract.Contract costs include all costs directly related to specificcontracts, costs that are specifically chargeable to thecustomer under the <strong>term</strong>s of the contract and an allocationof overhead expenses incurred in connection with the Group’sconstruction activities in general.Where the outcome of a contract cannot be reliably estimated,contract costs are recognised as an expense as incurred.Construction work in progress is stated at the aggregate ofcontract costs incurred to date.Borrowing costsBorrowing costs are recognised as an expense in the periodin which they are incurred.Grant expenditureNon-discretionary grants are those grants that are awardedif the grant application meets the specified criteria and arerecognised as expenditure when an application that meetsthe specified criteria for the grant has been received.Discretionary grants are those grants where <strong>Council</strong>has no obligation to award on receipt of the grant applicationand are recognised as expenditure when a successfulapplicant has been notified of <strong>Council</strong>’s decision.LeasesFinance leasesA finance lease is a lease that transfers to the lesseesubstantially all the risks and rewards incidental to ownershipof an asset, whether or not title is eventually transferred.At the commencement of the lease <strong>term</strong>, the <strong>Council</strong>recognises finance leases as assets and liabilities in theStatement of Financial Position at the lower of the fair valueof the leased item or the present value of the minimumlease payments.The finance charge is charged to the Prospective Statement ofComprehensive Income over the lease period so as to producea constant periodic rate of interest on the remaining balance ofthe liability.The amount recognised as an asset is depreciated over itsuseful life. If there is no certainty as to whether <strong>Council</strong> willobtain ownership at the end of the lease <strong>term</strong>, the asset isfully depreciated over the shorter of the lease <strong>term</strong> and itsuseful life.Operating leasesAn operating lease is a lease that does not transfersubstantially all the risks and rewards incidental to ownershipof an asset. Lease payments under an operating lease arerecognised as an expense on a straight-line basis over thelease <strong>term</strong>.
hutt city <strong>community</strong> <strong>plan</strong> 205Cash and cash equivalentsCash and cash equivalents includes cash in hand, depositsheld at call with banks, other short-<strong>term</strong> highly liquid investmentswith original maturities of three months or less, and bank overdrafts.Bank overdrafts are shown in current liabilities in the Statementof Financial Position.Trade and other receivablesTrade and other receivables are initially measured at fair valueand subsequently measured at amortised cost using theeffective interest method, less any provision for impairment.Financial assetsFinancial assets and liabilities are initially measured at fair valueplus transaction costs unless they are carried at fair value throughprofit or loss in which case the transaction costs are recognisedin the Prospective Statement of Comprehensive Income.Purchases and sales of investments are recognised ontrade-date, the date on which <strong>Council</strong> commits to purchaseor sell the asset. Financial assets are derecognised whenthe rights to receive cash flows from the financial assets haveexpired or have been transferred and the <strong>Council</strong> has transferredsubstantially all the risks and rewards of ownership.<strong>Council</strong> classifies its financial assets into the followingcategories: fair value through profit or loss, held-to-maturityinvestments, loans and receivables and fair value throughequity. The classification depends on the purpose for whichthe investments were acquired. Management de<strong>term</strong>inesthe classification of its investments at initial recognition.Financial assets fair value through profitor lossFinancial assets fair value through profit or loss include financialassets held for trading. A financial asset is classified in thiscategory if acquired principally for the purpose of selling in theshort <strong>term</strong>. Derivatives (eg. interest rate swaps and options) arealso categorised as held for trading unless they are designatedas hedges. Assets in this category are classified as currentassets if they are either held for trading or are expected to berealised within 12 months of the balance sheet date. The<strong>Council</strong>’s financial assets at fair value through profit and lossinclude derivates that are not designated as hedges.After initial recognition they are measured at their fair valueswith gains or losses on remeasurement recognised in theProspective Statement of Comprehensive Income.Loans and receivablesLoans and receivables are non-derivative financial assetswith fixed or de<strong>term</strong>inable payments that are not quoted inan active market. They are included in current assets, exceptfor maturities greater than 12 months after balance date, whichare included in non-current assets. The <strong>Council</strong>’s loans andreceivables comprise cash and cash equivalents, tradeand other receivables, <strong>term</strong> deposits, <strong>community</strong> andrelated party loans.After initial recognition they are measured at amortised cost usingthe effective interest method less impairment. Gains and losseswhen the asset is impaired or derecognised are recognised inthe Prospective Statement of Comprehensive Income.Loans, including loans to <strong>community</strong> organisations madeby <strong>Council</strong> at nil, or below-market, interest rates are initiallyrecognised at the present value of their expected future cashflows, discounted at the current market rate of return for asimilar financial instrument. The loans are subsequentlymeasured at amortised cost using the effective interestmethod. The difference between the face value and presentvalue of expected future cash flows of the loan is recognisedin the Prospective Statement of Comprehensive Income as agrant.Held to maturity investmentsHeld to maturity investments are non-derivative financial assetswith fixed or de<strong>term</strong>inable payments and fixed maturities that<strong>Council</strong> has the positive intention and ability to hold to maturity.They are included in current assets, except for maturities greaterthan 12 months after balance date, which are included innon-current assets.After initial recognition they are measured at amortised cost usingthe effective interest method less impairment. Gains and losseswhen the asset is impaired or derecognised are recognised inthe Prospective Statement of Comprehensive Income.Financial assets at fair value through equityFinancial assets at fair value through equity are those that aredesignated as fair value through equity or are not classified inany of the other categories above. They include non-currentassets unless management intends to dispose of theinvestment within 12 months of the balance date.
206The <strong>Council</strong> includes in this category:ÎÎ Investments that it intends to hold long-<strong>term</strong> but whichmay be realised before maturity; andÎÎ Shareholdings that <strong>Council</strong> holds for strategic purposes.<strong>Council</strong>’s investments in its subsidiary and associatecompanies are not included in this category as they are heldat cost (as allowed by NZ IAS 27 Consolidated and SeparateFinancial Statements and NZ IAS 28 Investments in Associates)whereas this category is to be measured at fair value.After initial recognition these investments are measured at theirfair value, with gains and losses recognised directly in equityexcept for impairment losses, which are recognised in theProspective Statement of Comprehensive Income.On derecognition the cumulative gain or loss previouslyrecognised in equity is recognised in the ProspectiveStatement of Comprehensive Income.Fair valueThe fair value of financial instruments traded in active marketsis based on quoted market prices at the balance sheet date.The quoted market price used is the current bid price.The fair value of financial instruments that are not traded inan active market is de<strong>term</strong>ined using valuation techniques.<strong>Council</strong> uses a variety of methods and makes assumptions thatare based on market conditions existing at each balance date.Quoted market prices or dealer quotes for similar instrumentsare used for long-<strong>term</strong> debt instruments held. Other techniques,such as estimated discounted cash flows, are used to de<strong>term</strong>inefair value for the remaining financial instruments.Impairment of financial assetsAt each balance sheet date <strong>Council</strong> assesses whether there isany objective evidence that a financial asset or group of financialassets is impaired. Any impairment losses are recognised in theProspective Statement of Comprehensive Income.Loans, receivables and <strong>term</strong> depositsImpairment of a loan, receivable or <strong>term</strong> deposit is establishedwhen there is objective evidence that <strong>Council</strong> will not be ableto collect all amounts due according to the original <strong>term</strong>s.Significant financial difficulties of the debtor/issuer, probabilitythat the debtor/issuer will enter into bankruptcy, and defaultpayments are considered indicators that the asset is impaired.The amount of the impairment is the difference between theasset’s carrying amount and the present value of estimatedfuture cash flows, discounted using the original effectiveinterest rate. For trade and other receivables, the carryingamount of the asset is reduced through the use of an allowanceaccount, and the amount of the loss is recognised in theProspective Statement of Comprehensive Income. When thereceivable is uncollectable, it is written off against the provisionaccount. Overdue receivables that have been renegotiated arereclassified as current (i.e. not past due). For <strong>term</strong> depositsand <strong>community</strong> loans impairment losses are recogniseddirectly against the instruments carrying amount.Quoted and unquoted equity investmentsFor equity investments classified as fair value through equity,a significant or prolonged decline in the fair value of theinvestment below its cost is considered an indicator ofimpairment. If such evidence exists for investments at fairvalue through equity, the cumulative loss (measured as thedifference between the acquisition costs and the current fairvalue, less any impairment loss on that financial assetpreviously recognised in the Prospective Statement ofComprehensive Income) is removed from equity andrecognised in the Prospective Statement of ComprehensiveIncome. Impairment losses recognised in the ProspectiveStatement of Comprehensive Income on equity investmentsare not reversed through the Prospective Statement ofComprehensive Income.Derivative financial instrumentsand hedging activities<strong>Council</strong> uses derivative financial instruments to hedgeexposure to interest rate risks arising from financing activities.In accordance with its treasury policy, <strong>Council</strong> does not holdor issue derivative financial instruments for trading purposes.Foreign currency transactions are translated into the functionalcurrency using the exchange rates prevailing at the dates ofthe transactions. Foreign exchange gains and losses resultingfrom the settlement of such transactions are recognised in theProspective Statement of Comprehensive Income.The <strong>Council</strong>’s derivative financial instruments are notdesignated as hedging instruments for accounting purposes.Accordingly, derivative financial instruments are reported asfinancial instruments at fair value through profit or loss.
hutt city <strong>community</strong> <strong>plan</strong> 207InventoriesInventories (such as spare parts and other items) held fordistribution or consumption in the provision of services thatare not supplied on a commercial basis are measured at thelower of cost, adjusted when applicable, for any loss of servicepotential. Where inventories are acquired at no cost or fornominal consideration, the cost is the current replacementcost at the date of acquisition.Inventories held for use in the production of goods andservices on a commercial basis are valued at the lower of costand net realisable value. The cost of purchased inventory isde<strong>term</strong>ined using the FIFO method.The amount of any write-down for the loss of service potentialor from cost to net realisable value is recognised in theProspective Statement of Comprehensive Income in theperiod of the write-down.Non-current assets held for saleNon-current assets held for sale are classified as held for saleif their carrying amount will be recovered principally througha sale transaction, not through continuing use. Non-currentassets held for sale are measured at the lower of their carryingamount and fair value less costs to sell.Any impairment losses for write-downs of non-current assetsheld for sale are recognised in the Prospective Statement ofComprehensive Income. Any increases in fair value (less costs tosell) are recognised up to the level of any impairment losses thathave been previously recognised. Non-current assets (includingthose that are part of a disposal group) are not depreciated oramortised while they are classified as held for sale.Assets that are being offered for sale under the Public WorksAct are recorded.Property, <strong>plan</strong>t and equipmentProperty, <strong>plan</strong>t and equipment consist of:Î Î Infrastructure assets; the fixed utility systems owned by<strong>Council</strong> and include resource consents. Each asset typeincludes all items that are required for the network tofunction. For example, sewerage reticulation includesreticulation piping and sewer pump stations.Î Î Operational assets; these include land, buildings, landfillpost closure, improvements, library books, <strong>plan</strong>t andequipment and motor vehicles.Î Î Restricted assets; parks and reserves owned by <strong>Council</strong>which provide a benefit or service to the <strong>community</strong> andcannot be disposed of because of legal or other restrictions.Property, <strong>plan</strong>t and equipment are shown at cost or valuation,less accumulated depreciation and impairment losses.AdditionsThe cost of an item of property, <strong>plan</strong>t and equipment isrecognised as an asset if, and only if, it is probable that futureeconomic benefits or service potential associated with the itemwill flow to <strong>Council</strong> and the cost of the item can be measuredreliably. In most instances, an item of property, <strong>plan</strong>t andequipment is recognised at its cost. Where an asset is acquiredat no cost, or for a nominal cost, it is recognised at fair valueas at the date of acquisition.Assets under construction are included at cost. The totalcost of a project is transferred to the relevant capital classon its completion and then depreciated. Borrowing costsare not capitalised.Costs incurred in obtaining any resource consents are capitalisedas part of the asset to which they relate. If a resource consentapplication is declined then all capitalised costs are written off.Costs incurred subsequent to initial acquisition are capitalisedonly when it is probable that future economic benefits orservice potential associated with the item will flow to <strong>Council</strong>and the cost of the item can be measured reliably.Costs that do not meet the criteria for capitalisation, or are belowthe thresholds of $1,000 for information technology hardware and$2,500 for other items, are charged to operating expenditure.DisposalGains and losses on disposals are de<strong>term</strong>ined by comparingthe proceeds with the carrying amount of the asset. Gains andlosses on disposals are reported net in the ProspectiveStatement of Comprehensive Income. When revalued assetsare sold, the amounts included in asset revaluation reserves inrespect of those assets are transferred to accumulated funds.DepreciationDepreciation is provided on a straight-line basis on all property,<strong>plan</strong>t and equipment at rates that will write off the cost (orvaluation) of the assets to their estimated residual values overtheir useful lives, except that art, museum collections and landare not depreciated.
208The expected useful economic lives have been estimated as follows:Estimated economic lives Years PercentageOperational assetsBuildings 50 – 80 1.25 – 2%Piers at Seaview Marina 25 4%Parking meters 15 6.67%Office equipment 10 10%Plant 10 10%Pay and display 10 10%Recycling depots 5 – 10 10 – 20%Playground equipment 5 – 10 10 – 20%Estimated economic lives Years PercentageReservoirs 80 1.25%Storm water pipe network assets 60 – 100 1 – 1.67%Water pipe network assets 60 – 90 1.11 – 1.67%Seaview wastewater treatment <strong>plan</strong>t 20 5%Milliscreen <strong>plan</strong>t 26 3.85%Pump and gauging stations 20 – 50 2 – 5%Sewerage pipe network assets 40 – 80 1.25 – 2.5%Gauging and reservoir equipment 15 6.67%Pump station control equipment 8 – 10 10 – 12.5%Computer equipment 3 – 5 20 – 33.33%Infrastructure assetsBridges 75 – 100 1 – 1.33%Drainage including manholes and drainpipe 50 – 80 1.25 – 2%Kerbing 80 1.25%Footpaths 50 2%Unsealed pavement (base course and sub base) 50 2%Street lights 29 3.45%Wharves 15 6.67%Road surface 20 5%Traffic signals and signs 16 6.25%Resource consentsconsent <strong>term</strong>
hutt city <strong>community</strong> <strong>plan</strong> 209RevaluationLand, buildings (operational and restricted), library books, andinfrastructural assets (except land under roads) are revaluedwith sufficient regularity to ensure that their carrying amountdoes not differ materially from fair value and at least everyfive years, on the basis described below. All other assetclasses are carried at depreciated historical cost. The <strong>Council</strong>assesses the carrying values of its revalued assets annuallyto ensure that they do not differ materially from the assets’ fairvalues. If there is a material difference, then the off-cycle assetclasses are revalued. The carrying values of revalued items arereviewed at each balance date to ensure that those values arenot materially different to fair value.ÎÎ Land and buildings have been valued at either optimiseddepreciated replacement cost or fair value.ÎÎ Infrastructure assets have been valued at optimiseddepreciated replacement cost. The exceptions are:ÆÆ wharves, which are valued at indemnity value,reflecting their minimum residual valueÆÆ traffic signs, which are stated at costÆÆ land under roads, which is valued at 45% of theaverage market value of adjacent land.ÎÎ Library literary assets are valued at depreciatedreplacement cost in accordance with draft guidelinesreleased by the New Zealand Library Association andthe National Library of New Zealand.All revaluations are carried out by independent valuers whospecialise in the asset classes listed above. The exception islibrary literary assets, which are valued by staff with specialistknowledge in this area.The results of revaluing are credited or debited to an assetrevaluation reserve for that class of asset. Where this resultsin a debit balance in the asset revaluation reserve, this balanceis expensed in the Prospective Statement of ComprehensiveIncome. Any subsequent increase on revaluation that off-setsa previous decrease in value recognised in the ProspectiveStatement of Comprehensive Income will be recognised firstin the Prospective Statement of Comprehensive Income upto the amount previously expensed, and then credited to therevaluation reserve for that class of asset.Upper <strong>Hutt</strong> <strong>City</strong> <strong>Council</strong>’s interestin the bulk wastewater systemThe <strong>Hutt</strong> Valley and Wainuiomata bulk wastewater systemis managed by <strong>Council</strong>. Upper <strong>Hutt</strong> <strong>City</strong> <strong>Council</strong> pays anannual levy to the <strong>Hutt</strong> <strong>City</strong> <strong>Council</strong> based on an apportionmentformula equating to between 26% and 31% of the fundingrequirements. While Upper <strong>Hutt</strong> <strong>City</strong> <strong>Council</strong> does not havelegal ownership of the bulk wastewater system, it is entitledto a share of the proceeds from any sale of the assets.Upper <strong>Hutt</strong> <strong>City</strong> <strong>Council</strong>’s interest in the bulk wastewatersystem assets is deducted from the value of property, <strong>plan</strong>tand equipment recognised in the Statement of FinancialPosition. Funding contributions from Upper <strong>Hutt</strong> <strong>City</strong> <strong>Council</strong>are recognised as revenue in the Prospective Statementof Comprehensive Income if the contributions are for theoperation of the bulk wastewater system. Funding contributionsfor capital work are recognised as an increase in Upper <strong>Hutt</strong><strong>City</strong> <strong>Council</strong>’s interest in the bulk wastewater system assets.Intangible assetsGoodwillGoodwill represents the excess of the cost of the acquisition overthe fair value of <strong>Council</strong>‘s share of the identifiable assets, liabilitiesand contingent liabilities of the acquired subsidiary/associate atthe date of acquisition. Goodwill on acquisition of subsidiariesis included in “intangible assets”. Goodwill on acquisition ofassociates is included in “investments in associates” and istested for impairment as part of the overall balance.Separately recognised goodwill is tested annually forimpairment and carried at cost less accumulated impairmentlosses. An impairment loss recognised for goodwill is notreversed in any subsequent period.Goodwill is allocated to cash generating units for the purposesof impairment testing. The allocation is made to those cashgenerating units or groups of cash generating units that areexpected to benefit from the business combination, in whichthe goodwill arose.Software acquisition and developmentAcquired computer software licences are capitalised on thebasis of the costs incurred to acquire and bring to use thespecific software. Costs that are directly associated with thedevelopment of software for internal use by <strong>Council</strong>, arerecognised as an intangible asset. Direct costs included thesoftware development, employee costs and an appropriateportion of relevant overheads.Staff training costs are recognised as an expense when incurred.Costs associated with maintaining computer software arerecognised as an expense when incurred.
210EasementsEasements are recognised at cost, being the costs directlyattributable to bringing the asset to its intended use. Easementshave an indefinite useful life and are not amortised, but areinstead tested for impairment annually.AmortisationThe carrying value of an intangible asset with a finite lifeis amortised on a straight-line basis over its useful life.Amortisation begins when the asset is available for useand ceases at the date that the asset is derecognised.The amortisation charge for each period is recognisedin the Prospective Statement of Comprehensive Income.The useful lives and associated amortisation rates of majorclasses of intangible assets have been estimated as follows:Computer software 3 – 5 years 33% – 20%Impairment of property, <strong>plan</strong>t and equipmentand intangible assetsAssets that have an indefinite useful life, or are not yet availablefor use, are not subject to amortisation and are tested annuallyfor impairment. Assets that have a finite useful life are reviewedfor indicators of impairment at each balance date. When there isan indicator of impairment the asset’s recoverable amount isestimated. An impairment loss is recognised for the amount bywhich the asset’s carrying amount exceeds its recoverableamount. The recoverable amount is the higher of an asset’sfair value less costs to sell and value in use.Value in use is depreciated replacement cost for an assetwhere the future economic benefits or service potential ofthe asset are not primarily dependent on the asset’s abilityto generate net cash inflows and where the entity would,if deprived of the asset, replace its remaining futureeconomic benefits or service potential.The value in use for cash-generating assets and cash generatingunits is the present value of expected future cash flows.If an asset’s carrying amount exceeds its recoverable amountthe asset is impaired and the carrying amount is written downto the recoverable amount. For revalued assets the impairmentloss is recognised against the revaluation reserve for that classof asset. Where that results in a debit balance in the revaluationreserve, the balance is recognised in the Prospective Statementof Comprehensive Income. For assets not carried at a revaluedamount, the total impairment loss is recognised in the ProspectiveStatement of Comprehensive Income.The reversal of an impairment loss on a revalued asset iscredited to the revaluation reserve. However, to the extentthat an impairment loss for that class of asset was previouslyrecognised in the Prospective Statement of ComprehensiveIncome, a reversal of the impairment loss is also recognisedin the Prospective Statement of Comprehensive Income.For assets not carried at a revalued amount (other thangoodwill) the reversal of an impairment loss is recognisedin the Prospective Statement of Comprehensive Income.Creditors and other payablesCreditors and other payables are initially measured at fairvalue and subsequently measured at amortised cost usingthe effective interest method.BorrowingsBorrowings are initially recognised at their fair value netof transaction costs incurred. After initial recognition, allborrowings are measured at amortised cost using theeffective interest method.Borrowings are classified as current liabilities unless the<strong>Council</strong> has an unconditional right to defer settlement ofthe liability for at least 12 months after the balance date.Employee entitlementsShort-<strong>term</strong> employee entitlementsEmployee benefits that <strong>Council</strong> expects to be settled within12 months of balance date are measured at nominal valuesbased on accrued entitlements at current rates of pay. Theseinclude salaries and wages accrued up to balance date,annual leave earned to, but not yet taken at balance date,retiring and long service leave entitlements expected to besettled within 12 months, and sick leave.<strong>Council</strong> recognises a liability for sick leave to the extentthat absences in the coming year are expected to be greaterthan the sick leave entitlements earned in the coming year.The amount is calculated based on the unused sick leaveentitlement that can be carried forward at balance date, to theextent that <strong>Council</strong> anticipates it will be used by staff to coverthose future absences.<strong>Council</strong> recognises a liability and an expense for bonuses wherecontractually obliged or where there is a past practice that hascreated a constructive obligation.
hutt city <strong>community</strong> <strong>plan</strong> 211<strong>Long</strong>-<strong>term</strong> employee entitlementsEntitlements that are payable beyond 12 months, such aslong service leave and retiring leave, have been calculatedon an actuarial basis. The calculations are based on:ÎÎ likely future entitlements accruing to staff, based onyears of service, years to entitlementÎÎ the likelihood that staff will reach the point of entitlementand contractual entitlements information; andÎÎ the present value of the estimated future cash flows.Superannuation schemesDefined contribution schemesObligations for contributions to defined contribution superannuationschemes are recognised as an expense in the ProspectiveStatement of Comprehensive Income as incurred.Defined benefit schemes<strong>Council</strong> belongs to the Defined Benefit Plan ContributorsScheme (the scheme), which is managed by the Board ofTrustees of the National Provident Fund. The scheme is amulti-employer defined benefit scheme.Insufficient information is available to use defined benefitaccounting, as it is not possible to de<strong>term</strong>ine from the <strong>term</strong>s ofthe scheme, the extent to which the surplus/deficit will affectfuture contributions by individual employers, as there isno prescribed basis for allocation. The scheme is thereforeaccounted for as a defined contribution scheme.Provisions<strong>Council</strong> recognises a provision for future expenditure ofuncertain amount or timing when there is a present obligation(either legal or constructive) as a result of a past event, it isprobable that expenditures will be required to settle theobligation and a reliable estimate can be made of theamount of the obligation.Provisions are measured at the present value of theexpenditures expected to be required to settle the obligationusing a pre-tax discount rate that reflects current marketassessments of the time value of money and the risks specificto the obligation. The increase in the provision due to thepassage of time is recognised as an interest expense andis included in “finance costs”.Financial guarantee contractsA financial guarantee contract is a contract that requires<strong>Council</strong> to make specified payments to reimburse the holderfor a loss it incurs because a specified debtor fails to makepayment when due.Financial guarantee contracts are initially recognised at fairvalue. If a financial guarantee contract was issued in astand-alone arm’s length transaction to an unrelated party, itsfair value at inception is equal to the consideration received.When no consideration is received a provision is recognisedbased on the probability <strong>Council</strong> will be required to reimbursea holder for a loss incurred, discounted to present value. Theportion of the guarantee that remains unrecognised, prior todiscounting to fair value, is disclosed as a contingent liability.Financial guarantees are subsequently measured at the initialrecognition amount less any amortisation, however if <strong>Council</strong>assesses that it is probable that expenditure will be requiredto settle a guarantee, then the provision for the guarantee ismeasured at the present value of the future expenditure.Landfill post closure costsAs operator of the Silverstream and Wainuiomata landfill sites,<strong>Council</strong> has an obligation to ensure the ongoing maintenanceand monitoring services at these landfill sites after closure.<strong>Council</strong> also has an obligation to monitor closed landfill sitespreviously operated by local authorities subsequentlyamalgamated to form the <strong>Hutt</strong> <strong>City</strong> <strong>Council</strong>.A site restoration and aftercare provision has been recognisedas a liability in the Statement of Financial Position. Provision ismade for the present value of closure and post closure costswhen the obligation for post closure arises. The calculated costis based on estimates of closure costs and future site tradewaste charges and monitoring costs. The estimated length oftime needed for post closure care is Silverstream 30 years,and Wainuiomata 28 years.The calculations assume no change in the legislativerequirements or technological changes for closure andpost closure treatment. The discount rate used is a pre taxrate that reflects current market assessments of the timevalue of money and the risks specific to <strong>Council</strong>.Amounts provided for closure and post closure costs arecapitalised to the landfill asset where they give rise to futureeconomic benefits, or if they are incurred to enable futureeconomic benefits to be obtained. The capitalised landfillasset is depreciated over the life of the landfill based onthe capacity used.
212EquityEquity is the <strong>community</strong>’s interest in <strong>Council</strong> as measuredby total assets less total liabilities. Equity is classified intoa number of reserves to enable clearer identification of thespecified uses that <strong>Council</strong> makes of their accumulatedsurpluses. The components of equity are:ÎÎ Accumulated fundsÎÎ <strong>Council</strong> created reservesÎÎ Restricted reservesÎÎ Asset revaluation reserves.Reserves represent a particular use to which various partsof equity have been assigned. Reserves may be legallyrestricted or created by <strong>Council</strong>.<strong>Council</strong> created reserves are established by <strong>Council</strong>. Theymay be altered without reference to any third party or thecourts. Transfers to and from these reserves are at thediscretion of <strong>Council</strong>.Restricted reserves are subject to specific conditions acceptedas binding by <strong>Council</strong>, which may not be revised by <strong>Council</strong>without reference to the courts or third party. Transfers fromthese reserves may be made only for specified purposes orwhen certain conditions are met.Goods and services tax (GST)All items in the financial statements are stated exclusive of GST,except for receivables and payables, which are stated on aGST inclusive basis. Where GST is not recoverable as input taxthen it is recognised as part of the related asset or expense.The net amount of GST recoverable from, or payable to, theInland Revenue Department (IRD) is included as part ofreceivables or payables in the Statement of Financial Position.The net GST paid to, or received from the IRD, including theGST relating to investing and financing activities, is classifiedas an operating cash flow in the statement of cash flows.Commitments and contingencies are disclosed exclusive of GST.Cost AllocationThe operating statements report the net cost of services forsignificant activities of <strong>Council</strong>. <strong>Council</strong> has derived the netcost of services for each significant activity using the costallocation system outlined below.Direct costs are charged directly to significant activities.Indirect costs are charged to the significant activities basedon cost drivers and related activity or usage information.Each significant activity has been charged an internal interestcost. The net interest cost incurred by <strong>Council</strong> is allocatedto each significant activity based on the net book value ofproperty, <strong>plan</strong>t and equipment used by the activity.
hutt city <strong>community</strong> <strong>plan</strong> 213FORECAST FINANCIAL STATEMENTS –PROSPECTIVE FUNDING IMPACT STATEMENTFor the year ending 30 June Estimate2009$000Budget2010$000Forecast2011$000Forecast2012$000Forecast2013$000Forecast2014$000Forecast2015$000Forecast2016$000Forecast2017$000Forecast2018$000Forecast2019$000OPERATING EXPENDITURE OF ($000): 113,583 120,720 121,225 122,681 124,416 128,831 132,201 135,276 140,603 144,680 149,490Funding for Operating ExpenditureGeneral rate 51,579 53,484 54,921 56,288 57,635 59,545 61,508 63,491 65,581 67,733 69,963Targeted rates 25,991 26,603 27,339 28,121 28,980 29,811 30,675 31,609 32,527 33,478 34,449User charges 26,565 30,100 29,858 30,367 30,841 31,285 31,732 32,191 33,049 33,542 34,047Operating contributions 5,935 6,036 6,204 6,256 6,408 6,569 6,729 6,889 7,061 7,238 7,418Other revenue 2,433 2,497 2,164 2,153 2,194 2,404 2,307 2,369 2,604 2,506 2,579(Surplus)/deficit applied to borrowing 1,080 2,000 739 (504) (1,642) (783) (750) (1,273) (219) 183 1,034TOTAL FUNDING FOROPERATING EXPENDITURE 113,583 120,720 121,225 122,681 124,416 128,831 132,201 135,276 140,603 144,680 149,490CAPITAL EXPENDITURE OF ($000): 26,036 26,946 30,838 36,670 37,712 30,859 28,501 52,305 57,376 35,956 34,072Funding for Capital ExpenditureCapital Contributions 5,096 5,460 5,672 14,504 6,659 6,286 6,439 9,007 7,283 7,429 7,616Funding from non-cash expenses 23,976 27,459 27,182 27,521 27,964 29,904 31,561 31,710 33,017 34,018 35,965Asset sales 2,400 6,870 12,403 2,831 – – – – – – –Operating surpluses/(deficits) (1,080) (2,000) (739) 504 1,642 783 750 1,273 219 (183) (1,034)Borrowing/(debt repayment) (4,356) (10,843) (13,680) (8,690) 1,447 (6,114) (10,249) 10,315 16,857 (5,308) (8,475)TOTAL FUNDING FORCAPITAL EXPENDITURE 26,036 26,946 30,838 36,670 37,712 30,859 28,501 52,305 57,376 35,956 34,072
214rates for 2009/101. IntroductionThe Funding Impact Statement (FIS) details the rates to be set, defines the differential categories,and shows the rating factors to be used for 2009/10.The information below is a summary of this information and shows an amount for each rate andcharge, based on the information in the FIS. It also shows the change in the amount payableon a range of typical properties.B) Wastewater RateType: Targeted RateRating Factor: Number of Water Closets or urinalsThe charges for the 2009/10 rating year are as follows:CategoryChargeIt should be noted that all figures in this section are GST inclusive, unless otherwise stated.First WC or urinal per rating unit $3892. ChangesSecond and each subsequent WC or urinal per rating unit$194.50 eachNo changes have been made to the rating structure and differential factors used for the2008/09 year.3. Schedule of Rates for 2009/10A) Water Supply RateType: Targeted RateRating Factor: Separately used or inhabited part of a rating unitThe charges for the 2009/10 rating year are as follows:C) Recycling ChargeType:Targeted RateRating Factor: Number of separately used or inhabited parts (SUIP) of the rating unitThe charge for the 2009/10 rating year is as follows:CategoryRating units in the Residential category receiving or able to use therecycling collection service.Charge$36CategoryConnectedServiceable but not ConnectedCharge$308 per part$154 per partD) Jackson Street Programme RateType: Targeted RateRating Factor: Capital ValueThe charge for the 2009/10 rating year is as follows:CategoryRating units in any business category having frontage to JacksonStreet, Petone, between <strong>Hutt</strong> Road and Cuba Street.Rate0.05180 cents per $of Capital Value
hutt city <strong>community</strong> <strong>plan</strong> 215E) Private Drains RateType: Targeted RateRating Factor: Cost of work to upgrade private drainThe charges for the 2009/10 rating year are as follows:CategoryPer dollar of the cost of the work to upgrade private drainF) General RateType: General RateRating Factor: Capital ValueCharge24.30 cents per yearfor five years4. Summary of Revenue Required from RatesRateAmount(Inclusive of GST)$000sAmount(Exclusive of GST)$000sGeneral Rate 63,168 56,149Targeted Rates:Water Supply 12,251 10,890Wastewater 16,501 14,668Jackson St 90 80Recycling 1,350 1,200Private Drains 88 78The differential categories and charges for the 2009/10 rating year are as follows:Category Ratio Charge per $ of Capital ValueTotal Rate Revenue $93,448 $83,065Note: Total rate revenue includes rates charged on <strong>Council</strong>-owned properties.Residential (RE) 1.00 0.23560 centsRural (RU) 0.65 0.15310 centsBusiness Accommodation (BA) 3.00 0.70670 centsBusiness Central (BC) 3.70 0.87170 centsBusiness Suburban (BS) 3.40 0.80100 centsUtility Networks (UN) 2.50 0.58900 centsCommunity Facilities 1 (CF1) 1.00 0.23560 centsCommunity Facilities 2 (CF2) 0.50 0.11780 centsCommunity Facilities 3 (CF3) 2.50 0.58900 cents
2165. Summary of Revenue Required by Differential Group6. Examples of Rates on a Range of Typical PropertiesDifferential Group Rates 2009/10$000sTotal Rates byCategory $000sProportion OfTotal RatesThe examples below show how a range of properties are affected by the proposed rates for thenew year.Residential 58,896 63.0%Rural 462 0.5%CategoryRateableValues2008/09Rates2009/10 RatesUtility Networks 2,816 3.0%CVCurrentRatesNewRatesChangeAmountChange%ageBusiness:$$$$Accommodation 531Central 9,094Suburban 20,630 30,255 32.4%Community Facilities:1 7482 1343 137 1,019 1.1%Total Rates Levied $93,448 100.00%Residential – Average 386,000 1,596 1,642 46 2.9%Residential – High Value 800,000 2,539 2,618 79 3.1%Residential – 22 Flats 2,850,000 18,194 18,756 562 3.1%Residential – Low Value 240,000 1,263 1,298 35 2.8%Rural (No Services) 455,000 674 697 23 3.4%Rural (Full Services) 540,000 1,480 1,524 44 3%Bus. Accommodation 1,350,000 13,385 13,738 353 2.6%Business Central 9,800,000 84,288 87,096 2,808 3.3%Business Central 325,000 3,421 3,530 109 3.2%Business Suburban 1,700,000 22,538 23,067 529 2.3%Business Suburban – JSP 810,000 7,368 7,605 237 3.2%
hutt city <strong>community</strong> <strong>plan</strong> 2177. Rates Instalment DetailsThe amount of the annual rates payable on each rating unit ispayable by six equal instalments by the following dates:Instalment No.OneTwoThreeFourFiveSixDue Date20 August20 October20 December20 February20 April20 JuneWhere the annual rates are not able to be set in time for the firstinstalment, the first instalment will be calculated and chargedas one sixth of the previous year’s rates. The remaining fiveinstalments will then be calculated as each being one fifth ofthe amount of the annual rates, after deducting the amount ofinstalment one.8. Penalties on Unpaid RatesIf the rates instalment amount is not paid by the due date thenthe following penalty charges will be incurred:a) After the due date shown for each instalment, a penaltycharge of 10% of the amount remaining unpaid for thatinstalment will be added to the rate accountb) All rates levied in any previous financial year (includingany penalty amounts already added for late payment)which remain unpaid after the due date for payment ofthe second instalment in the current year (20 October),will incur a further penalty charge of 10%c) All rates levied in any previous financial year (including anypenalty amounts already added for late payment) whichremain unpaid after the due date for payment of the fifthinstalment in the current year (20 April), will incur a furtherpenalty charge of 10%.Provided that no penalty shall be added to any rate account:a) Where a direct debit authority is in place for payment of therates by regular weekly, fortnightly or monthly instalments,and payment in full is made by the end of the rating year; orb) Where any other satisfactory arrangement has beenreached for payment of the current rates by regularinstalments by the end of the rating year.
218<strong>Hutt</strong> <strong>City</strong> <strong>Council</strong>’s Fees and Charges for 2009/10The following is a consolidated list of <strong>Hutt</strong> <strong>City</strong> <strong>Council</strong>’s fees and charges. All fees and chargesinclude Goods and Services Tax (GST).ANIMAL SERVICESARCHIVESThere is no charge for inspecting items at the public reading room.2009/102009/10DogEntire dog $95.00Neutered $85.00All dogs not registered by 4 August $125.00Classified “Dangerous” $123.00Classified “Dangerous” and not registered by 4 August $184.50Responsible owner status $55.00Replacement registration tags $5.00Euthanasia at owner’s request $30.00Licence fee for keeping more than two dogs $30.00Infringement fees set in the Dog Control Act 1996 applyMicro-chipping fee $30.00Impounding and Sustenance FeesFirst impounding during year of registration $75.00Second impounding during year of registration $150.00Sustenance fee per dog per day $16.00Boarding fees per day $16.00Seizure fee $75.00Search Fees1 hour Without chargeAn initial charge for the first chargeable half hour $30.00For each subsequent half hour $38.00Research Questions – Fees apply* (New Charges)An initial charge for the first half hour $30.00For each subsequent half hour $38.00Note:ÎÎ *For Public Records Act accessÎÎ The full half-hour fee will be charged for each part-period usedÎÎ Fees are chargeable in advancePhotocopy FeesÎÎ Copying is subject to the physical condition and type of the item – in the interest ofpreserving the archive, and Copyright legislationÎÎ All copying of archives will be carried out by Archives staffA4 up to 20 pages Without chargeA4 pages in excess of 20 20 cents per pageFees to recover the cost of staff time may apply+A3$2.00 per pageFees to recover the cost of staff time may apply++ After the first 10 minutes of copying, staff time will be added to search/research time.
hutt city <strong>community</strong> <strong>plan</strong> 219BOAT SHEDSBoat shedCEMETERIES2009/10Independent valuationon a square metre basis2009/10Disin<strong>term</strong>entsBurial (body) $1,860.00*Ashes $170.00* Note: This figure is indicative only and the actual charge may differ depending onthe nature of the disin<strong>term</strong>ent2009/10Plot Purchase and Maintenance In-perpetuityAdult $1,240.00Child (1 to 12 Years) $492.00Infant (Under 1 year) $492.00Ashes $465.00Ashes garden, Taita and Wainuiomata $770.00Memorial tree plots, Block 18 $756.00Ponga trail, Block 19 $605.00Monumental plots, Block 16 $1,810.00In<strong>term</strong>ent FeesAdult $655.00Child (1 to 12 Years) $420.00Infant (Under 1 Year) $112.50Ashes $85.00RSA SectionBurial plot purchaseNo ChargeBurial in<strong>term</strong>ent fee $655.00Ashes plot purchaseNo ChargeAshes in<strong>term</strong>ent fee $85.00Ashes in<strong>term</strong>ent (memorial wall) $85.00Re-in<strong>term</strong>entsTo be charged as for in<strong>term</strong>ent feesSpecial Fees and ChargesOutside district fees* $843.00Outside district fee* – children under 12 $742.00Outside district fee* – RSA $843.00Outside district fee* – ashes $610.00Casket larger than standard $187.00Triple depth burial in<strong>term</strong>ent $153.00Outside standard hours of workActual CostPlaque/Memorial fees $65.00Plot cancellation fee $42.00Transfer of Exclusive Right $42.00Breaking of concreteActual CostSearch fee: Per entry (up to 30 minutes) $10.00* Applies to all plot purchases where deceased has lived outside the city for the last five or more years.Reimbursement for unused plots is calculated at the rate originally paid for the plot.
220COMMUNITY DEVELOPMENT2009/10Community Group Directory $5.00ENCROACHMENT ON HUTT CITY COUNCIL LAND2009/10Application fee (new applications) $168.70Application fee (alterations to existing use) $56.20GardensSingle garageDouble garageCommercial$112.50 per annum$125.00 per annum$250.00 per annumAssessed by <strong>Council</strong>at a market rateNote: these are indicative figures only and actual charges may differ depending on the nature of theencroachment. Other encroachment types will be assessed by <strong>Council</strong> on an individual basis.2009/10Copies of Otho-rectified Aerial Images (per tile) $50.00GIS Specialists time (per hour) $60.00District Plan spatial dataENVIRONMENTAL CONSENTS$1,000 or part thereofAll fees include GST and are payable under Section 36 of the Resource Management Act 1991.Fees are not refundable if your application is declined or withdrawn. Additional charges mayapply (see below).Application fees cover the cost of processing your application only. After you start building thereare charges to cover the cost of <strong>Council</strong>’s monitoring costs, such as site visits, research, photos,communications and administration.Resource ConsentsENGINEERING RECORDS AND LAND INFORMATION SERVICESPrint size Plan Printer TransparencyPlan PrinterInk Jet PlotsOversize – $50.00A0 – $30.00A1 $8.00 $5.00 $20.00A2 $4.00 $3.00 $10.00A3 $2.00 $7.00A4 – $5.00Land Use Consents (Non-complying, Discretionary,Restricted Discretionary, Controlled)Notified Application – Hearing required (includes up to 40 hours of processingand 1 monitoring inspection)If application is required to be notified in a daily newspaper an additional feeof $1,000.00 is required.Notified Application – No hearing required (includes up to 30 hoursof processing and 1 monitoring inspection)Limited Notification – (includes up to 30 hours of processing and1 monitoring inspection)2009/10$4,715.00$3,565.00$3,565.00
hutt city <strong>community</strong> <strong>plan</strong> 221Non-Notified Resource Consent (includes up to 7 hours of processing and1 monitoring inspection)Non-Notified Resource Consent – Residential Additions and Alterations(includes up to 5 hours of processing and 1 monitoring inspection)2009/10$920.00$690.00All additional processing (per hour) $115.00All additional monitoring inspections (per visit)Consultants Fees and Costs of Disbursements will also be additionallycharged and invoiced when consent is completedSubdivisions (including Unit Title/Cross Lease)Notified Application – Hearing required (includes up to 40 hours of processingand 1 monitoring inspection)If application is required to be notified in a daily newspaper an additional feeof $1,000.00 is required.Notified Application – No hearing required (includes up to 30 hoursof processing and 1 monitoring inspection)Limited Notification – (includes up to 30 hours of processing and1 monitoring inspection)Subdivision consent including land use consent (includes up to10 hours of processing and 1 monitoring inspection)Subdivision consent including Certificate under section 223 of the RMA(includes up to 8 hours of processing and 1 monitoring inspection)$115.00$4,715.00$3,565.00$3,565.00$1,265.00$1,035.00plus $50 perlot over 4 lotsCertificate under section 224 of the RMA $230.00Certificate under section 226 of the RMA (includes up to 3 hours of processing) $345.00Section 241 and 243 RMA application $690.00Rights of Way (includes 3 hours of processing) $345.00Rights of Way sealing fee $150.002009/10Other FeesSection 139a Existing Use Certificate application $690.00Certificate of Compliance (includes up to 6 hours of processing) $690.00Outline Plan (includes up to 6 hours of processing and 1 monitoring inspection) $745.00Outline Plan waiver $745.00Section 10 waiver, section 37 waiver, section 125 extension, section 126$690.00cancellation, section 127 and section 128 review (non-notified) RMA (includesup to 6 hours of processing)Sections 357, 357A and 357B objection (non-notified) $690.00Certificate of Use under Sale of Liquor Act $150.00Any special inspections (per hour) $115.00Sealing Fee (for urgent applications for registrable instruments) $80.00Certificate under Overseas Investment Act 1973 $360.00Cost of disbursements, i.e. venue hire, photocopying, catering, postage, Actual Costpublic notificationIndependent consultants, advisors, specialistsActual CostAll consents: additional processing hours (per hour) $115.00Discharge or Withdrawal of Registrable AgreementLegal costs plus officer’s time at (per hour) $115.00Processing request for Removal of Building Line (plus disbursements) $150.00Adjustment or Revocation of EasementsLegal costs plus officer’s time at (per hour) $115.00Land Information Memoranda (‘LIM’)Residential Property LIM $300.00Commercial Property LIM (deposit) $300.00Additional processing hours (per hour) if more than 2 hours is required for$100.00commercial property LIMs
222Building ConsentsProject Information Memorandum, Building Consent & Certificate of Acceptance FeePlease note that the PIM and BC fees listed below are a Base Fee only and DO NOT include anyadditional inspections, Consultants Fees or BRANZ and DBH levies. These will be charged extraas and if required.Total PIM and BCValue of Work PIM BC Total CostMinor Works Bldg/P & D$65.00 $165.00 $230.00Free Stand/Inbuilt FireTo $5,000 $160.00 $285.00 $445.00To $10,000 $160.00 $490.00 $650.00To $19,999 $290.00 $695.00 $985.00To $50,000 $290.00 $950.00 $1,240.00To $100,000 $320.00 $1,505.00 $1,825.00To $200,000 $320.00 $1,810.00 $2,130.00To $300,000 $480.00 $2,215.00 $2,695.00To $500,000 $540.00 $2,720.00 $3,260.00To $700,000 $700.00 $3,325.00 $4,025.00To $1,000,000 $950.00 $4,230.00 $5,180.00Over $1,000,000 $950.00+ $100.00per $200,000$4,235.00+ $360.00per $200,000$5,185.00+ $460.00per $200,000Once Building Consent has been granted, you will be notified of any further fees due, such asadditional Inspection Fees, Consultants Fees, BRANZ and DBH levies.Consultants Fees (e.g. Peer Review, NZ Fire Service, Legal or Professional advice) will becharged at actual cost plus disbursements.2009/10Amendment Fee (includes half hour processing time) $150.00All additional processing (per hour) $115.00Inspection Fee$100.00 per inspectionRefundable Damage Deposit $500.00Certificate for Public Use$165.00 when receivedwith a Building Consent$225.00 when receivedindependentlyService Connection FeeSewer $30.00Stormwater $30.00Water $60.00Certificate of AcceptanceWorks under $100,000Works $100,000 and over$700.00 deposit plusnormal consent fees andlevies for DBH$2,000.00 deposit plusnormal consent fees andlevies for DBHThe Building Research Association of New Zealand (BRANZ) levy charge is $1.00 per $1,000for works $20,000 and over, and the Dept of Building and Housing (DBH) levy charge is$1.97 per $1,000 for works $20,000 and over.
hutt city <strong>community</strong> <strong>plan</strong> 2232009/10Non Standard ProjectsRemoving load bearing wall (1 inspection) $190.00Demolition of Chimney $190.00Install French Doors (inside existing opening) $190.00Deck (with or without pergola) < 20m2 $190.00Kick out to soffit (under 10m2) $190.00Kick out to soffit (over 10m2) $190.00Re-site dwelling (on site) $190.00Re-locatable dwelling (move to another site) $190.00Stairs from basement to upper floor (1 inspection) $190.00Small Drainage work up to $4,999.00 value of work $190.00Hot Water Cylinder exchanges and similar $190.00Domestic solar hot water heating panelsNo ChargeOther FeesExemption from building work under Schedule 1 of the Building Act 1991(includes 1 hour processing)$100.002009/10Street Crossing InspectionActual CostStructural Checking FeeActual CostWater Connection/Alterations applicationActual CostSewer/Stormwater Connection/DisconnectionActual CostKerb and Channel ConnectionsActual CostBackflow Prevention DeviceActual CostSanitary Sewer TV SurveyActual CostStormwater TV SurveyActual CostCompliance Schedule/Building WOFBuilding Warrant of Fitness $100.00Building W.O.F – Annual Certificate $100.00Building W.O.F/C.S. Inspection$115.00/hourAmendment to Compliance Schedule $50.00Commercial Cable Car $100.00Residential Cable Car $50.00Change in Tenure$115.00/hourApplication for waiver or modification of Building Consent fee plus actualcost of any professional advice sought by <strong>Council</strong> (includes half hourprocessing time)$100.00Development and Financial ContributionsAll additional processing (per hour) $115.00Issue of PIM to Building Control Authority $100.00Plumbing Inspections $100.00General Inspections $100.00Marquee Licence (includes 1 hour processing) $100.00All additional processing (per hour) $115.00Swimming Pool and Spa Inspections – per inspection $100.00Building over <strong>Council</strong> Drains $200.00Section 72 – Building on land subject to natural hazardsActual CostSection 75 – Building on 2 or more allotmentsActual CostChange of Use $100.00Development and financial contributions are payable in relation to the subdivision anddevelopment of land. The amounts payable are described in <strong>Council</strong>’s Policy on Developmentand Financial Contributions (see page 257).2009/10Record SearchesProperty Search (includes 1 print) $20.00Print per microfiche image $5.00Certificate of Title $15.00Interests/document e.g. transfer, easement, covenant, lease $15.00
224ENVIRONMENTAL HEALTHPremises meeting the required standard by 1 July are eligible for a discount, providedre‐registration is applied for by 20 August.FeeDiscountFeeA Gradeor FoodControlPlan2009/10Transfer/minimum fee $50.00Non-complying inspection fee $80.00Class Five – Eating Houses (>40),Caterer (large), Wholesalers (large),Rest Homes (>50), Supermarkets (large),Supply of high risk food$843.00 $579.00 $474.00Travelling Shop – Food $250.00 $170.00Food PremisesFeeDiscountFeeA Gradeor FoodControlPlanFood Stall $250.00 $170.00Clubs/Canteens (small) – type 16 –$122.00 $85.00 $70.00no food preparationOther LicencesClass One – Fruiterers, Pre-packagedonly (low risk, pre-packaged)Class Two – Dairies, Service Stations(small premises – ready made foods –some ice cream/pre-wrapped pies),Clubs (medium), Supply of low risk foodClass Three – Clubs (large),Rest Homes (
hutt city <strong>community</strong> <strong>plan</strong> 225Additional ChargesEnvironmental Policy2009/10One off Food Stall $20.00New Premises – Establishment fee $100.00Initial Licence fee $80.00Transfer Licence fee $50.00Additional Inspections or Food Control Plan re-audit feeFood Safety Audits$80.00 per visit$90.00 per hour(expenses additional)Street Musicians Licence $20.00Amusement Devices (per site for 7 days)Noise ControlSet by statute2009/10Seizure Fine (stereo equipment) $140.00and $1 per day after the1st month of storageSecurity Alarms – daytime attendances $80.00Security Alarms – after hours attendances $150.00Consultancy and survey fee$100.00 per hour2009/10Requests for Change to District Plan (deposit) $5,000.00All actual costs related to the proposed <strong>plan</strong> change, including <strong>council</strong>officers’ time, will be borne by the applicant as follows:ÎÎ All work undertaken by the <strong>Council</strong>’s officers in connection with the requestfor the change shall be charged at $80.00 per hour against the deposit.ÎÎ Any hearing shall be charged at $1,000 per day or part day againstthe deposit.ÎÎ If the proposed change is notified publicly, advertising charges will beactual costs payable by the applicant.ÎÎ All information requested by the <strong>Council</strong> shall be supplied at theapplicant’s cost.Notice for Requirements (deposit) $5,000.00All actual costs related to the requirement, including <strong>council</strong> officers’ time,will be borne by the Requiring Authority as follows:ÎÎ All work undertaken by the <strong>Council</strong>’s officers in connection with therequirement shall be charged at $80.00 per hour against the deposit.ÎÎ Any hearing shall be charged at $1,000 per day or part day againstthe deposit.ÎÎ If the requirement is notified publicly, advertising charges will be actualcosts payable by the Requiring Authority.ÎÎ All information requested by the <strong>Council</strong> shall be supplied at the RequiringAuthority’s cost.Operative District PlanComplete set $250.00Text Volume $125.00Map Volume $125.00
226GAMBLING VENUE AND BOARD VENUE2009/10Weekends& PublicholidaysMainHallSupperRoomKitchen& SupperRoomMainHall &KitchenAllfacilitiesClass 4 Gambling Venue and Board Venue applications $300.00HALLSCommunity rates of charges for hall hire are set out below.The commercial rates are set at the <strong>community</strong> rate, plus 50%, with a separate negotiablecharge of up to 10% of the gross revenue of the commercial activity. A charity rate is alsoavailable by application.Town Hall and Horticultural HallMonday toFridayMainHallSupperRoomKitchen& SupperRoomMainHall &KitchenAllfacilities8 am – 12 noon $160.00 $40.00 $80.00 $210.00 $240.0012 noon – 2pm $80.00 $35.00 $50.00 $115.00 $145.002 pm – 6pm $160.00 $40.00 $80.00 $210.00 $240.006pm – 11 pm $180.00 $50.00 $120.00 $240.00 $285.008am – 6pm $270.00 $85.00 $160.00 $350.00 $425.002pm – 11pm $270.00 $85.00 $160.00 $350.00 $425.008am – 11pm $350.00 $120.00 $240.00 $475.00 $585.00After 11pm $70.00 $70.00 $70.00 $70.00 $70.008 am – 12 noon $225.00 $70.00 $115.00 $270.00 $325.0012 noon – 2pm $115.00 $45.00 $90.00 $160.00 $190.002 pm – 6pm $225.00 $70.00 $115.00 $270.00 $325.006pm – 11 pm $255.00 $90.00 $170.00 $335.00 $410.008am – 6pm $385.00 $115.00 $225.00 $490.00 $600.002pm – 11pm $385.00 $115.00 $225.00 $490.00 $600.008am – 11pm $490.00 $170.00 $335.00 $650.00 $805.00After 11pm $100.00 $100.00 $100.00 $100.00 $100.00Little TheatreAll FacilitiesMonday – FridayAll FacilitiesWeekends &Public Holidays8 am – 1 pm $130.00 $190.001 pm – 6 pm $130.00 $190.006pm – 11 pm $130.00 $190.00Two sessions in one day $210.00 $285.00Three sessions in one day $315.00 $430.00After 11pm $70.00 $100.00Note: The Town Hall supper room and kitchen are not available for public hire during normal workinghours of 8am – 5pm, Monday – Friday.
hutt city <strong>community</strong> <strong>plan</strong> 227Walter Nash StadiumMoera, Eastbourne and Belmont Community HallsOff PeakPeakUsage 1 Court 2 Courts 1 Court 2 CourtsAll FacilitiesMonday – FridayAll FacilitiesWeekends &Public HolidaysCasual Users $73.00 $85.00 $90.00 $124.00Major Users $62.00 $73.00 $79.00 $102.00Discount Users $45.00 $57.00 Not Available Not AvailableAll Day Hirage $1,970.00NOTE: These are maximum charges.Off Peak Hours: Weekdays between hours of 8am-3pmPeak Hours: Weekdays between hours of 3pm-10pmWeekends between hours of 8am-10pmMajor Users: Use the Stadium on a consistent basis for a period of 4 months or moreDiscount Users: Only available in off-peak and at the discretion of the TrustThese charges include:ÎÎ All permanent seatingÎÎ Set up of courts (i.e. hoops)ÎÎ ClocksÎÎ Kitchen (only available on all day hire)ÎÎ Changing rooms and showersPer hour (maximum) $15.00 $20.00Wainuiomata HallAll FacilitiesMonday– FridayWeekends& PublicHolidaysMeeting RoomMonday– FridayWeekends& PublicHolidaysPer hour (maximum) $15.00 $20.00 $10.00 $12.00Hardwick Smith LoungeAll FacilitiesMonday – FridayAll FacilitiesWeekends &Public HolidaysPer hour (maximum) $10.00 $15.00Kensington HallMonday – FridayWeekends &Public HolidaysPer hour (maximum) $8.00 $10.00
228LANDFILLs (all charges include a government waste levy)LIBRARIES2009/10Domestic Vehicles (cash only)Cars and station wagons $12.00Vans, utilities, SUV (4-wheel drives), small trailers $24.00(Max refuse dimensions: 2.5m long, 1m high, 1.5m wide)2009/10Interloans (non-urgent) per request $10.00Interloans (urgent)Lost itemsAt costReplacement cost plus$10 processing fee on adult itemsPlease note: Combinations of vehicles (vans, utilities, small trucks) and trailer will cost the sum of theirrespective charges.Rental collectionsVary according to format toa maximum of $10 per itemAll Other Vehicles (per tonne) $95.25Minimum Charge $47.62Special Burials $131.25Minimum Charge $65.62Overdue chargesVary according to format from$0.20 to $2.00 per day to a maximumof $10.00 per itemBorrower’s card replacement (per card) $2.00Internet access and computer use$1.00 per half hourPotentially Hazardous WastesBy negotiation, refer to the “<strong>Hutt</strong> <strong>City</strong> Landfill – Waste Disposal Guide”Car Bodies (per tonne) $95.25TyresDisposal of more than 4 tyres (per tonne) regardless of vehicle type $311.25Minimum Charge $155.62Refuse Bags (including government levy)Plastic bags – packet of 5 $9.50Plastic bags – packet of 10 $19.00Plastic bags – packet of 50 $95.00
hutt city <strong>community</strong> <strong>plan</strong> 229LITTERING INFRINGEMENT FEES2009/10Minor Littering Infringement fee $100Minor littering is defined as depositing in or on a public place or in or on private land without theconsent of the occupier:Cigarette butts; Wrappers/paper; Chewing gum; Small food waste; Take-away food/drinkcontainers; Fish & chip papers; Plastic drink bottle(s); and Aluminium can(s).NB: For cigarette butt littering, this is a two step enforcement process.First step: Educate/warning – offender advised this is not acceptable.Second step: If a person is found depositing cigarette butt litter having already been warned,an infringement fee of $100 will be issued.Medium Littering Infringement fee $200Medium littering is defined as depositing in or on a public place or in or on private land withoutthe consent of the occupier:Single used disposable nappy or nappies; Small dumping (e.g. shopping bags) – domestic/commercial waste in, or by, public litter bins; Small dumping in or by commercial waste bins/clothing bins/recycling stations; Persistent use of unofficial (non-<strong>council</strong>) refuse bags; andSmall insecure load from truck or trailer.NB: Small dumping defined as up to four shopping bags or two refuse bags or single items.Small insecure load is defined as paper, single item, grass clippings, dust that has come offa truck or trailer.2009/10Major Littering Infringement fee $400Major littering is defined as depositing in or on a public place or in or on private land without theconsent of the occupier:Household waste; Commercial waste; Green waste; Car parts; or any other litter as defined in theLitter Act 1997 not defined as a minor or medium littering above.NB: The Litter Act 1979 defines the depositing of glass or glass bottles (or broken glass orbottles) as a dangerous form of litter and thus considered by <strong>Council</strong> asa major littering offence. The decision whether to issue an infringement notice for major litteringor to refer the matter to the District Court will be de<strong>term</strong>ined on a case by case basis, basedon the severity and malicious intent of the alleged offence.OFFICIAL INFORMATIONThe following charges shall apply for requests made under the Local GovernmentOfficial Information and Meetings Act 1987 (The ‘Act’):(a) If the request is made by an identifiable natural person seeking access to any personalinformation about that person then such requests are subject to the Privacy Act 1993 andthese charges do not apply.(b) If the aggregate amount of staff time spent in actioning a request exceeds one hour thenthe basis of charging (except for the issue of Land Information Memoranda under section44A of the Act) is as follows:ÆÆ An initial charge for the first chargeable half hour or part thereofincluding search, retrieval, provision of information and supervision $30.00Æ Æ Each additional half hour or part thereof$38.00(c) Photocopying on standard A4 where the total number of pages exceeds 20(the first 20 pages will be free).$0.20per page
230(d) All other charges incurred shall be fixed at an amount that recovers the actual costsinvolved. This will include:ÆÆ Producing a document by computer or other like equipmentÆÆ Reproducing a photograph, film, video or audio recordingÆÆ Arranging for the applicant to hear or view an audio or visual recordingÆÆ Providing a copy of any map, <strong>plan</strong> or other document larger than A4, retrieval ofinformation off–site, or any situation in which a direct charge is incurred by the<strong>Council</strong> in providing the informationÆÆ Where repeated requests are made from the same source in respect of a common subjectin any eight-week period, requests after the first will be aggregated for charging purposes(e) A charge may be modified or waived at the discretion of a General Manager or the GeneralCounsel where payment might cause the applicant financial hardship, or where remissionor reduction of the charge would facilitate good relations with the public, or assist thesection, group or organisation in its work.(f) The charge may not include any allowance for:ÆÆ Information that is not where it ought to beÆÆ Time spent deciding whether or not access should be allowed and in what form (notethat the actual physical editing of protected information is chargeable)(g) Charges shall be paid in advance of receipt of information. Work on a request where thecharge is likely to exceed $76 may be suspended unless a deposit is paid.PARKINGAll metered parking within the Central Business District is managed with Pay & Display machines,which provide for payment by coins, TxT-a-Park or Credit Cards. HCC Pay & Display ParkingMeters provide GST Invoices, and do not vend coin change.Approved In-Car meters (e.g. SmartPark personal parking meter) are supported and HCC storedvalue cards are available from <strong>Council</strong>.Mobility car parks are provided at the prevailing zone fee.On-street metered parking is restricted to 2 hour maximum parking duration in the Lower <strong>Hutt</strong>commercial centre. High demand parking spaces attract a higher fee for the second optionalhour. All day parking is provided on-street and in the car parks that surround the central area.The Dowse car park offers metered 2 hour and 4 hour maximum duration parking.Hours of Meter operationGeneral FeesPremium Shopper Zone (red)(2 hour maximum)Shopper Zone (green)(2 hour maximum)Commuter Zone (yellow)(All day, unrestricted)Riverbank car parkTxt-a-Park & Credit CardsSmartPark stored value cards($50 & $100 denominations)Monday to Friday 9am to 5pm,except Public Holidays.$2 per hour, rising to $3 per hour for the second hour.$1.50 per hour.70 cents per hour with a $5 per day maximum charge.70 cents per hour, with a $4 per day maximum charge.A monthly pass is available at $60 per month (reducedto $45 for December).50 cent service fee applies.$5 service fee applies per card.
hutt city <strong>community</strong> <strong>plan</strong> 231Hours of Meter operationMonday to Friday 9am to 5pm,except Public Holidays.Hours of Meter operationMonday to Friday 9am to 5pm,except Public Holidays.Parking ZonesPremium Shopper Zone (red)($2 per hour, rising to $3 per hourfor the second hour – 2 hourmaximum)Shopper Zone (green)($1.50 per hour – 2 hour Maximum)High St (Laings Rd to Waterloo Rd)Queens Dr (Laings Rd to Waterloo Rd)Margaret St (Dudley St to Queens Dr)Bunny StWaterloo Rd (Queens Dr to High St)Laings Rd (Queens Dr to High St)Part Daly St (Dudley St to River Stopbank)Market Gr (North side)Ward StFraser StHigh St (Fraser St to Laings Rd)Queens Dr (Laings Rd to Daly St Extn)Andrews AveDudley StDaly St (North-east part from Andrews Ave)Rutherford St (Margaret to Countdown car park)High St (Waterloo Rd to Downer St)Queens Dr (Waterloo Rd to High St)Osbourne PlKings Cres (Cornwall St to Queens Dr)Bloomfield Tce (Knights Rd to Kings Cres)Cornwall St (Kings Cres to Pretoria St)Pretoria St (High St to residential boundary)Waterloo Rd (Queens Dr to Cornwall St)Raroa Rd (Cornwall St to eastern end)Commuter Zone (yellow)(70 cents per hour,$5 Maximum fee – All day)Myrtle Street (yellow)(70 cents per hour,$4 Maximum fee – All day,No monthly passes will apply)TheNewDowse car park (yellow)(70 cents per hour)Raroa Rd (High St to Cornwall St)Cornwall St (Knights Rd to Kings Cres)Knights Rd (Cornwall St to Bunny St)Stevens GrCivic Fountain car parkMarket Gr (South side)Rutherford St (Countdown car park to Queens Dr)Riverbank car park ($4 maximum & monthly $60pass available)Knights Rd to Huia St & north side Huia Stto Laings RdProvides 2 hour and 4 hour maximum parking durationat Commuter Zone rates.
232Penalties – Pay and Display Areas2009/10Not displaying a ticket $40.00Overstay where the excess time is:Not more than 30 minutes $12.00More than 30 minutes but no more than 1 hour $15.00More than 1 hour but no more than 2 hours $21.00More than 2 hours but no more than 4 hours $30.00More than 4 hours but no more than 6 hours $42.00More than 6 hours $57.00ROADINGSubdivision Inspection and Approval Charges2009/10Boundary adjustment $132.30Additional lots/unit titles – 3.43% of total construction cost for one new lot reducing by 0.07% foreach additional lot to 0.7% for 40 or more additional lots. The minimum fee is $132.30 irrespectiveof whether any construction work is necessary.Motor Crossing ChargesMiscellaneousStandardFeeAdmin/InspectionParking exemption permits available forContractors only – conditions apply.RECYCLING2009/10$15.00 per space per day or$8.00 per space per half dayConcrete dished crossing/m 2 $130.00 $72.00Extensions to existing concrete crossings/m 2 $130.00 $72.00Installation of concrete dished crossing in conjunction with $65.00 $72.00road reconstruction work/m 2Concrete block crossing/Pipe crossing/‘Slot’ type crossing/m 2 $130.00 $72.00Deposit for privately installed crossing ($200 refundedupon satisfactory completion of crossing)$272.002009/10Replacement recycling containers $10.00Trench Inspection FeesProposals, administration and monitoring on time basis:2009/10Engineer (per hour) $61.88Inspector (per hour) $42.75
hutt city <strong>community</strong> <strong>plan</strong> 233SPORTSFIELDSSeason ChargesSWIMMING POOLSIndoor Pools (Huia, Naenae, Stokes Valley)Set to recover the percentage of operating cost identified below plus the full operating cost ofancillary services:Recovery RatesPercentageLevel 1 Level 2 Level 3 Children Training/WinterSports 30 20 10 5 5Cricket/Croquet 25 15 10 5 N/AOne-off or Single Day HireCharged at 10% of the season charge per game or where the game lasts three hours or longer,15% of the season charge per day.Special ChargesEvents and commercial operators2009/10By quotationPicnic bookings (30 or more people) $30.00Filming per hour $100.00Marquees for picnics/promotions $100.00Hire of rooms, social facilities, training fields etc.Note: Bookings for the season will take priority over casual bookingsSTORMWATERBy quotation2009/10Casual RatesAdult $4.50Child $3.00Over 60s $3.00Spectator (non-supervising adult) $1.50Family pass (2 adults/4 children) $12.00Concession RatesAdult 10 swim $38.50Adult 30 swim $94.50Child & over 60s 10 swim $25.50Child & over 60s 30 swim $63.00Pool HireRegular Hire (25 metres per hour) $60.00Casual hire (25 metres per hour) $85.00Regular hire (50 metres per hour) – Naenae Pool $125.00Casual Hire (50 metres per hour) – Naenae Pool $180.00Lane charge (per hour) $17.00School GroupsGroup hire for Lessons (per head) $1.00Meeting RoomsCasual hire (per hour) $20.002009/10Stormwater connection fee $30.00
234Outdoor Pools (Eastbourne, McKenzie, Wainuiomata)WASTEWATER2009/10Casual RatesAdult $4.00Child $2.50Over 60s $2.50Spectators (non-supervising adult) $1.50Family pass (2 adults/4 children) $10.00Concession RatesAdult 10 swim $34.00Adult 30 swim $84.00Child & over 60s 10 swim $21.50Child & over 60s 30 swim $52.50Pool HireRegular hire (25 metres per hour) $40.00Casual hire (25 metres per hour) $58.00Regular hire (50 metres per hour) – Wainuiomata Pool $55.00Casual hire (50 metres per hour) – Wainuiomata Pool $120.00Wainuiomata Lounge HireCasual hire (per hour) $20.002009/10Wastewater connection fee $30.00Trade Waste ConnectionCheck application, prepare and print permit, fax copy and post original, invoice requisition.FeesConsentConsent + $200if conditionalconsent requiredClass 1: High Risk $1,600.00 $1,800.00Class 2: Moderate Risk $800.00 $1,000.00Class 3: Low Risk $400.00 $600.00Class 4: Minimal Risk $160.00 $360.00Note: May include laundries, dry cleaners, restaurants, small wash pads, supermarkets withdelicatessens and/or bakery, caterers, canteens.Class 5: Food Premises (Minimal Risk with Low Flow) $70.00 N/ANote: May include takeaway food premises, cafes and small restaurants.Application Fees $80.00Re-inspection Fees $80.00Trade Waste User Charges2009/10Flow (per cubic metre) $0.442 per m 3Total Suspended Solids$0.633 per kgCOD (Chemical Oxygen Demand)$0.257 per kg
hutt city <strong>community</strong> <strong>plan</strong> 235WATER2009/10Upper Belmont Development Levy (per lot) $5,640.00Water connection fee $60.00Fee for use of water by builders on unmetered industrial and commercial sites $55.00Charge for Ordinary Supply Class 2 WaterMinimum chargeUACDomestic water meter rental $60.00Normal users per cubic metreUp to 100,000 cubic metres $1.38In excess of 100,000 cubic metres $1.05Water supplied by hydrantPer cubic metre $1.38Minimum charge $25.00Back flow prevention – annual inspection charge $150.00
236Revenue and Financing PolicyIntroductionUnder the Local Government Act 2002 (“the LGA”), <strong>Council</strong> isrequired to adopt a Revenue and Financing Policy. <strong>Council</strong>adopted its first Revenue and Financing Policy as part of the<strong>Long</strong> Term <strong>Council</strong> Community Plan 2004-2014, and hasreviewed the Policy as part of the production of subsequentCommunity Plans.This Revenue and Financing Policy contains <strong>Council</strong>’s policiesin respect of funding operating and capital expenditure fromavailable sources. It is an important policy as it de<strong>term</strong>ineswho pays for <strong>Council</strong>’s activities.Funding of Operating ExpenditureThe <strong>Council</strong> funds operating expenditure from the followingsources:ÎÎGeneral ratesÎÎTargeted ratesÎÎFees and chargesÎÎInterest and dividends from investmentsÎÎGrants and subsidiesÎÎOther operating revenueRates provide the major source of revenue for funding localgovernment expenditure. Rates can be considered as a tax onreal estate property. Rates fund approximately 70% of <strong>Hutt</strong> <strong>City</strong><strong>Council</strong> activities with the remaining revenue coming mainlyfrom fees/charges (~22%), and operating subsidies, typicallyfrom Central Government Agencies (~5%). Rates are dividedinto general rates and targeted rates. General rates are setdifferentially depending on property use.General RatesThis is where the <strong>council</strong> decides that all ratepayers shouldpay for all or part of a particular <strong>council</strong> service. What eachratepayer pays depends on the assessed value of theirproperty relative to the value of other properties. Generally,the higher the assessed value of the property, the higher therates. However, <strong>council</strong>s can decide that different categoriesof properties should contribute differently to the total generalrate. For example <strong>Hutt</strong> <strong>City</strong> <strong>Council</strong> has decided that businessand utility network properties should pay a different rate perdollar of property value than residential properties. Within thebusiness category there are a number of sub-categories. Therate payable on each category of property is usually expressedas a multiplier of the residential rate. This is described as ‘thedifferential factor’. For example, if the residential rate is $1.00per $1,000 of rateable value and the business rate is $2.50,the business differential is said to be 2.5 times. In <strong>Hutt</strong> <strong>City</strong>,Rural properties are charged a differential of 0.65 (65% ofthe residential rate) to reflect the fact that they receive fewer<strong>Council</strong> services.<strong>Hutt</strong> <strong>City</strong> <strong>Council</strong> uses the following business sector differentials:Business Central 3.7Business Suburban 3.4Business Accommodation 3.0Utility Networks 2.5These differentials reflect the fact that businesses gaina higher share of the benefits of <strong>Council</strong> services. On average,a business will make greater use of the <strong>City</strong>’s wastewater,stormwater and roading services than residential ratepayersand will benefit more from work to improve town centres.The Business Central differential applies to the central businessdistrict. It is higher than the average business differential as<strong>Council</strong> incurs proportionally more expenditure in support ofthis area.Business Accommodation is a lower business differential foraccommodation facilities, reflecting that a significant portionof the costs attributable to this sub-group is already accountedfor through the targeted rates for water and wastewater.The Business Suburban differential applies to all other businessproperties except those mentioned separately here.The Utility Networks differential applies to the distribution networksof utility owners, of which <strong>Council</strong> is by far the biggest in the city.This differential effectively transfers additional costs to <strong>Council</strong>’swater-related activities, which is offset by a reduction in the overallgeneral rate requirement. The reversal of <strong>Council</strong>’s rates on itsown assets is achieved by a consolidated cost adjustment.Targeted RatesThis is where a <strong>council</strong> decides that the cost of a service orfunction should be met by a particular group of ratepayers(possibly even all ratepayers) on a different basis than thegeneral rate. There is considerable scope for local authoritiesto target functions in specific areas and to set different levels ofrates for different properties. The main targeted rates chargedby <strong>Hutt</strong> <strong>City</strong> <strong>Council</strong> are for Water Supply and for WastewaterServices. In addition, the Jackson Street upgrade project inPetone is funded through a rate targeted on all businessproperties on Jackson St. Recycling is also funded througha targeted rate in order to provide greater transparencyabout the use of the funding.
hutt city <strong>community</strong> <strong>plan</strong> 237Fees and ChargesLocal authorities can levy charges to contribute to the costof some facilities (such as swimming pools) and also feesto fully or partly meet the cost of regulatory services, suchas those under the Building and Resource ManagementActs. Similarly the <strong>Council</strong> has the ability to fine peopleand business for certain rule infringements. The amountof income derived through these fines depends on thelevel of noncompliance and the amount of effort the<strong>Council</strong> puts into enforcement activities.Funding of Capital Expenditure<strong>Council</strong> funds capital expenditure from borrowing andthen spreads the repayment of that borrowing over severalyears. This enables <strong>Council</strong> to best match charges placedon the <strong>community</strong> against the period of benefits fromcapital expenditure.Borrowing is managed within the framework specified in theLiability Management Policy (see page 281). While seekingto minimise interest costs and financial risks associatedwith borrowing is of primary importance, <strong>Council</strong> seeksto match the <strong>term</strong> of borrowings with the average lifeof assets when practical.<strong>Council</strong>’s overall borrowing requirement is reduced to theextent that other funds are available to finance capitalexpenditure. Such other funds include:ÎÎ<strong>Council</strong> reserves, including reserves comprisingdevelopment contributions under the Act, and financialcontributions under the Resource Management Act 1991.ÎÎContributions towards capital expenditure from otherparties such as Land Transport NZ (in relation to certainroading projects) and Upper <strong>Hutt</strong> <strong>City</strong> <strong>Council</strong> (in relationto joint wastewater activities).ÎÎAnnual revenue collected to cover depreciation charges.ÎÎProceeds from the sale of assets.ÎÎOperating surpluses.How does <strong>Council</strong> decide whatis funded from where?The Local Government Act 2002 (LGA), lists the factors that the<strong>council</strong> is to consider when it de<strong>term</strong>ines how much income willbe derived from a particular source i.e. how much income willcome from general rates versus targeted rates versus fees andcharges etc. A table showing how these considerations impacton the final cost allocation for each activity is included asAppendix A. The factors that are considered are:Distribution of BenefitsThe LGA requires <strong>Council</strong> to assess the benefits from eachactivity flowing to the <strong>community</strong> as a whole, and those flowingto individuals or identifiable parts of the <strong>community</strong>. Some<strong>term</strong>s that are useful in describing who benefits from aparticular service are:Î ÎNon-rival – the enjoyment of a benefit by a person doesnot prevent the benefit being enjoyed by other people atthe same time. An example is street lighting. Rival has theopposite meaning.Î ÎNon-excludable – no person or group can be preventedfrom enjoying the benefit. An example is beaches.Excludable has the opposite meaning.Î ÎPublic goods – goods or services that can often only besupplied by the <strong>community</strong>, and are usually both non-rivaland non-excludable.Î ÎPrivate goods – at the other extreme are pure privategoods that have the opposite characteristics – rivalry andexcludability. If the service provided by the <strong>Council</strong>benefits identifiable parties and the costs related to theservice can be allocated directly to them, such servicesare called private goods.Î ÎPositive Externalities – The use of private goods andservices can also result in benefits to third parties – peoplewho don’t directly use them. These are called ‘spill overeffects’ or ‘positive externalities’. The differentiation ofprivate and public goods and the identification ofexternalities are necessary for the strict apportionment ofthe costs between private users and the <strong>community</strong> as awhole. Sometimes such differentiation is not easy, becausevery few goods and services can be treated as pureprivate or public; most goods and service havecharacteristics of both private and public goods.Period of BenefitsThe LGA requires <strong>Council</strong> to assess the period over which thebenefits from each activity will flow. This in turn indicates theperiod over which the operating and capital expenditureshould be funded.For all activities operating costs are directly related to providingbenefits in the year of expenditure. As such, they areappropriately funded on an annual basis from annual revenue.
238Assets, purchased from capital expenditure, provide benefitsfor the duration of their useful lives. Useful lives range from afew years in the case of computer equipment through to manydecades for infrastructural assets such as pipe networks.This introduces the concept of intergenerational equity.This concept reflects the view that benefits occurring overtime should be funded over time. This is particularly relevantfor larger capital investments such as the wastewatertreatment <strong>plan</strong>t, bridges, landfills etc.Exacerbator PaysThe LGA requires <strong>Council</strong> to assess the extent to which eachactivity exists only because of the actions or inaction of anindividual or group. Examples are fixing a chemical spill,dog control, littering and parking fines.Sometimes known as polluter pays, this principle aimsto identify the costs to the <strong>community</strong> of controlling thenegative effects of individual or group actions. The principlesuggests that <strong>Council</strong> should recover any costs directly fromthose causing the problem. Most activities do not exhibitexacerbator pays characteristics. This heading is onlyincluded in the analysis of those activities which dodemonstrate such characteristics.Costs and Benefits of Distinct FundingThe LGA requires <strong>Council</strong> to consider the costs and benefits ofdistinct funding for each activity. This section is interpreted asrequiring <strong>Council</strong> to consider the costs and benefits of fundingeach activity in a way that relates exclusively to that activity.An example of this would be funding swimming pools entirelyfrom user charges, or refuse collection from a targeted rate.The consideration of the costs and benefits of distinct fundingmust include the consequences of the chosen funding methodfor transparency and accountability.Funding every activity on such a distinct basis would beextremely administratively complex. For some activities thequantity of rates funding to be collected amounts to only afew cents per ratepayer. The administrative costs and lackof significance lead <strong>Council</strong> to fund most activities by wayof a general rate.Funding Impact StatementA more detailed breakdown of the rating mechanisms usedand the impact of these mechanisms on each type of propertyis shown in the Funding Impact Statement in Appendix B.
hutt city <strong>community</strong> <strong>plan</strong> 239Appendix ARevenue and financing Policy by Major ActivityOutcomeFunding SourceProportionDistributionof BenefitsFunding RationaleLibraries<strong>Council</strong> provides, maintains andmanages eight libraries in the city.These are run as a single city-wideservice. Their primary role is to providewritten and recorded material such asbooks, audiovisual resources andaccess to online information. Libraryservices are used for many purposesincluding learning, research andentertainment.This activity contributes primarily tothe following Community Outcomes:ÎÎOutcome 5 – Lifestyle –affordable access to <strong>community</strong>facilities that include arts,cultural and recreationaloptions.ÎÎOutcome 9 – Healthy andEducated Community –everyone has access to awide range of excellenteducational services.Public – highPrivate – LowOther – LowOngoingWhile there are identifiable private benefits from the provision of libraryservices, the <strong>Council</strong> views the open and low cost access to informationand books as being in the best interest of the city as a whole. Allowingpeople to mostly use the library resources free of charge is seen ascontributing to the Community Outcome of “affordable access to<strong>community</strong> facilities that include arts, cultural and recreational options”.The library system is an efficient way for the <strong>community</strong> to pool theirreading and information resources and it is unlikely it could continue toexist if it operated on a strictly user pays system. Rather charges arelevied for late returns, internet access and DVD hire, but thesecontribute only a small amount towards total operating cost.Museums<strong>Council</strong> operates two museums. TheNewDowse displays art, craft and othercultural materials. The Petone SettlersMuseum specialises in the socialhistory of the Lower <strong>Hutt</strong> Valley andPetone. These institutions are open tothe public at no charge, other than forspecial exhibitions.This activity contributes primarily toCommunity Outcome 5 – Lifestyle– affordable access to <strong>community</strong>facilities that include arts, culturaland recreational options.Public – highPrivate – LowOther – LowOngoingThe <strong>Council</strong> believes that the support of the arts, recognition of oursocial history and cultural endeavours is an important component inmaking the city a vibrant and attractive city, as well as providing ameans for the <strong>community</strong> to express a sense of self and place. Whileindividual visitors to these facilities do gain private benefits, collectingan entry fee would be inefficient due to the costs associated withestablishing and operating a door charge system. <strong>Council</strong> recognisesthe contribution the Dowse Foundation and donors are making to thecity through the extensive <strong>community</strong> fundraising activities.
240OutcomeFunding SourceProportionDistributionof BenefitsFunding RationaleAquatics and Recreation<strong>Council</strong> provides and maintains sixswimming pools in the city as part of itsportfolio of recreational facilities.Recreational programmes are<strong>community</strong>-based programmesdesigned to encourage residents toengage in a range of recreationalactivities. These services are providedto promote health and enjoyment andstimulate the <strong>community</strong>’s interest indifferent recreational opportunities.This activity contributes primarily toCommunity Outcome 5 – Lifestyle– affordable access to <strong>community</strong>facilities that include arts, culturaland recreational options.Public – med/highPrivate – med/lowOther – lowBenefits areongoing so longas facilities aremaintained.Fees and charges contribute a significant portion of the income for thisactivity. This reflects the fact that individuals benefit from the personalfitness and enjoyment they derive from using the facilities. However it isalso recognised that there are positive benefits for the <strong>community</strong> whenthe population is fit and actively engaged. The pool also providesquality and accessible tuition in essential water safety and life skillswhich produces both private and public benefits. To this extent fundingfrom general rates is a key source of income for this activity.Parks and Reserves<strong>Council</strong> provides and maintainspassive recreational facilities in the cityfor the enjoyment and well-being of thepublic, free of charge. Sports fields areprovided and maintained throughcharges to sports codes. Recreationareas are both natural and created,with the majority of effort targeted atmaintenance and retaining areas intheir natural state. This activity alsoincludes <strong>Council</strong>’s cemeteries.This activity contributes primarily toCommunity Outcome 5 – Lifestyle– affordable access to <strong>community</strong>facilities that include arts, culturaland recreational options.Public – highPrivate – lowOther – lowLands purchasedfor sports groundsand reservesprovide substantialintergenerationalbenefits.Parks and Reserves: <strong>Council</strong> views the active participation of residentsin outdoor activities as beneficial to the whole <strong>community</strong>. Somedegree of user charging is appropriate, however affordability forsporting clubs is now a factor in limiting participation. The actions ofsports codes contribute to the need for <strong>Council</strong> to undertake themaintenance of sports fields, this is therefore an example of theexacerbator principle.Cemeteries: There is a significant private benefit in this service to thefamilies of deceased people where burials and internment services areprovided. There is also an ongoing <strong>community</strong> benefit in providing forthe respectful treatment of deceased people who form part of the<strong>community</strong>’s heritage and whakapapa.
hutt city <strong>community</strong> <strong>plan</strong> 241OutcomeFunding SourceProportionDistributionof BenefitsFunding RationaleCommunity Support<strong>Council</strong> has a policy of identifying andunderstanding its communities and theirissues. Through greater knowledge oflocal needs <strong>Council</strong> is able to respondsuitably to social issues affectingmembers and groups of communities itrepresents. The support <strong>Council</strong>contributes assists groups to achievetheir goals when it would not otherwisehave been possible owing to lack ofresources. This support includesfacilitation, advocacy, consultation andallocation of grants to <strong>community</strong>organisations and groups. Theseservices are carried out through<strong>Council</strong>’s Community DevelopmentDivision or through private contracts.This activity contributes primarily tothe following CommunityOutcomes:ÎÎOutcome 5 – Lifestyle – a citythat is safe, friendly andwelcoming, where peopleexperience a sense ofbelongingÎÎOutcome 5 – Lifestyle –affordable access to <strong>community</strong>facilities that include arts,cultural and recreationaloptions.Public – highPrivate – lowOther – lowThere is anintergenerationalaspect to thisactivity, in that theSocial PolicyFramework wasdeveloped over afew years but itsbenefits will occurover a longerperiod.In most cases <strong>community</strong> support or grants are targeted towards themost disadvantaged groups in society. Targeting intervention at themost disadvantaged groups does provide individual benefits for thosepeople. However the very nature of this service means that therecipients cannot be expected to shoulder the cost. By lifting the statusof our most disadvantaged groups, the whole <strong>community</strong> benefitsthrough greater social cohesion, higher productivity, and less demandfor remedial services. Therefore this activity is appropriately fundedfrom the general rate.
242OutcomeFunding SourceProportionDistributionof BenefitsFunding RationaleProperty<strong>Council</strong> manages a variety of propertiesfor use by the <strong>community</strong>. Theseproperties are mainly <strong>community</strong> andcivic halls and venues, public toilets and<strong>community</strong> houses. <strong>Council</strong>’s ownershipof most of these properties is largelyhistorical. There is significant publicpreference for retaining <strong>Council</strong>ownership of the properties used by the<strong>community</strong>, and facilitating <strong>community</strong>events, meetings and gatherings. Publictoilets are provided for <strong>community</strong>convenience and to safeguard publichealth. Progressive reviews of thesefacilities ensure they remain efficientand meet changing publicrequirements. <strong>Council</strong> also providesand maintains a number of otherproperties, including buildings used for<strong>Council</strong>’s administration and othermiscellaneous properties.This activity contributes primarily tothe following CommunityOutcomes:ÎÎOutcome 5 – Lifestyle –affordable access to <strong>community</strong>facilities that include arts,cultural and recreationaloptions.ÎÎOutcome 6 – RegionalFoundations – everyone has aquality standard of affordablehousing.Public – med/highPrivate – med/lowOther – lowOngoingThe provision of halls and venues (including <strong>community</strong> houses)provides largely individual benefits to the people or groups who usethem. Therefore fees and charges are set so that some of theoperational costs are recouped through user charges. Increasing theuser charge beyond the current rates would result in many <strong>community</strong>groups ceasing to operate.Public toilets provide benefits to both the individual and the public,however charging for public toilets would defeat the purpose for which<strong>council</strong> has provided them.
hutt city <strong>community</strong> <strong>plan</strong> 243OutcomeFunding SourceProportionDistributionof BenefitsFunding RationaleRoading and TrafficThe roading and traffic significantactivity consists of five sub-functions –roading and footpaths, street cleaning,street lighting, traffic management andparking. <strong>Council</strong> provides, maintainsand cleans sealed roads and footpathsthroughout the city. Traffic controlmeasures are utilised to ensure theefficient and safe movement of motorvehicles, cyclists, pedestrians andother forms of transport. Street lightingis provided to ensure the safety andsecurity of road and footpath usersat night.Parking involves the provision,maintenance and regulation ofon-street and off-street carparksin the commercial areas of the city.The location and regulation ofcarparks is designed to ensure fair,easy and efficient access to the city’scommercial areas.This activity primarily contributes tothe following CommunityOutcomes:ÎÎOutcome 1 – CommunityProsperity – a local economythat is attractive to bothbusinesses and residents.ÎÎOutcome 2 – Connected –enhanced roading system.ÎÎOutcome 6 – RegionalFoundations – roading, waterand waste (including recycling)work and are accessible to all.ÎÎOutcome 7 – Sense of Place – abuilt environment that isattractive, safe and healthy; amore attractive <strong>Hutt</strong> <strong>City</strong>.Public – med/highPrivate – lowOther – lowThe benefits ofroad facilities areongoing andspread over thelong <strong>term</strong>.Roading: Many of the benefits of roading networks accrue toindividuals or businesses. To a large extent, this is reflected in thesubsidies received by <strong>Council</strong> from government for roading, which areultimately funded from fuel excise, road user charges, and vehicleregistration charges. However, for the balance of costs which <strong>Council</strong>must cover, <strong>Council</strong> has no means to charge individual users of thelocal network on a user-pays basis. Consequently, rates revenue isused to fund <strong>Council</strong>’s share of these costs. Most roading expenditurein the city relates to the ongoing maintenance of the existing networkand assets, with only moderate expenditure on improvements. Most ofthe expenditure is therefore funded directly from rates revenue (andgovernment subsidies) rather than through borrowing. However, majorprojects with benefits over several decades or very high costs, will bedebt funded, along with an approximate contribution from developmentcontributions charges where possible. This helps ease the immediateburden on rates, helps to ensure intergenerational equity, and ensuregrowth costs are bourn by developers.Street Cleaning: Street cleaning has a range of benefits widely dispersedamongst the <strong>community</strong>, and for which there is little ability or sense incharging individual for the benefits they receive. The need to undertakestreet cleaning is partially caused by the actions of individuals littering ordumping and is thus, an exacerbator issue. However, it is very difficult topolice this activity and consequently, few costs are able to be recoveredthis way.
244OutcomeFunding SourceProportionDistributionof BenefitsFunding RationaleRoading and Traffic (contd)Parking: The benefits of on street parking largely accrue to theindividuals or groups involved. However charging and activelymonitoring parking in most areas, such as most urban neighbourhoods,is simply not practical or cost effective – although some timerestrictions may still apply. Consequently, a large proportion of the costis simply absorbed into the roading budget, and funded accordingly.In areas with a high concentration of parking demand, it becomesnecessary and cost-effective to manage parking, allowing much of thecost associated with these parks to be recouped through parkingcharges and/or fines.Water SupplyThis activity involves the supply of highquality drinkable water for domesticand commercial use. <strong>Council</strong>purchases bulk water from GreaterWellington Regional <strong>Council</strong>, and thisaccounts for 56% of the total cost ofwater supply to the city. Water is thendistributed around the city through thelocal pipe network. <strong>Council</strong>’s ownershipof the pipe network is historical. Thereis a legal requirement for <strong>Council</strong> toretain control of these assets.This activity contributes primarily tothe following CommunityOutcomes:ÎÎOutcome 1 – CommunityProsperity – a local economythat is attractive to bothbusiness and residents.ÎÎOutcome 4 – HealthyEnvironment – clean air,water and land.Public – lowPrivate – highOther – lowOngoing benefitsas long asinfrastructure ismaintained.Much of the benefit from this activity is considered to be private to thepeople who obtain and use the water. In the absence of metering,targeted rates can be seen as a proxy for user charges. All connectionsare charged the targeted rate, and this is assumed to cover the supplyof the average residential user. Commercial water users are charged ona metered rate for water consumption over and above this volume.Public health benefits arise out of the treatment of water borne diseases.Water leakage and unaccounted-for water accounts for a significantamount of total water use. This cost is spread evenly across all users.
hutt city <strong>community</strong> <strong>plan</strong> 245OutcomeFunding SourceProportionDistributionof BenefitsFunding RationaleWastewater<strong>Council</strong> ensures the treatment anddisposal of household and commercialeffluent according to regional andnational environmental standards.A new treatment <strong>plan</strong>t wascommissioned in 2002 to ensureeffluent is treated to higher standards.This activity primarily contributes tothe following CommunityOutcomes:ÎÎOutcome 1 – CommunityProsperity – a local economythat is attractive to bothbusinesses and residents.ÎÎOutcome 4 – HealthyEnvironment – clean air, waterand land.ÎÎOutcome 6 – RegionalFoundations – roading, waterand waste (including recycling)work and are accessible by all.ÎÎThrough treating and disposingof wastewater <strong>Council</strong> isprotecting both the physicalenvironment and the health ofthe <strong>community</strong>. There is also alegal requirement for <strong>Council</strong> toretain control of these assets.Public – lowPrivate – highOther – lowThe benefit ofwastewater serviceare ongoing andspread over thelong <strong>term</strong>.The removal of wastewater largely benefits the person whosewastewater is removed. However the public also benefits throughimproved public health and an unpolluted environment. The operationof many social and commercial activities would be curtailed if raweffluent was not properly dealt with.There is also a significant exacerbator component to the treatment ofwastewater, as people cause costs through their action (for examplecommercial businesses that produce tradewaste) or inaction (forexample not installing a dual flush toilet).Some revenue is collected from the Upper <strong>Hutt</strong> <strong>City</strong> <strong>Council</strong> as anoperating contribution towards the shared service.
246OutcomeFunding SourceProportionDistributionof BenefitsFunding RationaleStormwater<strong>Council</strong> operates an effective drainagesystem to protect property from floodingdamage. Stormwater infrastructureincludes pipe networks, street-sidegutters, retention dams and openwatercourses. These are provided andmaintained according to the reasonablecosts of managing foreseeable floodingevents. There is a legal requirement for<strong>Council</strong> to retain control of these assets.This activity primarily contributes tothe following CommunityOutcomes:ÎÎOutcome 1 – CommunityProsperity – a local economythat is attractive to bothbusinesses and residents.ÎÎOutcome 4 – HealthyEnvironment – clean air,water and land.ÎÎOutcome 6 – RegionalFoundations – roading,water and waste (includingrecycling) work and areaccessible by all.Public – highPrivate – lowOther – lowThe benefitsaccrue over a longperiod,and hence costsneed to beappropriatelyallocated betweenthe current andfuture users.Stormwater reticulation, watercourses, major storm events andwatercourse quality management addressed under this activity, arepartly for private benefit but mainly for public benefit. This is in <strong>term</strong>s ofdealing with public spaces and the public stormwater system,managing damage from severe flooding and conducting monitoringand pollution control for the <strong>community</strong> at large. Economies of scaleassociated with the provision of the overall system are also recognised.Buildings and pavements increase the necessity for stormwa<strong>term</strong>anagement and in this respect the built-up areas can be consideredto exacerbate the problem.Solid Waste<strong>Council</strong> contracts out the collection ofmost residential and some commercialsolid waste and household recycling. Italso owns two landfills for the disposalof the city’s refuse. <strong>Council</strong>’s WasteManagement Plan guides this activity.<strong>Council</strong> wishes to promote recyclingand waste reduction and to provide forthe disposal of the city’s solid waste.Residents and businesses can opt outof <strong>Council</strong>-controlled service but as yetno private sector operators have putforward acceptable proposals forsignificant non-<strong>Council</strong> landfills.This activity contributes primarilyto Community Outcome 4 – HealthyEnvironment – clean air, waterand land.Public – lowPrivate – HighOther – lowThe benefits of thisactivity are ongoingand spread over along period.The primary benefits of this activity are private benefits to peoplewhose refuse is disposed of, and this is the classic example of polluterpays. Solid waste charges need to be set to incentivise people toreduce, reuse, recover and recycle. If these more beneficial actionscan be encouraged we can significantly diminish the amount of wasteto landfill.<strong>Council</strong> provides kerbside recycling which is funded through atargeted rate. Recycling produces public benefits through thesustainable resource use and through the deferral of costs involvedin replacing landfills.There are also public benefits in ensuring that refuse is disposed ofappropriately. The consequences of poorly dealt with waste areimmediate public health effects. <strong>Long</strong>er <strong>term</strong> health effects can alsoresult from interaction with contaminated sites.
hutt city <strong>community</strong> <strong>plan</strong> 247OutcomeFunding SourceProportionDistributionof BenefitsFunding RationaleEnvironmental Management<strong>Council</strong> develops, implements andmonitors the District Plan, relevantby-laws and other environmentalpolicies and <strong>plan</strong>s for the sustainabledevelopment of the city. <strong>Council</strong>’sstatutory resource management andbuilding approval functions as well asliquor licensing and environmentalhealth are also included under thisactivity. Regular inspections are carriedout to ensure compliance withlegislative requirements, the DistrictPlan, resource consent and buildingconsent conditions and by-lawrequirements. Regular inspections ofbusiness premises, certification andliquor licensing are undertaken topromote and protect public health inthe city.Noise and hazardous substances arecontrolled by this activity. The control ofanimals and stock in the city (a largepart of which involves dogs and dogregistrations) and public educationabout the care and control of animalsare also covered.There is a legal requirement forthis activity.This activity contributes primarily tothe following Community Outcomes:ÎÎOutcome 4 – HealthyEnvironment – continuedprotection and conservationof our environment.ÎÎOutcome 5 – Quality Lifestyle –a city that is safe, friendly andwelcoming, where peopleexperience a sense ofbelonging; a diverse naturalenvironment that is accessible,enjoyable and safe.ÎÎOutcome 7 – Sense of Place –a built environment that isattractive, safe and healthy.Public – medPrivate – medOther – lowBenefits ofregulatory activitiesare ongoing evenwhere specificregulationschange.Environmental Policy: District <strong>plan</strong>ning has a mix of private and publicbenefits, as well as encouraging optimal resource use over time. TheDistrict <strong>plan</strong> is de<strong>term</strong>ined by the <strong>community</strong> in <strong>term</strong>s of the ResourceManagement Act. It therefore applies to, and represents theenvironmental aspirations of the <strong>community</strong> as a whole.Environmental Approvals: The environmental approvals activity isundertaken to ensure that public welfare is not jeopardised by theactions of individuals or groups now or in the future. Current chargesfor building permits are already considered to be at the top end of whatthe consumer can reasonably afford to pay. High charges will restrictdevelopment activity or lead to a higher rate of charge avoidance.Environmental Inspections & Enforcement: The environmentalinspections and enforcement activity ensures that the policies andregulation of <strong>Council</strong> are being complied with. The service also acts tocontrol the negative effects of non-compliance by individuals or groups,nearly all of which are businesses. There is also a general public benefitin the assurance of a safe environment.Animal Control: Animal control is primarily the dog control function with asmall amount of service involved with general livestock control. Dogregistration fees are a targeted form of cost recovery for this activity. Ananimal control function is necessary in order to ensure the public is safefrom the negative effects of animal ownership. At one level, the activitycan be considered an exacerbator issue, as the actions of animal ownerscreate the need for the service. Often, it can be hard to track down ananimal’s owner – or the animal may be a stray – so recouping the costsof this activity are difficult.
248OutcomeFunding SourceProportionDistributionof BenefitsFunding RationaleEmergency Management<strong>Council</strong> develops and implementscity-wide emergency management<strong>plan</strong>s, and promotes <strong>community</strong>preparedness for emergencies. Plansare also in place for dealing with andpreventing rural fires. <strong>Council</strong> maintainsthe in-house capacity to co-ordinateresponses to both civil defence andrural fire emergencies. There is a legalrequirement under the Forest and RuralFires Act and the Civil Defence Act for<strong>Council</strong> to perform these functions.This activity contributes primarily toCommunity Outcome 5 – Lifestyle– a city that is safe, friendly andwelcoming, where peopleexperience a sense of belonging.Public – Med/HighPrivate – Med/lowOther – medBenefits ofpreparednessare ongoing,although directbenefits are short<strong>term</strong> in the event ofa disaster.The whole <strong>community</strong> benefits from this activity. It is triggered wherethe disruption to <strong>community</strong> life is such that a coordinated <strong>community</strong>response is required.The work regarding rural fire response and prevention applies largely to<strong>Council</strong>-owned land and therefore any benefits apply to the <strong>community</strong>.A rural fire response is necessary to deal with fires lit accidently ordeliberately. Where the person responsible for starting a rural fire isidentified, they are dealt with through the courts and compensation isobtained where possible.Revenue is collected from the Upper <strong>Hutt</strong> <strong>City</strong> <strong>Council</strong> as an operatingcontribution towards the shared service and this is reflected in the‘other’ funding source category.Local Urban environment<strong>Council</strong> aims to develop an urbanenvironment that will help to attractpeople and investment and enhancethe city’s image. <strong>Council</strong> alsorecognises the contribution the city’sheritage buildings and features play inthe city’s image and history. The publicspace of the city is managed anddeveloped by <strong>Council</strong> on behalf of the<strong>community</strong>. The benefits of preservingbuildings of architectural, heritage andhistoric value are to the <strong>community</strong> as awhole, as the work required is often ofno benefit to the owner or occupier.<strong>Council</strong> therefore purchases the publicbenefit on behalf of the <strong>community</strong>.This activity contributes primarily toCommunity Outcome 7 – Sense ofPlace – a built environment that isattractive, safe and healthy.Public – highPrivate – lowOther – lowBenefits areongoing.Particularly workaround thepreservation ofheritage elementsis intended for thebenefit of futuregenerations.<strong>Council</strong> aims to carry out improvements to public areas to improve theamenity value of the city. Most of the benefits from this activity accrueto the <strong>community</strong> as a whole. Certain parts of the <strong>community</strong>, such asbusiness owners, may gain distinct private benefits as a result of<strong>council</strong> work in shopping areas etc.
hutt city <strong>community</strong> <strong>plan</strong> 249OutcomeFunding SourceProportionDistributionof BenefitsFunding RationaleEconomic Development<strong>Council</strong> has a leading role in fosteringthe city’s growth in a number of ways.These are through creating a businessfriendlyenvironment, facilitating theexpansion and creation of localbusinesses and employment, increasingtourism to the city and contributing toregional growth through regionaleconomic development initiatives.Individual businesses generally haveinsufficient incentives to exploreopportunities that benefit the city as awhole as well as themselves. The city’sbusinesses and residents benefit from<strong>Council</strong>’s support of the business sectorand from the promotion of the city as aplace to visit.This activity contributes primarily toCommunity Outcome 1 –Prosperous Community – a localeconomy that is attractive to bothbusinesses and residents.Public – Med/highPrivate – lowOther – lowOngoingThe general economic development function of <strong>Council</strong> aims toincrease jobs and wealth for the benefit of the whole city. Theseprojects are targeted at regional cooperation and growth industries.Over time the economic growth of the city does not benefit any onegroup in the <strong>community</strong>.Governance<strong>Council</strong> is an elected body thatgoverns the direction and objectivesof the activities it is responsible foron behalf of the city. Communityrepresentatives on Community Boardsand Community Committees are partof <strong>Council</strong> and provide local input intogovernance issues. <strong>Council</strong> is requiredby law to have elected members.This activity contributes to allCommunity Outcomes in that theelected members of <strong>Council</strong>are responsible for defining thoseoutcomes and deciding how theyare to be achieved.Public – highPrivate – lowOther – lowOngoingThe beneficiaries of this activity are the people and organisationsin the <strong>City</strong> who benefit through the democratic governance of the<strong>City</strong>’s affairs.
250OutcomeFunding SourceProportionDistributionof BenefitsFunding RationaleAdvice and SupportThis activity involves the processes ofpolicy formation, consultation andpublic accountability on behalf of<strong>Council</strong>. The most public examples ofthis are the annual <strong>plan</strong>ning andreporting processes and thedevelopment of the city’s strategic<strong>plan</strong>s. Professional advice and supportare necessary to assist the <strong>community</strong>and their representatives on <strong>Council</strong>,Community Boards and CommunityCommittees to make informeddecisions on behalf of the <strong>community</strong>.This activity contributes to allCommunity Outcomes.Public – highPrivate – lowOther – lowOngoingThe beneficiaries of this activity are the people and organisationsin the <strong>City</strong> who benefit through the democratic governance of the<strong>City</strong>’s affairs.Managing ServicesThis activity incorporates theorganisational support functions thathelp <strong>Council</strong> to provide its otheractivities in the most efficient andeffective manner. It includes:This activity contributes to allCommunity Outcomes bysupporting all of <strong>Council</strong>’sother activities.Public – highPrivate – lowother – lowOngoingThe entire <strong>community</strong> benefits from the <strong>Council</strong> being run as anefficient organisation.ÎÎHuman Resources ManagementÎÎFinancial ManagementÎÎCorporate Strategy and RiskÎÎCorporate CounselÎÎInformation ServicesKey:High 80-100% Med/high 60-79% Med 40-59% Med/low 20-39% Low 0-19%
hutt city <strong>community</strong> <strong>plan</strong> 251Appendix BFunding Source ProportionsApproximate Share of General RateActivity Funding Source Private Other Public Proportionof RateResidential Business UtilityNetworksRuralGeneral RateLibraries General Rate Low Low High 12% 9.5% 2.0% 0.4% 0.1%Museums General Rate Low Low High 4% 2.6% 1.2% 0.1% 0.1%Aquatics and Recreation General Rate Med/Low Low Med/High 9% 7.0% 1.5% 0.3% 0.2%Parks and Reserves General Rate Low Low High 17% 13.6% 2.9% 0.5% 0.0%Community Support General Rate Low Low High 4% 3.3% 0.6% 0.1% 0.0%Property General Rate Med/Low Low Med/High 5% 4.0% 0.8% 0.1% 0.1%Roading and Traffic General Rate Low Low Med/High 23% 5.0% 15.0% 3.0% 0.0%Stormwater General Rate Low Low High 11% 6.3% 4.5% 0.2% 0.0%Solid Waste General Rate High Low Low (10%) (8.0%) (1.5%) (0.3%) (0.2%)Environmental Management General Rate Med Low Med 8% 1.2% 6.8% 0.0% 0.0%Emergency Management General Rate Med/Low Med Med/High 1% 0.7% 0.2% 0.1% 0.0%Local Urban Environment General Rate Low Low High 2% 0.2% 1.8% 0.0% 0.0%Economic Development General Rate Low Low Med/High 3% 0.0% 2.9% 0.1%Governance General Rate Low Low High 4% 3.1% 0.7% 0.1% 0.1%Advice and Support General Rate Low Low High 7% 5.8% 0.9% 0.2% 0.1%Managing Services General Rate Low Low High100% 54% 40% 5% 1%Targeted RatesWater Supply Targeted Rate (Water) High Low Low 100% 88.9% 11.0% 0.0% 0.1%Wastewater Targeted Rate (Wastewater) High Low Low 100% 94.0% 5.7% 0.0% 0.3%
252Significance Policy1. ObjectiveAll decisions the <strong>Council</strong> makes must be made in accordancewith the decision-making requirements of the Local GovernmentAct 2002 (set out in sections 76-81). <strong>Council</strong> must make ajudgement about how to achieve compliance with the Act thatreflects the significance of the matter under consideration.This policy explains the <strong>Council</strong>’s approach to de<strong>term</strong>iningsignificance and lists the thresholds, criteria and proceduresthat will be used in the assessment.2. IntroductionThe Local Government Act 2002 sets out the framework for<strong>Council</strong>’s consultation and decision-making processes.Significance is a key concept in this framework. The <strong>term</strong>significance, as used in the Act, is not intended to have a precisedefinition and instead refers to a continuum – from decisions thatare trivial in nature to decisions that are of major importance. The<strong>council</strong> must decide where on the continuum a decision sits andwhat level of analysis and consultation is appropriate every timea decision is made.The significance continuum has a threshold at which pointdecisions are deemed to be ‘significant’. If an issue requiringdecision is de<strong>term</strong>ined to be ‘significant’ the <strong>council</strong> will:1. Undertake consultation in accordance with the SpecialConsultative Procedure (see s84 and 97of the Act).2. Appropriately observe section 76(1) of the Act,i.e. ensure that every decision is made in accordancewith the decision-making requirements set out in theAct (s.76 (3)(b) refers).3. Take into account the relationship of Maori and theirculture and traditions, if any of the options involvesa significant decision in relation to land or a bodyof water (s.77 (1)(c) refers).The Significance Policy, along with the <strong>Council</strong>’s Consultationand Engagement Policy, gives <strong>Council</strong> guidance on whatconsultation processes should be followed in relation to aparticular decision. The <strong>Council</strong>’s ‘Guide to Good DecisionMaking’ provides further assistance as to what analysis isappropriate given the significance and nature of a decision.Even where <strong>Council</strong> deems that a particular decision doesnot reach the ‘significant’ threshold, they may still chooseto adopt the Special Consultative Procedure.3. Approach to decision-makingand significanceDe<strong>term</strong>ining significanceA significant decision is one that has a high degree ofsignificance in <strong>term</strong>s of its impact onÎÎthe wellbeing of <strong>Hutt</strong> <strong>City</strong> and/orÎÎpersons likely to be affected by or with an interest inthat decision and/orÎÎthe costs to or the capacity of the <strong>Hutt</strong> <strong>City</strong> <strong>Council</strong> toprovide for the wellbeing of the city.When considering the significance of a proposal, decision orother matter, the <strong>Council</strong> will use the following threshold andcriteria: (Note: it is the cumulative effect of all these criteria thatde<strong>term</strong>ines the overall significance of a matter).ÎÎThe extent to which the matter flows logically andconsequentially from a significant decision alreadymade or from a decision in the LTCCP (as amended)or the Annual Plan.Trivial Significant Major ImportanceIncreasing level of analysis andconsultation appropriateMatter hadbeen signalledin the LTCCPincreasing significanceMatter has not beensignalled in the LTCCP oris contrary to a positiontaken in the LTCCP
hutt city <strong>community</strong> <strong>plan</strong> 253ÎÎThe magnitude of the matter in <strong>term</strong>s of its net cost to the<strong>Council</strong>. Where a decision has not been highlightedthrough the LTCCP or Annual Plan, a decision involving achange in spending of more than 10% of the <strong>plan</strong>nedcapital expenditure for capital items or 5% of the <strong>plan</strong>nedoperating expenditure for operating decisions will beconsidered significant.Low $ Amountincreasing significanceHigh $ AmountÎÎThe transfer of ownership or control, or the disposal orabandonment of a Strategic Asset as a whole as definedby the LGA or listed in section 4 of this policy will beconsidered to be significant. The degree to which transferof ownership or control, or the disposal or abandonmentof a part of a Strategic Asset undermines the integrity/functioning of the asset as a whole or restricts thenetworking utility of the asset will also be considered.ÎÎThe matter includes consideration of a large increase inuser fee or the introduction of a user fee for a service thathas previously been provided free of charge.Small fee increase –at or below inflationincreasing significanceLarge fee increase, orintroduction of newuser charge especiallywhere this will affectvulnerable residentsÎÎThe matter includes consideration of an alteration to theintended level of service provision for any core <strong>Council</strong>activity, including a decision to commence or cease anysuch activity.Small servicelevel alterationincreasing significanceLarge service levelalteration or decisionto commence orcease activityespecially wherethis will affectvulnerable residentsÎÎReversibility and Intergenerational equity. The moreirreversible the effects of a decision the more significanceit has – particularly where the decision involves theunsustainable use of resources and thus reduces the rightof future citizens to inherit the same diversity of natural andsocietal resources enjoyed by current citizens.Effects of thedecision arereversibleincreasing significanceEffects of thedecision areirreversibleÎÎPracticality. The Act provides for the <strong>Council</strong> to take intoaccount the circumstances under which a decision istaken and what opportunity there is to consider a rangeof options of the views and preferences of other people.In circumstances in which failure to make a decisionurgently would result in the loss of opportunities which areassessed as able to contribute to achieving the <strong>community</strong>outcomes, then the <strong>Council</strong> will tailor its decision makingprocesses to allow as much evaluation and consultation asis practicable while achieving the timeline required.Discrete compotnent –no impact on integrityof whole strategic assetincreasing significanceUndermines abilityof strategic assistto deliver serviceMatter requiresthat a decisionis made urgentlyincreasing consultationand analysis appropriateNo particularurgency isrequired
254ÎÎThe extent to which the matter under consideration iscontroversial within the <strong>community</strong>.Low degree ofpublic interestand controversyProcedureincreasing significanceHigh degree ofpublic interestand controversyAll reports to <strong>Council</strong> will include an assessment of thesignificance of the report’s recommendations. A statementshowing how the <strong>Council</strong> has (or will) appropriately observe(d)the Act, with regard to the appropriate degree and form ofconsultation and analysis, will also be included.If the recommendations are considered to be above the‘significant’ threshold, an external peer review will be soughtto confirm that the decision-making process undertaken is inaccordance with the decision-making requirements set out inthe s76 of the Act.4. Strategic AssetsThe Act defines a Strategic Asset as:“an asset or group of assets that the local authority needs toretain if the local authority is to maintain the local authority’scapacity to achieve or promote any outcome that the localauthority de<strong>term</strong>ines to be important to the current or futurewellbeing of the <strong>community</strong> and includes—(a) any asset or group of assets listed in accordance withsection 90(2) by the local authority and(b) any land or building owned by the local authority andrequired to maintain the local authority’s capacity to provideaffordable housing as part ofits social policy and(c) any equity securities held by the local authority in –(i) a port company within the meaning of the PortCompanies Act 1988:(ii) an airport company within the meaning of theAirport Authorities Act 1966”In accordance with section 90(2) of the Local GovernmentAct 2002 <strong>Hutt</strong> <strong>City</strong> <strong>Council</strong> considers the following assetsto be strategic:ÎÎRoading NetworkÎÎWastewater Network and TreatmentÎÎStormwater NetworkÎÎWater Supply NetworkÎÎLandfillsÎÎNetwork of parks and reservesÎÎDowse and Settlers CollectionsÎÎLibrary Network
hutt city <strong>community</strong> <strong>plan</strong> 255Policy on Partnerships with the Private Sector1.A policy adopted under section 102(4)(e) –(a) must state the local authority’s policies in respect of thecommitment of local authority resources to partnershipsbetween the local authority and the private sector; and(b) must include –(i) the circumstances (if any) in which the localauthority will provide funding or other resourcesto any form of partnership with the private sector,whether by way of grant, loan, or investment,or by way of acting as a guarantor for any suchpartnership; and(ii) what consultation the local authority will undertakein respect of any proposal to provide funding orother resources to any form of partnership with theprivate sector; and what conditions, if any, the localauthority will impose before providing funding orother resources to any form of partnership withthe private sector; and(iii) an outline of how risks associated with any suchprovision of funding or other resources areassessed and managed; and(iv) an outline of the procedures by which anysuch provision of funding or other resourceswill be monitored and reported on to the localauthority; and(v) an outline of how the local authority will assess,monitor, and report on the extent to whichCommunity Outcomes are furthered by anyprovision of funding or other resources or apartnership with the private sector.2. In this section partnership with the private sector meansany arrangement or agreement that is entered into betweenone or more local authorities and one or more personsengaged in business; but does not include:(a) any such arrangement or agreement to which the onlyparties are:(i) local authorities; or(ii) one or more local authorities and one or more<strong>council</strong> organisations; or(b) a contract for the supply of any goods or services to,or on behalf of, a local authority.The policy can only be amended as an amendment to theCommunity Plan.PurposeThe policy is linked to the statutory principle that a localauthority should collaborate and co-operate with other localauthorities and bodies as it considers appropriate to promoteor achieve its priorities and desired outcomes, and makeefficient use of its resources (section 14(e) of the LocalGovernment Act refers).This policy only applies to partnerships with the private sector.“Partnership with the private sector” is defined in the LocalGovernment Act to mean any arrangement or agreement that isentered into between one or more local authorities and one ormore persons engaged in business, but does not include:ÎÎArrangements or agreements to which the only parties arelocal authorities or one or more local authorities and one ormore <strong>council</strong> organisations.ÎÎA contract for the supply of goods or services to, or onbehalf of, a local authority.To clarify, <strong>Council</strong> has considered this definition with regard tothe apparent overall intent of the legislation and the nature of<strong>Council</strong>’s business. <strong>Council</strong> has de<strong>term</strong>ined that specificallythis policy shall apply to:ÎÎArrangements or agreements for provision of grants, loans,guarantees, or investments between <strong>Council</strong> and personsengaged in business.ÎÎAgreements for a venture where <strong>Council</strong> participates with aperson engaged in business with some joint objective.ÎÎAny agreement with a person engaged in business to forma <strong>Council</strong> organisation, or any agreement to sell shares in a<strong>Council</strong>-controlled Organisation or <strong>Council</strong>-controlledTrading Organisation to a person engaged in business (thiswill be in addition to the requirements of section 56 of theLocal Government Act if applicable).but shall NOT apply to:ÎÎContracts between <strong>Council</strong> and its ordinary suppliers ofgoods and services (for example, purchase of officesupplies or legal services).ÎÎContracts between <strong>Council</strong> and its customers for theordinary supply of goods and services (for example, saleof swimming equipment or provision of various consentsor licences).ÎÎContracts for the supply of goods and services between<strong>Council</strong> and its agents for undertaking activities of <strong>Council</strong>(such as building or maintaining roads).ÎÎBorrowing by <strong>Council</strong> and the investment of <strong>Council</strong>’s fundspurely for financial gain as these transactions will beaddressed in the Liability Management and InvestmentPolicies respectively.ÎÎAgreements with or grants to <strong>community</strong> organisations,charitable trusts and other <strong>community</strong> groups, governmentdepartments, not-for-profit organisations, other local
256authorities and <strong>Council</strong>-controlled Organisations wherethe other organisation is to supply any goods or servicesto, or on behalf of, <strong>Council</strong>.ÎÎMemoranda of Understanding or Heads of Agreementwhere <strong>Council</strong> is not providing any funding or othersignificant resources to the other party.Circumstances under which <strong>Council</strong>may consider a partnership withthe private sector<strong>Council</strong> may consider a partnership with the private sectorwhere there are benefits to <strong>Council</strong> of committing resourcesto a partnership with the private sector such as when:ÎÎA need, that a partnership with the private sector wouldaddress, has been defined in measurable <strong>term</strong>s.ÎÎThe partnership is the most effective means of realising<strong>Council</strong>’s strategic goals or Community Outcomes asdefined in <strong>Council</strong>’s Community Plan.ÎÎThe partnership will lower the cost of the provision ofidentified services to the <strong>community</strong>.ÎÎRisk allocation is shared equitably.ÎÎThere is scope for the private sector to contributeparticular skills and/or innovative capacity.Consultation<strong>Council</strong> will only undertake consultation in respect of anyproposal to provide funding or other resources to any formof partnership with the private sector if that partnership isde<strong>term</strong>ined to be significant in <strong>term</strong>s of <strong>Council</strong>’s approvedSignificance Policy. <strong>Council</strong> will generally not undertakeconsultation in respect of a proposal to provide funding orother resources to any partnership with the private sectorthat is not considered significant.ConditionsThe conditions any Public/Private Sector partnership will besubject to will depend on the nature of the partnership butwill include the following where appropriate:ÎÎPrivate sector participation will be subject to approvedprocurement processes, with an emphasis on transparencyand disclosure of processes and outcomes,acknowledging the need to protect commercialconfidentiality where appropriate.ÎÎAny proposed partnership will be assessed against<strong>Council</strong>’s policies, <strong>plan</strong>s, strategic goals and CommunityOutcomes as specified in the Community Plan.ÎÎOutputs will be clearly specified including measurableperformance standards.ÎÎThe partnership is compliant with other relevant legislation.ÎÎAll private sector parties will be fully accountableto <strong>Council</strong> for the delivery of the specified projectand/or services.Risk Management<strong>Council</strong> will assess and manage any risks associated with anyPublic/Private Sector partnership in the following manner:ÎÎRisk will be assessed, monitored and reported inaccordance with <strong>Council</strong>’s risk management framework.ÎÎRisk allocation between the partners will be clear andenforceable, with consequential financial outcomes.ÎÎThe major principle governing risk will be a risk transferregime where risk will be transferred to whoever isbest able to manage it, taking into account publicinterest considerations.ÎÎEach party must have the freedom to choose how tohandle and minimise any risk.ÎÎWhere <strong>Council</strong> is not the only user of an asset, demand(or volume/usage) risk may also be transferred.Monitoring and Reporting<strong>Council</strong> will monitor and report on a Public/Private Sectorpartnership by:ÎÎEnsuring transparency and disclosure of key processesand outcomes.ÎÎClearly setting out responsibilities for the monitoringof outcomes.ÎÎMonitoring and reporting progress on partnershipcontracts in accordance with <strong>Council</strong>’s financial andprogramme reporting regime.ÎÎAssessing and monitoring Community Outcomes asrequired under the Local Government Act 2002 AnnualReport requirements.
hutt city <strong>community</strong> <strong>plan</strong> 257development and financial contributions policyPart 1: Introduction – FinancialContributions Policy and DevelopmentContributions Policy1 IntroductionThe <strong>Long</strong> Term <strong>Council</strong> Community Plan (LTCCP) includescapital expenditure that <strong>Council</strong> expects to incur to meetthe increased demand for <strong>community</strong> facilities resultingfrom growth in the <strong>City</strong>, for example from subdivision ornon-residential building developments. Un<strong>plan</strong>ned capitalexpenditure is also needed occasionally to accommodatechanges to, or increased demand, from specific developments.The <strong>Council</strong> must make adequate and effective provision inits Community Plan to fund this expenditure.In the interests of achieving financial equity between existingratepayers and new developers, <strong>Council</strong> has decided thatdevelopers should pay the growth related capital expenditurecosts of providing <strong>community</strong> facilities (network infrastructure,<strong>community</strong> infrastructure and reserves).To achieve this equity, <strong>Council</strong> charges financial contributionsas specified in its District Plan prepared under the ResourceManagement Act 1991 (RMA) and development contributionsunder the Local Government Act 2002 (LGA). Financialcontributions and development contributions are separatecharges and are used to fund separate categories ofexpenditure by <strong>Council</strong>.This section is divided into three parts:Part 1 (this Part) provides a summary of the <strong>Council</strong>'s financialcontributions and development contributions policies.Part 2 sets out the 'operational' development contributionspolicy. This describes the kinds of development for whichdevelopment contributions are payable, what they amount to,when they are assessed, and when they need to be paid etc(see sections 2 to 4). Part 2 is all most people will need toread if they wish to know how to calculate the developmentcontributions payable for a specific development.Part 3 sets out the 'substantive' development contributionspolicy. This describes the legislative framework, the processfollowed by the <strong>Council</strong>, the methodology followed to makethe decision to use development contributions to fund growthrelated capital expenditure, and the relevant capitalexpenditure figures (see sections 5 to 12). Part 3 will mainlybe of interest to people who want to know the details of howthe policy was developed and how the developmentcontributions payable under this policy were de<strong>term</strong>ined.1.1 What are financial contributions?Financial contributions are required where individualdevelopments give rise to capital expenditure that is notincluded in the LTCCP and for reserves. In these cases,<strong>Council</strong> may impose a financial contribution as a conditionof resource consent, specifically:ÎÎFinancial contributions for reserves.ÎÎFinancial contributions to which District Plan Rules 12.2.1through to 12.2.1.6, and 12.2.2.1 apply.A brief summary of these is provided below.Reserve Contributions – Subdivision of landThere is a long history of requiring subdividers of land toprovide land or money for the purpose of providing public openspace as reserves. Reserves are generally required as part ofthe subdivision process as they provide open space andrecreation facilities and opportunities necessary to cater foradditional demand generated and also to protect and enhanceamenity values. As communities continue to grow in size andpopulation there is a need to provide recreation and openspace to meet their needs and requirements.As part of its evaluation under section 32 of the RMA, a numberof options were assessed by <strong>Council</strong> and after considerableconsultation with the public, developers and other specialinterest groups, it was considered that reserve contributionsshould be set at a maximum of 7.5% of the value of eachadditional allotment. It was recognised that the maximumreserve contribution is not appropriate in all cases and thiscan be adjusted taking into account criteria specified inRule 12.2.1.7(b) of the District Plan.Reserve Contributions – Development of landThe District Plan also recognises that the developmentof land for business/commercial purposes can increase thenumber of people employed at a particular location andconsequently there may be an increase in demand for openspace and recreation areas. After considerable consultationwith the public, property owners, developers and other specialinterest groups, and after evaluating various options, it wasconsidered by <strong>Council</strong> that where commercial or industrialdevelopment will result in an increase or intensification of useof land, a reserve contribution in the form of money equivalent
258to 0.5% of the value of the development in excess of $200,000is appropriate. It was also recognised that the maximum reservecontribution is not appropriate in every case and the maximumcould be adjusted based on criteria specified in Rule12.2.2.2(b) of the District Plan.Financial Contributions – ServicesIn the District Plan the developer of a subdivision ordevelopment is responsible for funding all work within itsboundaries relating to services directly required for thesubdivision or development. This approach has been inpractice for a very long period of time. Two main methodsfor imposing financial contributions have been adopted inthe District Plan, these being the recoupment impact fee(or sometimes called the recognised equity method) andthe capital improvements programme fee.In summary the District Plan requires financial contributionsas follows:ÎÎIn subdivision or development of land the rules specify thatthe developer is responsible for all work within itsboundaries relating to services directly required.ÎÎThe rules specify that where, as a result of subdivisionor development of land, services in adjoining land whichwere previously adequate become inadequate, then thesubdivider or developer should pay for the full and actualcosts of upgrading services.ÎÎWhere subdivision or development takes place and theservices in the adjoining land are already inadequate, thenthe rules specify that the subdivider or developer shouldpay a proportion of the costs of upgrading services.ÎÎIn cases where <strong>Council</strong> has upgraded services in advanceof land being subdivided then the subdivider or developershould pay the full and actual costs of upgrading, takinginto account the time value of money, when the land issubsequently subdivided or developed.Financial Contributions – Traffic impact fee for retailactivities and places of assembly in all residentialand rural activity areasThe District Plan recognises that large scale retail activitiesexceeding 3,000 square metres in floor area and all placesof assembly in residential and rural activity areas may haveadverse effects on the surrounding roading network and onpedestrian circulation. In such circumstances the District Planrequires that the developer contribute to the upgradingand modification of the surrounding roads, intersectionsand footpaths.1.2 What are development contributions?Development contributions provide the <strong>Council</strong> with a methodto fund <strong>plan</strong>ned infrastructure required as a result of growth,such as subdivision or workplace building developments.Development contributions may be required in relation to adevelopment if its effect is to require new or additional assetsor assets of increased capacity and as a consequence the<strong>Council</strong> incurs capital expenditure to provide appropriately fornetwork infrastructure or <strong>community</strong> infrastructure. This alsoincludes infrastructure already built in anticipation of growth.The policy provides for the <strong>Council</strong> to impose developmentcontributions on developments to fund growth related capitalexpenditure on:ÎÎNetwork infrastructure, i.e:ÆÆwater supplyÆÆwastewaterÆÆstormwaterÆÆtransport and roadingÎÎCommunity infrastructure, i.e. local urban environmentinfrastructureDevelopment contributions are not payable at this stage forreserves (which are dealt with through financial contributionsunder the RMA) or other categories of <strong>community</strong> infrastructuresuch as pools, libraries, or museums.1.3 Relationship between financial contributionsand development contributionsThe development contributions policy is distinct from andin addition to the provisions in the District Plan that provide<strong>Council</strong> with the discretion to require financial contributionsunder the RMA.Development contributions are used to help fund <strong>plan</strong>nedand budgeted capital expenditure related to growth. Financialcontributions are required for reserves and for where individualdevelopments give rise to capital expenditure that is notincluded in the LTCCP, and therefore that expenditure is notincluded in <strong>Council</strong>’s development contribution policy. In thesecases, <strong>Council</strong> may impose a financial contribution as acondition of resource consent. The following table illustratessome examples of the types of infrastructure works which fallunder either the <strong>Council</strong>’s financial contribution requirementsor the development contributions policy.
hutt city <strong>community</strong> <strong>plan</strong> 259Infrastructure TypeConnection of subdivision sewer to main systemLocal Asset(FinancialContributions)Planned <strong>City</strong>wideInfrastructure(DevelopmentContributions)2.1 How to calculate your developmentcontributionThe diagram below illustrates the process for calculatingdevelopment contributions payable. Steps 1 to 3 aredescribed in sections 2.2-2.4 (below).New roads constructed as part of a subdivisionIntersection changes for management of increased traffic caused by newshopping centreStep 1Calculate how many Equivalent Household Units(EHUs) 1 your development will create for eachinfrastructure groupOpen space reserve for subdivisionIncreased diameter water main to allow for increased flow to service newproperties created by subdivision<strong>City</strong> wide traffic networks and/or safety improvements needed to cater forincreased traffic from population and business growthStep 2Calculate how many EHU credits (if any) for yourdevelopment and deduct from the number ofEHUs in step 1.Additional capacity at the wastewater treatment <strong>plan</strong>tStormwater network upgrade to provide increased capacity to cater for growthNew reservoir to provide additional storage capacity for growthStep 3Go to the schedule of development contributionsin section 2.4 and identify the fees payable perEHU for each infrastructure group.PART 2: OPERATIONAL POLICY2 Application of the policyThis development contributions policy will apply to all resource consents, building consents and authorisations for serviceconnections granted from 1 July 2009 (refer section 3.1 for assessment process). The previous policy shall continue to applyfor all resource or building consents and authorisations for service connections granted before this date.Step 4Multiply the number of EHUs (less credits in step2) in your development by the developmentcontribution identified in step 3 and add 12.5%to account for GST. This is the total developmentcontribution payable for your development.1. Refer to page 265 for a definition of Equivalent Household Unit.
2602.2 How to calculate the number of EHUs (Step 1)Development contributions are payable for the number of EHU's created by each development. EHU's are applied as followsfor all developments.Infrastructure Group Residential Non Residential2.3 Credit for EHUs for existing development(Step 2)In some cases, credits may be used to reduce the developmentcontribution payable. Credits will be expressed in EHUs foreach infrastructure group.Roading and TrafficWater SupplyWastewaterStormwater1 EHU per household unitor allotmentRetail: 1 EHU per 20m 2 GFA 2Commercial: 1 EHU per 50m 2 GFAIndustrial: 1 EHU per 85m 2 GFA1 EHU per 265m 2 GFA1 EHU per 275m 2 GFA1 EHU per 200m 2 impervious areaCredits will not be refunded, and can only be used fordevelopments on the same site. Credits cannot be used toreduce the number of units of demand to less than zero.A credit is given for the number of EHUs assessed for theexisting or most recent prior use of the site. This is to recognisesituations where the incremental demand increase oninfrastructure is not as high as the assessed number of unitsof demand implies.Local Urban EnvironmentRetail: 1 EHU per 75m 2 GFACommercial: 1 EHU per 150m 2 GFAIndustrial: 1 EHU per 800m 2 GFAIn some cases, a different EHU factor can apply for certain types of residential developments (refer 2.5 Modifications to assessments).Different EHU factors can also apply for non-residential developments where a special assessment or self-assessment of EHUsis undertaken. See section 2.5 for more information.The number of EHU credits available will be calculated byapplying the criteria in the above paragraph except where:ÎÎResidential allotments existing as at 1 July 2009 – theseare deemed to have a credit of one EHU.ÎÎNon residential developments where a special assessmentprocess is used – in this case, the special assessmentprocess will also be used to de<strong>term</strong>ine any credits.2. GFA stands for Gross Floor Area. Refer to page 265 for a definition of Gross Floor Area.
hutt city <strong>community</strong> <strong>plan</strong> 261Examples where credits will arise are illustrated in the below table.2.4 Schedule of development contributions (Step 3)Type of existing developmentRe-development of six residential allotmentsinto a commercial office blockInfill residential subdivision of existingallotment into two allotments.Residential development of existing CBD sitewith 400m 2 GFA commercial building (200m 2footprint) into eight unit title apartments –no additional impervious areaNature of credit(s)6 EHUs credits, i.e. one for each of theexisting residential allotments1 EHU credit, i.e. one for the originalallotment. Development contributionspayable on 1 EHURoading and traffic: 8 EHUs credits(400m 2 GFA/50m 2 per EHU)Local urban environment: 2.67 EHUs credits(400m 2 GFA/150m 2 per EHU)Water supply: 1.51 EHU credits(400m 2 GFA/265m 2 per EHU)Wastewater: 1.45 EHU credits(400m 2 GFA/275m 2 per EHU)Stormwater: 1 EHU credit (200m 2 impervioussurface/200 m 2 per EHU)The schedule of development contributions is below. All fees in the schedule are GST exclusive.AssetsDevelopment contribution per EHURoading and traffic $276Water supply $113Wastewater $2,087Stormwater $348Local urban environment $136Total $2,9602.5 Modifications to assessmentsMinor Household UnitsA minor household unit, such as a rear section ‘granny flat’, shall be assessed at 0.5 EHU peradditional unit. For the purpose of this policy, a minor household unit is defined as a residentialunit with a maximum gross floor area of 65 square metres that is additional to a residentialhousehold unit already established on the allotment.Development where there is no connectionFor developments where there is no connection to water supply or wastewater reticulationsystems, the <strong>Council</strong> will reduce the amount of the development contribution payable by thewater supply or wastewater component. If a development is subsequently connected to thewater and/or wastewater reticulation systems, the applicable contribution will be payableprior to connection.
262Rural development and stormwater infrastructureDevelopment in non-urban areas where no stormwater systemsare provided will not be charged the development contributioncomponent related to stormwater.Private development agreementsWhere it is in the interest of both parties, the <strong>Council</strong> mayconsider entering into a private development agreement witha developer. This agreement must clearly identify the departurefrom the standard processes and calculations and state thereasons for this approach. It must also state clearly why theagreement is in both parties’ interests.Self assessments and Special assessments fornon-residential developmentsThe standard non-residential units of demand may be departedfrom where self assessment is sought by the developer or aspecial assessment is required by the <strong>Council</strong>.ÎÎThe onus is on the applicant to prove (on the balance ofprobabilities) that the actual increased demand createdby the development is different from that assessed byapplying the standard non residential unit of demand.Actual increased demand means the demand created bythe most intensive non residential use(s) likely to becomeestablished in the development within 10 yearsfrom the date of application.ÎÎThe <strong>Council</strong> may de<strong>term</strong>ine an application made under thispart at its discretion. In doing so the <strong>Council</strong> must take intoaccount everything presented to it by way of the writtenapplication, and may take into account any other matter(s)it considers relevant.ÎÎAny application must be accompanied by the fee payableto recover the <strong>Council</strong>'s actual and reasonable costs ofde<strong>term</strong>ining the application. The fee will be assessedat the time of application. <strong>Council</strong> may levy additionalfees to meet <strong>Council</strong>'s actual costs, should the actualcosts be materially higher than the initial assessment.Special assessmentÎÎThe assessment must relate to all infrastructure for whichdevelopment contributions are payable under the policy.ÎÎThe <strong>Council</strong> may request information from the applicantto establish the actual increased demand.ÎÎThe <strong>Council</strong> must bear its own costs in relation to thespecial assessment.ÎÎEverything the <strong>Council</strong> intends to take into account whenmaking a special assessment must be provided to theapplicant for a written reply at least 14 days before theassessment is de<strong>term</strong>ined.ÎÎThe <strong>Council</strong> may de<strong>term</strong>ine a special assessment madeunder this part at its discretion. In doing so the <strong>Council</strong>must take into account everything presented to it by wayof a written reply, and may take into account any othermatter(s) it considers relevant.Assessment guidelinesWithout limiting the <strong>Council</strong>'s discretion, when assessing anapplication for a self-assessment, or a special assessmentinitiated by <strong>Council</strong>, the <strong>Council</strong> will be guided by the following:Self-assessmentAn applicant may apply for a self-assessment of the numberof EHUs payable for a particular development as follows:ÎÎThe application must be made in writing before anydevelopment contributions payment in respect of thedevelopment becomes due.ÎÎThe assessment must relate to all infrastructure categoriesfor which development contributions are payable underthe policy.If the <strong>Council</strong> believes on reasonable grounds that theincreased demand for roading and traffic, water supply,wastewater, stormwater, and urban design assessed fora particular development by applying the standardnon-residential unit of demand is materially less than theactual increased demand created by the development,it may require a special assessment to de<strong>term</strong>ine thenumber of EHUs as follows:ÎÎA special assessment must be initiated before anydevelopment contributions payment in respect of thedevelopment becomes due.InfrastructureTypeRoading and trafficWater supplyWastewaterStormwaterLocal urban environmentUsage Measure per EHU10 vehicle movements per day730 litres per day675 litres per day200 m 2 of impervious surface1 hour per day
hutt city <strong>community</strong> <strong>plan</strong> 2632.6 When the <strong>Council</strong> will not requirea development contributionProvision of infrastructureThe <strong>Council</strong> is unable to require a development contributionfor network infrastructure or <strong>community</strong> infrastructure if, andto the extent that:ÎÎIt has, under section 108(2)(a) of the Resource ManagementAct 1991, imposed a condition on a resource consent inrelation to the same development for the same purpose;ÎÎThe developer will fund or otherwise provide for thesame local reserve, network infrastructure, <strong>community</strong>infrastructure in agreement with the <strong>Council</strong> (and citywidefees will still apply); orÎÎThe <strong>Council</strong> has received or will receive funding from athird party.Land use consent or unit title developmentThe conversion of an existing unit development into unit titleswill not be assessed for development contributions, as thechange does not generate a new demand for networkinfrastructure or <strong>community</strong> infrastructure. This does not applyto any building consents required as part of any changes to theexisting unit development, which will still be assessed tode<strong>term</strong>ine if development contributions are applicable.Minor non-residential additionsDevelopment contributions for non-residential developmentswill not apply to an addition of less than 10 square metres ofgross floor area to an existing building in any 12 month period.<strong>Council</strong> developmentsThe <strong>Council</strong>’s own developments are exempt from being liableto pay development contributions. For the avoidance of doubt,this exemption does not apply to developments undertakenby or on behalf of <strong>Council</strong> organisations, <strong>Council</strong> controlledorganisations, or <strong>Council</strong> controlled trading organisations,as defined in section 6 of the LGA.3 Assessment and PaymentThis part of the policy sets out when a development will beassessed to de<strong>term</strong>ine if a development contribution isrequired and, if so, when payment is required.3.1 Assessment and liability<strong>Council</strong> may assess developments to de<strong>term</strong>ine if developmentcontributions are payable. In making this assessment, thefollowing stepped process is followed. Each step must besatisfied for a development to be subject to a requirementfor a development contribution.Step 1Step 2Step 3The application involves a “development”.A development is:ÎÎAny subdivision or other developmentthat generates a demand for networkinfrastructure, or <strong>community</strong> infrastructure;butÎÎDoes not include the pipes or lines of anetwork utility operator.The development, either alone or in combinationwith another development, requires the <strong>Council</strong>to incur capital expenditure on new or additionalassets or assets of increased capacity.None of the exemptions provided for in section2.6 of this policy apply.The development is subject to adevelopment contribution
2643.2 When the <strong>Council</strong> will assess if adevelopment contribution is requiredGenerally, developments will be assessed for developmentcontributions when:ÎÎResource consent is granted under the ResourceManagement Act 1991 for a development; orÎÎBuilding consent is granted under the Building Act 2004for building work (including the grant of a certificate ofacceptance); orÎÎAuthorisation for a service connection is granted.In most circumstances, <strong>Council</strong> will make the assessmentat the earliest time any of the above apply.The following provide more information on when the <strong>Council</strong>will assess developments for development contributions forspecific types of developments.Subdivision of land (excluding unit title development)A development involving a resource consent being grantedunder the RMA for the fee simple subdivision of land will beassessed when the subdivision consent is granted. Where asubdivision consent provides for its implementation in stages,the <strong>Council</strong> will apportion any development contributionassessed between each stage, on the basis of the numberof EHU's generated by each stage.Building consentThe <strong>Council</strong> will assess all developments requiring a buildingconsent when the building consent is granted, unless alreadyassessed when resource consent was granted under the RMAfor the fee simple subdivision of land.Service connectionDevelopments requiring a service connection, for whicha development contribution has not been assessed and/orpaid, will be assessed at the time of the application forservice connection.3.3 PaymentFor developments subject to a development contribution,liability for payment of the development contribution willarise from the time the resource consent, building consentor service connection is granted. The payment of thedevelopment contribution must be made within 6 monthsof that date, except in the case where <strong>Council</strong> has agreedto accept a guarantee in accordance with section 3.4 below.3.4 GuaranteesAn applicant may request that <strong>Council</strong> accept a guaranteefor any development contribution payable in excess of$50,000. This request must be made at the time a resourceconsent, building consent or service connection is granted.Guarantees shall:ÎÎOnly be accepted from a registered trading bank.ÎÎBe for a maximum period of 24 months, subject to anyextension(s) as may be agreed by the <strong>Council</strong>.ÎÎWill have an interest component added, at an interest rateof 2% above the Reserve Bank official cash rate on theday the guarantee document is prepared. The guaranteedsum will include interest, calculated on the basis of themaximum <strong>term</strong> set out in the guarantee document. If the<strong>Council</strong> agrees to an extension of the <strong>term</strong> of the guaranteebeyond 24 months, the applicable interest rate will bereassessed from the date of the <strong>Council</strong>'s decision andthe guaranteed sum will be amended accordingly.ÎÎBe based on the GST inclusive amount of the developmentcontribution payable.At the end of the <strong>term</strong> of the guarantee, the developmentcontribution (together with interest) is payable immediatelyto <strong>Council</strong>. If the <strong>Council</strong> accepts a guarantee, all costs forthe preparation of the guarantee documents will be metby the applicant.3.5 Powers of the <strong>Council</strong> if developmentcontributions are not paidUntil a development contribution required in relation to adevelopment has been paid, the following will apply.DevelopmentTypeSubdivisionBuildingServiceconnectionOtherConsequence of Non-PaymentWithhold a certificate under section224(c) of the RMAWithhold a Code ComplianceCertificate under section 95 of theBuilding Act 2004Withhold a service connectionto the developmentPrevent the commencement of aresource consent under the RMA<strong>Council</strong> will also register the outstanding developmentcontribution as a charge on the subject land under theStatutory Land Charges Registration Act 1928.
hutt city <strong>community</strong> <strong>plan</strong> 2653.6 Remission and postponementThe <strong>Council</strong> will not consider any request to postpone paymentof a development contribution, except where a guarantee hasbeen agreed (refer 3.4).The <strong>Council</strong> may remit a development contribution at itscomplete discretion. The <strong>Council</strong> will only consider exercisingits discretion in exceptional circumstances. Applications madeunder this part will be considered on their own merits and anyprevious decisions of the <strong>Council</strong> will not be regarded asbinding precedent.Any request for remission must be made in writing and set outthe reasons for the request. The request must be made:ÎÎwithin 15 working days after <strong>Council</strong> has advised theapplicant in writing of the development contributionpayable; andÎÎbefore the development contribution payment is madeto <strong>Council</strong>.The <strong>Council</strong> will not allow retrospective remissions ofdevelopment contributions.Applications for remissions will be heard by the <strong>Council</strong>’sOperations and Compliance Committee, or other committeeas delegated by <strong>Council</strong>. Applicants will be given at least 10working days notice of the date, time and place of the hearing.When considering a request for remission, the matters takeninto account will include:ÎÎThe purpose of the development contributions policy,<strong>Council</strong>’s financial modelling, and <strong>Council</strong>’s funding andfinancial policies.ÎÎThe extent to which the value and nature of the worksproposed by the applicant reduces the need for worksproposed by <strong>Council</strong> in it capital works programme.ÎÎWhether the development contribution payable under thispolicy is manifestly excessive in relation to the impact ofthe development on the demand for infrastructure.ÎÎAny other matter(s) that the <strong>Council</strong> considers relevant.3.7 RefundsRefunds of development contributions paid to the <strong>Council</strong>will be made where:ÎÎResources consents lapse or are surrendered.ÎÎBuilding consents lapse.ÎÎThe development or building does not proceed.ÎÎThe <strong>Council</strong> does not spend the money on the purposefor which the development contribution was required.ÎÎPrevious overpayment has been made (for whatever reason).The development contribution will be refunded to the consentholder or his or her personal representative or successor(less a fair and reasonable administration fee).4 DefinitionsIn this policy:Actual increased demand means the demand created bythe most intensive non residential use(s) likely to becomeestablished in the development within 10 years from thedate of the application.Allotment has the meaning given to it in section 218(2) ofthe Resource Management Act 1991, and 'lot' has thesame meaning.Community facilities mean reserves, network infrastructure or<strong>community</strong> infrastructure for which development contributionsmay be required in accordance with section 199 of the LGA.Community infrastructure means:ÎÎland, or development assets on land, owned or controlledby the <strong>Council</strong> to provide public amenities; andÎÎincludes land that the <strong>Council</strong> will acquire for that purpose.Development means:ÎÎany subdivision or other development that generatesa demand for network infrastructure or <strong>community</strong>infrastructure; butÎÎdoes not include the pipes or lines of a network utility operator.Equivalent household unit (EHU) is a type of “unit ofdemand” used by the <strong>Council</strong>. One EHU equates to the typicaldemand for infrastructure generated by an average household.Gross floor area (GFA) is the sum of all gross floor areas of allfloors of a building or buildings on an allotment, or a proposedallotment, measured from the exterior faces of exterior walls, orfrom the centre-lines of walls separating two buildings.Household unit means a home or residence that is a selfcontainedunit includes kitchen and bathroom facilities ofany nature and is physically separated, or capable of beingseparated, from any other household unit.Network infrastructure means the provision of roads andother transport, water, wastewater, and stormwater collectionand management assets.Network utility operator has the meaning given to it bysection 166 of the Resource Management Act 1991.Non residential development means any developmentthat falls outside the definition of residential developmentin this policy.
266Residential development means the development of landand buildings for any domestic/living purposes for use bypeople living on the land or in the buildings.Service connection means a physical connection to aservice provided by, or on behalf of, the <strong>Council</strong>.PART 3: THE SUBSTANTIVE POLICY5 IntroductionThis Part of the policy outlines how the development contributionspayable under this policy have been de<strong>term</strong>ined. It includesdescriptions of:ÎÎThe process followed by <strong>Council</strong> to make the decisionto use development contributions to fund growth relatedcapital expenditure and an assessment of the extentto which growth costs should be funded throughdevelopment contributions.ÎÎThe methodology used for de<strong>term</strong>ining the developmentcontributions payable under this policy.ÎÎKey assumptions used when de<strong>term</strong>ining the developmentcontributions payable under this policy in the calculations.ÎÎSummary details of the relevant capital expenditure figuresand calculations used in de<strong>term</strong>ining the developmentcontributions payable under this policy.This section is mainly of interest to people who want to knowthe details of how the policy was developed and how thedevelopment contributions payable were calculated.Readers should refer to Part 2 of this policy if they wish to knowhow to calculate the development contributions payable for aspecific development.6 How development contributions are calculatedThis section outlines the methodology used for de<strong>term</strong>iningthe development contributions payable for each infrastructuregroup. It also outlines some of key factors considered acrossall of the groups. The application of this methodology to eachinfrastructure group is covered in sections 8-12.A summary of the steps applied in the methodology is providedbelow. A brief ex<strong>plan</strong>ation of what is involved in at each step isdescribed below in sections 6.1-6.7.Step 1Step 2Step 3Step 4Step 5Step 6Step 7Define catchmentIdentify growth related capital expenditureIdentify % of growth costs to be funded bydevelopment contributionsIdentify units of demandIdentify design capacity provided for growthAllocate costs to units of demandPrepare schedule of fees6.1 Define catchment (Step 1)A catchment is the area serviced by particular infrastructure.Catchments are defined with reference to characteristics ofthe service, the common benefits received across thegeographical area supplied, and judgments involving abalance between administrative efficiency and the extentof common benefits.The <strong>Council</strong> uses a single catchment (the entire city) for allactivities in this development contributions policy. Thisapproach has been adopted because:ÎÎmost of the capital works <strong>plan</strong>ned over the next 10 years arespread around the city and therefore have city wide benefits;ÎÎthere are no projects of a sufficiently large nature to warranta separate catchment approach; andÎÎthere is no single area within the city where growth isexpected to concentrate.6.2 Identify growth related capitalexpenditure (Step 2)The purpose of this step is to identify the total <strong>plan</strong>ned costs ofcapital expenditure for network and <strong>community</strong> infrastructureresulting from growth. These costs are identified in the<strong>Council</strong>’s <strong>Long</strong> Term <strong>Council</strong> Community Plan, and in thecase of historical costs, from previous years’ accounts.Growth costs (including capacity increases to cater for growth)can be funded in full or in part through developmentcontributions. Generally, growth costs do not include costsassociated with service level improvements and renewals thatserve existing households. However, a proportion of thesecosts may be included where capacity for growth is provided
hutt city <strong>community</strong> <strong>plan</strong> 267for as part of a service level improvement or renewal (forexample, where extra capacity to accommodate growth isprovided as part of a stormwater renewal project).Many projects, typically larger projects, are identifiedspecifically as part of this process and an assessmentis made of the extent to which the project caters for growth.In addition to these projects, many other capital works cater tosome extent for growth, but are smaller, numerous, and oftenundertaken as a minor part of other works, such as renewal orservice level improvements. Undertaking a detailed assessmentof every one of these projects would be costly (relative to thesize of the projects), time consuming, and extremely difficult,and offer little in <strong>term</strong>s of robustness over a simpler approach.Consequently, in all infrastructure groups, an assumption aboutthe extent to which projects collectively accommodate growth hasbeen made. The proportion attributed to growth is related tothe extent of growth expected over the 10 year period of theLTCCP (generally around 6%). This approach is only applied tocapital works that have a growth component. Capital works thatclearly do not bear any relation to growth have been excludedfrom this process.6.3 Identify the percentage of growth coststo be funded by development contributions(Step 3)The previous step (Step 2) de<strong>term</strong>ines the maximum amountthat <strong>Council</strong> can seek if the full extent of growth costs wererecovered through development contributions. However, foreach infrastructure group, <strong>Council</strong> must consider a range ofmatters before de<strong>term</strong>ining whether to recover any or all growthcosts, or only a portion, through development contributions.This is undertaken in Step 3.The matters considered when making this assessment are:ÎÎThe <strong>community</strong> outcomes to which the infrastructureprimarily contributesÎÎThe distribution of benefits between the <strong>community</strong>as a whole, and any identifiable parts of the <strong>community</strong>,and individualsÎÎThe period in or over which the benefits are expected tooccurÎÎThe extent to which the actions or inaction of particularindividuals or a group contributeto the need to undertake the activityÎÎThe costs and benefits, including consequences fortransparency and accountability,of funding the activity distinctly from other activities.These assessments can be found in the each of theinfrastructure sections (sections 8-12).The <strong>Council</strong> has also considered the overall impact of anyallocation of liability for revenue needs on the current and futuresocial, economic, environmental, and cultural wellbeing of the<strong>community</strong>, as required by section 101(3)(b)) of the LGA.<strong>Council</strong> considers that allocating the full cost of growth todevelopment is fairer to existing ratepayers, and helps ensureeconomic efficiency. By not imposing the burden of growth costson existing ratepayers, rates income is also able to be used toadvance <strong>Council</strong>’s other activities. These activities contribute ina wide rage of ways to improving the current and future social,economic, environmental, and cultural wellbeing of the<strong>community</strong>.In addition, the development contributions charges within thispolicy are not overly onerous or out of step with those requiredin other cities or districts. They are, therefore, not expected todivert private sector investment from <strong>Hutt</strong> <strong>City</strong> on anysignificant scale.As a result of these assessments, <strong>Council</strong> has de<strong>term</strong>ined foreach infrastructure group that 100% of the growth costsidentified in Step 2 should be met by developmentcontributions.6.4 Identify units of demand (Step 4)The unit of demand used in this policy is the equivalenthousehold unit (EHU). This representsthe demand on infrastructure resulting from one typicalhousehold. For green field developments, one EHU will beapplied uniformly to all residential allotments regardless of sizefor reasons of administrative efficiency and because lot size isnot considered to have a material impact on demand. For aninfill development, one EHU applies to a residential dwelling asdefined in the District Plan.For non-residential developments, the level of demand for thattype of development has been de<strong>term</strong>ined and converted to anequivalent household unit. The resulting EHU schedule applies.
268InfrastructureGroupRoading and trafficWater supplyWastewaterStormwaterLocal urbanenvironmentResidential1 EHU per unit orallotmentNon ResidentialRetail: 1 EHU per 20m 2 GFACommercial: 1 EHU per 50m 2 GFAIndustrial: 1 EHU per 85m 2 GFA1 EHU per 265m 2 GFA1 EHU per 275m 2 GFA1 EHU per 200m 2 impervious areaRetail: 1 EHU per 75m 2 GFACommercial: 1 EHU per 150m 2 GFAIndustrial: 1 EHU per 800 m 2 GFAIn de<strong>term</strong>ining the above schedule, the usage measures below were used to assess demandequivalence for each infrastructure type. These measures are de<strong>term</strong>ined as part of theassessment for each infrastructure type.Infrastructure TypeRoading and trafficUsage Measure per EHU10 vehicle movements per day6.5 Identify design capacity provided for growth (Step 5)The design capacity varies considerably between different types of infrastructure. Larger projectsare identified specifically as part of this process and a specific assessment is made of designcapacity to be applied in this policy. In some cases, it is economically prudent to provide sparegrowth capacity considerably beyond current 10-year expectations of growth, as is the case withthe wastewater treatment <strong>plan</strong>t. Costs are recovered across the full design number of EHUs.Projected growth in EHUs over the 10 year period of the LTCCP will be relevant to the <strong>Council</strong>'sbudgeting of revenue, but not the calculation of the development contribution per EHU (i.e. thefull cost of infrastructure designed to cater for growth over and above that expected in the 10 yearperiod will not be recovered within the 10 year period).As noted earlier, other projects are smaller and widespread and while catering for growth withinthe 10 year period of the LTCCP, do not warrant a project by project assessment of designcapacity. Where such infrastructure has been included, the design capacity component related togrowth is assumed to approximately meet growth demands over the 10 year period. Consequently,the design capacity will be equal to the growth expected in the 10 year period.6.6 Allocate costs to units of demand (Step 6)The development contribution charge per EHU is calculated by dividing the total growth relatedcapital expenditure to be recovered by development contributions (Steps 2 and 3) by thedesigned units of demand for growth (Step 5).Water supplyWastewaterStormwaterLocal urban environment730 litres per day675 litres per day200 m 2 of impervious surface1 hour per day6.7 Prepare schedule of fees (Step 7)A detailed schedule has been prepared to enable the development contribution to be calculated byinfrastructure type (below). This puts together the different development contributions payable perEHU for each infrastructure type calculated in Step 6. All fees in the schedule are GST exclusive.
hutt city <strong>community</strong> <strong>plan</strong> 269AssetsDevelopmentcontribution per EHURoading and traffic $276Water supply $113Wastewater $2,087Stormwater $348Local urban environment $136Total $2,9607 Key assumptionsSeveral key assumptions have been made when makingthe assessments under the methodology described above.Some of the assumptions apply across all infrastructure types,while others are specific to certain types of infrastructure.The assumptions that apply across all infrastructure types aredetailed below, while the infrastructure specific assumptionsare listed in the infrastructure sections (8-12).7.1 Growth impact on minor worksIn addition to the larger specific projects identified as explicitlygrowth related, most infrastructure areas undertake a largenumber of smaller improvement, upgrade and renewal worksthat also increase infrastructure capacity and take account ofthe impact on infrastructure of continuing growth within the cityover the next 10 years.Where minor projects have been identified as partially growthrelated, a fixed proportion of the total cost is attributed togrowth. Applying an assumed rate has been adopted becauseundertaking a more detailed assessment of every projectwould be time consuming, extremely difficult, and offer little in<strong>term</strong>s of improved robustness. The proportion that applies toeach infrastructure group is noted in the sections for eachinfrastructure groups (sections 8-12) and is based on expectedEHU growth in that infrastructure area over 2009-2019 (see<strong>Hutt</strong> <strong>City</strong> growth estimate below). It is generally around 6%.7.2 Application of costing methodsAverage costs have generally been applied to the allocationof capital expenditure between existing and growth EHUs.Average costs reflect a fair allocation of capital infrastructurecosts to newcomers. Additionally, in most cases, it is a difficultand complex exercise to de<strong>term</strong>ine incremental/marginal costs.7.3 Cost of individual items of capital expenditureThe <strong>Council</strong> has used the best information available at the timeof developing this policy to estimate the cost of individual itemsof capital expenditure that will be funded in whole or part out ofdevelopment contributions. These reflect the estimates withinthe LTCCP and a reasonable estimate of the costs in the future,including inflation.It is likely, however, that actual costs will differ from theseprojections due to factors beyond the <strong>Council</strong>'s control, suchas changes in the price of raw materials, labour, etc, and thetime the works are undertaken. The <strong>Council</strong> will review itsestimates of capital expenditure regularly and adjust theLTCCP as appropriate, including this policy.7.4 Financial assumptionsThe following financial assumptions have been applied:ÎÎInterest has been applied to the calculations at a rate of10%. The development contribution fees payable have beenadjusted accordingly. For projects in the future, a discountis provided to reflect interest gained on the sums paid early.For infrastructure projects in which additional capacity hasalready been provided in anticipation of growth, additionalcosts are included to reflect interest charges.ÎÎIncome generated from rates will be sufficient to meet theoperating costs of growth related capital expenditure intothe future.ÎÎAll NZ Transport Agency subsidies will continue at presentlevels and that eligibility criteria will remain unchanged.ÎÎThe methods of service delivery will remain substantiallyunchanged.7.5 <strong>Hutt</strong> <strong>City</strong> growthResidential<strong>City</strong> growth assumptions are a key influence on the <strong>Council</strong>’sasset management <strong>plan</strong>s and capital expenditure budgets inthe LTCCP for the period 2009 – 2019. These population andhousehold growth assumptions are informed by forecastsbased on Greater Wellington Regional <strong>Council</strong>’s WellingtonTransport Strategy Model projections for population anddwellings. These are based on Statistics New Zealand censusforecasts for the periods 2006 to 2026. 3 Population estimatesfor 2011, 2016, and 2021 are provided by the modelling. Fromthese forecasts, population estimates for 2009 and 2019 are alsomade by assuming even growth between periods modelled.3. These figures undercount the population slightly. This is taken intoaccount in forecasts also. Consequently, growth forecasts are notmaterially affected.
270Est 2009 Est 2019Est growth2009-2019Population 99,167 100,906 1,739Households 36,134 38,381 2,247These projections indicate that residential growth over the period 2009 - 2019 will be 2,247households, or 8.65% growth.Non ResidentialNon-residential growth is estimated in square metres of development and is broken downbetween industrial, commercial and retail segments. These estimates are based on previousyears’ growth and the medium <strong>term</strong> economic outlook.Est 2009 m 2 Est 2019 m 2 2009-2019 m 2Est growthRetail 251,000 276,000 25,000Commercial 147,000 157,000 10,000Industrial 1,719,000 1,784,000 65,000Total 2,117,000 2,217,000 100,000Total EHU growthApplying the non-residential growth estimates to the non-residential EHU conversions factors(See 6.4), yields a non-residential growth estimate in EHUs for each infrastructure group. Addingthis to the residential growth estimates provides the following expected EHU growth for eachinfrastructure group.AssetsResidentialEHUgrowthNonresidentialEHUgrowthTotalEHUgrowthTotalEHU %growthRoading and traffic 2,247 2,215 4,462 6.2%Water supply 2,247 375 2,622 6.0%Wastewater 2,247 363 2,610 6.0%Stormwater 2,247 250 2,497 6.0%Local urbanenvironment 2,247 491 2,738 6.4%8 Roading and Traffic8.1 IntroductionThe traffic and roading network comprises the city’s main arterial routes and secondary roads,including bridges, walls and embankments, footpaths, walkways and cycleways, parking, andpublic transport access and shelters.Development growth increases traffic volumes and congestion which adversely impacts on trafficflows, safety, and wear and tear on road surfaces. To maintain the traffic flows, safety and servicelevels, additional capital works are required across the networks on an ongoing basis. Theseworks typically comprise many small projects right across the city over a 10 year period. Mostsuch works are <strong>plan</strong>ned to approximately match expected growth over the 10 year period toensure cost effective use of <strong>Council</strong>’s resources and assets.In addition to these many minor works, <strong>Council</strong> has also two major projects <strong>plan</strong>ned which willhelp to cater for growth:ÎÎMelling/SH2 Interchange – works associated with the Melling/SH2 Interchange upgrade toimprove access to the city centre from State Highway 2.ÎÎMajor network movements – works intended to improve the roading capacity and speed ofmovements from the east side to the west side of the valley floor.
hutt city <strong>community</strong> <strong>plan</strong> 2718.2 Define catchment (Step 1)Roading networks are typically available to, and used by,everyone in the <strong>community</strong>. Additionally, there are no significantworks identified in the LTCCP that either:ÎÎhave benefits that mainly accrue to any particular areas inthe city; orÎÎare needed largely as a result of growth in any particularareas within the city.Consequently, a single catchment is used for roading and traffic.8.3 Identify growth related capitalexpenditure (Step 2)It is estimated that approximately 6.2% of minor ongoingimprovements relates to the extra capacity needed toaccommodate growth over the next 10 years. On an averagecost allocation basis, 6.2% of the total capital expenditureis therefore attributable to growth.A more detailed assessment has been undertaken for the worksassociated with NZTA’s Melling/SH2 Interchange upgrade andthe major network improvement. 66% of the capacity provided bythe Melling/SH2 upgrade, and 34% of the capacity of the majornetwork improvement is estimated to cater for growth from 2009.Consequently, 66% of the HCC’s contribution towards the totalcost of the Melling/SH2 upgrade and 34% of the major networkimprovements have been attributed to growth respectively.However, only 10.3% of HCC’s contribution towards the Melling/SH2 upgrade, and 4.1% of the cost of the major networkimprovement, relates to growth over the period 2009-2019.The total 10 year cost of growth for transport is estimated to be$1.86 million. The present value (in 2009/2010) of these costsis $1.23 million.8.4 Identify the percentage of growth coststo be funded by development contributions(103(b) Assessment) (Step 3)100% of the growth costs related to roading and traffic identifiedin Step 2 are to be recovered from development contributions.In making this de<strong>term</strong>ination, the following factors wereconsidered by <strong>Council</strong>:The <strong>community</strong> outcomes to which the infrastructureprimarily contributesThe relevant <strong>community</strong> outcomes for roading and trafficare listed from page 32 of the LTCCP. They describe a citywhere all modes are supported, a high level of service isoffered and maintained, and investment is made to ensuregrowth is catered for. This growth is much better able to beaccommodated if additional funding through developmentcontribution is possible, rather than levelling all cost onexisting ratepayers.The distribution of benefits between the <strong>community</strong>as a whole, and any identifiable parts of the <strong>community</strong>,and individualsThe distribution of benefits between existing householdsand newcomers generally was taken into account at the timethe growth component of capital expenditure was de<strong>term</strong>inedin Step 2.<strong>Hutt</strong> <strong>City</strong> <strong>Council</strong> does not consider that it is practical orappropriate to target the development contributions acrossdifferent catchments as discussed in Step 1.The period in or over which the benefits are expectedto occurRoading and traffic infrastructure typically offers benefits overseveral years, and in many cases, decades. For this reason,capital investment in such assets is typically funded throughborrowing and paying off the debt over a long period of time.This allows infrastructure to proceed that otherwise may not,and helps ensure intergenerational equity.However, applying this model to growth related costs meansthat those growth costs are borne by everyone else in the<strong>community</strong>. Consequently, the advantages offered by payingfor assets over time through borrowing, need to be weighedagainst the advantages of charging for growth cost up front,particularly equity (for other ratepayers) and economic efficiency.On balance, <strong>Council</strong> considers that the greater good isachieved in this case by growth costs being borne bythose that create the costs, up front through developmentcontributions, rather than through borrowing.The extent to which the actions or inaction of particularindividuals or a group contribute to the need to undertakethe activityThere are no significant works identified in the LTCCP thatare needed largely as a result of growth in any particular areawithin the city. Consequently, no particular individual or groupscontribute to the demand for the roading assets <strong>plan</strong>ned tosuch an extent that they can be singled out.Financial contributions are required where individual developmentsgive rise to capital expenditure that is not included in the LTCCP,and therefore that expenditure is not included in <strong>Council</strong>’sdevelopment contribution policy. In these cases, <strong>Council</strong> can
272usually identify the individual or group involved and may impose a financial contribution as acondition of resource consent.The costs and benefits, including consequences for transparency and accountability, offunding the activity distinctly from other activities.<strong>Council</strong> considers that greater transparency and economic efficiency is achieved by ensuringthat costs associated with growth are explicitly identified, and met by growth, rather than by the<strong>community</strong> through rates, and growth facing less than 100% of the costs it causes.8.5 Identify units of demand (Step 4)The unit of demand used in this policy is the equivalent household unit (EHU). For transport, thisrepresents the demand on roading and traffic infrastructure assumed to result from to 10 vehiclemovements per day. For non-residential developments, the following conversion rates will apply:2ÎÎRetail: 1 EHU per 20 m GFA2ÎÎCommercial: 1 EHU per 50 m GFA2ÎÎIndustrial: 1 EHU per 85 m GFAThese demand estimates were de<strong>term</strong>ined from data from the New Zealand Trips and ParkingDatabase Bureau.8.6 Identify design capacity provided for growth (Step 5)The major network movements improvements have a total capacity of around 38,000 vehiclesper day. This translates to around 109,208 EHUs capacity; assuming 3.5% of total trips in thecity will run through the improvements. It is assumed that two thirds of the capacity of theimprovements will cater for existing demand and addressing backlog (around 25,000 vehiclesper day), leaving 34% of the capacity to cater for growth. 4.1% of the total capacity (4,462 EHUs)is estimated to cater for growth over the next 10 years.8.7 Allocate costs to units of demand (Steps 6 and 7)Fees are charged as follows:Anticipated costsGrowthrelated capitalexpenditure(present value)Design EHUs(10 years 09-19) Fee per EHUMinor capital works $454,182 4,462 $102Melling/SH2Interchange upgrade $312,871 4,462 $70Major networkmovements $464,316 4,462 $104Total $276As noted earlier the programme of minor improvement works and the Wainuiomata Hill Rd SharedPath are assumed to approximately meet demand within the 10 year period. Consequently, thedesign capacity is estimated to be the growth expected in the 10 year period, 4,462 EHUs (refersection 7.5).The SH2/Melling Interchange has a total capacity of around 18,000 vehicles per day. Thistranslates to around 43,000 EHUs capacity; assuming 4% of total trips in the city will run overthe Interchange. It is assumed that a third of the capacity of the upgraded Interchange willaddress backlog, leaving 66% of the capacity to cater for growth. 10.3% of the total capacity(4,462 EHUs) is estimated to cater for growth over the next 10 years.
hutt city <strong>community</strong> <strong>plan</strong> 2739 Water Supply9.1 IntroductionThe water supply network comprises the city’s 24 reservoirs,690km of pipes, 13 pumping stations, 37,708 service connections,4,315 fire hydrants and 113 water meters. Growth increasesdemand on the water supply and consequently on the demandsof the whole water supply network.The capital expenditure <strong>plan</strong>ned in the 2009-2019 LTCCPcomprises an ongoing programme of upgrading pipe capacityand reservoir and water main upgrades. These upgrades aremainly undertaken to replace existing undersized or faultyinfrastructure, with additional capacity installed at that timeto accommodate growth. Consequently, only a portion ofsuch costs are attributable to growth.9.2 Define catchment (Step 1)Within the city or catchment areas, there are no significantworks identified in the LTCCP that have benefits that mainlyaccrue to any separately identifiable part of the <strong>community</strong>or to particular individuals. Therefore it is not considerednecessary to divide the city into particular ‘catchments’.The total capital expenditure cost of growth expected for watersupply over the period 2009/2010 – 2018/2019 is estimated tobe approximately $475,452. The present value (in 2009/2010)of these future costs is estimated to be $296,077.9.4 Identify the percentage of growth coststo be funded by development contributions(103(b) Assessment) (Step 3)100% of the growth costs related to stormwater identified inStep 2 are to be recovered from development contributions.In making this de<strong>term</strong>ination, the following factors wereconsidered by <strong>Council</strong>:The <strong>community</strong> outcomes to which the infrastructureprimarily contributesThe relevant <strong>community</strong> outcomes for water supply are listedfrom page 32 of the LTCCP. They describe a city where ahigh level of service is offered and maintained, and continualupgrading and investment is made to ensure growth is cateredfor. This growth is much better able to be accommodatedif additional funding through development contribution ispossible, rather than levelling all costs on existing ratepayers.<strong>Hutt</strong> <strong>City</strong> <strong>Council</strong> does not consider that it is practical orappropriate to target the development contributions acrossdifferent catchments as discussed in Step 1.The period in or over which the benefits are expectedto occurWater supply infrastructure typically offers benefits over severalyears, and in many cases, decades. For this reason, capitalinvestment in such assets is typically funded through borrowingand paying off the debt over a long period of time. This allowsinfrastructure to proceed that otherwise may not, and helpsensure intergenerational equity.However, applying this model to growth related costs meansthat those growth costs are borne by everyone else in the<strong>community</strong>. Consequently, the advantages offered by paying forassets over time through borrowing, need to be weighed againstthe advantages of charging for growth cost up front, particularlyequity (for other ratepayers) and economic efficiency.On balance, <strong>Council</strong> considers that the greater good is achievedin this case by growth costs being borne by those that create thecosts, up front through development contributions, rather thanthrough borrowing.9.3 Identify growth related capitalexpenditure (Step 2)It is estimated that on average, approximately 6% of water supplyworks relate to the extra capacity needed to accommodate theexpected growth over the next 10 years. The balance, 94%, isattributed to renewal and/or increases in capacity to improve‘fire load’ capacity for the purposes of legislative compliance.The distribution of benefits between the <strong>community</strong>as a whole, and any identifiable parts of the <strong>community</strong>,and individualsThe distribution of benefits between existing householdsand newcomers generally was taken into account at the timethe growth component of capital expenditure was de<strong>term</strong>inedin Step 2.The extent to which the actions or inaction of particularindividuals or a group contribute to the need to undertakethe activityThere are no significant works identified in the LTCCP that areneeded largely as a result of growth in any particular areaswithin the city. Consequently, no particular individual or groupscontribute to the demand for the water supply assets <strong>plan</strong>nedto such an extent that they can be singled out. Financial
274contributions are required where individual developmentsgive rise to capital expenditure that is not included in theLTCCP, and therefore that expenditure is not included in<strong>Council</strong>’s development contribution policy. In these cases,<strong>Council</strong> can usually identify the individual or group involvedand may impose a financial contribution as a condition ofresource consent.The costs and benefits, including consequences fortransparency and accountability, of funding the activitydistinctly from other activities.<strong>Council</strong> considers that greater transparency and economicefficiency is achieved by ensuring that costs associatedwith growth are explicitly identified, and met by growth,rather than by the <strong>community</strong> through rates, and growthfacing less than 100% of the costs it causes.9.5 Identify units of demand (Step 4)The unit of demand used in this policy is the equivalenthousehold unit (EHU). For water supply, 1 EHU represents thedemand on water supply infrastructure assumed to result from730 litres being drawn per day. This results in an estimated9,490,168m 3 of water being supplied to 35,600 occupiedhouses within Lower <strong>Hutt</strong> per year.The metered water supplied to commercial, industrial and retailpremises in Lower <strong>Hutt</strong> is 2,117,837m 3 per year. The totalnon-residential ground floor area for 2008 has been estimatedto be 2,117,000m 2 , suggesting water consumption of 2.7 litresper day per m 2 . This translates to a non-residential conversionrate of 1 EHU per 265m 2 GFA.9.6 Identify design capacity provided forgrowth (Step 5)As noted earlier the programme of minor works are assumedto approximately meet demand within the 10 year period.Consequently, the design capacity is estimated to be thegrowth expected in the 10 year period, 2,622 EHUs (refersection 7.5).9.7 Allocate costs to units of demand(Steps 6 and 7)Fees are charged as follows:Growthrelatedcapitalexpenditure(presentvalue)DesignEHUsFee perEHUGeneralcapital works $296,077 2,622 $113Total $11310 Stormwater10.1 IntroductionFlooding is an important issue within <strong>Hutt</strong> <strong>City</strong> as the city issituated on a flood plain, and much of the surrounding area isalso prone to flood related issues such as slope stability andlocalised flooding. The <strong>City</strong>’s stormwater network helps dealwith stormwater and periods of heavy rain by shifting the wateroff and away from the surface, so that in most cases, floodingis avoided.The stormwater network system comprises 528km of pipes,24km of channels and canals, 13 pump stations, 5 retentiondams, 11,224 manholes, 1,736 inlets and approximately1,802 inspection points and nodes.The development of vacant land generally leads to increasedlevels of impermeable structures and services such asbuildings and pavement. Consequently, development growthincreases the amount of surface water that needs to be shifted,raising the risk of flooding and increasing the demands on thestormwater network. Therefore it is imperative that the capacityof the stormwater network is maintained and current and futuredemands are provided for to ensure that the integrity of thenetwork can be maintained.The capital expenditure <strong>plan</strong>ned in the 2009-2019 LTCCPcomprises an ongoing programme of upgrading pipe capacityand installing and upgrading pump stations, flood protectionworks and the remediation of the Waiwhetu Stream. These pipeupgrades are mainly undertaken to reduce the flood risk fromexisting development, with additional capacity installed at thattime to accommodate growth. Consequently, only a portion ofsuch costs are attributable to growth.
hutt city <strong>community</strong> <strong>plan</strong> 27510.2 Define catchment (Step 1)Within the city or catchment areas, there are no significantworks identified in the LTCCP that have benefits that mainlyaccrue to any separately identifiable part of the <strong>community</strong>or to particular individuals. Therefore it is not considerednecessary to divide the city into particular ‘catchments’.10.3 Identify growth related capitalexpenditure (Step 2)It is estimated that on average, approximately 6% of capacityin stormwater works relates to the extra capacity needed toaccommodate expected growth over the next 10 years. Thebalance, 94%, is attributed to renewal and/or increases incapacity to reduce existing flooding risks. On an averagecost allocation basis, 6% of the total capital expenditure,is therefore, attributed to growth.The total capital expenditure cost of growth expected forstormwater over the period 2009/2010 – 2018/2019 is estimatedto be $1,160,302. The present value (in 2009/2010) of thesefuture costs is $869,597.10.4 Identify the percentage of growth coststo be funded by development contributions(103(b) Assessment) (Step 3)100% of the growth costs related to stormwater identified inStep 2 are to be recovered from development contributions.In making this de<strong>term</strong>ination, the following factors wereconsidered by <strong>Council</strong>:The <strong>community</strong> outcomes to which the infrastructureprimarily contributesThe relevant <strong>community</strong> outcomes for stormwater are listedfrom page 32 of the LTCCP. They describe a city where ahigh level of service is offered and maintained, and continualupgrading and investment is made to ensure growth is cateredfor. This growth is much better able to be accommodated ifadditional funding through development contribution ispossible, rather than levelling all costs on existing ratepayers.The distribution of benefits between the <strong>community</strong>as a whole, and any identifiable parts of the <strong>community</strong>,and individualsWhile the benefits of stormwater works may be limited to a veryspecific area, the area contributing to the need to undertakethe works can be much larger. For example, increased floodingon the valley floor can result from development growth somedistance away, on the hills. In many cases, there may be nodirect benefit to a particular area of development of thestormwater works undertaken, but the works are needed toensure flooding risk is not increased elsewhere.For this reason, <strong>Council</strong>s consider that it is inappropriateand unfair to reduce the stormwater costs caused by growthbecause it benefits an identifiable part of the <strong>community</strong>(by mitigating the increased risk of flooding).The period in or over which the benefits are expectedto occurStormwater infrastructure typically offers benefits over severalyears, and in many cases, decades. For this reason, capitalinvestment in such assets is typically funded through borrowingand paying off the debt over a long period of time. This allowsinfrastructure to proceed that otherwise may not, and helpsensure intergenerational equity.However, applying this model to growth related costsmeans that those growth costs are borne by everyone elsein the <strong>community</strong>. Consequently, the advantages offered bypaying for assets over time through borrowing, need to beweighed against the advantages of charging for growthcost up front, particularly equity (for other ratepayers) andeconomic efficiency.On balance, <strong>Council</strong> considers that the greater good is achievedin this case by growth costs being borne by those that create thecosts, up front through development contributions, rather thanthrough borrowing.The extent to which the actions or inaction of particularindividuals or a group contribute to the need to undertakethe activityWithin the catchments or city, <strong>Council</strong> is not aware of particularindividuals or group that contribute to the demand for thestormwater assets <strong>plan</strong>ned to such an extent that they canbe singled out.
276Financial contributions are required where individualdevelopments give rise to capital expenditure that is notincluded in the LTCCP, and therefore that expenditure is notincluded in <strong>Council</strong>’s development contribution policy. In thesecases, <strong>Council</strong> can usually identify the individual or groupinvolved and may impose a financial contribution as acondition of resource consent.The costs and benefits, including consequences fortransparency and accountability, of funding the activitydistinctly from other activities<strong>Council</strong> considers that greater transparency and economicefficiency is achieved by ensuring that costs associated withgrowth are explicitly identified, and met by growth, rather thanby the <strong>community</strong> through rates, and growth facing less than100% of the costs it causes.10.5 Identify units of demand (Step 4)The unit of demand used in this policy is the equivalenthousehold unit (EHU). For stormwater, 1 EHU represents thedemand on stormwater infrastructure assumed to result from200 m 2 of impervious surface area. The conversion rate thatapplies to non-residential developments (retail, commercialand industrial) is 1 EHU per 200 m 2 impervious surface area.10.6 Identify design capacity provided forgrowth (Step 5)As noted earlier the programme of minor works are assumedto approximately meet demand within the 10 year period.Consequently, the design capacity is estimated to be thegrowth expected in the 10 year period, 2,497 EHUs (refersection 7.5).10.7 Allocate costs to units of demand(Steps 6 and 7)Fees are charged as follows:Anticipated costsGrowthrelatedcapitalexpenditure(presentvalue)DesignEHUsFee perEHUGeneralcapitalworks $869,597 2,497 $348Total $34811 Wastewater11.1 IntroductionThe wastewater supply network comprises the city’s 672km ofpipes 24 pumping stations, 507 inspection points and 13,303manholes and other nodes. Development increases demandon the water supply and consequently places extra demandson the wastewater network system.The capital expenditure <strong>plan</strong>ned in the 2009-2019 LTCCP forthe wastewater network comprises an ongoing programmeof upgrading the pipe network, ongoing system maintenanceand resource consent renewals for the local and trunkwastewater systems. However, no projects involve an increasein the capacity of the network to accommodate growth. TheSeaview wastewater treatment <strong>plan</strong>t completed in 2002 is theonly infrastructure recognised in the development contributionpolicy for wastewater. It was built with additional capacity toaccommodate future growth.11.2 Define catchment (Step 1)Within the city, there are no significant works identified inthe LTCCP (or undertaken previously) that have benefitsthat mainly accrue to any separately identifiable part ofthe <strong>community</strong> or to particular individuals. Therefore itis not considered necessary to divide the city intoparticular ‘catchments’.
hutt city <strong>community</strong> <strong>plan</strong> 27711.3 Identify growth related capitalexpenditure (Step 2)The wastewater treatment <strong>plan</strong>t was built with 10% additionalcapacity to accommodate growth for Lower <strong>Hutt</strong>. Approximately65% of the <strong>Hutt</strong> <strong>City</strong>’s share of the wastewater treatment <strong>plan</strong>t’sspare capacity is expected to be taken up by growth over the10 years 2009-2019.Total historical cost incurred for the additional capacity at thewastewater treatment <strong>plan</strong>t is $4.5 million. The present value (in2009/2010) of this cost is approximately $8.33 million. However,the present value of the 10 year growth cost is only $5.45m.11.4 Identify the percentage of growth coststo be funded by development contributions(103(b) Assessment) (Step 3)100% of the growth costs related to wastewater identified inStep 2 are to be recovered from development contributions.In making this de<strong>term</strong>ination, the following factors wereconsidered by <strong>Council</strong>:The <strong>community</strong> outcomes to which the infrastructureprimarily contributesThe relevant <strong>community</strong> outcomes for wastewater are listedfrom page 32 of the LTCCP. They describe a city where a highlevel of service is offered and maintained, and continualupgrading and investment is made to ensure growth is cateredfor. This growth is much better able to be accommodated ifadditional funding through development contribution ispossible, rather than levelling all costs on existing ratepayers.The distribution of benefits between the <strong>community</strong>as a whole, and any identifiable parts of the <strong>community</strong>,and individualsThe distribution of benefits between existing households andnewcomers generally was taken into account at the time thegrowth component of capital expenditure was de<strong>term</strong>inedin Step 2.<strong>Hutt</strong> <strong>City</strong> <strong>Council</strong> does not consider that it is practical orappropriate to target the development contributions acrossdifferent catchments as discussed in Step 1.The period in or over which the benefits are expectedto occurWastewater infrastructure typically offers benefits over severalyears, and in many cases, decades. For this reason, capitalinvestment in such assets is typically funded through borrowingand paying off the debt over a long period of time. This allowsinfrastructure to proceed that otherwise may not, and helpsensure intergenerational equity.However, applying this model to growth related costs meansthat those growth costs are borne by everyone else in the<strong>community</strong>. Consequently, the advantages offered by paying forassets over time through borrowing, need to be weighed againstthe advantages of charging for growth cost up front, particularlyequity (for other ratepayers) and economic efficiency.On balance, <strong>Council</strong> considers that the greater good isachieved in this case by growth costs should be borne bythose that create the costs, up front through developmentcontributions, rather than through borrowing.The extent to which the actions or inaction of particularindividuals or a group contribute to the need to undertakethe activityThere are no significant works identified in the LTCCP (orundertaken previously) that are needed largely as a result ofgrowth in any particular areas within the city. Consequently,no particular individual or groups contribute to the demandfor the stormwater assets <strong>plan</strong>ned to such an extent that theycan be singled out.Financial contributions are required where individualdevelopments give rise to capital expenditure that is notincluded in the LTCCP, and therefore that expenditure is notincluded in <strong>Council</strong>’s development contribution policy. In thesecases, <strong>Council</strong> can usually identify the individual or groupinvolved and may impose a financial contribution as acondition of resource consent.The costs and benefits, including consequences fortransparency and accountability, of funding the activitydistinctly from other activities.<strong>Council</strong> considers that greater transparency and economicefficiency is achieved by ensuring that costs associated withgrowth are explicitly identified, and met by growth, rather thanby the <strong>community</strong> through rates, and growth facing less than100% of the costs it causes.
27811.5 Identify units of demand (Step 4)The unit of demand used in this policy is the equivalenthousehold unit (EHU). For wastewater, 1 EHU represents thedemand on wastewater infrastructure assumed to result from675 litres per day. The conversion rate that applies to nonresidentialdevelopments (retail, commercial and industrial)is 1 EHU per 275m 2 GFA.11.6 Identify design capacity provided forgrowth (Step 5)The wastewater treatment <strong>plan</strong>t was built with 3,991 EHUsspare capacity. Around 65%, or 2,610 EHUs, of the sparecapacity is expected to be taken up through growth in the10 year period 2009-2019.11.7 Allocate costs to units of demand(Steps 6 and 7)Fees are charged as follows:Historic CostsGrowthrelatedcapitalexpenditure(presentvalue)DesignEHUsFee perEHUWastewaterTreatmentPlant $8,329,186 3,991 $2,087Total $2,08712 Local Urban Environment12.1 IntroductionUrban environment concerns the arrangement, appearance andfunctionality of <strong>Hutt</strong> <strong>City</strong>, and in particular the shaping and usesof urban public space. Urban environment deals primarily withthe design and management of public space (i.e. the 'publicenvironment', 'public realm' or 'public domain'), and the waypublic places are experienced and used. Public space includesthe totality of spaces used freely on a day-to-day basis by thegeneral public, such as streets, parks and public infrastructureand facilities.Some aspects of privately owned spaces, such as buildingfacades or domestic gardens, also contribute to public spaceand are therefore also considered by urban environment.However, these elements are typically managed through<strong>plan</strong>ning instruments, and do not result in capital expenditureby <strong>Council</strong>.Development typically requires the either new public space orfeatures to be provided and/or for the features, functionality,and aesthetics of existing public space to be improved,offering a higher standard of public space.The capital expenditure <strong>plan</strong>ned in the 2009-2019 LTCCPcomprises upgrades of CBD and suburban shoppingcentres. These upgrades are intended to bring the publicspace up to contemporary standards, helping stimulatebusiness growth and making it a more attractive, pleasantand useful space for residents. These works also includethe recent High Street upgrade. Consequently, this historicexpenditure is also recognised.The upgrades mainly serve existing residents, although anelement of the works is being provided to accommodategrowth within the city. Providing for growth at the time theworks are being undertaken rather than at a later stage,is more economic and allows design cohesion.12.2 Define catchment (Step 1)Like roads and traffic, urban environment assets are oftenavailable to and used by a wide range of people within the city.This is particularly so with much of the work <strong>plan</strong>ned over the2009-2019 period as it is centred on the CBD, which servesthe entire city. A smaller amount of works are expected in thesuburban shopping centres. Over the 2009-2019 period,these works are expected to be fairly evenly spread aroundthe city. For these reasons, a single catchment is used forurban environment.12.3 Identify growth related capitalexpenditure (Step 2)It is estimated that on average, approximately 6.4% of theurban environment capital works within the CBD and thesuburban centres are needed to accommodate expectedgrowth over the next 10 years. On an average cost allocationbasis, 6.4% of the total CBD and suburban shopping centresrelated capital expenditure is therefore, attributed to growth.The total capital expenditure cost of growth expected forurban environment over the period 2009/2010 – 2019/2020 isestimated to be $305,500. $106,771 of historical costs for theHigh Street upgrade are also recognised as growth related.The present value (in 2009/2010) of these costs is estimatedto be $372,506 ($119,634 for historic costs and $252,872 forfuture costs).
hutt city <strong>community</strong> <strong>plan</strong> 27912.4 Identify the percentage of growth coststo be funded by development contributions(103(b) Assessment) (Step 3)100% of the growth costs related to urban environment areto be recovered from development contributions. In makingthis de<strong>term</strong>ination, the following factors were consideredby <strong>Council</strong>:The <strong>community</strong> outcomes to which the infrastructureprimarily contributesThe relevant <strong>community</strong> outcomes for urban environment arelisted from page 32 of the LTCCP. They describe a city thatis increasingly attractive, pleasant and safe to live in thatattracts people and business, with a developing uniqueness.These outcomes are strongly related to improving outcomesfor the existing population, but also reflect the need to ensurethat the standard of public space achieved through urbanenvironment is appropriate for growth. Meeting this standardis much more achievable if additional funding throughdevelopment contribution is possible, rather than levellingall costs on existing ratepayers.The distribution of benefits between the <strong>community</strong>as a whole, and any identifiable parts of the <strong>community</strong>,and individualsThe distribution of benefits between existing households andnewcomers generally was taken into account at the time thegrowth component of capital expenditure was de<strong>term</strong>inedin Step 2.<strong>Hutt</strong> <strong>City</strong> <strong>Council</strong> does not consider that it is practical orappropriate to target the development contributions acrossdifferent catchments as discussed in Step 1.The period in or over which the benefits are expectedto occurUrban environment infrastructure typically offers benefits overseveral years, and in most cases, decades. For this reason,capital investment in such assets is typically funded throughborrowing and paying off the debt over a long period of time.This allows infrastructure to proceed that otherwise may not,and helps ensure intergenerational equity.However, applying this model to growth related costsmeans that those growth costs are borne by everyone elsein the <strong>community</strong>. Consequently, the advantages offered bypaying for assets over time through borrowing, need to beweighed against the advantages of charging for growthcost up front, particularly equity (for other ratepayers) andeconomic efficiency.On balance, <strong>Council</strong> considers that the greater good isachieved in this case by growth costs should be borne bythose that create the costs, up front through developmentcontributions, rather than through borrowing.The extent to which the actions or inaction of particularindividuals or a group contribute to the need to undertakethe activityThere are no significant works identified in the LTCCP (orundertaken previously) that are needed largely as a result ofgrowth in any particular areas within the city. Consequently,no particular individual or groups contribute to the demandfor urban environment assets <strong>plan</strong>ned to such an extent thatthey can be singled out.Financial contributions are required where individualdevelopments give rise to capital expenditure that is notincluded in the LTCCP, and therefore that expenditure is notincluded in <strong>Council</strong>’s development contribution policy. In thesecases, <strong>Council</strong> can usually identify the individual or groupinvolved and may impose a financial contribution as acondition of resource consent.The costs and benefits, including consequences fortransparency and accountability, of funding the activitydistinctly from other activities.<strong>Council</strong> considers that greater transparency and economicefficiency is achieved by ensuring that costs associated withgrowth are explicitly identified, and met by growth, rather thanby the <strong>community</strong> through rates, and growth facing less than100% of the costs it causes.
28012.5 Identify units of demand (Step 4)The unit of demand used in this policy is the equivalent household unit (EHU). For local urbanenvironment, this represents the demand on urban environment assets assumed to result from1 hour per day per household.For non-residential developments, the following conversion rates will apply:2ÎÎRetail: 1 EHU per 75m GFA2ÎÎCommercial: 1 EHU per 150m GFA2ÎÎIndustrial: 1 EHU per 800m GFAThese demand estimates are based on shopping time data for adults (2.6 hour per week), andthe average number of people per household (2.7).The non-residential conversion rates have been calculated by using data on the space typicallyrequired per employee for the different types of non-residential developments (27m 2 for retail,55m 2 for commercial, and 300m 2 for industrial).12.6 Identify design capacity provided for growth (Step 5)As noted earlier, approximately 6.4% of capital expenditure is assumed to relate to growthand these works are assumed to approximately meet demand within the 10 year period.Consequently, the design capacity is estimated to be approximately equal to the extrademand on the system over that time, 2,738 EHUs (refer section 7.5).12.7 Allocate costs to units of demand (Steps 6 and 7)Fees are charged as follows:Historic Costs2007/2008 CBDMaster<strong>plan</strong> worksAnticipated costsCBD Making Places(incorporating CBDMaster<strong>plan</strong>) &Suburban ShoppingCentre worksGrowthrelated capitalexpenditure(present value) Design EHUs Fee per EHU$119,634 2,738 $44$252,872 2,738 $92Total $136
hutt city <strong>community</strong> <strong>plan</strong> 281Liability Management PolicyINTRODUCTIONSection 102(4)(b) of the Local Government Act 2002requires <strong>Council</strong> to adopt a Liability Management Policy.The requirements of that policy are listed in section 104.The relevant legislation is reproduced below:Section 104 Liability ManagementPolicyA policy adopted under section 104(4)(b) must state thelocal authority’s policies in respect of the managementof both borrowing and other liabilities, including:ÎÎinterest rate exposure; andÎÎliquidity; andÎÎcredit exposure; andÎÎdebt repayment; andÎÎspecific borrowing limits; andÎÎthe giving of securities.GENERAL POLICY<strong>Council</strong>’s liabilities comprise borrowings and various otherliabilities. <strong>Council</strong>’s Liability Management Policy focuses onborrowing as this is the most significant component andexposes <strong>Council</strong> to the most significant risks.Other liabilities are generally non-interest bearing. Cash flowsassociated with other liabilities are incorporated in cash flowforecasts for liquidity management purposes and de<strong>term</strong>iningfuture borrowing requirements.<strong>Council</strong> raises borrowing for the following primary purposes:ÎÎGeneral debt to fund <strong>Council</strong>’s balance sheet and fromtime to time liquidity requirementsÎÎSpecific debt associated with “special one-off” projectsand capital expenditureÎÎTo fund assets with intergenerational qualities.<strong>Council</strong> is able to borrow through a variety of marketmechanisms including the issue of bonds or commercial paperand direct bank borrowing. In evaluating new borrowings (inrelation to source, <strong>term</strong>, size and pricing) the General ManagerBusiness Services and Finance Manager will take into accountthe following:ÎÎThe size and economic life of the related projectÎÎThe impact of the new debt on the borrowing limitsÎÎRelevant interest rate margins payable under eachborrowing sourceÎÎ<strong>Council</strong>’s overall debt maturity profile, to ensureconcentration of debt is avoided at re-issue/rollover timeÎÎPrevailing interest rates relative to <strong>term</strong> for bond andcommercial paper issuance and bank borrowing, andmanagement’s view of future interest rate movementsÎÎAvailable <strong>term</strong>s from bond and commercial paperissuance and from banksÎÎLegal documentation and financial covenantsÎÎAlternative funding mechanisms such as leasing areevaluated with financial analysis in conjunction withtraditional on-balance sheet funding. The evaluationtakes into consideration ownership, redemption valueand effective cost of funds.Interest expenses arising on the existing debt portfolio andfuture borrowings will generally be allocated to specificactivities of <strong>Council</strong> in proportion to the assets employedby each activity. Subject to the approval of the StrategicLeadership Team selected interest costs may be chargeddirectly to <strong>Council</strong> activities if related borrowings are clearlyidentifiable as relating to that activity.OVERALL BORROWING LIMITSIn managing borrowing <strong>Council</strong> adheres to the following limits:LimitNet debt as a percentage of equity
282Income is defined as earnings from rates, government grantsand subsidies, user charges, interest and other revenue.Rates exclude regional levies.Debt is repaid as it falls due in accordance with the applicableloan agreement. Subject to the debt limits a loan may be rolledover or renegotiated as and when appropriate.MANAGING DEBT REFINANCING RISKCash flow deficits in various future periods based onlong <strong>term</strong> financial forecasts are reliant on the maturity structureof loans and facilities. Liquidity risk management focuses on theability to borrow at that future time to fund the gaps. Funding riskmanagement centres on the ability to refinance or raise new debtat a future time at the same or more favourable pricing (fees andborrowing margins) and maturity <strong>term</strong>s of existing facilities.Managing <strong>Council</strong>’s funding risks is important as several riskfactors can arise to cause an adverse movement in borrowingmargins, <strong>term</strong> availability and general flexibility including:ÎÎLocal Government risk is priced to a higher fee andmargin levelÎÎ<strong>Council</strong>’s own credit standing or financial strength asa borrower deteriorates owingto financial, regulatoryor other reasonsÎÎA large individual lender to <strong>Council</strong> experiences its ownfinancial/exposure difficulties resulting in <strong>Council</strong> not beingable to manage its debt portfolio as optimally as desiredÎÎThe New Zealand investment <strong>community</strong> experiences asubstantial over supply of <strong>Council</strong> investment assets.A key factor in funding risk management is to spread andcontrol the risk to reduce the concentration of risk at onepoint in time so that if any of the above events occur, theoverall borrowing cost is not unnecessarily increased, noris the desired maturity profile compromised owing tomarket conditions.Liquidity/Funding Risk Control Limits<strong>Council</strong> manages liquidity and funding risk through applicationof the following limits and principles:ÎÎTerm debt and committed debt facilities are maintained atan amount that averages 100% of projected peak net debtlevels over the next 12 months (per long <strong>term</strong> cash anddebt forecasts)ÎÎAn allocated amount of committed credit facilities isdesignated as cover for special funds as outlined in theInvestment Policy and other legislative requirementsÎÎThe maturity profile of total committed funding in respectto all loans and committed facilities is maintained withinthe following limits:Period Minimum Maximum0 to 3 years 10% 60%3 to 5 years 20% 60%5 years plus 10% 60%ÎÎA maturity profile that is outside the above limits, but selfcorrects in less than 90 days, is not in breach of this Policy.However, maintaining a maturity profile outside theselimits requires specific approval of the Finance andAudit Committee.ÎÎTreasury staff provide comprehensive daily and weeklycash management reporting, together with rolling 12-monthforecasts, annual cash/debt forecasting and long <strong>term</strong>debt forecasts out to 10-years. This reporting is used tomonitor actual and forecast liquidity and funding riskand to <strong>plan</strong> accordingly.ÎÎThe General Manager Business Services has the discretionaryauthority to refinance existing debt on more favourable <strong>term</strong>s.MANAGING INTEREST RATE RISKRisk RecognitionInterest rate risk is the risk that funding costs (owing to adversemovements in market interest rates) will materially exceedadopted annual <strong>plan</strong>s and 10-year interest cost projections,so as to adversely impact cost control, capital investmentdecisions/returns/ and feasibilities.Given <strong>Council</strong>’s debt level it has a large exposure to interestrate movements (a 1% interest rate movement on $50 millionof debt over 12 months = $500,000). Accordingly, the primaryobjective of interest rate risk management is to reduce theuncertainty of interest rate movements through fixing of fundingcosts. However, a secondary objective is to minimise the netfunding costs for <strong>Council</strong> within acceptable risk parameters.Both objectives are to be achieved through the activemanagement of underlying interest rate exposures.
hutt city <strong>community</strong> <strong>plan</strong> 283Approved Financial InstrumentsDealing in interest rate products must be limited to the following financial instruments:INTEREST RATE RISK CONTROL LIMITSBorrowingsCATEGORYCash management and borrowingInvestments(All investments must be senior ranked)Interest rate risk managementINSTRUMENTBank overdraftCommitted cash advance and bank accepted bill facilities (<strong>term</strong> facilities)Uncommitted money market facilitiesBond issuanceShort <strong>term</strong> bank depositsBank billsBank certificates of deposit (CDs)Treasury billsLocal Authority stock or State-owned Enterprise (SOE) bondsCorporate bondsPromissory notes/commercial paperForward rate agreements (“FRAs”) on:ÎÎBank billsÎÎGovernment bondsInterest rate swaps including:ÎÎForward start swaps (start date
284The fixed rate amount at any point in time must be within thefollowing maturity bands:Fixed Rate Maturity Profile LimitPeriodMinimumCoverMaximumCover1 to 3 years 15% 60%3 to 5 years 15% 60%5 to 10 years 15% 60%A fixed rate maturity profile that is outside the above limits, butself corrects in less than 90 days, is not in breach of this Policy.However, maintaining a fixed rate maturity profile outside theabove limits requires specific approval of the Finance andAudit Committee.The following additional controls are applied to manage interestrate risk:ÎÎFloating rate debt may be spread over any maturity out to12 months. Bank advances may be for a maximum <strong>term</strong> of12 monthsÎÎForward rate agreements (FRAs) outstanding at any onetime must not exceed 75% of the total floating rate debt.FRAs may be “closed out” before maturity date by enteringan equal and opposite FRA to the same maturity date or,alternatively, by purchasing an option on an FRA for theequal and opposite amount to the same dateÎÎInterest rate options must not be sold outright. However,1:1 collar option structures are allowable whereby the soldoption is matched precisely by amount and maturity to thesimultaneously purchased option. During the <strong>term</strong> of theoption, one side of the collar cannot be closed out byitself, both must be closed simultaneously. The sold optionleg of the collar structure must not have a strike rate“in-the-money”ÎÎPurchased borrower swaptions must mature within12 months unless specifically approved by theFinance and Audit CommitteeÎÎInterest rate options with a maturity date beyond12 months, which have a strike rate (exercise rate)higher than 2.00% above the appropriate swap rate,cannot be counted as part of the fixed rate coverpercentage calculation.Security<strong>Council</strong>’s borrowings and interest rate risk managementinstruments will generally be secured by way of a chargeover <strong>Council</strong>’s rate revenue. However, if it is consideredadvantageous, <strong>Council</strong>’s borrowings and other financialarrangements may be on an unsecured basis, or securedby way of a charge over physical assets.Physical assets will be charged only where:ÎÎThere is a direct relationship between the debt andthe purchase or construction of the asset that it funds(eg, an operating lease, or project finance)ÎÎThe General Manager Business Services considers acharge over physical assets to be appropriateÎÎThe Finance Manager ensures that the required register ofcharges and any associated documents are provided, filedand kept in accordance with the provisions of the LocalGovernment Act 2002 and any other relevant legislation.<strong>Council</strong>’s utilisation of special funds as detailed in theInvestment Policy will be on an unsecured basis.Debt RepaymentThe funds from all asset sales and operating surpluses willbe applied to the reduction of debt and/or a reduction inborrowing requirements, unless <strong>Council</strong> specifically directsthat the funds be put to another use.<strong>Council</strong> will manage debt on a net portfolio basis at all times. Thisalso applies to funds vested to <strong>Council</strong> for specific purposes asdictated by legislation.Contingent Liabilities<strong>Council</strong> from time to time provides financial guaranteesto <strong>community</strong>, sporting, cultural and similar non-profitorganisations. Management ensures that the organisationis financially sound and the project is financially viable ona stand-alone basis.<strong>Council</strong>’s maximum liability is limited to $1.2 million and$300,000 for any single loan. Financial guarantees are givenfor a period of no more than 10 years.Financial statements are received annually and <strong>Council</strong>is notified if the loan falls into arrears. Should any guaranteebe called upon <strong>Council</strong> will take immediate steps to recoverthe money.
hutt city <strong>community</strong> <strong>plan</strong> 285Investment PolicyIntroductionSection 102(4)(c) of the Local Government Act 2002 requires<strong>Council</strong> to adopt an investment policy. The requirements ofthat policy are listed in section 105. The relevant legislationis reproduced below:Section 105 Investment PolicyA policy adopted under section 102(4)(c) must state the localauthority’s policies in respect of investments including:ÎÎthe objectives in <strong>term</strong>s of which financial and equityinvestments are to be managed; andÎÎthe mix of investments; andÎÎthe acquisition of new investments; andÎÎan outline of the procedures by which investments aremanaged and reported on to the local authority; andÎÎan outline of how risks associated with investments areassessed and managed.General PolicyAs <strong>Council</strong> is a net borrower of funds and applies surplusfunds to debt repayment, investments are only maintained tomeet specified business objectives. An example is the holdingof minor equity investments in order to participate in selectedlocal authority mutual funds for risk management purposes.The mix of investments held is outlined below. Investments aregenerally managed by <strong>Council</strong>’s Financial Services Division,which monitors investments, assesses associated risks andreports monthly to <strong>Council</strong>’s Strategic Leadership Team andquarterly to <strong>Council</strong>’s Finance and Audit Committee.Liquid InvestmentsFor the foreseeable future <strong>Council</strong> will have a permanent netdebt/borrowing position and will use flexible short-<strong>term</strong> workingcapital money market funding lines. Accordingly, it does nothave any requirement to be in a surplus cash situation.Therefore, any liquid investments must be restricted to a <strong>term</strong>that meets future cash flow projections. Any liquid investmentsmust be placed within the counterparty credit limits specified in<strong>Council</strong>’s Treasury Policy.Sinking Funds<strong>Council</strong> is no longer required to use sinking funds as amechanism for loan repayments. Where practical, <strong>Council</strong>will actively pursue the cessation of contributions to existingsinking funds. Accordingly, the existing sinking fundsestablished before 1 July 1998 will run down over theirattributable lives to zero.Given that <strong>Council</strong> will be a net borrower for the remaining livesof the existing sinking funds, the sinking funds should be usedfor internal borrowing purposes. This will negate any interestrate gap risk that occurs when <strong>Council</strong> borrows at a higherrate compared with the investment rate achieved by sinkingfunds. Such internal borrowings should be netted from the“net debt level”.A statement of sinking funds is prepared annually by theSinking Fund Commissioners.Special FundsLiquid assets will not be required to be held against specialfunds. Instead, <strong>Council</strong> will manage these funds using internalborrowing facilities.Accounting entries representing monthly interest accrualallocations will be made using <strong>Council</strong>’s average weightedcost of funds for that period.Trust FundsTrust Funds represent those administered by <strong>Council</strong> in <strong>term</strong>sof a bequest trust deed, or similar document that has beencreated by a third party. Such funds are to be separatelyinvested and used for the express purpose for which theywere intended.Equity Investments<strong>Council</strong>’s equity investments are restricted to minor strategicholdings in selected organisations and interests in several<strong>Council</strong>-controlled Organisations.The objectives of <strong>Council</strong>-controlled Organisations are asdefined in section 59 of the Local Government Act 2002,and as set out in their statements of intent approved by<strong>Council</strong> each year.
286Policy for Remission and Postponement of Rates on Maori Freehold LandIntroductionMaori freehold land is defined in the Local Government(Rating) Act 2002 as land whose beneficial ownership hasbeen de<strong>term</strong>ined by a freehold order issued by the Maori LandCourt. Only land that is the subject of such an order mayqualify for remission or postponement under this policy.Whether rates are remitted or postponed in any individual casewill depend on the individual circumstances of each application.In general, a remission of rates will be considered, unless thereis a reasonable likelihood that the subject land will be used ordeveloped in the immediate future.This policy has been formulated for the purposes of:ÎÎEnsuring the fair and equitable collection of rates fromall sectors of the <strong>community</strong> by recognising that certainMaori-owned lands have particular conditions, features,ownership structures, or other circumstances that makeit appropriate to provide relief from rates.ÎÎMeeting the requirements of Sections 102 and 108 and thematters in Schedule 11 of the Local Government Act 2002to have a policy on the remission and postponement ofrates on Maori freehold land.ObjectivesThe objectives of this policy are:ÎÎTo recognise situations where there is no occupier or persongaining an economic or financial benefit from the land.ÎÎTo set aside land that is better set aside for non-usebecause of its natural features (whenua rahui).ÎÎTo recognise matters related to the physical accessibilityof the land.ÎÎTo recognise and take account of the presence of waahitapu that may affect the use of the land for other purposes.ÎÎWhere only part of a block is occupied, to grant remissionfor the portion of land not occupied.ÎÎTo facilitate development or use of the land where <strong>Council</strong>considers rates based on the rateable value make the useof the land uneconomic.Conditions and CriteriaÎÎApplication for this remission or postponement should bemade prior to commencement of the rating year.Applications made after the commencement of the ratingyear may be accepted at the discretion of <strong>Council</strong>.ÎÎOwners or trustees making application should includethe following information in their applications:ÆÆDetails of the rating unit or units involved.ÆÆThe objectives that will be achieved by providinga remission.ÆÆDocumentation that shows the land which is thesubject of the application is Maori freehold land.ÎÎ<strong>Council</strong> may of its own volition investigate and grantremission or postponement of rates on any Maorifreehold land in the city.ÎÎRelief, and the extent thereof, is at the sole discretion of<strong>Council</strong> and may be cancelled or reduced at any time.ÎÎ<strong>Council</strong> will give a remission or postponement of up to100% of all rates, except targeted rates set for water supplyor wastewater disposal, based on the following criteria:ÆÆThe land is unoccupied and no income is derived fromthe use or occupation of that land.ÆÆThe land is better set aside for non-use (whenua rahui)because of its natural features, or is unoccupied,and no income is derived from the use or occupationof that land.ÆÆThe land is inaccessible and is unoccupied.ÆÆOnly a portion of the land is occupied.ÆÆThe property carries a best potential use value that issignificantly in excess of the economic value arisingfrom its actual use.
hutt city <strong>community</strong> <strong>plan</strong> 287Rates postponement policyIntroductionThis policy is prepared under sections 102 and 110 of theLocal Government Act 2002.ObjectiveTo assist ratepayers experiencing extreme financialcircumstances which affect their ability to pay rates.Conditions and CriteriaÎÎOnly rating units used solely for residential purposes (asdefined by <strong>Council</strong>) will be eligible for consideration forrates postponement for extreme financial circumstances.ÎÎOnly the person entered as the ratepayer, or theirauthorised agent, may make an application for ratespostponement for extreme financial circumstances. Theratepayer must be the current owner of, and have ownedfor not less than five years, the rating unit which is thesubject of the application. The person entered on <strong>Council</strong>’srating information database as the ‘ratepayer’ must not ownany other rating units or investment properties (whether inthe district or in another district).ÎÎThe ratepayer (or authorised agent) must make anapplication to <strong>Council</strong> on the prescribed form.ÎÎ<strong>Council</strong> will consider, on a case-by-case basis, allapplications received that meet the criteria describedin the first two paragraphs under this section.ÎÎWhen considering whether extreme financial circumstancesexist, all of the ratepayer’s personal circumstances will berelevant including the following factors: age, physical ormental disability, injury, illness and family circumstances.ÎÎBefore approving an application <strong>Council</strong> must be satisfiedthat the ratepayer is unlikely to have sufficient funds leftover, after the payment of rates, for normal health care andproper provision for maintenance of his/her home andchattels at an adequate standard as well as makingprovision for normal day-to-day living expenses.ÎÎBefore approving an application <strong>Council</strong> must be satisfiedthat the ratepayer has taken all steps necessary to claimany central government benefits or allowances theratepayer is properly entitled to receive to assist with thepayment of rates.ÎÎWhere <strong>Council</strong> decides to postpone rates the ratepayermust first make acceptable arrangements for paymentof future rates, for example, by setting up a system forregular payments.ÎÎAny postponed rates will be postponed until:ÆÆThe death of the ratepayer(s).ÆÆThe ratepayer(s) ceases to be the owner or occupierof the rating unit.ÆÆThe ratepayer(s) ceases to use the property ashis/her residence.ÆÆA date specified by <strong>Council</strong>.ÎÎ<strong>Council</strong>, as authorised by section 88 of the LocalGovernment (Rating) Act 2002, will charge an annual feeon postponed rates for the period between the due dateand the date they are paid. This fee is designed to cover<strong>Council</strong>’s administrative and financial costs and may varyfrom year to year. The fee that will be charged in the2009/10 financial year is $50.ÎÎEven if rates are postponed, as a general rule the ratepayerwill be required to pay the first $500 of the rate account.ÎÎThe policy will apply from the beginning of the rating yearin which the application is made although <strong>Council</strong> mayconsider backdating past the rating year in which theapplication is made depending on the circumstances.ÎÎThe postponed rates or any part thereof may be paid atany time. The applicant may elect to postpone the paymentof a lesser sum than that which they would be entitled tohave postponed pursuant to this policy.ÎÎPostponed rates will be registered as a statutory landcharge on the rating unit title. This means that <strong>Council</strong>will have first call on the proceeds of any revenue fromthe sale or lease of the rating unit.Delegations<strong>Council</strong> will delegate authority to approve applications for ratespostponement to particular <strong>Council</strong> officers.
288rates remission policyIntroductionIn order to allow rates relief where it is considered fair andreasonable to do so, <strong>Council</strong> is required to adopt policiesspecifying the circumstances under which rates will beconsidered for remission. There are various types of remission,and the circumstances under which a remission will beconsidered for each type may be different. The conditionsand criteria relating to each type of remission are thereforeset out separately in the following pages, together with theobjectives of the policy.This policy is prepared under section 109 of the LocalGovernment Act 2002 for consultation using the specialconsultative procedure laid down in section 83 of thesame Act.Part 1 – Remission for Community,Sporting and other OrganisationsObjectives of the PolicyÎÎTo facilitate the ongoing provision of non-commercial<strong>community</strong> services that meet the needs of the residentsof the city.ÎÎTo facilitate the ongoing provision of non-commercialrecreational opportunities for the residents of the city.ÎÎTo assist the organisations’ survival.ÎÎTo make membership of the organisations more accessibleto the general public, particularly disadvantaged groups.These include children, youth, young families, agedpeople, and economically disadvantaged people.Conditions and Criteria<strong>Council</strong> may remit rates where the application meets thefollowing criteria:ÎÎThe policy will apply to land owned by <strong>Council</strong> or ownedand occupied by a charitable organisation, which is usedexclusively or principally for sporting, recreation, or<strong>community</strong> purposes.ÎÎThe policy does not apply to organisations operated forprivate pecuniary profit.ÎÎThe policy will also not apply to groups or organisationswhose primary purpose is to address the needs of adultmembers (over 18 years) for entertainment or socialinteraction, or who engage in recreational, sporting, or<strong>community</strong> services as a secondary purpose only.ÎÎApplications for remission must be made in writing to<strong>Council</strong> prior to the commencement of the rating year.Applications received during a rating year will beapplicable from the commencement of the followingrating year. Applications will not be backdated.ÎÎOrganisations making application should include thefollowing documents in support of their application:ÆÆStatement of objectives.ÆÆFinancial accounts.ÆÆInformation on activities and programmes.ÆÆDetails of membership or clients.ÎÎAny remission granted in relation to the general rate underthis policy will not exceed 50% of the amount charged,unless exceptional circumstances exist.ÎÎAny organisation being rated in any of the CommunityFacilities differential categories will not be eligible for anyremission in relation to the general rate, unless exceptionalcircumstances exist.ÎÎThe policy shall apply to such organisations as areapproved by <strong>Council</strong> as meeting the relevant criteria.ÎÎNo remission will be granted on targeted rates for watersupply under this policy.ÎÎRemission of targeted rates for wastewater disposal underthis policy will only be granted as follows, to the types oforganisations specified:ÆÆPlaces of Religious Worship will be charged for amaximum of two pans, except in circumstances whereit is evident that there is regular weekday use of thebuilding for non-worship purposes.ÆÆChild Care Facilities will be charged for a maximumof two pans.ÆÆSports clubs will be charged for a maximum oftwo pans, unless the club holds a liquor licence.ÆÆNo more than 200 pans are to be charged on anyone property.
hutt city <strong>community</strong> <strong>plan</strong> 289ÆÆMarae and other similar meeting places are to becharged for a maximum of two pans.ÆÆIn cases of doubt each application shall be referredto <strong>Council</strong>’s Finance and Audit Committee for afinal decision.Delegations<strong>Council</strong> may delegate the authority to make such approvalsto particular <strong>Council</strong> officers as specified by a resolutionof <strong>Council</strong>.Part 2 – Remission of Penalties addedto unpaid RatesObjective of the PolicyTo enable <strong>Council</strong> to act fairly and reasonably in its considerationof penalties on rates which have not been paid by the due date.Conditions and CriteriaÎÎUpon receipt of an application from the ratepayer, or ifidentified by <strong>Council</strong>, <strong>Council</strong> may remit a penalty whereit considers that it is fair and equitable to do so. Mattersthat will be taken into consideration by <strong>Council</strong> includethe following:ÆÆThe ratepayer’s payment history.ÆÆThe impact on the ratepayer of extraordinary events.ÆÆThe payment of the full amount of rates due.ÆÆThe ratepayer entering into an agreement with <strong>Council</strong>for the payment of rates.ÎÎ<strong>Council</strong> reserves the right to impose conditions on theremission of penalties.DelegationsDecisions on the remission of penalties may be delegatedto <strong>Council</strong> officers or a Committee of <strong>Council</strong>. All delegationswill be recorded in <strong>Council</strong>’s delegations register.Part 3 – Remission of Uniform AnnualGeneral Charges and Targeted Ratesin certain circumstancesObjective of the PolicySection 20 of the Local Government (Rating) Act 2002 providesfor two or more rating units to be treated as one unit for settinga rate if the units are:ÎÎIn the same ownership.ÎÎUsed jointly as a single unit.ÎÎContiguous or separated only by a road etc.This policy provides for the possibility of rates remission wherethe above three conditions are not all met, but where it isnevertheless considered inequitable for the rating units to betreated as separate.In addition, it provides for remission of uniform annual generalcharges and/or targeted rates for water and wastewater incases where a rating unit is liable for multiple charges, but it isconsidered inequitable or excessive to assess full charges.Conditions and CriteriaÎÎThe units may be in separate ownership, but if they arecontiguous and are used jointly as a single unit, they willbe treated as a single unit.ÎÎContiguous rating units in the same ownership will betreated as a single unit where any of the followingcircumstances exist:ÆÆOne unit is used as a private residence and thecontiguous unit(s) is used solely as a garden orsimilar private part of the grounds only in connectionwith the residence.ÆÆOne unit is used solely for vehicle parking inconjunction with a building on a contiguous ratingunit in the same ownership.ÎÎA rating unit used for residential purposes and whichincludes a separately inhabited part may apply to betreated as having only one separately used or inhabitedpart if the second part is occupied by a dependentmember of the family of the owner.ÎÎOwners wishing to claim a remission under this policy arerequired to make a written application and to supply suchevidence as may be requested to verify that a remissionshould be granted under this policy. While a remission maybe granted for the current year, no consideration will begiven to applications relating to prior years.Delegations<strong>Council</strong> will delegate authority to consider and approveapplications to <strong>Council</strong> officers.
290Part 4 – Remission on Land Protectedfor Natural, Historic or CulturalConservation PurposesObjective of the PolicyTo protect and promote significant natural areas, culturallysignificant sites, historic buildings, structures and places,and archaeological sites.This policy will support the provisions of the District Planwhere a number of these features have been identified.Conditions and CriteriaÎÎRatepayers who own rating units which include significantnatural areas, culturally significant sites, historic buildings,structures and places, and archaeological sites, includingthose identified in the District Plan, and who havevoluntarily protected these features, may qualify forremission of rates under this part of the policy.ÎÎLand that is non-rateable under section 8 of the LocalGovernment (Rating) Act and is liable only for rates forwater supply, wastewater disposal or refuse collectionwill not qualify for remission under this part of the policy.ÎÎApplications must be made in writing. Applications shouldbe supported by documentary evidence of the protectedstatus of the rating unit, eg. a copy of the Covenant or otherlegal mechanism.ÎÎIn considering any application for remission of ratesunder this part of the policy <strong>Council</strong> will consider thefollowing criteria:ÆÆThe extent to which the protection and promotion ofsignificant natural areas, culturally significant sites,historic buildings, structures and places, andarchaeological sites will be promoted by grantingremission of rates on the rating unit.ÆÆThe degree to which the significant natural areas,culturally significant sites, historic buildings, structuresand places, and archaeological sites are presenton the land.ÆÆThe degree to which the significant natural areas,culturally significant sites, historic buildings, structuresand places, and archaeological sites inhibit theeconomic utilisation of the land.ÎÎIn granting remissions under this part of the policy <strong>Council</strong>may specify certain conditions before remission will begranted. Applicants will be required to agree in writingto these conditions and to pay any remitted rates if theconditions are violated.ÎÎ<strong>Council</strong> will decide what amount of rates will be remittedon a case-by-case basis subject to a maximum amountof 50% of rates owing per year.DelegationsApplications for the remission for protection of heritage will beconsidered by a Committee of <strong>Council</strong>, acting under delegatedauthority from <strong>Council</strong>.PART 5 – RATES REMISSION FOR ECONOMICDEVELOPMENTObjectives of the PolicyTo promote employment and economic development within thecity by offering rates remission to:ÎÎencourage developments that assist new businesses tobecome established in the city, orÎÎencourage developments that assist existing businessesin the city to expand and grow.This policy is one of a number of initiatives for businesses that<strong>Council</strong> has in place to assist in achieving the outcomes in itsEconomic Development Strategy.Conditions and CriteriaThis part of the policy applies to commercial and/or industrialdevelopments that involve the construction, erection oralteration of any building or buildings, or other works intendedto be used for industrial, commercial or administrativepurposes. Residential developments will not qualify forremission under this part of the Remission Policy.In order for an application for rates remission for economicdevelopment to be considered, applicants must meet all thecriteria in either Part A (1) or Part A (2).Each application made under Part 5 of the Rates RemissionPolicy – Economic Development will be considered on acase-by-case basis. Satisfaction of the criteria outlined inthis policy does not guarantee a remission of rates. The finaldecision to grant a remission of rates will be at <strong>Council</strong>’ssole discretion.
hutt city <strong>community</strong> <strong>plan</strong> 291Part A1 General CriteriaÎÎThe development must be of strategic importance forthe future economic development of the city. This maybe demonstrated by the scale, type or nature ofthe development.ÎÎThe development will create new employment opportunities.Generally a development targeted at a new business wouldbe expected to create at least 50 new full-time-equivalentjobs to Lower <strong>Hutt</strong>. Developments that target an existingbusiness would be expected to increase its full-timeequivalent staff numbers by:ÆÆover 50% of existing full-time-equivalent jobs; orÆÆat least 50 new full-time-equivalent jobs,whichever is the lesser.ÎÎThe development is unlikely to be in competition withexisting businesses. Generally the applicant will berequired to demonstrate that the development will createlittle or no competition with existing businesses, or thatthere is unfulfilled demand in the market for the type ofbusiness that will be targeted.ÎÎThe development will bring a significant amount of newcapital investment into the city. The amount of newinvestment should be not less than $2,500,000 unless thebusiness falls within the category identified in 2 below.Consideration will be given to the extent that the newdevelopment would increase the rating base.2 Criteria regarding innovative or rare typesof business for Lower <strong>Hutt</strong> using advancedscience and/or advanced technologyDevelopments that attract innovative or rare types of businessfor Lower <strong>Hutt</strong> using advanced science and/or advancedtechnology are likely to be more favourably considered forremission. Where this type of business does not initially create50 new full-time-equivalent jobs or invest at least $2,500,000of new capital investment:ÎÎThe development must be of strategic importance for thefuture economic development of the city. This will bedemonstrated by the advanced science and/or advancedtechnology nature of the development.ÎÎThe development is unlikely to be in competition withexisting businesses. Generally the applicant will berequired to demonstrate that the development will createlittle or no competition with existing businesses, or thatthere is unfulfilled demand in the market for the type ofbusiness that will be targeted.ÎÎThe applicant must demonstrate, through recognisedresearch and development programmes and/or throughownership or access to recognised intellectual propertyrights, that it has a realistic future potential to create atleast 50 new full-time-equivalent jobs and at least$2,500,000 of future new capital investment within3 years.To further assist in considering applications for remission underthis part of the policy <strong>Council</strong> will also have regard to the extentapplications meet all or some of the additional guidelinesoutlined in Part B.Part B – Additional GuidelinesThese additional guidelines have been developed to assist inassessing the suitability of an application for rates remissionand in de<strong>term</strong>ining at what level, if any, rates remission shouldbe set. Only when an application has been shown to meet themandatory criteria outlined in Part A (1) or Part A (2) will theadditional guidelines in Part B be applied (as applicable).ÎÎThe development attracts businesses that demonstrate along-<strong>term</strong> commitment to remain and operate in the city.Property ownership or a long-<strong>term</strong> lease of property maybe accepted as a proof of commitment.ÎÎThe development protects or retains cultural aspects of thecity, e.g. maintains and protects a heritage building.ÎÎThe development adds new and/or visually attractiveinfrastructure/ buildings to the city.ÎÎThe development has minimal impact on the environmentin <strong>term</strong>s of air, water or soil.ÎÎIt is likely that any remission granted would provideencouragement or impetus to proceed with the development.Application ProcessApplications must be made in writing and received allowingsufficient time to be considered by <strong>Council</strong> prior to thecommencement of construction.Commencement of construction will be deemed to haveoccurred when the activity for which a building consent hasbeen issued has commenced.For the purposes of this policy a development is any project orgroup of projects requiring one or more building consents that,as a body of work, occurs within a similar timeframe, and thatstands alone as a complete activity in and of itself.
292This policy does not exclude the potential for more than onedevelopment to occur on the same site.Applications must be supported by:ÎÎA description of the developmentÎÎA <strong>plan</strong> of the development (where possible)ÎÎAn estimate of costs of the developmentÎÎAn indication of the businesses that will be attracted bythe developmentÎÎAn estimate of the likely number and type of jobs createdby the developmentÎÎEvidence that the jobs (positions) created are new toLower <strong>Hutt</strong>ÎÎAn environmental impact report (if applicable)ÎÎEvidence of ownership or access to intellectual propertyrights (if applicable)ÎÎEvidence of future commercial potential of use of thatintellectual property (if applicable).Where the applicant is not the owner or the ratepayer of theproperty, the applicant must provide written proof of supportfrom the property owner. If the applicant is a lessee then thelease expiry date should be stated, as well as any rights ofrenewal etc.In considering applications <strong>Council</strong> may decide to seekindependent verification of any information provided onan application.Each application made under Part 5 of the Rates RemissionPolicy – Economic Development will be considered on acase-by-case basis. Satisfaction of the criteria outlined in PartA (1) or Part A (2) does not guarantee a remission of rates. Thefinal decision to grant a remission of rates will be at <strong>Council</strong>’ssole discretion. Remissions granted will generally be not lessthan 50%, and may be up to a maximum of 100% of the rateslevied by <strong>Hutt</strong> <strong>City</strong> <strong>Council</strong> on the capital value of the newinvestment only, and for up to a maximum remission periodof three years.In granting remissions under this part of the policy <strong>Council</strong> mayin its discretion specify certain conditions before the remissionwill be granted having regard to the criteria and the applicationprocess in this policy. Applicants will be required to agree inwriting to these conditions and to pay any remitted rates if theconditions are violated.DelegationsApplications for a remission of rates for economic developmentwill be decided by full <strong>Council</strong>. <strong>Council</strong> may elect to refer all orpart of an application to a Committee for additional review andrecommendation.Part 6 – Remission for Residential Landin Commercial or in Industrial AreasObjectiveTo ensure that owners of residential rating units situated incommercial or industrial areas are not unduly penalised by thezoning decisions of this <strong>Council</strong> and previous local authorities.Conditions and CriteriaTo qualify for remission under this part of the policy the ratingunit must:ÎÎBe situated within an area of land that has been zoned forcommercial or industrial use. Ratepayers can de<strong>term</strong>inethe zoning of their property by inspecting the District Plan,copies of which are available at <strong>Council</strong> offices.ÎÎBe listed as a “residential” property for differential ratingpurposes. Ratepayers wishing to ascertain whether theirproperty is treated as a residential property may inspect<strong>Council</strong>’s rating information database at <strong>Council</strong> offices.Those ratepayers wishing to claim remission under this partof the policy must make an application on the prescribed form(available from <strong>Council</strong> offices).The application for rates remission must be made to <strong>Council</strong>prior to the commencement of the rating year. Applicationsreceived during a rating year will be applicable from thecommencement of the following rating year. Applications willnot be backdated.If an application is approved <strong>Council</strong> will direct its valuationservice provider to inspect the rating unit and prepare avaluation that will treat the rating unit as if it were a comparablerating unit elsewhere in the district. The ratepayer may beasked to contribute to the cost of this valuation. Ratepayersshould note that the valuation service provider’s decision isfinal and there are no statutory rights of objection or appeal forvalues done in this way.The amount of remission granted under this part of the policywill be limited to the difference between the rates charged onthe original value, and the rates chargeable on the valuationof the rating unit as a house in a residential area.DelegationsApplications for remission under this part of the policy will bede<strong>term</strong>ined by officers of <strong>Council</strong>, acting under delegatedauthority from <strong>Council</strong> as specified in the delegations register.
hutt city <strong>community</strong> <strong>plan</strong> 293Part 7 – Remission of WastewaterCharges to SchoolsObjectiveTo provide relief and assistance to educational establishmentsas defined in the Rating Powers (Special Provision for CertainRates for Educational Establishments) Amendment Act 2001in paying charges for wastewater services.Conditions and CriteriaÎÎThis part of the policy will apply only to educationalestablishments as defined in the Rating Powers (SpecialProvision for Certain Rates for Educational Establishments)Amendment Act 2001.ÎÎThe policy does not apply to any school house, or any partof a school used for residential purposes.ÎÎThe wastewater charge to any educational establishmentin any one year will be the lesser of either:(a) The amount of the targeted rate for wastewater,calculated based on the actual number of toilet pansin the establishment.(b) The amount of the targeted rate for wastewatercalculated based on a notional number of toilet pansin the establishment, de<strong>term</strong>ined according to thefollowing formula:ÆÆBased on the establishment’s water consumptionfor the previous financial year, each 200 cubicmetres of water used, or part thereof, shall countas one toilet pan.ÎÎWhere the charge made is based on the notional numberof toilet pans, the amount of the remission allowed willamount to the difference between the calculations setout in a and b above.Part 8 – Remission of Rates andCharges on Land Affected byNatural CalamityObjectiveTo provide relief and assistance to any ratepayer wherethe use that may be made of any rating unit has beendetrimentally affected by erosion, subsidence, submersion,or other natural calamity.Conditions and CriteriaÎÎThis part of the policy will apply to any rating unit affectedby natural calamity.ÎÎIn the case of residential rating units, up to 100% of allrates and charges, including charges made for waterand wastewater services, may be remitted for the periodduring which the buildings are uninhabitable.ÎÎIn the case of all other rating units, up to 100% of allrates and charges, including charges made for waterand wastewater services, may be remitted for the periodduring which the rating unit is unable to be fully utilised,or utilised to the same extent as it was prior to theoccurrence of the natural calamity.ÎÎApplications are required to be made in writing bythe ratepayer.ÎÎApplications will generally only be considered forassistance where the rating unit is uninhabitable orunusable for a period exceeding one month.ÎÎThe application must describe the nature of the naturalcalamity, and outline the steps that the owner has taken,or will be taking, to return the rating unit to a usable state,and provide an estimate of the time the rating unit isexpected to be affected.ÎÎThe amount of remission granted in any individual case willbe de<strong>term</strong>ined based on the severity of the damage to therating unit, as well as the individual circumstances of theratepayer and the financial circumstances of <strong>Council</strong>.ÎÎApplicants for a remission under this part of the policywill also be deemed eligible to be considered for apostponement of rates under the Rates PostponementPolicy. Assistance granted may therefore be in the formof either a postponement or a remission of rates, or acombination of both, whichever is most appropriate inthe individual circumstances.ÎÎAny rates postponed on rating units affected by naturalcalamity may at a later date be considered for a remissionunder this policy, when the full extent and duration of theevent has become more clearly defined.ÎÎAll applications must be made in writing by the ratepayerwithin three months of the event.DelegationsApplications for remission under this part of the policywill be decided by a Committee of <strong>Council</strong>, acting underdelegated authority.
294Corporate Asset Management PolicyPurposeThe intent of this policy is to set out a broad framework for themanagement of <strong>Council</strong> assets, such that <strong>Council</strong> servicesmeet <strong>community</strong> expectations of time, quality and value formoney now and in the future.Corporate FrameworkThe policy reflects <strong>Council</strong>’s vision, <strong>community</strong> outcomesand performance targets as written in the <strong>Long</strong> Term <strong>Council</strong>Community Plan.<strong>Council</strong>’s vision for the <strong>Hutt</strong> <strong>City</strong> <strong>Council</strong> is “A better city,everyday”. <strong>Council</strong> is committed to the continued achievementof this vision and has identified five priority areas and objectivesthat are crucial to the <strong>Hutt</strong> <strong>City</strong> <strong>Council</strong>’s success. These are:Core Servicesand CommunityEngagementStaffGrowth andDevelopmentEnvironmentRegionalCo-operationÎÎDelivering excellent and innovativeservices that provide value for moneyÎÎEngaging with residents to ensure ourkey projects and decisions reflect ourcommunities’ valuesÎÎStaff will have the skills, informationand tools they need to do their jobsÎÎLeading the city’s growth anddevelopment to ensure a vibrantand thriving <strong>Hutt</strong> <strong>City</strong>ÎÎBeing an environmental sustainabilityleader and responding to the changingsocial and economic climateÎÎWorking in partnership with others todeliver shared services and contributeto regional initiativesThe above vision statement and corporate objectives are aboutthe delivery of services to the stakeholders of the <strong>City</strong>. In orderto deliver these services, appropriate and well maintainedassets are necessary. The <strong>Council</strong>’s Asset Management Policywill complement and build upon the LTCCP and through itscontinued implementation and more formalised approach toasset management, principles and methodology, <strong>Council</strong>will achieve the following:ÎÎClear direction and ‘ownership’ of asset management,ÎÎBetter and more informed decision-making by <strong>Council</strong>,staff and the <strong>community</strong>,ÎÎIntegration of resources and knowledge and the abilityto <strong>plan</strong> for present and future generations, includinga more comprehensive approach to risk management,ÎÎA framework to implement continuous improvement inasset management practice,ÎÎEnhanced ability to undertand and meet <strong>community</strong>needs and expectations,ÎÎAchievement of legislative and regulatory requirements.lifecycle asset managemet PolicyUnderstanding Customer ExpectationsÎÎThe <strong>Council</strong> will complete regular customer surveys orsatisfaction surveys in all of their service provision areas tode<strong>term</strong>ine the <strong>community</strong>’s service standard expectations.The Communitrak Survey may be sufficient to fulfil thisrequirement, but asset managers may choose to seekadditional input.ÎÎRegular reports setting out the results of surveys, reviewsand achievement of levels of service etc will be preparedand made accessible to stakeholders.Asset Planning and BudgetingÎÎAll assets will be managed in accordance with theInternational Infrastructure Management Manual publishedby the Association of Local Government Engineering NZInc (INGENIUM) and the National Asset ManagementSteering (NAMS) Group.ÎÎBudget allocations for new capital and cyclic renewals will bemade subject to <strong>Council</strong>’s approval via the LTCCP process.ÎÎAll capital expenditure will be judged on a life cyclecost approach.ÎÎAsset renewal and maintenance programs will be met priorto any new or additional assets being considered exceptwhere such a course of action has been clearly signalledand consulted on through the LTCCP process.ÎÎ<strong>Council</strong> will periodically review all its asset stock andidentify opportunities for asset rationalisation.ÎÎPreventative maintenance programs will be undertakenon all infrastructure and other assets to ensure that thelowest lifecycle cost is achieved and asset servicepotential is optimised.Asset Operations and MaintenanceÎÎMaintenance <strong>plan</strong>s shall be developed for all asset groupsusing asset condition data and shall incorporate a costbenefit approach as appropriate.ÎÎ<strong>Council</strong> will encourage all services to benchmark their assetmaintenance <strong>plan</strong>s and life cycle management techniquesto ensure that the <strong>Council</strong> is adopting best practice.
hutt city <strong>community</strong> <strong>plan</strong> 295Risk Assessment and ManagementÎÎAll staff responsible for and involved in activities associatedwith the management of the <strong>City</strong>’s assets will be trained toan appropriate level to ensure that risk assessmentpractices are applied.ÎÎA risk management strategy is a necessary part of theasset management <strong>plan</strong> for each group of assets andmust be specific to the assets in question. Each managerresponsible for an asset group will annually assess theiroverall business risks and de<strong>term</strong>ine the most appropriatestrategies to manage these.Asset Accounting and CostingÎÎThe <strong>Council</strong> will maintain a detailed register of allowned assets.ÎÎThese assets will be will be revalued at intervals of noless than 5 years.ÎÎEffective useful life (being the lesser of the physical andeconomic life) will be assigned to each of these assets withthe written down value and depreciation value de<strong>term</strong>inedin accordance with the NZ equivalent of the InternationalFinancial Reporting Standards (IFRS)ÎÎDepreciation charges shall be calculated for all assetson an appropriate basis. The basis for de<strong>term</strong>ination ofdepreciation shall be subject to review with the objectivebeing to use a method that best reflects that change inservice potential as a result of consumption of the asset.ÎÎAll costs will be de<strong>term</strong>ined on an accurate accrual basisand any cost subsidies or compliance costs will be clearlydefined and transparent.Asset Management PlansÎÎ<strong>Council</strong> will develop Asset Management Plans for eachgroup of assets. Specifically Asset Management Planswill be prepared for Organisational Assets, Roading,Landfills, Pools, Property, Water Supply, Local Wastewater,Stormwater, Trunk Wastewater, and Parks and Gardens.ÎÎAs far as possible, Asset Management Plans will beconsistent with other <strong>Council</strong> strategies and <strong>plan</strong>ningdocuments. Inconsistencies will be highlighted wherethese are unavoidable. In particular Asset ManagementPlans should demonstrate the links between the AssetManagement Plan, the District Plan, regional growthstrategies and the Sustainability Strategy.ÎÎThe level of sophistication for each Asset ManagementPlan will be commensurate to the value, complexityand criticality of each asset class. However, all AssetManagement Plans will be subject to continuousimprovement.ÎÎStaff responsibilities for Asset Management Plan activitiesshall be included in the Asset Management Plans andalso reflected in individual position descriptions.Asset Management Working GroupÎÎA multi-disciplinary and cross functional Asset ManagementWorking Group will be established to assist with the ongoingreview and improvement of corporate asset management.ÎÎThe asset management working group shall includeManagers with functional responsibility for developmentof the various activity asset management <strong>plan</strong>s, a Financeteam representative and a Strategic Development teamrepresentative.Asset Management Roles andResponsibilitiesTo achieve this policy the following key roles, responsibilitiesand commitments have been identified.<strong>Council</strong>ÎÎTo act as overall stewards for infrastructure assets thatare owned or controlled by <strong>Council</strong>.ÎÎTo set the Corporate Asset Management Policy andvision with linkage to the LTCCP.ÎÎTo approve and review Asset Management Plans.ÎÎTo ensure appropriate resources and funding are provided,to allow services to be delivered and assets maintained,renewed and developed in line with the LTCCP.
296Strategic Leadership Team (SLT)ÎÎTo foster and support the Asset Management Working Group.ÎÎTo ensure that accurate and reliable information is presentedto <strong>Council</strong> for decision-making.ÎÎTo monitor the performance of staff in implementingasset management activities and ensure that staff areappropriately trained in asset management practice.ÎÎTo ensure that the <strong>community</strong> and key stakeholdersinput is incorporated into Asset Management Plans.Asset Management Working GroupÎÎTo implement and continuously review, and wherenecessary recommend changes to, the corporateAsset Management Policy.ÎÎTo develop and implement an asset managementwork<strong>plan</strong> with a view to having all asset management<strong>plan</strong>s reflect the corporate approach by 2011 andthereafter to ensure regular review of all assetmanagement <strong>plan</strong>s (including adherence to levels ofservice and other performance targets).ÎÎTo develop a ‘<strong>community</strong> of asset managementexpertise’ within <strong>Council</strong>. As such, this group will sharelearnings and champion organisational wide assetmanagement <strong>plan</strong>ning. They will also:ÆÆprovide practical advice during the developmentor review of any asset management <strong>plan</strong>, andÆÆencourage continuous improvement, innovationand effective methods to improve assetmanagement practice.ÎÎTo make submissions to SLT on the priority of Capital Worksprojects as part of the annual budget process.ÎÎTo meet monthly, and report to the SLT and to <strong>Council</strong>as required.
hutt city <strong>community</strong> <strong>plan</strong> 297DEFINITIONSThese definitions are intended to define <strong>term</strong>s used in thisCommunity Plan in plain English. For legal definitions seethe Local Government Act 2002.Appropriation/AppropriatedMoney that has been set aside from, or brought into, anoperating or revenue account.AssetSomething of value that <strong>Council</strong> owns on behalf of the peopleof <strong>Hutt</strong> <strong>City</strong>, such as roads, drains, parks and buildings.Asset Management PlanA long <strong>term</strong> <strong>plan</strong> for managing an asset to ensure that itscapacity to provide a service is kept up, and costs over thelife of the asset are kept to a minimum.Capital ExpenditureExpenditure that will increase the value of <strong>Council</strong>’s assets.Capital ValueValue of land including any improvements.Community BoardsLocal elected bodies set up under the Local Government Act.Community boards are consulted by <strong>Council</strong> and can represent<strong>community</strong> concerns to <strong>Council</strong>. <strong>Hutt</strong> <strong>City</strong> <strong>Council</strong> has three<strong>community</strong> boards: Eastbourne, Petone and Wainuiomata.Community CommitteesLocal committees set up by <strong>Council</strong>. Community committeesare consulted by <strong>Council</strong> and can represent <strong>community</strong>concerns to <strong>Council</strong>. <strong>Hutt</strong> <strong>City</strong> <strong>Council</strong> has two <strong>community</strong>committees: Central/West and North/East.Community OutcomeAn outcome for the <strong>community</strong> that is identified as a priority.<strong>Council</strong>-Controlled Organisations (CCOs)Companies in which <strong>Council</strong> is at least 50% shareholder thatindependently manage facilities and deliver services andundertake developments on behalf of the <strong>Hutt</strong> <strong>City</strong> <strong>community</strong>.Where necessary, <strong>Council</strong> funds these organisations.<strong>Council</strong>-Controlled Trading Organisations(CCTOs)CCOs that operate a trading undertaking for the purpose ofmaking a profit.Employee CostsExpenditure on staff. This includes wages, salaries andrelated taxes, training and recruitment costs. Remunerationof elected and appointed representatives is also includedunder this heading.Financial Year<strong>Council</strong>’s Financial Year runs from 1 July to 30 June of thefollowing year.Forecast Financial StatementThis is a ten-year <strong>plan</strong> for <strong>Council</strong>’s revenue and expenditure,cash flows, and borrowing programme.Land ValueValue of land, excluding any improvements.Local Government Act 2002The key legislation that defines the powers and responsibilitiesof local authorities like <strong>Hutt</strong> <strong>City</strong> <strong>Council</strong>.<strong>Long</strong> Term <strong>Council</strong> Community Plan orCommunity PlanA <strong>plan</strong> that describes the activities of the local authority, the<strong>community</strong> outcomes and long <strong>term</strong> focus for the decisionsand activities of the local authority.Maintenance CostsExpenditure in relation to repairs and maintenance of<strong>Council</strong>’s assets.
298Mana WhenuaPeople with the mana of the land.Nga Tekau o Poneke – Wellington Tenths TrustLocal tangata whenua with inherited land ownership inWellington and <strong>Hutt</strong> Valley and kinship to Northern TaranakiTe Atiawa.Operating ExpenditureExpenditure for the normal services of <strong>Council</strong>.Operating ProjectsSignificant projects that do not result in the creation of<strong>Council</strong> assets.Performance MeasureA measure that shows how well <strong>Council</strong> is doing in achievingthe goals it has set for itself.RatesFunds collected by <strong>Council</strong> from levies on property. These arebased on the capital value of the property but the <strong>term</strong> is oftenused to also include Uniform Annual General Charges andTargeted Rates.SignificanceDegree of importance of the issue, proposal, decision ormatter as assessed by the local authority in <strong>term</strong>s of its likelyconsequences for the current and future social, economic,environmental or cultural wellbeing of the <strong>community</strong>.Supplier CostsExpenditure for the purchase of general goods and services.Support CostsThe internal allocation of expenditure incorporated inActivity 18 – Managing Services.TaongaA highly prized resource.Targeted RatesAny rate levied, other than the general rate, which is targetedat users of a service such as water supply, wastewater andthe Jackson Street Programme.Te AtiawaLocal tangata whenua with inherited land ownership andkinship to northern Taranaki Te Atiawa.Te Runanganui o Taranaki Whanui ki te Upoko ote Ika a MauiA representative Maori <strong>Council</strong> made up from local tangatawhenua and representing the eight Taranaki tribes within theWellington region.Te Taurahere o Te AwakairangiThe <strong>Hutt</strong> Valley branch of Te Runanganui o Taura Here ki teWhanganui a Tara which represents 23 tribal groups in thegreater Wellington region.User ChargesIncome to <strong>Council</strong> through fees paid by those who use specificservices provided by <strong>Council</strong>.
hutt city <strong>community</strong> <strong>plan</strong> 299CONTACT DETAILSHUTT CITY COUNCILAddress:Administration Building30 Laings RoadLower <strong>Hutt</strong>Postal Address: Private Bag 31 912Lower <strong>Hutt</strong> 5010Telephone: (04) 570 66660800 HUTT CITYAfter HoursEmergencies:(04) 570 6666 andpress 1 for emergencyInfoLine: (04) 570 6660Facsimile: (04) 569 4290Email:Website:contact@huttcity.govt.nzwww.huttcity.govt.nzWar Memorial LibraryAddress: Cnr Queens Drive & Woburn RoadLower <strong>Hutt</strong>Telephone: (04) 570 6633Eastbourne Community LibraryAddress: Rimu StreetEastbourneTelephone: (04) 562 8042Moera Community LibraryAddress: Cnr Randwick Road & Randwick CrescentMoeraTelephone: (04) 568 4720Naenae Community LibraryAddress: Hillary CourtNaenaeTelephone: (04) 567 2859Petone Community LibraryAddress: Britannia StreetPetoneTelephone: (04) 568 6253Stokes Valley Community LibraryAddress: Scott CourtStokes ValleyTelephone: (04) 562 9050Taita Community LibraryAddress: Taine StreetTaitaTelephone: (04) 567 2767Wainuiomata Community LibraryAddress: Queen StreetWainuiomataTelephone: (04) 564 5822
300MAYOR AND COUNCILLORSNorthern Ward <strong>Council</strong>lorsEastern Ward <strong>Council</strong>lorsMayor David Ogden CA, JP (OCOF)MayorT: 570 6932 (business)E: david.ogden@huttcity.govt.nz<strong>Council</strong>lor Angus Finlayson JP (I)T: 566 5046 (private)F: 566 2082 (private)M: 027 445 3035E: angus.finlayson@huttcity.govt.nz<strong>Council</strong>lor Roger Styles (OCOF)Deputy MayorT: 934 3270 (private)F: 934 3271 (private)M: 027 480 0072E: roger.styles@huttcity.govt.nzKey:(I) Independent(OCOF) Our <strong>City</strong> Our Future(TRW) Team Ray Wallace<strong>Council</strong>lor Gwen McDonaldT: 563 7212 (private)F: 563 6664 (private)563 7212 (business)M: 027 454 0546E: gwen.mcdonald@huttcity.govt.nz<strong>Council</strong>lor Barbara Branch (OCOF)T: 565 3303 (private)E: barbara.branch@huttcity.govt.nz
hutt city <strong>community</strong> <strong>plan</strong> 301Central Ward <strong>Council</strong>lors Western Ward <strong>Council</strong>lors Harbour Ward <strong>Council</strong>lors<strong>Council</strong>lor David Bassett JP (I)T: 566 4929 (private)F: 566 4999 (private)M: 021 135 9391E: david.bassett@huttcity.govt.nz<strong>Council</strong>lor Margaret Cousins JP (I)T: 586 2135 (private)F 586 1046 (private)E: margaret.cousins@huttcity.govt.nz<strong>Council</strong>lor Joy Baird JP (I)T: 568 3225 (private)F 569 3350 (private)M: 027 430 0737E: joy.baird@huttcity.govt.nz<strong>Council</strong>lor Deborah Hislop (I)T: 567 0567 (private)M: 027 457 0567E: deborah.hislop@huttcity.govt.nz<strong>Council</strong>lor Max Shierlaw (OCOF)T: 589 3669 (private)M: 027 260 6852E: max.shierlaw@huttcity.govt.nz<strong>Council</strong>lor Ross Jamieson JP (I)T: 562 7231 (private/business)F 562 7231 (private/business)M: 027 442 7319E: ross.jamieson@huttcity.govt.nz
302COMMUNITY BOARD AND COMMUNITY COMMITTEE MEMBERSWainuiomata Ward <strong>Council</strong>lors<strong>Council</strong>lor Randall Day (TRW)T: 564 9696 (private)F: 564 2411 (private/business)M: 021 231 5279E: randall.day@huttcity.govt.nz<strong>Council</strong>lor Ray Wallace JP (TRW)T: 564 8880 (private)F: 564 8880 (private)M: 027 226 4046 (private/business)E: ray.wallace@huttcity.govt.nzEastbourne Community BoardIan Young (Chair): 562 8622Derek Wilshere (Deputy Chair): 562 7920Sarah Crawford:sarah.crawford@huttcity.govt.nzMurray Gibbons: 562 8567Geoff Rashbrooke: 568 4988Petone Community BoardGerald Davidson (Chair): 938 3723Michael Lulich (Deputy Chair): 977 3166Kelly Barratt: 021 289 0088Mason Branch: 569 1270Richard Cole: 586 1113Vera Ellen: 938 1946Wainuiomata Community BoardMargaret Willard (Chair): 973 1378Terry Stallworth (Deputy Chair): 564 9081Jim Manu: 564 7366Marcia Ngarimu: 564 7706Tracey Pollard: 564 3021Kevin Small: 564 6841Central/West Community CommitteeChristopher Milne (Chair): 586 3890Desiree Mulligan (Deputy Chair): 938 9525Kathryn Fitzpatrick: 586 6075Sue Lafrentz: 567 0856Rick Mooney: 586 1895North/East Community CommitteeLeigh Sutton (Chair): 563 5184Ted Heslin (Deputy Chair): 567 7753Michael Ellis: 577 3877Julie Englebretsen: 563 5179Amanda Woodbridge: 977 6255
hutt city <strong>community</strong> <strong>plan</strong> 303Strategic Leadership TeamTony Stallinger,Chief ExecutiveDDI: 04 570 6773E: tony.stallinger@huttcity.govt.nzStuart Duncan,General Manager Projects/Electoral OfficerDDI: 04 570 6792E: stuart.duncan@huttcity.govt.nzMarty Grenfell,General Manager Community ServicesDDI: 04 570 6878E: marty.grenfell@huttcity.govt.nzMatt Reid,General Manager Business ServicesDDI: 04 570 6781E: matt.reid@huttcity.govt.nzBruce Sherlock,General Manager <strong>City</strong> InfrastructureDDI: 04 570 6833E: bruce.sherlock@huttcity.govt.nzJoycelyn Foo,General CounselDDI: 04 570 6736E: joycelyn.foo@huttcity.govt.nzKim Kelly,General Manager Development ServicesDDI: 04 570 6949E: kim.kelly@huttcity.govt.nz