temperature changes during 1 year in New York - Earth Science Review
temperature changes during 1 year in New York - Earth Science Review
temperature changes during 1 year in New York - Earth Science Review

Create successful ePaper yourself
Turn your PDF publications into a flip-book with our unique Google optimized e-Paper software.
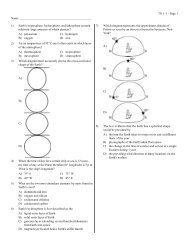
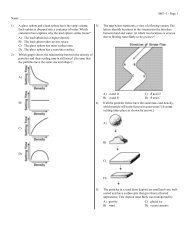
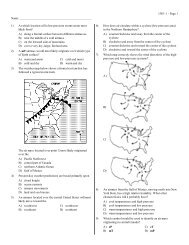
Questions 22 and 23 refer to the follow<strong>in</strong>g:<br />
The diagrams below represent plastic hemisphere models. L<strong>in</strong>es have been drawn to show the apparent path of the Sun across the sky<br />
on June 21 for observers at four different <strong>Earth</strong> locations. The zenith (Z) is the po<strong>in</strong>t <strong>in</strong> the sky directly over the observer.<br />
22) The Arctic Circle has the coolest climate of these four<br />
locations because the Arctic Circle<br />
A) receives the fewest hours of daylight<br />
B) is usually farthest from the Sun<br />
C) receives mostly low-angle, slant<strong>in</strong>g <strong>in</strong>solation rays<br />
D) reflects the least amount of <strong>in</strong>solation<br />
Questions 24 through 27 refer to the follow<strong>in</strong>g:<br />
4364 - 1 - Page 4<br />
23) Which location will experience the shortest duration of<br />
<strong>in</strong>solation?<br />
A) Arctic Circle<br />
B) Equator<br />
C) Tropic of Cancer<br />
D) central <strong>New</strong> <strong>York</strong> State<br />
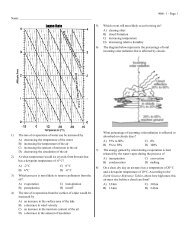
The graph below shows the vary<strong>in</strong>g amounts of <strong>in</strong>solation received at Brockport, <strong>New</strong> <strong>York</strong>, on three different dates under clear or<br />
partly cloudy skies.