06th International Conference on Permafrost - 2 ... - IARC Research
06th International Conference on Permafrost - 2 ... - IARC Research
06th International Conference on Permafrost - 2 ... - IARC Research

You also want an ePaper? Increase the reach of your titles
YUMPU automatically turns print PDFs into web optimized ePapers that Google loves.
PERMAFROSTSixth <str<strong>on</strong>g>Internati<strong>on</strong>al</str<strong>on</strong>g> <str<strong>on</strong>g>C<strong>on</strong>ference</str<strong>on</strong>g>PRQCEEDINGS (Vol. 2)July 5-9, 1993Beijing ChinaOrganized byLanzhou Institute of Glaciology & Geocryology,Chinese Academy of Sciences & Chinese Society ofGlaciology and GeocryologySouth China University of Technology Press
Sixth <str<strong>on</strong>g>Internati<strong>on</strong>al</str<strong>on</strong>g> <str<strong>on</strong>g>C<strong>on</strong>ference</str<strong>on</strong>g> Proceedings <strong>on</strong> <strong>Permafrost</strong> (Vol. 2)Published by South China University of Technology PressI(Wushan Guangzhou China)First Published 1993ISBN 7-5623-0484-X / P 1
PERMAFROSTSixth <str<strong>on</strong>g>Internati<strong>on</strong>al</str<strong>on</strong>g> <str<strong>on</strong>g>C<strong>on</strong>ference</str<strong>on</strong>g>PROCEEDINGS (Vol. 2)
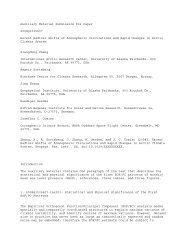
GENERALISED DlSTRlBUTlCOF PERMAFROST IN THENORTHERN HEMISPHEREJ.A. HeginbottomGeological Survey of Canada1992LEGENDExtensive disc<strong>on</strong>tinupermafrost -ISporadic andmountain permafrost
PREFACEAbout <strong>on</strong>e-fifth of the land area of the earth, .A total of 189 c<strong>on</strong>tributed papers are includedis underlain by perennially frozen ground, or ' in first volume of the proceedings which c<strong>on</strong>permafrost.It affects many human activities, tains almost all the papers accepted for prcsencausingunique problems in the envir<strong>on</strong>ment, tati<strong>on</strong> at the paper sessi<strong>on</strong>s. A total number ofecosystem, resource development and c<strong>on</strong>struc- 98 papers, reports and abstracts are included inti<strong>on</strong>s in cold regi<strong>on</strong>s. Since permafrost is a this sec<strong>on</strong>d volume of the proceedings, am<strong>on</strong>gthermal c<strong>on</strong>diti<strong>on</strong>, it is very sensitive towhich <strong>on</strong>e is the reviewed oral presentati<strong>on</strong>changes in climate. Global warming could resultin permafrost degradati<strong>on</strong>, causing resultantecological andsocioec<strong>on</strong>omic c<strong>on</strong>sequences. Thus,permafrost has become more and more Important inpaper writen by G.C. Lewis et al, 9 are invitedpapers presented at the special sessi<strong>on</strong>s, 77are poster papers, 5 are poster abstracts. Theposter papers submitted by Chinese authors andthe development of polar and high altitude M<strong>on</strong>gulian authors are reviewed. Many scientificregi<strong>on</strong>s which occupy key positi<strong>on</strong>s in the global and engineering disciplines were represented,system.It is necessary to give scientists andengineers an opportunity to meet regularly inorder to discuss the state of the art of scienceand technology in their fields, and to gain theimpetus for further work, as well as to comparepermafrost c<strong>on</strong>diti<strong>on</strong>s with other regi<strong>on</strong>s of theworld, particularly regi<strong>on</strong>s where <strong>on</strong>ly seas<strong>on</strong>allyfrozen soils currently exist. The Inrernati<strong>on</strong>al<str<strong>on</strong>g>C<strong>on</strong>ference</str<strong>on</strong>g>s <strong>on</strong> <strong>Permafrost</strong> are organizedto serve this purpose.The First <str<strong>on</strong>g>Internati<strong>on</strong>al</str<strong>on</strong>g> <str<strong>on</strong>g>C<strong>on</strong>ference</str<strong>on</strong>g> <strong>on</strong> <strong>Permafrost</strong>was therefore held in the United Statesat Purdue University. in 1963; the Sec<strong>on</strong>d inYakutsk, Siberia, 1973; the Third in Edm<strong>on</strong>t<strong>on</strong>,Canada, 1978; the Fourth in Fairbanks, Alaska,1983; and the Fifth in Tr<strong>on</strong>dheim, Norway,1988.The Sixth <str<strong>on</strong>g>Internati<strong>on</strong>al</str<strong>on</strong>g> <str<strong>on</strong>g>C<strong>on</strong>ference</str<strong>on</strong>g> <strong>on</strong>Pefmafroat (VI ICOP) was co-sp<strong>on</strong>sored by severalnati<strong>on</strong>al scientific and technical organizati<strong>on</strong>s,and was held under the auspices of the ChineseSociety of Gleciology and Geocryology (CSGG),which is in the Adhering Nati<strong>on</strong>al Body of the<str<strong>on</strong>g>Internati<strong>on</strong>al</str<strong>on</strong>g> <strong>Permafrost</strong> Associati<strong>on</strong> ( IFA,, andwas organized by the Lanzhou Institute of Glaciologyand Geocryology (LIGG), Chinese Academyof Sciences, with the collaborati<strong>on</strong> of theState Key Laboratory of Frozen Soil Engineering.LIGG. The support and the guidance of the<str<strong>on</strong>g>Internati<strong>on</strong>al</str<strong>on</strong>g> <strong>Permafrost</strong> Associati<strong>on</strong> wereextremely important for us in preparati<strong>on</strong> forthe c<strong>on</strong>ference.The VI ICOP was successfully held <strong>on</strong> 5-9July 1993 at Beijfng. China. About 274 parricipants(including 26 accompanyings) from 21countries attended this c<strong>on</strong>ference. Am<strong>on</strong>g them,27 and 22 attendants participated 'in the fieldtrips from Beijing to Lhasa and from Beijing toTianshan Mountain, respectively.The eighth IPA council meeting was heldduring this c<strong>on</strong>ference <strong>on</strong> 5 July 1993, from1950 to 2145, at which new IPA officers wereelected and appointed. They are: President,Cheng Guod<strong>on</strong>g (China): Vice President, Hugh M.French (Canada): Vice-president, Nikolai N.Romanoukkii (Russia), and Secretary General,Jerry Brown (USA).including physics, chemistry and mechanics offrozen soil, geophysics, periglacial geomorphology,soil science, climatology, hydrology,ecology, civil and mechanical engineering. Thehigh quality of the papers was the result ofhard work by the authors, as well as from theassistance given by the Editorial Committee ofthe <str<strong>on</strong>g>Internati<strong>on</strong>al</str<strong>on</strong>g> <strong>Permafrost</strong> Associati<strong>on</strong>, andby the numerous reviewers in the membercountries.Finally, the Chinese Organizing Committeewishes to acknowledge all of you that haveparticipated in the preparati<strong>on</strong> for thisc<strong>on</strong>ference: the authors of the papers, thereviewers, the sp<strong>on</strong>sors, the publisher, and thestaff of many instituti<strong>on</strong>s that have beenworking to make it a successful c<strong>on</strong>ference.Cheng Guod<strong>on</strong>gChairmanChinese Organizing CommitteeSixth <str<strong>on</strong>g>Internati<strong>on</strong>al</str<strong>on</strong>g><str<strong>on</strong>g>C<strong>on</strong>ference</str<strong>on</strong>g> <strong>on</strong> permafrostV
CONTRIBUTING SPONSORSThe Financial Support to the Sixth <str<strong>on</strong>g>Internati<strong>on</strong>al</str<strong>on</strong>g> <str<strong>on</strong>g>C<strong>on</strong>ference</str<strong>on</strong>g> <strong>on</strong> <strong>Permafrost</strong>is mainly c<strong>on</strong>tributed by the following organizati<strong>on</strong>s.GovernmentalCommissi<strong>on</strong> of Nati<strong>on</strong>al Natural Science Foundati<strong>on</strong> of China;Chinese Academy of Sciences;Geography Society of China:South-South Cooperati<strong>on</strong> Fellowship Program, Academia Sinica:China <str<strong>on</strong>g>Internati<strong>on</strong>al</str<strong>on</strong>g> Centre for Yc<strong>on</strong>omic and Technical Exchanges, Ministryof Foreign Ec<strong>on</strong>omic Relati<strong>on</strong>s and Trade.N<strong>on</strong>governmental, ,The First Highway Survey and Design Institute, Ministry .of Communicati<strong>on</strong>;Cold Regi<strong>on</strong>s Development and <strong>Research</strong> Society of China:Central Coal Mining <strong>Research</strong> Institute. Ministry of Coal Mining of China:Heil<strong>on</strong>gjiang Provincial Institute of Water C<strong>on</strong>servancy Science:The First Survey and Design Instittue, Ministry of Railway of China;Heil<strong>on</strong>gjhang Provincial Institute of Cold Regi<strong>on</strong> C<strong>on</strong>structi<strong>on</strong> Science;Heil<strong>on</strong>gjiang Provincial Institute of Communicati<strong>on</strong> Science:Northwest Institute of Railway Science, Ministry of Railway of China:Gansu Provincial Institute of Water C<strong>on</strong>servancy Science:Northeast Survey and Design Instittue, Ministry of Water C<strong>on</strong>servancy:Mining Industry University of China;Inner M<strong>on</strong>ggulia Institute of Water C<strong>on</strong>servancy Science;Jilin Provincial Institute of Water C<strong>on</strong>servancy Science;Heil<strong>on</strong>gjiang Provincial Institute of Low Temp. C<strong>on</strong>structi<strong>on</strong>;<str<strong>on</strong>g>Internati<strong>on</strong>al</str<strong>on</strong>g> Science Foundati<strong>on</strong>.
CHINESE HONORARY COMMITTEE.Chairman: Zhou GuangzhaoPresident of Chinese Academy of Sciences,Academician.Vice-Chairmen: Sun H<strong>on</strong>glie President of Natural Resources Expediti<strong>on</strong>Commissi<strong>on</strong> of China, Academician.Liu D<strong>on</strong>gsheng President of <str<strong>on</strong>g>Internati<strong>on</strong>al</str<strong>on</strong>g> Uni<strong>on</strong> for Quaternary<strong>Research</strong>, Academician.Sun Shu Vice-president of the Nati<strong>on</strong>al Natural ScienceFoundati<strong>on</strong> of China, Academician.Zhu Lilan Vice-president of the State Science andTechnology Commissi<strong>on</strong> of China. Academician.Liu Shu Professor, the State Science and TechnologyAssociati<strong>on</strong> of China.Members: Li JiejunZheng DuLi Yusheng Wang SijingXu ShaoxingCONSULTATIVE COMMITTEE' Chairman: Shi YafengAcademicianVice-Chalrrnen: Dai Moan Vice-Governor of Heil<strong>on</strong>gjiang Province.Yang Shengfu Director of Engineering Administrati<strong>on</strong>,Department of the Ministry of Communicati<strong>on</strong>sof China,Zhang Xiang<strong>on</strong>g Professor, Geology University of China.Members: Zhu XuanDai Dingz<strong>on</strong>g Xu R<strong>on</strong>glieOuyang Ziyuan Xue Shiying Weng ShidaZhang Jiazhen Zhao Chunian Cui ZijiuORGANIZING COMMITTEEChairman: Cheng Guod<strong>on</strong>gVice-Chacrmen: Wu Ziwang Zhou Youvu Yu XiangGe Qihua Zhang JieSeceetary-General: Zhu YuanlinAssociate Secretary-Generals: Xu Xiaozu Chen Xiaobai T<strong>on</strong>g BoliangHuang Yizhi Qiu Guoqing T<strong>on</strong>g ChangjiangEu Zh<strong>on</strong>gweiMembers: Wu Jingming Yu Qun , Liu H<strong>on</strong>gxuHuang Xiaoming Jia Jianhua Zhu QiangDai Huiming Xie Yingqi Xu Bom<strong>on</strong>gLu GuoweiOverseas Members: J. Brown H.M. French N.A. Grave
The reviewof abstracts andmanuscripts forthispre-<str<strong>on</strong>g>C<strong>on</strong>ference</str<strong>on</strong>g> publicati<strong>on</strong> was c<strong>on</strong>ducted underthe supervisi<strong>on</strong> of the Chinese Organizing Cornmitteeand the IPA Editorial Committee. Approximately450 abstracts were received from 24countries. It was necessary to limit the numberof papers from Russia and China. Thesecountries were asked to invite a’ more limitednumber of appropriate papers. A review form wasagreed to and each paper received two or morereviews. Some papors were rejected; in othercases the authors simply did not submit manuscripts.Individuals without papers were encouragedto submit posters and,have their abstractspublished in a post-<str<strong>on</strong>g>C<strong>on</strong>ference</str<strong>on</strong>g> volume.In order to save time and to employ nativelanguages in the reviews, all Chinese andM<strong>on</strong>golianpapers were reviewed in China and allRussian papers were reviewed in Russia, employingthe standard review f<strong>on</strong>n. All Russian andChinese reviewed papers were available inEnglish in August 1992 when members of the EditorialCommittee met in Washingt<strong>on</strong>, D.C., duringthe IPA Council meeting. The papers andreview forms were examined and discussed at thattime, and members of the IPA Council wefe askedto assist with additi<strong>on</strong>al reviews.Reviewofthe 100 n<strong>on</strong>-Chinese or-Russianpapersinvolved reviewers from many of the IPA membercountries. This review process was c<strong>on</strong>ducted bythe Chair, IPA Editorial Committee, in coasultati<strong>on</strong>with members of the Cormnittee. Below isa list of all individuals who provided thesereviews. The IPA Editorial Committee and theChinese Organizing Committee express their appreciati<strong>on</strong>toallthosewhodevotedtheirvaluabletime and expertise to this process. Deservingparticular thanks for their assistance inselecting reviewers and following up with manyof them are Alan Heginbottom, Geological Surveyof Canada; Nikolai Grave and Valery Volgina,Russian Academy of Sciences; Eugene Marvin,Cold Regi<strong>on</strong>s <strong>Research</strong> and Engineering Laboratory,representing the American Society ofCivil Engineers; and John Zarling, Universityof Alaska, representing the Amerkcan Society ofMechanicalEngineers. TheColdRegi<strong>on</strong>s <strong>Research</strong>and Engineering Laboratory is gratefully acknowledgedfor furnishing instructi<strong>on</strong>s, samplesand layout sheets for preparati<strong>on</strong> of finalcamera Copy for the proceedings volumes. Membersof the IPii Editorial Committee are:YerEy Brown, Chair, USAH.M. French, CanadaN.A. Grave, RussiaCheng Guod<strong>on</strong>g, ChinaL. King, GermanyE.A. Koster. The NetherlandsT .L. P&wb, Ex Officio, IPA ExecutiveCommitteeH. J<strong>on</strong>as Akerman, University of Lund, Lund,SwedenD<strong>on</strong>ald Albert, Cold Regi<strong>on</strong>s <strong>Research</strong> andEngineering Laboratory, Hanover, NewHampshire, USABernard AZkire, Michigan TechnologicalInstitute, Hought<strong>on</strong>, Michigan, USADuwayne Anders<strong>on</strong>, Texas A&M University,College Stati<strong>on</strong>, Texas, USA.R<strong>on</strong>ald Atkins, West Leban<strong>on</strong>, New Hampshire,USAAbdul Aziz, G<strong>on</strong>zaga University, Spokane,Washingt<strong>on</strong>, USAT.H.W. Baker, Nati<strong>on</strong>al <strong>Research</strong> Council ofCanada, Ottawa, Ontario, CanadaRichard Berg, Cold Regi<strong>on</strong>s <strong>Research</strong> andEngineering Laboratory, Hanover, NewHampshire, USAPatrick Black, Cold Regi<strong>on</strong>s <strong>Research</strong> andEngineering Laboratory, Hanover, NewHampshire, USAGeorqe BlaisdeJ.1, Cold Regi<strong>on</strong>s <strong>Research</strong> andEngineering Laboratory, Hanover, NewHampshire, USASteven Blasco, Geological Survey of Canada,Dartmouth, Nova Scotia, CanadaJerry Brown, Arlingt<strong>on</strong>, Virginia, USAMargo M. Burgess, Geological Survey ofCanada, Ottawa, Ontario, CanadaChris Eurn, Carlet<strong>on</strong> Univsksity, Ottawa,Ontario, CanadaNe1 Caine, University of Colorado, Boulder,Colorado, USAL. David Carter, U.S. Geological Survey,Anchorage, Alaska, USAEdward Chacho, Yr., Cold Regi<strong>on</strong>s <strong>Research</strong>and Engineering Laboratory, Hanover, NewHampshire, USAEdward Chamberlain, Cold Regi<strong>on</strong>s <strong>Research</strong>bnd Engineering Laboratory, Iianover, NewHampshire, USAIan D. Clark, univer6lty of Ottawa, Ottawa,Ontlrio, CanadaGary Clow, U.S - Geological Sumey, MenloPark, California, USABill C<strong>on</strong>nor, Alaska Department of Transportati<strong>on</strong>and Public Facilities, Fairbanks,Alaska, USAScott Crowther, Crowther Associates, Anchorage,Alaska, USAScott Dallimore, Geological Survey ofCanada, Ottawa, Ontario, CanadaLarry Dingman, University of New Bampshire,Durham, New Hampshire, USAJean-Claude Di<strong>on</strong>ne, Universitb Laval, QuibecCity, Quhbec, CanadaFrancesco Dramis, Universita di Camerino,Camerino, ItalyLarry Dyke, Geological Survey of Canada,Ottawa, Ontario, CanadaRobert Eat<strong>on</strong>, Cold Regi<strong>on</strong>s <strong>Research</strong> andEngineering Laboratory, Hanovex,New Hampshire, USAP.A. Eggint<strong>on</strong>, Geological Survey of Canada,Ottawa, Ontario, Canadavm
, I fDavid Esch, Alaska Department of Transportati<strong>on</strong>and Public Facilities, Juneau,Alaska, USAK,R. Everett, Ohio State University, Columbus,Ohio, USAOscar Ferrians, U.S. Geological Survey,Anchorage, Alaska, USAKaare Flaate, Norwegian Road Administrati<strong>on</strong>,Oslo, NorwayD.C. Foxd, McMaster University, Hamilt<strong>on</strong>,Ontario, CanadaStephen Forman, Ohio State University,Columbus, Ohio, USAHugh M. French, University of Ottawa, Ottawa,Ontario, CanadaMasarni Fukuda, Hokkaido University, Sapporo,JapanJohn R. Giardino, Texas A&M University,College Stati<strong>on</strong>, Texas, USAOdd Gregersen, Norwegian Geotechnical Insti-' tute, Oslo, NorwayGeorge Gryc, U.S. Geological Survey, MenloPark, California, USAWilfried Haeberli, Versuchsanstalt furWasserbau, Hydrologie und Glaziologie,Zurich, SwitzerlandBernard Hallet, University of Washingt<strong>on</strong>,Seattle, Washingt<strong>on</strong>, USAStuart A. Harris, University of Calgary,Calgary, Alberta, CanadaWilliam D, Harris<strong>on</strong>, University oE Alaska,Fairbanks, Alaska, USADavid G. Harry, Enezgy, Mines and Resources,Ottawa, Ontario, CanadaD<strong>on</strong>ald W. Nayley, EEA Engineering C<strong>on</strong>sultants,Ltd., Edm<strong>on</strong>t<strong>on</strong>, Alberta, CanadaBeez Haten, Northern Engineering and Scientific,Anchoxage, Alaska, USAJ. Alan Heginbottom, Geological Survey ofCanada, Ottawa, Ontario, CanadaKaren Henry, Cold Regi<strong>on</strong>s <strong>Research</strong> andEngineering Laboratory, Hanover,New Hampshire, USAChristopher E. Heuer, Exx<strong>on</strong> Producti<strong>on</strong><strong>Research</strong> Co., Houst<strong>on</strong>, TBX~S, USAKen Hinkel, University of Cincinnati, Cincinnati,Ohio, USALarry Hinzrnan, University o€ Alaska,Fairbanks, Alaska, USAFieter Hoekstra, Blackhawk Geosciences, Inc.,Golden, Colorado, USAVincent Janoo, Cold Regi<strong>on</strong>s <strong>Research</strong> andEngineering Laboratory, Hanovef,New Hampshire, USAThomas Jenkins, Cold Regi<strong>on</strong>s RasearchaandEngineering Laboratory, Hanover,New Hampshire, USANil9 Johansen, University of Alaska,Fairbanks, Alaska, USAG.H. Johnst<strong>on</strong>, Ottawa, Ontario. CanadaAlan S. Judge, Geological Survey of Canada,Ottawa, Ontario, CanadaDouglas Kanc, University ot Alaska,Fairbanks, Alaska, .USAB.D. Kay, University of Guelph, Guelph,Ontario, CanadaG. Peter Kershaw, University of Alberta,Edm<strong>on</strong>t<strong>on</strong>, Alberta, CanadaStephen Ketcham, Cold Regi<strong>on</strong>s <strong>Research</strong> andEngineering Laboratory, nanover,New Hampshire, USAJohn Kimble, Soil C<strong>on</strong>servati<strong>on</strong> Service,Lincoln, Ygbraska, USALoren2 Kinq, Justus &iebiq Unlversitat,Gieasen. GermanyEduard Koster, University of Utrecht,Utrecht,, Tho NetherlandsWilliam B. Krantz, University of Colorado,Boulder, Colorado, USARaym<strong>on</strong>d A. Kreig, RA Kreig & Associates,Anchorage, Alaska, USAPave1 J. Kurfurst, Geological Survey ofCaRada, Ottawa, Ontario, CanadaArthur H. Lachenbruch, U.S. GeologicalSurvey, Menlo Park, California, USABranko Ladanyi, Universitb de M<strong>on</strong>trbal,Quibec, CanadaY.P. Lautridou. Centre de Gbomorphologie,Caen, FranceAnt<strong>on</strong>i G. Lewkowicz, Erindale College,University of Tor<strong>on</strong>to, Mississauga.Ontario, CanadaB.H. Luckman, University of Western Ontario,L<strong>on</strong>d<strong>on</strong>, Ontario, CanadaVirgil Lunardini, Cold Regi<strong>on</strong>s <strong>Research</strong> andEngineering Laboratory, Hanover,New Hampshire, USAPhilip Mafsh, Nati<strong>on</strong>al Hydrology <strong>Research</strong>Institute, Saskato<strong>on</strong>, Saskatchewan,CanadaTerry McFadden, University of Alaska, Fairbanks,Alaska, USAJ.D. McKendrick, University of Alaska,Palmer, Alaska, USABrainerd Mears, University of Wyoming, Laramie,Wyoming, USAMichael Metz, GeoTech Services, InC .,Golden, Colorado, USABruce Molnia, U.S. Geological Sumay,Rest<strong>on</strong>, Virginia, USAYoshisuke Nakano, Cold Regi<strong>on</strong>s Resaarch andEngineering Laboratory, Hanover,New Hampshire, USAE.E. Nels<strong>on</strong>, Rutgers University, NewBrunswick, New Jersey, USAJ.F, Nix<strong>on</strong>, Nix<strong>on</strong> Geotech, Calgary, Alberta,CanadaWalter Oechel, San Diego State University,San Diego, California, USAKevin O'Nsill, Cold Regi<strong>on</strong>s <strong>Research</strong> andEngineering Laboratory, Hanover,New Hampshire, USAThomas Osterkamp, University of Alaska,Fairbanks, Alaska, USASamuel 1. htealt, University of Michigan,Ann Arbor, Michigan, USAKim Peters<strong>on</strong>, University of Alaska, Anchorage,Alaaka, USATroy L* P&w&, Ariz<strong>on</strong>a Stace University,Tempe, Ariz<strong>on</strong>a, USAJ.A. Pil<strong>on</strong>, Gaolopical Survey of Canada,Ottawa, Ontario, CanadaWayne Pollard, McGill University, M<strong>on</strong>ttlsl,QuBbec , CanadaVarn Rdmpt<strong>on</strong>, Tarrain Analysis and MappingServices Ltd., Carp, Ontaxio, CanadaW.R. Rouse, McMaster University, Hamilt<strong>on</strong>,Ontario, CanadaFrank Sayles, Cold Regi<strong>on</strong>s <strong>Research</strong> andEngineering Laboratory, Hanover,New Hampshire, USAD.C. Sego, University oil Alberta, Edm<strong>on</strong>t<strong>on</strong>,Alberta, CanadaPaul V. Sellmann, Cold Regi<strong>on</strong>a <strong>Research</strong> andEnginearinq Laboratory, Hanover,New Hampshire, USAEaius Shaver, Marine Biological LabOXatQEy,Woods Hole, Massachusetts, USASally Shoop, Cold Regi<strong>on</strong>s <strong>Research</strong> andEngineering Laboratory, Hanover,New Hampshire, USAXugi Shur, RA~Kroig h Asaociater. Anchorage,Alaska, w?n -
Michael Smith, Carlet<strong>on</strong> University, Ottawa,' Ontario, CanadaC. Tarnocai, Agriculture Canada, Ottawa, Ontario,CanadaRupert G. Tarr, Jr., Golden Associates, Inc.,Anchorage, Alaska, USAJ.C.F. Tedrow, Hutgers University, New Drunswick,New Jersey, USAlloward 'l'homas, America North Inc., Anchorage,AI aska, USAClement Tremblay, Ministry of Trans.port, St. Foy,Qubhec, CnnadaRein Vaikmae, Est<strong>on</strong>ian Academy of Sciences,'l'allir~n. Est<strong>on</strong>iaRohert 0 . Van Everdingen, Arctic Institute ofNorth America, Calgary, Alherta, CanadaRrigittc van VLiet-Lanoe, Centre deGbomorphologie, Caen, FranceTheodore Vins<strong>on</strong>, Oreg<strong>on</strong> State University,Corvallis, Oreg<strong>on</strong>, USAJohn Vitek, Oklahoma State University,Stillwater, Oklahoma, USA1)<strong>on</strong>ald A. Walker, INSTAAR, University ufColurado, Boulder, Colorado, USAJames Walters, University of Northern Iowa,Cerlnr Falls, Iowa, USAI3aolai Wang, University of Ottawa, Ottawa,Ontario, CanadaA. 1,i11coln Washburn, University of Washingt<strong>on</strong>,Seattle, Washing~<strong>on</strong>,.USAKathleen D. White, Cold Regi<strong>on</strong>s <strong>Research</strong> endEngineering Laboratory, Aanover, New Hampshire,US4Sidrrey White, Ohio State Univcrsity, Columbus,Ohio, USAPeter J , Willinms, Carlet<strong>on</strong> University. Ottawa,Ontar io, CnnatlnMing-Ko Woo, McMaster tlniversity, llomilt<strong>on</strong>,Ontario, CanadaJohn Zarling, Iltliversity of Alaska, Fnirbanks,Alaska,. USAHai Ch<strong>on</strong>gyuan, LlCG, Chinese Academy of Sciences,C h i ir nChctr Xiaohai, TJGG, Chinese Academy of Sciences,Ch I riaCIrcng Guotlotlg, LIGG, Chinese Academy ofSciences, ChinaCu Zh<strong>on</strong>gwci, LIGG. Chinese Academy of Sciences,ChinaGun D<strong>on</strong>gxing LIGG, Chinese Acnrlrmy of Sciences,ChinaI, lnng Yizhi, LIGG, Chinese Academy of Sciences,ChinaKang Erst, L I GG, Chinese Academy of Sciences, 'ChinaLi Cuoliang, Northwest Institute of RailwayScience, M i nistry of Railway, ChinsLi Shude, LI c: G, Chinese Academy of Sciences,Chi naLiu l'ieliang, Northwest Institute of RailwayScience, Ministry of Railway, Chinayiu Guoqing, LIGG, Chinese Academy of Sciences,ChinaSheng Zh<strong>on</strong>gyan, LIGG, Chinese Academy ofSciences, ChinaT<strong>on</strong>g Boliang, LIGG, Chinese Academy af Sciences,ChinaT<strong>on</strong>g' Changjiang, LIGG, Chinese Academy ofSciences, ChinaVu Rangjun, LIGG, Chinese Academy of Sciences,ChinaWu Ziwang, LIGG, Chinese Academy of Sciences,ChinaXu Xiaosu, LIGG, Chinese Academy of Sciences,ChinaZ<strong>on</strong>g Zh<strong>on</strong>gg<strong>on</strong>g, LIGG, Chinese Academy ofSciences, ChinaZhang Changqing. LIGG, Chinese Academy ofSciences, ChinaZhou Youwu, LIGG, Chinese Academy of Sciences,ChinaZhu Qiang, Gansu Provincal Ins~itute of Water'C<strong>on</strong>servancy Science, Ministry of WaterC<strong>on</strong>servancy, ChinaZhu Linnan, LIGG, Chinese Academy of Sciences,ChinaZhn Yuanlin, LtFG, Chinese Academy of Sciences,ChinaV'.T. Ralobaev, <strong>Permafrost</strong> InstituLe, Siberiannranch of the Russian Academy of Sciences,Yakutsk, RussiaL.N. Chrustalev, Moscow State University,Moscow, RussiaV.P. Chernjadiev, Institute of EngineeringC<strong>on</strong>structi<strong>on</strong> Survey, Moscow, RussiaG.T. Dubikov, Institute of engineeringC<strong>on</strong>structi<strong>on</strong> Survey, Moscow, RussiaA.D. Frolov, Russian llumanities University,Moscow, RussiaR.U, Genadinnlk, Institute of Cryosphere of theSiberinn Branch of the Russian Academy ofSciences, Tyumen. RussiaN.A. Grave, Russian Nati<strong>on</strong>al <strong>Permafrost</strong>Committee, Russian Academy of Sciences,Moscow, RussiaS.E. Grechishev. Insti~dte of ltyrlrogeology andEngineering Geology, Moscow, RussiaI.E. Gurianov, <strong>Permafrost</strong> Institute, SiberianRranch of the Russian Academy of Sciences,Ynkutak, RussiaI.V. Klimovsky. <strong>Permafrost</strong> Institute, SiberianBranch of llle Russian Academy of Sciences,Yakutsk, RussiaA.A. Msndarov, <strong>Permafrost</strong> Institute, SiberianRranch of the Russian Academy of Sciences.Yakutsk. RussiaN.G. Moskalenko, Institute of Hyrlrogeo ogy andEngineering Geology, Moscow, RussiaA.V. Pavlov. Tnstitutc of Hydrogeology andEngineering Geology, Moscow, Russia0.P. Pavlova, Institute of EngineeringC<strong>on</strong>structi<strong>on</strong> Survey, Moscow, RussiaN.N. Romanovsky, Moscow State Un+versiMoscow. RussiaG,E. Roaenbaum, Moscow State University, Moscow,Russin4.V. Sadovsky, Institute of Basements andUnderground C<strong>on</strong>structi<strong>on</strong>s, Moscow, RussiaN.V. Tumel, Moscow State University, Moscow,RussiaK.F. Voitkovsky. Moscow State University,Moscow, RussiaS.S. Vyalov, Moscow Ensineerlng C<strong>on</strong>structi<strong>on</strong>Institute, Moscow, RussiaYu.K. Zatetsky, Institute "liydroproject."Mo'scow, RuasiaJerry BrownChairman of theIPA Editorial CommitteeZhu YuanlinSecretary-General of theChinese Organizing CommitteeN
Opening Plenary Sessi<strong>on</strong>Closing Plenary Sessi<strong>on</strong>Field Trip A-1 from Lanzhou to Lhasa (July 12-22,1993)Tian Shan Field Trip, A-2 (July 11-18,1993)CONTENTS-<str<strong>on</strong>g>Internati<strong>on</strong>al</str<strong>on</strong>g> <strong>Permafrost</strong> Associati<strong>on</strong> Standing Committees and Working GroupsKcsoluti<strong>on</strong>965971914979983986Special Sessi<strong>on</strong><strong>Permafrost</strong> and Changing ClimateNels<strong>on</strong> F.E., A.H. Lachenbruch, M.K. Woo, E.A. KosterT.E. Osterkamp and M.K, GavrilowPresent Human Induced Climatic Change and CryoecologyGavrilova Maria K.Recent <strong>Permafrost</strong> Degradati<strong>on</strong> al<strong>on</strong>g the Qinghai-Tibet HighwayCheng Guod<strong>on</strong>g, Huang Xiaoming and Kang Xingcheng<strong>Research</strong> <strong>on</strong> <strong>Permafrost</strong> and Periglacial Processes in MountainAreas-Status and PerspectivesHaeberli Wilfried<strong>Permafrost</strong> in the Mountain Ranges of North AmericaHarris Stuart A. and John R. GiardinoMountain <strong>Permafrost</strong> in EuropeKing Lorenz and J<strong>on</strong>as AkermanStudies <strong>on</strong> Mountain <strong>Permafrost</strong> in AsiaQiu GuoqingLinear C<strong>on</strong>structi<strong>on</strong> in Cold Regi<strong>on</strong>s-Paved Roads and AirfieldsVins<strong>on</strong> Ted S.Current Development <strong>on</strong> Preventi<strong>on</strong> of Canal from Frost Damage in PRCChen XiaobaiC<strong>on</strong>tributed Sessi<strong>on</strong>A Model €or the Initiati<strong>on</strong> of Patterned Ground,owing to DifferentialSec<strong>on</strong>dary Frost HeaveLewis G.C., W.S. Krantz and N. CainePoster Sessi<strong>on</strong>Initiati<strong>on</strong> of Segregati<strong>on</strong> Freezing Observed,,in PorousSoft Rock during Melting ProcessAkagawa SatoshiThe Ensuring and Ecological Safety <strong>on</strong> the Gam PipelinesOperating in the <strong>Permafrost</strong> Z<strong>on</strong>eAnt<strong>on</strong>ov-Druzhinin Vitaly P.Engineering and Geocryological Studies of the Central Part OfYamal Peninsula Caused by its DevelopmentRaulin V.V., A.L. Chekhovsky and I.I ChamanovaMethods of Large Scale Ecological and GeocryologicalClassificati<strong>on</strong> of the Northern Part of Western SiberiaChehovsky A.L. and I.I Shamanova98710061010X0141019102210281031103710441050105410601062/I
Experimental Studies <strong>on</strong> Ice Segregati<strong>on</strong> and the Modesof Frost HeavingChen Ruijie and Kaoru HoriquchiThe Relati<strong>on</strong>ship between Ice Intrusi<strong>on</strong> Temperature andC<strong>on</strong>fined PressureChen Ruijie and Kaoru Horiguchi10641067Preliminary Tests of Heave and Settlement of Soils undergoingOne Cycle of Freezing-Thaw in Closed System <strong>on</strong> A Small Centrifuge 1070Chen Xiangsheng. A.N. Schofield and C.C. SmithFrost Susceptibility of Powdered Calcium Carb<strong>on</strong>ateChen Xiaobai. Corte A.E., Wang Yaqing and ShengYuComparis<strong>on</strong> of Two Ground Temperature Measurement Techniques atan Interior Alaskan <strong>Permafrost</strong> Site 1076Collins Charles M.. Richard K. Haugen and Timothy 0. HorriganPreliminary Study <strong>on</strong> the Freezing Point in SoilCui Guangxin and Li YiIO7 31079Calculati<strong>on</strong> of Maximum Thawed Depth of <strong>Permafrost</strong> under theBlack-Colour Pavement Based <strong>on</strong> Geothermal Gradient 1082Cui Jianheng and Yeo Cuiqin)Observati<strong>on</strong> <strong>on</strong> Periglacial Mess Movement in the Head Area ofUrumqi River and Laerd<strong>on</strong>g Pass, Tianshan Mountains 1086, Cui Zhijiu, Xi<strong>on</strong>g Heigang and Liu GengnianL<strong>on</strong>g-Term Shear Strength of Frost-Thaw Transit Z<strong>on</strong>eDing Jingkang, Xu Xueyan and Lou Anjing1092The Compressing Properties and Salt Heaving Mechanism Study ofSulphate Salty SoilFei Xuelipng and Li Bin1096A Computati<strong>on</strong>ally Feasible Reducti<strong>on</strong> of the O'Neill-MillerModel of Sec<strong>on</strong>dary Frost HeaveFowler A.C., G.G. No<strong>on</strong> and W.B. KrantzGeocryology in Mt. TianshanGorbunov A.P.The Freezing and Frost Heave Regularities of Base Soilfor Arbitrary SlopeDirecti<strong>on</strong> and Gradient 1108Guo Dianxiang. Vei Zhengfeng and Ma YijunPeriglacial Period and Pleistocene Natural Envir<strong>on</strong>ment ofWestern Mountains of BeijingGuo Xud<strong>on</strong>gThe Physics of Liquid Water in Frozen Powders and SoilHaiying FU J.G. Dash. L. Wilen and B. HalletAStudy of the Thermal State in the <strong>Permafrost</strong> at theSej<strong>on</strong>g Stati<strong>on</strong>, AntarcticaMan UK and H.C. Sung11001105111311171119Two-Dimensi<strong>on</strong>al Stefan Problem around A Cooled Buried Cylinder1124Haoulani H.. A.M. Cames-Pintaux and J. Aguirre-Puente<strong>Permafrost</strong> Mapping Using Grass 1128Haugen Richard R.. Nancy H. Greeley and Charles M. CollinsCircumarctic Map of <strong>Permafrost</strong> and Ground Ice C<strong>on</strong>diti<strong>on</strong>s 1132Heginbottom J.A., J. Brown, E.S. Melnikov and O.J. Ferrians Jr.<strong>Permafrost</strong>in Greenland Studies1137Henrik Mai and Thorkild ThomsenSnow and <strong>Permafrost</strong> in the Tian Shan Mountains1144Hu Ruji and Ma Hang
Frost-Acti<strong>on</strong> Design and Applicati<strong>on</strong>s of Enlarged TypePile Foundati<strong>on</strong> Bridge in Waterlogged Area of S<strong>on</strong>g T<strong>on</strong>g, Huang Junheng, Xu Zhenghai, Ge Huanyou and ZUO LiThe Shallow Cover Design and C<strong>on</strong>structi<strong>on</strong> Technology ofBuilding Foundati<strong>on</strong>s in Daqing Regi<strong>on</strong>Jiang H<strong>on</strong>gju and Cheng EnyuanThe Preventi<strong>on</strong> 'and Treatment of Frost Damage .<strong>on</strong> Buildingsand Canals in <strong>Permafrost</strong> Regi<strong>on</strong>sJiao TianbaoDeterminati<strong>on</strong> Method for the Coefficient of the Degreeof Sunshine and Sunshade <strong>on</strong> CanalsLi Anguo and Chen QinghuaSimilarity Analysis of Modeling Test of Frozen Soil under LoadLi D<strong>on</strong>gqing and Zhu LinnanAComposite Model of Multiple Acti<strong>on</strong>s for Forming Patterned GroundLi Guangpan and Gao MinC<strong>on</strong>solidati<strong>on</strong> of Deep Layer Frozen Soila in Triaxial TestsLi Kun, Wang Changsheng and Chen Xiangsheng<strong>Permafrost</strong> and Periglacial Landforms in Kekexili Area ofQinghai ProvinceLi Shude and Li ShijieRegi<strong>on</strong>al Features of <strong>Permafrost</strong> in Mahan Mountain and theirRelati<strong>on</strong>ship to the Envir<strong>on</strong>mentLi Zuofu, Li Shude end Wang YinxueA Soluti<strong>on</strong> for the Icing Heave of Foundati<strong>on</strong>s in <strong>Permafrost</strong>Regi<strong>on</strong>s by Lowering the Ground Water TableLiu Shifeng and Zou XinqingThe Geographic Southern Boundary of <strong>Permafrost</strong> in theNortheast of ChinaLu Guowei, Wang Binlin and Guo D<strong>on</strong>gxlngRoad Design and Senovati<strong>on</strong>s of the North Slope in Da Hinggan LingLuo WeiquanPracticeof Reinforced C<strong>on</strong>crete Strip Foundati<strong>on</strong> in <strong>Permafrost</strong> Regi<strong>on</strong>sMen ZhaoheA Microstructure Damage Theory of Creep in Frozen SoilMiao Tiande, Wei Xuexia and Zhang ChangqingThe Paleoclimate Charactersitics in Xinjiang since the Late PleistocenePan AndingThe Introducti<strong>on</strong> of Applicati<strong>on</strong> Methods for CT in Frozen SoilExperimental <strong>Research</strong>Pu YibinPreliminary Data for <strong>Permafrost</strong> Thermal Regime and i ts Correlati<strong>on</strong>' Meteorological Parameters near the Spanish Antarctic Stati<strong>on</strong>Ramos M.An Experimental Study of Canal Lining Prevented from Frost Damageand SeepageRen Zhizh<strong>on</strong>gThe Impact of 'Salt Type <strong>on</strong> deformati<strong>on</strong> of Frozen Saline Soils 'Roman L.T.. Alifanova A.A. end Zhang ChangqingGeophysical Methods of Cryology Ecological ,M<strong>on</strong>itoringSedov B.M. and Yu, Ya. Vaahchilav<strong>Permafrost</strong> in the Selenge River Basin (<strong>on</strong> the M<strong>on</strong>golian Territory). Sharkhuu A.114811521155115911641167117111741178118311861190119311971202120812111215121912221223\
Deformati<strong>on</strong> of Thawing Dispersed Large Detrital Rocks of Cryolite Z<strong>on</strong>eShesternyov D.M.Palsa Formati<strong>on</strong> in the Daisetsu Mountains, JapanS<strong>on</strong>e Toahio and Nobuyuki TakahashiA Study <strong>on</strong> Characteristics of Ice-Damage and Preventi<strong>on</strong> ofHydraulic Projects in North ChinaSu Shengkui and Zhang TiehuaThe Lates Pleistocene Cryomere in the Regi<strong>on</strong> of Kopjes and theBig Mesetas, Patag<strong>on</strong>ia. ArgentinaTromobotto Dario and Bernd SteinSeas<strong>on</strong>al Freezing and Thawing Grounds of M<strong>on</strong>goliaTumurbaatar D.Highwall Stability in Strip Mines in <strong>Permafrost</strong>Vakili JalalDistructi<strong>on</strong> and Rehabilitati<strong>on</strong> of Shaft Lining Used in Frozen ShaftWang Changsheng and Liu RihuiPressure Influence <strong>on</strong> Pore Charactersitic of Frozen SoilsWang Jiacheng, Xu Xiaozu, Deng Yousheng, Zhang,Lixing,IU.P. Lebedenko and E.M. Chuvilin<strong>Permafrost</strong> Change for 'Asphalt Pavement al<strong>on</strong>g Qinghai-Xizang HighwayWang Shaoling and Mi HaizhenA Study <strong>on</strong> Preventing Frost Heave of the Shaft-Type Energy DissipatorWang Shir<strong>on</strong>gField Experiment <strong>Research</strong> of Water and'Heat Transfer within Freezingand Thawing Silt Loam under Fixed Groundwater LevelsWang Yi, Gao Weiyue and Zhang LianghuiThe Effects of Gold Mining <strong>on</strong> the <strong>Permafrost</strong> Envir<strong>on</strong>ment, Wuma MiningArea, Inner M<strong>on</strong>golia of ChinaWaag Yingxue and T<strong>on</strong>g BoliangRecent Discovery of Periglacial Phenomena <strong>on</strong> Tu Wei Ba Shan(Broken Tail Hill) in Zhalainoer, Inner M<strong>on</strong>goliaWang Zhenyi and Lin YipuUniaxial Stress Relati<strong>on</strong> of Frezen LoessWu Ziwang. Ma Wei, Chang Xiaoxiao and Sheng Zh<strong>on</strong>gyanApplicati<strong>on</strong>s of Data Base Technology in Frozen Soil <strong>Research</strong>Xia ZhiyingFrost Heave Properties of N<strong>on</strong>saturated Compacted Cohesive Soiland its Applicati<strong>on</strong> in Winter C<strong>on</strong>structi<strong>on</strong> of Core DamsXie Yinqi and Wang JianguoObservati<strong>on</strong> and <strong>Research</strong> of Sorted Circles in Empty Cirque atthe Head of Urumqi River Tian Shan, ChinaXi<strong>on</strong>g Heigang, Liu Gengnian and Cui ZhljiuStudy and Development of the Techniques against Frost Damage ofHydraulic StructuresXu Bomeng. Li Anguo and Shao LijunUnfrozen Water C<strong>on</strong>tent in Multi-Crystal IceXu Xiaozu. Zhang Lixin. Deng Youbheng, Wang Jiacheng,IU.P. Leb'edehko and E.M. ChuvilinThe Thaw Settlement of Railway Foundati<strong>on</strong>s in <strong>Permafrost</strong> Swamp Regi<strong>on</strong>sYang Hair<strong>on</strong>g. Liu Tieliang and Guan ZhifuThaw-C<strong>on</strong>solidati<strong>on</strong> of Unsaturated Frozen SoilYang Lifeng, Xu Bomeng and Lu Xingliang1227123112351238124212471251125512591262,12651269127212741278128212871292129512981301
Notched Charpy Bar Impact Test <strong>on</strong> Frozen SoilYu Qihao and Zhu Yuanlin<strong>Permafrost</strong> Characteristics and the Exploitati<strong>on</strong> and Utilizati<strong>on</strong>of Ground Water in Hanjiayuan, Da Hinggan Ling, ChinaYuan Haiyi and Liu XuekuiSeas<strong>on</strong>ally Frozen Ground and its Behavior <strong>on</strong> Frozen Heave inthe Yamenzhen Regi<strong>on</strong>, Gansu Province, China ,Yue Hansen and Qiu Guoqing130413081312Culvert Engineering in the <strong>Permafrost</strong> Regi<strong>on</strong> <strong>on</strong> Qinghai-Xizang Plateau 1317Zhang Jinzhao and Yao CuiqinNumerical Analysis of Temperature and Stress <strong>on</strong> the Canal Subsoilduring FreezingZhang Zhao and Wu ZiwangThe Relati<strong>on</strong>ship between the Railway Project C<strong>on</strong>structi<strong>on</strong> andEnvir<strong>on</strong>ment Protecti<strong>on</strong> in <strong>Permafrost</strong> AreaZheng QipuRegularity of Frost Heave of the'seas<strong>on</strong>ally Frozen Soil i nHetao Irrigati<strong>on</strong> Area, Inner M<strong>on</strong>goliaZhou DeyuanFossil Periglacial Landforms in the Shenn<strong>on</strong>gjia Mountains. ChinaZhou Zh<strong>on</strong>gminThe <strong>Research</strong> of Porous Slab Structures for Preventing FrostDamage of RoadsZhu Yunbing and Guo ZuxinDrilling Characteristics of Engineering Geology of <strong>Permafrost</strong><strong>on</strong> Da Hinggan Ling Regi<strong>on</strong>Zou XinqingQuaternary Geology and Geocryology in Northern Quebec, CanadaAllard Michel. Jean A. Pil<strong>on</strong>Rati<strong>on</strong>al Utilizati<strong>on</strong> of Water Resources in <strong>Permafrost</strong> Regi<strong>on</strong>s,Artificial Recharge of Groundwater StorageBurchak T.V. and L.M. DemidyukIce Wedge Development Slopes, Fosheim Peninsula, EllesmereIsland, Eastern Canadian ArcticLewkowicz Ant<strong>on</strong>i G ,Lakes and <strong>Permafrost</strong> in the Colville River Delta, AlaskaWalker H. JesseSorted Circle Dynamics: 10 Years of Field Observati<strong>on</strong>s fromCentral AlaskaWalters James C.Author IndexGeneral Subject - Senior Author IndexList ofparticipants in VI ICOP13211326133013341338134213441344134513451346134713511354
OPENING PLENARY SESSIONTuesday, July 6, J 993ClIRNG GUODONG - Respec-ted Dr. Troy P&w&, l’residentof the <str<strong>on</strong>g>Internati<strong>on</strong>al</str<strong>on</strong>g> <strong>Permafrost</strong> Associati<strong>on</strong>;rcspected Medam Deng Nan, Vic.e President of theState Science R I I ~ Technology Commissi<strong>on</strong> of China:respe.:red Yadam Hu Qiheng, Vice President of thcChinese Academy of Sciences; distinguished delegates,distinguished guests, and ladie’s andgentlemen: Welcome to the formal sessi<strong>on</strong>s of theSixth TnLernati<strong>on</strong>al <str<strong>on</strong>g>C<strong>on</strong>ference</str<strong>on</strong>g> <strong>on</strong> <strong>Permafrost</strong>. Iam Cheng Guodmng, Chairman of the Chinvst: OrganizingCommittee for the C<strong>on</strong>fcrcncc. It gives megreat pleasure tu announce the formal opening ofthe Sixth lnternati<strong>on</strong>al <str<strong>on</strong>g>C<strong>on</strong>ference</str<strong>on</strong>g> <strong>on</strong> Pernafrost.This <str<strong>on</strong>g>C<strong>on</strong>ference</str<strong>on</strong>g> is Organized by the LanzhouInstitutecof Glaciology and Ceocryology w i . ~ h t.hec0llaborati<strong>on</strong> of the State Key Laboratory ofFrozen Soil Fngineering of the 1,anzhou Institute,and the Center for Internatimnal Scieuti I ic.Sxchange of the Chinese Academy of Sciences,under thc auspices of the Chinese Society otGlaciology and Geocryolugy. The society is theAdhering Body for the lnterr~ati<strong>on</strong>al <strong>Permafrost</strong>Associati<strong>on</strong>. On 5ehalC of t.ht!se instituti<strong>on</strong>s,1 have the h<strong>on</strong>our of expressing the warmestwclcome to all parlicipants of this <str<strong>on</strong>g>C<strong>on</strong>ference</str<strong>on</strong>g>.‘Today, T will first introduce the digniLacius atthe fr<strong>on</strong>t tahle :+nd then say a few words ahoutthe <str<strong>on</strong>g>C<strong>on</strong>ference</str<strong>on</strong>g>. This will bc followed by anopening address fl-om the presidellt of thclntcarnati<strong>on</strong>al Perma1 rust Associati<strong>on</strong>.It is my pleasure to introduce t-he pers<strong>on</strong>s atthe fr<strong>on</strong>t tahle. A t my far right is t’rofessrlr7,hu Yuanlin, Secretary general of the <str<strong>on</strong>g>C<strong>on</strong>ference</str<strong>on</strong>g>,and Deputy Directur’ of the State Key I.~bvr-atoryof Frozen Soil Engineering, N e v ~ LO Profcssor%hu is Vr. 7hang Hcngxuan, Vi(’+ Chairman of theCold Regi<strong>on</strong>s Tjevclvpmcnt and I,esearc.h Suciety ofChina. hext. is DI. .Jerry Brown, an oversraymember of (.he 0r.yanizing Committee for thisC<strong>on</strong>fcrcnco and who c<strong>on</strong>trihut.e(l n grc.at amountoi hclp during the preparat.11jn of this C<strong>on</strong>ferencr.Next to Pr. Drown is Academician Shi Yafcng,Chairman of the C<strong>on</strong>sultative Committee for the<str<strong>on</strong>g>C<strong>on</strong>ference</str<strong>on</strong>g>, H<strong>on</strong>orary President of the ChineseSOC iet.y of Glaciology and Geocryology, aIId!lorlorary Direct-or of the Lanzhou Institute ofGlaciology and Geocryology. Next is Dr. HughFrench, the leader of the Canadian Delegati<strong>on</strong>,~11d Dcnn of Science at the University of Ottawa.On my immediate right is Madam Hu Qiheng, Vicc-President of the Chinese Ac-ademy of Sciences.A n d <strong>on</strong> my i.mmediatc left is nr. Troy t’Cw6,President of the Tnternati<strong>on</strong>al <strong>Permafrost</strong> Associati<strong>on</strong>.Next tn Dr. PCwC is Madam Dcng Nan,Vicc President. of the State Sciencc and TechriologyCommissi<strong>on</strong> of Chirla. Her attendance is a veryexc~ting event. Next to Madam Deng is Dr. RossYackay, Secretary General of the TPA, a leadingpermafrost researcher and holder of numeroush<strong>on</strong>ors. Next to Dr. 41eckay is Academici~n TuGunngzhi. Member of the Presidiumof the Chinese Academy of Sciences, Chicfof t.he Divisi<strong>on</strong> of Geoscicnces. Next to AcademicianTu is Ilr. Love1 1, leader of t.he US Delegati<strong>on</strong>,and. the Chairmrrn of the Advis(.)ry Committee<strong>on</strong> Working Croups of the TPA. Next is Dr.Kamensky,leader of t h c Russian Delegati<strong>on</strong>, and Directorof the <strong>Permafrost</strong> 1nst.i tute ot the RussianAcademy 1)f Sciences.Let me turI1 rlow to the C<strong>on</strong>ferencc. Yore than277 research papers and poster papers were submittcd,am<strong>on</strong>g t.hem about 159 rrom overseasscientists and en’gineers irlvolvcd in geocryology,and 124 from Chinese participallts. About 300frozen ground researchers from 22 countries areattending !.his <str<strong>on</strong>g>C<strong>on</strong>ference</str<strong>on</strong>g>. This gives us anopporLurlity to review thc state of our knowledge<strong>on</strong> the subjcct. Me w i l 1 bc able to henelit fromthis opportunity to develop a visi<strong>on</strong> of t.hcfuture for permafrost research and develupmentin the world. I would also I ikc to point outthat many papers have been written primarily hhyoungresearchers; thus it seems that the C<strong>on</strong>ferericrwill achieve <strong>on</strong>e of its primnr) ubjcctives965
'iich is to promote a ncw generati<strong>on</strong> ljf scieqtistsand enginccrs intercstcrl iu geocryology.In this time de havc a many problcms wiLh~puyulaLinn growth, resource dcvcloyments and theproI.ecLiun vf the euv ir<strong>on</strong>ment. Many of our per-mcrrrostregi<strong>on</strong>s are rich in rcnew:+hle and n<strong>on</strong>renewableresources which are rf+guired for thebenefit of t.he human race. To develop thesercsouic.es, we have to c<strong>on</strong>tinually scek L o improvcour engineering dcsign and c<strong>on</strong>struct i<strong>on</strong> techniquesand help promole a clean envir<strong>on</strong>ment. Linkedwit.h this is the realizati<strong>on</strong> that permafrostscience, as the hasic rcscorc.h, involving theorigin, dist.rihuti<strong>on</strong> and nature of permafrost andrelated ficlds such as hydrology are cssential tosound engineering design and clean safe tnvir<strong>on</strong>ment.A t present, c<strong>on</strong>sidcrable attenti<strong>on</strong> basbeen direcLed to c<strong>on</strong>cerns regarding yotent.ia1c.h<strong>on</strong>ges in permafrost. due LC human ac.tivi ties andcarb<strong>on</strong> dioxide-induced c1imat.e warming. We mustremember that the ground is the very foundati<strong>on</strong><strong>on</strong> which thc ocusystems evolve rrnd huwan infrastructuresare built. Climatic warming wi 11change the permafrost terrain, thus changing thevery foundati<strong>on</strong> UT the ecosyst-ems and infrastructures.It is, therefore, clear' Lhat wc are facedwith numerous challenges. To meet these challenges,we need not <strong>on</strong>ly to work hard, hut also to learr.through the experiences of others. For thesereas<strong>on</strong>s, internati<strong>on</strong>al c-<strong>on</strong>ferences and internatiorlalstudies are essential. The lntcrnati<strong>on</strong>al<strong>Permafrost</strong> Associati<strong>on</strong> is thus 3rganizetl toserve this purpose. Let's now call <strong>on</strong> Dr. TroyP&w&, President of the <str<strong>on</strong>g>Internati<strong>on</strong>al</str<strong>on</strong>g> PcrmafrostAssociati<strong>on</strong>.TROY L. PkWk - Thank you Professor Cheng, MadamDcng Nan, Madam Hu Qiheng, distinguished guests,and ladies and gen~lemen: The <str<strong>on</strong>g>Internati<strong>on</strong>al</str<strong>on</strong>g><strong>Permafrost</strong> Associati<strong>on</strong> is most pleased andh<strong>on</strong>ored that the People's Republic of China ishosting the Sixth <str<strong>on</strong>g>Internati<strong>on</strong>al</str<strong>on</strong>g> <str<strong>on</strong>g>C<strong>on</strong>ference</str<strong>on</strong>g> <strong>on</strong><strong>Permafrost</strong>. This marks a turning point in thehistory of IPA. Now each of the founding countrieswill have hosted an Tnternati<strong>on</strong>al Perma-Frost <str<strong>on</strong>g>C<strong>on</strong>ference</str<strong>on</strong>g>.Madam Deng Nan, Madam Hu Qiheng, it is mypleasure to thank you for- the c<strong>on</strong>tinuing interestand su.pyort that your respective organizati<strong>on</strong>s,and your country in general, havc given toresearch and applic.ati<strong>on</strong> of permafrost s~udies,not <strong>on</strong>ly in China, but to internati<strong>on</strong>al cooperati<strong>on</strong>in this field.On behalf of the IPA, I wish to extend ourgreat appreciati<strong>on</strong> to the Chinese Society ofGlaciology and Geocryology and to the LanzhouInst i Lute of Clac iology and Geocryology underwhose auspices and organizati<strong>on</strong> this c<strong>on</strong>ferenceis being held.It has heen ten years since the officialfound irlg of the Tnt-ernati<strong>on</strong>al <strong>Permafrost</strong>. Associati<strong>on</strong>in 1983 at the Fourth <str<strong>on</strong>g>Internati<strong>on</strong>al</str<strong>on</strong>g> C<strong>on</strong>fert.nce<strong>on</strong> l'ermaf rust held at Fairbanks, hleska.Rut it has been 20 years since the idea for aninternati<strong>on</strong>ti1 organizati<strong>on</strong> was advanced by P.I.Melnikov at the Sec<strong>on</strong>d <str<strong>on</strong>g>Internati<strong>on</strong>al</str<strong>on</strong>g> <str<strong>on</strong>g>C<strong>on</strong>ference</str<strong>on</strong>g><strong>on</strong> Permatrost held at Yakutsk, USSR, in 1973.Our internati<strong>on</strong>al activities started with theFirst Intarnatj<strong>on</strong>al <str<strong>on</strong>g>C<strong>on</strong>ference</str<strong>on</strong>g> <strong>on</strong> Pcrmrrfrostheld at I'urdue University, Lafayettc, Indiana,USA, in 1963. IL has been my privilege to participatei n all of Lhe c<strong>on</strong>ferences to date andserve as Vice President of IPA, 1983-1988, andPresident, 1988-1993. Ross Mackay has been ourfoun+ing, hard-working, and guiding SecretaryGeneral for the pi<strong>on</strong>eering 10 years. Ross andI cxtend our heartfelt thanks to the other membersof the Executive CommiLLees who guided theAssociati<strong>on</strong> through thesc early years: P.T.Meln i kov, President, 1983-1988; Kaare Float.e,Vice President, 1983-1988; and Cheng Guod<strong>on</strong>g andV.P. Melnikov, Vice Presidents, 1988-1993. Forthe last fivc years, pcrs<strong>on</strong>nel of the StandingCommittees, Working Groups and Nati<strong>on</strong>al AdheringBodies have greatly aided in the development ofour active organizati<strong>on</strong>.Perhaps it would be well to review progressof the IPA, especially of the last five years.Four of the 20 Adhering Member Countr1.e~ (Canada,China, USA, USSR) were charter members, and theothers joined in the last ten years. Our c<strong>on</strong>stituti<strong>on</strong>and bylaws were formalized in 1988 andrevised in 1993.With a firm early foundati<strong>on</strong>, IPA has underg<strong>on</strong>ean extensive maturing and expansi<strong>on</strong>. TheExecutive Committee and members of the Councilhave met annually: 1988 (Oslo), 1Y89 (Yamburg,Siberia, USSR), 1990 (Quebec City), 1991 (Beijine),1Y42 (Washingt<strong>on</strong>, D.C.) and 1993 (Beijing).The council met in 1990 and 1992. In 1989 TPA wasapproved as an Affiliated Organizati<strong>on</strong> of theTnternati<strong>on</strong>al Uni<strong>on</strong> of Geologioal Sciences (Illcs),<strong>on</strong>e of the largest and most active n<strong>on</strong>-governmentalscientific organizati<strong>on</strong>s in thc world.The establishment and functi<strong>on</strong>ing of StandingCommittees and Wor'king Groups during the lastfive ycars.probably has been the most importantacti<strong>on</strong> of the TPA to date.The 24-page IPA news bulletin, Frozen Ground,has been well-received worldwide since itsinitiati<strong>on</strong> in 1990 when it grcw from the ori.gina1IPA newsletter. Puhlicati<strong>on</strong> is thc courtesy of
the Cold Pegi<strong>on</strong>s <strong>Research</strong> and Engineering 1,abora-Lory, 'lanover, N.Y. USA, and 1600 copies arepr-intell and dist.ributed throughout thc world bythe.~+~Iher ing mcmbers. A pcrmafrost and ground iccmay of thc Northern Ycmispherc is being preparedat :d scalc of 1:10,03O,OOU and will be publishedby thc U.S. Gcological Survey.The Norking (;roups c<strong>on</strong>sI.iI.ute the he;3rL of t.he"act.inn cen~er". Six groups wcre organized in.July 1088 i3nd une j n 1992, and <strong>on</strong>c is in 1993. Itis.a plr;>sur,e trr reyurt tha,t thc Working Groupshuvt. bccn cxccedingly active since their incepti<strong>on</strong>w1t.h flcld symposia <strong>on</strong> various subjects in Switzerland,Rurui;j, United States, Canada, Sweden,Net.hrrl<strong>on</strong>llsr FI ancc, and others; and publicati<strong>on</strong>of sympi~sium rvsults as wcll as bibliographiesand preparati<strong>on</strong> o f ;3 mu1 t.i1 ingucrl glossary.Thc importance of permafrost research irl sciencea r i d engineering is being Inore widely apyrt"Clatvd because of 1nt.ernat.i<strong>on</strong>al C<strong>on</strong>fcrcnces <strong>on</strong>I'ermafrost. sut..h :js this <strong>on</strong>e, as well as activitiesof our liarking Croups, and TPA in general.Past climat PK ~ . w r bc ~ bcttcr understood hy aknowledge o f [tic history of frozen ground, it.s'forrnatio:~ ;311rl degradati<strong>on</strong> over geologic time; abetter undcrst<strong>on</strong>ding of permafrost will permitmore suc.cessfu1 c<strong>on</strong>structi<strong>on</strong> proceduces in polarand mount.ain areas; even a better understandingof t.he envir<strong>on</strong>mcnt of some of the or-her planetswill he pos.;ible btAcausc of our current andfutllre wurk with frozen ground.TII (;I osing, I believe the ful.ure Tor. pcrmafrostresetjrch looks bright. Rest wishes and success,espccially tn he young scientists and engirleersof the world, for- ~:<strong>on</strong>tinued work in the st.urly offrozen grou~~rl.Ill1 QIHENC - Mr. Chairman, larliea and gentlcment,L t is t~ grvat h<strong>on</strong>our for tile t.o be w i t h you atthe Openiilg St.ssL<strong>on</strong> of this c<strong>on</strong>ferer1c.e. On behalf1)l t l l c Chinese Academy o f Scicncc, 1 would like'to wijrmly welcome all of you t.o thc Sixth Lntcrnat11rnaI C<strong>on</strong>fcrcncc <strong>on</strong> PermafrosL and tu exprcssour thanks tu the <str<strong>on</strong>g>Internati<strong>on</strong>al</str<strong>on</strong>g> PermdFrosLAssociatiorl lor guirl~rncc and support of thisCunfcrcnce.it is the first time that this <str<strong>on</strong>g>C<strong>on</strong>ference</str<strong>on</strong>g> ishcld in China sincf its first mceting in 1963.T helieve I~;+I. !.his Cor~leten~e 11111st he veryimportant for Chinvsc gcocryologists in order 110stimulotc intcrnati<strong>on</strong>al cxch<strong>on</strong>gcs irnrl couperali<strong>on</strong>,to ririse thc yositi<strong>on</strong> of Chin;+ i n !.he world andto tuthsr develop the permafrost rcscarch inC h i [I n .Since lOClO's, the Chincsc scicntists hovf: bewdoing deep RII~ wide investigati<strong>on</strong>s <strong>on</strong> scas<strong>on</strong>ally;+nd pernlanently frozen ground, especially <strong>on</strong> thewidely-distributed, high altitude permafrost.Meanwhile, they have made great achievements andc<strong>on</strong>trihuti<strong>on</strong>s to the research <strong>on</strong> frozen soilphysics, mechanics and engineering propertiesand to the design and c<strong>on</strong>structi<strong>on</strong> of engineeringworks in cold regi<strong>on</strong>s. With further developmentof t.he Western and Northeast China, the study <strong>on</strong>fr<strong>on</strong>en soil must play more and mure importantrulc in the ec<strong>on</strong>omic development and relatedc<strong>on</strong>st ruc.ti<strong>on</strong>.Although we have gained great progress in theresearch <strong>on</strong> permafrost, there are still somedisparities compared with developed countries.A t present, the study <strong>on</strong> permafrost has beenclosely related to the glohal climate change andecological and envir<strong>on</strong>mental c<strong>on</strong>diti<strong>on</strong>s. We arehappy to enhance scientific exchange and c-ooperati<strong>on</strong>with the scientists and engineers fromvariuus countries and to accelerate the developmentof permafrost science.Finally, please accept my best wishes for thesuccess of this grand c<strong>on</strong>ference. Thank you foryour attenti<strong>on</strong>.TU GUANGZHl - Ladies and gentlgment, friends andcomradcs, It is my great pleasure to extend toyou a warm wclcume <strong>on</strong> behalf of the Earth Scier1c.e~Divisi<strong>on</strong> of the Chinese Academy uf Sciences.You as scifntists and engineers have gatheredhere from all over the world to attend thc Sixth<str<strong>on</strong>g>Internati<strong>on</strong>al</str<strong>on</strong>g> <str<strong>on</strong>g>C<strong>on</strong>ference</str<strong>on</strong>g> <strong>on</strong> <strong>Permafrost</strong>.Am<strong>on</strong>g the various disciplines of earfh sciences,geocryology <strong>on</strong> the study of permafrcst isa relatively new <strong>on</strong>e, but it has made rapidprogress in recent years. This could be judgedby thc number of papers presented at this c<strong>on</strong>ferencewhich cover a wide area of research. Acasual gl.ance at .these papers would reveal thestr<strong>on</strong>g interest. fowards geocryology from otherbranches of earth sciences.'As an ec<strong>on</strong>omic geolog.ist who is engaged in thestudies of gold rleposits at the present 'time, 1have found that., as is t'te case in Siberia, Canadaand Alaska, the placer gold deposits in China arepreferentially located in regi<strong>on</strong>s of permafrost.T 1 seems probable that gc'ld accumulates Lo formplacer mainly by chemical or biochemical means.This serves a good example of c.luse ties betwccngeocryology <strong>on</strong> the <strong>on</strong>e hand and ore explorati<strong>on</strong>and geochemistry <strong>on</strong> the other.China is a t.hird world country. We need athorough development in science and technology.China could uffer a good oppurtunity and a soundbackground for almost all branches of carthsciences. W e welcome earth scientists from a13
over thc world to IIOIIIC 1.c Chinv to exchungeopini<strong>on</strong>s, scientific achievements an? ideas wi.thus. I do hope our c<strong>on</strong>ference would prove to br~ Bsuccessful <strong>on</strong>e and you will enjoy your stay HLthis c<strong>on</strong>ference and in Chinu as wel.1. Thank you.SHI YAPENG - Ladies and gentlemen, anrl h<strong>on</strong>uureriguests, On behalf of the Chinese Society ofGlaciology anrl Geocryology and the Lanzhou lnstituteof Glaciology and Geocryology (LIGG), ChienseAcademy of Sciences, 1 would like to welcome youtu Rcijing and the Sixth <str<strong>on</strong>g>Internati<strong>on</strong>al</str<strong>on</strong>g> C<strong>on</strong>fererl(e<strong>on</strong> <strong>Permafrost</strong>.1 am especially delighted Lhat this c<strong>on</strong>fcrenc.cis being held for the first time in a developingcountry in Asia.Since 1978 end t.he Third <str<strong>on</strong>g>Internati<strong>on</strong>al</str<strong>on</strong>g> C<strong>on</strong>ferencc<strong>on</strong> <strong>Permafrost</strong> in Edm<strong>on</strong>t<strong>on</strong>, Canada, theChinese permafrost community h8.u I-~een activclyinvalved with the various Tnternatiunal <strong>Permafrost</strong><str<strong>on</strong>g>C<strong>on</strong>ference</str<strong>on</strong>g>s and very interested in the adva~lcesand developments in geocryology all over thcworld.As you all know, ladics and gentlement, Chinahas q l<strong>on</strong>g hisLory, but its permafrost researchis relatively recent. However China is the thirdlargest permafrost country in the world, with 2millian km' of the teritory underlain by permafrost.The inceptj<strong>on</strong> and developments of permafrostscience in China was clusely associatedwith exchanges of scholars with forcign countries.For example, some of the pi<strong>on</strong>eer permafrost scientistsin China were trained S n the formerSoviet Uni<strong>on</strong>. Nowdays, with the increase ofinternati<strong>on</strong>al colleborati<strong>on</strong>, Chinese graduatcs~udents anrl visiting scholars arc sent abroadto learn more about advanced sciencc and technology.These exchange programmes have, in <strong>on</strong>e wayor another, assisted China in keeping pace withthe state-of-the-art of the internati<strong>on</strong>al permafrostand its related sciences. Here, it is,therefore, mort? a.ppropriate them ever to expressmy sincere thanks and appreciati<strong>on</strong> to the hostingcountries and organizati<strong>on</strong>s (institut.es anduniversities), and supervisors of these Chinesescientists.<strong>Permafrost</strong> provides opportunities and challengesfor both engineers and scientists specializingin cold reRi<strong>on</strong>s to cope with variousc<strong>on</strong>structi<strong>on</strong> and geotechnical problems and toreveal the mystery of many periglacia% landformsand processes. We hope, that with the increaseof internati<strong>on</strong>al collaborati<strong>on</strong> and exchanges ofideas and data, more and more features andmysteries in geocryology will be uncovered.I 'd also like to say hnw proud T ;im of thenumber of yartlcipants from thc LIGG. Those ofyou who w'ill be part.icipant.ing i n vne of thetwo field trips will have the occassi<strong>on</strong>,to visit1,atizhou and see € i rst h;1nd the research t-hat. i s<strong>on</strong>going there.T am also very p1east.d to see so many familiarraces avd have so many expert.s from a1 1 ovvr tha22 countries of the world gathering here in Beijingto exchange ideas and discuss researchresults. 1.f the number of participants is anyindicator, we should expect a very rewarding andsuccessful c<strong>on</strong>ference. Ladies and gentlemen,<strong>on</strong>ceagain, welcome to China, welcome to Reijing, andwt'.Icome to> the Sixth <str<strong>on</strong>g>Internati<strong>on</strong>al</str<strong>on</strong>g> C<strong>on</strong>fcrencc <strong>on</strong>PermRTrost.C. WILLlAM LOVELL - Thank you, Mr. Chairman. Onbehalf or t.he 11.S. Committee tor the IPA, the1I.S. Nati<strong>on</strong>al Academy of Scierrc-es, and the manyscientific and engineering specialists for permafrostirr the United States, T bring greetings tothe at-tendances of t.he Six1.h TnLerrlati<strong>on</strong>al Cor]-fercnce <strong>on</strong> <strong>Permafrost</strong>.I had the pleasure of serving <strong>on</strong> the OrkanizingCommittee of the vcry fast ICOP he1.d in 1963at Purdue University in Lafayette, Tndiana, USA.Therefore T can appreciate, in at least a smallway, the enormous efforts of the OrganizingCommittee for the Sixth ICOP, led so ably byCheng Guod<strong>on</strong>g. The c<strong>on</strong>tributi<strong>on</strong>s of the H<strong>on</strong>oraryCommittee, the C<strong>on</strong>sultative Committ'ee and thegovernmental and n<strong>on</strong>govfrnmental sp<strong>on</strong>sors werealso essential.Some 52 U.S. scientists and engineers havetravelled to Reijing tu attend the 6th TCOP andto delivcr 29 papers. I wuuld like to givespecial recognitive to may 10 c-odelegates <strong>on</strong> theU.S. Nati<strong>on</strong>al Academy of Sciences Delegati<strong>on</strong>.They are: Dr. Rernard Hallet, Deputy Chiefr)degat.e, Dr. Roger G. Barry, Mr. George Gryc,Mr. Rupert (:. Tart, Jr., Dr. Chien-Lu Ping,Dr. John P. Zatling, Dr. A.H. Lachenbruch, Dr.Jerry Brown, Dr. Troy L. P&w&, Ms. Sally A.Shoop.We all. anticipate with great pleasure thetechnical, cultural and social associati<strong>on</strong>s thatw i l l result from this c<strong>on</strong>ference. And we greatlyappreciate the many fjne efforts of our Chlnesehosts whi.ch make all of this possible. Thank you.HUGH FRENCH - Mr. Chairman, Mr. President, HuQihene, Tu GuanRzhi, ladies and ~entlemen, Onbehalf of the Nati<strong>on</strong>al <strong>Research</strong> Eouncil ofCanada, and the Canadian permafrost community,968
1 bring greetings from Canada, I bring greetingsnot <strong>on</strong>ly from my colleagues here with me in Rel-,jing, but also from numerous colleagues who wereunable to attend. Our permafrost community coversa widc range of permafrost science and engineeringinterests. They exist at the academic,governmentaland geotechnical (commercial) levels.Canada, like China, is a vast country. UnlikeChina, it <strong>on</strong>ly has a populati<strong>on</strong> of less than 30millian. But, like China, it possess significantand extensive areas underlain by permafrost. Assuch, we have much in commun and much to learnfrom each other as we c<strong>on</strong>tinue to develop ourrespective countries, both materially and c.1-turally.Canada was the bust of the 3rd Tnternati<strong>on</strong>al<str<strong>on</strong>g>C<strong>on</strong>ference</str<strong>on</strong>g> <strong>on</strong> <strong>Permafrost</strong>, held in Edm<strong>on</strong>t<strong>on</strong> in1978. There was a small delegati<strong>on</strong> from China tothat c<strong>on</strong>ference - approximately 10 pers<strong>on</strong>s.Today, as we can see, Chinese permafrost sciencehas grown and prospered, and it is impressive.Equally impressive is the amount of organizati<strong>on</strong>that must go into running a c<strong>on</strong>ference suchas this, planning the technical program, arrangingthe field excursi<strong>on</strong> and local programs, theaccommodati<strong>on</strong> end reglstratl<strong>on</strong>, and the banquetsand recepti<strong>on</strong> is a daunting task. I recognizethis arld thank you, Mr. Cheng, and your collea-'gues for the opportunity t3 benefit from thisc<strong>on</strong>ference.Therefore, <strong>on</strong> behalf of all Canadians present,and numerous others who are unable to be here,I extend my greetings and offer you my bestwishes for a most successful and productivec<strong>on</strong>ference in an atmosphere of cordlalily andfriendship.R.M. KAMENSKY - Mr. Chairman, ladies and gentlemen, dearfriends and c.olleagues, On behalf of the Russian delegati<strong>on</strong>I greet you cordially at the VI <str<strong>on</strong>g>Internati<strong>on</strong>al</str<strong>on</strong>g><str<strong>on</strong>g>C<strong>on</strong>ference</str<strong>on</strong>g> <strong>on</strong> <strong>Permafrost</strong>. We are gathered here in Reijingto extend our knowledge of permafrost gained during thepast five years and discuss the strategy of furtherresearch am<strong>on</strong>g internati<strong>on</strong>al community of permafrostresearchers. I am happy to say that during the lastyears internati<strong>on</strong>al cooperati<strong>on</strong> has strengthened instudyi.ng permafrost. For example, the <strong>Permafrost</strong> Instituteof the Russia11 Academy Sciences of is c<strong>on</strong>ductingJoint work with the Japanese scientists. We work inclose cooperati<strong>on</strong> with Chinese scientists. Thus, a jointRussian-Chinese expediti<strong>on</strong> worked <strong>on</strong> the Tien-Shan tostudy alpine permafrost. It resulted in joint publicati<strong>on</strong>printed at the <strong>Permafrost</strong> Institute. We have brought thecopies to Beijing and they are available for purchase.We are c<strong>on</strong>ducting research in cooperati<strong>on</strong> with twoinstitutes in Kharbin, China, in the field of permafrostengineering. In Sept. 1993 an internati<strong>on</strong>al workshop <strong>on</strong>!'rotecti<strong>on</strong> of Engineering Structures from Frost Heavewill be organized jointly with them. We hope that the<str<strong>on</strong>g>C<strong>on</strong>ference</str<strong>on</strong>g> in Beijing will be successful. We are gratefulto the Organizing Committee, our colleagues in the LanzhouInstitute of Glaciology and Geocryology for inviting11s to the <str<strong>on</strong>g>C<strong>on</strong>ference</str<strong>on</strong>g> and for warm hospitality. Thankyou.JERRY BROWN - It is an h<strong>on</strong>or and a pleasure tomeet you here today and to have served as anoverseas member of the Organizing Committee. Onbehalf of the many countries and individualsparticipating in the c<strong>on</strong>ference, I extend ourcollective appreciati<strong>on</strong> to the Chinese OrganlzingCommittee and sp<strong>on</strong>sors for hosting and organizingthe VICOP. In additi<strong>on</strong> to those attending thec<strong>on</strong>ference in Beijing, there are many Individualswho assisted us, but were unable to attend.%These include authors and reviewers of papers.In my role as Chairman of the IPA Editoral Committee,1 wish to extend special appreciati<strong>on</strong> tothe c<strong>on</strong>ference General-Secretary, Professor ZhuYuanlin and his colleagues for organizing thec<strong>on</strong>ference publicati<strong>on</strong>s. The prec<strong>on</strong>ference proceedingsvolume is a major accomplishment and itwill c<strong>on</strong>vey the results of the c<strong>on</strong>ference to thescientific and engineering commanities throughoutthe world.Finally, Secretary General Robin Brett of the<str<strong>on</strong>g>Internati<strong>on</strong>al</str<strong>on</strong>g> Uni<strong>on</strong> of geological Sciences, theparent organizati<strong>on</strong> of the IPA, has extended hisbest wishes to Professor Cheng Guod<strong>on</strong>g for asuccessful c<strong>on</strong>ference. I also wish the c<strong>on</strong>ferencegreat success and thank the organizirs andsp<strong>on</strong>sors in their c<strong>on</strong>tributi<strong>on</strong>s to the advancementof permafrost science and engineering.Thank you.ZBANG HENGXUAN - Ladies and Gentlemen, It is agreat event in the sci.entific world of the coldregi<strong>on</strong> countries that the remarkable 6th <str<strong>on</strong>g>Internati<strong>on</strong>al</str<strong>on</strong>g><str<strong>on</strong>g>C<strong>on</strong>ference</str<strong>on</strong>g> <strong>on</strong>-<strong>Permafrost</strong> is opening inBeijing, the capital city of China. On this,occasi<strong>on</strong> and <strong>on</strong> behalf of the Cold Regi<strong>on</strong> Developmentinstitute of China, I would like to givesincere c<strong>on</strong>gratulati<strong>on</strong>s to the c<strong>on</strong>ference, andwarm welcome to the scientists from differentparts of the world.With the advance of cold regi<strong>on</strong> development,the study <strong>on</strong> frozen earth has become more andmore important. The <str<strong>on</strong>g>Internati<strong>on</strong>al</str<strong>on</strong>g> <str<strong>on</strong>g>C<strong>on</strong>ference</str<strong>on</strong>g> <strong>on</strong>964
~ of'<strong>Permafrost</strong>,which is held every five years, hasprovided the scientists and engineers with anopportunity for regular c<strong>on</strong>tacts and exchangesof experience, to discuss the curr'ent status andthe future of research <strong>on</strong> frozen ground. Thisindicates that the research and development offrozen ground has opened a new road for themankind to make use of frozen ground and overcomethe damage caused by the frozen earth. Ibelieve that the 6th <str<strong>on</strong>g>Internati<strong>on</strong>al</str<strong>on</strong>g> <str<strong>on</strong>g>C<strong>on</strong>ference</str<strong>on</strong>g> <strong>on</strong><strong>Permafrost</strong> will record a new chapter in theworld history of frozen ground research..The Cold Regi<strong>on</strong> Development Institute ofChina is an academic organizati<strong>on</strong> which c<strong>on</strong>sistsexperts, scholars and leading officials. Itaims at the research work of cold regi<strong>on</strong> developmentand the promoti<strong>on</strong> of ec<strong>on</strong>omic and technicalcooperati<strong>on</strong> will greatly promote the cooperati<strong>on</strong>will greatly promote the cooperative developmentof the internati<strong>on</strong>al r-ld regi<strong>on</strong>s. Amajor event will he held in ,anuary, 1994 inHsrbin to celebrate the 10th anniversary of theIce and Snow Festival and the 20th anniversaryof Ice-Lzntern Snow. At the same time, we w i l lhold the <str<strong>on</strong>g>Internati<strong>on</strong>al</str<strong>on</strong>g> <strong>Research</strong> <str<strong>on</strong>g>C<strong>on</strong>ference</str<strong>on</strong>g> <strong>on</strong>the Development of Tce and Snow Culture. Thec<strong>on</strong>ference will not <strong>on</strong>ly activate and enrich theartistic and cultural life of the people in coldregi<strong>on</strong>s, but also promote the regi<strong>on</strong>al developmentas well as tourism, trade, ec<strong>on</strong>omic andtechnical exchange and coo?erati<strong>on</strong> and friendlyrelati<strong>on</strong>s between different parts of the world.Experts and scholars are welcome to come to themeeting.During the course when the world ec<strong>on</strong>omy isbecoming more and more internati<strong>on</strong>alized, modernizedand divided into groups, the developmentand cooperati<strong>on</strong> between internati<strong>on</strong>al regi<strong>on</strong>sare given more anti more attenti<strong>on</strong> by many countriesand regi<strong>on</strong>s. The development of the countriesand regi<strong>on</strong>s in the cold area is c<strong>on</strong>strainedby adverse natural envir<strong>on</strong>ment, which set manynegative c<strong>on</strong>diti<strong>on</strong>s for their ec<strong>on</strong>omic development.We must combine different forces, toc<strong>on</strong>vert the adverse c<strong>on</strong>diti<strong>on</strong>s into favorable<strong>on</strong>es. We will do our best to create a comfortableenvir<strong>on</strong>ment and land for the people to live andwork. We wish the c<strong>on</strong>ference a success. We hopeyou enjoy your stay in Beijing. Thank you.ZHU YIJANLIN - Dear Chairmen, ladies and gentlemeniT am very glad to be with you here attendingthe Sixth <str<strong>on</strong>g>Internati<strong>on</strong>al</str<strong>on</strong>g> <str<strong>on</strong>g>C<strong>on</strong>ference</str<strong>on</strong>g> <strong>on</strong> <strong>Permafrost</strong>.On behalf of the State Key Laboratory of FrozenSoil Engineering, the Lanzhou Institute ofGlaciology and Geocryology, Chinese Academy ofSciences, I would like to express a warm welcometo all of you for attending this c<strong>on</strong>ference.Our State Key Lahoratory of Frozen Soil Engineeringis a new and modern laboratory equippedwith various kinds of test equipment and devicesand living accommodati<strong>on</strong>s. It is <strong>on</strong>e of the bestcold regi<strong>on</strong>s science laboratories in the world,and is open to the world.Scientists and engineers, especially youngpromising rcsearchera are encouraged to apply toour Laboratory Science Foundati<strong>on</strong> and do researchwork at our Laboratory. We would like to inviteYOU to visit our Aaboratory after this c<strong>on</strong>ference,I hope this c<strong>on</strong>ference will turn out to be asuccessful c<strong>on</strong>ference. And I wish all of youhave a good time during the c<strong>on</strong>ference, goodtime as Reijing and gopd time in China. Thankyou for your attenti<strong>on</strong>.970
CLOSING PLENARY SESSIONFriday, July 9, '1993CHENG (:IJODO!JC, - T,adies and gentlemen. Wclcomf tothe final formal scssi<strong>on</strong> of the Sixth <str<strong>on</strong>g>Internati<strong>on</strong>al</str<strong>on</strong>g><str<strong>on</strong>g>C<strong>on</strong>ference</str<strong>on</strong>g> <strong>on</strong> <strong>Permafrost</strong>. We have bcenmecting here in Beijing for the past five days.to freely exchange ideas and knowledge, discussjoint studies, develop friendship. Now wegathered for a few ilems of business. T wouldlike to thank all of you, <strong>on</strong> hehalf of theChinese Organizing Committee for attending the<str<strong>on</strong>g>C<strong>on</strong>ference</str<strong>on</strong>g>. I am sure you all agree that thec<strong>on</strong>ference has been extremely beneficial 6o allof you.Now 7 would first like to call <strong>on</strong> ProfcssorAlbert Pissart to read the necrology.!de will hear now from Professor 'Troy P&w&.Under his very capable leadship and yuirlarlce,the TPA and c<strong>on</strong>tinuing development of permafrostscience and enginecring have heen internati<strong>on</strong>allyassured. Professor PbwB was giver) special recogniti<strong>on</strong>by the University of Alaska in lY91, whenhe receive an h<strong>on</strong>orary degrec of Doctor ofScience. Such an award is the highest tribute aUniversity can c<strong>on</strong>vcy to a distinguished individual,and i n his case recognized his major c<strong>on</strong>tributi<strong>on</strong>to the understanding of Alaska, geologyand his internatioual lcadership in permafrostresearch. Jn additi<strong>on</strong> to the h<strong>on</strong>ors bestuwcd <strong>on</strong>him by the I:nivers-ity, the State of Alaska'slcgislature gave him an official cert-ifjcaterccognizing his year's of dedicati<strong>on</strong> to theDniversity of Alaska and its st.udents, as wellas his nllmrrous accomplishmer1ts associated withpermafrust rcscarch in Alaska and world wide.It's my pleasure, <strong>on</strong> hehalf of the IPA and t.heChinese Organizing Committee to present him agift in h<strong>on</strong>or of Profcssor Pew& for tlis tremcndousc<strong>on</strong>tributi<strong>on</strong>s to the IPA and pcrmafrostresearch.Next, 1 would like to call <strong>on</strong> Professor RossMackay. As a Secretary General he has made tremendousr-<strong>on</strong>tribuLlorrs to the TPA. Besides, ht.remains our mos't productive permafrost scientist,and spent more timc! in the field since hisretiryment than many w i l l in their entire lives.The award of Lhe 1991 Logan Medal signi firs thesubstance and leadership of his research. !lismost recent work <strong>on</strong> thermal c<strong>on</strong>tracti<strong>on</strong> c.rac.kingprovides a remarkable synthesis of detailed' field obscrvati<strong>on</strong>s and the theory of crack propagati<strong>on</strong>in solids. It is my h<strong>on</strong>or <strong>on</strong> behalf ofthe Chinese Organizing Committee to presentProfessor Mackay a gift in h<strong>on</strong>or of his lifetime dedicati<strong>on</strong> to permafrost research and tothe IPA and with our sincere good wishcs.Let me try to explain the meaning of thc gift.,This is a Chinese character which means l<strong>on</strong>gevity.Tn China, crane also symbolizes l<strong>on</strong>gevi t.y,and the old man is R l<strong>on</strong>g-1 i ved man. So we wishPruf. Mackay a l<strong>on</strong>g, l<strong>on</strong>g life.We w i l l now have a fcw closing remarks fromthe leaders of the delegati<strong>on</strong>s, we will hearfirst from Dr. Lovell, representing the IISDelegati<strong>on</strong>.Next., lct.'s call <strong>on</strong> l'rofessor French, representingthe Canadian Dclcgati<strong>on</strong>.Out ncxt speaker is Dr. Kamensky, representingthe Russ i.an Del cgatiun.I would like now call <strong>on</strong> Acadcmician Shi Ya-Feng, representing Chinese Delegati<strong>on</strong>.Now, we w i l l hear from members of the new Il'AYxecutive Committee. Firstly, I would like tr)take this opportunity to express my he:
turn sc.r ve the r~eeds of ail pcoplc. 1,lr s~ientlsts:and er~y,ineers must join our mirlds and hands toexl~lr~re the sccxcta o f scie~ce and opcn newrvalms oi I-ivili~ati<strong>on</strong> tor thc comm<strong>on</strong> progressof rnarlk inil. 'The IPA shuulrl 1)romot.e this kinrl oruni<strong>on</strong> in the fteld of Gcocrynlugy. To reach thisgoal we sti II h.ive a l<strong>on</strong>g way tu xu, and arcfaceil with numer~o~~s challenges, which aretcchnulugic, scientific nrtd social in nature.Iiut wt! w ~ l do l our br.st 1.0 meet the challenges,to turthcr ;+I 1 research in yervlnrrost.Now T would like tu !.all. <strong>on</strong> I'rofcssor HughT:r.er~
1encouraged our Russian colleagues to c<strong>on</strong>siderthe establishment of R data subccnter' forpermafrost and ground ice. Wc heard plans forthe 1998 c<strong>on</strong>ference in Carrada and encouragedour European collecrgues to begin planniug forthe eighth c<strong>on</strong>ference in 2003 i n Europe. Overthe next five years I will be in c<strong>on</strong>t,act withmany of you and hope to learn of you activitiesfor reporting in Frozen Ground. For t.hose ofyou going <strong>on</strong> the post-c<strong>on</strong>ference field tripsI wish you success and for those of you retu'rninghome, have a safe journey. Thank you and Ihope to see you all in 1998.' 973
FIELD TRIP A-1 FROM LZUJBHOU TO LHASA(JULY 12 - 22, 1993)Following the VIth <str<strong>on</strong>g>Internati<strong>on</strong>al</str<strong>on</strong>g> <str<strong>on</strong>g>C<strong>on</strong>ference</str<strong>on</strong>g><strong>Permafrost</strong> in Beijing, two technical field tripsdeparted for Lanzhou and Urumqi. About 20 membersof the c<strong>on</strong>feFence and ten accompanying Chineseguides and support pers<strong>on</strong>nel took part in thepost-c<strong>on</strong>ference field trip to the Qinghai-Tibet-Plateau, the "Roof of the World". During the sixdaybus trip and over 2000 km from Lanzhou toLhasa (cp. Figure 1), the field trip permittedthe participants to observe selected perigladial,glacial and permafrost sites <strong>on</strong> the plateau.During this short period we gained an impressi<strong>on</strong>of the characteristic permafrbst and permafrostrelated phenomena, of the distinctivegeoecologiCal and biological z<strong>on</strong>ati<strong>on</strong> of thisregi<strong>on</strong> as well as of, the local people, theirliving c<strong>on</strong>diti<strong>on</strong>s in and adapti<strong>on</strong>s to this uniqueenvir<strong>on</strong>ment.JULY LO AND 11; LANZHOULocal sightseeing and city excursi<strong>on</strong>Visit to the State Key Laboratory of FrozenSoil Engineering, Lanzhou Institute of Glaciologyand Geocryology (Figure 2).An evening banquet prepared by the staff ofLIGG (Figure 3) highlightened the visit.JULY 12: LANZHOU - OXNGHAI LAKE VIA XININGFigure 1: Route mapThe route led through an impressive loesslandscapewhich is characterized by linear downcuttings.Xiqing City (2275 m a.s.1.) with about570.000 people is located in the northeasternpart of the Qinghai-Tibet-Plateau. The Qinghai-Tibet-Highway begins at Xining and ends after adistance of 2000 km in Lhasa.There was a visit and photo stop at the TaerTemple about 30 km southwest of Xining. TheGelupa m<strong>on</strong>astary is <strong>on</strong>e of the most importantLama m<strong>on</strong>astaries in modern China.After having passed an agriculturaly dominatedlandscape of extended fields of rape and corn andpastures we arrived at the hotel at the QinqhaiLake (3194 m), China's largest salt water lake.974
Sand dunes at Xidatan <strong>on</strong> the.valley bottom forma large chain of active crescent sand dunes of 'local Quaternary deposits. In the 1970s threedunes moved over the old highway at an elevati<strong>on</strong>of 4350 m a.s.1..Overnight in Nachitai Military Depot at3550 m a,s.l..JULY 17: NACHITAI TO WD%O~,IANGAfter crossing*the Kunlun Mountains Pass(4776 m) in the mid-secti<strong>on</strong> of the Eastern KunlunMountains the open plateau was reached.Near by the pass a large open-system pingo whichdeveloped during the Pleistocene wag visited(Figure 7). Recent climatic c<strong>on</strong>diti<strong>on</strong>s in thearea: mean annual air temperature is below - 5'C,yearly precipitati<strong>on</strong> is at least 280 mm and thewinterfrost lasts about 7-8 m<strong>on</strong>ths.The descGnding to 4500 m a,s.l., which is thealtitude of most parts of the plateau, the regi<strong>on</strong>is characterized by smooth depressi<strong>on</strong>s. Damage tothe road is mainly caused by the melting ofground ice.Al<strong>on</strong>g the Qingshui River permafrost thicknessis 10-50 m. Numerous thermokarst lakes of varyingsize and form, the largest being several squarekilometers, and pingos are present.The Wudaoliang Basin has permafrost thicknessof 30-60 m.The H<strong>on</strong> Xi1 <strong>Permafrost</strong> Observati<strong>on</strong> Site ismainly used to study the effects of vegetati<strong>on</strong> <strong>on</strong>the ground temperature regime and the permafrostformati<strong>on</strong>.Overnight at the Wudaoliang Military Depot(4700 m a.s.1.).JULY 16: GOLMUD TO NACHITAXThe Qinghai-Tibet Highway crosses the KunlunMountains, the high plains around the YangtseRiver, the Tanggula Range and the plateau basinregi<strong>on</strong> of northern Tibet. <strong>Permafrost</strong> underlies800 km al<strong>on</strong>g the excursi<strong>on</strong> area. On the firststage of the travel, the wide valleys of GolmudRiver and its tributaries, large dilluvial fansand prominent moraines in the river valleys areobserved.Between 4150 and 4200 m a.s.l., in the uppecpart of Golmud River Valley and Xidatan Valley, afault block valley 150 km from Golmud, permafrostis disc<strong>on</strong>tinuous with a mean annual groundtemperatures of 0.1 to 1.o'c.The northern lower limit of c<strong>on</strong>tinuouspermafrost was reached at about 4350 m a.s.1..<strong>Permafrost</strong> is c<strong>on</strong>tinuous in a distance of 550 kmfrom 4350 m <strong>on</strong> the north slope of the KunlunMountains southwards to Amdo <strong>on</strong> the southernslopes of the Tanggula Mountains.From Xidatan Valley two moraines of the lastglaciati<strong>on</strong> are seen 4400 at m and 4300 m <strong>on</strong> thenorth-facing slopes of East Kunlun Nountains. Anouter end moraine with an extensi<strong>on</strong> of about10 km is developed al<strong>on</strong>g the south side of thevalley. From the highway can be seen various18: WUDAOLIANG m,,TANGGULA MITaTTARY DEPOTperiglacial phenomena such as rock glaciers above4900 m a.s.1. to the northwest of the KunlunThe mean altitude from Wudaoliang towards thePass, detritus slopes, soliflucti<strong>on</strong> slopes at ,Tanggula Mountains is slightly above 4700 m.4520 m a.s.1, and pingos.Photo stop at sand erosi<strong>on</strong> slumpings, a specialA ground temperature observati<strong>on</strong> field of the kind of thermoerosi<strong>on</strong> in the wind blown sandLanzhou Institute of Glaciology and Geocryology depositi<strong>on</strong> area of the plateau. The slumpingwas visited.976
c<strong>on</strong>sists of loose paleo-windblown deposits suchas fine-grained sand, silt and clay. The sparse -vegetati<strong>on</strong> c<strong>on</strong>sists of traces of pastures. Theice c<strong>on</strong>tent of the permafrost in these layers wasestimated to be 30%, a value questi<strong>on</strong>ed by someof the participants as being too low.Visit to the Fenghuoshan Observati<strong>on</strong> Stati<strong>on</strong>(Figure E ) , where the most intensive permafroststudies of the Qinghai-Tibet-Plateau are carriedout. It is a major test facility and was used bythe Northwest Branch of the China Academy ofRailway Science for testing embankments and pilesin anticipati<strong>on</strong> of a railroad across the Plateau.The stati<strong>on</strong> also has <strong>on</strong>going l<strong>on</strong>g termtemperature records.After crossing Tanggula Pass, which representsthe border between Qinghai Province and Tibet,the North Tibetan Plateau was entered. It is opento the south-west m<strong>on</strong>so<strong>on</strong> which causes anincrease in the annual temperature andprecipitati<strong>on</strong> compared with the northern Qinghai-Tibet Plateau. Due to desqending altitude thec<strong>on</strong>tinuous permafrost is gradually replaced bydisc<strong>on</strong>tinuoup, sporadic and island permafrost.The limit between c<strong>on</strong>tipuous permafrost andislano permafrost runs near highway milest<strong>on</strong>e116, north it is c<strong>on</strong>tinuous and south it occursas island permafrost.overnight in Nagqu (4507 m a.s,l.) an importantcity in the eastern part of the plateau basinregi<strong>on</strong> of Northern Tibet.JULY 20 : NAGQU TO LHASAVisit to an explosive seas<strong>on</strong>al frost mound inthe intersecti<strong>on</strong> z<strong>on</strong>e between the NW strikingcompressi<strong>on</strong> torsi<strong>on</strong> fault and the NE strikingtensi<strong>on</strong> torsi<strong>on</strong> fault in fr<strong>on</strong>t of Wuli Mountains.Photostop at the hot springs in theintersecti<strong>on</strong> of two faults in the Buqu RiverBasin at the north slope of Tanggula Mountains.Here in the area of disc<strong>on</strong>tinuous permafrostgeothermal phenomena like hot springs as well asthe presence of river and lake beds cause largethaw areas. Buqu River Valley is a prominentexample for such a thaw area.Overnight at the Tanggula Military Depot(5060 m a*s*l.).&&.X19: TANGGULA TO NAGQUCrossing of the Tanggula Mountains Pass. Withan altitude of 5231 m a.s.1. the highest point ofthe Qinghai-Tibet highway was reached (Figure 9).Here the end moraines of the last glaciati<strong>on</strong>could be seen near Basico Lake at the east of thepass.The route led al<strong>on</strong>g g4aciated mountain ridges,through a shrub and grassland vegetati<strong>on</strong>, foreststeppes and a densely populated, rich cultivatedlandscape whiCh appgargd with descendingaltitude.Photostap at hot springs of the Gulu geyserarea near by a Tibetan settlement in fr<strong>on</strong>t of theNianqing Tanggula Mountains. The group received awarm welcome from the local people (Figure 10).Visit to the Ygngbajing hot geothermal area andthe terrestrial steam generating electric stati<strong>on</strong>about 90 km west of Lhasa.Descent throuqh the V-shaped L<strong>on</strong>dui Valley toLhasa. At 4100 m' a.s.1. the valley widened andwas occupied by cultivated fields of rape, andfrom 3950 m a.s.1. <strong>on</strong> with barley fieldsdominating the landscape. Closer to Lhasa from3700 m <strong>on</strong> downwards, they were replaced by cornf ields.Arrived in Lhasa (3658 m a.s.l.), the capitaland religious and cultural centre of Tibet, at 6o'clock p.m.' 977 '
~ areaFigure 10: Tibetans welcome th excursi<strong>on</strong> groupwhile visiting hot springs the in Gulu geyser(by E. King)JULY 21 AND 22 LHASA:City excursi<strong>on</strong>s to temples, m<strong>on</strong>astaries, localmarkets etc..JULY 23: FLIGHT FROM LHASA TO CHENGDUMost of the group returned to Beijing <strong>on</strong> July24. The excursi<strong>on</strong> and the special circumstancesunder which it took place will certainly beremembered far a l<strong>on</strong>g time by all theparticipants.WFERENCEs :Liu Tungsheng & Yuan Baoyin (1991): QuaternaryGlaciati<strong>on</strong>s and Periglaciati<strong>on</strong>s in the Qinghai-Xlzhang (Tibetan) Plateau. Excursi<strong>on</strong> guidebook. <str<strong>on</strong>g>Internati<strong>on</strong>al</str<strong>on</strong>g> Uni<strong>on</strong>' for Quaternary<strong>Research</strong>, XI11 <str<strong>on</strong>g>Internati<strong>on</strong>al</str<strong>on</strong>g> C<strong>on</strong>gress, Beijinq,China, 1991.Guo O<strong>on</strong>gxin h Zhao Xiufeng, eds (1993): A Guideto the <strong>Permafrost</strong> and Envir<strong>on</strong>ment of theQinghai-Xizang Plateau. Excursi<strong>on</strong> guide book,VIth <str<strong>on</strong>g>Internati<strong>on</strong>al</str<strong>on</strong>g> <str<strong>on</strong>g>C<strong>on</strong>ference</str<strong>on</strong>g> <strong>on</strong> <strong>Permafrost</strong>,Beijirrg, China, 1993.ACKNOWLEDGEMENTS:Thanks are given to Lotens Xing for c<strong>on</strong>tributi<strong>on</strong>sand Jerry Brown for the improvement of theenglish manuscript.hElisabeth SchmittIPA, Chair Editor ial comm ittee
Tian Shan Field Trip, A-2(July 11-18, 1993)JULY -EXCURSIONIN URUMQIUrumqi (1.2 milli<strong>on</strong> people of severalnati<strong>on</strong>alities) is the capital of Xinjiang Uygur ,TUInY. 14: URUMQI- TIANCHI LAKE - U mAut<strong>on</strong>omous Regi<strong>on</strong>. It is located <strong>on</strong> an alluvialfan at the northern foot of Tian Mountains.Left Urumqi heading to Tianchi (Heavenly) LakeAccording to its latitudinal and l<strong>on</strong>gitudinalabout 60 km east of Urumqi in the San G<strong>on</strong>g Riverlocati<strong>on</strong> (about 43" N and 86" E) it has a dry, Valley <strong>on</strong> the north slope of Bogda Shan. Thec<strong>on</strong>tinental climate. Trees and irrigati<strong>on</strong> furrows route passed steppe and pasture in the foothillfollow all roads. The irrigati<strong>on</strong> water source is z<strong>on</strong>e northeast of Urumqi and irrigati<strong>on</strong> systemsthe Tian Shan. The city is characterized by dense <strong>on</strong> arable land and forests in the Fuk<strong>on</strong>g area.traffic and large industry causes a remarkable The transiti<strong>on</strong> from desert to steppe and forestair polluti<strong>on</strong>.belt (c<strong>on</strong>ifers) took place in a horiz<strong>on</strong>talVisit to the Xinjiang Museum of Geology and distance of about 30 km.Mineral Products.The visit to Tianchi Lake (1910 m a.s.l) in amountainous setting provided an opportunity for*gQxExcursi<strong>on</strong> to Turpan in the middle part of'theXinjiang Uygur Aut<strong>on</strong>omous Regi<strong>on</strong>. As aninterm<strong>on</strong>tane basin in the Tian Shan it issurrounded by Mt. Bogdas in the north, Mt.Karawuquntag in the west, Mt. Jueluotag in thesouth and Kumtar desert in the southeast. Itslowest point is 155 m m.s.l..The route was characterized by the transiti<strong>on</strong>from steppe to desert and allowed a view to thesnowy Bogda Shan (5445 m a.s.1,) during theentire day.Photostop at the Lake of Chaiwo Pu where saltexploitati<strong>on</strong> and irrigated fields could beobserved. In the upper Turpan basin thec<strong>on</strong>sequences of recent flooding (roaddestructi<strong>on</strong>) across the extensive arid plain eastof Urumqi (appaerently due to the lack ofvegetati<strong>on</strong>) after night rainfall in thesurrounding mountains could be observed. On theride through the st<strong>on</strong>y desert (hammada) greenoasis Turpan and an oil exploitati<strong>on</strong> field werepassed.Visit to ancient Bizalik Thousand Buddha Caves<strong>on</strong> the cliff of Mutuo Valley, 48 km notheast ofTurpan City. The sandy soil is covered withventifacts.Visit to the ancient city of Gaochang nearbythe caves. It was built in the 1st century,destroyed in the 14th century and has been key apoint al<strong>on</strong>g the ancient silk road.Visit to the grape Valley, which is an 8-kml<strong>on</strong>g and half-kilometer wide oasis rich in water.The 400 hectares of cultivated land include 220hectares of wine-growing.Visit to the ancient, but still active Korezirrigati<strong>on</strong> system and the Wudaolin forest beltwhich is fed by this irrigati<strong>on</strong> system of wells,underground-and surface-channels.speculati<strong>on</strong> <strong>on</strong> alternative mechanisms offormati<strong>on</strong> of the lake (ancient bedrock landslideor moraines). The bluff at the outlet showedunstratified coarse and fine deposits and layeredfluvial sediments. The sunny morning allowed abeautiful view to the snowy summit of Bogda Shanwhile in the afterno<strong>on</strong> it became cloudy.JULY. 15: URUMOI - URUMQI RIVE-CISTATION - CANGF ANGGOU SECTIONOLOGICALDrive to Tian Shan Glaciological Stati<strong>on</strong> withseveral stops en route to inspect and discussperiglacial features. Late Pleistocene alluvialfan sediments of Urumqi River with an alternatebedding of coarse, dark fluvial and Pine, lightsediments without clear signs of stratificati<strong>on</strong>were passed. The questi<strong>on</strong> of the origin of thefine sediments (fluvial or eolian) and thegenesis of the fan were up for discussi<strong>on</strong>. Nosigns of periglacial features could be observed.About 10 km in fr<strong>on</strong>t of the mountain rangeUrumqi River terraces could be seen. Two mainterraces were clearly distinguished in thedistance. The height of these terraces wereestimated to be about 50 m. The edges of theloess covered terraces (Figure 1) are maturelydissected due to water erosi<strong>on</strong>.In the gorge of the upper reach of the UrumqiRiver (Daxigou River) the Yingxi<strong>on</strong>gqiaohydrolgical and climatological stati<strong>on</strong> is locatedat 1830 m a.s.1.. The observati<strong>on</strong>s include waterlevel, temperature, discharge and suspendedsediments of the water, precipitati<strong>on</strong>, humidity,air temperature as well as river ice c<strong>on</strong>diti<strong>on</strong>s.At the upper end of the fault basin of Houxia(Rear Gorge) the base camp of Tian ShanGlaciological Stati<strong>on</strong> is located (2130 m a.s.1.).' 979 '
JULY 16: GLAUOWGI CAL STATION - SHENGLI WABAN- GTICIOMGICAL STATIONThe highly interesting day was devoted toalpine settings and glaciers in the Urumqi River Rock Glacier No. 4 (Figure 3)is located <strong>on</strong> ahead waters. The glaciological stati<strong>on</strong> summer north facing slope In fr<strong>on</strong>t of Glacier No. 3 andcamp (Figure 2). Glacier No. 1, the precipitous cut by the old highway. Since 1960 mean advanceroad past Wangfeng Highway Maintenance and of RE4 is 18 cm/year, The rock glacier is notubiquitous glacial and periglacial landforms t<strong>on</strong>gue shaped. Patterned ground between RG4 andprovoked lively discussi<strong>on</strong>s am<strong>on</strong>g members of the the moraine of Glacier No. 3 could be observed.group.The gravel road al<strong>on</strong>g the upper Urumqi River(Daxigou River) climbed a sec<strong>on</strong>d gorge and a V-shaped valley and passed Uigur camps. No signs oflate-Pleistocene glaciati<strong>on</strong> like U-shaped valleysand Nunataks could be observed. Wood and treesdisappeared and an alpine setting with debrisslopes characterized the landscape. On northfacing slopes above 2900 m high mountainpermafrost is present.<strong>Permafrost</strong> areas were reached at about3000 m a.s.1. near Wangfeng Highway MaintenanceSquad. Here, clear forms of glaciati<strong>on</strong> as hangingvalleys and f?d moraines of +he Wangfengformati<strong>on</strong> (C age of 14920 ?: 750 years B.P.)were developped. Under periglacial c<strong>on</strong>diti<strong>on</strong>s aseries of geliflucti<strong>on</strong> steps and t<strong>on</strong>gues wereformed .The road to Shengli Daban pass (4020 m a.s.1.)was built in 1960 <strong>on</strong> a steep, dangerous debrisslope covered with large blocks. Rockfalls areobeserved at many places. Ongoing repairs of theroad are necessary. The elevati<strong>on</strong> o'f thesurrounding mountains is about 4300 m a.s.1..View to retreating Glacier No. 3 <strong>on</strong> thenorthern slope of Mt. Karawuquauntag. The lateralmoraine c<strong>on</strong>tains buried glacier ice. A snowavalanche could be observed <strong>on</strong> the steep hangingcirqueglacier.The 20 m depth borehole No. 5, drilled ingneiss bedrock in a sharp turn of the road(3900 m a.s.1.) is the highest borehole in theChinese Tian Shan. The mean annual groundtemperature is -4.9-C and permafrost thickness isestimated to be 230 m. The active layer thicknessis 1.75 m in September.Figure 3: Rock Glacier No.4 (3550 m a.s.1.) cutby the old highway980
The glaciological stati<strong>on</strong> summer camp (3540 ma.s.1.) is a climatological stati<strong>on</strong> with 35 yearsrecord starting in 1958: Borehole No. 4, 18 rn indepth, was drilled in 1990. The depth of zeroannual amplitude is 15 m. <strong>Permafrost</strong> thickness isestimated to be loo m.The frost mound next tu a small creek(Figure 4 ) with an ice core is probably caused byan injecti<strong>on</strong> at about 3500 m a.s.1.. Its heightis about 1.2 m and it is partly eroded due tothermokarst. Several smaller frost mounds arelocated in the area.Walk al<strong>on</strong>g the moraines of the Wangfengformati<strong>on</strong>. Road cuts show an unstratified tilland glaciotect<strong>on</strong>ic thrust sheets. The end moraineof the lower limit is locatedabout 2900 ma.s.1..A profile at the Red May Bridge <strong>on</strong> a terraceabout 20 m above Urumqi River shows glaciofluvialsediments as well as talus and lakedeposits.JULY 17, 1993: GLACIOLOGICAL STATION - GLACIERNO. 1 - URUMQIThe 3.1 km l<strong>on</strong>g gravel road from the summercamp to the glacier was built in 1981 mainly byhand and in view of permafrost characteristics.St<strong>on</strong>e stripes are formed beside the road. Walkdown the moraine <strong>on</strong>to the south branch of theglacier.Glacier No. 1 (Figure 6) is a small glacierwith two branches in north facing cirques. It isretreating, south and north branch are stillc<strong>on</strong>nected by a very short secti<strong>on</strong> but willprobably separate in a few years. Mass balancemeasurements are carried out every four to sixweeks since 1959. High ablati<strong>on</strong> and accumulati<strong>on</strong>during summer. During the visit a fresh and wetsnow cover <strong>on</strong> the ice could be observed.Figure 6 : South and north branch of GlacierNo. 1. in the background and the active RockGlacier No. 2 in the foreground.981
An empty cirque, sorted circles, stripes andprotalus ramparts could be observed in thesurroundings of the glacier. The thickness of theactive layer is about 1.5 m. No soliflucti<strong>on</strong>measurements take place. High mountain vegetati<strong>on</strong>characterizes the landscape.The active Rock Glacier No. 2 is located nextto the glaciological stati<strong>on</strong>. The rock glacier isnot t<strong>on</strong>gue shaped but. very similar to the form ofprotalus ramparts. It is situated below a steepnorth facing debri slope, Its active z<strong>on</strong>e is inthe middle part of the fr<strong>on</strong>t slope.Return to Urumqi.JULY,10 : FLIGHT FROM URUMOI TO BE,IJING.WERENCESChaohai, L. et al. (1991) : Handbook of the TianShan Glaciological Stati<strong>on</strong>, Lanzhou.Euoqing, Q., Shije, L., Huijun, J. & Lin, 2.(1993): Guide book of the field trip A-2 of the<str<strong>on</strong>g>Internati<strong>on</strong>al</str<strong>on</strong>g> <str<strong>on</strong>g>C<strong>on</strong>ference</str<strong>on</strong>g> <strong>on</strong> <strong>Permafrost</strong>.Lanzhou.ACKNOWLEDGEMENTS: Thanks are given to Jerry Brownfor the improvement of the english manuscript.The report based <strong>on</strong> field notes and reports byRainer Lehmann, Germany, and Chuck W. Slauqhter,USA. All photographs are taken by R. Lehmann.edited by Elisabeth Schmitt,IPA, Chair Editorial Committee982
INTBRNATIONAL PERMAFROST ASSOCIATIONSTANDING COMMITTEES AND WORKING GROUPSMEMBERSHIP AND PURPOSEThe following Committees and Working Groups wereapproved for five years at the IPA Councilmeeting, July 8, 1993, Beijing. China. WorkingGroups and Committees are expected to report <strong>on</strong>progress at Council meetings and regularly inthe Frozen Ground News Bulletin. Working Groupmembership is limited to Chair, Secretary andsix full members; excepti<strong>on</strong>s to this limit aremade by the Council. Ex Offic'io members fromthe IPA Executive Committee and Working GroupChairs may be represented <strong>on</strong> other WorkingGroups. There may be an unlimited number ofcorresp<strong>on</strong>ding members <strong>on</strong> Working Groups andinterested individuals should apply to theWorking Group Chair.IPA EXECUTIVE COMYITTEECheng Guod<strong>on</strong>g, President (China)H.M. French, Vice President (Canada)N.N. Romanovsky, Vice President (Russia)Jerry Brown, Secretary General (USA)ADVISORY COMMITTEE ON WORKING GROUPSC.W. Lovell, Chair (USA)W. Haeberli (Switzerland)S.E. Grechishchev (Russia)Ex Officio: H.M. French, IPA Executive CommitteeFINANCE COMMITTEEO.J. Ferrians, Jr., Chair (USA)A. Pissart (Belgium)Zhu Yuanlin (China)Ex Officio: J.Brown, IPA Executive CommitteeEDITORIAL COMMITTEEE. Schmitt, Chair (Germany)M.A. Grave (Russia)J.A. Heginbottom (Canada)K. Hall (Southern Africa)Xu Xiaozu (China)Ex Officio: J. Brown, IPA Executive CommitteeWORKING GROUPSMountain <strong>Permafrost</strong>TerminologyGlobal Change and <strong>Permafrost</strong>Data and Informati<strong>on</strong>Periglacial Procekses and Envir<strong>on</strong>mentsCryosolsFoundati<strong>on</strong>sSeas<strong>on</strong>al Freezing and Thawing of <strong>Permafrost</strong>AreasWORKING GROUPSMountain <strong>Permafrost</strong>Purpose: To improve the exchange of informati<strong>on</strong><strong>on</strong>, describe the state of knowledge about, andstimulate research activities c<strong>on</strong>cerning permafrostat high altitudes and in rugged topography,especially at low latitudes. The objectives ofthe WG over the next five years are to (1)promote applicati<strong>on</strong> of computer models to predictpermafrost occurrence, (.2)' organize inter -comparis<strong>on</strong>s of results of aodelling and fieldmapping, (3) coordinate l<strong>on</strong>g-term m<strong>on</strong>itoringwith regard to warming trends, (4) investigateenergy exchanges in the active layer and (5)improve understanding of permafrost creeplrockglacier formati<strong>on</strong>.W. Haeberli, Chair (Switzerland)F. .Dramis, Secretary (It. ly)S.' Harris (Canada)A. Gorbunov (Kazakhqtan)M.M. Koreisha (Russia)Ex Officio: Cheng Guod<strong>on</strong>g,IPA Executive CommitteeTerminologyPurpose: To develop a set of internati<strong>on</strong>allyaccepted permafrost terms for engineering andscientific use, with language equivalents. Overthe next five years the HG plans to completedevelopment of the multi-language index withthe additi<strong>on</strong> of definiti<strong>on</strong>s, complete theEnglish-Russian dicti<strong>on</strong>ary of over 2000 termsand incorporate the new Chinese-Russian-Englishglossary into a comm<strong>on</strong> index. The ldorking Groupwill disserminate and encourage use of suchterminology.R.O. van Everdingen, Chair (Canada)V. K<strong>on</strong>ishchev, Secretary (Russia)J. Akerman (Sweden)A. Corte (Argentina)F. dramis (Italy)O.J. Ferrians, Jr. (USA)J, Karte (Germany)0. Gregersen (Norway)J,P, Lautridou (France)Qiu Guoqing (China)Ex Officio: N.A. Romanovsky,IPA Executive CommitteeGlobal Change and <strong>Permafrost</strong>Purpose: To identify the effects and c<strong>on</strong>sequencesof global changes in temperature and relatedphenomena up<strong>on</strong> the nature of permafrost and itsdistributi<strong>on</strong>. An annotated bibliography ofpermafrost and climate change was completed andthe special issue of <strong>Permafrost</strong> and PeriglacialProcesses <strong>on</strong> the same topic was published anddistributed at the VICOP. Activities over thenext five years include preparati<strong>on</strong> of aninventory of existing ground temperature sites,standardizati<strong>on</strong> of data collecti<strong>on</strong> and archivingin cooperati<strong>on</strong> with the WG <strong>on</strong> data and informati<strong>on</strong>,more direct involvement with global modellingactivities, and c<strong>on</strong>vening of wr;-kshops <strong>on</strong>related problems. The Working Group is encouragedto interact with other nati<strong>on</strong>al and internati<strong>on</strong>al~~projects groups c<strong>on</strong>cerned with global change(e.g. IGBP, IPCC).
F.R. Nels<strong>on</strong>, Chair (USA)A. Taylor, Secretary (Canada)O.A. Anisimov (Russia)M.K. Gavrilova (Russia)T.E. Osterkamp (USA)Ex Officio: Cheng Guod<strong>on</strong>g, IPA ExecutiveCommitteeR.G. Barry, WG Data and Informati<strong>on</strong>W. Saeberli, WG Mountain <strong>Permafrost</strong>Data and Informati<strong>on</strong>Purpose: To improve and standardize and collecti<strong>on</strong>,archiving, documentati<strong>on</strong> and disseminati<strong>on</strong>of permafrost data. Activities over the nextfive years include a proposed workshop <strong>on</strong> DataPriorizati<strong>on</strong> 1994, c<strong>on</strong>tinued efforts to assembleand publish permafrost data under the auspicesof WDC - B (Boulder, develop a carto-bibliographicdata base, and update rhe permafrostbibliographic compilati<strong>on</strong>. The Working groupwill collaborate with the WG <strong>on</strong> Terminology,Global Change and other nati<strong>on</strong>al and internati<strong>on</strong>alcommittees and agencies c<strong>on</strong>cerned withrelevant data.R.G. Sarry, Chair (USA)J.A. Yeginbottom, Secretary (Canada)J. Akerman (Sweden)M.J. Clark (United Kingdom)Chen Xianzhang (China)E.S. Melnikov (Russia)Ex Officio: F.E.Nels<strong>on</strong>, WG Global ChangeR.O.van Everdingen, WG TerminologyPeriglacial Processes and Envir<strong>on</strong>mentsPurpose: (1) To investigate the frequency andmagnitude of periglacial processes, especiallythose occurring within the active layer, (2) toevaluate different methodologies and techniquesfor process measurements, and (3) to predictthe effects of potential climate change <strong>on</strong>periglacial envir<strong>on</strong>ments using c<strong>on</strong>temporarydata and the stratigraphic record. Over thenext five years the WG will c<strong>on</strong>duct severalsymposium, field trips and prepare a handbook<strong>on</strong> recommended techniques for investigatingperiglacial processes. The WG operates jointlywith the IGU Commissi<strong>on</strong> <strong>on</strong> Frost Acti<strong>on</strong> Envir<strong>on</strong>mentsand its President J.-P. Lautridou,(France) and Secretary C. Harris, (UnitedKingdom).A,G. Lewkowize, Chair (Canada)C. Harris, Secretary (United Kingdom)J. Akerman (Sweden)Cui Zhijiu (China)R. Hallet (USA)A. Pissart (Relgium)V. Solomatin (Russia)V. Vandenberghe (The Netherlands)Ex Officio: J.P. Lautridou (France), IGUCommissi<strong>on</strong> <strong>on</strong> Frost Acti<strong>on</strong> Envir<strong>on</strong>mentsCryosolst’urilvst.: To dcvt.lup and n~djnt~in close workingrelati<strong>on</strong>s between soi 1 and permafrost scientist.&throughout the bipolar regi<strong>on</strong>s, and to develol,projects to correlate and/or c<strong>on</strong>solidate thevast amounts of informeti<strong>on</strong>, maps, and data <strong>on</strong>soils that are of interest to IPA. Activitiesover the next five include charactcrizati<strong>on</strong> ofsoil climates, map the relati<strong>on</strong>ship of permafrostand cryosol distributi<strong>on</strong> and participate inseveral field trips and c<strong>on</strong>ferences: soilcorrelati<strong>on</strong> in Northwestern North America inlate July 1993; field trip to Yagadan-Kolymaregi<strong>on</strong> in summer 1994, attendance at the <str<strong>on</strong>g>Internati<strong>on</strong>al</str<strong>on</strong>g>Soil Science Society (ISSS) Subcommissi<strong>on</strong><strong>on</strong> Frozen Soils in 1994, and organizati<strong>on</strong>of the Sec<strong>on</strong>d <str<strong>on</strong>g>Internati<strong>on</strong>al</str<strong>on</strong>g> <str<strong>on</strong>g>C<strong>on</strong>ference</str<strong>on</strong>g> <strong>on</strong>Cryopedology in Syktyvkar in 1996. Coordinati<strong>on</strong>and liais<strong>on</strong> will be proyided with the ISSS andother organizati<strong>on</strong>s having comm<strong>on</strong> interests.D. Gilichinsky, Chair (Russia)C.L. Ping, Secretary (USA)J. Bockheim (USA)G. Broll (Germany)Wang Ilaoqing (China)9. Jakobsen (Denmark)G. Mazhitova (Russia)C,, Tamocai (Canada)Foundati<strong>on</strong>sPurpose: To collect informati<strong>on</strong> <strong>on</strong> the practiceof foundati<strong>on</strong> engineering in various permafrostregi<strong>on</strong>s of the world and to synthesize guidelinesfor effective engineering practice. Activitiesover the next five years include preparati<strong>on</strong> ofc<strong>on</strong>cise state-of-the-art-reports <strong>on</strong> such topicsas pile foundati<strong>on</strong>s and foundati<strong>on</strong> research andc<strong>on</strong>duct seminars and workshops <strong>on</strong> related topicsincluding a special seminar <strong>on</strong> foundati<strong>on</strong>failures. The WG encourages m<strong>on</strong>itoring andreporting of the performance of foundati<strong>on</strong>s inpermafrost and works closely with the WG <strong>on</strong>Seas<strong>on</strong>al Freezing and Thawing and nati<strong>on</strong>al andinternati<strong>on</strong>al engineering and geotechnicalorganizati<strong>on</strong>s and societies including theCanadian Geotechnical Associati<strong>on</strong> and theAmerican Society of Civil Engineers.J.W. Ro<strong>on</strong>ey, Chair (USA)K, Flaate, Secretary (Norway)R.M. Kamensky (Russia)L. Krustaley (Russia)P.J. Kurfurst (Canada)R.C. Tart, Jr. (USA)Zhu Y uanlin (China)ex 0 f ficio: A. Phukan (USA), WG Seas<strong>on</strong>alFreezing and ThawingSeas<strong>on</strong>a 1 Freezing and Thawing of <strong>Permafrost</strong> AreasPurpose To improve the exchanRe of informati<strong>on</strong><strong>on</strong>,-describe the state of knowiedge about. andstimulat,e research activities c<strong>on</strong>cerning frostacti<strong>on</strong> in soils and measures to protect againstits harmful effects in permafrost areas. The WGwill assist in organizing the next :;ymposium <strong>on</strong>Frost in Geotechnical EngineeEing ir Lulea,Sweden, in March 1997, and work closely withthe WG foundati<strong>on</strong>s and other WG <strong>on</strong> problems ofcomm<strong>on</strong> interest. The WG interacts with othernati<strong>on</strong>al and internati<strong>on</strong>al groups and crganizati<strong>on</strong>s(e.g. <str<strong>on</strong>g>Internati<strong>on</strong>al</str<strong>on</strong>g> Society of SoilMechanics and Foundati<strong>on</strong> Engineering (ISSMFE)and its Technical Committee <strong>on</strong> Frost (TC 8); theAmerican Society of Civil Engineers (ASCF) andits Technical Council <strong>on</strong> Cold Regi<strong>on</strong>s.Engineering(TCCBE); the <str<strong>on</strong>g>Internati<strong>on</strong>al</str<strong>on</strong>g> Symposi,um for GroundFreezing; the <str<strong>on</strong>g>Internati<strong>on</strong>al</str<strong>on</strong>g> road Federati<strong>on</strong>).. 981
A. Phukan, Chair (USA)E. Ladanyi, Secretary (Canada)M. Fukada (Japan)H.L. Jessberger (Germany)S. Knutss<strong>on</strong> (Sweden)G.Z. Perlstein (Russia)K. Senneset INorway)E. Slunga (Finland)EX Officio: J.W. Ro<strong>on</strong>ey fUSA), WG Foundatior IS
RESOLUTION: INTERNATIONAL PERMAFROST ASSOCIATIONApproved July 8, 1993 at the IPA Council Meeting, Beijing, ChinaWHEREAS the importance of permafrost is reflectedin both internati<strong>on</strong>al governmental and n<strong>on</strong>governmentalreports and science plans (IntergovernmentalPanel <strong>on</strong> Climate Change (IPCC);IGBP core projects: <str<strong>on</strong>g>Internati<strong>on</strong>al</str<strong>on</strong>g> Global AtmosphericChemistry Project (IGAC); Land.-OceanInteracti<strong>on</strong>s in the Coastal Z<strong>on</strong>e Project (LOICZ);Biospheric Aspects of the Hydrological CycleProject (BAHC); and Global Change and TerrestrialEcosystems Project (GCTE);WHEREAS the distributi<strong>on</strong> and properties of permafrostare of increasing interest to thosec<strong>on</strong>cerned with assessing the influence o fglobal climate change <strong>on</strong> high latitudes andhigh altitudes; .WHEREAS permafrost I s sensitive to climate andc<strong>on</strong>tains a memory of past climate changes; 'WHEREAS the IPA is c<strong>on</strong>cerned with the advancernent,ofknowledge <strong>on</strong> the formati<strong>on</strong> and degradati<strong>on</strong>of permafrost at regi<strong>on</strong>al and global scales:Be it RESOLVED that the IPA, c<strong>on</strong>sisting oE 20adhering nati<strong>on</strong>al bodies, representing manyearth science and engineering disciplines, seeka more active role in the IGBP-cor? programs bycommunicating IPA interests and acLivities torelevant IGBP programs, IPCC assessments, andother programs;FURTHERMORE the IPA notify other nati<strong>on</strong>al andinternati<strong>on</strong>al scientific and engineeringorganizati<strong>on</strong>s of its present working groups'plans and activities including the availabilityin early 1994 of the IPA 1:10,000,000 map ofpermafrost and ground ice of the NorthernHemisphere;Finally, be it RXSOLVED that relevant IPAworking groups give particular attenti<strong>on</strong> toglobal climate change and prepare status andtrend reports for the Seventh <str<strong>on</strong>g>Internati<strong>on</strong>al</str<strong>on</strong>g><str<strong>on</strong>g>C<strong>on</strong>ference</str<strong>on</strong>g> <strong>on</strong> <strong>Permafrost</strong>, to be held in Canadain August 1998.i
<strong>Permafrost</strong> and Changing ClimbleCF.E. Nels<strong>on</strong>', A,E. Larhenbrueh2, M.-k. Woo3, E.A. Kostec',T.E. Osterkarnp', M.K. Gavrllora6, Cheng Guod<strong>on</strong>p'.t'Dcpanment of Geological Sciences, Cornell University, Ithaca, ,NY. US4 14853Chairman, IPA Working Group <strong>on</strong> Permafrqst and Global Change'U.S. Geological Survey, Menlo Park, CA, USA 940253Depanmetlt of Geography, McMaster University, Hamilt<strong>on</strong>, Ontario, Canada,L8S 4K1'Geographical Institute, University of UtrcchtHeidelbcrglaan 2, 3584 CS, Utrecht, "'he Netherlands'Geophysical Institute, University of Alaska, Fairbanks, Alaska, USA 99775'%ermafrost Institute, Yakutsk, Russia 677018'LanEhou Institute of Glaciology and Geocryology, Lanzhou, P.R. China 730GOOINTRODUCTIONThe focus <strong>on</strong> climate change and its effects <strong>on</strong> ecosystems andhuman activities has so intensified in recent years thrt it isnow a central issue in many of the natural and social sciences.Governmental interest and public support for research <strong>on</strong> thistopic has provided the impetus for highly visible and coordinatednati<strong>on</strong>al research initiatives, and intens debates centered <strong>on</strong>approptiate resp<strong>on</strong>ses to thc issue permeate public-policydiscussi<strong>on</strong>s (e.g., Levine rt al. 1992, Messner ef al. 1992,aothman and Chapman 1993, Winh 1993). Climate change has evenprovided a tentative, if c<strong>on</strong>troversial, basis forintergovernmental mpcrati<strong>on</strong> (Hought<strong>on</strong> el al. 1990, v<strong>on</strong> Mnltke1989, Agarwd and Nasain 1990). Although permafrost has thepatentis1 to be a major element in the fabric of climate-changeresearch, it has to date occupied <strong>on</strong>ly a tangential positi<strong>on</strong> withrespect to both policy discussi<strong>on</strong>s and c<strong>on</strong>structi<strong>on</strong> of*This c<strong>on</strong>tributi<strong>on</strong> is bwd <strong>on</strong> an invited lecture by A.H.Lachenbruch and proscntati<strong>on</strong>s by the other authors in a plenarysessi<strong>on</strong> <strong>on</strong> "Qlobal Climate Change and Pcrmafrost" at the Sixth<str<strong>on</strong>g>Internati<strong>on</strong>al</str<strong>on</strong>g> <str<strong>on</strong>g>C<strong>on</strong>ference</str<strong>on</strong>g> <strong>on</strong> <strong>Permafrost</strong>, Beijing, July 6, 1993.'Permanent addrew Department of Geography, Rutgers University,New Bnmswick, NJ, USA 08903integrative climate-change scenarios. A new resoluti<strong>on</strong>, whichappears elsewhere in this volume, puts the <str<strong>on</strong>g>Internati<strong>on</strong>al</str<strong>on</strong>g><strong>Permafrost</strong> Associati<strong>on</strong> <strong>on</strong> record as giving permafrostlclimatechangeinteracti<strong>on</strong>s high priority (IPA 1993).<strong>Permafrost</strong> is a temperature c<strong>on</strong>diti<strong>on</strong> of the solid Earth; itsexistence depends <strong>on</strong> the local heat balance in cold regi<strong>on</strong>s. Thewidely discussed models for c<strong>on</strong>temporary greenhouse warminggenerally predict that effects will be greatest in these regi<strong>on</strong>s(e.g., Budyko and Izrael 1987, Maxwell and Barrie 1989, Roots1989: but see Kahl er 01. 1993, Walsh 1993) and, in general, thatthey will alter the surface heat balance and the temperaturc anddistributi<strong>on</strong> of pcrmafrost (Nels<strong>on</strong> and Anisimov 1993, Riseboroughand Smith 1993). Relatively rapid changes may occur in thepositi<strong>on</strong> of the top of permafrost (depth of summer thaw) and inthe distributi<strong>on</strong> of warm permafrost near its ,southern limit;these changes can impact the dynamics of a broad rangc of surfaceprocesses and may relcasc greenhouse gascs, currently stored in, permafrost, to the atmosphere. Changes in the positi<strong>on</strong> of thelower boundary of permafrost will, however, gencrally beunimportant for hundreds or thousands of years, during which timcthe downward propagating thermal wave will preserve a lingeringrecord of the climatic event at depth. In the presence of achanging climate, therefore, permafrost can play at least threeimportant roles: 1) as a rrcorder of climatt change, 2) as anrrgent of envir<strong>on</strong>mental changes that affect ecological and humancommunities, and 3) as a facilitator of further climate changc.987 '
IPERMAFROST AS A RECORD KEEPERIn cold c<strong>on</strong>tinuous permafrost, as in other impermeable carthImatcrials, there is little movement of groundwater and heattransfer is almost exclusively by c<strong>on</strong>ducti<strong>on</strong>, a process thatIIIIfollows relatively simple mathematical rulcs.climatic change in theThus, if apast altered mcan annual temperature atthe base of the active layer, thc changc would propagate slowlydownward into the permafrostat a rate that can be calculated.In effect, the ground "remembers" the major evcnts in its surfacetemperature history,today to depthsand careful tcmpwature measurements madeof a few hundred meters can provide informati<strong>on</strong><strong>on</strong> the history of local surface temperature during pastcenturies.In high latitudes, bodies of water that du nntfreeze to thebottom in winter generally have mean bottom temperatures near orabove O"C, whereas the mean tempcrature of theadjacent landsurface may be much lower (e.g., -10' to -15'C near the shorcs 11fthc Arctic Ocean today).c<strong>on</strong>cerned, thc migrati<strong>on</strong>leavea a dramatic "climatic change"shore is advancing <strong>on</strong> therctrcating from the land.temperature meawrementsInsofar as the solid earth ISof a lake or ocean shoreline thereforein its wake a warming if theland or coohng if the shoreline isGcothermal methods can be applictl tuin wells nn the submerged Arcticc<strong>on</strong>tinental shelf to interpret the chrnnolngy rlf rapid shorelinetransgressi<strong>on</strong> in progress <strong>on</strong>and of the inundati<strong>on</strong> of the Arctic c<strong>on</strong>tinentalthe last glaciati<strong>on</strong>. Effects<strong>on</strong> low-lying permafrost canmuch of the Arctic shnrcline today,shclf followingof predicted global sea-level risebe estimated by thc same methods(Lachenbruch 1957, Lachenbruch et nl. 1982, 1988a, Wang 1993).Additi<strong>on</strong>al informati<strong>on</strong> about the history of the recentclimatic system can be obtained by measuring the tempcrature,depth, and ice c<strong>on</strong>tent of existing permafrost and modeling thesurface c<strong>on</strong>diti<strong>on</strong>s thatmust have existcd to generate thepermafrost observed. Where ice c<strong>on</strong>tent is high and permafrost isdeep, as in Prudhoc Bay, Alaska or eastern Siberia, suchI calculati<strong>on</strong>s provide climatic informati<strong>on</strong> <strong>on</strong> timescales* 5approaching 10 ycars, the period of glacial cycles (Balohacv etal. 1978, Harris<strong>on</strong> 1991, Osterkamp and Gosink 1991).In additi<strong>on</strong> to the informati<strong>on</strong> <strong>on</strong> climatethe present thcrmal statehistory c<strong>on</strong>tained inof permafrost, much can be learnedabout past surface c<strong>on</strong>diti<strong>on</strong>s from the cold-climatefeatures and organic materials preserved in(Carter er 41. 1987, Mackay 1988).ice-wedge polyg<strong>on</strong>s, which form from thegeomorphicburied permafrostOf particular intcrest arepercolati<strong>on</strong> of summermeltwater into a network of dcep thermal c<strong>on</strong>tracti<strong>on</strong> cracks thatform during wintcr in cold brittle permafrost. Evidence <strong>on</strong> theseas<strong>on</strong>al growth and deteriorati<strong>on</strong>of past generati<strong>on</strong>s of icewedges reveals changes in past surface c<strong>on</strong>diti<strong>on</strong>s whcre thesenetworks of massive ice arcpreserved in the stratigraphic record(Lachenbruch 1966, Mackay and Matthews 1983).Climate Signals in <strong>Permafrost</strong> Temperatures:From Climate to <strong>Permafrost</strong>Many important envir<strong>on</strong>mental changeschange in permafrost regi<strong>on</strong>s dorather in the active layer above it. The permafrostassociated with climatenot occur in permafrost, butgenerallyshares its upper boundary with the base of the active layer(Figurc I), and acts as a "listeningchanges that occur there.and above the activepast" for temperatureHowever complex the thermal changes inlayer may be, the <strong>on</strong>ly parameter rccordcd bypermafrost is the temperature changc that makes its way to thebase of the active layer, for practical purpascs,the mcun annuoltemperature change. It is this quantity, the mean annualtemperature at the topof permafrost (Tpo, whose time history iscstimated in "climatic" rec<strong>on</strong>structi<strong>on</strong>s from borehole temperaturemeasurements.Such rcc<strong>on</strong>structi<strong>on</strong>s are bascd <strong>on</strong> the assumpti<strong>on</strong> that, exceptfor the effects of steady heat flow from the earth's interior, achange in mean annual temperatureby a past change in surface tempcrature. Thisheat transfer iswith depth can bt caused <strong>on</strong>lywill be true whercexclusively by c<strong>on</strong>ducti<strong>on</strong> with n<strong>on</strong>-changingproperties, and where effects of sources and sinks, if theyexist, cancel each other over the yearly cycle.c<strong>on</strong>diti<strong>on</strong>s are generallyAlthough thcscsatisfied in most cold permafrost, theyclearly do not apply in the overlying active layer, snow, andnir In general, therefore, Tmr (mean annual air tcmperature,Figure 1) will diffcr from 'i',~(mean annual tempcrature of the"solid surface": snow in winter, ground in summer). and Tss willdiffer from Tpf (mean annual tempcrature at the top ofpermafrost, Figure l), whether 01 not the climate is changing.Effects above the solid surface are addressedby the radiati<strong>on</strong>balancc of climatology, c<strong>on</strong>sidered briefly below. Between thesolid surface and permafrost, the temperature offset (Tsb- Tpf,Figure 1) is determined by the complex dynamics of thesnowlactive-laycr system. Clearly, thcrc aremany differentFigure 1. Measurement sites for the differently defined surfacetemperatures: Tpf at upper surface of permafrost, Tgs at groundsurface, Tss at the solid surface of the snow pack when it ispresent and ground surface when it is not, and T-ir in a standardabservatory thermometer shelter.
types of surface change, climatic andthe same change inotherwise, that can produceperdrost temperature, and someenvir<strong>on</strong>mentally ~mpartant thermal changes in the active layermight have little effect <strong>on</strong> 4f. It is imp<strong>on</strong>ant, therefore, tomaintain a distincti<strong>on</strong> between changing permafrost surfacetemperature and changing climate.Simple references tocharacterid or defined by an increase in"climatic warming' imply that it can bemean annual airtemperature near the Earth's surface. Figure 2 is a reminder ofthe inadequacy of such a definiti<strong>on</strong>for predicting envir<strong>on</strong>mentaleffects c<strong>on</strong>trolled by the active layer, which is mast sensitiveto summer temperature. The three cases illustrated in Figure 2a11 represent a 4 " mean ~ annual warming (from -9' to -9'~).achieved respectively, with warmer summers,much warmer winters with somewhat cooler summers.might have dramatic effectsmight have little or n<strong>on</strong>e.warmer wintcrs, orThe first<strong>on</strong> surface envir<strong>on</strong>ments, the thirdThe sec<strong>on</strong>d is more c<strong>on</strong>sistent withpredicti<strong>on</strong>s from most general circulati<strong>on</strong> models (IPCC WorkingOroup 1990, Mnxwell 1992).These relati<strong>on</strong>ships can be addressedin an approximate fashi<strong>on</strong> by the ratio of freezing and thawingdegrce-day sums (Nels<strong>on</strong> and Outcalt 1987).the warming will generally propagate to permafrast,be detectable for centuries,In all three cases,where it maybut a distincti<strong>on</strong> am<strong>on</strong>g the threeoriginal surface c<strong>on</strong>diti<strong>on</strong>s will not be possible.4°C Warming Scenarios, Alaskan ArcticNext to the shift in mean air temperature, the mog obviousagent to shift Tpf is winter snow cover, which insulates theground in winter, causing Tpr > h s (the *mow offsct", e.&,Goadrich 1982, Zhang and Ostertramp 1993); a secular increaw insnow cover (8 born fide climatic change) can cause a coIIspicuoUSwarming signal in pcrmafrost. A more subtle dTpf signal from thesnow can occur with no change in snow cover or mean airtemperature if the amplitude of seas<strong>on</strong>al temperature variati<strong>on</strong>increases; the same snow cover causes more warming because ofgreater damping in colder winters as the climate becomes morec<strong>on</strong>tinental (Lachcnbmch 1959). This may be the principal causeof the difference in Tpf from -9°C at Barrow <strong>on</strong> the AlaskanArctic coast to 4°C at Wmiat, 80 km inland. Both have similarmean air temperatures and snow cover, but Umiat has a morec<strong>on</strong>tinental climate.In general, rhe mean annual temperature will not be the sameat different levels between the air/solid interface and the topof permafrost, as explained schematically in Figure 3. Forseas<strong>on</strong>al effects that make it easier for downward heat transferthrough the snow and active layer than upward transfer out ofthem, Tpf will be greater than 'ha when the two have reachedcquilibrium. Examples are infiltrati<strong>on</strong> (with possible lateralflow) of summer meltwater and rain, a unidirecti<strong>on</strong>al process thatadvects heat downward, and the "snow offset," which insulates theground tclcctively in winter. These are designated Type I1processes in Figure 3. Examples of Type I processes, which cancause a steady negative offset of permafrost temperatures, arethe change in thc active layer from a good thermal c<strong>on</strong>ductor whenit is frozen in winter to a poorer <strong>on</strong>e that inhibits downwardheat flow when thawed in summer. An effect of the same sign isthe upward transport of moisture (and dehydrati<strong>on</strong>, reducingc<strong>on</strong>ductivity) in the active layer to supply surface evaporati<strong>on</strong>TYPE I TYPE 1Summw WlPrMlFigure 2. Three scenarios for the same warming (from solid todashed curves) of meun ground surface temperature (Tag). Summerc<strong>on</strong>diti<strong>on</strong>s that c<strong>on</strong>trol the envir<strong>on</strong>mentally sensitive activeLayer ate quite different for each, us indicated by the ratio ofannual freezing degree days to thawing degree days (see Nels<strong>on</strong>nnd Outcalt 1987).Figure 3. Snow and active-layer processes 0.pC I) that causethe periodic seas<strong>on</strong>al influx of hwt in summer (Qio) to be lessthan the seas<strong>on</strong>al outflow in winter (Q<strong>on</strong>t) generally c<strong>on</strong>tributeto a decrease in mean temperalure with depth. Those that causethe periodic summer inflow to exceed the periodic winter outflow(Type YI) generally c<strong>on</strong>tribute to an increase in temperature withdepth. Envir<strong>on</strong>mentdy induced changes in any such snow atactive-layer processes are remembered in the permafrosttemperature record as changing "climate."989
and transpirati<strong>on</strong>; it tends to counteract heat gained by downwardc<strong>on</strong>ducti<strong>on</strong> in summer. A number of other seas<strong>on</strong>al processesinvolving n<strong>on</strong>-c<strong>on</strong>ductive transport of scnsible and latent heat bymigrating moisture, sometimes involving vaporizati<strong>on</strong>,c<strong>on</strong>densati<strong>on</strong>, and ice segtegali<strong>on</strong> in the active layer have beendescribed (e.g., Nakano and Brown 1972, McGaw rt ~ 1 1978, . Wallet1978, Mackay 1983, Nels<strong>on</strong> et al. 1%S, Outcalt et ul. 1992).Subtle changes and inreracti<strong>on</strong>s am<strong>on</strong>g the factors that c<strong>on</strong>trolsome of these processes, for example, prol<strong>on</strong>gati<strong>on</strong> of the zerocurtain by n<strong>on</strong>-linear interacti<strong>on</strong> of latent heat of soilfreeze/thaw and snow cover (Goodrich 1982), could cause n changein heat balance within the active layer that would be rememberedby permafrost temperatures as a change in Tpf.,d F O I The permafrost surface temperature,important single parameter for the, integratedenvir<strong>on</strong>mental c<strong>on</strong>diti<strong>on</strong>s. Understandingimplicati<strong>on</strong>s, however, requires a knowledgethermal processes that c<strong>on</strong>trol it as wellinformati<strong>on</strong> whenever possible. Whetherdirect resp<strong>on</strong>se to changing climatic parameters,precipitati<strong>on</strong> and snow cover, or to changingc<strong>on</strong>diti<strong>on</strong>s, drainage patterns, or theevolving plant communities, they areinformati<strong>on</strong> that we should attempt tofactors, including climate change, landhelp us to understand the dynamics ofTpf, may be the mosthistory ofits full range ofof the physir- ofus supplementarypast changes in Tpf wereincludinggeomorphicheat and water balance ofunique source ofrelate" to envir<strong>on</strong>mentaluse, and others that willchanging ecosystems.aa-O T H ~ ,LFigure 4. Borehole temperatures In part b are from sites denotedby solid circles in part a. Shaded regi<strong>on</strong> for each curve is therecenk warming anomaly; numbers by CU~VCS denote time in yearsbsforc 1984 for start-up of best-fitting model of lincar warming.Insert in part b summarizes statis!ics for starting date andtotal warming for best-fitting step and linear models (afterLachenbruch and Marshall 1986).
The,Tcmpcmture Si-from Recent Warming EventsFipra 4b &owa a group of typical temperature profiles fromoil wells <strong>on</strong> the Alaskan Arctic coastal plain. With fewexcepi<strong>on</strong>s (see map of Fipro 4a), they generally have a linearporti<strong>on</strong> at de@ and a curved porti<strong>on</strong> near the surface.simpleat intcrprcuti<strong>on</strong> of the profiles is that the linearTheporti<strong>on</strong> at depth represents steady heat flux from the Earth's2interior (which we mawre to be 0.05 to 0.10 Wlm ), and thecurved pan represents a rent warming event propugatingdownward (Wed nrca). ?emount of surface warming .(dTpf) isthe diffsrencs bawasn the tempcratures obtained by extrapolatingthe straighr and curved pans to the surface, a few 'C ia thesccases (see CUIVE CTD, Figure 4b). The durati<strong>on</strong> of the warmingw<strong>on</strong>t, severaldecades to a century according to simplehcat-c<strong>on</strong>dud<strong>on</strong> models. is estimated from thepcneVati<strong>on</strong> of thedepth ofmomaious curvature, referenced in theright-hand margin of Figure 4b. Arrowsrho anomaly should be 10 or 100 years afteror linw change in aurfacc tcmpcratnre.Figure 5 cotuparea three formal rec<strong>on</strong>amni<strong>on</strong>stemperature history fipf) from the(Figure 4b).low where the bottom oftho start of a stepof surfaceanomaly (shaded regi<strong>on</strong>) at AWUThe timing and magnitude of the step and linearfuncti<strong>on</strong>s were determined by the least squares method describedby Lachenbruch and Marshall (1986), and tbe smooth curve (Clow etnl. 1991) by tho msthod of Speard expansi<strong>on</strong> (Parker 1977, Clow1992), in which the unknown time history is represented by aseries of orth<strong>on</strong>ormal functi<strong>on</strong>s.the= dataAll of the rec<strong>on</strong>structi<strong>on</strong>s fitwithin observati<strong>on</strong>al error (f 0.05"C) and there islittle baiis for prefemng <strong>on</strong>e to another. p c resoluti<strong>on</strong> canbc greatly improved,however, by increasing the measurementprecisi<strong>on</strong> to the prewntly feasible f O.00IoC.) The results showthat although theae mc.asurernems do not resolve details of thesurface temperature history, there can be little doubt about thebig picture; at AWU and most of the other holes in this 2 x la32km regi<strong>on</strong>, there WM a marked, but Laterally variable increasein temperature athlsius during thethe top of permafroat ("0 of a ftw degreestwentieth century (Lachenbmch and Marshall1986, Lachcnbmcb et al. 1988a. Clow et d. 1991). Some sitesshow a more recent -ling, believed to bc related to enginwringdisturbance (Laehenbrucb and Matsbnhall 1986). A reas<strong>on</strong> for thisdramatic and locally variable change has not bccn found in thehitcd rccords of surface temperature or Snowfall from theregi<strong>on</strong>, and its causa remains unknown.From Figure 6, it canbc w n that heat accumulati<strong>on</strong> in thesolid Earth from the unbalanced downward "climatic" flux (c) mustbe of the me order as the upward geothermal flux (g), which itnullifies to yield ncar-zero gradients near the surface (Figure6b). "he catimatos for the AWU of g N 0.06 W/m2 and c, .* 0.16Wlm' (Lachenbnrcb ut al. 1988r) arc illugtratod in Figure 6. itb of interest to campwe these mdost solid&fluxes to the4.03.02.01 .o0.01 .0125 rnn 75 50 25 0The (YBP)Figure 5. Best-fitting step, ramp, and spectral expansi<strong>on</strong> modelsfor rcccnt warming event at AWU, Figure 4 (after Lachenbruch etal. 1988a, Claw et al. 1991).more vigorous activity <strong>on</strong> the other side of the Fanh's surface.The larger "top-side" fluxes drive the ecosystem, and theirbalance point determines the Earth's surface temperature (Wcllcrand Holmgren 1974). They c<strong>on</strong>sist of the incoming and outgoingradiati<strong>on</strong> comp<strong>on</strong>ents and their difference (the net radiati<strong>on</strong>,Figure 68), which, pm<strong>on</strong>y othcr things, is resp<strong>on</strong>sible for meltingsnow and evaporating water, allowing them to return to the sea orthe atmosphere to balance both the thermal and hydrologic budgctsin preparati<strong>on</strong> for the next annual cycle. Thc numbers <strong>on</strong> thearrows (Figure 6a) indicate that there top-side climatic fluxessum to zero as they should if thc climate is not changing.However, from Figure 4 we know that climatc is changing; at Awunaabout 0.16 Wlm' more has bun going into the Earth than out for ahalf century or so. As this is just lllOhh of the net radiati<strong>on</strong>(itself a difference of large numbers), we cannot detect it bytrying to keep a balance sheet of fluxes at the Earth's surface.Thus, while the unbalanced climate flux (C in Figure 6) is aninc<strong>on</strong>spicuous .wc<strong>on</strong>d-order effect in the climatic system, it is ac<strong>on</strong>spicuous firscnrdcr effect that dominates the thermal regimeof the upper IMJ m in the solid-earth system (Figures 4 and 6b).The solid Zurth is a good m<strong>on</strong>itor for changes in thc surfqccenergy balance. The downward flowing heat cannot go far in accntury because the Earth is a poor c<strong>on</strong>ductor; it is allc<strong>on</strong>tained in the stippltd regi<strong>on</strong> (Figure 6b), which representsthe copplcte climatic cvcnt from statt to finish.PERMAFROST AS AN AGENT OF ENVIRONMENTAL CHANGEIt is paradoxical that in permafrost regi<strong>on</strong>s the porti<strong>on</strong> of. the ground that has the greatest influence <strong>on</strong> surface dynamics isthe very porti<strong>on</strong> that is not permafMSt: the active layer and itsvcgctati<strong>on</strong>. The permafrost, of course, imparts to the activelayer its important characteristics: a base generally at- 991
Figure 6. Typical thermal c<strong>on</strong>diti<strong>on</strong>s in permafrost regi<strong>on</strong>s ffthc Alaskan Arctic. a. Average annual energy fluxes (Wlm ) aboveand bclow the Earth's surface. b. Geothermal regime: g is stepdygwrbermal heat loss, C is heat gain from warming climate,stippled regi<strong>on</strong> represents total heat accumulati<strong>on</strong> by the solidearth from warming event.subfreezing temperature and impermeable to moisture, withc<strong>on</strong>diti<strong>on</strong>s generally prohibitive for penetrati<strong>on</strong> by roots.typical c<strong>on</strong>diti<strong>on</strong>s, the active layer is the growth medium forbiotic systems and the reservoir for theirwater and nutrientsupply (Oeruper et al. 1980), the Locus of most terrestrialUnderhydrologic activity (Hinzman et al. 1991, Kane et ul. 1992). anda boundary layer across which heat, moisture, and gases areexchanged between rbe solid earth and atmospheric systems.With climate warming, (increased mean annual andlor summertempcralure), the depth of thaw and settlement of the surfacewill generally increase (e.g.,Kane et al. 1991, Nakayama ef nl.1993, Waelbroeck 1993). but not uniformly; for example, deepeningtroughs can form over a network of large ice wedges, therebyaltering drainage patterns and the distributi<strong>on</strong> of wet and dryhabitats.The changed distributi<strong>on</strong> and moti<strong>on</strong> of the soil watercan have a dominant effect<strong>on</strong> the thermal and chemical balance,including the rates of biogeochemical reacti<strong>on</strong>s, the productivityof living systems, the decompositi<strong>on</strong> of organic matter,generati<strong>on</strong> or uptake of COZ and CHI, and other charactcristicr ofthe activelayer that influence (and are influenced by) thedistributi<strong>on</strong> of plant communities (Oechel and Billings 1992,Shaver er al. 1992).Changes in thethemechanical and thermal c<strong>on</strong>diti<strong>on</strong> of permafrostas its moisture changss state during climateinteracting surface effectschange can cause(mechanical, thermal, hydrological,and biological), whose major impacts are treated in thesubsecti<strong>on</strong>s.followingTerrain Susceptibility and Implicati<strong>on</strong>s for DevelopmentsThe envir<strong>on</strong>mental impacts of permafrost and ita growth anddeteriorati<strong>on</strong> with changing climate depend primarily <strong>on</strong> theamount and form of the ice itmassive ice bodies are comm<strong>on</strong>.manifestati<strong>on</strong>s of the dramatic change inc<strong>on</strong>tains; both interstitial ice andThe impacts are almost alltransfer properties associated with phase change.interstitial ice, forstrength and heat-Melting Ofexample, decreases strength and increasespermeability, permitting increased water flow.leads to increasedmelting in an'unstableThis, in turn,advcctive heat transfer, and acceleratedprogressi<strong>on</strong> that can cause collapse ofmassive ice, soil flowage, and disrupti<strong>on</strong> of the landscape.In warmer permafrost,near the margins of its extent,increasing surface temperature can cause summertoo great to refreeze in winter.c<strong>on</strong>duits fortransfer (e.&,thawing to depthsThe resulting taliks can begroundwater flow and associated c<strong>on</strong>vective heatin warm permafrost may beAnisimov 1989). The presence of unfrozen watera comm<strong>on</strong> occurrence, owing to smallamounts of soluble impurities comm<strong>on</strong>ly present in groundwatct(Osterkamp 1989). This unfrozen water changes the thermalproperties of the permafrost, makesand creates a distributedpermafrost.them temperature dependent,latent heat sink throughout the body ofThese factors can result in very complex thermal andhydrologic regimes in marginalwill cause them to deteriorate rapidly.permafrost areas and in many areasThe latitudinal gradientof mean annual surface temperature near the warm margins ofc<strong>on</strong>tinental permafrostgenerally ranges from o.~~-~.o~c/~oo km(&molotchiLova 1988, Mackay 1975, Anisimov 1989). Thus, in someregi<strong>on</strong>s like central Canada and Siberia, climatic warming of afew degrees can subject vast areas to marginal decay.Thisprocess. together with the effects of a thickening active layer,will bc resp<strong>on</strong>sible for prompt (10°-102 years), major impacts <strong>on</strong>the dynamics of permafrost regi<strong>on</strong>s subjected to a warming climate(Stuart 1986. Nels<strong>on</strong> and Anisimov 1993).Unlike the slow Loss of permafrost by heat c<strong>on</strong>ducti<strong>on</strong> frombelow in c<strong>on</strong>tinuouswarm disc<strong>on</strong>tinuous permafrost is apermafrost areas, however, thc rapid loss ofprocess that is not wcllknown. There are few published data for such aspects as thawingratts at the permafrost tableand base, processes of talikdcvelopmenr, lime scales for thawing, or the importance oflateral heat flow.In the absence of such empirical data,simulati<strong>on</strong> studies assume great importance. Riseborough (1990)carried out a numerical simulati<strong>on</strong> <strong>on</strong> the effectsof latent heat<strong>on</strong> the thermal resp<strong>on</strong>se of rl.~ upper 20 m of permaltost. Whereunfrozen water is present, henear-surface ground temperature trends aresuggested that short-term,not necessarily an992
absolute measure of the magnitude and rate of change to thesurface thermal regime. Risehrougb and Smith (1593) linked thethermal resp<strong>on</strong>se of permafrost in the Fort Simps<strong>on</strong> area ofCanada's NorthweJt Territories to a 2x cO2 warming scenario fromthe Canadian Climate Centre general circulati<strong>on</strong> model.Randomized weather mords, superimposcd <strong>on</strong> the trend provided bythe GCM, were used to drive a numerical heat-transfer model thatevaluated the thermal resp<strong>on</strong>ss of permafrost over a 140-yearperiod. Results from 121 replicati<strong>on</strong>s wete highly dependent <strong>on</strong> ,particular details in the simulated surface climate, and gave awide range of times for diwppearance of the permafrost profile.Interannual climatic variability appears to be an importantfactor in the evoluti<strong>on</strong> of permafrost under an overall warmingtrend.Despite our lack of data <strong>on</strong> thawing permafrost. there isabundant historical evidence for thermokarst development overextensive regi<strong>on</strong>s. Evidence for the existence of thermokarstrelief at subc<strong>on</strong>tinental scales, in the form of alas complexes,ice-wedge pseudomorphs, truncated wedges, and interpermafrosttaliks, has been found across Siberia, and has been related tospecific intervals characterized by distinct climatic warming(Baulin et al. 1984, K<strong>on</strong>dratjeva et al. 1993). These ihclude theclose of the Pleistocene (Baulin and Danilova 1984), the"Holocene Optimum' in Yakutia (Soloviev 1959) and a late Holomnewarming 300-25oI1 years BP in western Siberia (Solomatin 1992).Some appreciati<strong>on</strong> for the potential impact of climate-inducedpermafrost degradati<strong>on</strong> in areas of intensive development can begained through examinati<strong>on</strong> of currcnt problems involving ice-richterrain in Siberia. 'Although permafrost degradati<strong>on</strong> induccd bydirect anthropogenic activities such as clear-cutting of forestsare not optimal analogs for climate-induced effects, their scalecan in some instances allow us to visualize the regi<strong>on</strong>al impactsthat worst-case climatenhange scenarios could eventually have inareas of ice-rich permafrost. Moreover, local- and regi<strong>on</strong>alscalehuman activities are likely to be superimposed <strong>on</strong> broaderclimatic influences, and their effects may therefore be additive.Regi<strong>on</strong>s that c<strong>on</strong>tain cxtensive areas of warm, ice-richpermafrost, as in western Sibcria and the far East, areparticularly sensitive to landscape disturbance and increasedthaw depths (Vyalov et d. 1993). At exploratory drill sites innorthern Chukotka, active-layer thickness increased by a factorof two to three in terrain subjected to removal of vegetati<strong>on</strong>cover, compared with adjacent undisturbed areas. The Bykovskyfish-processing plant in Yakutie, which supplied fish to theentire USSR during World War 11, is an example of problems thatmay be encountered in many settlements under a warming climate.The ice c<strong>on</strong>tent of the ground beneath Bykovsky is as high as 90%.with <strong>on</strong>ly 0.6-1.0 m of mineral-soil overburden. DiMurbance ofthe upgcr 5-15 cm of moss and turf cover bas initiatedthermokarst processes that will necessitate aband<strong>on</strong>ment of thecommunity within the next ten years (Origoriev et al. 1990).Climatic warming alsahas serious implicati<strong>on</strong>s for thestability of engineered works in mountainous regi<strong>on</strong>s (Haeberli 1w,heberli er al. 1593). SpiSc examples include theQinghai-Ximng Highway in Tibet (An et nl, 1993, Cheng, thisvolume) and projects described by UIrich and King (1993) in theAlps.Hydrology of <strong>Permafrost</strong> AreasSeveral points we notewortby when c<strong>on</strong>sidering thehydrological c<strong>on</strong>sequences of permafrost thaw.e Frozen ground has very low hydraulic c<strong>on</strong>ductivity (Burt andWilliams 1976) and most permafrost materials can bc regarded BSimpervious to storage and transmissi<strong>on</strong> of significant quantitiesof water.Thus, infiltrati<strong>on</strong> and percolati<strong>on</strong> is limited (WOO1986). and groundwater flow is restricted to taliks andseas<strong>on</strong>ally thawed z<strong>on</strong>es (van Everdingen 1987).Thickening of theactive layer and formati<strong>on</strong> of new taliks accompanying climaticwarming will expand subterranean passageways for storage andcirculati<strong>on</strong> of groundwater.a <strong>Permafrost</strong> retains varying amounts nf water in the form ofground ice, much of which remains in storagc for centuries or ~millennia.Some of this ice will be released to the hydrologiccycle when permafrost degrades, but <strong>on</strong>ce melted and drained, thissource of water will be depleted.3 Heat and moisture fluxes str<strong>on</strong>gly affect each other. Latentheat is involved in the freezingand thawing processes while thethermal c<strong>on</strong>ductivity and capacity of thawed soils differ greatlyfrom those of frozen soils (Farouki 1981, Lunardini 1981).Increased thawing offeedbacks.the permafrost will have hydrologic0 Climatic warming in permafrost regi<strong>on</strong>s will likely bcaccompanied by changes in the precipitati<strong>on</strong> regime.Alterati<strong>on</strong>sin the magnitude and timing of precipitati<strong>on</strong>, as well as the formof precipitati<strong>on</strong> (e.g., rain YS. snow), will influence thehydrologic rhythm of a regi<strong>on</strong> under a changed climate. Climaticchange, with its attendant effects <strong>on</strong> permafrost and vegctati<strong>on</strong>development, will affect all the water balance comp<strong>on</strong>ents, whilemodificati<strong>on</strong>s of several hydrologic elements will havesignificant feedback <strong>on</strong> the permafrost,basins.Precipitati<strong>on</strong> is themajor source of water input to permafrostWarmer c<strong>on</strong>diti<strong>on</strong>s will shorten the freezing period. Atlow elevati<strong>on</strong>s, snowfall may occur later and snowmelt may beearlier than at prcscnt, so that peak melt events may not bec<strong>on</strong>centrated or as intense. At high elevati<strong>on</strong>s, the effect oftemperature lapse rate <strong>on</strong>of the effects of temperature increases.asthe freezing altitude will countcr someTogether with incrcascdstorminess and orographic influences, c<strong>on</strong>diti<strong>on</strong>s may even favormore snowfall at high elevati<strong>on</strong>s while rainfall increases in thelower mnes.For areas where the ground snow cover does notdecrease significantly, the insulating effects <strong>on</strong> the permafrostmay not diminish in the future.993 '
Evaporati<strong>on</strong> in permafrost regi<strong>on</strong>s ia limited by the l<strong>on</strong>gdurati<strong>on</strong> of mow md ice cover <strong>on</strong> the ground and by the low levelof energy available during the thawed seas<strong>on</strong>. A warming scenariowill shorten the snow- and iw-covcred period (except perhaps forhigh altitudes), and provide more heat in summer. Pan of thiswill be due to reduced ground heat flux as the frnzcn substratedccpens to lessen the ground temperature gradients, and part isdue to the higher sensible heat available. Computer simulati<strong>on</strong>(e+, Kana et al. 1991) suggests that higher evaporati<strong>on</strong> willaccompany higher summer temperatures. Should climatic changec<strong>on</strong>tinue, however, thc vegetari<strong>on</strong> will likely be different fromtoday, probably ar all scales, from the species to the biomelevel. If the lichens and mosses that tend to be suppressors ofevapotransirati<strong>on</strong> (Rouse et al. 1977) are replaced by transpiringplants, evaporative losses will Increase. Large-scale hydrologicchanges may omr io the extensive wetlands that occupy largetracts of the disc<strong>on</strong>tinuous permafrost regi<strong>on</strong>s of Eurasia andNorth America. Enhanced evaporati<strong>on</strong> asaociated with theprojected warming will lower the water table, followed by changesin the peat characteristics as the wetlaud surfaces kome drier(woo 1992).<strong>Permafrost</strong> degradati<strong>on</strong> will thicken the active layer, Thisshould allow greater infiltrati<strong>on</strong> and water storage, especiallytor rain that falls during the thawed period. Thus, there willbe more groundwater available to suaain baseflow in the fall,resulting in an extended sueamflow seas<strong>on</strong>. In terms of runoffresp<strong>on</strong>ses lo basin water input, Slaughter er d ' s (1983) studyin central Alaska provides a modern analog to what the futurepatrern may be: small basins with low percentages of permafrosttend to produce smaller ranges of flow c<strong>on</strong>diti<strong>on</strong>s, yielding fewerhigh flows of large magnitude and more discharge during low flowseas<strong>on</strong>s.Srreamflow of most rivers in permafrost areas exhibit a nivalregime, which is characterized by high snowmelt runoff in spring,followed by low summer flows that are occasi<strong>on</strong>ally raised byrainfall events (Church 1974). In the temperate z<strong>on</strong>e, raingeneratedpeaks dominare and fhc seas<strong>on</strong>al runoff pattern followsa pluvial regime (Woo 1990). As climatic warming occurs,particularly if winter temperature increases are pr<strong>on</strong>ounced, thesnowmelt pak flow may be similar to or lower than the present,depending <strong>on</strong> whether snowfall increases or otherwise. Raininducedflows may be more frcquent if rainstorms becomeprevalent, although higher evaporati<strong>on</strong> and more deeply thawedactive layers available for moisture storage may reduce therunoff pks. The baseflow period will be extended, depending <strong>on</strong>how much later the winter arrives. In general, the nival regimerunoff pattern will weaken for many rivers in the permafrostregi<strong>on</strong>, and thc pluvial influence up<strong>on</strong> runoff will intcnsiEy forrivers abng the margins of the disc<strong>on</strong>tinuous permafrost z<strong>on</strong>es.The impacts of global warming <strong>on</strong> the hydrologic system arefull of time lags; examples include such c<strong>on</strong>siderati<strong>on</strong>s as unevenstorage changes causing variable resp<strong>on</strong>se time, and whether thechanges are steady or involve thresholds (see Woo et 01. 1992).Other c<strong>on</strong>siderati<strong>on</strong>s include fctdbacks between the hydrologicaland external systems or am<strong>on</strong>g different hydrological cltments:"random" signals emanating from climatic variability, chanceoccurrences of events and phenomena; and human factors, includingdevelopment in permafrost areas, activities involved in resourceextracti<strong>on</strong>, and changes in land use. Our task is to deduce thehydrologic, tendtncies under climaticby uncertainties in the climate model predicti<strong>on</strong>s.change forcing, c<strong>on</strong>strainedGiven thecurrent limited level of knowledge <strong>on</strong> permafrost hydrologic andclimatic processts, <strong>on</strong>ly pwralized statements <strong>on</strong> the impacts,not detailed quantificati<strong>on</strong>, should warrant our c<strong>on</strong>fidence.Ecological and Geomorphic EffectsComprchensivt overviews of thc very large litcraturc <strong>on</strong>ecological resp<strong>on</strong>ses to climatic change are provided by Gates(1993) and Solom<strong>on</strong> and Shugan (1993). A rich literature alsoexists <strong>on</strong> permafrost as an ecological factor, much of itpotentially useful in the c<strong>on</strong>text of climatic change (e.g., Gill1975, Llrltin and Billings 1983, Morrissey ef 01. 1986, Burn andFriele 1989, Evans et 41. 1989, Gross et a!. 1990, Zdtai andVitt 1990, Laflcur et al. 1992, Lavnic et 01. 1992).C<strong>on</strong>siderable interest has focused <strong>on</strong> geographical shifts ofthe forest-tundra transiti<strong>on</strong> as a respnnse to climatic change: arecent publicati<strong>on</strong> by Tim<strong>on</strong>ey ef al. (1992) provides a firm basislor m<strong>on</strong>itoring northward migrati<strong>on</strong> of the forest tundra innorthwestern Canada, as well as for simulatinn studies. Mucheffort has already bten expended <strong>on</strong> predicting latitudinal shiftsof the boreal and tundra z<strong>on</strong>es (e.&, Solom<strong>on</strong> 1986. Kauppi andPosch 1988, M<strong>on</strong>serud ef 01. 1993; also see discussi<strong>on</strong> in Gates1993 and Solom<strong>on</strong> and Shugart 1993). Experiments linkingvegetati<strong>on</strong>al resp<strong>on</strong>ses to GCM-derived climate scenarios generallypredict poleward migrati<strong>on</strong> of vegetati<strong>on</strong> classes, and shrinkageof the area occupied by tundra. Simulati<strong>on</strong> experiments by B<strong>on</strong>an@r al. (1992) suggest, however, that important climate feedbackmechauisms could be triggered by shifts in the forest-tundratransiti<strong>on</strong>, includinp tbose accomplished by such anthrnpogcsicactivities as extensive deforestati<strong>on</strong> in the boreal z<strong>on</strong>e.<strong>Permafrost</strong> is an important ecological factor in the arctic andsubarctic aqd should be c<strong>on</strong>sidered explicitly in future modelingexercises*Ueomorphic resp<strong>on</strong>ses to climate warming were reviewed indetail by Wuo er al. (1992). Development of thermokarstphenomena at regi<strong>on</strong>al scales is likely to occur, and hasimportant implicati<strong>on</strong>s for resource management, as well as thcother impacts <strong>on</strong> human activities outlined above.Potential also exists for widespread slope failure in resp<strong>on</strong>seto a general climatic warming trend, although relati<strong>on</strong>ships arelikely to bc complex and spatially inhomogeneous. Lewkowicz(1992), for example, presented evidence that rapid rates of thaw994 *
I .penetrati<strong>on</strong> into ice-rich subsurface layers may bc a moreimportant factor in triggeringactive-layer detachment slidesthan is the simple maximum annual depth of thaw. This c<strong>on</strong>clusi<strong>on</strong>again suggests the importanccof interannual climatic variabilityfor realistic awssments of tbe resp<strong>on</strong>se of permafrost toclimatic warming (cf. Riseborough and Smith 1993).Slaughter and Hamann (1993) suggested that degrading pingosin the disc<strong>on</strong>tinuous permafrost wne could be uscd to m<strong>on</strong>itor thc<strong>on</strong>set or progressi<strong>on</strong> of climatic warming; palsas and other near-surface, ice-rich Landforms in subarcticuseful in this capacity.C<strong>on</strong>cerns havc bcenpearlands may also proveexpressed about the effccts <strong>on</strong> coastalpcrrnafrost of a greenhouse-induced rise in sea lcvcl (e-p., Roots1989, Barnes 1990, Woo et af. 19992). Recent observati<strong>on</strong>al andmodeling work focused <strong>on</strong> the resp<strong>on</strong>se of the Antarctic ice shcctto climatic warming suggests, however, that the ice sheet mayreceive increased nourishment, and that a large increase in sealevel could bc delayed substantially (Bentley and Geovinctto1991, Sugden 1992).PERMAFROST AS A FACILITATOR OF CLIMATE CHANGEA very large amountof carb<strong>on</strong> has been stored in pcatlands ofthe boreal and tundra regi<strong>on</strong>s during the Holocene. Much of thiscarb<strong>on</strong> is sequestered in permafrost;warming, gencral retreatunder c<strong>on</strong>diti<strong>on</strong>s nf climateand thinning of permafrost may c<strong>on</strong>vertthese regi<strong>on</strong>s into net sources of carb<strong>on</strong> (Billings 1987, Oechelet al. 1993, but also see Yarie and Van Cleve 1991, B<strong>on</strong>an PI a!.1992, Kolchugina and Vins<strong>on</strong> 1993). initiating fecdbsct cffcctsand enhanced warming.Methane in shallow permafrostA substantial body of literature has accumulatcd in rccentyears <strong>on</strong> methane emissi<strong>on</strong>s innorthern regi<strong>on</strong>s (e.g., Uarriss etdl. 1985, Moore and Knowles 1987. 1990. Whalen and Reeburph 198s.Moore 1990a. IWb, Morrissey and Livingst<strong>on</strong> 1992, Torn andChapin 1993).The intense interest in this subject is motivatedby recogniti<strong>on</strong> of methane's effectivencss as a grecnhnusc gas nndby its rapidly increasing c<strong>on</strong>ccntratinn in thc atmc~aphcrc(Cicer<strong>on</strong>e and Oremland 1988). Although fcw data arc available,large amounts of CH4 may be stored in permafrost rcgi<strong>on</strong>s; awidespread increase of thaw depth in resp<strong>on</strong>se to climatic warmingcould, in principle, release asubstantial proporti<strong>on</strong> of thismethane, triggering feedback effects in the atmospheric system.Although there has ken a tremendous upsurge of research <strong>on</strong>methane in northern regi<strong>on</strong>s, detailsvery poorly known.sampled emissi<strong>on</strong> rates (e.g.,of the mcthanc budgct arcOreat variability has been observed inMorrissey and Livipgst<strong>on</strong> 1992) nndthe few data available <strong>on</strong> tho methane c<strong>on</strong>tent of permafrost alsosuggest high variability (Kvenvolden and Lorens<strong>on</strong> 1993).Moreover, the relati<strong>on</strong>ahips between methane flux, soil moisture,nnd soil temperature are poorly known (Vourlitis et nl. 1993).Two recent papers attempted to model the release of methanefrom permafrost,using <strong>on</strong>e-dimensi<strong>on</strong>al numerical heat-transfermodels driven by GCM-generated climate-change scenarios.their estimates of the methane c<strong>on</strong>tent of permafrost <strong>on</strong> dataBasingobtained from areas near Fairbanks (Kvenvolden and Lorens<strong>on</strong> 1993)and Pmdhoe Bay (Moraes and Khalil 1993, Rasmussen et al. 1993)in Alaska, estimates of the maximum global rntes nf methanerelease were, respectively, 25-30 and 5-8 Tglyr. These resultsunderscore he uncertainty surrounding this topic.Far morc data<strong>on</strong> the methane c<strong>on</strong>tent of permafrost are necessary before trulyreliable estimates can be made.Furure modeling effortsinvolving circumarctic extrapolati<strong>on</strong> should also be based <strong>on</strong> thelarge-scale, high-quality map of permafrost distributi<strong>on</strong>schcduled for publicati<strong>on</strong> in early 1994 (Brown 1992).rather than<strong>on</strong>e of the many published small-scale depictinns, the majnrity ofwhich are poorly documented (see Nels<strong>on</strong> 1989, Nels<strong>on</strong> and Anisinw1993).Gas hydrate: a recordkeepcr and agent of climate changeSediments in cold regi<strong>on</strong>s may trap large quantitiesgas, largely mcthane, in icc-like crystalline structuresof naturalc<strong>on</strong>taining water molecules and called gas hydrates or rlathrutes(Katz ez al. 1959). They store natural gas efficicntly (up tow 150 times as much methane as anequal volume of free pns untlcrstandard c<strong>on</strong>diti<strong>on</strong>s of temperature and pressure. Gas hydratesare of interest inc<strong>on</strong>necti<strong>on</strong> with global climate change as apotential source of atmospheric methane, <strong>on</strong>e of the mostimportant greenhouse gases.potential commercial source of energy.Gas hydrates aretemperature andlorsuperficial part of the solid earth. Theshown in Figurewherein fluid pressure is equalThey are also of interest as astable under special c<strong>on</strong>diti<strong>on</strong>s of lnwhigh pressurc that obtain in <strong>on</strong>ly a small,stability ficld is7. assuming the comm<strong>on</strong> ("hydrostatic") c<strong>on</strong>diti<strong>on</strong>.to the weight of a column ofwater extending to the surface. For thc typical Arctic coastalc<strong>on</strong>diti<strong>on</strong>s illustrated for Barrow,methane hydrate isAlaska ("0 yrs," Figure 7a),stable between about 200 and 700 m, andpermafrost extcnds downward below a thin active laycr to a dcpthnf about 400 m. At Prudhoe Bay, Alaska, the higher c<strong>on</strong>ductivlty(lower thermal gradient) ice-rich permafrost extcnds to a depthof 600 m and the hydrate stability ficld to more than 1 km(Figure 7b). Understeady c<strong>on</strong>diti<strong>on</strong>s, hydrates will be stable <strong>on</strong>the c<strong>on</strong>tinent <strong>on</strong>ly in colder permafrost regi<strong>on</strong>s.steady-state temperature gradientsutfacc temperaturegcotherm to interscctThe principal globakhangeFor the typicalillustrated in Figure 7a, \hewould have to be below about -5'C lor thethe hydrate field.questi<strong>on</strong> about gas hydratc is:will a warming climate destabilize gas hydrates, release mcthaneto the atmosphere, and thercby enhance thec<strong>on</strong>tributi<strong>on</strong> eo the greenhouse effect? Thewarming by itsgeothermal effect of3 sudden increase of surface temperature by 10°C is illus!rat~d' 995
Significant amounts of methane will not be released fromdestabilized methane hydrate in permafrost areas by present-dayclimate change for a millennium or more.e Presentday c<strong>on</strong>tributi<strong>on</strong>s to atmospheric methane fromdestabilized hydrate should be sought <strong>on</strong> the Arctic c<strong>on</strong>tinentalshelf, where warming started with inundati<strong>on</strong> thousands of yaarsago (Lachenbruch et al. 1982, 1988b. Kvenvolden 1988, MacD<strong>on</strong>ald1990, Judge and Majorowicz 1992, Osterkamp and Fei 1993).Figure 7. Thermal. decay of methane hydrate stability field(shaded) beneath a transgressing Arctic shoreline. Land surfacewith geotherm typical of Barrow, Alaska (a), or Prudhoe Bay.Alaska (b), is inundated by sea (mean annual bottom temperature,-1°C) at time t= 0 years. Destabilizati<strong>on</strong> takes ten times l<strong>on</strong>gerat Prudhoe Bay owing to latent heat absorbed by its highice-c<strong>on</strong>tent permafrost (Lachenbruch et al. 1982, 1988b, 1988c.Lachenbruch and Saltus, unpublished calculati<strong>on</strong>s).in Figure la. This is much more severe than predicti<strong>on</strong>s ofclimate models, but it is an accuratereprcscntati<strong>on</strong> of the"climate change" that occurs when Arctic seas ovcrridc the land.a process that must have occurred nvet milli<strong>on</strong>s of squarckilometers <strong>on</strong> the Arctic cnntincntal shelf as it was inundated byrising sea lcvcl following the last glaciati<strong>on</strong>.c<strong>on</strong>tinues today at rates exceeding aTransgressi<strong>on</strong>meter per year al<strong>on</strong>g much ofthe Arctic coastline (e.&, Caner et d. 1987, Mackay 1986).Figure la suggests that the effects of a thermal disturbancetoday would not reach the top of the gas hydrate field at -200 mfor centuries, and for initialc<strong>on</strong>diti<strong>on</strong>s typical of Barrow,Alaska today (Lachcnbruch et 41. 1988~). significant methanerdoase could not occur for thousands of years. If,"Barrow model" in Figureunlike thela, the permafrost were ice rich as atPrudhoe Bay (Lachenbruch et al. 1982, Lachenbruch et al. 1988b),the destabilivrti<strong>on</strong> would take tens of thousands of years (Figure7b. Although the phase boundaries of gas hydrates vary withCompositi<strong>on</strong>, fluid pressure, and salinity, these examples serveto illustrate two rather generalpoints:INFORMATION ISSUES<strong>Research</strong> into the effectsgenerated a substantial increasc inthis topic sinceof climatic change <strong>on</strong> permafrost hasthe number of publicatians <strong>on</strong>the last permafrost c<strong>on</strong>ference (Koster and Judge1994). Although warming trends have c<strong>on</strong>sistently been predictedto be most pr<strong>on</strong>ounced in the high latitudes (e.&, Roots 1989),the permafrost community has, with <strong>on</strong>ly a few excepti<strong>on</strong>s (e.g.,Lachenbruch and hhrshall 1986), not communicated the importanceof its subject as a recorder, facilitator,climate-induccd changes to the largercspecially in high-impact, integrative medla.Interest inand agent ofscientific community;the potential effects of climatic changc <strong>on</strong>permafrost is widespread and increasing; the situati<strong>on</strong> isrcflected in the growth of literature <strong>on</strong> this general topic overthe past five years. Rcvitwshave been published recently byBarry (1985). Williams and Smith (1989). Pissan (1990). Streetand Melnikov (1990), Vins<strong>on</strong> and Hayley (1990), Haeberli (1992),Koster (1991, 1993a), Koster and Nieuwcnhudzen (1992). Melnikovand Street (1992). C)avrilova (1993), and Haeberli er d(1993).Several of these publicati<strong>on</strong>s built up<strong>on</strong> earlier effortsMcBeath (1984) and French (1986).Despite worldwide interest in climatebychange issues and theassumpti<strong>on</strong> that n<strong>on</strong>htrn wetlands and permafrost regi<strong>on</strong>s play avital role in theglobal climate system, relatively few studieshave appeared specifically dealing with these subjects andpresenting new data. The IPCC Scientific Assessment of GlobalChange (Aought<strong>on</strong> et al. 1990) reflects this minor attenti<strong>on</strong> toclimate-permafrost interacti<strong>on</strong>s, with <strong>on</strong>ly two short paragraphs<strong>on</strong> high-latitude methane sources (p. 22) and temwrature profilesin permafrost (p. 225).Similarly, permafrost bibliographies produced by Hcginhttomand Sinclair (1985) and Brennan (1988, 1993) rcvcal that, despitea large number of cirati<strong>on</strong>s, <strong>on</strong>ly a limited number of .publicati<strong>on</strong>s explicitly present data <strong>on</strong> the resp<strong>on</strong>se ofpermafrost to former, present, or future climatic changes.similar c<strong>on</strong>clusi<strong>on</strong> can be drawnAfrom the overview presented inTable 1, which reflects items published throagh 1992. Studies <strong>on</strong>*frozen ground properties" (125) and "permafrost engineering"(203), predominantly of North American origin, provide thenecessary background for climatenot address rhe subject in depth.change impact analysis, but doStudies <strong>on</strong> "palCWnVi~O~~ental, .,9 996
tI 363 72 11 37 1839 4 6 306 17 28 13 3 4. t!4047 lo 1507 433 I92I320 3114 31t 13ti 6 Olfrhilrl. pelnlalro6T ~rpllllrlwn wd EUllbtrUStIUn6 7 2 LI7 *r,,,,,
CONCLUSKONS: AN AGENDA FOR RESEARCHClimatic warming raises thespcncr of a very severe andspific sat of problems in high-latitude regi<strong>on</strong>s, To addressthese chnllengcs in an effective mnncr will require coordinatedand sustained effort by the permafrost research community.of the more prominent'below.ModelingGeneral circulati<strong>on</strong> modelscurrently used to investigatedistributi<strong>on</strong> of climatic change.isnues in need of resoluti<strong>on</strong> are outlined(GCMs) are the primary meansand predict the nature, extent, andGCMs are complex,threedimensi<strong>on</strong>al models of .the earth's atmosphere and oceans;because they are cxtrcrnely c<strong>on</strong>sumptive of computing resourcesSomethey are implemented over very coarse geographical Lattices. Theinternode distances of these models, often several degrees oflatitude andl<strong>on</strong>gitude, is of profound importance for applicati<strong>on</strong>of their results to a variety of scientific problems. Issues ofscale dependence and theinvolving regi<strong>on</strong>al climate are thereforeefforts at present (e.g., Karl et 01.,and Mearnsapplicability of GCMs to problemsthe focus of intensive1990, Boville 1991, Giorgi1991, Grotch and MacCracken 1991, Gutowski er al.1991, Hewits<strong>on</strong> and Crane 1992).With <strong>on</strong>ly the few excepti<strong>on</strong>s noted in earlierc<strong>on</strong>trast to the efforts of botanists and ecologists (e.g.,secti<strong>on</strong>s, snd inSolom<strong>on</strong> 1986, Kauppi and Posch 1988, Thomas and Rowntree 1992),permafrost gcientists have not made extensive use of GCM resultsin their discussi<strong>on</strong>s about potential impacts of climate change.Although scale-related problems areinvolving the formulati<strong>on</strong>substantial, as are othersof explicit linkages between GCMresults and the transient resp<strong>on</strong>se of permafrost to climati'cchange (see discussi<strong>on</strong> in Burn and Smith 1993), generalcirculati<strong>on</strong> models arc the scientificcommunity's primary toolsfor forecasting climate- change scenarios. As part of the<str<strong>on</strong>g>Internati<strong>on</strong>al</str<strong>on</strong>g> <strong>Permafrost</strong>Associati<strong>on</strong>'s focus <strong>on</strong> climate-changeissues (IPA 1993). high priority should be given to developinglinkages between permafrost research and models of climatechange, over a hierarchy af geographical scales.Technological isauesTechnology introduced in the wlrnmercial market during thc lastdecade has made pos~ble substantial improvements in thefeasibility, cost, and scale of field measurement programs inremote cold-cllmste regi<strong>on</strong>s. As in many other areas of science,technological innovati<strong>on</strong>s will allow us to expand the scope ofour investigati<strong>on</strong>s to such an extentquesti<strong>on</strong>s wc ask is fundamentally altered.that the nature of theIntroducti<strong>on</strong> ofrelatively inexpensive battery-powered, computer-c<strong>on</strong>trolledmeasuring and recording systems, for example, has made itpossible to oMniD bigh-frcqucncy time saries at remote sites,allowing extensive evaluati<strong>on</strong> of local c<strong>on</strong>diti<strong>on</strong>s and theirvariabitity. Accuracy requirements CUP be stringent, howevcr,particularly where permafrost temperatures are near OOC, or inspecial applicati<strong>on</strong>s. Some of the less costly instrumentati<strong>on</strong> isnot optimally cofllpred for the temporal intervals, sensingresoluti<strong>on</strong>, or tcmpcratwe canditi<strong>on</strong>s required for permafrostresearch. Recent unpublished calculati<strong>on</strong>s by Zhang andOstcrkamp, for example, suggest that highly accuratedeterminati<strong>on</strong> of in situ thermal diffusivity may require accuracy<strong>on</strong> the order of *O.OIoC in the mcasurcments. <strong>Permafrost</strong>researchers should communicate their needs and standards tomanufacturers clearly and in detail, particularly in the sphereof low-priced instrumentati<strong>on</strong>, which may require <strong>on</strong>ly inexpensivemodificati<strong>on</strong>s to achieve a c<strong>on</strong>figurati<strong>on</strong> that can k usedeffectively and widely.In the even more demanding applicati<strong>on</strong> of using theinformati<strong>on</strong> stored in permafrost as a paleoclimatic signal, toachieve a reiiable means of identificati<strong>on</strong>, rec<strong>on</strong>structi<strong>on</strong>, andfuture m<strong>on</strong>itoring of recent changes in the temperature at thepermafrost surface requires that temperatures be m<strong>on</strong>itored with aPrecisi<strong>on</strong> of * milliKelvin (mK). If borehole temperatures Canbe remeasured over a period of years with millidegree precisinn,we Can overcome major obstacles to the rec<strong>on</strong>structi<strong>on</strong> of surfacetemperature posed by steady-statc effects of inhomogeneity andthreedimensi<strong>on</strong>ality. Commercially available thermistortranduccrs, metering bridges, and tmreholc logging cables areadequate to C<strong>on</strong>struct systems with a sensitivity of a fracti<strong>on</strong> ofa mK. The two principal limitati<strong>on</strong>s to attaining thc desirddprecisi<strong>on</strong> in the field are: 1) returning to the same measurementdepths with adequate precisi<strong>on</strong> <strong>on</strong> relogging, and 2) c<strong>on</strong>trollingthe random c<strong>on</strong>vecti<strong>on</strong> of the generally unstable fluid in the, borehole. These problems are currently being addressed by a teamat the U.S. OcologiCal Survey in Menio Park.Remote sensing has become an important tool in many aspects ofPdar research (kg., Hall and Martincc 1985, Epp and Matthews1991); permaftOSt is no excepti<strong>on</strong>. Remote sensing has proveneffective for relating vegetati<strong>on</strong> and other terrain c<strong>on</strong>diti<strong>on</strong>s to<strong>Permafrost</strong> (e.&, Morrissey et al. 1986. Morrissey 1988, Belangeref 01. 1990, Liang and Ou 1993, Peddle and Franklin 1993).Ground-penetrating radar is extremely useful for delineatingpermafrost distributi<strong>on</strong> at local scales (Arc<strong>on</strong>e et ale 1982,Dmlittfe et 41. IW), and should prove equally effective form<strong>on</strong>itoring areas with the potential for stability problems underc<strong>on</strong>diti<strong>on</strong>s of general warming (Judge et 01. 1991). Asremote-sensing technology evolves, it is likely to increase inimportance as a gmcryological tool. Enhanced rcsoluti<strong>on</strong> fromspace-borne sensors, for example, may provide a means forobserving large-%ale mass movements or the degradati<strong>on</strong> ofnear-surface permafrost iu subarctic peatlands <strong>on</strong> a circumpolar''998 -
asis, rather thanat the local or regi<strong>on</strong>al scales necessitatedby the us0 of sequential aerial photography (Thie 1974).Measurement Programs and Data ArchivesAs important as the c<strong>on</strong>tributi<strong>on</strong>s of individuals or smallgroups of investigators may be, maximum advantage can be made oftechnological advances <strong>on</strong>ly if the data derivedmade available to the larger scientific community.from them areRecentstudies suggest str<strong>on</strong>gly that to view climate change as operatingprimarily at low frequcncies is ovcrly simplistic (Eradley andJ<strong>on</strong>es 1y92, Stcvens 1993; instead, integrated paleoclimaticevidence indicates that climate change operates at avariety oftemporal and spatial scales. and that pr<strong>on</strong>ounced, regi<strong>on</strong>aloscillati<strong>on</strong>s take place at the d-.dl scale. The implicati<strong>on</strong>sof these findings are profound for studies of permafrost, andunderscore the criticalbasis.Despite its importance toand applied science, there hasneed for integrati<strong>on</strong> of data, <strong>on</strong> a globala large numbcr d fields in basicbeen little c<strong>on</strong>sensus about orattempts to achieve a coordinated, internati<strong>on</strong>al implementati<strong>on</strong>of field measurements of ground temperature. Records areextremely few in many pans of the circumpolarstandardizati<strong>on</strong> prescnts a formidablc barrier tointegrative studies of existing records.regi<strong>on</strong>s andcomparative orGiven the very highlevels of interest and c<strong>on</strong>cern about the amplificati<strong>on</strong> of globalwarming in the polar regi<strong>on</strong>s, it is imperativcthat aninternati<strong>on</strong>al measurement program be implemented <strong>on</strong> a globalbasis.A program of ground-temperature measurements is neededurgently, similar inExperiment) effort to m<strong>on</strong>itorwarming <strong>on</strong> arctic biota (Molau 1992).ground-temperature stati<strong>on</strong>s, ideally at orwill establish critical empiricaltemperature.mpe to the ITEX (Intcrnari<strong>on</strong>al Tundraand evaluate the cffects of climatcA circumpolar network ofnear ITEX locati<strong>on</strong>s,Linkages between air and groundMoreover, sukh a network can provide informati<strong>on</strong>about the nature, extent, and rateof thaw that will be necessaryfor realistic regi<strong>on</strong>al and global planning activities.Much of the foregoing discussi<strong>on</strong> centers <strong>on</strong> climatechange,its detecti<strong>on</strong>, and the derivati<strong>on</strong> of recent climate history fromrelatively deep boreholes in thick permafrost.There is an acuteneed to inventory borehole locati<strong>on</strong>s and archive the data fromthcrn. This review also draws attenti<strong>on</strong>obaervuti<strong>on</strong>al data describingto the shortage ofpermafrost thawing ordisappearance, and emphasizes the impanance of the active layerfor permafrost evoluti<strong>on</strong> under a wurming climate.Detecti<strong>on</strong> anddocumentati<strong>on</strong> of warming in thc upper layers of permafrost, aswell as changes in the active laycr, are critical to theadvancement of our knowledge about climate change itself, as wellas the resp<strong>on</strong>se of prdrost to it. Brennan and Barry's (1989,also see Barry and Brennan 1993) suggestiocs for programs tocollect, standardize, and archivepermafrost-related data, <strong>on</strong> aninternati<strong>on</strong>al basis, must k given high priority if we hope toobtain the backgroundnecewry to m<strong>on</strong>itor cbnn&es in permafrostareas sensitive to climatic or anthropogenic disturbances. Onlywith an integrated, global database can adequate understandingattained about the degradati<strong>on</strong> of permafrost, its effects <strong>on</strong>geomorphic proccssea, and its potential to threaten the integrityof man-made structures andAcknowledgmentsThe authors thank Drs. Jerryreviews of the manuscrip.REFERENCESfacilitics.beBrawn and Roger Barry for helpfulAgarwal, A. and S. Nsrain (1990). Global Warming in an UnequalWorld: A Case of Envir<strong>on</strong>mental Col<strong>on</strong>ialism. Centre for Scienceand Envir<strong>on</strong>ment, New Delhi.An, W., 2. Wu, Y. Zhu, and A. Judge (1993). Influence of climatechange <strong>on</strong> highway embankment stability and permafrost in thepermafrost regi<strong>on</strong> of thc Qinghai-Xizang Plateau. InProceedings of the Sixth <str<strong>on</strong>g>Internati<strong>on</strong>al</str<strong>on</strong>g> <str<strong>on</strong>g>C<strong>on</strong>ference</str<strong>on</strong>g> <strong>on</strong><strong>Permafrost</strong>, Volume I, 11-16. South China University ofTcchnology Press, Wushan, Guangzhou, China.Anisimov, O.A. (1989). Changing climate and permafrostdistributi<strong>on</strong> in the Soviet Arctic. Physical Geography 10(3),285-293.Arcane, S.A., P.V. Sellmann, and A.J. Delaney (1982). Radardetecti<strong>on</strong> of ice wedges in Alaska. CRREL Report 82-43, 15 pp.Balobaev, V.T., V.N. Devyatkin, and I.M. Kutasov (1978).C<strong>on</strong>temporary geothermal c<strong>on</strong>diti<strong>on</strong>s of the existence avddevelopment of permafrost. In Sauger, F.J., (ed.), Proceedingsor the Sec<strong>on</strong>d Internati<strong>on</strong>ul <str<strong>on</strong>g>C<strong>on</strong>ference</str<strong>on</strong>g> <strong>on</strong> <strong>Permafrost</strong>, USSRC<strong>on</strong>tributi<strong>on</strong>, 8-12. Nati<strong>on</strong>al Academy of Sciences, Washingt<strong>on</strong>,DC .Barnes, P.W. (1990). Effects of elevated temperatures and risingsea level <strong>on</strong> arctic coasts. Journal of Col&Regi<strong>on</strong>sEngineering 4(1). 21-28.Barry, R.0. (1985). Cryosphere and Climate Change. U.S.Department of Energy, Office of Energy <strong>Research</strong>, Office ofBasic Energy <strong>Research</strong>, Washingt<strong>on</strong>, D.C., WE\ER4235.Barry, R.G. and A.M. Brennan (1993). Sixth <str<strong>on</strong>g>Internati<strong>on</strong>al</str<strong>on</strong>g><str<strong>on</strong>g>C<strong>on</strong>ference</str<strong>on</strong>g> OQ <strong>Permafrost</strong>: Towards a permafrost Informati<strong>on</strong>system. In Promedings of the Sixth <str<strong>on</strong>g>Internati<strong>on</strong>al</str<strong>on</strong>g> <str<strong>on</strong>g>C<strong>on</strong>ference</str<strong>on</strong>g><strong>on</strong> <strong>Permafrost</strong>, Volume 1, 23-26. South China University ofTechnology Press, Wushan, Guangzhou, China.Baulin, V.V. and N.S. Danilova (1984). Dynamics of LateQuaternary permafrost in Siberia. In Velichko, A.A., (ed.),Late Quaternary Envir<strong>on</strong>ments of the Soviet Uni<strong>on</strong>, 69-77.University of Minnesota Press, Minneapolis.Baulin, V.V., B. Belopukhova, and N.S. Danilova (1984). Holoccnepermafrost in the USSR. In Velichko, A.A., (ed.), LateQuaternary Envir<strong>on</strong>ments of the Soviet Uni<strong>on</strong>, 87-91. Universityof Minnesota PresJ, Minneapolis.
Belanger, J.R.. S.R. Dallimore, and P.A. Eggint<strong>on</strong> (1990).Applicati<strong>on</strong>s of thematic mapper thermal infrared imagery forPermaprost pnd terrain studies, Richards Island, N.W.T. InPrdings of the Fifth Canadian <strong>Permafrost</strong> <str<strong>on</strong>g>C<strong>on</strong>ference</str<strong>on</strong>g>,231-238. Centre d'etudes nordiques, Universith LavaUNati<strong>on</strong>alRcmrch Council of Canada, Quhbcc.Bentley, C.R. and M.B. Oeiovinctto (1991). Mass balance ofAntarctica and sen level change. In Wcller. G., C.L. Wils<strong>on</strong>,and B.A.B. Severin, (cdn.), Proceedings. <str<strong>on</strong>g>Internati<strong>on</strong>al</str<strong>on</strong>g><str<strong>on</strong>g>C<strong>on</strong>ference</str<strong>on</strong>g> <strong>on</strong> the Role of the Polar Regi<strong>on</strong>s in Global Change.Volume II. 481-488. Qoophydcal Institute, University ofAlaska, Fairbanks.IBillings, W.D. (1987). Carb<strong>on</strong> balance of Alaskan tundra and taiga' ccosystems: past, present und future. Quaternary ScienceReviews 6(2), 165-177.B<strong>on</strong>an, G.B., D. Pollard, and S.L. Thomps<strong>on</strong> (1992). Effects ofboreal forest vegemtian <strong>on</strong> global climate. Nature 359,716-718.Boville, B.A. (1991). Sensitivity of simulated climate to modelresoluti<strong>on</strong>. Journal of Climate 4(5), 469-485.Bradley, R.D. and P.D. J<strong>on</strong>es (1992). Climate Since A.D. 1500. 679pp. Routledge, Chapman & Hall, L<strong>on</strong>d<strong>on</strong>.Brennan, A.M. (1988). <strong>Permafrost</strong> Bibliography Update 1983-1987.Glaciological Data Report GD21. 225 pp, World Data Center Afor CJlaeiology, Boulder, CO.Brennan, A.M. (1993). <strong>Permafrost</strong> Bibliography Update 1988-92.Qlaciological Data Report 0J3-26.World Data Center A forGlaciology, Boulder, CO.Brennan, A.M. and R.G. Barry (1989). Ice Core Update 1980-1989.<strong>Permafrost</strong> Data Worksbop. 127 pp. Glaciological Data ReportGD-23, World Data Center*for Glaciology, Boulder, CO.Brown, J. (1992). A chamarctic map of permafrost and ground icec<strong>on</strong>diti<strong>on</strong>s. In clilichinsb, D.A., (ed.), Proceedings, 1st<str<strong>on</strong>g>Internati<strong>on</strong>al</str<strong>on</strong>g> <str<strong>on</strong>g>C<strong>on</strong>ference</str<strong>on</strong>g> <strong>on</strong> Cryopedology, 15-21. Pushino<strong>Research</strong> Centre, Pushino. Russia.Budyko, M.I. and Y.A. Iuael (1987). Anthropogenic ClimaticChange. 405 pp. Hydrometeoizdat, Leningrad, in Russian;English editi<strong>on</strong> published by The University of Ariz<strong>on</strong>a Press,1992.Burn, C.R. and P.A. Friele (1989). Geomorphology, vegetati<strong>on</strong>successi<strong>on</strong>, soil characteristics and permafrost inretrogressive thnw dumps near Mayo, Yuk<strong>on</strong> Territory. Arctic42(1), 314.Burn, C.R. snd M.W. Smith (1993). Issues in Canadian permafrostresearch. Progress in Physical Geography 17, 156-172.Burt, T.P. and P.J. Williams (1976). Hydraulic c<strong>on</strong>ductivity infrozen soils. Ea& Surface Processes 1, 349-360.Carter, L.D., T.A. Heginbbttom, and M.-k. Woo (1987). Arcticlowlandu. In ad, W.L., (ed.), Geomorphic Systems of NnrthAmerica, Centemid SpGcial Volume 2, 583-627. GeologicalSociety of America, Boulder, CO.'Christensen, T.R. (1993). Methane emissi<strong>on</strong> from Arctic tundraBiogeochemistry 21(2), 117.139.Church, M. (1974). Hydrology and permafrost with reference t<strong>on</strong>orthern North America. In Proceedings, Workshop Seminar <strong>on</strong><strong>Permafrost</strong> Hydrology, 7-20. Canadian Nati<strong>on</strong>al Committee,<str<strong>on</strong>g>Internati<strong>on</strong>al</str<strong>on</strong>g> Hydrological Decade, Ottawa.Cicer<strong>on</strong>e, R.J. pnd R.S. Oremland (1988). Biogeochemical aspectsof atmospheric methane. Global Biogeochemical Cycles 2(4),299-327.Claw, 0.D. (1992). The extent of,temporal smeriring insurface-temperature histories derived from boreholetemperature measurements. Global and Planetary Change 6,81-86.Claw, G.D., A.H. Lachenbruch, and C.P. McKay (1991). Inversi<strong>on</strong> ofborehole temperaNrG data for recent climatic changes:examples from the Alaskan arctic and antarctica. In Weller,G., C.L. Wils<strong>on</strong>, and B.A.B. Severin, (eds.), Proceedings,<str<strong>on</strong>g>Internati<strong>on</strong>al</str<strong>on</strong>g> <str<strong>on</strong>g>C<strong>on</strong>ference</str<strong>on</strong>g> <strong>on</strong> the Role of the Polar Regi<strong>on</strong>s inOlobal Change, Volume 11, 533. Geophysical Institute,University of Alaska, Fairbanks, AK.Dingman, S.L., R.Q. Barry, a. Weller, C. Bens<strong>on</strong>, E.F. LeDrew, andC.W. Owdwin (1980). Climate, snow cover, microclimate, andhydrology. In Brown, J., P.C. Miller, L.L. Tieszen, and F.L.Bunnell, (eds.), An Arctic Ecosystem: the Coastal Tundra atBarrow, Alaska, 30-65. Hutchins<strong>on</strong> & Ross, Stroudsburg, PA.Doolittle, J.A., M.A. Hnrdisky, and S. Black (1992). Aground-penetrating radar study of Goodream Palsas,Newfoundland, Canada. Arctic and Alpine <strong>Research</strong> 24(2),173-178.Epp, H. and S.B. Matthews (eds. 1991). Remote Sensing of ArcticEhvir<strong>on</strong>ments. Arctic 44(Supplement I), 171 pp.Evans, B.M., D.A. Walker, C.S. Bensnn, E.A. Nordstrand, and G. W.Peters<strong>on</strong> (1989). Spatial interrelati<strong>on</strong>ships between terrain,snow distributi<strong>on</strong> and kcgetati<strong>on</strong> patterns at an Arcticfoothills site in Alaska. Holarctic Ecology 12(3), 270-278.van Everdingen, R.O. (1987). The importance of permafrost in thehydrological regime. Canadian Bulletin of Fisheries andAquatic Scienccs 215, 243-276.Farouki, O.T. (1981). Thermal Properties of Soils. CRRELM<strong>on</strong>ograph 81-1, 151 pp. U.S. Army Cold Regi<strong>on</strong>s <strong>Research</strong> and. Engineering Laboratory, Hanover, NH.French, H.M. (1986). Climate Change Impacts in the CanadianArctic. Pr6ceedings of a Canadian Climate Program Workshop,3-5 March 1986. 171 pp. Envir<strong>on</strong>ment Canada, Orillia, Ontario.Gates, D.M. (1993). Climate Change and its BiologicalC<strong>on</strong>sequences. 280 pp. Sinauer Associates, Sunderland, MA.Gavrilova, M.K. (1993). Climate and permafrost. <strong>Permafrost</strong> andPcriglacial Processes 4(2), 99-1 11.Gersper, P.L., V. Alexander, S.A. Barkley, R.J. Barsdate, andP.S. Flint (1980). The soils and their nutrients. In Brown,J., P.C. Miller, L.L. Tieszcn, and F.L. Bunnell, (eds.), AnArctic Ecosystem: The Coastal Tundra at Barrow, Alaska,421432. Dawden, Hutchins<strong>on</strong> & Ross, Stroudsburg, PA.' 1000 '
Gill, D. (197s). Influence of white spruce <strong>on</strong> permafrost-tablemicrotopography, Mackenzie River Delp. Canadian Journal ofEarth Sciences 12, 263-25?Giorgi, F. and L.O. Mearns (1991). Approaches to the simulati<strong>on</strong>of regi<strong>on</strong>al climate change: a review. Reviews of Geophysics29(2), 191-216.Goodrich, L.E. (1982). The influence of snow cover <strong>on</strong> the groundthermal regime. Canadian Cleotechnical Journal 19, 421-432.Grigoriev, M.N., I.V. Pozdniakov, and V.P. Romanov (1990).Cryogenic processes in ice complex ground causcd byman-induced disturbance of the surface. In Ratsi<strong>on</strong>alnoieprirodapohvanie v kriolitoz<strong>on</strong>e, IMZ SO AN SSSR, YakutskGross, M.F., MA. Hardisky, J.A. Doolittle, and V. Klemas (1990)Relati<strong>on</strong>ships am<strong>on</strong>g depth to frozen soil, soil wetness, andvegetati<strong>on</strong> type and biomass in tundra near Bethal, Alaska,U.S.A. Arctic and Alpine <strong>Research</strong> 22(3), 275-282.Grotch, S.L. and M.C. MacCtacken (1991). The use of generalcirculati<strong>on</strong> models to predict regi<strong>on</strong>al climatic change.Journal of Climate 4(3), 286-303.Gutowski, W.J.J., D.S. Gutzltr, and W.-C. Wang (1W1). Surhccenergy balances of three general circulati<strong>on</strong> models:implicati<strong>on</strong>s for simulating regi<strong>on</strong>al climate change. Journalof Climate 4(2), 121-134.Haeberli. W. (1992). Possible effects of climatic change <strong>on</strong> theevoluti<strong>on</strong> of Alpine permafrost. In Boer, M.M. and E.A. Koster.(eds.), Cfrwnbouse-Impact <strong>on</strong> Cold-Climate Ecosystems andLandscapes. Catena Supplement 22, 23-35, Catena Verlag,Cremlingen-Destedt, Germany.Haeberli, W., Cheng Guod<strong>on</strong>g, A.P. Gorbunov, and S.A. Harris(1993). Mountain permafrost and climatic change. <strong>Permafrost</strong>and Periglacial Processes 4(2), 165-174,Hall, D.K. (1988). Aswssmcnt of polar change using satellitetechnnlogy. Rtviews of Oeophysics 26(1), 26-39.Hall, D.K. and J. Martincc (1985). Remote Sensing of Ice andSnow. 189 pp, Chapman and Hall, New York.Hallct, B. (1978). Solute redistributi<strong>on</strong> in freezing ground. InProceedings of the Third <str<strong>on</strong>g>Internati<strong>on</strong>al</str<strong>on</strong>g> <str<strong>on</strong>g>C<strong>on</strong>ference</str<strong>on</strong>g> <strong>on</strong><strong>Permafrost</strong>, Volume 1, 85-91. Nati<strong>on</strong>al <strong>Research</strong> Council ofCanada. Ottawa.Harris<strong>on</strong>. W.D. (1991). <strong>Permafrost</strong> resp<strong>on</strong>se to surface temperaturechange and its implicati<strong>on</strong>s for the 40,00(1-year surfacehistory at Prudhoe Bay. Journal of Qeophysical <strong>Research</strong>%B(2), 683695.Harriss, R.C.. E. Gorhum. D.I. Sebacher. K.B. Bartlett. and P.APlebbc (1985). Methane. flux from northern peatlands: Nature315, 652-654.Hewits<strong>on</strong>, B.C. and R.G. Crane (1992). Regi<strong>on</strong>al-scalc climatepredicti<strong>on</strong> from the GISS GCM. Global and Planetary Change 97,249-267.Hineman, L.D., D.L. Kane, R.E. Gieck, and K.R. Everett (1991).Hydrologic and thermal properties of the active layer in theAlaskan Arctic. Cold Regi<strong>on</strong>s Science and TechnoloSy 19(2),95-110.Hought<strong>on</strong>, J.T., G.J. Jenkins, and J.J. Ephraums (1990). ClimateChange. The IPCC Scientific Assessment. 364 pp, CambridgeUniversity Press, Cambridge.IPA (1993). Resoluti<strong>on</strong> <strong>on</strong> permafrost and global climate change,approved at 1PA Council Meeting, July 8, 1993, Beijing, China.Frozen Ground 14, in press.Judge, A. and J.A. Majorowicz (1992). Geothermal c<strong>on</strong>diti<strong>on</strong>s forgas hydrate stability in the Beaufort-Mackenzic ma: theglobal change aspcct. Global and Planetary Change 6(2/4),25 1-263Judge, A.S., C.M. Tucker, J.A. Pil<strong>on</strong>, and B.J. Moormqn (1991).Remote sensing of permafrost by ground-penetrating radar attwo airports in Arctic Canada. Arctic 44(Supplement l), 40-48.Kahl, J.D., D.J. Cbarlevoix, N.A. Zaltwva, R.C. Schnell, andM.C. Serreze (1993). Absence of evidence for greenhousewarming over the Arctic Ocean in the past 40 years. Nature361(6410), 335-337.Kane. D.L.. L.D. Hinunan, and J.P. Zarling (1991). Thermalresp<strong>on</strong>se of the active Lyer to climatic warming in apermafrw envir<strong>on</strong>ment. Cold Regi<strong>on</strong>s Science and Technology19(2), 11 1-122.Kane, D.L., L.D. Himman, M.-k. Woo, and K.R. Everett (1992).Arctic hydrology and climate change. In Chapin, F.S. fly,R.L. Jefferies, J.F. Reynolds, G.R. Shaver, and J. Svoboda,(eds.), Arctic Ecosyscms in a Changing Climate: anEcophysiological Perspective, 35-57. Academic Press, SanDiego.Karl, T.R., W.-C. Wang, M.E. Schlesinger, R.W. Knight, and D.Portman (1990). A method of relating general circulati<strong>on</strong> modelsimulnted climate to the observed local climate. Part I:Seas<strong>on</strong>al statistics. Journal of Climate 3(10), 1053-1079.Katz, D.L., D. Cornell, R. Kobnyashi, F.H. Poettmann, J.A. Vary,J.R. Elenbass, and C.F. Weinaug (1959). Handbook of NaturalGas Engineering. 802 pp. McGraw-Hill, New York.Kauppi, P. and M. Posch (1988). A caw study of the effects ofC02-induced climatic warming <strong>on</strong> forest growth and teh forest' sector. A. Productivity reacti<strong>on</strong>s of northern boreal forests.In Parry, M.L.,. T.R. Carter, and N.T. K<strong>on</strong>ijn, (eds.), TheImpact of Climatic Variati<strong>on</strong>s <strong>on</strong> Agriculture. Volume 1.Assessments in Cool Temperate and Cold Regi<strong>on</strong>s, 183-195.Kluwer Acudernic, Dordrecht, The Netherlands.Hcginbottom, J.A. and M.P. Sinclair (1985). Cumulative Index to<strong>Permafrost</strong> <str<strong>on</strong>g>C<strong>on</strong>ference</str<strong>on</strong>g> Proceedings (1958-1983). 215 pp.Geological Survey of Canada Open File Report 1135, Ottawa.1001 -
Kolchugina, T.P. and T.S. Vins<strong>on</strong> (1993). Climate warming and thecarb<strong>on</strong> cycle in the permafrost z<strong>on</strong>e of the former SovietUni<strong>on</strong>. <strong>Permafrost</strong> and Periglacial Processes 4(3), 149-163.K<strong>on</strong>dratjeva, K.A., S.F. Khrutzky, and N.N. Romanovsky (1993).Changes in the extent of permafrost in the late Quaternaryperiod in the territory of the former Soviet Uni<strong>on</strong>. <strong>Permafrost</strong>and Pcriglacial Processes 4(2), 112-':9.Koster, E.A. (1991). Assewment of climate change impact inhigh-latitude regi<strong>on</strong>s. Terra 103, 3-13,Lachenbruch, A.H., S.P.J. Galanis, and T.I-&J. Moses (1988b). Athermal cross secti<strong>on</strong> for the permafrost bd hydrate stabilityz<strong>on</strong>es in tbc Kupruk and Prudhoc Bay oil fields. U.S.Geological Survey Circular 1016, 48-51.Lachenbnrch. A.P., J.H. Sass, LA. Lawver, M.C. Brewer, B.V.Marshall, R.J. Munroe, J.P.*lly,S.P.J. Galanis, andT.H.J. Moses (1988c), Temperature and depth nf pcrmafrost <strong>on</strong>the Arctic shpc of Alaska. In Grye, G., (ed.), Geology andExplorati<strong>on</strong> of the Nati<strong>on</strong>al Petroleum Reserve in Alaska. U.S.Qeologid Survey Professi<strong>on</strong>al Paper 1399, 645456.Koster, E.A. (1993a). Qlobal warming and periglacial landscapes.In Roberts, N., (ed.), The Changing Global Envir<strong>on</strong>ments,127-149. Bost<strong>on</strong>, Basil Blackwell.Koster, E.A. (1993b). Introducti<strong>on</strong>-present glcbal change andpermafrost, within the framework of the <str<strong>on</strong>g>Internati<strong>on</strong>al</str<strong>on</strong>g>Geosphere-Biosphere Programme. <strong>Permafrost</strong> and PeriglacialProcesses 4(2), 95-98.Koster, E. and A. Judge (1994). <strong>Permafrost</strong> and Chmatic Changc:an Annotated Bibliography. in press pp. Woi-Id Data Center Afor Glaciology, Boulder, CO.Koster, .E.A. and M.E. Nieuwenhuijzen (1992). <strong>Permafrost</strong> resp<strong>on</strong>seto climatic change. In Boer, M.M. and E.A. Koster. (cds.),Ereenhouae-Impact <strong>on</strong> Cold-Climate Ecosystems and Landscapcs.Catena Supplement 22,- 37-58. Catena Verlag,Cremlingen-Destedt, Germany.Kvenvolden, K.A. (1988). Methane hydrates and glnbal climate.Olobal Biogeochemical Cycles 2(3), 221-229,Kvenvolden, K.A. and T.D. Lorens<strong>on</strong> (1993). Methane inpermafrost-preliminary results from coring at Fairbanks,Alaska. Chemosphere 26(1-4), 609-616.Lachenbruch, A.H. (1957). Thermal cffccts of the ocean <strong>on</strong>permafrost. Geological Society of America Bulletin 68,1515-1530.Lachenbruch, A.H. (1959): Periodic heat flow in a stratifiedmedium with applicati<strong>on</strong> to permafrost problems. U.S.Geological Survey Bulletin 10834, 36 pp.Lachenbruch, A.H. (1966). C<strong>on</strong>tracti<strong>on</strong> theory of ice-wedgepolyg<strong>on</strong>s: a qualitative dimd<strong>on</strong>. In <strong>Permafrost</strong><str<strong>on</strong>g>Internati<strong>on</strong>al</str<strong>on</strong>g> <str<strong>on</strong>g>C<strong>on</strong>ference</str<strong>on</strong>g>, 63-71. US. Nati<strong>on</strong>al Acadcrny ofSciences-Nati<strong>on</strong>al <strong>Research</strong> Council 1287, Washingt<strong>on</strong>, D.CLachenbruch, A.H. and B.V. Marshall (1986). Changing climate:geothermal evidence from permafrost in the Alaskan arctic.Science 234, 689-696.Lachenbruch, AH., J.H. Sass, B.V. Marshall, and T.H.J. Moses(1982). <strong>Permafrost</strong>, heat flow, and the geothermal regime atPrudhoe Bay, Alash. Journal of Geophysical <strong>Research</strong> 87(11B),9301-9316.Lachenbruch, A.H., T.T. Cladouhos, and R.W. Saltus (1988a).<strong>Permafrost</strong> temperature nnd the changing climate. In Senneset,K., (ed.). Promedings of the FX&h <str<strong>on</strong>g>Internati<strong>on</strong>al</str<strong>on</strong>g> <str<strong>on</strong>g>C<strong>on</strong>ference</str<strong>on</strong>g><strong>on</strong> <strong>Permafrost</strong>, Volume 3, 9-17. Tapir Publishers, Tr<strong>on</strong>dheim,Norway.Lafleur, P.M., W.R. Rouse, and D.W. Carls<strong>on</strong> (1992). Energybalance differences and hydrologic impacts across the northerntreeline. <str<strong>on</strong>g>Internati<strong>on</strong>al</str<strong>on</strong>g> Journal of Climatology 12(2), 193-203.Lavoie, C. and S. Payettc (1992). Black Spruce growth forms as arecord of a changing winter envir<strong>on</strong>ment at treeline, QuBbec,Canada. Arctic and Alpine <strong>Research</strong> 24(1), 4049.Levine, M.D., J.A. Sathaye, and F.P. Craig (1992). Strategies foraddressing climate change: policy pcrspcctives from around thcworld. Energy 17(12), 1121-1136.Lewkowica, A.0. (1992). Factors influencing the distributi<strong>on</strong> andinitiati<strong>on</strong> of activc-layer detachment stidcs <strong>on</strong> EllesmereIsland, arctic Canada. In Dix<strong>on</strong>, J.C. and A.D. Abrahams,(eds.), Periglacial Oeomorphology, 223-250. Wiley, New YorkLiang, F. and Z. OU (1993). Applicati<strong>on</strong> of remote sensing imagesto the investi~ati<strong>on</strong>s of the changes of permafrost envir<strong>on</strong>mentin burned forest regi<strong>on</strong>s, Da Hinggan Ling, China. InProceedings of the Sixlh <str<strong>on</strong>g>Internati<strong>on</strong>al</str<strong>on</strong>g> c<strong>on</strong>ference <strong>on</strong><strong>Permafrost</strong>, Volume 1, 388-392. South China University ofTechnology Press, Wushan, Uuangzhou, China.Luken, J.O. and W.D. Billings (1983). Changes in bryophyteproducti<strong>on</strong> associarep with a thermokarst erosi<strong>on</strong> cycle in asubarctic bog. Lindbergia 9, 163-168.Lunardini, V.Y. (1981). Heat Transfer in Cold Climates. 731 ppVan Nostrand Reinhold, New York.MacD<strong>on</strong>ald, G.J. (1990). Role of methane clathrates in past andfuture climaees. Climatic Change 16, 247-291.Maclray, J.R. (1975). The stability of permafrost and recentclimatic chnnge in the Mackenzia Valley, N.W.T. GeologicalSurvey of Canada Papcr 75-1, Part B, 1731176.Mackay, J.R. (1983). Downward water movement into frozen ground,western arctic mast, Canada, Canadian Journal of EarthSciences 20, 120-134.Mackay, J.R. (1986). Fifty years (1935 to 1985) of coastalretreat west of Tuktoyaktuk, District of Mackenzie. GeologicalSurvey of Canada Pap 86-1A, 727-735.Mackay, J.R. (1988). Pingo collapse and paleoclimaticrec<strong>on</strong>structi<strong>on</strong>. Canadian Journal of Earth Sciences 25(4),495-51 1.Macllray, J.R. and I.V.J. Matthews (1983). Pleistocene ice and sandwedges, Hoopcr Island, Northwest Territories. Canadian Journalof EIanh Sciences 20, 1087-1097.1002 '
Maxwell, J.B. (1992). Arctic climate: potential for Change undcrglobal warming. In Chapin, F.S. 111, P.L. Jeffcries, J.F.Reynolds, G.R. Shaver, and J. Svoboda, (eds.), ArcticEcosystems in a Changing Climate: an EcophysiologicalPerspective, 11-34. Academic Press, San Diego.Maxwell, J.B. and L.A. Barrie (1989). Atmospheric and climaticchange in the Arctic and Antarctic. Ambio 1, 42-49.McBeath, J.H. (1984). The Potcntinl Effects of Carb<strong>on</strong>Dioxide-Induced Climatic Changes in Alaska, Proccedings of a<str<strong>on</strong>g>C<strong>on</strong>ference</str<strong>on</strong>g>. 208 pp. School of Agriculture and Land ResourcesManagement, University of Alaska, Miscellaneous Publicati<strong>on</strong>83-1, Fairbanks.McGaw, R.W., S.I. Outcalt, and E. Ng (1978). Thermal propertiesand regime of wet tundra soils at Barrow, Alaska. InProceedings of the Third <str<strong>on</strong>g>Internati<strong>on</strong>al</str<strong>on</strong>g> <str<strong>on</strong>g>C<strong>on</strong>ference</str<strong>on</strong>g> <strong>on</strong><strong>Permafrost</strong>, Volume 1, 47-53. Nati<strong>on</strong>al Rescarch Council ofCanada, Ottawa.Melnikov, P.1. and R.B. Street (1992). Terrestrial comp<strong>on</strong>ent nlthe cryosphere. In Tegart, W.J.McG. and G.W. Sheld<strong>on</strong>, (eds.),Climate Change 1992: thc Supplzlncntary Report to the IPCCImpacts Assessment, 94-102. Australian Government PublishingService, Canberra.Mcssner, W., D. Bray, G. Germain, and N. Stcht (1992). Climatechange and social order; knowledge for acti<strong>on</strong>? Knowlcdge andPolicy 5(4), 82-10.Molau, U. (1992). ITEX Manual. 9 pp. Man and the BiosphereProgram, Goetborg, Swcdcn.v<strong>on</strong> Moltke, K. (1989). <str<strong>on</strong>g>Internati<strong>on</strong>al</str<strong>on</strong>g> agreement to stabilizeclimate: less<strong>on</strong>s from the Mantreal Protocol. Climatic Change14. 211-212.M<strong>on</strong>serud, R.A., N.M. Tcbebakova, and R. Lccmans (1993). Globs1vegetati<strong>on</strong> change predicted by the modified Budyko model.Climatic Change 25(1), 59-83.Moore, T.R. (199Oa). Gas exchanges between peatlands and theatmosphere. Canadian Geographer 34, 86-87.Moore, T. (1Y90b). Spatial and temparal variati<strong>on</strong>s of methaneflux from subarctichorthern boreal fens. OlobalBiogeochemical Cycles 4(1), 29-46.Moore. T.R. and R. Knowles (1987). Methanc and carb<strong>on</strong> dioxidcevolutinn from subarctic fens. Canadian Journal nf SoilScience 67, 77-81.Moore, T.R. and R. KnoGIes (199@). Methane emissi<strong>on</strong>s from fen,bog and swamp peatlands, Quebec. Biogeochemistry 11, 45-61.EZoraes. F. and M.A.K. Khalil (1993). <strong>Permafrost</strong> methane c<strong>on</strong>tent:2. Modeling theory and results. Chemosphere 26(1-4), 595-607.Morrissey, L.A. (1988). Predicting the occurrence of permafrostin the Alaskan disc<strong>on</strong>tinuous z<strong>on</strong>e with satellite darn. InSe<strong>on</strong>eset, K., (ed.), Proceedings of the Fifth <str<strong>on</strong>g>Internati<strong>on</strong>al</str<strong>on</strong>g><str<strong>on</strong>g>C<strong>on</strong>ference</str<strong>on</strong>g> <strong>on</strong> <strong>Permafrost</strong>, Volume 1, 213-217. Tapir Publishcrs,Tr<strong>on</strong>dhcim, Norway.Morrisscy, LA., L.L. Str<strong>on</strong>g, and D.H. Card (1986). Mappingpermafrost in the boreal forest with thcdatic mapper satellitedata. Photogrammetric Engineering and Remote Sensing 52(Y)1513-1520.Nakano, Y. and J. Brown (1972). Matbematical modeling andvalidati<strong>on</strong> of rbc thermal regimes in tundra soils, Barrow,AlasL8:Arctic and Alpine <strong>Research</strong> 4(1), 19-38.Nakayama, T., T. S<strong>on</strong>e, and M. Fukuda (1993). Effects of climaticwarming <strong>on</strong> the active layer. In Proceedings of thc Sixth<str<strong>on</strong>g>Internati<strong>on</strong>al</str<strong>on</strong>g> C<strong>on</strong>fercnce <strong>on</strong> <strong>Permafrost</strong>, Volume 1, 488-493.South China University of Technology Press, Wushan, Guangzhou, ,China.Nels<strong>on</strong>, F.E. (1989). <strong>Permafrost</strong> in eastern Canada: a review ofpublished maps. Physical Geography 10(3), 233-248.Nels<strong>on</strong>, F.E. and O.A. Anisimov (1993): <strong>Permafrost</strong> z<strong>on</strong>ati<strong>on</strong> inRussia under antbropogenic climatic change. <strong>Permafrost</strong> a;ldPeriglacial Processcs 4(3), 137-148.Nels<strong>on</strong>, F.E. and S.I. Outcalt (1987). A computati<strong>on</strong>al method forpredicti<strong>on</strong> and regi<strong>on</strong>alizati<strong>on</strong> of permafrost. Arctic andAlpine <strong>Research</strong> 19(3), 279-288.Nels<strong>on</strong>, F.E., S.1. Outcalt. C.W. Goodwin, and K.M. Hmkel (1985).Diurnal thermal regime in a pat-covered palm, Toolik Lake,Alaska. Arctic 38(4), 310-315.Oechel, W.C. and W.D. Billings (1992). Effects of global change<strong>on</strong> the carb<strong>on</strong> balance o€ Arctic plants and ecosystems, InChapin, F.S. 111, R.L. Jcfferies, J.F. Reynolds, G.R.Shaver, J. Svoboda, and E.W. Chu, (cds.), Arctic Ecosystems ina Changing Climate: an Ecophysiological Perspective, 139-168.Academic Press, San Diego.Oechel, W.C., S.J. Hasrings, G. Vourlitis, M. Jenkins, G.Riechers, and N. GruIke (1993). Recent change of Arctic tundraecosystems from a net carb<strong>on</strong> sink to a source. Nature 361,520-523.Qstcrkamp, T.E. (1989). Occurrence and potential importance ofsaline permafrost in Alaska. In Proceedings ul the Workshop <strong>on</strong>Saline <strong>Permafrost</strong>,, Winnepeg, Manitoba.Osterkamp, T.E. and T. Fei (1993). Potential occurrence ofpermafrost and gas hydrates in the c<strong>on</strong>tinental shelf nearL<strong>on</strong>ely. Alaska. In Proceedings of the Sixth <str<strong>on</strong>g>Internati<strong>on</strong>al</str<strong>on</strong>g><str<strong>on</strong>g>C<strong>on</strong>ference</str<strong>on</strong>g> <strong>on</strong> <strong>Permafrost</strong>, Volume 1, 500-505. South ChinaUniversity of Technology Press, Wushan, Guangzhou, China.Qsterkamp, T.E. and J.P. Oosink (1991). Variati<strong>on</strong>s in permafrostthickness in resp<strong>on</strong>sc to changes in paieoclimatc. Journal ofGeophysical <strong>Research</strong> 96B(3), 4423-4434.Outcalt, S.I., K.M. Hinkel, and F.E. Nels<strong>on</strong> (1992). Spectralsignature of coupled flaw in the refreezing active layer,northern Alaska. Physical G-grllphy 13(3), 273-284.Parker, R.L. (1977). Understanding inverse theory. Annual Reviewof Earth and Planetary Sciences 5, 35-64.'Morrissey, L.A. and G.P. Livingst<strong>on</strong> (1992). Methane emissi<strong>on</strong>sfrom Alaska Arctic tundra: an assessment of local spatialvariability. Journal of Geophysical <strong>Research</strong> 97(DIS),16,661-16,670.Peddle, D.R. and S.E. Fraultlin (1993). Clwificati<strong>on</strong> ofpermafrost active layer depth from remotely sensed andtopographic evidence. Remote Sensing of Envir<strong>on</strong>ment 44(1),67-80.
Pissan, A. (1990). Advances in periglacial geomorphology.Zeitschrift fur Gcomorphologie Supplcmcntband 79, 119-1 3 1Rasmussen, R.A., M.A.K. Khalil, and F. Moraes (1993). <strong>Permafrost</strong>methane c<strong>on</strong>tent: 1. Experimental data from sites in northernAlaska. Chemosphere 26(1-4), 591-594.Riscborough, D.W. (1990). Soil latent heat as a filter of theclimate signal in permafrost. In Proceedings of the FifthCanadian <strong>Permafrost</strong> C<strong>on</strong>fercncc, 199-205. Centre d'etudesnordiques, Universite LavallNati<strong>on</strong>al <strong>Research</strong> Council ofCanada, QuBbec.Riseborough, D.W. and M.W. Smith C1993). Modelling permafrostresp<strong>on</strong>se to climate change and climatc variability. InLunardinai, V.J. and S.L. Bowen, (cds.), Proceedings, Fw~rth<str<strong>on</strong>g>Internati<strong>on</strong>al</str<strong>on</strong>g> Symposium <strong>on</strong> Thermal Engineering & Sciencc forCold Regi<strong>on</strong>s, 179-187. US Army Cold Regi<strong>on</strong>s <strong>Research</strong> andEngineering Laboratory, SFcial Report 93-21, Hannvcr. NH.Solom<strong>on</strong>, A.M. and H.H. Shugart (eds. 1993). Vegetati<strong>on</strong> Dynamics &Global Change. 338 pp. Chapman & Hall, New York.Solovicv, P.A. (1959). Kriolitozana severnoi chastitcno-Amginskogo mezhdurechia. 144 pp, Izdatelslvo AN SSSR,Moscow.Stevens, W.K. (1993). In new data <strong>on</strong> climate changes, decades,not centuries, count. The New York Times December 7, C4.Street, R.B. and P.1, Melnikov (1990). Seas<strong>on</strong>al snow cnvcr, iceand permqfmst. In Tega'rt, W.J.McG., G.W. Sheld<strong>on</strong>, and D.CGriffiths, (eds.), Climate Change. The IPCC ImpactsAsscssment, 7.1-7.33. Australian Government PublishingService.Stuart, A. (1986). Thc development of a spatial permafrost modelfor northern Canada and its applicati<strong>on</strong> to scenarios ofclimate change. Kel<strong>Research</strong> Corporati<strong>on</strong>, Downsview, Ontario.Roots, E.F. (1989). Cliplate changc. high latitude regi<strong>on</strong>sClimatic Change 15(1/2), 223-253.Rothman, D.S. and D. Chapman (1993). A critical analysis ofclimate changc policy research. C<strong>on</strong>tempnrary Policy Issucs11(1), 88-98,Rohse, W.R., P.F. Mills, and R.B. Stcwar! (1977). Evaporm<strong>on</strong> inhigh latitudes. Water Resources <strong>Research</strong> 13. 909-914.Schmitt, E. (1y93). Global cllmatic change and some possiblegeomorphological and ecological effects in arctic permnfrnstenvir<strong>on</strong>mcnts, Isfjorden and Liefcdcfjorden, northernSpitsbcrgcn. In Proceedings of thc Sixtb <str<strong>on</strong>g>Internati<strong>on</strong>al</str<strong>on</strong>g>Cunferencc <strong>on</strong> <strong>Permafrost</strong>, Volume 1, 544-549. South ChinaUniversity of Technology Press, Wushan, Guangzhou, China,Shaver, G.R., W.D. Billings, F.S. Chapin 111, A.E. Gihlln. K.J.Nadclhoffer, W.C. Oechel, and E.B. Rastetter (1992: Globalchange and the carb<strong>on</strong> balance of Arctic ecosystcms. Biosclencc42, 433-441.Slaughter, C.W. and R.I. Hartzrnann (1993). Hydrologic and watcrquality charactstistics of a degrading open-system pingo. InProceedings of the Sixth <str<strong>on</strong>g>Internati<strong>on</strong>al</str<strong>on</strong>g> <str<strong>on</strong>g>C<strong>on</strong>ference</str<strong>on</strong>g> <strong>on</strong><strong>Permafrost</strong>, Volume 1, 574-579. South China University ofTechnology Press, Wushan, Guangzhou. China,Slaughter, C.W., J.W. Hilgcrt, and E.H. Culp (1983). Summerstreamflow and scdimcnt yield from disc<strong>on</strong>tinunus permafrostheadwater catchments. In Proceedings of the Fourth<str<strong>on</strong>g>Internati<strong>on</strong>al</str<strong>on</strong>g> <str<strong>on</strong>g>C<strong>on</strong>ference</str<strong>on</strong>g> <strong>on</strong> <strong>Permafrost</strong>, Volume 1, 1172- 1 177.Nati<strong>on</strong>al Academy Press, Washingt<strong>on</strong>. DC.Smith, M.W. and D.W. Riseborough (1983). Pcrrntlfrost sensitivityto climatic change. In Proceedings of thc Fourth <str<strong>on</strong>g>Internati<strong>on</strong>al</str<strong>on</strong>g><str<strong>on</strong>g>C<strong>on</strong>ference</str<strong>on</strong>g> <strong>on</strong> <strong>Permafrost</strong>, Volume I, 1178-1183. Nati<strong>on</strong>alAcademy Press, Washingt<strong>on</strong>, D.C.Solomatin, V.I. (1992). Deoecologia Severa, 270 pp. IzdatelstvoMGU, Moscow.Solom<strong>on</strong>, A.M. (1986). Transient resp<strong>on</strong>se of forests toC02-induced climate chhnge: simulati<strong>on</strong> modeling experiments ineastern North America. Oecologia 68, 567-519.Sugden, D. (1992). Global warming: Antarctic ice sheets at risk?Nature 359(6398), 775-776.Thic, 1. (1974). Distributi<strong>on</strong> and thawing of permafrost in thesouthern part of the disc<strong>on</strong>tinuous z<strong>on</strong>c in Manitoba. Arctic27, 1S9-2M).Thomas, G. and P.R. Rowntree (1992). The boreal forests endclimate. Quarterly Journal of the Royal Mctcorolopy Socicty11SB(505), 469-497.Tim<strong>on</strong>ey, K.P., G.H. La Roi, S.C. Zoltai, and A.L. Robins<strong>on</strong>(1992). The high subarctic forest-tundra of northwcsternCanada: positi<strong>on</strong>, width, and vegetati<strong>on</strong> gradients in relati<strong>on</strong>to climate. Arctic 45(I). 1-9.Torn, M.S. and E.S. Chapin I11 (1993). Envir<strong>on</strong>mental and bioticc<strong>on</strong>trols over methane flux from Arctic tundra. Chemosphere2q1-4). 357-368.Ulrich, R. and L. King (1993). Influence of mountain permafrost<strong>on</strong> c<strong>on</strong>structi<strong>on</strong> in the Zugspitze Mountains, Bavarian Alps,Germany. In Proceedings oi the Sixth <str<strong>on</strong>g>Internati<strong>on</strong>al</str<strong>on</strong>g> <str<strong>on</strong>g>C<strong>on</strong>ference</str<strong>on</strong>g><strong>on</strong> <strong>Permafrost</strong>, Volume 1, 625430. Proceedings of the Sixth<str<strong>on</strong>g>Internati<strong>on</strong>al</str<strong>on</strong>g> Cunference <strong>on</strong> <strong>Permafrost</strong>, Wushan, Guangzhou,China.VanC-nberghe, J. and A. Pissart (1993). <strong>Permafrost</strong> changcs inEuropc during the last glacial. <strong>Permafrost</strong> and PeriglacialProcesses 4(3), 121-135.Vins<strong>on</strong>, T.S. -.n? D.W. Hayley (1990). Global Warming and Clin-xt!c'Change. Journal of Cold Regi<strong>on</strong>s Engineering 4, 73 pp.Vourlitis, O.L., W.C. Oechel, S.J. Hstings, and h1.A. Jenkins(1993). The effect of soil moisture and thaw depth <strong>on</strong> CH4 fluxfrom wet coastal tundra ecosystems <strong>on</strong> thc North Slope ofAlaska. Chemosphsrc 26(1-4), 329-337.Vyalov, S.S., A.S. Gcrasimov, A,J. Zolotar', and S.M. Fotiev(1993). Ensuring structural stability and durability inpermafrost ground areas at global warming of the Earth'sclimate. In Proceedings of the Sixth <str<strong>on</strong>g>Internati<strong>on</strong>al</str<strong>on</strong>g> <str<strong>on</strong>g>C<strong>on</strong>ference</str<strong>on</strong>g><strong>on</strong> <strong>Permafrost</strong>, Volume 1, 955-960. South China University ofTechnology Press, Wushan, Guanglhou, China.1004
Waelbrocck, C. (1993). Climate-soil processes in the presence ofpermafrost: a systems modelling approach. Ecological Modelling69(3,4), 185-225.Wal& J.E. (1993). The elusive Arctic warming. Nature 36U6410).300-301. 'Wang, B. (1993). A numerical simulati<strong>on</strong> of coastal retreat andpermafrost c<strong>on</strong>diti<strong>on</strong>s, Mackenzie Delta Regi<strong>on</strong>, Canada. InPr-ings of the Sixth <str<strong>on</strong>g>Internati<strong>on</strong>al</str<strong>on</strong>g> <str<strong>on</strong>g>C<strong>on</strong>ference</str<strong>on</strong>g> <strong>on</strong><strong>Permafrost</strong>, Volume 1, 664-669. South China University ofl'echnology Press, Wusban, Changzhou. China.Weller, a. and B. Holmgren (1974). The microclimates of theAr& tundra. Journal of Applied Meteorology 13, 854-862.'Whalen, S.C. and W.S. Reeburgh (1988). A methane flux time seriesfor tundra envir<strong>on</strong>ments. cilobal Biogeochemical Cycles 2,399410.Williams, P.J. and M.W. Smith (1989). The Frozen Earth:Fundamentals of Qeocryology. 306 pp. Cambridge UniversityPress, New York.Winh, T.E. (1993). Developments in US Policy toward globalclimate change. US Department of State dispatch 4(22), 399.Woo, M.-k. (1986). <strong>Permafrost</strong> hydrology in North America.Atmosphere4cean 24, 201-234.Woo, M.-k. (1990). C<strong>on</strong>sequences of climatic change for hydrologyin permafrost z<strong>on</strong>es. Journal of Cold Regi<strong>on</strong>s Engineering 4(1),15-20.Woo, M.4 (1992). Impacts of climatic variability and change <strong>on</strong>Canadian wetlands. Canadian Water Resources Journal 17, 63-69.Woo, M.-k, A.G. Lewkowicz, and W.R. Rouse (1992). Resp<strong>on</strong>seCanadian permafrost envir<strong>on</strong>ment to climatic change. PhysicalGeography 13(4), 287-317.of theYarie, J. and K. Van Cleve (1991). Changes in the sourcelsinkrelati<strong>on</strong>ships of the Alaskan boreal forest as a result ofclimatic warming. fn Weller, a., C.L. Wilsan, and R.A.B.Sevcrin, (eds.), Proceedings, <str<strong>on</strong>g>Internati<strong>on</strong>al</str<strong>on</strong>g> <str<strong>on</strong>g>C<strong>on</strong>ference</str<strong>on</strong>g> ttwRole of the Polar Regi<strong>on</strong>s in Global Change, Volume 1143&439. Geophysical Institute, Univcrsity of Alaska.Fairbanks, AK.amolotchikova, S.A. (1988). Mean annual temperature of groundsin East sibcrh. h Senneset, K., (ea.), Proceedings of theFifth <str<strong>on</strong>g>Internati<strong>on</strong>al</str<strong>on</strong>g> <str<strong>on</strong>g>C<strong>on</strong>ference</str<strong>on</strong>g> <strong>on</strong> <strong>Permafrost</strong>, 237-240. TapirPublishers, Tr<strong>on</strong>dheim, Norway.Zhang, T. and T.E. Osterkamp (1993). Changing climate andPrmafrOst temperatUrCS in the Alaskan Arctic. In Proceedingsof the Sixth <str<strong>on</strong>g>Internati<strong>on</strong>al</str<strong>on</strong>g> <str<strong>on</strong>g>C<strong>on</strong>ference</str<strong>on</strong>g> <strong>on</strong> <strong>Permafrost</strong>, Volume 1,783-788. south China University of Technology Press, Wushan,Guangzhou, China.ZOlbi, S.C. and D.H. Vitt (1990). Holocene climatic change andthe distributi<strong>on</strong> of peatlands in western interior Canada.Quaternary <strong>Research</strong> 33(2), 231-240.1005
PRESENT HUMAN INDUCED CLIMATIC CHANGE AND CRYOECOI.,OGYMaria K. Gavrilova<strong>Permafrost</strong> Institute, Siberian Rranch, Russian Academy of Scicnccs, Yakutsk, 677018, Russia<strong>Permafrost</strong> is a c<strong>on</strong>scqucncc of cold climate. But the climate is not c<strong>on</strong>stant, It changes c<strong>on</strong>tinuously.Until recently cryogenic processes were altering under effect of natural climate changahility. M:ln's af"fect changing microclimate of locality has incrcascd rcccntly. Under large-scale activity it leads to CBI:IStrophes.A great danger may be caused by climatc warming under atmosphere polluti<strong>on</strong>. It will cause reinforcementof thermokarast phenomena.INTRODUCTION-- - - .Climate of any place undergoes c<strong>on</strong>tinuous changc bothshort-term and l<strong>on</strong>g-term (Gavrilova, 1992 a). At prcscnt, mancan not affect large-scale climate forming factors such as cosmic,astr<strong>on</strong>omic, geological and others, but can <strong>on</strong>ly influence to someextent the geographic factors as the atmosphere transparency andterrain.Predicted macroclimatic Change resulting from hurnan-induccdatmosphcric polluti<strong>on</strong> and an increase in carb<strong>on</strong> dioxidec<strong>on</strong>tent in the atmosphere in the future. Meanwhilc, permafrost rcscarchsare c<strong>on</strong>cerned about human-induced changes of a lowerscale, i.e. mesa-, micro- and nanoclimatic changcs causcd by tcrrainand surface disturbances.CI,TMATE AND NATURAL CRYOGENIC PHENOMENA. . -.. .. .- . . ... . "- ..... . - . ". . ...." . .-. .Pcrmatrost is characterized not <strong>on</strong>ly by negative temperatures,but thc presence of cementing L'rozen water ranging fromnllcroparliclcr to huge Ice bodies as well. sharp temperature fluctuall<strong>on</strong>sand phase transiti<strong>on</strong>s of watcr givc risc to cryogcnic processessuch ac trost fracturing, frost hcaving, ground icc melting,ground subqidence, thermokarst, thermal abrasi<strong>on</strong>, thermaldenudati<strong>on</strong>, thermal erosiori, soliflucti<strong>on</strong>, formati<strong>on</strong> of open andclosed taliks and others.These processes are active under natural c<strong>on</strong>diti<strong>on</strong>s, and theyarc associated with gcncral climatic and othcr physico-gcographicalc<strong>on</strong>diti<strong>on</strong>s. In recent ycars, it has hccn revcaled that they followa cyclic pattern coinciding with short-term (tens to hundrcds ofycnrs) clirnatc fluctuati<strong>on</strong>s. For cxamplc, during the years of heavyprecipitati<strong>on</strong> the fate of chel-mal erosi<strong>on</strong> incrcascs, and many newthcrmokarst lakes form, while during dry years the lakcs degrade,tilliks freeze below lakes, pingos form actively (Bosikov, IYYO).I)urine \v:lrnmcr periods ground water sccpagc and icing fbrm;~~l<strong>on</strong>occur intcnscly. Cooling is accompanied hv upward devc!opmcnt ofrcliel., while warming by 1iounw;ird dcwloprncnt (Shpolinnsk:li,l.1992).Cyclic:ll chnnpcc 111 cryopcnic procc\ws occur <strong>on</strong> ;I ~cawnc~llvhasi.; nc well. For cs;lmple. 111 :II-CRS 01 pcI-cnn1;11 Ircczlng ol groun,l.landslides are more active in fall (when frozcn material havcthawed), and in areas of seas<strong>on</strong>al freezing In spring after snow rnciting(Rosenbaum. Mudrov and Tumel, 1990). Intensified fracturingtakes place from November to March, i.e. when air and surfacetemperatures arc the lowest (Sukhodrovsky, 1969).MICROCI.IMATE AND ANTHROPOGENIC CRYOGENKC.... ". . .." . . .PHENOMENA. ..Under natural c<strong>on</strong>diti<strong>on</strong>s the cryogenic pl-ocesses take placeslowly and in a smallcr cxtcnt, and the ratc of rccovcry is hichcr.Human activities cause accelerati<strong>on</strong> of cryogenic processes, an increasein tile Rrea of adverse impacts, and the pcrmatrost tcrrainvery oftcn lose? its ability to recovery. A new gcosystcm forms. andpcrmafrost may disappcar in somc areas.Dernrestati<strong>on</strong> accompanying development of the regi<strong>on</strong>, rcrnovalof vcgctati<strong>on</strong> and snow cover, irrigati<strong>on</strong> and drainage improvemen:$cause. significant changes in the heat and moisture balancesboth at the ground surface and in the upper layer 01- thcground. This can lead to local permafrosl degradntl<strong>on</strong> oraggradati<strong>on</strong>, cspccially in thc island pcrmafrost ?<strong>on</strong>e, Tor example,in the Baiktll-Amur Railway Regi<strong>on</strong>.Invesilgati<strong>on</strong>s <strong>on</strong> heat balance and microclimate show thatdclbrcstati<strong>on</strong> :csults in intcnsificati<strong>on</strong> of seas<strong>on</strong>al thawing: in theNorth it is by a tactor of I .5, in Ccntral Yakutia by a factor of 2,and in southern Siberia soils frozcn in winter thaw cntircly. In theNorth removal of the soil cover (as the iorest litter) causes an addi-
ti<strong>on</strong>al increase under a disturbed surface freeze in winter more intensely.Observati<strong>on</strong>s in southern Yakutia show that if the mossand snow covers are removed, the upper soil temperatures are twiceas small in winter (Gavrilova, 1977,1973, 1978).The effects of human activities <strong>on</strong> permafrost depend <strong>on</strong> thescale and durati<strong>on</strong> of the impact, as well as the climatic z<strong>on</strong>e, terrainc<strong>on</strong>diti<strong>on</strong>s, the nature ofthe warm and cold seas<strong>on</strong>s, trends innaturally occuring processes. If human-induced and natural processescoincide in time, cryogenic processes intensify, if not, theymay be wcakened or even damped. On the whole, in cold Yakutiaclearing oi'trecs results in a lowering of the upper ground tcmperaturcs,while in warmer southern Siberia it causes permafrost to disappearin clear-cut areas.CATASTROPHIC.- CONSEQUENCES - OF MAN ACTIVITY 'INTHE CKYOLITHOZONE"". -"_ -In the permafrost areas, detrimental impacts of human activitiesbecome evident immediately. Deep impassable ruts and bogsformed al<strong>on</strong>g the paved roads in rural areas are the first evidences.If the early settlers of Siberia could simply displace the heaved gatesand fences, nowadays, this can not be applied to large blocks ofmulti-storey buildings in cites and large settlements, requiring urgentmaintenance measure;.Well-known Rykovsky fish-processing plant located in ArcticYakutia, which supplied tish to the entire country during the sec<strong>on</strong>dworld war, will have to be aband<strong>on</strong>ed within IO years. The icec<strong>on</strong>tcnt of the ground under the Bykovsky settlement is 90%, theice bodies are up to IO rn wide at the top, the thickness of a coveringground layer is <strong>on</strong>ly 0.6 to 1 m, average natural thaw depth is0.6 m (Grigoriev, et al., 1990). Disturbance of the upper 5 to 15 cmmoss and turf cover has initiated cryogenic processcs. The rate Ofshore erosi<strong>on</strong> is up to 10 m / yr.Warm permafrost is particularly sensitive to landscape disturbance,as in wcstern Siberia and the Far East. At exploratorydrill sites in northern Chukotka active layer thickness increases bya factor of 2 to 3 as compared to adjacent undisturbed areas, whenvcgetati<strong>on</strong>al and soil cover are removed, and the thawed z<strong>on</strong>e enlargesaround (Kotov and Maslov, 1992). Funnel-shaped hollowsform in (he mouth of deep oil and gas exploratory boreholes causedby melting of blocks of ground ice,Big towns generally favor the preservati<strong>on</strong> of permafrost andeven strcngthcn it duc to the existence of an insulating "culturallayer" and shadowing cflect of buildings. In the city of Yakutsk, ata depth of 10 m the ground temperatures lower to 4 to SoC belowzero during 4 to 5 years, if proper c<strong>on</strong>structi<strong>on</strong> and maintenanceapproaches are used (Popenko et al., 1990).Problems arise if c<strong>on</strong>structi<strong>on</strong> is performed carelessly neglectingstandards and codes for placing of foundati<strong>on</strong>s, c<strong>on</strong>structi<strong>on</strong>materials arc of poor quality, maintenance is made incorrectly,foundati<strong>on</strong>s are flooded by industrial and domestic waste. InYakutsk, 40% of large-panel residential buildings require urgentrepair measures, and 20% may collapse so<strong>on</strong>.Settlements located in the permafrost z<strong>on</strong>e are sources ofchemical c<strong>on</strong>taminati<strong>on</strong> of the envir<strong>on</strong>ment makarov, 1992). Poorpermeability of permafrost, small depth of thaw, low temperaturesand other factors facilitate the decay of chemical substances. c<strong>on</strong>-centrated soluti<strong>on</strong>s arq transported by surface water c<strong>on</strong>taminatehuge areas. In some locati<strong>on</strong>s weak platie-frozen pound and taliksmay develop. Salinized frozen ground erodes the c<strong>on</strong>crete foundati<strong>on</strong>s.C<strong>on</strong>taminated frozen ground becomes an awressive factarIimpeding man's activity,There is increasing c<strong>on</strong>cern about c<strong>on</strong>structi<strong>on</strong> of linear structurea (railwayes, highways, pipelines, power transmissi<strong>on</strong> lines, irrigati<strong>on</strong>channels, etc.). The reas<strong>on</strong> is that during c<strong>on</strong>structi<strong>on</strong> andmaintenance not <strong>on</strong>ly the c<strong>on</strong>structi<strong>on</strong> sites are disturbed, but adjacentareas as well. In many casm access roads have not been builtin advance, and drainage facilities have been made poorly. Jt hasresulted in deepcr thawing, ground subsidence, thermal erosi<strong>on</strong>,ground water seepage, icing, paludificati<strong>on</strong> and landslides.for the Baikal-Amur Railway the maintenance casts have alreadycxcceded the c<strong>on</strong>structi<strong>on</strong> costs. Z<strong>on</strong>es of thawed ground develop al<strong>on</strong>g oil and gas pipelines. In central Yakutia these z<strong>on</strong>es are0.75 to 1.5 m wide (Popov, 1992). Reclamati<strong>on</strong> channels are highlysusceptible, and when they are destroyed, it results in that agriculturallands become unusable because of water erosi<strong>on</strong> of' soils. Thewater in reclamati<strong>on</strong> channels causes melting of ice resulting in depressi<strong>on</strong>sand in cave-ins, and water is discharged to the formeddepressi<strong>on</strong>s. The bed of a channel made for basin irrigati<strong>on</strong>. in centralYakutia was designed to be 2 m wide 20 years later it is 10 to 20m wide (Ugarov, 1992; Chang and Melkozerav, 1992).Rccently, drainage and irrigati<strong>on</strong> imprpvements have been in+troduced in agricultural areas of Traisbaikal, Yakutia andChukotka because of dry climates there. These improvements hawbeen applied to 8.5% of agricultural lands in central Yakutia. Theyhave already resulted in grw producti<strong>on</strong> of fodder grass 15-18%,potatoes 80%, vegetables 100%. However, improper use of irrigati<strong>on</strong>methods (excessive irrigati<strong>on</strong> in particular ) results inpaludificati<strong>on</strong>,'formati<strong>on</strong> of depressi<strong>on</strong>s and cave-ins, heaving asthe permafrost is impervious to water. One quater of reclaimedlands have already had to be aband<strong>on</strong>ad. Restorati<strong>on</strong> is requiredthrough tilling of depressi<strong>on</strong>s, cutting pf mounds and grading.More frequent cycles of irrigati<strong>on</strong> with smaller amount Of Waterhave been recommended by the researchgrs of the <strong>Permafrost</strong> Instituteto prevent water from reaching the pound icetable(1ntensifikatsia ..., 1988; Gavriliev. 1991). C<strong>on</strong>StruCti<strong>on</strong> ofhydroelectric power plants exerts harmful infhencts 4" envir<strong>on</strong>ment(Bianov et ai., 1992). Water reservoirs must impoundedfor power plants because the riwr discharge is ,not uniformthroughout the year. However, forests and meadows are flooded,water quality deteriorates, hydrological and hydrogtalogical regimeschange, earth materials are redeposited. Impnunded Waterwarms up the reservoir bed and shores.The Vilui hydroelectric power plant was the first ,proict Onpermafrost. The water impoundment lasted 7 years (1967-1973). Inthe first year the depth of thaw in the water reservoir bed increasedto 5 m, in the sec<strong>on</strong>d year 7 m, in :he third year 8.5 m (ICamenskY Ctal., 1973). At present, thickness of the thawed layer is 20 m(Kamensky and Olovin, 1990). Fifteen-year observati<strong>on</strong>s(1977-1989) show that the retreat rate of low ice c<strong>on</strong>tent shores is 1to 2 m / yr, that of ice-rich shores is 4 to 5 m / yr (K<strong>on</strong>stantinov,1992).The modificati<strong>on</strong> of shorelines in the Amguema hydroelectricpower plant which is under c<strong>on</strong>structi<strong>on</strong> in Chukotka has been1007
~ ofpredicted to owur a8 following : during the tiit year of operati<strong>on</strong>the upper 1.5 to 2 m layer of unc<strong>on</strong>solidated rocks will be subjectedto thermal erosi<strong>on</strong>, in 2-3 years ground ice will extensively melt,later the water reservoir will enlarge 5% due to thawing ofpermafrost; finally vat and moss cover will come to the surfacethat can causc,damage to the power plant units(Tishin, 1990).PREDICTED CLIMATE WARMING AND THERMOKARSTNowadays mankind is c<strong>on</strong>cerned about predicted man+ducedglobal climatic change (warming) related to atmospheric polluti<strong>on</strong>resulting from industrial development. It is predicted that inthe middle of the 21st century global air temperatures may rise by 3k 1.5"c (Antropogenie izmencnia klimata, 1987). Climatic warmingis forecasted to be greater at high latitudes, i.e. in thepermafrost z<strong>on</strong>e (5 to 10°C per year) (Gavrilova, 1992 b). It is ob.vious that the earth surface and uppcr soil-ground will immediately resp<strong>on</strong>se to thcsc sharp changes. Cryogenic procesases will develop extensively as they arc dependent up<strong>on</strong> both climatic c<strong>on</strong>diti<strong>on</strong>sand 1ocal.buman-inductd impacts (Kachurin, 1961; Shur,1977; Romanovrky, 1977).Thennokarst development has the following stages: melting ofground ice, fornati<strong>on</strong> of a depressi<strong>on</strong>, filling with water, thermaland physical impact of water. drainage of a jake, diminishing of athermokarst feature.Melting of ice may commence due either climatic warming orlocal disturbance of an insulating layer (vegetati<strong>on</strong>al and soil cov-WS).Evidences of relict thermokarst relief are found in western andcasteh Siberia which developed 10 thousand years ago. It coincidedin time with the period of Late Pleistocene temperature maximum.The sec<strong>on</strong>d phase of intensive thetmokarst development (ofa smaller extent) took place 5 to 6 thousand years ago in centralYakutia (Yakutian temperature maximum) (Soloviev.1959) and 2.5to 3 thowand yea- ago in western Siberia (Late Holocene warming)Gcocccdogia Sever@, 1992). The thermokarat features that canbe observed at present in antral Yakutia are 200 to 300 years old,and those in western Sibcrip wd Chukotka are 500 to 700 years oldv<strong>on</strong>tirdiaro, 1972). Although it is believed that during the past 300to 400 years the climate (air temperatures) has not been changing,secular variati<strong>on</strong>s in humidity could have effect.Thennokarst development depends <strong>on</strong> all climatic factors:cloud patterns (radiative heating), temperature (general heat background),precipitati<strong>on</strong> (insulating effect of snowcover, water balancec<strong>on</strong>stituents), air humidity and winds (evaporati<strong>on</strong> rate ) andothers (Efimov. 1950; Nemvhinov, 1958; Sploviev, 1961).Precipitati<strong>on</strong> is 'a very important factor in development ofthermokarst features and associated lakes. Precipitati<strong>on</strong> changes <strong>on</strong>a alasses had less watmduring the periods of 3890-3900 and 1914to 1947, while between these two periods they had relatively greateramount of water (Soloviev, 1961). Direct relati<strong>on</strong>ship with precipitati<strong>on</strong>is found through meteorological research of precipitati<strong>on</strong> variati<strong>on</strong>s(Gavrilova, 1987k Bosikov_(l991) ghes aore &tailedchr<strong>on</strong>olcgy of high and low water prccipitati<strong>on</strong> data as well.Chigir (Geologia Scvera, 1992) bclievs that forecasts of changein thcmyogeasystem should take into account the comb'inati<strong>on</strong> ofsecular climatic sequences: warm and humid, warm and dry. coldand humid, cold and dry. The cryogenic processes will developdifferently in different periods.It is predicted that by the middle of the 21st century theamount of precipitati<strong>on</strong> will increase at high ' latitudes(Antropogenie izmenenia Klimata, 1987).CONCLUSIONThus, if global climate does change significantly in future, thecryogenic processes will develop intensely, thermokarst in particular.Thermokarst development will be caused both bymacroclimatic and microclimtic changes, i.e. global warming, increasein precipitati<strong>on</strong> amount, and extensive human activities.REFERENCESBudyko, M. and Y.Izrael (1987).,Antropogenie izmenenia klimata.407 p. Gidromoteoizdat, Leningrad.Bianov, G., M.Malyshev and I. Sergeev (1992). Ecological aspectsuse of hydroencrgy in the permafrost z<strong>on</strong>e: Ratsi<strong>on</strong>alnoieprirodopolzovanie v kriolitoz<strong>on</strong>e, 46-50 pp. Nauka, Moscow.Bosikov, N.(1990). Changability of general humidity in the areaand dynamics of cryogenic processes: Ratsioalnoieprirodopolzovanie v kriolitoz<strong>on</strong>e, 58 p. IMZ SO AN SSSR,Yakutsk.Chang, R, and G. Melkozerov (1992). Peculiarities of structure andperformance of reclamati<strong>on</strong> channels in Yakutia:Ratsi<strong>on</strong>alnoie prirodopolzovanie v kriolitoz<strong>on</strong>e, 86-92 pp.Nauka, Moscow.Efimov, A.(1950). Development of thermokarst lakes in centralYakutia: Isledovanie Vechnoi Merzloty v Takutskoi Respublike(V01.2), 98-1 14 pp. Izdatelstvo AN SSSR, Moscow.Gavrilova, M.(1973). Climate of central Yakutia (Klimat' Tsentralnoi Iakutii). 2nd editi<strong>on</strong>. 120 p. Knizhnoe izdatelstvo,Yakutsk.Gavribva, M. (1978). Climate and Perennial freezing of ground(Klimat i mnogoletnee promerzanie gornykh porod 1. 214 p.Nauka, Novosibirsk.Gavrilova, M.(1987). Analysis of changes in natural climatic c<strong>on</strong>diti<strong>on</strong>sin Yakutia to the beginning of the next century:Prirodnye uslovia osvaevaemykh regi<strong>on</strong>ov Sibiri. 146-1 59 pp.IMZ SO SSSR, Yakutsk.Gavrilova, M.(1992 a). Impact of global climatic change <strong>on</strong> thepermafrost z<strong>on</strong>e: Ratsi<strong>on</strong>alnoie prirodopolzovanie vkriolitoz<strong>on</strong>e, 4-8 pp. Nauka, Moscow.Gavrilyev, p. (1991). Reclamati<strong>on</strong> of permafrost areas in Yakutia(Melioratsia merzlotnykh zcmel v Iakutii). 182 p. Nauka,Novosibirsk.Solomatin, V.(1992). Geoecologia Scvera (vvcdenie vgeokrioecologiu) (Northern geoecology. Introducti<strong>on</strong> intogeocryecology). 270 p. Tzdatelstvo MGU, Moscow. .~Crigoriev, M., 1.Pozdniakov and V.Romanov (1SIM). Cryogenicprocpx,.in im. complex. gmcf-iiausid by man-induced disturbanceof the surface: Ratsi<strong>on</strong>alnoie prirodopolzovanic vkriolitoz<strong>on</strong>e, 60 p. ZMZ SO RAN, Yakutsk.,IntensiMratsia koiioproizvodstva v z<strong>on</strong>e reki Amgi.Recomendatsii (Intensificati<strong>on</strong> of producti<strong>on</strong> of fodder in theAmga River area) (1988). 40 p. Knizhnoie izdatclstvo, Yakutsk.Kachurin, S. (1961). Thermokarst development in the USSR terri-
tory (Termokarst na territorii SSSR). 292 p. Izdatelstvo ANSSSR, Moscow..Kamensky et al. (1973). Guide. North-western Yakutia (Putevoditel. Severo-Zapadnaia Iakutia). 45 p. IMZ SO ANSSSR , Yakutsk.Kanmensky, R. and B. Olovin (1990). Changes in climatic andpermafrost c<strong>on</strong>diti<strong>on</strong>s in the z<strong>on</strong>e of thermal impact from thelarge water reservoirs in the Far North: Ratsi<strong>on</strong>alnoieprirodopolzovanie v kriolitoz<strong>on</strong>e, 20-21 pp. IMZ SO ANSSSR. Yakutsk.K<strong>on</strong>stantinov, L(1992). Shore erosi<strong>on</strong> of the water rcscrvoir of theVilui hydroelectric power plant: Ratsi<strong>on</strong>alnoieprirodopolzovanie v kriolitoz<strong>on</strong>e, 57-63 pp. Nauka, Moscow.Kotov, A. and V. Maslov (1992). Man-induced changes in thepermafrost z<strong>on</strong>e of the Nizhneanadyr depressi<strong>on</strong>:Ratsi<strong>on</strong>alnoie prirodopolzovanie v kriolitoz<strong>on</strong>e, 159-165 pp.Nauka, Moscow.Makarov, V.(1992). Ecological-geochemical problcms in thepermafrost z<strong>on</strong>e in Yakutia: Ratsi<strong>on</strong>alnoie prirodopolzovaniev kriolitoz<strong>on</strong>e, 133-139 pp. Nauka, Moscow.Nemchinov, A.(1958). Cyclical variati<strong>on</strong>s of water levels in lakes incentral Yakutia: Nauchnie soobshenia Yakutskogo filiala ANSSSR (Vol.l), 30-37 pp. Knizhnoo izdatelstvo, Yakutsk.Popenko, H., A. Petrov, and S. Petrova (1990). Man-induced impacts<strong>on</strong> frozen Quaternary deposits in Yakutsk:Ratsi<strong>on</strong>alnoieprirodopolzovanie v kriolitoz<strong>on</strong>e, 96 p. IMZ SO AN SSSR,Yakutsk.Popov, V. (1992). Examinati<strong>on</strong> of a gas pipeline laid in the area ofice wedges: Ratsi<strong>on</strong>alnoie prirodopolzovanie v kriolitoz<strong>on</strong>e,102-107 gp. Nauka, Moscow.Rornanovsky, N. (1977).Theory of thermokarst: VestnikMoskovskogo Universiteta, seria geologia, No.1, 65-71 PP.Rosenbaum, G, Y. mudrov and N.Tume1 (1990). Effect of climaticchange <strong>on</strong> soliflucti<strong>on</strong>: Ratsi<strong>on</strong>alnoie prirodopolzovanic vkriolitoz<strong>on</strong>c, 12 p. IMZ SO AN SSSR, Yakutsk.Shpolianskaia, N. (1992). The permafrost z<strong>on</strong>e as an indicator ofpresent clirnatit-. change (Western Siberia): Ralsi<strong>on</strong>alnniepriodopolzovanie v kriolitoz<strong>on</strong>e, 30-35 pp. Nauka, Moscow.Shur, Y. (1977). Thermokarst (Thermokarst). 81 p. Nedra,Moscow.Solovicv, P. (1959). <strong>Permafrost</strong> in nothern part of the Lene-Amgaintcrfluvial (Kriolitoz<strong>on</strong>a severnoi chasti Leno-Amginskogomezhdurechia). 144 p. Izdatelstvo AN SSSR, Moscow.Solviev, P. (1961). Cyclical variati<strong>on</strong>s of watcr c<strong>on</strong>tent in thc alasslakes in central Yakutia related to climatic fluctuati<strong>on</strong>s: ,Voprosy geografii Yakutii, 48-54 pp. Knizhnoe izdatelstvo,Yakutsk.Sukhodrovsky, V.( 1969). Present relief formati<strong>on</strong> in ccntralYakutia: Voprosy geografii Yakutii (V01.5), 148-159 pp.Knizhnoe izdatelstvo, Yakutsk.Tishin, M. (1990). Predicti<strong>on</strong> of shoreline modificati<strong>on</strong>s in the waterreservoir of the Amguema hydroelectric power plant:Ratsi<strong>on</strong>alnoie prirodopolzovanie v kriolitoz<strong>on</strong>c. 26 p. 1MZ SOAN SSSR, Yakutsk.Tomirdiaro, S. (1992). Permafros; and development of mountain-' ous and lowland arcas (Vechnaia merzlota i osvoenie gornykhstran i nizmennostei ). 174 p. Magadan.Ugarov, 1.(1992). Methods of c<strong>on</strong>structi<strong>on</strong> of irrigati<strong>on</strong>. channels in,areas with ground ice occuring close to the surface:Ratsi<strong>on</strong>alnoie prirodopolzovanie v Kriolitoz<strong>on</strong>e, 92-94 pp.Nauka, Moscow.1009 '
RECENT PERMAFROST DEGRADATION ALONE THE QINGHAI-TIBET HIGHWAYCheng Guod<strong>on</strong>g", Huang Xiaoming** and Kang Xingcheng*"Lanzhou Institute of Glaciology and Geocryology,Chinese Academy of Sciences, Lanzhou, China**Northwest Institute of Chinese Railway Academyof Sciences, Lanzhou, ChinaThis paper presents some observati<strong>on</strong> results of climatic change and the resp<strong>on</strong>seof permafrost al<strong>on</strong>g the Qinghai-Tibet Highway during the last decades, anddiscusses a problem about the Qinghai-Tibet Plateau and initiati<strong>on</strong> of climaticchange.C<strong>on</strong>necting Lhasa and Xining, the respectivecapitals of the Tibet Aut<strong>on</strong>omous Regi<strong>on</strong> andQinghai Province, the Qinghai-Tibet Highwaytraverses more than 560 km of high-altitudepermafrost. Six meteorological stati<strong>on</strong>s arelocated al<strong>on</strong>g the highway; of these, Wudaoliang,Fenghuo Shan, and Tuotuohe are in the area ofthe plateau underlain by permafrost.Instrumental records show a coincidence oftrends in climatic changes between Xining inwestern China and those l.n eastern China andthe rest of the globe (Fig.2). The worldwidewarming that began in the 1880s reached amaximum in the 1940s (Zhang, 1976; Cheng, 1984).The instrumental records of five meteorologicalstati<strong>on</strong>s al<strong>on</strong>g the Qinghai-Tibet Nighway showdecreasing air temperatures during the 19609,and a pr<strong>on</strong>ounced reversal of this trend in the1970s. The <strong>on</strong>ly excepti<strong>on</strong> to this trend wasthe Wudaoliang stati<strong>on</strong> during the early 1980s(Fiy.3), although the reas<strong>on</strong>s for this situati<strong>on</strong>are not understood at present.PERMAFROST DEGRADATION ALONG THE QINGHAI-TIBETHIGHWAYEvidence of permafrost degradati<strong>on</strong> has beenfound in areas of both disc<strong>on</strong>tinuous andc<strong>on</strong>tinuous permafrost in the vicinity of thehighway, Temperature measurements and drillholesal<strong>on</strong>g the highway have dem<strong>on</strong>strated in manylocalities that near its lower altitudinal limitp~rmafrost is separated from the active layerby a thawed layer (Wang 1993).Another line of evidence in the regi<strong>on</strong> is arise in the base of the permafrost. Groundtemperature measurements from 1974 to 1989 ina borehole in the northern Jingxian valley atb530 m shows the permafrost base rose 5 m in15 years. The mean annual ground temperatureat A depth of 20 m increased by 0.2-0.3"Cduring the same period (Table 2). Moreover,some permafrost bodies have disappeared entirely,zic5s-Fig..l Locati<strong>on</strong>s of meteorological stati<strong>on</strong>sal<strong>on</strong>g the Qinghai-Tibet Highway
Table 1. Elevati<strong>on</strong> of meteorological stati<strong>on</strong>.8 al<strong>on</strong>g the Qinghai-Tibet HighwayStati<strong>on</strong> Golmud Wudaoliang Fenghuo Shan Tuotuohe NagquElevati<strong>on</strong>m, a.s.1.2806 4800 4700 4507 36580.40.30.20.10.0Fig.2 Comparis<strong>on</strong> of average temperature changes since 1870 in the world and in Xining, ChinaSuccessive 5-year means expressed as departures from the means for 1880-84 in the wholeworld and successive 5-year means expressed as temperature grades in China(Modified from Zhang, 1976)10-2-6It2""3"I="- 101950 1955 1960 1965 1970 1975 1980 1985 19901. Lhasa 2. Nagqu 3. Wudaoliang 4. Tuotuohe 5. GolmudFig.3 5-yaar running mean curves of air temperature <strong>on</strong> the Qinghai-Tibet PlateauTable 2. Rising of permafrost base at thenorth of Jingxian valleyarea attains thicknesses- of about 100 m. RecordsDepth of permafrost 1514 12 101992, mean annual temperature at a depth of 15 mbase (m)increased by 0.2'C, by 0.4'C at 10 m, by 0.8'Cat 5 m, and by 0,4"C at a depth of 3 m (Fig.4).Year 1974 1979 1985 1989 from Fenghuo Shan show a warming trend in bothair and ground temperatures, Between 1980 and(after Wang)Ground temperature measurements in two otherboreholes near Fenghuo Shan also illustrate theGround temperature measurements from 1975 towarming trend in permafrost in this area. Mean1989 in a borehole at 4670 m a.s.1. near HighwayMaintenance Squad No.124, for example, illustrateannual temperature at the 15 m level in a borehole<strong>on</strong> a south-facing slope increased by 0.1'C'the process of thinning and disappearance ofpermafrost near its former lower elevati<strong>on</strong>al 'limit (Table 3).from 1982 to 1992 (Fig.5). At the corresp<strong>on</strong>dingAreas of the Plateau underlain c<strong>on</strong>tinuouslyby permafrost have also been affected by degra-dati<strong>on</strong>. Fenghuo Shan stati<strong>on</strong> was established in1961 by the Northwest Institute of Railways ofthe Academy of Sciences. <strong>Permafrost</strong> in thisdepth is a borehole <strong>on</strong> a north-facing slope,mean annual temperature increased by a similaramount over a 28 year period (Fig.6).' 1011
.Table 3. Ground temperature in borehole 124-4("c)1 2 3 4 5 6 7 8 11 15 190 0.2 3.5 0.5 0.879-08-05 0.6 -0.1 -0.3 -0.1 -0.2 -0.20.184-08-07 -0.2 -0.3 -0.3 -0.10.1 o 0.2 0.7 0.8 0.989-07-26 0.7 0.1 0.10 0.1, 0.1 0.2 0.2 0.6 0.0 0.9(after Wang) parr1980 81 82 83 '84 85 86 87 88 89 I990 91 92-2.0 -- 2.5 -I 4II I II I I I I I l l I-3.0-Fig.4 Mean annual air and groundTsmpmmtvm ('01 -2 3temperatures at Fenghuo Shan Stati<strong>on</strong>Tomparature("C)0,2 -3 4I I I5-IO -15 -20 -25 -30 -Fig.5 Mean annual ground temperature. deep borehole at Fenghuo Shanin 20 rn35-Fig.6 Mean annual ground temperaturedeep borehole at Fenghuo Shanin 35 m
REFERENCESThe warm and colkl periods in eastern China,rec<strong>on</strong>structed for the last 500 years by meansof ;henology, are comparable to those obtainedfor the Qilian Mountains through dendroclimatologicalmethods. Based dn comparis<strong>on</strong>s betweeneastern China and the Qilian Mountains (Table4),the <strong>on</strong>set of both warm and cold pericds averages15 years earlier in the latter (Zhang et al.,1976, 1981; Cheng, 1YR4; Tang and Li, 1992).The air-temperature grade of the Qinghai-Tibet Plateau and the warm-cold periods in theQilitln Mountains have been rec<strong>on</strong>structed, based<strong>on</strong> tree-ring data. Comparis<strong>on</strong> between these datasets revealed that the relatively cold and warmperiods in Tibet were about 10-40 years, <strong>on</strong>average about 30 years earlier than those inthe Qilian Mountains (F'ig.7), Accordingly, ithas been suggested that the Qinghai-TibetPlateau may be an important source regi<strong>on</strong> forclimatic variati<strong>on</strong>s lasting 30-100 years (Tangand Li, 1992).Cheng Guod<strong>on</strong>g, (1984) Study of climate change inthe permafrost regi<strong>on</strong>s of China - A reviewin Final Proceedings of the 4th <str<strong>on</strong>g>Internati<strong>on</strong>al</str<strong>on</strong>g><str<strong>on</strong>g>C<strong>on</strong>ference</str<strong>on</strong>g> <strong>on</strong> <strong>Permafrost</strong>, Nati<strong>on</strong>al AcademyPress, Washingt<strong>on</strong>, D.C., pp.139-144.Tang Maocang and Li Cunqiang, (1992) An analysis<strong>on</strong> the Qinghai-Xizang Plateau as "a distrubingsource regi<strong>on</strong>" for climatic changes, inProceedings of the First Symposium <strong>on</strong> theQinghai-Xizang Plateau, Science Press,pp. 42-48.Wang Shaoling, (1993) <strong>Permafrost</strong> changes al<strong>on</strong>gthe Qinghai-Xizang Highway during the lastdecades, Arid Land Geography, Vo1.16, No.1,pp. 1-8.Zhang Jiacheng et al., (1976) Climatic changesand causes, Science Press, Beijing, pp.288.Zhang Xiang<strong>on</strong>g, Zhao Qin and Xu Ruizhen, (1981)Tree rings in Qilian Shan and the trend ofclimatic change in China, in Proceedings ofNati<strong>on</strong>al <str<strong>on</strong>g>C<strong>on</strong>ference</str<strong>on</strong>g> <strong>on</strong> Climatic Change,Science Press, Beijing, pp.26-35.Fig.7 Comparis<strong>on</strong> between the air temperaturegrade of the Qinghai-Tibet Plateau andthe warm-cold periods in QilianMountains during the last thousandyears (after Tang and Li)black - warm period:empty - cold period.Table 4. Comparis<strong>on</strong> of cold and warm periods between Qilian Mountains and east ChinaPeriodColdEast China(from phenology)1470-1520 A,D.1620-17201840-1890After 1945Qilian Mountains(from dendroclimatology)1428-1537 A,D.1622-17401797-1870after 1924Difference ofmedian year.12-1 231Warm1550-1600 A.D.1720-18301916-19451538-1621 A.D.1741-17961871-1923-7633
RESEARCH ON P EWROST AND PERICLACIAL PROCESSESIN MOUNTAIN AREAS - STATUS AND FERSPECTFJESWilfried HaeberliLaboratory of Hydraulics, Hydrology and Glaciology (VAW)Swiss Federal Institute of Technology (ETH), Zurich-SwitzerlandIWRODUCTIONDuring the past decades, intensified human activitytogether with the sensitive reacti<strong>on</strong> of snow and iceto <strong>on</strong>going and potential future warming trends led toremarkably increased awareness not <strong>on</strong>ly c<strong>on</strong>cerningthe scientific interest, beauty and vulnerability of coldmountain rages but also with regard to envir<strong>on</strong>mentalaspects, technical problems and natural hazardsencountered in such remote areas. In view of this development.the <str<strong>on</strong>g>Internati<strong>on</strong>al</str<strong>on</strong>g> <strong>Permafrost</strong> Associati<strong>on</strong>(lPA] established a working group <strong>on</strong> mouniain pma-@st at the Fifth <str<strong>on</strong>g>Internati<strong>on</strong>al</str<strong>on</strong>g> <str<strong>on</strong>g>C<strong>on</strong>ference</str<strong>on</strong>g> <strong>on</strong> Permali-ost.held at Tr<strong>on</strong>dheim, Norway. Within the frameworkof this activity and in cooperati<strong>on</strong> with the PAworking group <strong>on</strong> periglacial enuir<strong>on</strong>ments, internati<strong>on</strong>alworkshops were organized at Interlaken.Switzerland, in 1991 and at Calgary, Canada, in 1992.These workshops not <strong>on</strong>ly enabled exchange of experienceam<strong>on</strong>g specialists from various parts of the worldbut also aimed at assessing the state of knowledge inthe field and at formulating research recornmendati<strong>on</strong>sas well as internati<strong>on</strong>ally co-ordinated projectsfor the future. The following text attempts at drawingthe main c<strong>on</strong>clusi<strong>on</strong>s from these reflecti<strong>on</strong>s.STAlVSA series of situati<strong>on</strong> reports were compiled for theInterlaken workshop. In additi<strong>on</strong>, a review <strong>on</strong> mountainpermafrost and climatic change was written forthe IPA working group <strong>on</strong> present global change andpermafrost and discussed at the Interlaken workshop.These reports reflect a broad c<strong>on</strong>sensus am<strong>on</strong>g expertsand actively involved scientists about especiallyimportant topics c<strong>on</strong>cerned. They can be summarizedas follows:Prosvectina for mountain mvmafrost clnd rnavvinqof associated Dhenomena (King et al. 1992) requires acombinati<strong>on</strong> of techniques to be applied. Direct investigati<strong>on</strong>s(drilling. digging). indirect (geophysical)soundings and measurements (seismic refracti<strong>on</strong>, geoelectricresistivity, bottom temperatures of wintersnow, or radar), natural indicator phenomena (perennialsnow patches, cold springs emerging from snow-free areas, intact rock glaciers, push moraines s.~.,specific vegetati<strong>on</strong> patterns etc.) and computer sirnulati<strong>on</strong>sbased <strong>on</strong> empirically calibrated algorithms anddigital terrain informati<strong>on</strong> using Geographical Informati<strong>on</strong>Systems (Keller 1992) are most promising. Thetime of pure guessing with regard to the preserlce orabsence of mountain permafrost and to its main characteristics(temperature, thickness, ice c<strong>on</strong>tent)should now have definitely passed. Evidently, a minimumlevel of sophisticati<strong>on</strong> and funding is necessaryfor adequate research <strong>on</strong> permafrost and its relati<strong>on</strong>to periglacial processes and phenomena in highmountain areas. The most urgent need c<strong>on</strong>cerns detailedquantitative informati<strong>on</strong> from core drilling andborehole measurements (cf., for instance, V<strong>on</strong>derMflhll and Holub 1992).The study of the distributi<strong>on</strong> of mountain Bemafrostand climate (Cheng and Dramis 1992) first of allencounters dimcult problems with definiti<strong>on</strong>s (whereis the limit between "mountain" and "lowland' permafrost?]as well as with c<strong>on</strong>cepts ofiz<strong>on</strong>ati<strong>on</strong> or "beltati<strong>on</strong>"(c<strong>on</strong>tinuous - disc<strong>on</strong>tinuous - island sporadicpermafrost). Development of a comm<strong>on</strong> terminologywould facilitate the discussi<strong>on</strong> about global patternsof mountain permafrost distributi<strong>on</strong>. C<strong>on</strong>siderati<strong>on</strong> ofclimatic parameters such as mean annual air,temperature,freezing and thawing indices or solar radiati<strong>on</strong>(cf.. for instance, Hoelzle 1992) has been successful inat least half-quantitatively determining the influenceof altitude, latitude and c<strong>on</strong>tinentality <strong>on</strong> large-scaleoccurrence patterns and characteristics of mountainpermafrost. However, c<strong>on</strong>tinued research is needed tounderstand regi<strong>on</strong>al variability in more detail. In particular,the surface energy balance in mountain permafrostareas and active layer processes (especiallyadvective energy fluxes involved with steeply inclinedblocky surface layers) up to now essentially remainblack boxes in our understanding and striking obstaclesto scientific progress;A c<strong>on</strong>siderable variety of field and laboratory investigati<strong>on</strong>sis being devoted to processesin the wrialacial mountam belt as related to seas<strong>on</strong>allyand wrmy&llu frozen uround (Lautridou et al. 1992).One special focus of interest c<strong>on</strong>cerns the chain ofprocesses and forms linking mechanical weathering ofrock walls, cliff recessi<strong>on</strong>, scree formati<strong>on</strong>, and debris1014
displacement by soliflucti<strong>on</strong>, avalanches, debris flowsand permafrost creep (cf. also Olyphant 1983). Aspecial meeting held at Caen. France in 1991, devotedto problems of cryogenic weathering and organizedunder the auspices of the ICU commissi<strong>on</strong> <strong>on</strong> frostacti<strong>on</strong> envir<strong>on</strong>ments and the IPA working group <strong>on</strong>periglacid envir<strong>on</strong>ments illustrated the advantages ofcombining laboratory experiments with extensive fieldmeasurements and theoretical mbdelling (cf.. for instance,Matsuoka 1991). The model of crack propagati<strong>on</strong>due to segregati<strong>on</strong> ice growth in water-saturatedrocks with interc<strong>on</strong>nected cracks as proposed by Halletet al. (1991) deserves special attenti<strong>on</strong>, especiallywith regard to the influence of permafrost c<strong>on</strong>diti<strong>on</strong>sin bedrock walls. The corresp<strong>on</strong>ding effects relating tothe c<strong>on</strong>tinuous presence of ice in cracks at greaterdepth, the influence of l<strong>on</strong>g-term warming trends andthe potential destabilizati<strong>on</strong> of heavily fissured rockmasses in greater volumes remain to be investigated.Thanks to a growing number of precise field measurements(drilling. geophysics. photogrammetry etc.),permafrost creev <strong>on</strong> doves and rock olackr fimsti~nare now much better understood than a few decadesago (Barsch 1992). Perennial freezing and supersalurati<strong>on</strong>in ice of n<strong>on</strong>-c<strong>on</strong>solidated materials such astalus, till or even anthropogenic deposits induces fundamentalchanges in their geotechnical properties byreducing internal fricti<strong>on</strong> between rock particles andby enabling large-scale stress transmissi<strong>on</strong> and cohesiveflow behaviour according to the rheology of icerather than to that of n<strong>on</strong>-c<strong>on</strong>solidated debris. Rockglaciers and push moraines S.S. as the landforms resultingfrom cumulative straining of perennially.frozensediment bodies are composite products of various interactingand competing processes involved with thebuild-up and transformati<strong>on</strong> of talus or moraines byvarious slow and rapid processes. Inherent to thecomplex origin of such landforms with their manifoldtransiti<strong>on</strong>s and analogues is the fact that definiti<strong>on</strong>sand terminologies necessarily remain problematic.Emphasis should therefore rather be <strong>on</strong> the investigati<strong>on</strong>of the thermal and rheological c<strong>on</strong>diti<strong>on</strong>s involvedwith l<strong>on</strong>g-term preservati<strong>on</strong> of ice underneath the surfaceand the creep mode of ice/rock mfxtures (cf., forinstance, V<strong>on</strong>der Milhll and Haeberli 1990, Wagner1992). Such an approach also has the potential of improvingthe paleoclimatic interpretati<strong>on</strong> of relict featuresof permafrost creep (cf., for instance. Dramisand Kotarba 1992, Sollid and Ssrbel 1992).A great amount of work remains to be d<strong>on</strong>e in orderto learn more about the complex relafl<strong>on</strong>s a n ateracti<strong>on</strong>s between mountain aennafrost. olaciesnow and wata (Harris and Carte 1992). The radic%change of permeability at the permafrost table is a vitalsource of soil moisture in arid regi<strong>on</strong>s and greatlyspeeds up suprapermafrost runoff durlng snowmelt orliquid precipitati<strong>on</strong>. Soil and active layer texturethereby plays ari important role and also heavily influengsc<strong>on</strong>ductive and advective fluxes of sensible aswell as latent heat. The behaviour of intra- and subpermafrostwater is best studied using tracer experi-ments, borehole observati<strong>on</strong>s (cf., for instance, Tenthorey1992, V<strong>on</strong>der MCihll 1992) and physico-chemicalanalyses of water-cycle comp<strong>on</strong>ents. The snowcover as <strong>on</strong>e of these comp<strong>on</strong>ents is linked to mountainpermafrost through especially close interacti<strong>on</strong>sinvolving thermal ground insulati<strong>on</strong> during cold periods,reduced snow metamorphosis within and retardedspring runoff from the winter snowpack in permafrostareas as well as intense ground cooling by latentheat, snow emissivity and albedo effects duringsummer to fall (Keller and Gubler 1993). The relati<strong>on</strong>between permafrost and glaciers is quite well understoodin a general way and for static c<strong>on</strong>diti<strong>on</strong>s (cryosphereschemes: maritime and c<strong>on</strong>tinental climaticc<strong>on</strong>diti<strong>on</strong>s) but detailed understanding of individualcases requires modelling of complex time-dependentflow and freeze/ thaw dynamics with fullglacier/pennafrost coupling - a challenge for the 21stcentury ?Experience with c<strong>on</strong>structipn, envir<strong>on</strong>mental aroblemsand natural hazards in Jwrinlacial mountain beltsgrows but is still far from being adequate (Haeberli1992). Systematic site investigati<strong>on</strong> and design recommendati<strong>on</strong>sare needed for c<strong>on</strong>structi<strong>on</strong> <strong>on</strong> perenniallyfrozen ground of buildings, hydropower andtransportati<strong>on</strong> installati<strong>on</strong>s or protecti<strong>on</strong> work againstfloods, rockfalls and snow avalanches at high altitudes.Envir<strong>on</strong>mental aspects related to permafrostshould be more thoroughly studied in c<strong>on</strong>necti<strong>on</strong> withthe preparati<strong>on</strong> and maintenance of ski runs and thehazards from steep periglacial slopes must be morecarefully c<strong>on</strong>sidered. During the extraordinary floodsin the Alps in summer 1987, the periglacial belt producedthe largest sediment volumes eroded and displacedby debris flows. It is also noteworthy that thelast three major rock fall events in the Alps all seem tohave had some - still unexplained - c<strong>on</strong>necti<strong>on</strong>s withperennial ice in bedrock cracks Wal Pola/Valtellina.Italia 1987; Tschierva/Engadin. Switzerland 1988) orincreased hydraulic c<strong>on</strong>ductivity in degrading permafrost(Randa/Matter Valley, S&itzerland 1991). Thethinking process c<strong>on</strong>cerning the effects of permafrostgrowth and degradati<strong>on</strong> <strong>on</strong> steep slopes and rockwalls needs to be intensified. On the Qinghai-XizangPlateau, highway c<strong>on</strong>structi<strong>on</strong> <strong>on</strong> relatively warm permafrostand the danger of increasing desertificati<strong>on</strong>with potential future warming and permafrost degradati<strong>on</strong>are of greatest c<strong>on</strong>cern (cf. Guo and Zhao1993).The sensitivity of surface and subsurface ice withrespect to atmospheric c<strong>on</strong>diti<strong>on</strong>s together with theintensity of morphodynamic processes In rugged topographyleads to str<strong>on</strong>g reacti<strong>on</strong>s of mountain PWmafrostto clfmatic chanoe (Haeberli et al. 1993a). Thefocus of interest is with the marked warming periodsof the late Pleistocene and the 20th century as a basisfor better understanding and realistically anticipatingeffects of potentially c<strong>on</strong>tinued if not accelerated futurewarming due to anthropogenic greenhouse forcing.Combined glacier/permafrost studies have beenquite successful in rec<strong>on</strong>structing regi<strong>on</strong>al patterns of1015
paleotemperature and paleaprecipitati<strong>on</strong> during thelate glacial transiti<strong>on</strong> from predominantly cold anddry to generally warmer and more humid c<strong>on</strong>diti<strong>on</strong>ssuch as it appears to have been characteristic formany mountain ranges. Backward extrapolati<strong>on</strong> ofstatistical relati<strong>on</strong>s between borehole temperatures inpermafrost and meteorological parameters (air temperature,thickness of winter snow etc.) may help withassessing permafrost evoluti<strong>on</strong> in relati<strong>on</strong> to 20thcentury warming and - for cases with supersaturated(low-permeability) permafrost ~ can be compared withanalyses of borehole temperature profiles using heatc<strong>on</strong>ducti<strong>on</strong> theory. It should thereby be kept in mindthat both, the signals from and the effects <strong>on</strong> mountainpermafrost, are highly relevant to studies of globalwarming trends, because they reflect 3-dimensi<strong>on</strong>alaspects (latitude/l<strong>on</strong>gitude/altitude) of cryospherechanges and c<strong>on</strong>cern <strong>on</strong>e of the most heavily affectedecosystems <strong>on</strong> earth.PERSPECTIVESDecades of worldwide research in periglacialmountain belts have enabled the present state ofknowledge to be developed. This traditi<strong>on</strong> of highmountain research ha5 l<strong>on</strong>g been predominantly directedat the most fascinating phenomena and atproblems which could be addressed and treated byindividuals, small research groups and modestinstrumentati<strong>on</strong>. The future potential for fast changesand extreme disequilibria in cold mountain areas,however, is a challenge which more and more requiresdetailed process studies c<strong>on</strong>cerning aspects andquesti<strong>on</strong>s which have remained nearly untoucheduntil recently. Scientific progress is now especiallynecessary in the fields of n<strong>on</strong>-steady evoluti<strong>on</strong>s of andinteracti<strong>on</strong>s between various comp<strong>on</strong>ents of themountain envir<strong>on</strong>ment like permafrost and snow,glaciers, groundwater or bedrock under c<strong>on</strong>diti<strong>on</strong>s ofchanging surface energy balance. In additi<strong>on</strong> to suchprocess studies, internati<strong>on</strong>al coordinati<strong>on</strong> andcooperati<strong>on</strong> could be envisaged with regard topina. modellina and m<strong>on</strong>itoring of mountain permafrostin order to reach a more complete view in spaceand time of present c<strong>on</strong>diti<strong>on</strong>s and potentfal futuredevelopments. Corresp<strong>on</strong>dlng.research strategies firstof all depend <strong>on</strong> the scale c<strong>on</strong>sidered.An overview at the scale of hmlispheres and c<strong>on</strong>ttngntScan be gained by compiling the existing literatureand by applying climatic indices of large-scalepermafrost occurrence such as mean annual air temperature~n combinati<strong>on</strong> with altitude informati<strong>on</strong> anda simplified classificati<strong>on</strong> of vertical belts. A first stepinto this directi<strong>on</strong> was made with the extensive discussi<strong>on</strong>and intercomparis<strong>on</strong> of mountain permafrostc<strong>on</strong>diti<strong>on</strong>s during the field trips in the Alps and in-theAlberta Rocky Mountains as c<strong>on</strong>nected to the IPAworkshops at Interlaken and Calgary. Previouslymenti<strong>on</strong>ed differences in relative extent of altitudinalpermafrost belts (c<strong>on</strong>tinuous, disc<strong>on</strong>tinuous, sporadic)were recognized to be first of all due to differentdefiniti<strong>on</strong>s and terrninolo&. In the Alpine sense of theterm, a belt of disc<strong>on</strong>tinuous permafrost indeed extendsover at least 600 meters and probably evenmore in the Alberta Rockies. Striking differences innature, however. Tor the Alberta Rockies as comparedwith the Alps c<strong>on</strong>cern structural-geologic influences(predominance of bedded sedimentary rocks). therarity of the meadow belt, and the marked overlap betweenpermafrost and forest areas. Attempts arepresently being made at compiling a map of circumpolarpermafrost distributi<strong>on</strong> for the northern hemisphere,which also c<strong>on</strong>tains general informati<strong>on</strong> c<strong>on</strong>cerningthe occurrence of low-latitude mountaln permafrost.The three reviews <strong>on</strong> permafrost in mountainranges of North +erica (Harris and Ciardino 1993).Europe (King and Akermann 1993) and Central Asia(Qiu 1993) prepared in c<strong>on</strong>necti<strong>on</strong> with the presentc<strong>on</strong>tributi<strong>on</strong> for the same special sessi<strong>on</strong> <strong>on</strong> mountainpermafrost and periglacial processes within theframework of the VI <str<strong>on</strong>g>Internati<strong>on</strong>al</str<strong>on</strong>g> <str<strong>on</strong>g>C<strong>on</strong>ference</str<strong>on</strong>g> <strong>on</strong> <strong>Permafrost</strong>are examples of such cornpilati<strong>on</strong>s. Based <strong>on</strong>earlier reviews (cf. for instance Cheng 1983. Corte1988, Fuji and Higuchi 1978. Gorbunov 1978, Harris1988) and newly available informati<strong>on</strong>. it should bepossible to reach global coverage at a comparable levelwithin the corning years.The combinati<strong>on</strong> of mapping and modelling techniquesshould enable c<strong>on</strong>siderable progress to bemade in the corning years at the scale of indiuidualmouniain mnaes and arwas of mountains. Spatialsimulati<strong>on</strong> of permafrost c<strong>on</strong>diti<strong>on</strong>s by computer (GIs)models making use of digital terrain informati<strong>on</strong>should thereby be compared with maps and inventoriesof indicator phenomena such as intact rock glaciers.l<strong>on</strong>g-lasting snow, or suitable vegetati<strong>on</strong> patterns.C<strong>on</strong>cerning rock glaciers as permafrost indicators,not the origin of the ice but the thermalc<strong>on</strong>diti<strong>on</strong> for preserving ice in the ground over l<strong>on</strong>gperiods, Le. perennially negative ground temperatures,c<strong>on</strong>stitute the essential point. Other potentialindicator phenomena in permafrost-underlain peatlandas well as the Kurums of Asian authors needmore detailed investigati<strong>on</strong>. The presently availableempirical rules from the Alps for predicting permafrostdistributi<strong>on</strong> as a functi<strong>on</strong> of topography can <strong>on</strong>ly beapplied to other mountain areas after transformati<strong>on</strong>of the involved functi<strong>on</strong>s (aspect. altttude. snow/avalanche' effects) according to large-scale variati<strong>on</strong>sin mean air temperature. solar radiati<strong>on</strong> and precipitati<strong>on</strong>regimes (effects of latltude and c<strong>on</strong>tinentality).Systematic applicati<strong>on</strong> and field testing of modifiedmodel versi<strong>on</strong>s for selected mountain ranges couldhelp with adapting and further developing, i.e.generalizing the algorithms. which would then alsosewe as a key for simulating past and potential futurechanges as a resp<strong>on</strong>se to climatic forcing. At the sametime. models are to be developed and tested whichmore closely relate to physical processes. especially tot.he surface energy balance with its prinripal influencingparameters: solar radiati<strong>on</strong>, temperature and snow(cf. Hoeble et al. 1993).
~ <str<strong>on</strong>g>C<strong>on</strong>ference</str<strong>on</strong>g>The basis for such improved models is formed bydetailed process studies, modelling of transient reacti<strong>on</strong>sand l<strong>on</strong>g-term m<strong>on</strong>itoring at the scale of &lcatchments and selected research sites. At present,neither the climatic scenarios provided by GeneralCirculati<strong>on</strong> Models (CCMs) nor the present knowledgeabout mountain permafrost as a functi<strong>on</strong> of topographyand microclimatic c<strong>on</strong>diti<strong>on</strong>s enable any exactregi<strong>on</strong>al/local predicti<strong>on</strong>s to be made. L<strong>on</strong>g-term measurementsof the most important parameters involved(temperature, rheological properties, ice c<strong>on</strong>tent, hydraullcpermeability. frost heave and thaw settlementetc.) are therefore of high priority. The techniques(drilling, borehole observati<strong>on</strong>, photogrammetry, semiquantitativeanalysis of infrared aerial photography,runoff measurements etc.) for such l<strong>on</strong>g-term m<strong>on</strong>itoringpurposes are available loday. Corresp<strong>on</strong>dingprogrammes have recently been initiated in someplaces (Haeberli et al. 1993b) but need internati<strong>on</strong>allyco-ordinated support and completi<strong>on</strong>. Results froml<strong>on</strong>g-term m<strong>on</strong>itoring - as they become available - canbe used to calibrate models of transient resp<strong>on</strong>se atindividual points (for instance, heat c<strong>on</strong>ducti<strong>on</strong>,melting and thaw settlement in material with varlableice c<strong>on</strong>tent, etc.). Calculati<strong>on</strong>s for Individual pointscan later be combined with spatial simulati<strong>on</strong>s ofsurface permafrost c<strong>on</strong>diti<strong>on</strong>s in order to simulatetypical t;ansient effects at depth for extended areas.In a further step, such model simulati<strong>on</strong>s must betested and further developed by applying apprapriatesounding methods at characteristic sites indicated bymodel simulati<strong>on</strong>s. They could then hint at especiallysensitive areas and help assessing the representativityof m<strong>on</strong>itoring at a restricted number of sites. In fact,our state of knowledge and preparedness with regardto assessing and hopefully mitigating potential effectsof realistic warming scenarios essentially depends <strong>on</strong>the: establishment of adequate l<strong>on</strong>g-term m<strong>on</strong>itoringprogrammes.RECOMMEN1)ATIONS AND ACKNOWLEDGEMENTSSystematic internati<strong>on</strong>al coordinati<strong>on</strong> and cooperati<strong>on</strong>c<strong>on</strong>cerning permarost at high altitudes and inrugged topography should c<strong>on</strong>tinue with emphasis bnmodelling, mapping and m<strong>on</strong>itoring, especially in viewof potential future warming effects. A c<strong>on</strong>centratedknowledge transfer and inter-comparis<strong>on</strong> projectcould be carried out in various mountain areas of theworld with regard to the applicati<strong>on</strong> of CIS-modelsusing digital terrain informati<strong>on</strong> in combinati<strong>on</strong> withfield mapping (rock glacier distributi<strong>on</strong>, soil andspring temperatures, BE soundings etc.) for simulatingpresent-day. past and potential future permarostdistributi<strong>on</strong> patterns. In additi<strong>on</strong>, co-ordinatedplanhing of m<strong>on</strong>itoring programmes (photogrammetry,borehole observati<strong>on</strong>s, surface energy balance etc.)should be stimulated and the short/l<strong>on</strong>g-term stabilityof supersaturated sediments <strong>on</strong> slopes (creep/ rockglaciers. thaw/ debris flows) be examined/modelled byapplying modern sounding/computer techniques.Thanks are due to the members of the IPA workinggroup <strong>on</strong> mountatn permafrost and to J.P. Lautridou,chairman of the IPA working group <strong>on</strong> periglacial enutr<strong>on</strong>mentsas well as to the involved IPA council membersfor their most valuable and encouraglng help andassistance during the first 5 years of working groupactivity. The members of the PA working group <strong>on</strong>mountafn permafrost, J.P. Lautridou and a number offriends and colleagues at VAW/ETH Zurich reviewdan early draft of the present report.REFERENCESBarsch. D. (1992): <strong>Permafrost</strong> creep and rockglaciers.<strong>Permafrost</strong> and Periglacial Processes 3. 3, p.175 - 188.Cheng, G. (1983): Vertical and horiz<strong>on</strong>tal z<strong>on</strong>ati<strong>on</strong> ofhigh-altitude permafrost. Fourth <str<strong>on</strong>g>Internati<strong>on</strong>al</str<strong>on</strong>g><str<strong>on</strong>g>C<strong>on</strong>ference</str<strong>on</strong>g> <strong>on</strong> <strong>Permafrost</strong>, Fairbanks,Alaska/USA, Proceedings. p. 136 - 141.Cheng. G. and Dramis. F. (1992): Distributi<strong>on</strong> ofmountain permafrost and climate. <strong>Permafrost</strong>and Periglacial Processes 3, 2. p. 83 -91.Corte, AE. (1988): Geocryology of the central Andesand rock glaciers. Fifth <str<strong>on</strong>g>Internati<strong>on</strong>al</str<strong>on</strong>g> <str<strong>on</strong>g>C<strong>on</strong>ference</str<strong>on</strong>g><strong>on</strong> <strong>Permafrost</strong>, Tr<strong>on</strong>dheim. Norway, koceedings1, p. 718 - 723.Dramis. F. and Kotarba, A (1992): Southern limit ofrelict rock glaciers, Central Apennines. Italy.<strong>Permafrost</strong> and Periglacial Processes 3, 3, p.257 - 260.Fuji, Y. and Higuchi, K. (1978): Distributi<strong>on</strong> of alpinepermafrost in the northern hemisphere andits relati<strong>on</strong> to air temperature. Third <str<strong>on</strong>g>Internati<strong>on</strong>al</str<strong>on</strong>g><str<strong>on</strong>g>C<strong>on</strong>ference</str<strong>on</strong>g> <strong>on</strong> <strong>Permafrost</strong>, Edm<strong>on</strong>t<strong>on</strong>,Canada, Proceedings 1, p. 367 - 371.Gorbunov. A.P. (1978): <strong>Permafrost</strong> Investigati<strong>on</strong> inhigh mountain regi<strong>on</strong>s. Arctic and Alpine <strong>Research</strong>10, 2, p. 283 - 294.Guo D<strong>on</strong>gxin and Huang Yizhi (1993): A guide to thepermafrost and envir<strong>on</strong>ment of the Qinghai-Xizang Plateau (field trip Lanzhou - Lhasa:July 11 - 22, 1993). Published by the OrganizingCommittee of the Sixth <str<strong>on</strong>g>Internati<strong>on</strong>al</str<strong>on</strong>g><strong>on</strong> <strong>Permafrost</strong>. 56p.Haeberli. W. (1992): C<strong>on</strong>structi<strong>on</strong>, envir<strong>on</strong>mentalproblems and natural hazards in periglacialmountain belts. <strong>Permafrost</strong> and PerlglacialProcesses 3, 2, p. 111 - 124,. 1017 9
173,Haeberli. W.. Cheng, G., Gorbunov, AP. and Harris,S.A. (1993, a): Mountain permafrost and climaticchange. <strong>Permafrost</strong> and PeriglacialProcesses 4. 2. p. 165 - 174.Haeberli, W., Hoelzle. M., Keller. F., Schmid, W., V<strong>on</strong>derMohll, D. and Wagner, S. (1993,b): M<strong>on</strong>itoringthe l<strong>on</strong>g-term evolu'ti<strong>on</strong> of mountainpermafrost in the Swiss Alps. Sixth <str<strong>on</strong>g>Internati<strong>on</strong>al</str<strong>on</strong>g><str<strong>on</strong>g>C<strong>on</strong>ference</str<strong>on</strong>g> <strong>on</strong> <strong>Permafrost</strong>, Beijing,China, Proceedings 1, p. 214 - 219.Hallet, B, Walder. J.S. and Stubbs, C.W. (1991):Weathering by segregati<strong>on</strong> ice growth in microcracks at sustained sub-zero ternpera-tures: verificati<strong>on</strong> from an experimentalstudy using acoustic emissi<strong>on</strong>s. <strong>Permafrost</strong>and Periglacial Processes 2, p. 4, 283 - 300.Harris, S.A. (1988): The alpine periglacial z<strong>on</strong>e, In:Clark, M.J. (ed.): Advances in PeriglacialGeomorphology. Wiley, Chichester, p. 369 -413.Harris, S.A. and Corte, A. E. (1992): Interacti<strong>on</strong>s andrelati<strong>on</strong>s between mountain permafrost.glaciers, snow and water. <strong>Permafrost</strong> andPeriglacial Processes 3, p. 2, 103 - 110.Harris, S.A. and Giardino, R. (1993): <strong>Permafrost</strong> inmountain ranges of North America. Sixth <str<strong>on</strong>g>Internati<strong>on</strong>al</str<strong>on</strong>g><str<strong>on</strong>g>C<strong>on</strong>ference</str<strong>on</strong>g> <strong>on</strong> <strong>Permafrost</strong>, Beijing,China, Proceedings 2 (present volume).Hoelzle. M. (1992): <strong>Permafrost</strong> occurrence from BTSmeasurements and climatic parameters inthe eastern Swiss Alps. <strong>Permafrost</strong> andPeriglacial Processes 3, 2, p. 143 - 147.Hoekle, M.. Haeberli, W. and Kefler. F. (1993): Applicati<strong>on</strong>of BTS measurements for modellingmountain permafrost distributi<strong>on</strong>. Sixth <str<strong>on</strong>g>Internati<strong>on</strong>al</str<strong>on</strong>g><str<strong>on</strong>g>C<strong>on</strong>ference</str<strong>on</strong>g> <strong>on</strong> <strong>Permafrost</strong>, Beijing,China, Proceedings 1, p. 272 - 277.Keller. F. (1992): Automated mapping of mountainpermafrost using the program PERMAKARTwithin the geographical informati<strong>on</strong> systemARC/INFO. <strong>Permafrost</strong> and Periglacial Processes3, p. 2, 133 - 138.Keller, F. and Gubler, H.U. (1993): Interacti<strong>on</strong> betweensnow cover and high mountain permafrostat Murttl/Corvats'ch, Swiss Alps. Sixth<str<strong>on</strong>g>Internati<strong>on</strong>al</str<strong>on</strong>g> <str<strong>on</strong>g>C<strong>on</strong>ference</str<strong>on</strong>g> <strong>on</strong> <strong>Permafrost</strong>, Beiling,China, Proceedings 1, p. 332 - 337.King, L. and Akermann, H.J. (1993): Mountainpermafrost in Europe. Sixth <str<strong>on</strong>g>Internati<strong>on</strong>al</str<strong>on</strong>g><str<strong>on</strong>g>C<strong>on</strong>ference</str<strong>on</strong>g> <strong>on</strong> <strong>Permafrost</strong>, Beijing. China,Proceedings 2 (present volume).Lautridou, J.P., Francou. B. and Hall, K. (1992): Present-dayperiglacial processes and landformsin mountain areas. <strong>Permafrost</strong> and PeriglacialProcesses 3, 2. p. 93 - 101.Matsuoka, N. (1991): A model of the rate of frost shatering:applicati<strong>on</strong> to field data from Japan.Svalbard and Antarctica. <strong>Permafrost</strong> andPeriglacial Processes 2, 4, p 271 - 281.Olyphant. G.A. (1983): Computer simulati<strong>on</strong> of rockglacier developnient under viscous and pseudoplasticflow. Geological Society of AmericaBulletin 94, p. 499 - 505.Qiu, G. (1993): Mountain permafrost in central Asia.Sixth <str<strong>on</strong>g>Internati<strong>on</strong>al</str<strong>on</strong>g> <str<strong>on</strong>g>C<strong>on</strong>ference</str<strong>on</strong>g> <strong>on</strong> <strong>Permafrost</strong>,Beijing. China, Proceedlngs 2 (presentvolume).Sollid, J.L. and Sorbel. L. (1992): Rock glaciers inSvalbard and Norway. <strong>Permafrost</strong> and PerilacialProcesses 3, p. 3. 215 - 220.Tenthor+. G. (1992): Perennial ntvCs and the hydrologyof rock glaciers. <strong>Permafrost</strong> and PeriglacialProcesses 3, p. 3, 247 - 252.V<strong>on</strong>der Mtihll. D. (1992): Evidence of intrapermafrostgroundwater flow beneath an active rock glacierin the Swiss Alps. <strong>Permafrost</strong> and PeriglacialProcesses 3, p. 2, 169 ~V<strong>on</strong>der Mtihll, D. and Haeberli, W. (1990): Thermalcharacteristics of the permafrost within anactive rock glacier (Murttl/ Corvatsch, Gris<strong>on</strong>s,Swiss Alps). Journal of Glaciology 36,, -123, p. 151 - 158.V<strong>on</strong>der MCllrll, D. and Holub, P. (199d): Borehole loggingin Alpine permafrost, Upper Engadin,Swiss Alps. <strong>Permafrost</strong> and Perfglacial Processes3, 2, p. 125 - 132.Wagner, S. (1992): Creep of Alpine permafrost, investigated<strong>on</strong> the Murttl rock glacier. <strong>Permafrost</strong>and Periglacial Processes 3, p. 2, 157 - 162.King. L.. Gorbunov, A. P. and Evin. M. (1992): Prospectingand mapping of mountain perrnafrostand associated phenomena. <strong>Permafrost</strong>and Periglacial Processes 3, p. 2, 73 - 81.' 1018
PERMAFROST It4 THE MOUNTAIN RRNCIES OF NORTH AMERICAStuart A. Harriabepartment of Geography, univeralty of CalgaryCalgary, Alberta, Canada T2N 1N4John R. GiardinoDepartments of Geography and GeologyTexas A fi M University, College Stati<strong>on</strong>, TX 71843, USAMountain permafrost extends al<strong>on</strong>g the Western Cordillera of North America fromthe Arctic Ocean south to Mexico. It also occurs al<strong>on</strong>g the lowar coastalmountains in eastern North America as far south au the Gasp6 Peninsula, wherewarm tropical air and the effect of tha Gulf stream combine to keep the groundwarm. Coldest ground temperatures (-10' to -2OOC) and thickest permafrout occurin the Queen Elizabeth Islands. Most is post-glacial and the greater permafrostdistributi<strong>on</strong> in the western mountainu is due to their greater altitude, theproximity to the cold Arctic air masses in winter, cold air drainage, rain shadoweffebts and chinook winde causing thin winter snow <strong>on</strong> covers the eaatern side ofthe Cordillera. Climatic warming may be occurring <strong>on</strong> the Prairies, but the uppermountain slopes are generally not showing warmer air temperatures in thidC<strong>on</strong>tinental and Subc<strong>on</strong>tinental climate. Instead, it neems likely that majorshifts in air mass distributi<strong>on</strong> may be necessary to alter these mountainclimates. In the mountaina of eastern Canada, is there evidence for degradati<strong>on</strong>of permafrost.-Pi<strong>on</strong>eer work was carried out in Canada by Brown(1967, 1978). in Alaska by Ferrians (1965). and in thec<strong>on</strong>tiguous United Statea by Pew6 (1983). The altitudinalsediments, but may be relict in olner maLerials, includingmassive icy beds, some of which may represent buriedglacial ice (e.g., Lorrain ti Demeur, 1985; French ti Harry,1990) or other surface ice (e.q., snowbanks). <strong>Permafrost</strong>exiatence beneath the former ice sheets and basal icedistributi<strong>on</strong> in the Eastern Cordillera was described by temperatures of -17OC are comm<strong>on</strong> today.Harris (1986), and more recently Heginbottom and Dubrauil(1993) have assembled the currently available for data theIn the Eastern Arctic Islands, nlountairlv the c<strong>on</strong>tainmoat recent permafrost and ground ice map for the Nati<strong>on</strong>al permafroat with mean annual ground temperatures rdngingAtlas of Canada and for the Circumarctic map of permafrost from -2°C to -12°C beneath the alpine tundra vegetati<strong>on</strong>.and ground ice c<strong>on</strong>diti<strong>on</strong>s (Brown et al., 1993). This Ground ice appears to be of limited extent except inreport is baaed largely <strong>on</strong> these sources.peatlands.DISTRIBUTIONIn the Cordilleran of norrhwes'terr Nor-tn iunerica,c<strong>on</strong>diti<strong>on</strong>% vary with topography, latitude, proximityto theThe mountain permafrost areas extend al<strong>on</strong>g theArctic air maases and to the Pacific air masses. Al.<strong>on</strong>g theeastern and western margins of North America, from the Arctic coast, mean annual ground temperatures are -4OCQueen Elizabeth Islandm in the north, south to Mexico, to -1O'C. but these increaae to -1'C to -4'~ southwardn inwhere pnrmafrost occurs above about 4500 m (PlwB, 1983: central Xuk<strong>on</strong> and in the central Alaska Range. PermafroetHeine, pers<strong>on</strong>al communicati<strong>on</strong>, 1993) <strong>on</strong>thetops of occurs <strong>on</strong>ly <strong>on</strong> ths eastern side and <strong>on</strong> the tope of thevolcanoes. In the north, these areas grade into polarcoastal mountains around north the Pacific Ocean. At. Mountpermafrost at low @levati<strong>on</strong>e, but in the western Sub-Arctic Garibaldi (near Vancouvor) it ia limited to the mountainsouth of the Brooks Range and south-Central Yuk<strong>on</strong>, they topa. Ice c<strong>on</strong>tents can be high near the Arcti.c coast andbecome disc<strong>on</strong>tinuous to sporadic, and are limited to theHarris higher mountain fi Brown, ranges when mapped at a small southwards al<strong>on</strong>g in the eastern Cordillera through thescale (e.g., Yuk<strong>on</strong> Territory, although they are highly variable and1982; Heginbottom & Dubreuil, 1993; Brown generally decrease southwards. Sufficient interatltiaL iceet al., 1993). The tect<strong>on</strong>ically active, young mountains occuru in sediments <strong>on</strong> block elopes ro generatrp active rockform a broad belt. The lower limits fpr c<strong>on</strong>tinuous (>EO% glaciers as far south ae southwestern Alberta, and theseof the landscape underlain by permafrost), disc<strong>on</strong>tinuous can also be found locally <strong>on</strong> high mountain peake as far(30-80% underlain by permafroat) and sporadic permafrost south aa Mexico. Apart from these cases, ice c<strong>on</strong>tents tend(do%) generally rise southwards al<strong>on</strong>g the Easternto be lesa than 10% by volume south of the Yuk<strong>on</strong> Territory.Cordillera of Canada and the c<strong>on</strong>tiguous United States(Harris, 1986). Because the mountain tops become progreus-Mean annual ground temperatures are appreclhblyively higher in elevati<strong>on</strong> southward8 to the Colorado-New warmer al<strong>on</strong>g the eastern ri.m of the Arctic Islands and downMexico border, mountain permafrost can be found through a to the Gasp&, am a result of the higher snowfalls east ofverywide range of latitude and <strong>on</strong> into Mexico.Huda<strong>on</strong> Bay. Ground ice c<strong>on</strong>tent is variable, generally butlow.<strong>Permafrost</strong> aleo occurs in the mountains al<strong>on</strong>g theeastern rim of the Arctic felands and down al<strong>on</strong>g theseWhere the mean annual ground temperatures ahv- - eremountains to the GespB, where it occurs sporadically <strong>on</strong> 3'C. there tends to be a marked effect of aeyect <strong>on</strong>mountain tops under alpine tundra vegetati<strong>on</strong> f, Brown, (Gray permafroat distributiun which lnczeaaea lnverflely with1982). It disappears in New England as a result of the latitude in Canada. Most of ths permafrost is postinfluenceof the Gulf Stream and tropical air maasea froin glacial because moet of the area of present-day mounta,nthe Caribbean. These mountains are lower and geologically permafrost was covered by Late Wiscticein ice. Relictolder, but are still quite rugged and tect<strong>on</strong>ically active permafrost from colder glacial climates has <strong>on</strong>ly beenin various secti<strong>on</strong>s.dem<strong>on</strong>strated <strong>on</strong> Plateau Mountain, eouthwesl.Aqberta (Marrigfi Brown, 1982), which was a nunatak.CHAPkTERISTICSCLIMATIC PROCESSESIn the Queen Elizabeth Islands, near-surface permafrosttemperatures range between -10" and -2O'C, and theMountain permafrost areas oxist becauQe the micropermafrostis thick. Gtound ice c<strong>on</strong>tents are highlyclimate pecmita sufficient heat removal from the groundvariable and closely related to the nature of the bedrock. surface for part of the ground remain to below uoc for moreThe permafrost is post-glacial in the surficial glacial than two c<strong>on</strong>secutive years.Basic climatic factor5
favouring its formati<strong>on</strong> include lowinter snow cover, highIn eastern Canada, rock glacier-dominated mountainswinds removing the cover snow above tree line, proximity to are normal, although the shorter time mince deglaciati<strong>on</strong>cold Arctic air masses for l<strong>on</strong>g periods of time in winter, and massive bedrock limits their development in easternmaritime temperate air masses in summer (not tropical air Quebec and Labrador. They are associated with occasi<strong>on</strong>almasses), and cold air drainage. The Canadian Cordillera is palsas, patterned ground and ice wedges.characterized by rain shadow areas in the lee of thecoastal mountain ranges with chinook winds that remove EFFECTS much OF CLIMATIC CHANGESof the winter snow cover by ablati<strong>on</strong>. The further east andnorth the area is, the greater the frequency of cold Arctic From the discussi<strong>on</strong> <strong>on</strong> climatic processes, it isair masses in winter. <strong>Permafrost</strong> occurs in two situati<strong>on</strong>s, obvious that any changes in climate may greatly alter theviz., altitudinal permafrost <strong>on</strong> the upper slopes of the permafrost distributi<strong>on</strong> in the mountains of North America.mountains resulting from the cooler temperatures at higher There ia good evidence for permafrost being formed <strong>on</strong> theelevati<strong>on</strong>, and at the foot of mountain ranges because of higher parts of the Appalachian MOuntainS since the lastcold air drainage (e.g., Harris, 1982). The latter process glaciati<strong>on</strong>' (Clark & Schmidlin, 1992), whereas similarextends southwards at least as far as southwest Alberta, evidence can be found in the Cordillera from Mexico northwhere it has become more prevalent in the last eight through years. New Mexico, Ariz<strong>on</strong>a (e-g., Blagbrough & Farkas,Heavy snow accumulati<strong>on</strong>$ <strong>on</strong> tha slopes of mountain ranges 3968; Barsch & Opdike, 1971) and Colorado (Giardino, 1983)facing Pacific coast winds tend to result in a high to Alberta and British Columbia. Thus, in Banff Nati<strong>on</strong>alelevati<strong>on</strong> €or the lowest level of permafrost westwardePark, inactive near-slope rock glaciers can be fnund al<strong>on</strong>gacross the cordillera in British Columbia as the climatic the Bow River ?alley .at an elevati<strong>on</strong> 600 m below theregime changes from subc<strong>on</strong>tinental to maritime.present-day regi<strong>on</strong>al permafrost limit. Similar occurrencescan be found in Jasper Nati<strong>on</strong>al Park, so there must haveFurther north, cold air drainage and prevalence of been some very profound changes in climate producing acold Arctic air in winter result in far lowor groundmarkedly different distributi<strong>on</strong> of mountain permafrost intemperatures at a given elevati<strong>on</strong>, culminating in the poet-glacial times both in eastern and western Northc<strong>on</strong>diti<strong>on</strong>s <strong>on</strong> the Queen Elizabeth and Ellesmere Islands, America.where mean annual air temperature can be as low as -20°C.Summers are short and cool. This is a c<strong>on</strong>tinental perma-Further north around Fairbanks, Westgate et al.frost climate.(1990) have shown that permafrost landforms have developedperiodically for over 3 Ma B.P. The first dated evidenceSouthwards in the Cordillera, permafrost occurs most for cold c<strong>on</strong>diti<strong>on</strong>s in British Columbia is 3.5 Ma fromfrequently <strong>on</strong> the east and north-facing slopes of the Wells-Gray Nati<strong>on</strong>al Park (Hicks<strong>on</strong> & Souther, 1984). whichhighest mountains where snowfall is reducea or the snow agrees with the evidence from Patag<strong>on</strong>ia (see 1991). Corte,cover is removed by high winds. The main occurrences are In Central Yuk<strong>on</strong>, periglacial features to date least 2.5al<strong>on</strong>g the eastern Cordillera, although ice caves can be Ma in n<strong>on</strong>-glacial sediments at Old crow. Cold c<strong>on</strong>diti<strong>on</strong>sfound in the coastal ranges as far south as northernfirst developed <strong>on</strong> the rising high mountains of the St.California.Eliae Range as early as Miocene times (Armentrout, 1984).but appear to have mainly caused alpine glaciati<strong>on</strong>,Al<strong>on</strong>g the east coast of North America, the higher although some permafrost c<strong>on</strong>diti<strong>on</strong>a may have also beenprecipitati<strong>on</strong> tends to reduce the frequency of permafrost developed in nunataks at high altitudes.at a given elevati<strong>on</strong> and latitude in of apita the proximityof the mountains to a cold sea current. The of occurrenceepermafrost end abruptly where the coastal mountains areadjacent to the warm Gulf Stream drift, and where themaritime Tropical air masses penetrate from the Caribbean.LANDFORMSIn areas not dominated by glaciers, e.g., EllesmereIsland, mountain permafrost regi<strong>on</strong>s can be divided intothree groups, viz.: those dominated by active rock glaciers,by active block streams and by soliflucti<strong>on</strong>/geliflucti<strong>on</strong> landforms. The areas with active blockstreams are mainly limited tu the northeast Yuk<strong>on</strong> Territory,which has a suitable combinati<strong>on</strong> of low precipitati<strong>on</strong>and intense winter cold. These landforms are associatedwith active ice wedges and open system pingotl, as ae wellmassive ground ice in the valley floors. Spectacularicings (Lauriol et al., 1991) and seas<strong>on</strong>al frost mounds(Leffingwell, 1919: van Everdingen, 1978, 1982) may occurat the base of slopes.From east-central Yuk<strong>on</strong> Territory and the BrooksFig. 1. Variati<strong>on</strong> in mean annual air temperature atRange southwards to southwest Alberta and southeast BritishWats<strong>on</strong> Lake between 1939 and 1990 (bssld <strong>on</strong>columbFa, the Cordillera exhibits abundant active rockRES, M<strong>on</strong>thly).glaciers, The climate in moist and cold enough to providethe interstitial ice necessary for the formati<strong>on</strong> of nearsloperock glaciers. In the southwest Yuk<strong>on</strong> Territory andCentral Alaska, these are associated with open systemFigure 1 shows that the so-called "climatic change"pingos at the foot of slopes. Eastward3 at this latitude, of the last decade which is regarded as being the of resultextenaivs thick peat deposits have formed <strong>on</strong> the valley an increase in carb<strong>on</strong> dioxide, has not yet produced meanfloors and exhibit paleaa and peat plateaus. Although the annual air temperatures outaide the extremes measuredpingoa are c<strong>on</strong>fined to tne area north of the 60th parallel, during the last 50 years in central and southern Yuk<strong>on</strong>palsas and peat plateaus also can be found in the northern Territory (Wahl et al., 1987; Harris & Schmidt, 1993).parts of British Columbia and Alberta, Degrading iceSimilarly in southwest Alberta, the <strong>on</strong>ly mountain weatherwedges occur in south-central Alaska Yuk<strong>on</strong>, and but active stati<strong>on</strong> at a permafrost site showing an appreciable rise inice wedgee have been reported from Mayo (Burn, 1990) and mean annual air temperature is Marmot X1 near Basin Jasper.certainly occur to the north. Ice caves are present from The others ohow greater variability and frequency of majorOld Crow southwards.cold air drainage events, no but major overall change.South of Kananaskis Lakes in Alberta, the landscapeIn cuntrast, there is evidence for warming at the fewof active rock glaciers is replaced by <strong>on</strong>e with gelifluct- lowland weather stati<strong>on</strong>s al<strong>on</strong>g the Mackenzie River valleyi<strong>on</strong> and soliflucti<strong>on</strong> forma, together with felsenmeer and in the Arctic, but data from mountain sites in this areablock slopes, <strong>on</strong> the Lower part of the mountains. Active are lacking. This warming trend i5 also seen in datarock glaciera occur in the moister, cold climates nearrecorded since 1970 from the Plains regi<strong>on</strong> of Alberta. Itmountain tops. Patterned ground is comm<strong>on</strong> in the block is quite obvious that if a major change in mean annual airfielda, but peaty permafrost landforms are rare. Ice caves temperature occurred in the mountains, there would beare comm<strong>on</strong> in areaa of thin surficial deposits overadjustments in the distributi<strong>on</strong> of mountain permafrost, aslimest<strong>on</strong>es, dolomites, or volcanic rocks.ia occurring presently at Marmot Basin, but it would eeem
that the mountain climates of western North America not are Giardino, J. R. (1983) Movement of ice-cemented rockreacting to the perceived climatic change inferred fromglaciers by hydrostatic pressure: An example fromnearby lowland stati<strong>on</strong>s. This may mean that whereas majorMount Mestaa, Colorado. Zeitschrift fur Geomorpholoqiechanges could occur in permafrost distributi<strong>on</strong> at lowland27, 297-310.sites, the distributi<strong>on</strong> of mountain permafrost may remainlargely the meme a6 at present. It seems likely that major Gray, J. T. and R. J. E. Brown (1902) The influence ofshifts in air mass dimtributi<strong>on</strong> may be needed to'alter theterrain factors <strong>on</strong> the distributi<strong>on</strong> of permafroatsubc<strong>on</strong>tinental and c<strong>on</strong>tinental mountain permafrost cli-bodies in the Chic-Choc Mountains, Gaspbie, Quebec.mates. The different air masses would generate a newProceedings, 4th Canadian <strong>Permafrost</strong> <str<strong>on</strong>g>C<strong>on</strong>ference</str<strong>on</strong>g>,pattern of winds which would produce a different pattern ofCalgary, Alberta. Nati<strong>on</strong>al <strong>Research</strong> Council of Canada,ocean currents, and together these would have a profoundOttawa. 23-35.effect <strong>on</strong> the climate of the coastal mountains.Pl<strong>on</strong>g the east coast, the evidence for climaticchangc in the mountains is lacking, but there is str<strong>on</strong>gevidence for a climatic change that has been occurring inthe last few decades in western and central Quebec, wherepalsas are degruding near the southern limit of permafrost.Features interpreted us ice-wedge casts in post-glacialsediments have been reported from the St. Lawrence Lowlands,so there is evidence for substantial Holoceneclimatic change in this area as well.Thus, the occurrence of permafrost appears to becomplex, and numerous envir<strong>on</strong>mental variables are resp<strong>on</strong>siblefor c<strong>on</strong>trolling ite locati<strong>on</strong>. whereas the numerousvariables c<strong>on</strong>trolling permafrost development are known andunderstood, the relati<strong>on</strong>s between the various variables areproblematic at best.WERENCESAES, M<strong>on</strong>thly. M<strong>on</strong>thly Record. Envir<strong>on</strong>ment Canada,Atmospheric Envir<strong>on</strong>ment Service, Tor<strong>on</strong>to.ArmPntfOut, J. M. (1984) Recalibrati<strong>on</strong> of Miocenemolluscan stagaa and c<strong>on</strong>sequent recorralati<strong>on</strong> ofAlaskan formati<strong>on</strong>s. Geological Society of AmericaRbatracts with Programs 15(5), 267.Barsch, D. and R. G. Updike (1971) Periglaziale Formung amKendick Peak in Nord-Ariz<strong>on</strong>a wahrend der letztenKaltzeit. Gaographische Helvetica 3, 99-114.Blagbrough, Y. W. and S. E. Farkaa (1968) Rock glaciers inthe San Mate0 Mountaina, south-central New Mexico.American Journal of Science 266, 812-823.Brown, J., 0. J. Ferrians, Jr., J. A. Heginbottom and E, S.Melnikov (1993) Circumarctic map of permafrost andground ice c<strong>on</strong>diti<strong>on</strong>s. Proceedinge, 6th <str<strong>on</strong>g>Internati<strong>on</strong>al</str<strong>on</strong>g><strong>Permafrost</strong> <str<strong>on</strong>g>C<strong>on</strong>ference</str<strong>on</strong>g>, Beijing.Brown, R. J. E. (1967) <strong>Permafrost</strong> Map of Canada. Nati<strong>on</strong>al<strong>Research</strong> Council, Building <strong>Research</strong> Divisi<strong>on</strong>, NRCX9761, ahd Geological survey of Canada, Map 1246A.Brown, R. J. E. (1978) <strong>Permafrost</strong>. Plate 32 in:Hydrological Atlas of Canada, Ottawa. Fisheries andEnvir<strong>on</strong>ment, Canada. 34 Plates.Burn, C. R. (1990,) Implicati<strong>on</strong>u for palaooenvir<strong>on</strong>mentelrec<strong>on</strong>steuctiop of Recent ice-wedge development at Nayo,Yuk<strong>on</strong> Territory. <strong>Permafrost</strong> & Periglacial Processes 1,3-14.Clark, G. M. and T. W. Schmidlin (1992) Alpine periglaciallandforms of eastern North America: A review. <strong>Permafrost</strong>& Periglacial Processee 3, 225-230.French, H. M. and D. G. Harry (1990) Observati<strong>on</strong>s <strong>on</strong>butied glacier ice and massive segregated ice, WesternArctic Coast, Canada. <strong>Permafrost</strong> L PeriglacialProcesses 1, 31-43.Harris, s. A. (1982) Cold air drainage west of FortNels<strong>on</strong>, British Columbia. Arctic 35, 537-541.Harris, S. A. (1986) <strong>Permafrost</strong> distributi<strong>on</strong>, z<strong>on</strong>ati<strong>on</strong>,and rrtability al<strong>on</strong>g the eastern ranges of thecordillera of North America. Arctic 39, 29-38.Harris, 5. A. and R. J. E. Brown (1982) <strong>Permafrost</strong>distributi<strong>on</strong> al<strong>on</strong>g the Rocky Mountains in Alberta.[Roger J. E. Brown Memorial Volume, H. M. French, Ed.]Proceedings of the Fourth Canadian <strong>Permafrost</strong> c<strong>on</strong>fer-ence, Calgary, Alberta.Canada, Ottawa, 59-67.Nati<strong>on</strong>al research Council ofHarris, S. A. and I. H. Schmidt (1993) Peat plateaus, h160-167, Robert Campbell Highway, Yuk<strong>on</strong> Territory.Journal of Paleolimnology. In the Press.Heginbottom, J. A. and M. A. Dubrouil (3993) A newpermafrost and ground ice map for the Nati<strong>on</strong>al Atlas ofCanada. Proceedings, 6th fnternati<strong>on</strong>al <strong>Permafrost</strong>c<strong>on</strong>ference, Beijing.Hicks<strong>on</strong>, C. J. and J. G. Souther (1984) Late Cenozoicvolcanic rocks of the Clearwater-Wells Gray area,British Columbia. Canadian Journal of Earth Sciences21, 267-277.Lauriol, B., J. Cinq Mars and I. D. Clark (1991)Localisati<strong>on</strong>, genbe et f<strong>on</strong>te de quelgues naleds duNOrd du Yuk<strong>on</strong> (Canada). <strong>Permafrost</strong> & Periglacial Processes2, 225-236.Leffingwell, E. de K. (1919) The canning River regi<strong>on</strong>,northern Alaska. United States Geological Survey, Professi<strong>on</strong>alpaper Xl09. 251 pp.Lorrain, R. D. and P. Demeur (1985) Isotopic evidence forrelic Pleistocene glacier ice <strong>on</strong> Victoria Island,Canadian Arctic archipelago. Arctic 6. Alpine <strong>Research</strong>17, 89-98.PBwB, T. L. (1983) Alpine permafrost in the c<strong>on</strong>tiguousUnited states: A review. Arctic and Alpine <strong>Research</strong>15, 145-356.van Everdingen, R. 0. (1978) FrOSt mounds at: Bear Rock,near Fort Norman, Northwest Territories, 1975-1976.Canadian Journal of Earth Sciences 15, 263-276.van Everdingen, R. 0. (1982) Management of groundwaterdischarge for the soluti<strong>on</strong> of icing problems in theYuk<strong>on</strong>. In: Proceedings of the 4th Canadian PermafroatC<strong>on</strong>foreme. H. N. fr<strong>on</strong>ch, Ed., Associate Committee <strong>on</strong>Geotechnical Res@arch, Nati<strong>on</strong>al <strong>Research</strong> Council,Ottawa, 212-226. .Wahl, H. E., D. B. Fraa@r, R. C. Harvey and J. B. Maxwell(1987) Climate of Yuk<strong>on</strong>. Atmospheric Envir<strong>on</strong>mentService, Envir<strong>on</strong>ment Canada, Ottawa. climatologicalseries 140. 321 pp.Corte, A. E. (1991) Chr<strong>on</strong>ostratigraphic correlati<strong>on</strong>s ofwaatgate, J. A., B. A. Stemper and T. L. Pew6 (1980). Acryogenic and glacigenic episodes in Central Andes with3m.y. record of Pliocene-Pleistocene loess in interiorPatag<strong>on</strong>ia. <strong>Permafrost</strong> & Periglacial Procewdes 2, 67-Alaska. Geology 18, 858-861.70. .Ferrians, 0. J., Jr. (1965) <strong>Permafrost</strong> Map of Alaska.United states Geological Survey Miscellaneous GeologicalInventory Map 1-445. Scale 1:2,500,000.
MOUNTAIN PERMAFROST IN EUROPELorenz King' and J<strong>on</strong>as kerman2' Geographical Institute, Justus Liebig University,D-35390 Giessen, GermanyDepartment of Physical Geo raphyUniverslty of Lund, S-233 62 Luni, SwedenAbstract:In several Euro ean countries a good knowledge about the properties and the distributi<strong>on</strong> of mountainermafrost has gee, a vital factor for the development of these areas. This c<strong>on</strong>cerns particular1gvalbard (mining and c<strong>on</strong>structi<strong>on</strong> activities), the Fennoscandian mountains and the Alps (traflc andprotecti<strong>on</strong> measures). The distributi<strong>on</strong> of mountain permafrost in Europe is displayed and the mostImportant permafrost features for these mountain areas are menti<strong>on</strong>ed. Whereas island permafrost isvery comm<strong>on</strong> in many mountain areas, and sporadic permafrost, too, c<strong>on</strong>tinuous or disc<strong>on</strong>tinuouspermafrost is restricted to Svalhard, the Fennoscandian mountains and the Alps.INTRODII(JTION One of the was sessi<strong>on</strong>s also devoted to definiti<strong>on</strong> andclassificati<strong>on</strong> of mountain permafrost. It was agreed there, thatA "Circumarctic Map of <strong>Permafrost</strong> and Ground Ice mountain permafrostis perennially frozen ground in mountainC<strong>on</strong>diti<strong>on</strong>s" at a scale 1:lO milli<strong>on</strong> bas been recently prepared by areas. This includes mountains in tropical, moderate and polardifferent member countries of the <str<strong>on</strong>g>Internati<strong>on</strong>al</str<strong>on</strong>g> <strong>Permafrost</strong> areas, and their comm<strong>on</strong> featureis a c<strong>on</strong>siderable altitudmalAssociati<strong>on</strong> (IPA) and a first draft map has been presented and difference that produces special morpholoi d forms. It isdiscussed at the Sixth <str<strong>on</strong>g>Internati<strong>on</strong>al</str<strong>on</strong>g> <strong>Permafrost</strong> <str<strong>on</strong>g>C<strong>on</strong>ference</str<strong>on</strong>g> ingenerally accepted today, that active rockgfaciers are the mostPeking 1993. In additi<strong>on</strong>, the IPA Working Group <strong>on</strong> Mountain visible expressl<strong>on</strong> of mountain permafrost as creep of thick talus or<strong>Permafrost</strong> prepared a special sessi<strong>on</strong> with c<strong>on</strong>trlbuti<strong>on</strong>s frommorainic material. A great number of other eomorpholocicalAmerica, Europe and Asia (IIaeberli 1993). This paper is part of expressi<strong>on</strong>s for permafrost exist, too, and wilf be treated in thisthese presentati<strong>on</strong>s and summarizes the knowledge c<strong>on</strong>cerning paper.mountain permafrost in Europe.According to the c<strong>on</strong>siderable altitudinal differences, theAvailable informati<strong>on</strong> shows, that permafrost in Europe exists distributi<strong>on</strong> pattern of mountain permafrost is rather a verticalin: than a horiz<strong>on</strong>tal with <strong>on</strong>e, difficulties many involved for itsa) Northern Europe (incl. Iceland, the Svalbard Archipelago and presentati<strong>on</strong> <strong>on</strong> maps. In a short horiz<strong>on</strong>tal distance, ermafrostthe Fennoscandian Mountains) may existas c<strong>on</strong>tinuous (90 - loo%), disc<strong>on</strong>tinuous (& - 90 %),b) the Alps and sporadic (10 - 50 %) or island (0 - 10%) permafrost.c) the Pyrhkes.Although these definiti<strong>on</strong>s have been used for the <strong>Permafrost</strong>To a smaller extent permafrost is also [Tesent in:Map of the Northern Hemisphere presented at Sixth thed the Tatry Mountains (Poland, Slova la),<str<strong>on</strong>g>Internati<strong>on</strong>al</str<strong>on</strong>g> <strong>Permafrost</strong> <str<strong>on</strong>g>C<strong>on</strong>ference</str<strong>on</strong>g> in Pekin , and have alsoe{ the Carpathian Mountains (Romania), been adopted by the authors this for paper, Sould it be realized,f) the Abruzzi Mduntains (Italy) and that these mentl<strong>on</strong>ed termsare also used in a different manner n9) Scotland. <strong>on</strong>ly in Europe, but also in earlier studies in Norte.g. the term "sporadic" is often used for areas with less than 10%<strong>Permafrost</strong> areas are small in Europe, when compared to the occurrence, "patchy disc<strong>on</strong>tinuous" for10 to 50% and so <strong>on</strong>. TheAmerican Cordilleras or to Asia with their large areas of mountain additi<strong>on</strong> of percentage values to these terms certainly is a goodand plateau permafrost. However, the European mountains are approach to definiti<strong>on</strong> problems and helps to avoidrelatively densely PO ulared or develo ed, and a good permafrost misunderstandings.knowledge is a vital Factor in and for tl!ese areas and theirdevelopment (cp. Haeberli, 1992). Therefore, there is a goodknowledge about mountain permafrost distributi<strong>on</strong> and properties SVALBhRnin quite a number of European countries. During the IPA5 <strong>on</strong>sored internati<strong>on</strong>al workshop <strong>on</strong> "<strong>Permafrost</strong> and Periglacial The Svalhard Archipelago is mainly located between about 74"8. nvlr<strong>on</strong>ments in Mountain Areas" in Interlaken, Switzerland, 16- and SO" northern latitude and bel<strong>on</strong>gs, to the area of c<strong>on</strong>tinuous20 September, 19Y 1, much of this knowledge has been presented permafrost with a MAAT of about -4°C and lower (herman 1980,and dlscussed together with American and Asian permafrost1987, King et al., in prep.). <strong>Permafrost</strong> thicknesses of about 100 mspecialists, and research sites in the Alps have been visited befsre (al<strong>on</strong>g the west coast and the larger fiords) and 250 to 450 mand after the workshop. Meanwhile, most presentati<strong>on</strong>s have heen (further inland) have been measured, especially in the existin coalpublished in three issues of <strong>Permafrost</strong> and Periglucial Processes mines (Liest011980, 1986, Landvik et al. 1988). Large parts of(volume 3, 1-3, 1992). The references to these papers form anSpitsbergen, the main island of the archipelago, are an area ofexcellent bibliography <strong>on</strong> mountain permafrost.rugged mountainous terrain with <strong>on</strong>ly narrow coastal plains.. 1022
The central parts of Spitsbetgen and the large islands in the eastare built by youn sedimentary rocks and the mountains areplateaulike and Jvided by wide glacial valleys. 60% of thearchipelago are covered by glaciers.Ice-wedge olyg<strong>on</strong>s are frequent in the valley bottoms of thelarge wide vafeys of central Nordenskjold Land (Svenss<strong>on</strong> 1976).However their distributi<strong>on</strong> is not clear as they are often mixed upwith the even more comm<strong>on</strong> and more widely distributed soilwedges. These soil wedges are mistakenly often classified as icewedgesin ma s a d inventories, because their surficial appearancemight be sirnirar (herman 1980,1987). Pingos are comm<strong>on</strong> andfound in the large wide valle s of central Nordenskjbld andAndrte Land and more rare& <strong>on</strong> Ed 'eoya and Barents~ya. Amajori of the pingos are interpretef as open system pingos(Liestey1976) but a few have been classified as closed systempingos (Svenss<strong>on</strong> 1973). Palsa-like frost mounds have he nreported from Nordenskjold Land and Nordaustlandet (herman1982, Salvigsen 1 77). Icings of different origin are comm<strong>on</strong> allover the re i<strong>on</strong> ( w kerman 1980) and most comm<strong>on</strong>ly produced bythe winter &charge from subpolar glaciers. An interesting formare icings produced in associati<strong>on</strong> wlth some of the surgingglaciers.Steep rock slopes often produce vast amounts of debris, thatform rockglaciers in facoured places. These henomena ofmountain permafrost have been studied by 8umlum (1982) and bySollid and Sorbel (1992), also in cooperatl<strong>on</strong>s with colleagues fromETH-Zurich (Hoelzle, In prep.). Push moraine formati<strong>on</strong> is oftenfavoured by the existence of permafrost in glaciofluvial or marinesediments in the valley floors. The mechanisms of push moraineformati<strong>on</strong> has been studied by Van der Wateren (1Y92), Lehmann(1993; cp. also Gripp 1926, Sollid & Sorbel 1988).Although Greenland bel<strong>on</strong>gs to the North American c<strong>on</strong>tinent,it is also regarded as part of the "Nordic Countries" of Europe forhistorical reas<strong>on</strong>s, and a large number of permafrost studies havebeen d<strong>on</strong>e by European scieyp, especially from Denmark.References are compiled in erman (In prep.).ICELANDIceland experiences a mild and humid oceanic climate.<strong>Permafrost</strong> is limited to the central hi hlands above450 m ad.(Thorarinss<strong>on</strong> 1951, Schunke 1975). l%e majority of thepermafrost observati<strong>on</strong>s in Iceland arc c<strong>on</strong>nected with the flisurfaces(Islandic bogs), that are characterised by numerous smallp<strong>on</strong>ds alternating with level surfaces of wet ground and by amultitude of large hummocks, called rist (or dys). These rhsts arethe equivalent of" alsar" in the Scandinavian terminology andfound between 40tm and 800 rn ad. Their lower limitcorres <strong>on</strong>ds fairly well with the 0°C isotherm. At higher altitudesthe parsas (rdsts) are larger, higher and more stable. Hcights mayreach 3 m and diameters up to 30-40 m are comm<strong>on</strong>.Observati<strong>on</strong>s of permafrost in terminal moraines, rockglaciersand push moraines have been menti<strong>on</strong>ed by Eyles (1978),Humlurn (1985) and Rutten (1951. <strong>Permafrost</strong> is certaini alsopresent in the glacier-free rockwal I s and summits above 8&l ma.s.l., but no systematic studies have been d<strong>on</strong>e.FENNOSCANDKAIn Fennoscandia, the traditi<strong>on</strong>al opini<strong>on</strong> until recently was, thaterrqafrost in Fennoscandia, even in the northernmost parts,!asically was restricted to the palsa bogs (Fries& Bergstrom 1910,Hamberg 1905, Rapp & Rudberg 1960, Wramner 1973). However,recent studies made'clear, that the extent of permafrost is muchmore widespread and that the majority of the permafrost areasbel<strong>on</strong>g to "mountain ermafrost" (0strern 1964, Svenss<strong>on</strong> 1962b,Ra p & Clark 19 1 Ring 1976, 1982, 1983, 1986, Rapp 1982, King& %p ala 1987, kerman & Malrnstrfim 19 6, Jeckel 1988, Sollid& S@r&l 1992,0degard et al. 1992, cp. also L erman, manus.).The distributi<strong>on</strong> of permafrost in Fennoscandia is basically avertical z<strong>on</strong>ati<strong>on</strong> as follows:Island aermaft'ost with a high or medium high ice c<strong>on</strong>tent iscomm<strong>on</strong> in and around the Fennoscandian mountains and is found *from liardangervidda and Dovre in southern Norway (Sollid RrSclrbel 1974) up to the Varanger Peninsula in the north. Withinthis class permafrost is more or less restricted to organic soils. toogs and to als& or palsa-like features (Svenss<strong>on</strong> 1962a, 1986,khman 197f Meier :. ' 198.5, Seppala 1988). Annual and short-livedfrost blisters are also comm<strong>on</strong>, here. Island permafrost is quiteoften observed at altitudes above 1000 m a.s.1. in the south, andreaches down IO sea level altitude in the north. In thesouthernmost mountains of Hardangewidda (Norway) andJamtland and Hiirjedalen (Sweden) it my even be foundc<strong>on</strong>siderably lower than 1000 m ad. at very selected places,mainly bogs. In Jiimtland several sites between 650 and 750 m a.s.1.with palsa-like forms and small permafrost lenses have beenreported by Smith (191 I) or Lundquist (1962).Saoradic Dermafrost occupies the mountain areas above 1.200m ad. in thk south (Jotunheimen) and above 750 m ad. innorthern Sweden (Kehnekaise). Further north and inland, and dueto increased c<strong>on</strong>tinentality (cp. King & Seppsla 1987, MalmstrBm1988), this belt can also be found at lower altitudes of 300 m to 400rn. The str<strong>on</strong> gradient in c<strong>on</strong>tinentality from west to east isdisplayed in bigure I (cp. also valuefi in table 1). Icings, often inassociati<strong>on</strong> with karst drainage in the mountains and with smallgroundwater springs are quite comm<strong>on</strong> in the sporadic ermafrostbelt. Pingo-like features regarded as transiti<strong>on</strong>al forms getweenalsas and pingos are found in the Abisko, Finnmarksvidda andkastosjaure areas (Svenss<strong>on</strong> 1969, La erbiick & Rohde 1985,Akerman & Malmstrom 1986): in thefower levels these forms areoften relict.+s at altitudes of about 1600 mWith increasing altitudes, the sporadic permafrost belt graduallychanges into disc<strong>on</strong>tinad. In Jotunheimen, and 1 00 m a s.1. in the Kebnekaisemountains. This permafrost belt shows rock8laciers and ice-coredmoraines in the steeper, alpine type mountam (Barsch 1971,Bstrem 1964) and pr<strong>on</strong>ounced large-scale pol g<strong>on</strong> patterns in thesmoother Scandinavian fell-type mountains (iap & Clark 1971,Rapp & Annersten 19691. Rock glaciers may reacK down into thesporadic z<strong>on</strong>e, especially in the more c<strong>on</strong>tinental, easternmountain areas (Barsch & Treter 1976), where the periglacialareas have. quite a c<strong>on</strong>siderable vertical extent due to a highglaciati<strong>on</strong> limit and relatively low mean annual air temperatures.Wmoremoremaritime CLIMATE c<strong>on</strong>tinentalFigure 1: Schematic secti<strong>on</strong> across the Scandinavian mountainranges. From west to east the lower permafrost limits dropc<strong>on</strong>siderably and the altitude of the glaciati<strong>on</strong> limit increases. Thuspermafrost is mainly found in the eastern (and northern) partswith a more c<strong>on</strong>tinental climate; the western mountain rangesexperience much precipitati<strong>on</strong> and are often glacierized.ElI1023
The &~IOUS aermafrosy belt is found above 2060 m inJotunhcimen (NoGay) and above 1600 m ad. in northernSweden (King 1984). It is an area where patterned ground is oftena5 well developed as in many hi h arctic areas, if slope andsediment cover are favourable. fermafrost thicknesses of about 70m have been measured even at the relatively low altitude of 1200m a.s.1, (Ekman 1957) and the thickness of permafrost is estimatedto be more than 100 rn at about 1500 m ad. and probably even200 to 300 m in the highest elevati<strong>on</strong>s of the Kebnekaise mountain(2400 m ad.) in northern Sweden (King 1984, 1986).U S AND JURA<strong>Research</strong> in mountain permafrost has a l<strong>on</strong>g traditi<strong>on</strong> inEurope and started mainly in the Alps with the investi ati<strong>on</strong> ofrockglaciers (Barsch 1Y78, Haeberli 1985). It is generafly agreedtoday, that active rockglaciers are the most typical phenomena forwidespread s oradic or disc<strong>on</strong>tinuous mountain permafrost(Barsch 19927. Rockglacier research is still c<strong>on</strong>tinued in the Swiss,Italian, French and Austrain Alps, and there are a large numher ofthorougly investigated rock laclers in all these menti<strong>on</strong>edcountries (cp. Haeberli et 3. 1992, Bell<strong>on</strong>i et al. 1993, Evin et al.1993). <strong>Research</strong> includes studies of rockglacier movement over afew and up to 25 years, rockglacier drilling and detailedgeophysical borehole logging, as well as man eophysicalsounding techniques (eg Francou et al. 1992 haeberli et ai. 1979,V<strong>on</strong> der Muhll et al. 1990, 1992). In more recent ears, similarstudies have also heen c<strong>on</strong>ducted <strong>on</strong> Iceland, in tieFennoscandian mountains, as well as <strong>on</strong> S itsbergen (cp.references in previous chapters). Freeze/tfaw cles in ermafrostareas (e. . King 1990) and creep of permafrost~~laeber~ 1985,Wa ner f992) are other important research topics. Importantmet%odolopical advances in mountain permafrost research alsooriginated In the Alps: the BTS-method has become an acceptedworkin tool for ma in permafrost very efficiently (e.g.Gugliefmin et ai. 19$!, fioelzle et ai. 1993). Modelling ofmountain permafrost distributi<strong>on</strong> and its automated mapping willbring new knowled e and new ideas about permafrost distributi<strong>on</strong>of lar e areas that kave not been investigated detailedly until now(cp. f!eler 1992). A methodological review c<strong>on</strong>cerning mappingand prospecting of mountain permafrost is given by King et ai.(1992 . It shows that the Alps represent an Important researcharea or comparative studies in other mountain areas of the world(Cheng et al. 1992, Gorbunov 1978).In additi<strong>on</strong> to scientific projects (Haeberli 1993), research inmountain permafrost has also been greatly promoted byc<strong>on</strong>structi<strong>on</strong> measures. In the Alps, c<strong>on</strong>structi<strong>on</strong> includes railways,cable cars, skilifts, restaurants and hotels, communicati<strong>on</strong> towers,hydropower installati<strong>on</strong>s, high power transmissi<strong>on</strong> lines, androtecti<strong>on</strong> measures a ainst natural risks. C<strong>on</strong>structi<strong>on</strong> sites can&e found in all permafost belts, from the s oradic to thec<strong>on</strong>tinuous <strong>on</strong>e (Haeberli 1992). Many bezock exposures havethus been created and allowed the study of ice-filled bedrock-jointsor temperature gradients in tunnels. The scientific permafrostcommunity is ve grateful for these engineering activities, andshould carefully %low these, wherever ossible. Cum arabledevelopment activities have <strong>on</strong>ly startexin Northern gurope,Eastern Europe and the Pyrinies, and we will certainly learnmuch more about mountam permafrost distributi<strong>on</strong> in Europe inthe years to come.In the Alps, permafrost occurs from the southern French andItalian Alps over the central Swiss Alps to the Austrian andGerman Alps. Predominantely sooradic oermafrad with low icec<strong>on</strong>tent in bedrock and high ice-c<strong>on</strong>tent in n<strong>on</strong>c<strong>on</strong>solidatedsediments exists at altitudes between 2000 m and 2500 m ad.Patchy vepetati<strong>on</strong> and alpine meadows cover these areas and relictand inactwe rock laciers are ty i d and more numerous thanactive <strong>on</strong>es here. hand ~ermat%[ extends much further down, toaltitudes c<strong>on</strong>siderably lower than the treeline in general. Theoccurrences are limited to special places, as e.g. snow-freerockwalls and slopes exposed to ttie north, l<strong>on</strong>g lastin avalanchedeposits and ice-caves in limest<strong>on</strong>e areas. There, the hAAT maybe markedly higher than 0°C.Disc<strong>on</strong>tinuous Dermafrnst is comm<strong>on</strong> at altitudes above about2500 m a.s.1. and gradual1 changes into n In s ermafrost ataltitudes above 3000 to 3&0 m a.sll. Thc?%~~~r~afrosttemperature is -5" to -6°C at Jungfraujoch (3500 m ad., northernSwiss AI s) and about -15°C with maximum ermafrost thickncsscsexpectrfto exceed 1000 m <strong>on</strong> M,<strong>on</strong>te Rosa fi.500 m ad.,southern Swiss Alps; cp. Haeberli & Funk 1991).In c<strong>on</strong>trast to the Fennoscandian mountains the AI s have notbeen shaped by a c<strong>on</strong>tinental ice-sheet, and flat or rolEnmountain landscapes are missing and steep slopes preva!. Due tothis geomorphological characteristics of the Alps, the permafrostfeatures so typical for the "Scandinavian fjell" (palsas, pingo-likefeatures, ice-cored moraines, vast large scale polyg<strong>on</strong> patterns) aremissing in the Alps or are restricted to a few selected places.Active phenomena of creeping ice-supersaturated sedlments frommoraines and talus (rockglaciers) dominate instead, and thenumber of rockglaciers matches the number of glaciers. All formsof soliflucti<strong>on</strong> are quite widespread, too.The Jura mountains are located in France and Switzerland,northwest of the Swiss Alps. For large areas, they c<strong>on</strong>sist ofparallel folds of mesozoic sediments, often limest<strong>on</strong>e. In thenortheast, their c<strong>on</strong>tinuati<strong>on</strong> reaches to the cuesta-like Alb Imountains in Germany. Alltogether, this mountain area is severalhundred kilometers l<strong>on</strong>g and reaches above 1500 m a.s.1. at manypoints. Althou h the MA.+T is abave freezing point, ice-caves(island permatost) may be found at many places even at altitudesbelow 1200 m a.s.1. (Pancza 1992).OTHER EUROPEAN MOUNTAINSBesides the main mountain ranges of c<strong>on</strong>tinental Europe, the Alpsand the Scandes, there are a great number of larger and smallermountain ranges, where ermafrost has been roven or where itcan be expected, e. thehrenkes, the Ca atiians and theAppennine. Table Hgives the approximateTower limits for island,sporadic and disc<strong>on</strong>tmuous mountain permafrost in the mountainsof c<strong>on</strong>tinental Europe.The lowermost limits for island permafrost include areas of icecaves in karst areas, and the MAAT may therefore reach valuesc<strong>on</strong>siderably above the freezin point there. At the lower limit ofsporadic permafrost the MAAf 1s in the order of -1°C to -1.5'C,and above the altitude of the -3.X MAAT disc<strong>on</strong>tinuouspermafrost (> 50%) can be expected. The maximum 'altitude of therespective mountain range gives a first idea of the area affected byperennially frozen ground.In -[knees, geomorphological research has a l<strong>on</strong>gtraditi<strong>on</strong>, <strong>on</strong> the French side as well as <strong>on</strong> the Spanish <strong>on</strong>e and theinterest in mountain permafrost research is present, too (cp.Gutierrez et al. 1981). There are more than a dozen activerockglaciers in the Spanish PyrknCes in areas reaching above 2800m ad. (Agudo et al. 1992, San Jost et al. 1992, Serrano et al.1991). According to David Palacios (written communicati<strong>on</strong>) thearea abovc 2800 m a.s.1. is regarded as the altitudinal belt ofsporadic permafrost (10 - 50 %). In additi<strong>on</strong> to the studies ofactive permafrost, Chueca (1992) has mapped 170 rockglaciers asrelict permafrost forms. The joining of the Spanish nati<strong>on</strong>al bodyto the <str<strong>on</strong>g>Internati<strong>on</strong>al</str<strong>on</strong>g> Mountain <strong>Permafrost</strong> Associati<strong>on</strong> willcertainly have a positive effect <strong>on</strong> more detailed mountainpermafrost research in the Pyrenees, where more areas areexpected to he underlaid by permafrost according to the existingMAAT of -1.5"C and lower.In the central part of the Italian-Appennine, the AbruzziFountains, there are three small mountain areas where permafrostcan be expected: Gran Sasso, Maiella and Mente Vellino (Dramis& Kotarba 1992).In the Sauthern Camw,-Romania, inactive and activerockglaciers have been reported in altitudes above 2000 m a.s.1. byUrdea (1992). In the Fagaras, the Paring and the Retezatmountain massifs many mountain tops and crests reach altitudesbetween 2300 and 2500 m ad. and the MAAT at Omu- 1024
Table 1: Approximate lower limits for island (0 - lo%), sporadic (10 50%) anddisc<strong>on</strong>tinuous (> 50%) permafrost in c<strong>on</strong>tinental Europe. C<strong>on</strong>tinuous permafrostexists <strong>on</strong>ly in the Alps and in the highest parts of the Scandinavian mountains.Y ugoslaviaAlbaniaBulgaria(2505 rn a.s.1.) is -2.6"C. Here a ain, a large number of relictrockglaciers exist below about f000 m a d. and proove formerpermafrost c<strong>on</strong>diti<strong>on</strong>s (Ichim 1978, Urdea 1993).tlLtl!m,The mean annual air temperature in the Northern Cam 'es ecially in the Tatry mountains (Poland, Slovakia) is lower than -I.!&, too, and these climatic c<strong>on</strong>diti<strong>on</strong>s undoubtedly favour thedevelopment of sporadic permafrost. Whereas relict permafrostfeatures have been studied, research <strong>on</strong> the distributl<strong>on</strong> of activepermafrost is sti!l urgently needed (cp. Czudek, 1993).In Scotland the existence of small permafrost island in thehighlands cannot be excluded accordlng to thexistingtemperatures.ACKNOWLEDGEMENTS:Additi<strong>on</strong>al c<strong>on</strong>tributi<strong>on</strong>s for this report came from the followincolleagues: Matti Seppala (northern Finland), Wilfried Haeberfi(Switzerland), Michele Evin (France), Francesco Dramis (Italy),David Palacios (Spain), Adam Kotarba (Poland) and Petru Urdea(Romania).R,EFERENCES,SVALBARDAkerman, H.J. (1980): Studies <strong>on</strong> Perflaciql Ceompgholoq inWest Spitsbergen. PhD thesis. Lun s Unwersltets eogra lskaInst. Scr. Avh. LXXXIX: 297 pp.herman, H.J. (1982): Observati<strong>on</strong>s of palsas within thec<strong>on</strong>tinuous errnafrost z<strong>on</strong>e in eastern Siberia and in Svalbard.Geografisk Pidsskrift 82: 45-51.herman, H.J. (1987): Periglacial forms of Svalbard - A review. In:Boardman, J. (ed.): Periglacial Processes and Landforms inBritain and Ireland, Cambridge llniversity Press: 9-25.Akerman, H.J. (in prep.): Mountain permafrost in the Nordiccountries, a review. - In preparati<strong>on</strong> for Lunds Univ.Naturgeogr. Inst., rapporter och Notiser (1994).Gri p, K. (1926): Uber Frost und Strukturboden auf Spitzbergen.leitschr. Gesellsch. f. Erdkunde: 351-354.Humlum, 0. (1982): Rock Glaciers in Northern Spitsbergen: Adiscussi<strong>on</strong>. Journ. Geol. 90: 214-218.King L. & M. Volk (in trep.): Glaziolo ie und Glazialmorphologiedes 1-iefde- und Boc f~ordgebietes, Pfordspitzbergen. - Inpre arati<strong>on</strong> for Zeitschrift fur Geomorphologie N.F., Suppl.-bd.(1984)Landvik, J.Y..et al. (1988): Glacial history and permafrost in theSvalbard area. <strong>Permafrost</strong>, Fifth <str<strong>on</strong>g>Internati<strong>on</strong>al</str<strong>on</strong>g> <strong>Permafrost</strong> C<strong>on</strong>f.Proceedings 1: 194-198, Tr<strong>on</strong>dheim.khmann, R. (1993): The Significance of <strong>Permafrost</strong> in theFormati<strong>on</strong> and Appearance of Push Moraines, Examples of theCanadian Arctic and S itsbergen. Sixth <str<strong>on</strong>g>Internati<strong>on</strong>al</str<strong>on</strong>g><str<strong>on</strong>g>C<strong>on</strong>ference</str<strong>on</strong>g> <strong>on</strong> Permafost, Beijing 1993, Proceedinks vel. 1:374-379.Liest~l, 0. (1Y76): Ping 5 springs, and permafrost in Spitsbergen,Norsk Polarinstitutt f;bok 1975: 7-29.Liestal, 0. (1980): <strong>Permafrost</strong> c<strong>on</strong>diti<strong>on</strong>s in Spitsbergen. Frost iJord 21: 23-28.Liestal, 0. (1986): <strong>Permafrost</strong> pP Svalbard og pb fastlandet.Klimatiske forutsetnin er, uthredelse og tykkelse.Fjellsprengningsteknik~, bergmekanikk, geoteknikk. Tapir.Salvigsen, 0. (1Y77): An observati<strong>on</strong> of palsa-11 e forms inNordaustlandet, Svalbard. Norsk Polarinst. ftr bok: 364-367.Sollid, J.L. & L. Sorbel (1988): lnfluence of temperaturec<strong>on</strong>dititinsh formati<strong>on</strong> of end moraines in Fennoscdndia andSvalbard. Boreas 17: 553-558.
Sve w<strong>on</strong> 11 1976): Iskilar som klimatindikator. Svensk Geogr.Ar;hok 52L5.7.Van der Watcrw, 1.). (1992): Structural Geology andScdirnentology of Push Moraines. Diss., Faculteit derRllillrrr.lijke'Wt.tenschappen, Univ. van Amsterdam: 230 pp.ICEI.ANX)Eyles, N. (1978): Rock glaciers in Esjufjbll nunatak area, southeastIceland, Jijkull 28: 53-56.Humlum, 0. (1YXS): Genesis of an imbricate push moraine,Hofdahrekkujull, Iceland. Journal of Geolog 93: 185-195.Rutten, M.G. (1951): Polyg<strong>on</strong> soils in Iceland. Geologie enMijnhouw, Mai 195 1Schunkc, E, (1975): Die Periglazialerscheinungen Islands inAhhiingigkcit v<strong>on</strong> Klirna und Substrat. Ahh. Akad. Wiss.Gijttingen 30: 273 pp.Ihorarinss<strong>on</strong>, S. (1951): Notes <strong>on</strong> patterned, round in Iceland,with particular reference to the Icelandic kia's". Ceogr. Ann.33: 144"156.FE.NNOSCANDIAAhman, R. (1977): Palsar i Nordnorge. Medd. Lunds Univ. Geogr.Inst. Scr. Avh. 78: 165 pp.Akcrrnan. H.J. 6r l3. Malmstriirn (1986): <strong>Permafrost</strong> mounds in theAhisko area, Northern Swcden. Geogr. Ann. 68 A, 3: 155-165.Akerrnan, H.J. (in prep.): cp. secti<strong>on</strong> <strong>on</strong> SvalbardBarsch, El. (1971): Rock glaciers and icc-cored moraines. Geogr.Ann. 53 A, 3-4: 203-206.Barsch, D. Rr IJ. Treter (1976): Zur Verhreitung v<strong>on</strong> Periglazialphiinomenenin H<strong>on</strong>rlane/Norwegen. Geogr. Ann. 58 A: 83-93.Ekman, 5. (1YS7): Die Gewgsser des Ahisko-Gehietes. Kungl.Vetenskansakademiens Hmdlingar 4, e ser. 6,6: 172 pp.Fries, T. Rr E. Bergstriim (1910): Nigra iaktagelser iifver palsaroch deras fiirckomst i nordli aste Sveriga. Geol. Foren.Fiirhandl. Stockholm 32: 19f-205.Hamberg, A. (190s): Till Mean om alltid frustn mark i Sverige.Ymer 24: 87-93.Jeckcl, P.P. (1YXK): Pcrmafrost and its altitudial z<strong>on</strong>ati<strong>on</strong> in N.Lapland. In: <strong>Permafrost</strong>, Fifth <str<strong>on</strong>g>Internati<strong>on</strong>al</str<strong>on</strong>g> <strong>Permafrost</strong><str<strong>on</strong>g>C<strong>on</strong>ference</str<strong>on</strong>g>, Prtrcecdings Vol. 1: 170-175.King, L. (1976): Perrnafrostuntersuchungen in Tarfala, SchwedischLappland, mit Hilfe der llammerschlagseismik. 2. Glctscherk.11. C;\~ia!geol. 12,21 187-204.Kin L (19x2): Qualitative und uantitative Erfassun v<strong>on</strong>Fkrmafrost in Tarfala (Schwelsch Lap land) und fotunheimen(Norwegen) mit Hilfe geoelektrischer gndierungen. Z.Geornorph.. Suppl.Bd. 43: 139-160.King, L. (1983): High mountain permafrost in Scandinavia. In:<strong>Permafrost</strong>, Fourth <str<strong>on</strong>g>Internati<strong>on</strong>al</str<strong>on</strong>g> <str<strong>on</strong>g>C<strong>on</strong>ference</str<strong>on</strong>g>, Proceedings Vol.1: 612-617, Nar. Acad. Press, Washinfit<strong>on</strong>, D.C.King, L. (1984): <strong>Permafrost</strong> in Skandinavien,Untersuchungsergehnisse aus bppland, Jotunheimen undDovre/R<strong>on</strong>dane. Heidelberger Geogr. Arb.76: 174 pp.King, L. (1986): Z<strong>on</strong>ati<strong>on</strong> and ecology of high mountainpermafrost in Scandinavia. Geogr. Ann. 68 A: 131-139.Kine, L. & M. Seppiiki (1987): <strong>Permafrost</strong> thickness anddistributi<strong>on</strong> in Finnish Lapland - results of geoelectricalsoundings. Polarforschung 57,3: 127-147.LagerbHck, R. & L. Rodhe (19851: Pingos in northernmostSweden. Geogr. Ann. 67 A, 3-4: 239-245.Lundquist, J. (1962): Patterned ground and related frostphenomena in Sweden. Sveriges Geologiska Undersijkning, Ser.c 55: 101 pp.Malmstriim, B. (1988): Occurence of permafrost <strong>on</strong> the VarangerPeninsula, northernmost Norway. Norsk Geogr. Tidsskr. 42:239-244,Meier, K.-D. (1985): Stud-ien zur Verhreitung. Morphologie,Morphodynarnik und Okolo ie v<strong>on</strong> Palsas auf der Varanger-Halbinsel, Nord-N<strong>on</strong>vegen. kssener Geographische Arbeiten10: t14-204.@degSrd,R. et ai. ( 1992): Ground temperature measurements inmountaln permafrost, Jotunheimen, Southern Norway.<strong>Permafrost</strong> and Periglacial Processes 3: 231-234.Ostrem, G. (1964): Ice-cored moraines in Scandinavia. Geogr.Ann. 46: 282-337.Ra p. A (1982): Z<strong>on</strong>ati<strong>on</strong> of permafrost indicators in Swedishkpland. Geogr. 'I'idsskrift 82: 37-58.Rapp, A. & L. Annersten (1969): <strong>Permafrost</strong> and tundra olyg<strong>on</strong>sIn northern Sweden. In: Ptwt, T. (ed.): The periglaciafenvir<strong>on</strong>ment. M<strong>on</strong>trtal, Canada.Ragp, A. &.G.M. Clark (1971): Large n<strong>on</strong>sorted polyg<strong>on</strong>s inadjelaota Nati<strong>on</strong>al Park, Swedish Lapland. Geogr. Ann. 53 A:71-85,Rapp, A. Rr S. Kudher (1960). Recent periglacial phenomena inSweden. Bid. Pcrigf 8:.143:154.Seppala, M. (1988): Palsas and related forms. In: M.Y. Clark (ed.):Advances in Periglacial Geomorphology: 247-278.Smith, H. (191 I): Postglaciala regi<strong>on</strong>forskjutnin ar i norraHarjedalen och siidra JBrntlands fjalltrakter. keel. F8ren.Stockholm FBrh. 33: 503-530.Sollid, J.L. & L,. Sarhel (1974): Palsa bogs at Hau~tj0rn/o,Dovrefjell, South Norway, Norsk Geografisk TldsskrIft 28,l: 53-60.Sollid, J.L. & L. Smbel(1988): Influence of temperaturec<strong>on</strong>diti<strong>on</strong>s in formati<strong>on</strong> of end moraines in Fennoscandia andSvalbard. Boreas 17: 553-558.Sollid, J.L, & L. Sorbel (1992): Rock laciers in Svalbard andNorway. <strong>Permafrost</strong> and Perlglaaa! Processes 3,3: 215-220.Svenss<strong>on</strong>, H. (19624: Nigra iakta elser frh pals ornrfid<strong>on</strong>. NorskGeogr. Tidsskrift 18, 5-6: 212-2h.Svenss<strong>on</strong>, H. (1962b): Tundrarlyg<strong>on</strong>s. Photographicinterpretati<strong>on</strong> and field stu les In North Norwegian polyg<strong>on</strong>areas. Arb. Norges Geol. Unders 223: 298-327.Svenss<strong>on</strong>, H. (1969): A type of circular lakes in northernmostNorway. Geqgr. Ann. S1 A: 1.12.
statusSvenss<strong>on</strong>, H. (1986): Some morphoclimatic aspects of periglacialfeatures of northern Scandinavia. Geogr. Ann. 68 A:123-130.Wramner, P. (1973): Palsmyrar i Taavavuoma, La land.Giiteborgs Univ. Naturgeogr. Inst. Rapp. 3: 14d)pp.ALPS AND JURABarsch, (1978): Active Rock Glaciers as Indicators forDisc<strong>on</strong>tinous Alpine <strong>Permafrost</strong>, an Example from the SwissAlps. Proceedings of the Third <str<strong>on</strong>g>Internati<strong>on</strong>al</str<strong>on</strong>g> <str<strong>on</strong>g>C<strong>on</strong>ference</str<strong>on</strong>g> of<strong>Permafrost</strong>, July 10-13, 1978, Edm<strong>on</strong>t<strong>on</strong>, Alberta, Canada. Vol.1: 349-352, Ottawa.Barxh, D. (1992): <strong>Permafrost</strong> Cree and rockglaciers. <strong>Permafrost</strong>and Periglacial Processes 3,3: lkI88.Bell<strong>on</strong>i, S., A. Cart<strong>on</strong>, F. Dramis & C. Smiraglia (1993):Distributi<strong>on</strong> of permafrost, laciers and rock glaciers in theItalian mountains and correfati<strong>on</strong>s with climate: an atteqt tosythesize. Sixth <str<strong>on</strong>g>Internati<strong>on</strong>al</str<strong>on</strong>g> <str<strong>on</strong>g>C<strong>on</strong>ference</str<strong>on</strong>g> <strong>on</strong> <strong>Permafrost</strong>, eyng19Y3, Proceedings Vol. 1: 272-277.Cheng, G. & F. Dramis (1992): Distributi<strong>on</strong> of mountainermafrost and climate. <strong>Permafrost</strong> and Periglacial Processes 3,8: 83-91.Evin, M., D. Fabre, A. Assier & Ch. Guillain (1993): Les glaciersrocheux du Roure. Socittt ilydrotechnique de France, secti<strong>on</strong>glaciologie, Grenohle: 6 pp.Francou, B. & L. Reynaud (1992): 10 ears surficial velocities <strong>on</strong> arock lacier (Laurichard, French dps). <strong>Permafrost</strong> andPerigyacial Processes 3,3: 209-214.Gorbunov, A. P. (1978): <strong>Permafrost</strong> investigati<strong>on</strong> in high mountainregi<strong>on</strong>s. Arctic and Alpine <strong>Research</strong> 10,2: 283-294.Guglielrnin, M. & C. Tellini (1993): First example of permafrostmapping with BTS in the Italian Alps (Livi no, S<strong>on</strong>drio, Italy)Acta-Naturalia de I’Ateneo Parmenese 29,gN. 1/2 39-46. ’Haeberli, W. (1985): Creep of mountain permafrost: internalstructure and flow of alpine rock laciers. Mitt. derVersuchsanstalt fiir Wasserbau, kfydrologie und Glaziologie 77,ETH Zurich: 142 pp.Haeberli, W. (1992): C<strong>on</strong>structi<strong>on</strong>, envir<strong>on</strong>mental problems andnatural-hazards In periglacial mountain belts. <strong>Permafrost</strong> andPeriglacial Processes 3.2: 11 1-124.Haeberli, W. (1993): <strong>Research</strong> <strong>on</strong> permafrost and periglacidprocesses in mountain + areas and perspectives. (Thisvolume)Haeberli, W., M. Evin, G. Tenthorey, H.R. Keusen, M. Hoelzle, F.Kellef, D. V<strong>on</strong>der Muhll, S. Wagner, M. Pelfini & C. Smiraglia(1992): <strong>Permafrost</strong> research sites in the Alps: excursi<strong>on</strong>s of the<str<strong>on</strong>g>Internati<strong>on</strong>al</str<strong>on</strong>g> Workshop <strong>on</strong> <strong>Permafrost</strong> and PeriglacialEnvir<strong>on</strong>ments in Mountain Areas. Periglacial Processes 3,3:189-202.Haeberli, W. & M. Funk (1991): Borehole temperatures at theColle Gnifetti core-drillin site (M<strong>on</strong>te Rosa, Swiss Alps):Journal of Glaciology 37,725: 37-46.Haeberli, W., L. King & A. Flotr<strong>on</strong> (1979): Surface movementsand lichen-cover studies at the active rock glacier near theGrubengletscher, Wallis, Swiss Alps. Arctic and Alpine Res. 11,4: 421-441.Hoelzle, M., W. Haeberli Br F. Keller (1993): Applicati<strong>on</strong> of BTSmeasurementsfor modelling mountain perma rost dlstrlbutl<strong>on</strong>.Sixth <str<strong>on</strong>g>Internati<strong>on</strong>al</str<strong>on</strong>g> <str<strong>on</strong>g>C<strong>on</strong>ference</str<strong>on</strong>g> <strong>on</strong> <strong>Permafrost</strong>, Beijing 1993,Proceedings Vol. I: 272-217.Keller, F. (1992): Automated map ing of mountain permafrostusing the program PERMAdT within the geo raphicalinformati<strong>on</strong> system ARC/INFO. <strong>Permafrost</strong> and B eriglacialProcesses 3,2: 133-138.King, L. (1990): Soil and rock temperatures in disc<strong>on</strong>tinuousrrmafrost: Gornergrat and Unterrothorn, Wallis, Swiss Alps.ermafrost and Per~glacial Processes 1,2: 177-188.King, L., A. P. Gorbunov & M. Evin (1992): Prospecting andmapping of mountain permafrost and associated phenomena.<strong>Permafrost</strong> and Periglacial Processes 3,2: 73-81.Pancza, A. (1992): gtlivati<strong>on</strong> des parois rocheuses dans unefacikre du Jura NeuchBtelois. <strong>Permafrost</strong> and Periglacialrocesses 3,2: 49-54.V<strong>on</strong>der Muhll, D. & W. Haeberli (1990): Thermal characteristicsof the permafrost within an active rock lacier(Murttl/Corvatsch, Gris<strong>on</strong>s, Swiss Alps!. Journal of Glaciology36, 123: 151-158.V<strong>on</strong>der Muhll, D. & P. Holub (1992): Borehole lo ing in AlpineFmafrost, Upper Engadin, swiss ~ ps. Permakt anderiglacial Processes 3,2: 125-132.Wa ner, S. (1992): Creep of Alpine permafrost, investi ated <strong>on</strong>tte Murttl rock glacier. <strong>Permafrost</strong> and Periglacial jrocesses 3,2: 157-162.OTHER EUROPEAN AREASAgudo, C., E. Serrano & E. Martinez de Pis<strong>on</strong> (1989): El laciarrocoso activo de Los Gemelos en el Macizo de Posets birinboArag<strong>on</strong>es): Cuaternario y geomorfologla. Vol. 3: 83-91.Chueca, J. (1992): A statistical analysis of the spatial distributi<strong>on</strong>of rock glaciers, Spanish Central Pyrenees. <strong>Permafrost</strong> andPeriglacial Processes 3,3: 261-265.Czudek, T. (1993): Pleistocene Periglacial Structures andLandforms in Western Czechoslovakia. <strong>Permafrost</strong> andPeriglacial Processes 4, 1: 65-76.Dramis, F. & A. Kotarba (1992): Southern limit of relict rockfaciers, Central Appennines, Italy. <strong>Permafrost</strong> and Periglacialrocesses 3,3: 257-260.Gutierrez, M. Kr J.L. Pena (1981): Los glaclares rocososy elmodelado acompahante en el Brea de la B<strong>on</strong>aigua (PlrinCo deUrida). Bol. Ceol. Mintro 92: 11-20.Ichim, 1. (1978): Preliminary observati<strong>on</strong>s <strong>on</strong> the rock lacierphenomen<strong>on</strong> in the Romanian Carpathians. Revue kournaineGtol. Gtof. Gtogr., Gtographie 23,2: 2Y5-299.San Josk, J.J. De, C. Agudo, E. Serrano & F. Silio (1992):Auscultaci6n topografica y fotogrametrica del 8laciar rocoso deLas Ar ualas (Pirinto Arag<strong>on</strong>es): datos prelimlnares. In: F.Lo ez bermudez. C. C<strong>on</strong>esa Garcia & M.A. Rornero Dim(e&): Estudios de geomorfologia en Es aha, actas de lareunmn de la I1 reuni<strong>on</strong> naci<strong>on</strong>al de GI&: 423-431, Murcia.Serrano, E., E. Martinez de Pis<strong>on</strong> et al. (1991): El glaciarnoroccidental del Besiberri (Pirinto de Urida). Pirintos 137:95-109Urdea, P. (1992): Rock Glaciers and Periglacial Phenomena in theSouthern Carpathians. <strong>Permafrost</strong> and Periglacial Processes 3,3: 267-273.Urdea, P. (1993): <strong>Permafrost</strong> and Periglacial forms in theRomanian Carpathians. Sixth <str<strong>on</strong>g>Internati<strong>on</strong>al</str<strong>on</strong>g> <str<strong>on</strong>g>C<strong>on</strong>ference</str<strong>on</strong>g> <strong>on</strong><strong>Permafrost</strong>, Beljing 1993, Proceedings Vol. 1: 631-637.1027
STUDIES ON MOUNTAIN PERMAFROST IN ASIAQiu GuoqingLanzhou Institute of Glaciology and GeocryologyChinese Academv of Sciences,T..anzhou 73000,ChinaAsia has the largest permafrost area in the world. Thc existence of frozen ground and frost acti<strong>on</strong> wasknown l<strong>on</strong>g ago, while the systematic investigati<strong>on</strong>s <strong>on</strong> mountain permafrost were carried out since the50's of this century. The mountain permafrost can be divided into threeAbroad categories, ;.e., thepermafrost dcveloping in mountains in the c<strong>on</strong>tinuous belt of the Eurasian c<strong>on</strong>tinental permafrost z<strong>on</strong>e<strong>on</strong> a frigid background, the permafrost developing in mountains out side the Eurasian c<strong>on</strong>tinentalpermafrost z<strong>on</strong>e <strong>on</strong> a warm to temperate background and thc permafrost in mountains in thedisc<strong>on</strong>tinuous belt of the Eurasian c<strong>on</strong>tinental permafrost z<strong>on</strong>e. The distributi<strong>on</strong> of mountainpermafrost has a closc relati<strong>on</strong> to the climatic variati<strong>on</strong> in three dimensi<strong>on</strong>s. Much more work is neededfor searching a perfect classificati<strong>on</strong> of mountain permafrost.HISTORY. . " "Asia has the largest permafrost area in the world. The existenceof frozen ground and frost acti<strong>on</strong> was known l<strong>on</strong>g ago. InChina, the Rook of Rites: Seas<strong>on</strong>s, that was written 2000 years ago,described cxactly the seas<strong>on</strong>al fluctuati<strong>on</strong> of climate and the processesof ground freezing and thawing (Shi et al.,1964); the outstandingChincse geographer Xu Xiake had reported the existence.Of block field and the difference in frost acti<strong>on</strong> bctween the northandsouth-facing slopes in the Mt. Wutaishan of Northern Chinain 1633 (Xu, 1980). In West Tianshan, frost fissures and frostmounds were first reported by V.I. Roborovsky in 1893; the firstinformati<strong>on</strong> about permafrost in AK-Say basin of Inner Tianshanwas given by A.l. Reas<strong>on</strong>ov in 1913 (Gorbunov,l993). With the exploitati<strong>on</strong>of Siberia since the 19th century, many data and knowledgewas obtained and the geocryology became an independentdicipline lirstly in Russia in this century.Since 1950'S, permafrost investigati<strong>on</strong>s werc undertaken in theNortheast China in the interest of forest cxploitati<strong>on</strong> and railroadc<strong>on</strong>structi<strong>on</strong> in the Mt. Da-Hinggan Ling regi<strong>on</strong>. During the periodfrom 1950's to 1970'S, comprehensive invcstigati<strong>on</strong>s <strong>on</strong> naturalc<strong>on</strong>diti<strong>on</strong> and resource were carried out in West China, many publicati<strong>on</strong>s,as the rcsults of those expedili<strong>on</strong>s, emphasized the importanceof altitudinal z<strong>on</strong>ati<strong>on</strong> and the frost actl<strong>on</strong> in mountains.Special permafrost researches were carried out in the Mts. AltaiShan, Qilian Shan, Qinghai-Xizang Plateau of China, thc Mts.Zayilisky Alatau, West Tianshan, Inner Tianshan and Pamir of theUSSR / CIS, the Mts. Rhentei and Khangai of M<strong>on</strong>golia sincc1960's. In the past 3 years, a joint expediti<strong>on</strong> in Northern Tianshanwas undertaken by the Lanzhou Institute of Glaciology andGcocryology, Academia Sinica and the Pcrnmaf'rost Instilute ofSibcria Branch of the Russian Academy of Sciences.On the basis of the previous work, it is possible to review anddiscuss some aspects of the permafrost studies in mountain areas ofAsia.DISTRIRUTTON OF MOUNTAIN PERMAFROST-According to Gorbunov (1988), the mountain permafrost"should include <strong>on</strong>ly those percnnially frozen soils which occurover 500 m above sea level, and is absent below this level". Chengand Dramis (1992) suggested that the term "mountain permafrost"is used to include both alpine permafrost and polar mountainpermafrost, Which is not c<strong>on</strong>venti<strong>on</strong>ally c<strong>on</strong>sidered as alpinepermafrost. In this revicw, Cheng's c<strong>on</strong>cept is used.Generally, the mountain permafrost can be dividzd into threebroad categories, Le.,1. the permafrost developing in mountains in the c<strong>on</strong>tinuousbelt of the Eurasian c<strong>on</strong>tinental permafrost z<strong>on</strong>e, <strong>on</strong> a frigid background;2, the permafrost developing in mountains outside theEurasian c<strong>on</strong>tinental permafrost Lune, or <strong>on</strong> a warm to tempcratebackground;3. the permafrost developing in mountains in thedisc<strong>on</strong>tinuous belt of the Eurasian c<strong>on</strong>tinental permafrost z<strong>on</strong>e,this is the transiti<strong>on</strong>al type of the first two.The pcrmafrost in mountains of the northern part of EastSibcria is the typical <strong>on</strong>e of the first type. There, the mean annualair temperature ranges from -.7.5 to -15 OC or lower, permafrost ispresent everywhere with a mean annual ground tcmperarure of -3to -1 1 "C in plains, depressi<strong>on</strong>s and valleys, -7 t,' -15 'C at mountains(Ershov et al, 1989 a). Such a mountain permafrost developing<strong>on</strong> an extremely frigid background without a lower limit wasnamed the "Verkhoyangsk type alpine permafrost by Gorbunov(1978). Such kind of mountain permafrost is also seen in the Mt.
RYrranga and Mt. Putorana of the northern part of Central SiberiaPlateau,Outside the Eurasian c<strong>on</strong>tinental permafrost z<strong>on</strong>e, thc &vel-OPment of mountain permafrost depends mainly <strong>on</strong> the variati<strong>on</strong>of climate in three dimensi<strong>on</strong>s, For examplc, in the ChineseTianshan, according to the statistics using the data from 17stati<strong>on</strong>s, the dependence of the mean annual air temperature T <strong>on</strong>the latitude x], l<strong>on</strong>gitude X2 and altitude X3 is known as follows(Qiu, 1993):T= 109.28-2.19X1-0.024X2-0.005IX3 (1 1The'correlati<strong>on</strong> coefftcient R of (I) is 0.9596. The corresp<strong>on</strong>dingstandard rcgrcssi<strong>on</strong> coefficients are:R1 "0.48 forX1;B2 = 4.025 for X2;B3 =-0.93 for X3.For the vast area from Mt. Qilian Shan to the Mt.Himalaya,according to the statistics by using the data from 78 stati<strong>on</strong>s,T=66.25-0.92X1-0.14X24.0056X3 (2)The corrclati<strong>on</strong> coefficient R of (2) is 0.9530. The corresp<strong>on</strong>dingstandard regressi<strong>on</strong> coefficients are:R1 =-0.77 forX1;B2 = -0.20 for X2;B3=-1.12forX3.Thus, it could be c<strong>on</strong>cluded that in the mountains of WestChina the mean annual air temperature decreases very obviouslyfrom lowland to high mountain, decreases obyiously from south t<strong>on</strong>orth and slightly decreascs from west to east. Such a variati<strong>on</strong> ofmean annual air temperature in three dimensi<strong>on</strong>s influences in thedevelopment of permafrost in high mountains, the cold islandsstanding <strong>on</strong> the tcmperate-warm background in the middle-lowlatitudes while the lower limit of the disc<strong>on</strong>tinuous mountainpermafrost ascends southwards (Zhou et al, 1991):2700-3100 m a.s.1. in Mt.Tianshan;3500-3900 m a.s.1. in Mt.Qilian Shan;4150-4200 m a.s.1. at the Xidatang of the Mt. Kunlun Shan;4600 m a.s.1. <strong>on</strong> the south sidc ofMt.Tangula, and5100-5300 m a.s.1. in the Mt. Himalaya Shan.Such a latitudinal variati<strong>on</strong> of the lower limit is also sccn in thecentral Asia part of CIS, e.g., it riscs from 3200-3700 m a.s.1. in theMt.Zayilisky Alatau up to 3600-4000 m in Pamir (Gorbunov,1978).The lower limit of the mountain permafrost also descendseastwards. For example, al<strong>on</strong>g the 43'N latitude, it lies at 3300ma.s.1. in the Ralshaya Almatinka Permafrast Stati<strong>on</strong> in Kazakhstan,2900-3250 m a.s.1. in the Chinese Tianshan Glaciological Stati<strong>on</strong>(Qiu, 1993),1900-2000 m a.s.1. in the Mt. Changbai Shan (Zhou etal, 1991) and the Northeast Korea (Viktor An, 1993), and down to1700 m a.s.1. in Hokkaido.In the Mt.Qilanshan at 37'-40"N. the permafrost lowcr hitdescends from 3900 to 3500 m a.s.1. eastwards; in the Mt.WutaiShan at 38"N it lies at 2300 m a.s.1. In the Mt. Kunlun Shan at36"-34'30'N, it descends from 4400-4500 m in the northwest,4150-4200 m a.s.1. in the middle and 3850-3900 m at the southeastend; in the Mt. Taibai Shan (3CN) in the Shannxi Province, it liesat 3000 m a.s.l.(Zhou et al, 1991). All of these document aneastward descent of the lower limit of mountain <strong>Permafrost</strong>, andthis would result from the decrease of air ternperaturc in the Samedirecti<strong>on</strong>.The permafrost regi<strong>on</strong>s in the M<strong>on</strong>golian Republic and theNortheast China are in the south part of the Eurasian C<strong>on</strong>tinental<strong>Permafrost</strong> Z<strong>on</strong>e. 63% of the territory of the M<strong>on</strong>golian Republicis underlain by permafrost (Lombodchen, 1993), where the lowestand southernmost positi<strong>on</strong> of the permafrost islands was c<strong>on</strong>sideredas both the lower limit of the sporadic permafrost belt and thcsouth limit of the permafrost z<strong>on</strong>e(Joint Soviet-M<strong>on</strong>golia Scientific<strong>Research</strong> Geological Expediti<strong>on</strong>, 1974). Although the c<strong>on</strong>tinuityof permafrost tends to increasc northwards, showing a latitudinalz<strong>on</strong>ati<strong>on</strong>, it is also obvious that the permafrost with higher c<strong>on</strong>tinuity,lower temperature and a greater thickness occurs in the coldcenters or thc three mountain systems i.e., the Mt. M<strong>on</strong>golianAltay in the southwest, the Mt.Khangai in the west and theMt.Kentei in thc middle part of Northern M<strong>on</strong>golia, standing <strong>on</strong>the background of sporadic island permafrost belt, in other words,the latitudinal z<strong>on</strong>ati<strong>on</strong> and altitudinal z<strong>on</strong>ati<strong>on</strong> are of the sameimportance in the development of permafrost, while in thc otherkinds of mountain permafrost regi<strong>on</strong> there is not such a wide sporadicpermafrost belt. In Northeast China, the south limit ofpermafrost is also determined according to the southernmost positi<strong>on</strong>of permafrost islands( Guo et al, 1981). The west secor of thesouth limit approximitely coincides with the 0 to -1 "C isotherm,the middle --O'C, and the east--0 to t 1'C. Thc W-shanped runningof the south limit might result from the special terrain with theMt.Acrshan (700-1200m a.s.1.) in the southwest and the Mt.XiaoHinggan Ling in the southeast and the lower plain in thc middle(Guo et al, 1981). The fact that the permafrost increases in c<strong>on</strong>tinuityand thickness and decreascs in temperature shows a latitudinalmnati<strong>on</strong>. The coldest and thickest permafrost occurring in thenorth is the result of the altitudinal z<strong>on</strong>ati<strong>on</strong>,and the terrain has alsoefTect <strong>on</strong> it, Although different in terminology, the distributi<strong>on</strong>of permafrost in Northeast China and M<strong>on</strong>golia can be compsrcdto each other. The sporadic scarce-island- and island-pcrmalrostbelts in M<strong>on</strong>golia is corresp<strong>on</strong>ding to the island-permafrost bclt inNortheast China, the Predominantly c<strong>on</strong>tinuous belt in NortheastChina might corresp<strong>on</strong>d to the disc<strong>on</strong>tinuous belt, according tothere c<strong>on</strong>tinuity. The mountain permafrost in the Zabaykal rcgi<strong>on</strong>and the southern part of East and Central Siberia is <strong>on</strong> the backgroundof the disc<strong>on</strong>tinuous permafrost belt of the Eurasian C<strong>on</strong>tinental<strong>Permafrost</strong> Z<strong>on</strong>e.CLASSIFICATIONAn important problem in mountain permafrost studies is toprovide a perfect principle for the classificati<strong>on</strong> related to the distributi<strong>on</strong>of permafrost.It was suggested that the alpine permafrost be divided into thec<strong>on</strong>tinuous, disc<strong>on</strong>tinuous and sporadic z<strong>on</strong>es like that in the polarand subpolar regi<strong>on</strong>s, but the definiti<strong>on</strong>s would be somewhat different.If above a certain altitude the permafrost distributes everywhere,then this altitude could be defined as the lower iimit of thec<strong>on</strong>tinuous permafrost; if above a certain altitude <strong>on</strong>ly <strong>on</strong> somesides of the slopes can the permafrost occur, then this altitudc couldbe defined as the lower limit of the disc<strong>on</strong>tinuous pcrmafrost; belowthe disc<strong>on</strong>tinuous permafrost z<strong>on</strong>e, <strong>on</strong>ly in scmc localities witha special cryogenic c<strong>on</strong>diti<strong>on</strong> can the permafrost occur, then this
kind of permafrost could be defined as the sporadic <strong>on</strong>e(Corbunov,l978). The permafrost that develops under the thickforest and moss cover and the permafrost that develops in thehigh-porosity block fields is the typical sporadic permafrost inMt.Tianshan. This classificati<strong>on</strong> is quite simple and useful inpcrmatiost investigati<strong>on</strong> and mapping to distinguish the developmentc<strong>on</strong>diti<strong>on</strong> and distributi<strong>on</strong> characteristics of thecryolith<strong>on</strong><strong>on</strong>es. It is questioed that the mounatin mass is cutseparately and is disc<strong>on</strong>tinuous, the individual summit of themountain mass rose up to a high absolute altitude with low a meanannual air temperature,say, as low as -10 to -1S0C, of course, thesummit itself is subject to perennial freezing to a depth of severalhundred meters, the temperature in the cryolithoz<strong>on</strong>e may be lowerthan -5 to -10 'C, and all sides of the slopes are undcrlain bypcrmafrost and could be defined as the c<strong>on</strong>tinuous permafrostz<strong>on</strong>e;however, <strong>on</strong> the background of the whole mountain system inmiddle-low latitudes, the cryolothoz<strong>on</strong>e is <strong>on</strong>ly a small island occupying.Only several percent of the whole mountain area, in thisway the cryolothoz<strong>on</strong>e is disc<strong>on</strong>tinuous. Thus, there was anothersuggesti<strong>on</strong> that the permafrost be divided into the stable, lessstable, unstable and extremely unstable <strong>on</strong>es <strong>on</strong> the basis of theirtemperature and thickness (Cheng and Wang, 1982). This classificati<strong>on</strong>might be more perfect theoretically, however, it needs manydata in temperature and thickness obtained from boreholes andother observati<strong>on</strong> sites, so it could <strong>on</strong>ly be used in some areas beingstudied in detail. A perfect classificti<strong>on</strong> should be available for theplanning of engineerings and for the predicti<strong>on</strong> of possible changeof envir<strong>on</strong>ment in the near future, in additi<strong>on</strong>, it should also besimple and clear <strong>on</strong> the basis of parameters easier to obtain. Muchmore work is needed for searching a perfect classificati<strong>on</strong> of mountainpermafrost.REFERENCE". ., ."Cheng Guod<strong>on</strong>g and Wang Shaoling,1982,0n the permafrostz<strong>on</strong>ati<strong>on</strong> of the high-altitude permafrost in China. Journal ofGlaciology and Geocryology, 4(2),pp.l-17.Cheng Guod<strong>on</strong>g and PDramis, 1992, Distributi<strong>on</strong> of mountainpermafrost and clirnte. <strong>Permafrost</strong> and Periglacial Processes.3.2,pp83-91.Ershov, E.D. et al, 1989 a, Geocryology in USSR (EasternSibcria),"NEDRA" Press, Moscow. p.515.Ershov,E.D. et al, 1989 b, Geocryology in USSR(Centra1 Siberia)"NEDRA" Press, Moscow. p.414.Ershov,E.D. et al, 1989c, Geocryology in USSR (Mountain Regi<strong>on</strong>s in Southern USSR)."NEDRA" Press, Moscow. p.359.Gorbunov, A.P., 1978, <strong>Permafrost</strong> investigati<strong>on</strong>s in high-mountainregi<strong>on</strong>s. Arctic and Alpine <strong>Research</strong>.VOl.lO,N0.2.pp283-294.Gorbunov, A.P., 1988, The alpine permafrost z<strong>on</strong>e of the USSR.in:Proceedings of The Fifth <str<strong>on</strong>g>Internati<strong>on</strong>al</str<strong>on</strong>g> <str<strong>on</strong>g>C<strong>on</strong>ference</str<strong>on</strong>g> <strong>on</strong><strong>Permafrost</strong>. Vol.1. Tapir Publishers,Tr<strong>on</strong>dhcirn.pp.lS4-158.Gorbunov, A.P.,1993, Geocryology of the Tianshan. in:Proceedingsof The sixth <str<strong>on</strong>g>Internati<strong>on</strong>al</str<strong>on</strong>g> <str<strong>on</strong>g>C<strong>on</strong>ference</str<strong>on</strong>g> <strong>on</strong> <strong>Permafrost</strong>.Vol.2.pp. 1105 -1107 .Guo D<strong>on</strong>gxin, Wang Shaoling, Lu Guowei and DaiJinbo,l981,Divisi<strong>on</strong> of permafrost regi<strong>on</strong>s in the Da andXiao-Hinggan Ling of Northeast China. Jownai ofGlaciology and Geocryology, 3(3), pp.1-9.Joint Soviet-M<strong>on</strong>golian Scientific <strong>Research</strong> GeologicalExpediti<strong>on</strong>, 1974, Geocryological c<strong>on</strong>diti<strong>on</strong>s of the M<strong>on</strong>golianPeople's Republic. "NAUKA" Press, Mogcow. p.200.Eomborichen, R.,1993,Cryogenic processes and phenomean inM<strong>on</strong>golia. in : Proceedings of the Sixth <str<strong>on</strong>g>Internati<strong>on</strong>al</str<strong>on</strong>g> <str<strong>on</strong>g>C<strong>on</strong>ference</str<strong>on</strong>g>.Vol.1. South China Technology University Press.pp.411-415.<strong>Permafrost</strong> Institute of Siberian Branch, Academy of Sciences,USSR, 1974, General Geocryology (ObshayaMerzlotovedenye). Science Press, Beijing. p.318.Qiu Guoqing, Huang Yizhi and Li Zuofu, 1983, Alpine permafrost- in Tianshan, China. in: Procecdings of 4th <str<strong>on</strong>g>Internati<strong>on</strong>al</str<strong>on</strong>g> <str<strong>on</strong>g>C<strong>on</strong>ference</str<strong>on</strong>g><strong>on</strong> <strong>Permafrost</strong>. Nati<strong>on</strong>al Academy Press, Washingt<strong>on</strong>D.C. pp.1020-1023.Qiu Guoqing, 1993, Development c<strong>on</strong>diti<strong>on</strong> of alpine permafrost inMt.Tianshan, China. Proceedings of Sixth <str<strong>on</strong>g>Internati<strong>on</strong>al</str<strong>on</strong>g> <str<strong>on</strong>g>C<strong>on</strong>ference</str<strong>on</strong>g><strong>on</strong> <strong>Permafrost</strong>, Vol. I. South China Technology UniversityPress. pp.533-538.Shi Yafeng et al, 1964, Basic characteristics of existing glaciers inChina. ACTA Geographica Sinica.30(3). pp.183-208.Shi Yafeng et al, 1988, Explanati<strong>on</strong> to the map of snow, ice andfrozen ground in China (1:4000000). Cartographic PublishingHouse, Beijing. p.32.Viktor An, 1993, <strong>Permafrost</strong> in the north of Korean Penisula. in:Procecdings of the Sixth <str<strong>on</strong>g>Internati<strong>on</strong>al</str<strong>on</strong>g> <str<strong>on</strong>g>C<strong>on</strong>ference</str<strong>on</strong>g> <strong>on</strong><strong>Permafrost</strong>, Vol.1. South China Technology UniversityPress.pp.843-845.Xu H<strong>on</strong>gzhu, 1981, Xu Xiake's Travels. Acient Literature PublishingHouse, Shanghai. p.82.Zhou youwu, Qiu Guoqing and Guo D<strong>on</strong>gxin, 1991, Quaternarypermafrost in China. Quaternary Science Revicw.vo1.1o.pp.511-517.1030
LINEAR CONSTRUCTION IN COLD REGIONS - PAVED ROADS AND AIRFIELDSTed S. Vins<strong>on</strong>Professor, Department of Civil Engineering, Oreg<strong>on</strong> State University, Corvallis, OR 97331The performance of paved roads and airfields in cold regi<strong>on</strong>s may be categorized with rcspect to three modes ofdistress: (1) distorti<strong>on</strong> and pavement faulting, (2) disintegrati<strong>on</strong>, and (3) cracking. By far the most prevalent problemfor an asphalt c<strong>on</strong>crete pavement is cracking. Cracking may be traffic/load associated or n<strong>on</strong>-traffic/load associated.TrafficAoad associated cracking may be related to fatigue failure and subgrade rutting in an asphalt c<strong>on</strong>crete pavementstructure. Low temperature cracking may be caused by two distress mechanisms. First, trnnsverse cracks can extendthrough the entire pavement structure and into the subgrade. This type of transverse crack is associated primarily withthe thermal c<strong>on</strong>tracti<strong>on</strong> of soil (in the base, subbase, and/or subgrade) rather than'the asphalt c<strong>on</strong>crete surface layer.Sec<strong>on</strong>d, transversc thermal cracks can occur wholly in the asphalt c<strong>on</strong>crete surface layer. Methodologies presently existto allow the resistance of an asphalt c<strong>on</strong>cretej&ement to fatigue, subgrade rutting, and low temperature cracking tobe quantified and easily incorporated in pavement design for the subarctic and arctic.INTRODUCTIONRoads and airfields located in the arctic and subarctic may beclassifid iuto three distinct groups: (I) gravel surfaced, (2)"flexible"- bituminous surfaced, and (3) "rigid"- portland cement c<strong>on</strong>crete(PCC) surfaced. For example, the Alaska Department of Transportati<strong>on</strong>and Public Facilities (Alaska DOTPF) maintains a total centerlinenetwork of about 8000 km (5000 mi) of which about 3520 km (2200mi) are paved. Essentially all of the paved roads are bituminoussurfaced (asphalt c<strong>on</strong>crete (AC), bituminous surface treatment, sealcoat, etc.). However, in Russiaessentially all paved roads in the arcticand subarctic are rigid portland cement c<strong>on</strong>crete (Le., prefabricatedslabs).Virtually all roads and airfields in the subarckic and arctic wereinitially c<strong>on</strong>structed of a gravel fill placed directly <strong>on</strong> the existingvegctati<strong>on</strong> to take advantage of the insulati<strong>on</strong> and latent heat capacityof the surface organic laycr (Crory, 1988). The bearing surface wascreated by adding fines to "bind" the gravel, which was then compactedand graded. The binder material wns necessary because theaggregatcs which were used were not crushed.Since the number of paved roads and airfields in the subarctic andarctic is not great, their performance and factors which cause distressto asphalt c<strong>on</strong>crete may not be fully appreciated by professi<strong>on</strong>als involvedin their design and c<strong>on</strong>structi<strong>on</strong>. Thc purpose of this paper isto providaa review of the performance of paved roads and airfields inthe subarctic and arctic and to briefly discuss design mcthodologies torelate to three major distress modes in an asphalt c<strong>on</strong>crete pavement,namely, fatigue, subgrade rutting, and low temperature cracking.PERFORMANCE OF PAVED ROADS ANDSUBARCTIC AND ARCTICAIRFIELDS IN THERoad and airfield pavement performance in cold regi<strong>on</strong>s may becategorized with respect to three modes of distress (Vins<strong>on</strong> et ai.,1986): (1) distorti<strong>on</strong> and pavement faulting, (2) disintegrati<strong>on</strong>; and (3)cracking. In the discussi<strong>on</strong> Khat follows, a background of these distressmodes together with a limited review of the current stateof-the-art ofresearch and/or practice is presented.Distorti<strong>on</strong> and Pavement FaultingFrost heave and thaw degradati<strong>on</strong> in the active layer are primarycauses of distorti<strong>on</strong> (movement) and faulting of pavements in the arcticand subarctic. Distorti<strong>on</strong> distress is also associated with buriedstructures remaining fixed while the surrounding mil heaves or"jacking" out of the ground under successive freeze-thaw cycles.Frost heave distorti<strong>on</strong> is greatest toward the end of the winter.Evidence of differential movements for asphalt c<strong>on</strong>crete pavementsafter spring thaw is generally suggested by scrape marks from a snowplow blade. Very often, howeverp differentid movements are nitobvious after spring thaw. Remnant evidence of differential movementmay be associated with loss of fines beneath a distorted secti<strong>on</strong> thatresults in "lipping" at a crack or the formati<strong>on</strong> of a "birdbath"..The greatest differential movements observed over a <strong>on</strong>e-yearperiod are generally associated with differences in soil frost heaveresp<strong>on</strong>se, for example, a difference in soil resp<strong>on</strong>se may occurbetween a backfill material in a culvert trench and the adjacent soilunderlying the pavement. If the backfill soil is identical to the adjaccntsoil underlying the pavement, the differential movements may bereduced, but generally cannot be eliminated if the soil is frostsusceptible.Berg and Johns<strong>on</strong> (1983) noted that drains, culverts, or utilityducts placed under pavements <strong>on</strong> frost susceptible subgrades oftenexperience differential heave and should be avoided. They provideguidelines for transiti<strong>on</strong> z<strong>on</strong>es for culverts or utilities that must beplaced beneath pavements <strong>on</strong> frost susceptible soils 88 well 96l<strong>on</strong>gitudillal and transverse transiti<strong>on</strong>s accommodate to interrupti<strong>on</strong>s inpavement uniformity.Rice (1975) succinctly identified the causes of frost heave as thethree W's: winter, water.wick (is., cold temperatures, access to1031
watcr, n frost susceptible soil). It is univcrsally recognized thatmitigati<strong>on</strong> of distress relatcd to frost heave involvcs the elimintlti<strong>on</strong> of<strong>on</strong>e or more of these factors. C<strong>on</strong>sidering the evoluti<strong>on</strong>ary history ofmost roads and airficlds it may not be prnctical to rcmove frostsusccptihle soils since they often comprise must of thc emhankmcnt.C<strong>on</strong>sequently, insulati<strong>on</strong> is expericncing increased use to prevent theadvance of the freezing fr<strong>on</strong>t into the embankment to mitigate frostacti<strong>on</strong> (Kcstlcr and Berg, 1989).A c<strong>on</strong>sidertlti<strong>on</strong> of frost heavc suggests the related problem ofthnw weakening in the pavement structure. Pavement deteriorati<strong>on</strong>under repeutd loads is a process of cumulative damage. During springthaw, thc supporting capacity of a pavement surface layer provided bythe base, suhhase, or subgrade, can be reduced owing to excess porewater in the supporting layers. Under these c<strong>on</strong>diti<strong>on</strong>s damageaccumulati<strong>on</strong> for a given traffic volume and load is greatest and canlead to a substantial reducti<strong>on</strong> in overall pavement life (Rutherford andMah<strong>on</strong>ey, 1986). An example calculati<strong>on</strong> which follows the mechanisticapproach to pavement design (Mah<strong>on</strong>ey and Vins<strong>on</strong>, 1983) suggeststhe magnitude of the problem at the Nome Airfield (Vins<strong>on</strong> andRo<strong>on</strong>ey, 1991). C<strong>on</strong>sidering the potential for a fatigue failure in theasphalt c<strong>on</strong>crete under three design aircraft'loadings at the NomeAirfield, it wns dem<strong>on</strong>strated that 85 56 of the annual damage occursin a <strong>on</strong>e m<strong>on</strong>th "typical" spring thaw c<strong>on</strong>diti<strong>on</strong>.Adequate drainage provisi<strong>on</strong>s can mitigate thaw weakening anddamage accumulati<strong>on</strong> in a pavement structure. As thaw progressesfrom the surface downward the water released can, in general, <strong>on</strong>lydrain upwards (since the ground is frozen beneath and lateral redistributi<strong>on</strong>is oftennot possible owing to slowerthawing and/ or lesspermeable soils in the vicinity of the shoulders). The situati<strong>on</strong> pointsto the definite need for free draining base and subbase courses andl<strong>on</strong>gitudinal drains to remove the thaw water. Impedance of subsurfacedrainage elements caused by frozen soils must be c<strong>on</strong>sidered in thedesign process (Berg and Johns<strong>on</strong>, 1983).Distorti<strong>on</strong> distress of pavements in the subarctic and arctic causedby thaw-c<strong>on</strong>solidati<strong>on</strong> of underlying ice-rich permafrost is related toc<strong>on</strong>ductive and/or c<strong>on</strong>vective heat transport processes. Representativecase histories which document this problem have been presented forNome (Ro<strong>on</strong>ey et al., 1988), Kozebue (Esch and Rhode, 1976), andBethel (McFadden and Seibe, 1986) airfields. It is extremely importantwhen seeking a soluti<strong>on</strong> to a permafrost degradati<strong>on</strong> problem toidentify the c<strong>on</strong>tributi<strong>on</strong> related to c<strong>on</strong>ductive versus c<strong>on</strong>vective heattransport processes. <strong>Permafrost</strong> degradati<strong>on</strong> related to c<strong>on</strong>ducti<strong>on</strong> maybe associated with an inadequate thickness of gravel fill and/or thechange in albedo of the surface when it is pavcd. Traditi<strong>on</strong>al soluti<strong>on</strong>sfor a c<strong>on</strong>ducti<strong>on</strong>problem are to increase the thicknessof the fill(Henni<strong>on</strong> and Lobacz, 1973) or insulate the problem arm (Esch 1973,1986; Esch and Rhode, 1976; Ro<strong>on</strong>ey et ai., 1988). N<strong>on</strong>-traditi<strong>on</strong>alsoluti<strong>on</strong>s include changing the surface albedo using paint (Fulweiderand Aitken, 1963; Berg and Aitken, 1973; Berg and Esch, 1983), the ,usc of thermoprohes (or therrnosyph<strong>on</strong>s) (McEadden and Siebe, 1986).preventi<strong>on</strong> of snow acting as an insulati<strong>on</strong> blanket during the winter(Zarling et al., l988), use of air duct systems (Zarling et al., 1983),and prethawing followed by dynamic c<strong>on</strong>solidati<strong>on</strong> (Ro<strong>on</strong>ey et ai.,1988).<strong>Permafrost</strong> degradati<strong>on</strong> related to c<strong>on</strong>vective heat transport isassociated with ground water flow beneath the airfield or through theembankment. The influence of c<strong>on</strong>vecti<strong>on</strong> is to cause a positive inflowof heat into the system, thereby slowing down or preventing l<strong>on</strong>g-termfreeze back or, alternatively, accelerating the depth of thaw. Thesoluti<strong>on</strong> to a c<strong>on</strong>vective heat transport problem generally involves themodificati<strong>on</strong> of an existing subdrain system and/or the enhwccmcnt ofsuhsurface drainage away from the pavcrncnt structure embankment,Rutting distorti<strong>on</strong> can occur in the asphalt c<strong>on</strong>crete surface laycr.The mechanistic approach of pavement design present4 in a latersecti<strong>on</strong> of this paper c<strong>on</strong>sidcrs rutting related to the accumulati<strong>on</strong> ofdeformati<strong>on</strong>s associated with vcrtical strain at thc top of the suhgrade.A discussi<strong>on</strong> of rutting related to the use of low viscosity wphdtcements in cold regi<strong>on</strong>s is given by Janoo (1989). He notes that ruttingis related primarily to the aggregate in the mix and to a much lesserdcgree the grade of the asphalt cement. To minimize the potential forrutting, a well-graded angular aggregate (with two or more fracturefaces) is recommended. The occasi<strong>on</strong>al practice of adding <strong>on</strong>e-halfpercent to the design asphalt cement c<strong>on</strong>tent should be avoided as itmay c<strong>on</strong>tribute substantially to rutting.DisinteErati<strong>on</strong>Disintegrati<strong>on</strong> is the breaking up of a pavement into small, looseparticles. Disintegrati<strong>on</strong> may be acceterntd by freeze-thaw cycles, ortraffic loading, especially adjacent to cracks.In an asphalt c<strong>on</strong>crete pavement, disintegrati<strong>on</strong> isgenerally relatedto insufficient asphalt cement c<strong>on</strong>tent in the mix, poor compacti<strong>on</strong> ofthe mix (which may be related to cold weather c<strong>on</strong>structi<strong>on</strong> (Eat<strong>on</strong> andBerg, 1978)), overheating of the mix, or asphalt stripping. The firstthree problems can be avoided by carefully following c<strong>on</strong>venti<strong>on</strong>al mixdesign practice and c<strong>on</strong>scientiously supervising the c<strong>on</strong>structi<strong>on</strong> of thepavement. The potential for stripping may be overlooked!Stripping of an asphalt c<strong>on</strong>crete pavement is the loss of adhesi<strong>on</strong>between the asphalt cement and the aggregate. Stripping is due to theacti<strong>on</strong>ofwater or water vaporin the asphalt c<strong>on</strong>crete pavement.Specifically, water gets betwccn the asphalt cement film and the aggregate surface. Since the aggregate surfacc generally has a greaterattracti<strong>on</strong> for water than asphalt, the water is drawn between theasphalt cement and aggregate surface and strips the asphalt away fromthe aggregate. The rate at which stripping takes place depends <strong>on</strong> thetemperature, type of aggregate, and viscosity and compositi<strong>on</strong> of the__asphalt (Tyler, 1938). A summary and evaluati<strong>on</strong> of laboratory testprocedures used to identify the potential for stripping has beenprepared by Terrcl and Shute (1989).Two characteristic types of pavement failures are associated withstripping. If water enters the asphalt cement pavement through theupper surface, raveling of the aggregate occurs. If stripping occursfrom the bouom of the pavement upwards, random cracking and 'potholing is generally not detected until it is too late to prevent.C<strong>on</strong>cern for stripping suggests that the asphalt c<strong>on</strong>crete should bedensely compacted to achieve maximum impermeability. If thepavement has a high voids c<strong>on</strong>tent, water will enter at the surface andcreate the potential for stripping. Further, water can enkr thepavement through cracks.Wintcr snow removal practices can also create potential forstripping. Snow plowed to the sides of a roadway prevents the frozenshoulders from thawing during warmer periods. The frozen shouldersact as a barrier to drainage of free water provided by deicingsaltslsoluti<strong>on</strong>s or snowlice thaw associated with the heat absorbingblack asphalt pavement.CrackingBy far the most prevalent airport pavement performance problemis cracking. Cracking may be trafficlload associated or n<strong>on</strong>-trafficlloadassociated. With respect to roads, both traffic/ load and n<strong>on</strong>-trafficlloadassociated cracking may exist. With respect to airfield pave1032
ments, n<strong>on</strong>-trafficlload associated problems related to changes intemperature in the pavement structure and underlying#ground arepredominant.Fatigue of asphalt c<strong>on</strong>crete refers to cracking caused by repeatedbending due to traffic. Fatigue related to pavement cracking is oftenreferred to as "alligator cracking." The mechanistic approach topavement design presented in a later secti<strong>on</strong> of this paper c<strong>on</strong>sidersfatigue cracking related to the accumulati<strong>on</strong> of deformati<strong>on</strong> associatedwith tensile strains at the bottom of the asphalt c<strong>on</strong>crete surface layer.Reflecti<strong>on</strong> cracks are an expressi<strong>on</strong> of the crack pattcrn in anunderlying pavement. They are causcd by horiz<strong>on</strong>tal and/or verticalmovements in the pavement beneath an overlay. Reflecti<strong>on</strong> cracks maybe observed in both asphalt c<strong>on</strong>crete overlays <strong>on</strong> old PCC pavementsand asphalt c<strong>on</strong>crete pavements. Despite extensive work usingtechniques such as stress and strain relief interlayers, geotextiles, orreinforcing in the overlay, an m<strong>on</strong>omic soluti<strong>on</strong> to prevent reflecti<strong>on</strong>cracks does not exist. Reflecti<strong>on</strong> cracks have been observed within 6to 12 m<strong>on</strong>ths after c<strong>on</strong>structi<strong>on</strong> of an overlay <strong>on</strong> a 50 mm asphaltc<strong>on</strong>crcu surbe that was cold milled to an initial thickness of 12 mm(Vins<strong>on</strong> et al., 1986). The <strong>on</strong>ly way to completely eliminate reflecti<strong>on</strong>cracking is to remove the old pavement.Reflecti<strong>on</strong> cracks have been associated with the use of a cementtreated base (CTB). Vita et al. (1988) did not find this to be the caseat the Bethel, Alaska, Airfield which c<strong>on</strong>sists of a CTB underlying dnasphalt c<strong>on</strong>crete pavement. CTB reflecti<strong>on</strong> cracks did not appear to bea serious problem at khel. In fact, the c<strong>on</strong>structi<strong>on</strong> and performanceof CTB in cold regi<strong>on</strong>s has been very successful and it should be c<strong>on</strong>sideredfor more routine use in the future (Vins<strong>on</strong> ef al., 1984).Two distress mechanisms are believed to cause thermal crackingin the subarctic and arctic (Fromm and phang, 1972; h h andFranklin, 1989; Tian and Dai, 1988). First, trnnsverse cracks may becaused by the overall c<strong>on</strong>tracti<strong>on</strong> of the entire pavement structureand/or underlying subgrade. This mechanism may cause the crack toextend through the entire pavement structure and into the subgrade.The crack can extend across the pavement surface into the shoulderand be several inches wide. This type of transverse crack is associatdprimarily with the thermal c<strong>on</strong>tracti<strong>on</strong> of soil (in the base, subbase,and/or subgrade) rather than the asphalt c<strong>on</strong>crete surface layer. In fact,they can occur in both paved and unpaved roads and airfields atintervals of 12 to 90 m and depths extending to 2 m (Esch andFranklin, 1989).Sec<strong>on</strong>d, low temperature cracking is attributed to tensile stressesinduced in the asphalt c<strong>on</strong>crete pavement as the temperature drops toan extremely low temperature. If the pavement is cooled to a lowtemperature, tensile stresses develop &g ,a result of the pavement'stendency to c<strong>on</strong>tract. Fricti<strong>on</strong> between the pavement and the base Layerresists the c<strong>on</strong>tracti<strong>on</strong>. If the tensile stress induced in the pavementequals the strength of the asphalt c<strong>on</strong>crete mixture at that temperature,a microcrack develops at the edge and surface of the pavement. Underrepeated temperature cycles or the occurrence of colder temperatures,the crack penetrates the full depth and across the asphalt c<strong>on</strong>cretelayer. Tian and Dai (1988) note that it may be possible for a thermalcrack to reflect up through the asphalt c<strong>on</strong>crete layer from anunderlying stabilized layer if the coefficient of c<strong>on</strong>tracti<strong>on</strong> of thestabilized layer is greater than that of the asphalt c<strong>on</strong>crete layer.The primary pattern of low temperature cracking is transverse tothe directi<strong>on</strong> of traffic and is fairly regularly spaced at intervals of 30to 60 m for new pavements to less than 5 m for older pavements. Ifthe transverse crack spacing is less than the width of the pavement,l<strong>on</strong>gitudinal cracking may occur, and a block paacrn can develop. Thecomplex pattern of cracking that may be observed inmany olderpavements is a result of (1) the increase in stiffneas (i.e., hardening)of the asphalt cement with age, and (2) the change in the geometry ofthe,pavement slab. On the taxiway at Fairbanks Airfield a 3 m "blockpattern" developed <strong>on</strong> the taxiway associated with l<strong>on</strong>gitudinal andtransverse thermal cracks (Esch and Franklin, 1988).Fromm and Phang (1972) noted that the transverse cracks causedby the overall c<strong>on</strong>tracti<strong>on</strong> of the pavement structure and subgrade arenot as serious as cracks occurring wholly in the asphalt c<strong>on</strong>cretesurface layer. Cracks restricted to the asphalt c<strong>on</strong>crete surface layerallow ingress of water which in turn increases the rata of stripping and'allows pumping of a fins granular base course. Water entering thecrack during the winter may result in the formati<strong>on</strong> of an ice lensbelow the crack which produces upward lipping at the crack edge.Also, de-icing soluti<strong>on</strong>s may also enter the crack and cauw localizedthawing of the base which, in turn, may result in a depressi<strong>on</strong> aroundthe crack. Cedergren and Godfrey (1974) noted that 70% of surfacerunoff can enter a crack 1 mm wide.CURRENT PAVEMENT DESIGN PRACTICE FOR TRAFPIClLOAD RELATED CRACKINGCorps of Engineers ProcedureSince World War 11, the Corps of Engineers has developed pavement design procedures (toad and airfield) thaL CM be used to developstructural design requirements. The available design procedures forpavements subject to freezing and thawing in the underlying soils arebased <strong>on</strong> either of two basic c<strong>on</strong>cepts:C<strong>on</strong>trol of surface deformati<strong>on</strong> resulting from frost heave (orthaw).Provisi<strong>on</strong> of adequate bearing capacity during the most criticalclimatic period.Based <strong>on</strong> the above c<strong>on</strong>siderati<strong>on</strong>s, three separate design approachescun be used:Complete protecti<strong>on</strong> method: Sufficient thicknesses of pavementand n<strong>on</strong>-frost susceptible base course are provided to prevent frostpenetrati<strong>on</strong> into the subgrade.Limited subgrade frost penexrati<strong>on</strong> method: Sufficient thicknessesof pavement and n<strong>on</strong>-frost susceptibb base course are provided tolimit subgrade frost penetrati<strong>on</strong> to amount8 that restrict surfacedeformati<strong>on</strong> to within acceptable limits.Reduced subgrade strength method: The amount of frost heave isneglected and the design is bascd primarily <strong>on</strong> the anticipatedreduced subgrade strength during the thaw. +Henni<strong>on</strong> and Lobacz (1973) recommend that seas<strong>on</strong>al thawing andfreezing should be ratricted ta the pavement (surfacing and n<strong>on</strong>-frostsusceptiblebssecourse) in'c<strong>on</strong>tinuouspermafrost regi<strong>on</strong>s. Thec<strong>on</strong>ceptis comparable to the complete protecti<strong>on</strong> method wherein the criticalfactor is the dcpth of thaw rather than the depth of frost penetrati<strong>on</strong>.Alaska DOTPF ProcedureThe Alaska DOTPF (1982) haa issued pavement design guidelinesbased <strong>on</strong> research begun in 1976. The primary objective was to studythe various relati<strong>on</strong>ships that c<strong>on</strong>trolled the performance of flexiblepavements. Approximately 120 pavement secti<strong>on</strong>s were selected <strong>on</strong> theexisting state maintained road network for the rcscarch program. Thercsults of that study (McHattie et al, 1980) significantly influenced thedesign procedure.The Alaska WTPF design guidelines focus <strong>on</strong> the fact thatincreased fines (No. 200 minus material in the unbound layers of a- 1033
pavement structure) lead to increased thickness of asphalt c<strong>on</strong>cretesurfacing. In those areas of Alaska where asphalt c<strong>on</strong>crete is readilyavailable, increased fines in the underlying layers may be acceptable.However, in remote arctic regi<strong>on</strong>s the producti<strong>on</strong> of asphalt c<strong>on</strong>creteis expensive and should be minimized. Thus, it is prudent to specifyn<strong>on</strong>-frost susceptible (NFS) materials in the underlying layers to theextent possible to minimize the following:The requirements for asphalt c<strong>on</strong>crete (if not eliminate its need,altogether);The potential for frost heave;The potential for other types ofpavement distress such as alligatorcracking and rutting,Mechanistic DesiEn ApproachA mechanistic approach to pavement design involves (1) predictingstresses, strains, and deflecti<strong>on</strong>s in a pavement structure owing to aspecified geometry and magnitude ofwheel loading c<strong>on</strong>diti<strong>on</strong>s, and (2)adjusting ihe properties and thicknesses of the elements in thepavement structure to insure the predicted stresses, strains, anddeflecti<strong>on</strong>s are within allowable limits. The mechanistic approachprovides flexibility in modeling apavement structure owing to thc factthat measured material properties &
T,in which,Q(T) = accumulated thermal stress for n particular coolingrate, T,cy = coefficient of thcrmal c<strong>on</strong>tracti<strong>on</strong>,To, T, = initial and final temperature, respectively,S(t,T) = asphalt mix stiffness (modulus), time- and temperature-dependent,AT = tcmpcrature increment over which S(t,T) isapplicahle.The approximate soluti<strong>on</strong> suggested by equati<strong>on</strong> (2) may yieldreas<strong>on</strong>able results providing that two input paramctcrs are correctlymeasured or assumed: (1) the coefficient of thermal c<strong>on</strong>centrati<strong>on</strong>, and(2) the asphalt c<strong>on</strong>crete mix stiffness. The tensile strength of theasphalt c<strong>on</strong>crete mixture may be estimated or mcasured in thelaboratory in cither direct or indirect tensi<strong>on</strong>. In thc mechanisticapproach the fracture temperature is established hy equating the tensilestress calculatcd from equati<strong>on</strong> (2) with the tcnsilc strength at thattemperature.The dctcrminatinn of both the asphalt c<strong>on</strong>crete mix stiffness andthe tensile strength requircs that the rate of cooling in the hcld (andthe associated development of tcnsile stresses and strength) be relatedto a rate of loading or deformati<strong>on</strong> in the laharatory (or In the case ofa creep test, a time after initial loading). To date, a procedure toaccomplish this ta6k has not been c<strong>on</strong>clusively dem<strong>on</strong>strated to thepavement engineering community. Further, in the calculati<strong>on</strong> ofthermal stress the thermal c<strong>on</strong>tracti<strong>on</strong> coefficient is generally assumedto bc: 2 to 2.5 X lO+C. Recent measurements of the thermalc<strong>on</strong>tracti<strong>on</strong> of mixes with high voids c<strong>on</strong>tents or mixes employingmodified asphalt ccmcnt suggest this assumpti<strong>on</strong> could be in error hya factor of two or three. Further, age c<strong>on</strong>diti<strong>on</strong>ing of the specimensfor the determinati<strong>on</strong> of the mix stiffness or tensile strength has notbeen c<strong>on</strong>sidered in the applicati<strong>on</strong> of this approach. Finally, it hnsbeen noted by several rcswchers that my approach that is fundamentallyrelated to a measurement of the stiffness of the mix will not beacceptable for mixtures which employ modified asphalt cements.Simulati<strong>on</strong> MeasurementM<strong>on</strong>ismith et al. (1965) were the first to suggest that the thermallyinduced stress, st,rength, and temperature at failure could be measuredin a laboratory test which simulated c<strong>on</strong>diti<strong>on</strong>s to which a pavementslab was subjected in the field. The basic rcquirement for the testsystem is that it maintains the test specimen at c<strong>on</strong>stant length duringcooling. Arand (1987) made a substantial improvement to the testsystem by inserting a displacement "feedback" loop which irtsured thatthe stresses in the specimen would not relax because thc spccimenlength is c<strong>on</strong>tinuously correct during the test.A recent versi<strong>on</strong> of this "4, sys m developed under the StratcgicHighway <strong>Research</strong> Program (SHRP) is presented by Vins<strong>on</strong> et al,(1993). The thermal stress restrain4 spccirnen test (TSRST) systemc<strong>on</strong>sists of a load frame, screw jack, computer data acquisiti<strong>on</strong> andc<strong>on</strong>trol system, low temperature cabinet, and temperature c<strong>on</strong>troller.A heam or cylindrical specimen is mounted in the load frame whichis enclosd by the cooling cabinet. The chamber and specimen arecooled with vaporized liquid nitrogen. As the specimen c<strong>on</strong>tracts,LVDTs sense the movement and a signal is Sent to the computer whichin turn causa the screw jack to stre:ch the specimen back to itsoriginal length. This closed-loop process c<strong>on</strong>tinues as the specimen iscooled and ultimately fails. Measurements of elapsed time, temperature,deformati<strong>on</strong> and tensile load are recorded with the data acquiriti<strong>on</strong>system.Under the SHW effort over 400 TSRSTs were performed tocharactcrize the thermal cracking resistance of asphdt-aggregatemixtures. Bas4 <strong>on</strong> the test results. the following c<strong>on</strong>clusi<strong>on</strong>s areappropriate:TSRST results provide an excellent indicati<strong>on</strong> of low temperaturecracking resistance of asphalt c<strong>on</strong>crete mixtures. A ranking of lowtcmpcrature cracking resistance based <strong>on</strong> TSRST fracture temperatureis in excellent agreement with B ranking basd <strong>on</strong> the physicalproperties of asphalt cements.Based <strong>on</strong> a substantial number of test results, asphalt type,aggregate type, and air voids c<strong>on</strong>tcnts are factors which have Imajor effect <strong>on</strong> the low temperature characteristics of asphaltc<strong>on</strong>crete mixtures. Softer asphalt cements and aggregates with arough surface texture and angular shape provide greater resistanceto low temperature cracking ofasphalt c<strong>on</strong>crete mixtures. Fracturestrength was grcatcr for mixtures with low air voids c<strong>on</strong>tent.The dqgrec of aging has a significant effect <strong>on</strong> low temperaturecracking resistance of mixtures. As the degree of aging of amixture increases, fracture temperature becomes warmer andfracture strength decreases. The degree of the influence of agingdepends <strong>on</strong> t,he asphalt type.Increasing the amount of ttsphult cement in the mixture does notimprove the resistance of the mixture to low temperature cracking.The TSRST can be used in routine mix evaluati<strong>on</strong> for lowtemperature cracking resistance of asphalt c<strong>on</strong>crete mixtures.. Vins<strong>on</strong> et al, (1993) have presented a framework to evaluate thelow temperature cracking resistance of road and airfield pavementsbmed <strong>on</strong> TSRST results.SUMMARY AND CONCLUSIONSProfessi<strong>on</strong>als involved with the design of pavements in thewbmctic and arctic must bc c<strong>on</strong>cerned with three modes of distress:(1) distorti<strong>on</strong> and pavement faulting, (2) disintegrati<strong>on</strong>, and (3)cracking. By far the most prevalent prohlem for asphalt c<strong>on</strong>cretepavcmcnts is cracking, followed by distorti<strong>on</strong> related to differentialfrost heave. Methodologies prcsently exist to allow the resistance ofan asphalt c<strong>on</strong>crete pavement to fatigue, subgrade rutting, wd lowtemperature cracking to be quantified and easily incorporated inpavement dcsign for the subarctic and arctic.REFERENCESAlaska DOTPF (1982) Guide for flexible pavement design andevaluati<strong>on</strong>, Anchorage, AK. and Alaska DOTPF (1993) Prec<strong>on</strong>structi<strong>on</strong>Manual, Chapter 11-Design.Arand, W. (1987) Influence of bitumen hardness <strong>on</strong> the fatiguebehavior of asphalt pavements of different thickness due to bearingcapacity of subbase, traffic loading, and temperature. Proc., 6th<str<strong>on</strong>g>Internati<strong>on</strong>al</str<strong>on</strong>g> <str<strong>on</strong>g>C<strong>on</strong>ference</str<strong>on</strong>g> <strong>on</strong> Structural Behavior of Asphalt Pavemenu, University of Michigan.Berg, R. and T. Johns<strong>on</strong> (1983) Revised procedure for pavementdesign under seas<strong>on</strong>al frost c<strong>on</strong>diti<strong>on</strong>s. Special Report 83-27,USACRREL, Hanover, NH.' 103s
kg, R.L. and 13.W. Ajtken (1973) Some passive methods ofc<strong>on</strong>trolling geocryological c<strong>on</strong>diti<strong>on</strong>s in roadway c<strong>on</strong>structi<strong>on</strong>.Proc., North American C<strong>on</strong>tributi<strong>on</strong>, 2nd <str<strong>on</strong>g>Internati<strong>on</strong>al</str<strong>on</strong>g> <str<strong>on</strong>g>C<strong>on</strong>ference</str<strong>on</strong>g><strong>on</strong> <strong>Permafrost</strong>, Yatutsk, USSR.Berg, R.L. and D.C. Esch (1983) Effect of color and texture <strong>on</strong> thesurface temperature of asphalt c<strong>on</strong>crete pavements. Proc., 4th<str<strong>on</strong>g>Internati<strong>on</strong>al</str<strong>on</strong>g> <str<strong>on</strong>g>C<strong>on</strong>ference</str<strong>on</strong>g> <strong>on</strong> <strong>Permafrost</strong>, Fairbanks, AK.Ccdcrgren, H.R. an3 K.A. Godfrey (1974) Water: key cause ofpavement failure. Civil Engineering, ASCE.Crory, F.E. (1988) Airfields in arctic Alaska. Proc., 5th <str<strong>on</strong>g>Internati<strong>on</strong>al</str<strong>on</strong>g><str<strong>on</strong>g>C<strong>on</strong>ference</str<strong>on</strong>g> <strong>on</strong> <strong>Permafrost</strong>, Vol. 3, Tr<strong>on</strong>dheim, Norway.Eat<strong>on</strong>, R.A. and R.L. Berg (1978) Temperature effects in compactingan asphalt c<strong>on</strong>crete overlay. Roc., Cold Regi<strong>on</strong>s Specialty <str<strong>on</strong>g>C<strong>on</strong>ference</str<strong>on</strong>g>,ASCE, Vol. 1, Anchorage, AK.Esch, D.C. (1973) C<strong>on</strong>trol of permafrost degradati<strong>on</strong> beneath aroadway by subgrade insulati<strong>on</strong>. hoc., North American C<strong>on</strong>tributi<strong>on</strong>,Zndfnternati<strong>on</strong>al <str<strong>on</strong>g>C<strong>on</strong>ference</str<strong>on</strong>g><strong>on</strong><strong>Permafrost</strong>, Yakutsk, USSR.kh, D.C. (1986) Insulati<strong>on</strong> performance beneath roads and airfieldsin Alaska. Roc., 4th <str<strong>on</strong>g>Internati<strong>on</strong>al</str<strong>on</strong>g> <str<strong>on</strong>g>C<strong>on</strong>ference</str<strong>on</strong>g> <strong>on</strong> Cold Regi<strong>on</strong>sEngineering, ASCE, Anchorage, AK.Esch, D.C. and D. Franklin (1989) Asphalt pavement crackc<strong>on</strong>trol atFairbanks <str<strong>on</strong>g>Internati<strong>on</strong>al</str<strong>on</strong>g> Airfield. hoc., 5th <str<strong>on</strong>g>Internati<strong>on</strong>al</str<strong>on</strong>g> <str<strong>on</strong>g>C<strong>on</strong>ference</str<strong>on</strong>g><strong>on</strong> Cold Regi<strong>on</strong>s Engineering, St. Paul, MN.Esch, D.C. and J.J. Rhode (1976) Kotzebue Airfield, runway insulati<strong>on</strong>over permafrost. Proc., 2nd <str<strong>on</strong>g>Internati<strong>on</strong>al</str<strong>on</strong>g> Symposium <strong>on</strong> ColdRegi<strong>on</strong>s Engineering, ASCE.Fromm, H.J. and W.A. Fhang (1972) A study of tranwerm crackingof bituminoua pavements. Proc., AAFT, Vol. 41.Fulwider, C.W. and GIW. Aitken (1963) EffeEt of surface color <strong>on</strong>thaw penctrati<strong>on</strong> beneath a pavement in the arctic. Proc., 1st <str<strong>on</strong>g>Internati<strong>on</strong>al</str<strong>on</strong>g><str<strong>on</strong>g>C<strong>on</strong>ference</str<strong>on</strong>g> <strong>on</strong> the Structural Design of Asphalt Pavemanta.Has, R., I;. Meyer, G. Assnf, and H. Lee (1987) A comprehensivestudy of cold climate airfield pavement cracking. Proc., AAW,Vol. 56.Henni<strong>on</strong>, F.B. and E.F. LobacZ (1973) Corps of Engineers technologyrelated to design of pavements in areas of permafrost. Proc..North American C<strong>on</strong>tributi<strong>on</strong>,lnd <str<strong>on</strong>g>Internati<strong>on</strong>al</str<strong>on</strong>g> <str<strong>on</strong>g>C<strong>on</strong>ference</str<strong>on</strong>g> <strong>on</strong><strong>Permafrost</strong>, Yakuuk, USSR.Bills, J.F. and D. Brien (1966) The fracture of bitumens and asphaltmixes by temperature induced stresses. Proc., AAPT. Vol. 35.Janoo, V.C. (1989) Use of low viscosity asphalts in cold regi<strong>on</strong>s.Proc., 5th <str<strong>on</strong>g>Internati<strong>on</strong>al</str<strong>on</strong>g> <str<strong>on</strong>g>C<strong>on</strong>ference</str<strong>on</strong>g><strong>on</strong> Cold Regi<strong>on</strong>s Enginwring,AXE, St. Paul, MN.Kestler, M. and R. Berg (19d9) Enginwring design and c<strong>on</strong>structi<strong>on</strong>in permafrost regi<strong>on</strong>s: a review. Roc., North American C<strong>on</strong>tributi<strong>on</strong>,2ndlnternati<strong>on</strong>al C<strong>on</strong>ferencc<strong>on</strong><strong>Permafrost</strong>, Yakutsk, USSR.Mah<strong>on</strong>ey, J.P. and T.S. Vins<strong>on</strong> (1983) A pxhanistic approach topavement design in cold regi<strong>on</strong>s. Roc., 4th <str<strong>on</strong>g>Internati<strong>on</strong>al</str<strong>on</strong>g> <str<strong>on</strong>g>C<strong>on</strong>ference</str<strong>on</strong>g><strong>on</strong> <strong>Permafrost</strong>, Fairbanks, AK.McPadden, T. and C. Siebe (1986) Stabilizati<strong>on</strong> of permafrostsubsidence in the airfikld runway at Bethel, Alaska. Roc., 4th<str<strong>on</strong>g>Internati<strong>on</strong>al</str<strong>on</strong>g> Specialty <str<strong>on</strong>g>C<strong>on</strong>ference</str<strong>on</strong>g> <strong>on</strong> Cold Regi<strong>on</strong>s Engineering,ASCE, Anchorage, AK.McHatxie, R., B. C<strong>on</strong>nor, and D. Esch (1980) Pavement structuralevaluati<strong>on</strong>ofAlaskan highways. RcportNo. FHWA-AK-RD-SCLI,Alaska WTPF, Juneau, AK.McLeod, N.W. (1987) Pen-vis number (PVN) M a meamre of pavingasphalt temperature susceptibility and its applicati<strong>on</strong> to pavementdesign. Proc., Paving in Cold kens Mini-Workshop, Vol. 1,147-240.M<strong>on</strong>ismith, C.L., G.A. Secor, and K.E. Secor (1965) Temperatureinduced stresses and deformati<strong>on</strong>s in asphalt c<strong>on</strong>crete. Proc.,AAPT, Vol. 34, 248-285.Rice, E. (1975) Building in the North. M<strong>on</strong>ograph, The OcophysicalInstitute, University of Alaska, Pairbanks, AK.Ro<strong>on</strong>ey , J.W., J.F. Nix<strong>on</strong>, C.H. Riddle, and E.G. Johns<strong>on</strong> (1988)Airfield runway deformati<strong>on</strong> at Nome, Alaska. Proc., 5th Intemati<strong>on</strong>el<str<strong>on</strong>g>C<strong>on</strong>ference</str<strong>on</strong>g> <strong>on</strong> <strong>Permafrost</strong>, Tr<strong>on</strong>dheim, Norway.Rutherford, M. and J.P. Mah<strong>on</strong>ey (1986) A thermal analysis ofpavement thawing. Proc., 4th <str<strong>on</strong>g>Internati<strong>on</strong>al</str<strong>on</strong>g> <str<strong>on</strong>g>C<strong>on</strong>ference</str<strong>on</strong>g> <strong>on</strong> ColdRegi<strong>on</strong>s Engineering, Anchorage, AR.Terrel, R.L. and J.W. Shute (1989) Summary report <strong>on</strong> watersensitivity. Stmgic Highway <strong>Research</strong> Program, + Nati<strong>on</strong>al<strong>Research</strong> Council, SHRP-NIR-89-1003, Washingt<strong>on</strong>, DC.Tian, D. and H. Dai (1988) Cold cracking of asphalt pavement <strong>on</strong>highway. Proc., 5th <str<strong>on</strong>g>Internati<strong>on</strong>al</str<strong>on</strong>g> <str<strong>on</strong>g>C<strong>on</strong>ference</str<strong>on</strong>g> <strong>on</strong> <strong>Permafrost</strong>,Tr<strong>on</strong>dheim, Norway.Tyler, O.R. (1938) Adhesi<strong>on</strong> of bituminous films to aggregates.Furdue University <strong>Research</strong> Bulletin, No. 62, Val. 22.Vins<strong>on</strong>, T.S. (1989) Fundamentals of resilient modulus testing. Proc.,Workshop <strong>on</strong> Resilient Modulus Testing: State of the Rwtice,Oreg<strong>on</strong> Stare University, Corvallis, OR.Ving<strong>on</strong>, T.S., D.H. Jung, and J.W. Ro<strong>on</strong>ey (1993) Pavementperformanceand low temperature cracking of subarctic and arcticairfields. Proc., 6th <str<strong>on</strong>g>Internati<strong>on</strong>al</str<strong>on</strong>g> <str<strong>on</strong>g>C<strong>on</strong>ference</str<strong>on</strong>g> <strong>on</strong> <strong>Permafrost</strong>,Beijing, China.Vins<strong>on</strong>, T.S., J.P. Mah<strong>on</strong>ey, and M. Kaminski (1984) Cementstabilizati<strong>on</strong> for road c<strong>on</strong>structi<strong>on</strong> in Cold Regi<strong>on</strong>s. Proc., 3rd<str<strong>on</strong>g>Internati<strong>on</strong>al</str<strong>on</strong>g> Cold Regi<strong>on</strong> Engintering Specialty <str<strong>on</strong>g>C<strong>on</strong>ference</str<strong>on</strong>g>,AXE, Edm<strong>on</strong>t<strong>on</strong>, Alberta, Canada.Vins<strong>on</strong>, T.S. and J.W. Ro<strong>on</strong>ey (1991) A mechanistic approach topavement design for Nome Airfield. Proc., 6th <str<strong>on</strong>g>Internati<strong>on</strong>al</str<strong>on</strong>g> ColdRegi<strong>on</strong>s Engineering Specialty <str<strong>on</strong>g>C<strong>on</strong>ference</str<strong>on</strong>g>, ASCE, Eeban<strong>on</strong>, NH.Vinwn, T.S., J.W. Ro<strong>on</strong>ey, H. Zhou, and N. CoetzsG (1991) TudorRoad rehabilitati<strong>on</strong>, Anchorago, Alaska. Proc.. Road‘and AirportPavement Resp<strong>on</strong>se M<strong>on</strong>itoring Sy*ms, ASCE, USACRREL.NH .Vins<strong>on</strong>, T.S., H. Zhou, R. Alexander. and R.O. Hicks (1989)Backcalculati<strong>on</strong> of layer moduli and runway overlay design: U.S.Coast Guard Air Stati<strong>on</strong>, Kodink, Alaska. hoc., Stntc of the ArtSymposium <strong>on</strong> Pavement Resp<strong>on</strong>seM<strong>on</strong>itoring Systems for Roadsand Airfields, USACRREL, NH.Vins<strong>on</strong>, T.S., I. Zomerman, R. Berg, and H. Tomita (1984) Surveyof airfield pavement distress in cold regi<strong>on</strong>s. Proc., 4th Interna-KiOd <str<strong>on</strong>g>C<strong>on</strong>ference</str<strong>on</strong>g> <strong>on</strong> Cold Regi<strong>on</strong>s Enginering, Anchorage AK.Vita, C.L., J.W. Ro<strong>on</strong>ey , and T.S. Vins<strong>on</strong> (1988) Bethel Airfield,CTB pavement performance analysis. Proc., 5th <str<strong>on</strong>g>Internati<strong>on</strong>al</str<strong>on</strong>g><str<strong>on</strong>g>C<strong>on</strong>ference</str<strong>on</strong>g> <strong>on</strong> <strong>Permafrost</strong>.Zarling, J.P., W.A. Braley, and D.C. Esch (1988) Thaw stabilizati<strong>on</strong>of roadway embankments. Proc., 5th <str<strong>on</strong>g>Internati<strong>on</strong>al</str<strong>on</strong>g> <str<strong>on</strong>g>C<strong>on</strong>ference</str<strong>on</strong>g> <strong>on</strong><strong>Permafrost</strong>, Vol. 2.Zarling, J.P.,. B. C<strong>on</strong>nir, and D.J. Ooering (1983) Air duct systemsfor roadway stabiliznti<strong>on</strong> over permafrost areas. Proc., 4th<str<strong>on</strong>g>Internati<strong>on</strong>al</str<strong>on</strong>g> <str<strong>on</strong>g>C<strong>on</strong>ference</str<strong>on</strong>g> <strong>on</strong> <strong>Permafrost</strong>, Fairbanks, AK.
CURRENT DEVELOPMENT ON PREVENTION OF CANAL FROM FROST DAMAGE IN PRCChen Xiao-baiLanzhou Institute of Glaciology and Geocryology,Chinese Academy of Sciences, Lanzhou, ChinaThe frost damage c<strong>on</strong>diti<strong>on</strong> of canal was very heavy and has be-en paid much moreattenti<strong>on</strong> by scientists and engineers in China in last 20 years. The mainresults c<strong>on</strong>ducted in situ and in door are summarized including frost heavemechanism, classificati<strong>on</strong>, water migrati<strong>on</strong> and heave distributi<strong>on</strong> al<strong>on</strong>g depth,frost heave predicti<strong>on</strong> models and frost heaving force etc. Some anti-heavecountermeasures of canal used effectively and widely, such as flexible lining,anti-heave structures, and insulati<strong>on</strong> structures as well, are introducedbriefly also.INTRODUCTIONThe annual water discharge in China is theNumber h in the world and the average for perpers<strong>on</strong> is about <strong>on</strong>e fourth of that in the world.The annual amount of water for aRriculture usingin China is near 88 percentage of total waterexpended in which the irrLgati<strong>on</strong> amount is about94X of the azricultural <strong>on</strong>e which is almost 82.7%of total amount of water expended in China.However, the uti,lizati<strong>on</strong> coefficient of theirrigati<strong>on</strong> water is <strong>on</strong>ly 40 to 50X which meansabout 42% of the total amount water expended inChina was lost during transporting in c.ana1.Comparing with the utilizati<strong>on</strong> coefficient of 70to BOX in the developed countries, about 30 to50X of water discharge in China was osmosizedout off canal because of aoor lining. Up t<strong>on</strong>ow, the length of lining canal is 10 to 50% ofthe total in different proviences, for instance,in Xin.jiang district there were 23000 km canalswith different types of lining which was 109, ofthe total in 1986: in Xanxi province the lengthof lining canal was 1009 km in 1988 which was45% of the total <strong>on</strong>e: In Hunan province therewere 8000 km canals with lining which was 19.85Wof the tutal: In Sicuan and Fuje provinces thelength of lining canal was 39.37X and 22% of thetotal <strong>on</strong>e respectively (Jj.an, 1992).The seas<strong>on</strong>ally frozen ground is widely distributedto the north oE Changjiang River withthe half areas of the total in China. Thefrost depth increases from South to North andfrom the place with a low elevati<strong>on</strong> to that witha high elevati<strong>on</strong> and with the maxlmum <strong>on</strong>e ofaround 3 m. The amount of frost heave i.s 10 to30 cm and some over 40 cm. In gerenal, thefrust heave will make the canal suffered frostdamage as the frost depth is over 50 cm, It issure that the frost damage to the canal 1s themain reas<strong>on</strong> causing seepage. According to thestatistical data, about half lcngth of canalwith c<strong>on</strong>crete lining, 2800 km, was suffered byfrost damage in Xinjiang; for the main irrigati<strong>on</strong>network in Xanxi province, the frost crackphenomena were very popular in canal withc<strong>on</strong>crete lining which occurred <strong>on</strong> the surfaceof. south slope and north slope of the canalwith 75.3% and 277 of total area respectively,The frost damage to the bridge, culvert aswell as sluice Rate projects was very heavy.Almost all of the timber bridges in Heil<strong>on</strong>gjiangprovince were suffered frost heave wi-th themaximum frost displacement of 1 to 2 m: InTnner M<strong>on</strong>golia district, about 359, of totalbridges with different types were in frostdamaRe, and 63% of total culverts were notworked well in which 25% of the total <strong>on</strong>essuffered very serious frost damaRe, as about71% of total sluices were stood frost damage aswell.A large amount seepage of water from canalcaused by frost heave made the land at the bothsides of canal, 100 to 200 m in wideth, salinealkalized.For intance, during the thirtyyears from 50’s to ~ O ’ S , the irrigati<strong>on</strong> areaincreased to three times in Inner Msngolia whilethe area saline-alkalized increased to 10 timesmore than that of before at the first 10 yearswhich was about 73,8% of the total farmmingarea, and there were about 30X of ttltal farmminxarea saline-alkalized in Ninxia district.Since realizing that the frost damage was themain reas<strong>on</strong> causing seepage of canal in thewhole regi<strong>on</strong>s of North and North-West China witha seas<strong>on</strong>ally frost c<strong>on</strong>diti<strong>on</strong>, the water c<strong>on</strong>servancyinstitutes and colle~es in the regi<strong>on</strong>s aswell as Chinese Academy of Sciences paid moreattenti<strong>on</strong>s for understanding the mechanism ofsoi1,Erost heave and finding the more effectiveways to prevent the canals and hydraulicstructures from frost damage both in door andin situ. Some large observati<strong>on</strong> stati<strong>on</strong>s *established in Heil<strong>on</strong>gjiang, Gansu, Liaunin,Xanxi, Xiniiang, Inner M<strong>on</strong>golia, Shand<strong>on</strong>g,Shanxi and Ninxia Provinces (Aut<strong>on</strong>omous regi<strong>on</strong>s)1037
in which different suhjecLs have been obscrvedsuch as the frost processcs under various typesof soi 1 and water c<strong>on</strong>diti<strong>on</strong>s, and thc requlnrities<strong>on</strong> thc profiles of water redistributi<strong>on</strong>,frost heave as well as frost heaving forcesal<strong>on</strong>g the depth. In enginecring practico,different anti-heave countfrmeasurements werec<strong>on</strong>ducted wit.h various structures widely includingreplacing r-layey soils with gravel, sand andblown sand with different c<strong>on</strong>tentof fine grainedsoils; increasing t.he dcnsity of spils withdynamic c<strong>on</strong>solidati<strong>on</strong> method; st-rengthcningdrainage;impruving soils with chemical agcnts;insulat-ing foundati<strong>on</strong> bascs by ~near~a of effectiveinsulati<strong>on</strong>s; anti-heave strucl.ur'es such asarch and curvc structures, anchored structures,flexible <strong>on</strong>es as well as some special. structureswith large overlrurden pressurc etc. Based <strong>on</strong> alarge amount of rlnta collected from ohaervati<strong>on</strong>stati<strong>on</strong>s as menti<strong>on</strong>ed above for years and th,ewealthy experiences accumulated from pri>ct.ice, aTlesip,n N1>rr,1 for can:II was estahl ishcd by TheWater C<strong>on</strong>servancy Ministry of PBC as a profess.ivnalstandard (SL23-91), the other' <strong>on</strong>e with :1 t.itleof Anti-hcave Design Norm for Hydrauiic. structureswi 1 I bc estah1"ishcd in not l<strong>on</strong>g future bythe Ministry. Besides above, accordir~g t.o thelocal c<strong>on</strong>diti<strong>on</strong>s some special detailed rules andregulatious for dppl icati<strong>on</strong> i n engineering practicehave been made already by Local government.Up 1.0 now, it started to the new stage of thatthe results of frost heave study and experiencehave been ayplicd to t.he practical projects incold regi<strong>on</strong>s in China.NlTWRESULTS OF APPLLED STUDYIn the period from 1978 to 1988, bccause thescientists and engineers have been engaging inunderst.anding the hehavors of frost susceptibilityof soils during freezing in door and in situ,and in the practice for accumulating the experiencesin order to deal with the frost damageproblems to the structures in cold regi<strong>on</strong>s, somewealthy results could he suned heriefly asfollows:1. Frost Susc.cptibi1it.y Classificoti<strong>on</strong> of BaseSoilsAs well known. !.hat the indcx for evaluatingthe criteria of frost susceptibility of soilswas and is thc ratio of frost heave or the rateof frost heave widely. As the variatior, offrost depth in China from t.he north to theChangjiang River to the far north is 40 cm t3near 300 cm, it is difficult to predict thedegree of frost. dama~c to the structure byusing the indcxes. After analysing large amoun~of statistical data collected from differentreEi<strong>on</strong>s in Chi,na, the rep,ressive results showthat the denrec of frost damage to the structuresdepends 011 the total amount nf frost heave.C<strong>on</strong>sequently, the total amount of frost heavehas been accepted as an index For evala;3tjng thedegree of frost damage of base soils with whichthe base soils wcrc devided into five classeswith the name of N<strong>on</strong> FH, Weak FH, FH, lleavy FHand Very heavy FH as well which is rcsp<strong>on</strong>sihleto the total amount of Crust heave of h
~~~ thatby Jiling Province1 Water C<strong>on</strong>servancy 1nst.itute(SL23-91) In which the annual variati<strong>on</strong> coefficientof frost depth Cv will decrease with theincrease of frost depth. The standard frostdcpth could be expressed by freezing index Iowith a functi<strong>on</strong> of FIo=cc. To/' whilc.a=2.84 exp(1.921.10-" .To). )luring the calculati<strong>on</strong> offrost depth in practice, some coefficients offrequency model ratio Kf and slope correcti<strong>on</strong>KS as well as groundwater influence Kz arec<strong>on</strong>sidered as follows:Hd = Ho.Kf.Ks.Kzwhere, Hd is Ilesign Frost depth and Ho isstandard <strong>on</strong>e.The ohservati<strong>on</strong>al works 011 an effect ofsunshine <strong>on</strong> the frost depth have been c<strong>on</strong>ductedalready in Gansu, Xanxi, Ninxia and Shand<strong>on</strong>gdistricts as well. The results have beenapplied in the Norm yet in which Ks equals 0.65to 1.0 for the slope facing sun, 1.0 to 1.2 forthe bottom of canal and 1.2 to 1.5 for the slopewithout sunshine. The Rroundwater influencecoefficient Kz depends <strong>on</strong> not <strong>on</strong>ly GWT, but alsosoil types and i.s listed in Table 2 (SLZ3-91).Table 2. The Value of Groundwater InfluenceCocfficient K,Table 3. Replacing Ratio of Anti-heave Cushi<strong>on</strong>of CanalG.W.L.'(em)Soil typeHw>Hdt250 Clayey soil withhigh 11 R siltysoilHw>HdtlSOClayey soil withmiddle 11 &silty soilHeplacing ratiO""E(x)Up. p.s.Dow. p.s. & Rot.50-70 70-80lt>Hdt150 Clayey soil withlow 11 & silly bO -- 50soilClayey soil withhigh or middle I, 60-80 80-100R, silty sui1menti<strong>on</strong>ed -aboveClayey soil withlow T1 fi silty 50-60 60-80sol I.H,=>2.0 1.0 -0.95 1.0 1 .o2.O>Hw=>1.5 0.95-0.90 1-0 -0.95 1.01.5>Hw=>3.0 0.90-0.84 0.95-0.90 1.0 -0.97l.OO~ 5 0.84-0.75 0.90-0.80 0.97-0.940.5>Hw=>0 0.75-0.62 0.80-0.70 0.94-0.85Each signal's mean is shown in Table 4.Roccntly years, a theorical frost depth indifferent c<strong>on</strong>diti<strong>on</strong>s with vrrrjuus angles betweensunshine ray and ground surface was calculatedby means of encrge balance method (Gou et a1,1993; Li, 1Y93).4. Sufficient C<strong>on</strong>diti<strong>on</strong>s of an Anti-heaveCountermeasuti by Replacing Cxycy Soil withSandy or Gravel (Chcn et al, 197Y)A t first, limitina - the c<strong>on</strong>tent of finegrained soil as menti<strong>on</strong>ed above: Sec<strong>on</strong>dly,designing a sufficient replacing thickness: andthirdly, having a nccessary drainage cunditi<strong>on</strong>.A l l of the three is the sufficient c<strong>on</strong>diti<strong>on</strong>^of rcplac.ing clayey soil with sand or gravel foranti-heave.Sased <strong>on</strong> the observati<strong>on</strong>al data collected insitu, a suitable replacing ratio has beensupposed as listed in Table 3 (Zhu, Q.et al,1989b).Resides coarse sand and gravel used forcushi<strong>on</strong> meterials, blown sand was and is widelyutilized .in Gansu and Inner M<strong>on</strong>golia districts(Chen et al, 1986; Cheng et al, 1991, Zhu,D. etal, 1986a; Zhau et al, 1988) while a serviceinstructi<strong>on</strong> has been provided by the experimentalresults in door c<strong>on</strong>ducted by the authors(Chcn et al, 1986). A detailed service instructi<strong>on</strong><strong>on</strong> applicati<strong>on</strong> of blown sand to canalengineering projects has been established byInner M<strong>on</strong>golia Water C<strong>on</strong>servancy Institute(IMWCI, 1987).5. An Effect of Groundwater Level <strong>on</strong> Frost Heave+G.W.L.-Groundwater level, Hw: Hd-Design frostdepth; E*+ -1'erccntage of replac.ing depth tofrost dcpth; 1Jp.p.s.-Upper part of slope:Dow.p.s. & Rut.-Down part of slope & Rottom ofcanal; TI-Liquid limit of water c<strong>on</strong>tent.A largc amount of results collectcd fromobscrvat,ioual stati<strong>on</strong>s in situ and engineeringpractices show that there is a critical groundwaterlevel Hwo. While Hw=>Hwo, the frost heavew i l l be indeper~dent <strong>on</strong> groundwater level. Afteranalysing the statistical data, the value ofcritical groundwater level IIwo was listed inTable 4 (ST,23-91).Table 4. The Value of Critical Groundwater LevelSoi.1 typeHwo(m)C.-Clayeof water-C. wjth 11 C. with M C. with L SandyI1 & s. I1 & s. TL & S. soil2.0 1.5 1.0 0.5Y soil; S.-Silty soil: 11-Liquid limitc<strong>on</strong>tent; 11-High: M-Middlq; L-Low.Rased <strong>on</strong> the results collected in situ fromXinjiang Liaunj.n. Gansu, Xanxi, Neil<strong>on</strong>uiiang" -et.c, a regressi<strong>on</strong> functj.<strong>on</strong> for expressing therelati<strong>on</strong> bctwren frost heave ratio and groundwaterlevel Hw is as follows:q = a RXP (-b Hw)The functi<strong>on</strong> has heen c<strong>on</strong>ducted in dooralready (Chcn et al, 1988~). In order to use therelati<strong>on</strong> c<strong>on</strong>veniently in engineering practices,an apparent frost heave ratio f was recommendedwhich is defined as follows:f=h/(Hfth)xlOa%P~/(100tq)=~~~XP(-~lHw)1039 '
After regres:ji<strong>on</strong> of observati<strong>on</strong>al results insitu, the value of the c<strong>on</strong>stants of a1 and 81is listed in Table 5 (SL23-01).Table 5. The Value of 01 and 61Soil type '-1 a1 81-C. with €1 I, 8 S.O=
~~For claycy soils with water supply at given The listed value is <strong>on</strong>ly avai. table for the slebgroundwptfr level dur ir~g frcezing, a new modclfuundatimn wirh a short size of mure than 2 rn.wab c<strong>on</strong>ducted c<strong>on</strong>sidering i~~itial water c<strong>on</strong>tentW(X), initial dry unil. weighl: Yd(t/m'), frost Table 12. The Value of Horiz<strong>on</strong>tal Frost Ileaving 'pcnctrati<strong>on</strong> ru~e Vf(cm/day), groundwater levelForceHw(m), plasLicity index lp, and i<strong>on</strong> c<strong>on</strong>tent, S(rrrmol/l.00g soil) as well wt1ic.h could be expressedby :Classificoti~rrl ';: Weak FH FA Vcry PI1 VeryE'HAfter curve fitting with 76 groups uf expcrimentaldal.a, it cou1.d be described as follows:T,=bs41 l.5Xl~"5~3.60R2yi345Y vf1.1825EXP(-1 .4502Hw)EXl'(0~14781p)EXP(-0.1225S~While Frost heave rate R could be expressed as:H=4.h293X10-6W3.5177 4.2673y,i EXlJ(-l.6059Hw)F,XP(o.1637Tp)~XP(-n.124~~)7, k'rost Aeavino ForceAs well knownthat thc deterrninati.<strong>on</strong> of thevalue of frosC heaving force is very big workwhich should be observed in situ with largescale and taken many years. Rased <strong>on</strong> the datacollected mainly from Heil<strong>on</strong>gjiang ProvincialWater C<strong>on</strong>servancy Institute, Low TemperatureInstitutc and Transportati<strong>on</strong> 1nstitut.e. apractic.al value for frost heaving force has beenprovided. Based <strong>on</strong> the affecting directlor1 ofthe force, it. could be divided thrce ki-nds offrost heaving force: tangential <strong>on</strong>e T affectirlgaldng the lateral surface of foundati<strong>on</strong>; normalune 0 affecting f.he bottom of foundati<strong>on</strong> vertically;horiz<strong>on</strong>tal <strong>on</strong>e "h affecting the surfaceol retaining wall horiz<strong>on</strong>tally. Tablc 3.0, 11and 12 are 1ist.ed the values already which canbe applied in engineering pratice (SL23-91).Tablc 30. The Value of 'Tangential Prost He~vingF (I 1- c eNun Weak FH Very FH Very heavyClassificati<strong>on</strong>I.'! t.'H FH"For vcry smooth surfar-e of precast c<strong>on</strong>crete pile,the value should time a cocfficient of 0.8; andfor the r.oarsc surlace of st<strong>on</strong>e pi.^, the valueshould tine :.t coefficient of 1.2.'Table 1.1.The Value cf Normal Frost Heaving ForceStmulard va I ueI00Classificati<strong>on</strong> Standard value U (KPa)N<strong>on</strong> FH X-100 30-60 20-50 10-30l;:eak P9 100-150 63-100 50-80 30-60VI1 150-7.10 100-150 83-130 60-100Very FI4 210-290 150-220 130-1C10 103-150Very heavy' FH 290-390 220-300 190-260 1.50-2101 1 16.3 23.6 42.7 77 .o2 1 11.0 7.5.9 41.3 59.3L.'Y.-I.,inin~ type; W.D.-Wat.er dr:pth;C<strong>on</strong>c.-Cc.)ncretc;I
scale and practical experience in situ, a tes<strong>on</strong>ablestructure design was proposed by the uuthurs(Chen et 111, 1987) with wh-ich the slope uf soilprotecticn layer' up<strong>on</strong> plastic film will bestable." 2. Allr i--heave Structures1) II shaped canal--Sincc 1975 the first Ushayt~rl canal vas set up in Xanxi province (Zhu,Q- et al, 1991) with an optium hydraulic secti<strong>on</strong>;Ind saving land 1/2 to 3/4 compared with thetradi<strong>on</strong>al ladder shaped canal, and increasinganti-heave capacity as well. In 2983, the I1shaped canal built hy c<strong>on</strong>crete was set up inXanxi province for 7600 km and up to now it wasfinished about 20000 km i n China with a biggestd.ia;charge of 25.8 m3/s in irrigati<strong>on</strong> canal. NUWthe machines for c<strong>on</strong>structing U shaped canalwith cast in place or precast c<strong>on</strong>crete with therhameters of 40 cm, 60 cm, 80 cm, 100 cm and120 cm or more havc been used widely in practice2) Arch shaped botlom uf canal--As well knownthat, thc lining c.orner of canal bottom is easybroken (luring freering bf:cause of c<strong>on</strong>centraledfrost heaving stress. It is shown in pract-icethat the amount of frost heave at the archshaped bottom is about 1/2 to 1/4 of that at thecorner of bottom with a ladder shaped. C<strong>on</strong>sequently,the arch shaped bottom of canal withc<strong>on</strong>crete lining is set up rat.hcr popu1arl.y inseas<strong>on</strong>ally frost regi<strong>on</strong>s in China. 'The structurewith an arch shaped bottom is also used inthe tunnel for' disappering water head verysuc.cessfu1 in nortll-cast China with str<strong>on</strong>g frostsusceptihility hnse soil (\:RII~,, S.Y., et nl,1993) which is so called anti-heave structurewith an arch shaped.3 ) 11-11 shaped sluice--In norm situati<strong>on</strong>, asluice w i l l be designed as in optium hydraulicc<strong>on</strong>diti<strong>on</strong> with much complex structure. Howcver,this complex structure would not work well incold regi<strong>on</strong> with heavy frost heave because theoverburden pressure is so small that could notlimit the heave in an allowable <strong>on</strong>e. The "-"shaped sluice with a c<strong>on</strong>centrated load and aburied depth over maximum frost depth vas setup firstly in Xijiang district and later inHeil<strong>on</strong>gjiang province which is uscd widely innorth China.4) C<strong>on</strong>crete box and Reofahric sandwedgeretaining well--Some retaining walls were setup hy means of c<strong>on</strong>crete box with a space insidewhich were successful in Heil<strong>on</strong>gjiang provincebecausc they were permlted to have nn allowabledisplacemenl during freezing. The sandwedgestructures were built up irl Inner M<strong>on</strong>golia inwhich local soil was covered by Reofabrics andbuj1.t up <strong>on</strong>e up<strong>on</strong> another. Since they are veryflexibale for dealing with frost heave, so itw i l l be a new anti-heave structure for buildingrrtai.nj.ng wall in future.3. Insulati<strong>on</strong> StructuresThc insulati<strong>on</strong> materials were used beneathc<strong>on</strong>cr'ctc lining or foundati<strong>on</strong>, or closed theinside surface of retaining wall for preventingfrost penetrati<strong>on</strong> into base soil, as a result,the frost heave of insulated base soil will bedisappeared ur limited. A pulystyrene form slahwas firstly used beneath c<strong>on</strong>crete lining ofcanal in Shanxi province hy Academy of WaterC<strong>on</strong>servancy, and Shanxi Water C<strong>on</strong>servancyInstitute. It was successful and had a goodcomprehens.ive benefit (Jin et al, 1987). Later<strong>on</strong>, the polystyrene form slab was'userl bencat,hthe c<strong>on</strong>crete lining c3f canal :rlopc at the plt+cewith water level fluctuati<strong>on</strong>suffered heavy frost damagewhich used LO bein a water transportcanal in Shand<strong>on</strong>g,provincc. The thickness ofpolystyrene form slah is abuut 1/10 ro 1./15 ofthe design frost depth Ild which depends <strong>on</strong> thematerial properties (SL23-'31). Besides above,insulati<strong>on</strong> slab is also madc of pearlite andm-i.neral wool (Jian, 1992). The total capitalexpenditure of. last two will. reduce about. 1/3compared with that of insulaLed by polystyreneform.All of that menti<strong>on</strong>cd above is an outline ofthe current development. <strong>on</strong> thc suhject forpreventing canal frorr! frost damage in China.Howevcr, there are lots of pr'oblerns facing tohe sulved incl.uding tcchnique, capital,adiminislrati<strong>on</strong> and mat.erii3ls etc. as well.REFERENCESChen, X.E. ct al. (1979) On anti-heave measureoyrcplacing clayey soil with gravel. Bulletinof Sciences. No. 20, (33.5-939.Chcn, X.B. et al. (1986) An experimental study<strong>on</strong> frost susceptibility of wind-blown sands.J. Glaciology & Geucryology, No.3, 233-238.Chen, X.H. et al. (3.987) SaturaLe(l-dchydratedc<strong>on</strong>sol.idati<strong>on</strong> of f i I J with low densi1.y undits applicati<strong>on</strong> to canal engineering, SCIENTTASINICA, No.7: A, 779-784.Chen, X.R. et al. (1988a) Frost susceptibilityof sandy gravel during freezing, YAN'PUGONCCHENG XIJRRAO, No.3, 23-29.Chen, X.R. et al. (1.988b) A frost heave modelof sandy gravel in open system, Proc. VTCOP, 304-307.Chen, X.B. & Wang, Y.4. (1988~) Frost heavepredicti<strong>on</strong> model of clayey soils, Cold Regi<strong>on</strong>sSciences and Technology, 15, 233-238.Chen, X.E. & Wang Y.Q. (1991) A new model offrost heave predicti<strong>on</strong> model for clayey soils,SCIENCE I N CHTNA (n), No.iO, 1225-1236.Cheng, M.J. et al. (1991) Some anti-heavecountermeasures of canal lining in Tnnel-M<strong>on</strong>golia, Technique of seepage peventi<strong>on</strong>,N0.2, 107-110.Dcsign Norm OF Anti-heave for Canal Engineering(SL23-91)Gansu Water C<strong>on</strong>servancy Inst., (1986) A review<strong>on</strong> the results of prevent-i<strong>on</strong> of canal. fromseepage and frost damage in Gansu province,Tec-hnique of seepage preventi<strong>on</strong> of canal,Special lssue (4), 2-5.Guo, D.X. et al. (.1993) On freezing and frostheaving rule of base earth of lined canal ofArbiLry slope direcliun and gradient, Proc.ICOP *Tnner M<strong>on</strong>golia,Water C<strong>on</strong>servancy Tnst. (1087)An experimentaL report <strong>on</strong> preventi<strong>on</strong> of canalfrom Erost damage by using blown sand.Jian, G. (1992) An outline uf current deve.I.opment,problems and suggesti<strong>on</strong>s <strong>on</strong> antiseepagetechnique of canal i n China,Technique of secpage preventi<strong>on</strong>, No.3, 1-8.Ji.n, Y.T. et a1. (1987) An experimental study<strong>on</strong> new material and new structure forpreventing canal lining Srom frost damage.ti, A.G. et al. (1993) Delerminati<strong>on</strong> of sunshineand sunshade extent coefficient <strong>on</strong>canal, Proc. TCOP.Ljaunin Water C<strong>on</strong>servancy Inst. (1986) Ondesign for prcvcnti<strong>on</strong> of ant i-seepagestruc.tures from frost damage of canal,Technique of seepage prevcnti<strong>on</strong> of canal,Special Tsvue (4), 6-10.1042
Wang, S.R. (1993) A sttdy <strong>on</strong> basic types ofvertical tunnel for divappering water headand their capacity for anti-heave, Proc. ICOP.Wang, X.Y. (1987) A study of the relati<strong>on</strong> betweenfrost heave ratio (and apparent <strong>on</strong>e) andgroundwater level.Zhau, B.X. et al. (1986) An experimental results<strong>on</strong> the preventi<strong>on</strong> of canal from frost heaveby using blown sand in open system inNincheng county, Technjque of seepagepreventi<strong>on</strong> of canal, Speci.al Issue (4),82-89.Zhu, D.F. et al. (1986a) A discussi<strong>on</strong> <strong>on</strong> antiheaveeffect of wind-blown sands in irrigati<strong>on</strong>canal, J. Glaciology & Geocryology,No.3, 239-244.Zhu, D.F. et al, (1986b) An experiment of theeffect of soil and water c<strong>on</strong>diti<strong>on</strong>s <strong>on</strong> fTostheave of canal with c<strong>on</strong>crete lining,Technique of seepage preventi<strong>on</strong> of canal,Special Issue (4), 123-134.Zhu, Q. et al. (1988a) On the distributi<strong>on</strong> offrost heave al<strong>on</strong>g depth in seas<strong>on</strong>ally frostregi<strong>on</strong>s, J. Glaciology & Geocryology, No.1,1-7.Zhu, Q. et al. (1988b) Subsoil replacement usingsand-gravel for preventing frost heave damageof canal lining, Y. Glaciology & Geocryology,No.4, 400-408,Zhu, 9. et al. (1991) A review <strong>on</strong> the develoymentof anti-seepage technique of canal withc<strong>on</strong>crete lining in China, Technique ofseepage preventi<strong>on</strong>, No.1, 1-7.- 1043
A MODEL FOR THE INITIATION OF PATTERNED GROUNDOWING TO DIFFERENTIAL SECONDARY FROST HEAVEG. C. Lewis+, W, B. Kmntzt, and N. Cainet1 INTRODUCTION1044 -
1046
where vi is the tlitnensi<strong>on</strong>less ice velocity and XG is ;tnempirical c<strong>on</strong>stmt. The frost-heave velocity defined byequati<strong>on</strong> 7 is ;Lssuwxl to be equal to the ice vklocityevaIu:tteci at the z;+; that is,The parameter B defined by e$:tti<strong>on</strong> 10 isproporti<strong>on</strong>al to the IiLtent heat c<strong>on</strong>tent of thepermeating water divided by the c<strong>on</strong>ductive heattransfer characteristics of the soil; it is ch:tr:tcteristic .ofthe soil type: for clay B > 1. Eqmli<strong>on</strong> 6 is the Stefan c<strong>on</strong>diti<strong>on</strong> for thismoving boundilry problcm. Tho dorivztti<strong>on</strong> ofequati<strong>on</strong>s 6 and 7 erntmdies much of the complexphysics occurring in the frozen fringe. These equati<strong>on</strong>swere obt:tined hy c<strong>on</strong>hining tqu:Lti<strong>on</strong>s for the unfrozenwater and ice mitss hdances, energy h ~l~n~e, Drtrcyperme:tti<strong>on</strong> flow, Clitpeyrotl relati<strong>on</strong> for the freezingtcmpcratlire, and over:tlI force bnlmce at the hottom ofthe lowest ice lens using the f<strong>on</strong>ndism for rrdl1cing thefrozen fringc to il m;lthc1n;lti(:;tl plttne ils t1csc:ribotl byFowler (1989). The C1;yjeyr<strong>on</strong> etp1:lti<strong>on</strong> is motlifictl toinclude cryostatic sucti<strong>on</strong> effects : t~l is given bywave length of the patterned DSFH. A more completedevelopment of this analysis is given by Lewis (1993).The principal results of this linear stability analysisare sumtn:trized in Figure 2 for three characteristic soiltypes: clay (curve a); silt (curve b); and sand (curve c).This figure was prepared assuming that the loading isdue <strong>on</strong>ly to the weight of the overlying frozen soil andT; = 0 "C. The modulus of elasticity of the frozen soilwas assumed to be 5.0 x IO7 3 (Drewry, 1986).hlI I I T I E l0 0.1 0.2 0.3 0.4 0.5 0.6rFigure 2: Dinlensi<strong>on</strong>less wave number a and growth c*ellicient as functi<strong>on</strong>s of dimensi<strong>on</strong>less frost-penetrati<strong>on</strong>depth e -B for: (a) clay; (b) silt; (c) sand.[F] V4nt = Pwhere w is the z-tieflectiotl of tho c<strong>on</strong>ter of tho plnts, Eis Young's rnodult1s, antl h is the thickness of the frozenregi<strong>on</strong>.In order to ~t;JAish the c<strong>on</strong>diti<strong>on</strong>s for wllicll ilp:ttterned form of DSFH is possible, it is neceswry tosolve the above system of equati<strong>on</strong>s. We explored thisinstability mech;tnism by cwrying out a linear st:hilityanalysis to tleterrnine the o<strong>on</strong>diti<strong>on</strong>s recluircrl for tho 'initiati<strong>on</strong> of DSFH in the form of grountl-surf:lcecorrugati<strong>on</strong>s hrtving a wwe length X. This malysis candetermine the effect of soil type, frtwing depth, climilticc<strong>on</strong>diti<strong>on</strong>s, ctc., <strong>on</strong> the initiati<strong>on</strong> and charltcteristicThe lcft ordinate in Figure 2 is the dimensi<strong>on</strong>lessfrtuzing fr<strong>on</strong>t clepth which is plotted versus thedimensicinis wave number a. This figure indicatesthHt for C ~ L1oc:rti<strong>on</strong> C ~ of the freezling fr<strong>on</strong>t there is apreferred unstable wave number, independent of the -soiltype, which satisfies the linear stability analysis for thecoupled heat transfer antl permeati<strong>on</strong> described byequati<strong>on</strong>s 2-1ci and the elasticity c<strong>on</strong>straint.given byequati<strong>on</strong>17.The right ordinate in Figure 2 is the dimensi<strong>on</strong>lessgrowth coefficient r which also is plotted as a functi<strong>on</strong>of a. Figure 2 implies that the preferred wave numberand its growth coefficient decrease with increasingpcnetrilti<strong>on</strong> of the freezing frdnt. These predicti<strong>on</strong>sinclicate that the <strong>on</strong>edimensi<strong>on</strong>al SFH process for thespecified c<strong>on</strong>diti<strong>on</strong>s is unstable such that it will evolveinto DSFH characterized by a corrugated heavedground surface under1:tin by a corrugatedfrost-penetrati<strong>on</strong> fr<strong>on</strong>t.This linear stability analysis predicts that DSFH isthcorctic:llly possible in any soil characterized by acryostrttic,sucti<strong>on</strong> functi<strong>on</strong> for which I b I< 1. However,1047
7 REFERENCES
Initiati<strong>on</strong> of Segregati<strong>on</strong> Freezing Observed in Porous Soft Rockduring Melting ProcessSatoshi Akagawa,Institute of Technology. Shimizu Corporati<strong>on</strong>,Tokyo 135, JapanIce lens appearance in freezing soil and porous soft rock varies greally. This difference is assumed 10 be governedby the cohesi<strong>on</strong> or tensile strength of the porous materials, such as soils and soft rocks.In this paper, the author dem<strong>on</strong>strates the empirical results which show ice lens initiati<strong>on</strong> in a melting frozen poroussoft rock where no pore water flow and negative to zero net heat tlow at the segregating ice lens is maintained.The mechanism of the ice lens initiati<strong>on</strong> and growth in melting porous soft rock is discussed in the light ofthermodynamics and mechanical proprties of the rock.The discussi<strong>on</strong> supports the assumpti<strong>on</strong> with the data dem<strong>on</strong>strated in this paper : the tensile strength of freezingporous mawrial may play the role in determining of sucti<strong>on</strong> pressure at growing ice surface, and may c<strong>on</strong>trol ice lensinitiati<strong>on</strong> and c<strong>on</strong>tinuous growing properties.Table-1 Physical and mechanical properties Of tuffIce lens appearance in freezing soil and porous soft rock variesgreatly. Comparing the properties in frost heave tests, c<strong>on</strong>ducted withc<strong>on</strong>stant boundary temperature c<strong>on</strong>diti<strong>on</strong>s and an open pore water linesystem, it may be said that (1) many fine ice lenses are seen in frozennormally-c<strong>on</strong>solidated soils, (2) a reduced number of thin ice lenses areseen in frozen over-c<strong>on</strong>solidated soils, (3) a more reduced number of thickice lenses are Seen in Tertiary soils which have slight measurable tensilestrength, and (4) a few dominant thick ice lenses are seen in frozenporous soft rock.This difference seems to be related to the magnitude of theinteracti<strong>on</strong> between soil grains which is measured as the cohesi<strong>on</strong> and/ortensile smngth of each materral. Low cohesi<strong>on</strong> may cause frequent min icelenses and high tensile strength may cause restricted thick ice lenses.Experimental results menti<strong>on</strong>ed above reveal an assumpti<strong>on</strong> thatcohesi<strong>on</strong> and/or tensile strength of freezing porous materials affect theproperties of ice lensing. In other words, tensile strength may play thesame role as super-cooling does at ice lens initiati<strong>on</strong> in freezing soil.In order to examine the assumpti<strong>on</strong> menti<strong>on</strong>ed above, unusual frostheave tests were c<strong>on</strong>ducted. The procedure of the frost heave tests wasspecially arranged to eliminate the super-cooling of pore water which mayassist the initiati<strong>on</strong> of ice lenses. For this purpose, frost heave tests in thethawing c<strong>on</strong>diti<strong>on</strong> were ntroduced . Theoretically and experimentally itwas understood and c<strong>on</strong>firmed that ice lenses may not initiate or grow inthawing c<strong>on</strong>diti<strong>on</strong>s (ex Gilpin, 1982). A certain amount of net heat flow atthe rowing ice surface is required to meet the latent heat budget of icenucfreati<strong>on</strong> (Akagawa, 1990). In macroscopic view, the required net heatflow will never be supplied in melting process.In this paper, details of the frost heave tests c<strong>on</strong>ducted under thethawing c<strong>on</strong>diti<strong>on</strong>s aTe explained with test results, and the process of icelens initiati<strong>on</strong> in the thawing c<strong>on</strong>diti<strong>on</strong> is discussed.IMENT3almhEdWelded tuff with the properties listed in Table-I WBS used as thespecimen. It has already been c<strong>on</strong>firmed that the tuff frost heaves againstits tensile strength of 1.4 MPa in the freezing process (Akagawa et al.,1988), and that its properties which affect frost susceptibility, such as porestructure and/or unfrozen water properties, are similar to those of frostsusceptible soils (Akagawk 1991).Apparent specific gravityPorosity(%)Strength(MN/&CompressiveTensileTangent modulus (MN/m2)Secant modulus (MN/d )Elastic wave velocity(km/s)Poiss<strong>on</strong>'s ratioUnfrozenDry Saturated(20°C)Frozen.Saturated(-5C)(-15"c)(-25"c)1.40 1.72 ______ .__I___37.914.7 6.6 12.0 18.5 26.21.6 1.4 1.4 4.4 5.74812 3548 2859 2068 37634596 3126 3097 3410 62812.45 2.72 3.20 3.67 3.890.17 0.28 0.46 0.38 0.42AooaratusA triaxial frost heave test cell, shown in Fig.1, which was placedin 2 "c chamber waq used for this experiment. With this apparatuslateral heat tlow and side fricti<strong>on</strong> were reduced as much as possible. Theboundary temperatures of the specimen were maintained tiy circulatingtemperature c<strong>on</strong>trolled liquid in pedestals which are seen at both side of thespecimen in the figure. The temperature profiles were acquired withtemperature readings from platinum temperature transducers placed everylcm over the specimen. A pore water line was open from the waterreservoir to the specimen and the amount of the flow was measuredautomatically. The expansi<strong>on</strong> of the specimen was measured with a digitaldeformati<strong>on</strong> transducer which generated <strong>on</strong>e pulse for every 1 urndeformati<strong>on</strong>.€!m&bESample preparati<strong>on</strong>The trimmed specimen, which had the dimensi<strong>on</strong>s of 60mm indiameter and abut 90mm in height, wa? submerged in water under avacuum c<strong>on</strong>diti<strong>on</strong> for more than 3 m<strong>on</strong>ths. After the installati<strong>on</strong> of thespecimen in the uiaxiat frost heave cell, following almost the sameprocedure as c<strong>on</strong>venti<strong>on</strong>al triaxial compressi<strong>on</strong> test, pore water wascirculated from the bottom pedestal to the upper pedestal for 24 hours toavoid unfavorable air bubbles. Uurin this period, both pedestals weremaintained at a same temperature, +2E, to equalized the initial specimentemperature.
,3rd.thgwCooling liquid --.circulati<strong>on</strong>Thin rubkrmembrane...........shown in Fig.2-A-l to Fig.2-C-l . Tenlperalure changes in the freezingspecimens are also shown in Fig.2-A-2 to Fig.2-C-2 . Temperatureprofiles at some important priuds are shown in Fig.2-A-3 to Fig.2-C-3.These temperature profiles wcw drawn with temperature data at "a", "b","c", "d", and "e' in Fig.2-A,B1:-2, and corresp<strong>on</strong>d to the following;initial temperature profile, stcady urnperatwe profile at first freezingphase, steady temperature profile at sec<strong>on</strong>d freezing phase, ice lensinitiati<strong>on</strong> in first thawing phase, a:ld c<strong>on</strong>tinuous ice lens growth inthawing phase.During the first freezing phase, "a" to "b', specimens seemd toexpand, however this was not frost heaving but expansi<strong>on</strong> due. to thefreezing of bulk water and is usually called in-situ freezmg. In this phase,pore water was expelled from the specimen which is a typical phenomenaWarmingliquidcirculati<strong>on</strong>Pore water supplyPressure gaugefor unfrozenwater pressure atsegregating icelensFig.- I Triaxial frost heave cellTest procedureAs for the first stcp of this experiment, the specimen was frozenf~-om top to bottom uniaxial1 . c<strong>on</strong>trolling the tetnpcratures of the upperand lower pedestals at -IS 8 and 0c respectively. After thec<strong>on</strong>firmati<strong>on</strong> of negative remperatures over the entlre specimcn, furtherlowering of the specimen temperature was c<strong>on</strong>ducted by ceasing thetemperature c<strong>on</strong>trol at bottom pedestal. The frozen specimen was cooleddown further by heat extracti<strong>on</strong> from the upper pedestal. Afer it had beenhe c<strong>on</strong>firmed that the specimm had not expanded, the tcmperaturt: of thebottom pedestal was increased to the scheduled positive temperature inorder to thaw the specimen from the bottom upward. Since this was thcvery hcginning of the experiment, all the tcst c<strong>on</strong>diti<strong>on</strong>s were maintainedthroughout the experiment.In order to achieve the above menti<strong>on</strong>ed te6t procedure, the testc<strong>on</strong>diti<strong>on</strong>s, shown in Table - 2, were applied.Photo 1 Freezing specimenTable-2 Tcst c<strong>on</strong>diti<strong>on</strong>sTest name A - - ~ __ ~-Freeze up .I sf thaw hack 2nd thaw b& I b&......................................................(r I (kgf/cmZ) O.(l95 0.095 0.005 0.095*r 3 (kgf/cm') 0 0 0 0Pw (kgf/cm' ) 0 0 0 0Tc ("c) -15 -15 -12 -12Tw ('c) Oor-2 4.5 +3.5 +5.55"- ,."" _._"" __ ~'Teat name B............................. Fl-ee1-t: up~~'Test name C""hack thaw ........................................Frcc/n: UJ thaw backc I(kgf/cd) 0.095 0.095 n I(kgf/um2) 5.62 5.62n 3(kgf/cd ) 0 0 n 3(kgf/crn2) 5.43 3.43Pw(k Yficrr? ) 0 0 Pw(kgf/crn2) .S.O() 5.1) 8 closcdTc (k) -15 -15 Tc (c) -15 -14.4Tw ("(3) 0 & noc<strong>on</strong>t. +5.3 Tw ('C) Odi. noc<strong>on</strong>t. +5.1
-1Time (tu)Fig 2-A-I0 20 40 60 80 100-Time (tu)Fig 2-B-10 20 40 60 80 100 120140Time (hr)Fig 2-C-1-020v E 40b 6o800 50 '100 150 200 250Time (hr)Fig 2-A-20204060800 20 40 60 80Time (hr)Fig 24-2I..i-1020I B 6o0 20 40 60 80 100 120Time (hr)Fig 242-2100."-15 -10 -5 0 5-20 -15 -10 -5 0 5 -20 -15 -10 -5 0Temperature ('c) Temperature ( c ) Temperature ("c )5 10Fig 2-A-3 Fig 2-B-3 Fig 2-C-3Fig 2-A Test results of Test-A Fig 2-8 Test results of Test-B Fig 2-C Test results of Test-CI8oof in-situ freezing. At a time "b, the specimen temperature went helowzero entirely and then further freezing was accomplished by releasingc<strong>on</strong>uol of the wming pedestal temperature to avoid super-cooling. Thisprocedute led to the warmest temperature at "c" in Fig.2-A, B, C-2,where the specimen is lower than -4 c, as shown in Fig. 2-A, 8, C;3.During this period, the expansi<strong>on</strong> was ceased abruptly. Immediately afterthe period "c", the temperature of the warming pedestal was increased to 4'c in Test A and 5'c in Tests B and C . A couple of hours later, as thelower part of the specimen became positive in temperature, gradualexpansi<strong>on</strong> was started at about the period "d' in Fig.2-A, B, C-2. As timeelapsed, the heave fate increased to a rate of about 0.06mm/hr with porewater in-take. These combinati<strong>on</strong>s, such as expansi<strong>on</strong> of specimen andpore water in-flow reveals that the frost heaving with ice lens segregati<strong>on</strong>was taking place. Actually, ice lens growth was c<strong>on</strong>firmed through asemi-transparent rubber membrane as shown in Photo-1.In Test A, funher lhawing was c<strong>on</strong>ducted twice-at the periods "e"and "f'. During hoth thawing phaes, reducti<strong>on</strong> of heave amount was seenfirst and then recovery of heave amount was c<strong>on</strong>firmed as lime elapsed.However, the recovery was not very clear in the period "e" to "P',because of the insufficient time length.After the frost heave tests, specimens wcrc cut in two peices. Atypical photo of the ice lenses seen in the 'Test C specimen is shown inPhoto. 2. Due to the high rigidity of the specimen, the distance betweenthe bottom end of the specimen and warmest side of the ice lens did notchange over the Est durati<strong>on</strong>s. Therfore the locati<strong>on</strong> of ice lens initiati<strong>on</strong>was measured as this thickness. With these tnicknesses and thetemperature profiles at "d","e", "E". and "h", the segregati<strong>on</strong>temperatures, Ts, of ice lenses were observed as shown in Fig.3. Theseobserved Ts values scattered around the formerly observed Ts value, -1.4VI which was observed in normally c<strong>on</strong>ducted frost heave tests.
dPi= n t+Po : seoarati<strong>on</strong> omsurewl I , c<strong>on</strong>diti<strong>on</strong> at theDISCUSSXQjFrost heave tests c<strong>on</strong>dwtcd in this work clearly show a possibilityof ice lens initiati<strong>on</strong> and growth during thc thawing process, although thisis <strong>on</strong>ly seen with a very slow thaw back process. The tcst results promptquesti<strong>on</strong>s. such as (1)what mechanism may enable ice lens initiati<strong>on</strong> and(2)how is the heat budget for ice lensing maintained.In the following, a possible understanding of the above questi<strong>on</strong>sis discussed.Since the observed Ts values in this experiment are somcwhalsimilar to what was formerly measured, icc lensing propenies observed inthe experiment arc also similar IO usual ice lensing properties (Akagawa,1988). The observcd segregati<strong>on</strong> process of the ice lcnses in thiscxperment is understood to be the usual process. Then thennodynamicc<strong>on</strong>diti<strong>on</strong> in frozen fringe at the initiati<strong>on</strong> of ice lensing, the pcriod "d" and"g" in Fig.Z.A,B,C-2, is drawn as a triangular secti<strong>on</strong> pointed to by anarrow ,"A", III Fig.4. A quasi-equihbrium state was reached because therewas no pore water in-flow and availahle pores in the fringc were filledwith ice and unfrozen water. The right most, or highest point of trianglesecti<strong>on</strong> shows an ice pressure that IS almost scparating the pore despite itstensile strength, n 1. According 10 thc generalized Clausius-Clapcyr<strong>on</strong>equati<strong>on</strong>, ice pressure devcloped (dPi) due to the depressi<strong>on</strong> of the localequilibrium tcmperature (dT) is exprcsscd as;where dPw is the sucti<strong>on</strong> pressure In unfrozen water, 1, is volumetriclatent heat of fusi<strong>on</strong>, To is the freezing temperature of water in Kelvin atatmospheric pressure, y is the specific gravity and subscripts w and irefer to water and ice. In this case Ihe temperaturr should be around -1.4'c. Therefore. dPi should he about I .SSMp;i. lmmcdiately after thepore is enlarged by the separati<strong>on</strong> force exerted hy the ice pressure, theice pressure may drop to the overburdrn prcssure of Y.3kPa. Since thispressure is about 6/lWO of initial dPi, the thermodynamic c<strong>on</strong>diti<strong>on</strong> maychange to the other sidc of the 3I) drawing, sec exrow "C". The triangleshaped secti<strong>on</strong> shown by the other arrow reprcsents a relati<strong>on</strong>shipgoverned by generalized Clausius-Clapeyr<strong>on</strong> a1 dPi=O as;dPidPw = y i ( ---__ +y iLdT)ToThe thennodynamic c<strong>on</strong>diti<strong>on</strong> at the time ~rnrnediatcly after ice lensinitiati<strong>on</strong> in frozen fringc is shown as a deformed triangle, labled "R" inFig.-4, bwause tht thermal ficld will not change sp<strong>on</strong>tancously. Theciefobnned trianglc shows the reducti<strong>on</strong> in ice prcssure of ( ~ and t thegenerati<strong>on</strong> oftLPw, i.r. sucti<strong>on</strong> force. The relati<strong>on</strong> brtween n t and dPwin this case is shown as ;a c<strong>on</strong>diti<strong>on</strong> at ice lens segregati<strong>on</strong> withno overburden oressuret -".7"i i dPw =S: sucti<strong>on</strong> pressu;1, 8 (dPi=O)dPw=yw(9+L,, y I TOFig.4 Ice lens initiati<strong>on</strong> scheme with tensile strengthThe sucti<strong>on</strong> force induced by the tensile strength may he a driving forcefor flowing pore water from the water reservoir to the segregating ice lensthrough frozen fringe. As pore water migrates to the segregating ice. thelatent heat of ice nucleati<strong>on</strong> may raise the local temperature. If the rise inlocal temperature is less than the temperature change equivalznl tu a thepressure change, Pi, from I.SSMPa to 9.3 kPa, i.e. in this case 1 .SS/1.11- 0.0093/1.1 I = 1.39 (re, the sucti<strong>on</strong> may c<strong>on</strong>tinue to functi<strong>on</strong> pullingpore water to the growing ice lens. !4owever, although the value of thesucti<strong>on</strong> may diminish a cenain mount.In this manner tensile strength may play a role in determiningofsucti<strong>on</strong> pressure and therefore c<strong>on</strong>trol ice lens initiati<strong>on</strong> and the c<strong>on</strong>tinuousgrowing that is observed in the thawing c<strong>on</strong>diti<strong>on</strong>.In additi<strong>on</strong>, F4(3) clearly indicates that if a freezing material has ahigher tensile strength, a higher sucti<strong>on</strong> force may be expected when thematerial frost heaves. Therefore it may be said that str<strong>on</strong>g and stable icelensing occurs more often in freezing porous soft rock compared to usualsoil. This tendency may also be expected lo the ice lensing properties ofTertiary soils and ovcrc<strong>on</strong>solidawd soils.CLUSIONS(1) Porous material, i.e. welded tuff, frost heaves while it is thawingunder the c<strong>on</strong>diti<strong>on</strong> that no super-cooling is available.(2) The tensile strength of freezing porous material may play the role thatsuper-cooling does at ice lens initiati<strong>on</strong>,(3) Thc new ice lens initiati<strong>on</strong> process discussed in this work is favorableto explain the data obtained in this experiment, and the variati<strong>on</strong> of icelensing properties with respect to change in tensile s~de strength.REFERENCESAkagawa, S., S. Goto, tmti A.Saito (1988) Segregati<strong>on</strong> freezingobservcd in welded tuff by open system frost heave test. Proc. 5th, Int. C<strong>on</strong>f. <strong>Permafrost</strong>, pp1030-1075.Akagawa, S. (1990) A method for c<strong>on</strong>trolling stati<strong>on</strong>ary frost heaving.Shimizu Tech. Res. Bull. No.9, ppl-8.Akagawa, S. (1991) Studies <strong>on</strong> the process of frost damages to st<strong>on</strong>eremains under cold envir<strong>on</strong>ments and its preservati<strong>on</strong> method.doctoral thesis submitted to Hokkaido IJniv.Gilpin, R,R. ( 1982) A frost heave interface c<strong>on</strong>diti<strong>on</strong> for use in numericalmodelling. Proc. 4th Can. <strong>Permafrost</strong> C<strong>on</strong>f., pp4S9-465.YWdPw =. ...___ , t (3,yi .1053
THE ENSURING AND ECOLCGICAL SAFETY OF THE GAS PIPELINES OPERATING IN THE PERMAFROST ZONEVitaly P. Ant<strong>on</strong>nv-DtuzhininRRTTWDEINFO (INGEOTES) Ant<strong>on</strong>ov-Druzhinin Private Enterprise,Novy Urengoy,Tumen Regi<strong>on</strong> 626718, RussiaThis papr c<strong>on</strong>tains data <strong>on</strong> methodical backgrounds, large-scale experimentalresearch and fie1.d test of pipelines in a permafrost z<strong>on</strong>e. It is shown that inthe course of the experiment and during the obse'tvati<strong>on</strong> of the operating gaspipline behavior displacements of up to 100 m were determined. I : isdesirable that they should bt: of a seas<strong>on</strong>ally cyclic nature. This can beachi-evsd through the creati<strong>on</strong> of a special temperature c<strong>on</strong>diti<strong>on</strong> of gas beingtransported which prevents the effect of cryogenic heaving <strong>on</strong> the gas pipeline.The lat.t;er effect results in the disturbance of a seas<strong>on</strong>ally cyclic nature ofthe gars pipline displacements. It may sometimes lead to vertical pipelinedisplacements of 300 mm and more. Designed displacements may exceed 2 m perseas<strong>on</strong>. The latter phenomena seem to ke very dangerous for gas pipelinesoprati<strong>on</strong> i.n the pnnafrost z<strong>on</strong>e.Z-THRGPGOENIC STRUCTURES IN GEQSY STEMS(LANDSCAPES)~ OFPERMAFROST ZONEProblems created by oil and gas fieldsdevelopment, in Arctlc regi<strong>on</strong>s attract muchattenti<strong>on</strong> in the discussi<strong>on</strong> of interacti<strong>on</strong>of civil and industrial buildinqs andst>ruct:ures with permafrost.The investigati<strong>on</strong>s carried out mustpermit us to eva1uat.e changes in naturalenvir<strong>on</strong>ment, to single out theanthr-opoyenic comp<strong>on</strong>ent of these chanqes,to enslure accident-free opernti<strong>on</strong> of oiland qa.5 transport units, safet-y of people,envirooment.al c<strong>on</strong>trol in the mineralresources producti<strong>on</strong> regi.<strong>on</strong>s of the Arctic.C<strong>on</strong>sider t,he spatial-temporal structureof the Tas t.ranspor-t geotechnical system asa natural anthropogenic physicngeographicalohjert-, faking as an example the "pipelineenvirorlment" systein.These areas and z<strong>on</strong>es are shown (in crosssecti<strong>on</strong>) in Fig. 1.The paper Fuhrnitt.ed t.n your c<strong>on</strong>siderati<strong>on</strong>di:cur;ses ecologi.ca1 after-effects o€ thecclnstructi<strong>on</strong> and operati<strong>on</strong> of gas pipeliresin a nerm;jfr-or;t z<strong>on</strong>e and nertains to z<strong>on</strong>eslarqely determined by natllral c<strong>on</strong>diti<strong>on</strong>s.Even in case of uking ident,icalc<strong>on</strong>structi<strong>on</strong> technolcgy these z<strong>on</strong>es havedifferent c<strong>on</strong>figurati<strong>on</strong>.The main task of our investigati<strong>on</strong>s is toen.o,ure accident-free operati<strong>on</strong> of oil andgar; transport units, saf-ety of; people. Achilled ga,s ~ipeli.ning experiment has beenperformed <strong>on</strong> a test site of an operatinggas pipeline. In the course of theexperimsnt we have received data <strong>on</strong> thefreezing peculiarities of different soilsin the gas pipeline base. The freezing ratewas found to be 0.5 to 1.6 rnm/hour and thatof the pipeline displacement 45-65 mm.Computer simulati<strong>on</strong> of the temperaturefields of the soil around the gas pipelinebeing chilled has been carried out. Thesimulati<strong>on</strong> results are in qood,agreementwith field test experiments. Classificati<strong>on</strong>of permafrost z<strong>on</strong>e geosystems (Landscapes)reflecting ecological hazard of natural gaspipelining has been dsveloped.However, the ecoloqical safety of gastransport system in the permafrost z<strong>on</strong>e is1argel.y determined by its thermodynamicssystem. Most of all the thermodynamics ofthe gas transport system depends <strong>on</strong> the gaspipeline interacti<strong>on</strong> with the surroundingsoil, air and water in regi<strong>on</strong> 8, z<strong>on</strong>es 9-16(Fig. 1). Just. these processes arediscussed in this paper. It is known thatthe formati<strong>on</strong> of a soil z<strong>on</strong>e exposed to allthe year round thermal effect with the"ice-water" phase transiti<strong>on</strong> in soil is aprocess the most typical of the northerngas pipelines in a permafrost z<strong>on</strong>e. Thisprocess manifests i.tself in: 1) theformati<strong>on</strong> of thaw areas beneath thepipelines when gas is transported at atemperature above zero (t"C>O)- "warm" gas;2) the fobmati<strong>on</strong> of freezing areas duringthe transport-ati<strong>on</strong> of gas chilled to asubzero temperature (t"C
I1 - Regi<strong>on</strong> of geosystem anthropogenic transformati<strong>on</strong>,which is formed during gas pipelinec<strong>on</strong>structi<strong>on</strong> (regi<strong>on</strong> exposed to effect of gaspipeline under c<strong>on</strong>structi<strong>on</strong>) including: 2 - z<strong>on</strong>eof complete mechanical surface destructi<strong>on</strong>; 3 -z<strong>on</strong>e of partial mechanical surface destructi<strong>on</strong>;4 - buffering z<strong>on</strong>e: 5 - z<strong>on</strong>es of indirectFigure 1. The structure (in cross secti<strong>on</strong>) of thethermal effect: wi t.h "ice-water" phase tram.-ti<strong>on</strong> in soil (6), without "ice-water" phasetransiti-<strong>on</strong> in soil (7); 8 - reqi<strong>on</strong> of gposystemanthropogenic transfornmti<strong>on</strong>, which is formedduring gas pipeline operati<strong>on</strong> (regi<strong>on</strong> of oysr-atinggas pipeline effect); includinq: 9 - z<strong>on</strong>e ofwind regime change; 10 - z<strong>on</strong>e of surface waterflow change; 11 .- z<strong>on</strong>e of d.i rect thermal effect,c<strong>on</strong>sisting of: 12 - air z<strong>on</strong>e exposed to directthermal effect; 13 - z<strong>on</strong>e of surfare waterexposed to dirert thermal effect; 14 - ruck zcxlpexposed to all the year round thermal effectwit.11 "ice-water" phase transit i<strong>on</strong> in soil; 15 - ,rock z<strong>on</strong>e exposed to all the year rmmd thermaleffect without "ice-water" phase t,r;msiti<strong>on</strong> insoil; 16 - rock z<strong>on</strong>e exposed to seas<strong>on</strong>al directthem1 effect with "ice-water" phase transiti<strong>on</strong>;17 - pipe of the gas pipeline; 18 - soilsurface; 19 - boundary of z<strong>on</strong>e exposed to ef fcctof engineering structure resulting from dynamicequilibrium of interrelated sahsystems (herclstrichis directed to natural geosystfm).gas trarlsport geotechnical system.geosystems of a landscape stow type: pretundraforests (light forests) growing <strong>on</strong>unfrozen sands (natural type I) and <strong>on</strong>permafrost clay loams and sandy.loams withmean annul soil temperatures (tBv,) of about0 to l.O°C; tundras <strong>on</strong> permafrost sandyloams, clay loam and clays with tav, of -3.0 to-3.5"C (natural type 11) ; peat bogs with tmv+of -3.0 to -4 .0"C and -4 .o to -5.0"c(natural type IS1: type 111-1, free fromvein ice; t.ype 111-2, c<strong>on</strong>taining vein ice):high grass bogs with tav, of -2.0 to tl.O"C(natural type IV) .The main natural peculiarities nf the gaspipeline operati<strong>on</strong> in sollthern foresttundrawere represented in <strong>on</strong>e of our
Natural type ..C<strong>on</strong>ficprati<strong>on</strong> of z<strong>on</strong>e 14 (Fig. 1) for "warm"qas transnortati<strong>on</strong>Iteract i<strong>on</strong>A points of temperature fieldc<strong>on</strong>trol. in soils surroundingpipe of gas pipelineA points of pipe displacementc<strong>on</strong>trolThawing-freezing soils boundary (bergstrich isdirected to freezing soil)Soils: 1) seas<strong>on</strong>ally thawed2) seas<strong>on</strong>ally frozenFigure 2. The natural and geotechnical c<strong>on</strong>diti<strong>on</strong>sof the gas pip :lining test site.According to field testresults(2)06.02.86According to computersimulati<strong>on</strong> results(b)After 31 days of "cold" gastransportati<strong>on</strong>23.03.86After 85 days of "cold" gastransport at i<strong>on</strong>26.04.86After 123 days of "coldgas transportati<strong>on</strong>"r- 1IFigure 3, The tempprature field in the soil surrounding the gas pipeline.1056
Table 1. Physical properties of soils in the base of the gas pipeline test site (Fig. 2Y:(accepted in computer simulati<strong>on</strong>)NaturalThermalHeat capacity perTotalc<strong>on</strong>ductivity,unit volume+Lithologicmoisturewei:J:l of(kg-cal/m-hour .c) . (kg-cal/m3compositi<strong>on</strong>'Ontent'p<strong>on</strong>dingskele,t.<strong>on</strong>,W . forforfor foxto Fig.2)kg /mfreezing thawinq freezing thawingI I 1* I sand I 1600 I 16 I 1.75 I 1.55 I 480 I 590 I111-2 peat, 2.5 m 200200 1.150.1570 900sand 1600381.75 1.55480 590sandy loam 1650? 301.7 1.6 590035peat, 1 m. 200400 1.150.7510 900sandy loam 1650 30 1.1 1.6 590835111-1I I 1 I I Ipeat, 1 m 200 400 1.15 0.7 510 900clav loam 1100 32 1.55 1.45 590 835the results are duplicated by means of analog computati<strong>on</strong>experiments which was carried out <strong>on</strong> a testsite of an operating gas pipeline route(Fig. 2). The length of this site is about2.5 m. According to the program of thisexperiment the transported gas temperaturewas changing from positive to negativevalues. This enabled to observe differenttypes of interacti<strong>on</strong> between the gaspipeline and its soil base,It was found that during thetransportati<strong>on</strong> of gas at low temperatures(t"
Natural. c<strong>on</strong>di.-t: i <strong>on</strong>?3.. Fre-tundra forqstsand lightfor~st.s nn sandysoil.~ wit-h disc<strong>on</strong>t:inuausuerrnafrostcompositi<strong>on</strong>Soil3stateC<strong>on</strong>fi urat i<strong>on</strong>-ofz<strong>on</strong>e 11 (Fi.g. 1) forthe case of "warm"gas transportati<strong>on</strong>: . - X X x X k x"-4. High boys with peatydeposit more than 1 mthick1 - Fipe of the gas pipeline, 2 - thaw- phase transiti<strong>on</strong> in the soil: soils compoing-freezingsoils boundary (bergstrich is siti<strong>on</strong>: 4 -' sand, 5 - sandy loam, 6 - claydirected tn freezing soil), 3 - z<strong>on</strong>e of the loam; soils state: 7 - seas<strong>on</strong>ally thawing,all year round thermal effect with water seas<strong>on</strong>ally freezing, 9 permafrost.Figure 4. Heat disturbance of the permafrost surrounding the gas pipeline with "warm" gas.5b. The displacement resulting from the effect ofcryoqenic heavi.ng .175% l9B9Figure 5. Seas<strong>on</strong>al displacement of the pipeline
soil surrounding gas pipelines, it is veeysimple and oh~ious. Fig. 3 shows a goodarjreernent between the computed andmeasurement results.FIELD TESTRJEARCH 05' PIPELINES IN PERMRE'KOST ZONE,~Field test and large-scale experimentalresearch of pipelines in permafrost z<strong>on</strong>eunder c<strong>on</strong>diti<strong>on</strong>s of planes (sim.il.ar tothose of the permafrost z<strong>on</strong>e of WesternSiberia) must take into c<strong>on</strong>siderati<strong>on</strong> atleast five types of gas pipelining naturalc<strong>on</strong>diti<strong>on</strong>s (Fig. 4) ._"Field~ TestIn our approach to field tests ofpipelines the object of investiqati<strong>on</strong> isnot <strong>on</strong>ly the gas pipeline as a technicalobject but the gas pipeline and its naturalenvir<strong>on</strong>ment as an integral. gastranspirati<strong>on</strong> system. During theobservati<strong>on</strong>s we study all zop.es shown inFig, 1. Such an approach is calledengineering-geological m<strong>on</strong>itoring. Underthis term we understand observati<strong>on</strong>, dataaccumulati<strong>on</strong>, predicti<strong>on</strong> of thegeotechnical system development as anatural anthropogenic object. The main aimof engi.neering-gedlogical m<strong>on</strong>itorina isoptimizati<strong>on</strong>, provisior! cf reliability andecological safety of the geotechnicalsystem.At present the service of engineeringgeologicalm<strong>on</strong>itoring is carrying outobservati<strong>on</strong>s <strong>on</strong> 75-100 km sites ofoperating gas pipelines. These are mainsites of gas transporting systems ofWestern Siberia, which ace operating underpermafrost c<strong>on</strong>diti<strong>on</strong>s.The observati<strong>on</strong> system was designed withaccount. of methodical backgrounds menti<strong>on</strong>edin the first secti<strong>on</strong> of the author's paper.In the process of observati<strong>on</strong> wedetermined:1) the thermal field in the soilsurrounding gas pipeline; 2) the dynamicsof d.irect thermal effect with "ice-water"phase transiti<strong>on</strong> in soil (z<strong>on</strong>e 14, fig. 1);3) the ground water level beneath the gaspipeline; 4) displacement of gas pipelineand other technical characteristics.OPTIMIZATION OF GAS TRANSPORTINGGEOTECHNICKSYSTEM IN PERMAFROST ZONEThe brief summary may be presented asfollows :1. The "warm gas" pipslining isunreas<strong>on</strong>able because it is c<strong>on</strong>nected withthe permafrost thawing in the pipeI.ine baseand the activizati<strong>on</strong> of cryogenic processesdangerous for gas pipelines - thermokarst,thermal erosi<strong>on</strong>, ground subsidence etc.2. The cold gas pipelining is dangerousbecnl.l:;e of the acti.vizati<strong>on</strong> of frostheaving ahd fracturing of s0il.s and theformati<strong>on</strong> of frozen earth materials beneaththe pipelines.All the above-menti<strong>on</strong>ed testifies to thenecessity of developing such a temperaturec<strong>on</strong>diti<strong>on</strong> of the transported gas whichwould permit to c<strong>on</strong>trol cryogenic processesin the direct thermal effect z<strong>on</strong>es of gaspipelines (mainly in zoms 13, 14, 15, 16in the regi<strong>on</strong> of operating gas pipelheeffect 8, Fig. 1)-The temperature c<strong>on</strong>diti<strong>on</strong> of thetransported gas developed by us permi.ts toprevent dangerous cryogenic processes inthese z<strong>on</strong>es. Thereat seas<strong>on</strong>al qas pipelinedisplacements become comparable with thecxtsnt of seas<strong>on</strong>ally heavi.ng of clay loamin a seas<strong>on</strong>ally nature. As a result, thegas pipeline remains at the elevati<strong>on</strong> mark(Fig. 5a). In case of violati<strong>on</strong> of thisc<strong>on</strong>diti<strong>on</strong> the forces of cryogenic heavingmay affect the gas pipeline. This resultsin the deviati<strong>on</strong> from a design positi<strong>on</strong>(Fig. 5b) and possible dangerousdisplacements (Fig. 5c).The data presented are obtained duringfield nesting of pipelines in the processof engineering-geologial m<strong>on</strong>itoring of thegas transporting systems in the North ofWestern Siberia. The pipe displacementillustrates in Fig. 5a is determined <strong>on</strong> thegas pipeline fixed in soil with anchordevices and transporting gas undertemperature c<strong>on</strong>diti<strong>on</strong> developed by us.We have presented the methodicalhackgrounds and the results of large scaleexperimental research of pipelines in thepermafrost z<strong>on</strong>e being carried out by thedepartment of northern geotechnical systemsof the trust of Engineering-geologicalM<strong>on</strong>itoring and <strong>Research</strong>. It is worth notingthat the development'of temperaturec<strong>on</strong>diti<strong>on</strong> for gas pipelining, which permitsto c<strong>on</strong>trol cryogenic processes, is based <strong>on</strong>a special permafrost predicti<strong>on</strong>.Using the computati<strong>on</strong>al algorithm we havesimulated a problem of finding the m<strong>on</strong>thly .average gas temperature which ensures a 0.5 mthaw radius around the pipe all year round.The simulati<strong>on</strong> results are presented inFig. 6.t,'CIn '?- 1a 1L-L4I0 I , " ,I46IloIFI4; i c i i i j @ i j-- - gas temperaturethe temperatureI I -- mmh51of soil. surfaceFigure 6. Average m<strong>on</strong>thly gas temperatureprovide the minimum thaw area (0.5 m) .around the gas pipeline.The first year of operating. The initialsoil temperature -1 C.
~ ComplexENGINEERING AND GEOCRYOLOGICAL STUDIES OF THE CENTRALPART OF YAMAL PENINSULA CAUSED BY ITS DEVELOPMENTV.V.Baulin, A.L.Chekhovsky, 1.1. ChamanovaPNIIIS, Okrujnol PR. 18, 105058 GSP; Moscow, RussiaThe album of different scale engineering geocryological and forecast maps has been drawn up by thePNIIIS to design the projects of extracti<strong>on</strong>, treatment and gas piping. The special features of,geocryological c<strong>on</strong>diti<strong>on</strong>s of the territory are reflected the occurrence of ice beds and saline frozen soils.slope processes ect. The forecast of geocryological c<strong>on</strong>diti<strong>on</strong>s changes is given by means of differenttechnogenic impact up<strong>on</strong> the envir<strong>on</strong>ment.In 1990, Russia began to develop Bovanenkovo gas field situ-’ated in the central part of Yamal peninsula (west Siberia).Engineering and geocryological c<strong>on</strong>diti<strong>on</strong>s of the peninsula arewmplicated and specific. <strong>Permafrost</strong> that have the annual average#temperature from -7T to -2OOC is spread everywhere in the gas‘field area. <strong>Permafrost</strong> from the surface and down to the depth of3-4 m is characterized by high c<strong>on</strong>tent of ice (0.4-0.6) which decreases to 0.2-0.4 with depth increase. All the sea deposits that occupy75-80% of the gas field area are salinized. Their salinizati<strong>on</strong>changes from 0.1 YO to 1 % and more. Due to this fact frozen clayishsoil remain plastic even under low annual temperatures. This makesit more difficult to determine strength and deformati<strong>on</strong> characteristicsof salinized frozen soil and significantly diminishes.the carryingcapacity of pile foundati<strong>on</strong>s.Sloping processes are extremaly dangcrous. Depending <strong>on</strong> themeteorological c<strong>on</strong>diti<strong>on</strong>s and the active layer soil compositi<strong>on</strong> soilof the slopes at the steepness of 1.5T can be mobile. When carryingout field studies we obscrved the whole scale of slope processesfrom the classic slides to viscous soil flow <strong>on</strong> the foot of theactive layer. Destructi<strong>on</strong> and damage of the vegetative cover facilitatesslope processes.On the territory c<strong>on</strong>taining sea deposits massive ice is widelyspread. It reaches more than 100 m lengthwise and is 1Om and morethicker. Slide 1 shows the map of massive ice spreading inBivanenkovo gas field. The map is made <strong>on</strong> the basis of abundentdata (over 100 massive ice stripping holes, dozens of outcrops ) andcomputer interpreted aerophotographs, spacephotos andtopographic maps. It was found’ that massiveice properties arec<strong>on</strong>nected with numerous diagnostic indicators of its dispositi<strong>on</strong>(over 40): age of the topography, its morphology. number of lakesetc.The reliability of the method applied is 75-80% with massiveice at the depth of 3-5 m and 60-70% with ice at the depth of 5-10rn.PNIIIS’ studies in Bovanenkovo gas field were carried aut inthree directi<strong>on</strong>s: regi<strong>on</strong>al engieering and geocryological studies;survey of cryogenic processes and geocryological forecast; studiesof salinized frozen soil physical and methanical properties. In thepresentati<strong>on</strong>, we are going to dwell <strong>on</strong> the first two directi<strong>on</strong>s..Regi<strong>on</strong>al engcering and geocryological studies were aimed atproviding the designers with the survey data at every stap of design work. For this purpose we have worked out map legends andcarried out engieering and geocryological mapping in three scales.A 1:100,000 scale map of ecological and geocryologicalregi<strong>on</strong>alizati<strong>on</strong> c<strong>on</strong>tains data <strong>on</strong> engeering and geocryological c<strong>on</strong>diti<strong>on</strong>sin Bovanenkovo gas field area, permafrost resistance totechnogenic exposure and <strong>on</strong> envir<strong>on</strong>ment- protecting measures(Slide 2). In the process of making the map we have determined everyidentified engiecring and gaocryological site’s rcsistana totechnogenic damages. The map also provides data,<strong>on</strong> allowabletechnogenic damages and <strong>on</strong> recommended complexenvir<strong>on</strong>ment-protecting measures for every engineering andgcocryological site. Depending <strong>on</strong> the potentialities of emergence oractivizati<strong>on</strong> of cryogenic processes at disbalanced natural c<strong>on</strong>diti<strong>on</strong>sresistance of the geological envir<strong>on</strong>ment to technogenic exposurehas been estimated. we have identified three categories of engineeringand geocryological sites-resistant, relative resistant, andirresistant <strong>on</strong>es.of envir<strong>on</strong>ment-protecting measures that arc suggestedfor every engineering and geocryological site give informati<strong>on</strong><strong>on</strong> vegetati<strong>on</strong> removal possibilities; recommended fillingheight; critical quantity of snow accumulati<strong>on</strong>; filling slopes reinforcement;and surfaoe drainage.Engineering and geocryological regi<strong>on</strong>alizati<strong>on</strong> maps by c<strong>on</strong>structi<strong>on</strong>c<strong>on</strong>diti<strong>on</strong>s at the scale of 1:25,OOO make it possible to estimatethe complexity and approximate cost of c<strong>on</strong>structi<strong>on</strong> worksin every engineering and geocryological site (Slide 3). In the processof regi<strong>on</strong>alizing such factors as slope angles, prescncc of massive icd1060
and cryopegs, soil salinity, its temperature and ice c<strong>on</strong>tent in it, aswell as percentage of cryogenic damages and formati<strong>on</strong>s in the unit,and flood z<strong>on</strong>e size are taker. into c<strong>on</strong>siderati<strong>on</strong>.hccordine to the estimati<strong>on</strong> of various combinati<strong>on</strong>s of theabove-menti<strong>on</strong>ed geocryological factors several complexity levelsfor c<strong>on</strong>structi<strong>on</strong> sites were graded.Finally, we have marked 3 levels of c<strong>on</strong>structi<strong>on</strong> sites complexity-the least complex, relative complex, and complex sites. To theleast compleax sites we attribute plain terrace surfaccs and hasureysformed by soils with low ice c<strong>on</strong>tent; gentle slopes and back floodlands are related to the sec<strong>on</strong>d group; the most stecp slopes formedby soils with high ice c<strong>on</strong>tent and river bed-side flood z<strong>on</strong>es are related to the third group.Maps <strong>on</strong> engineering and geocryological c<strong>on</strong>diti<strong>on</strong>s andregi<strong>on</strong>alizati<strong>on</strong> by allowable technogenic load at the scale of1:5,000 are made for the southern part of Rovanenkovo gas field.Primary c<strong>on</strong>structi<strong>on</strong> sites are c<strong>on</strong>centrated here (Slide 4). Scenari.os of geocryological c<strong>on</strong>diti<strong>on</strong>’s damages are worked out for everyidentified engicering and geocryological district and for 7 mainc<strong>on</strong>structi<strong>on</strong> type’s. For evcry typeof c<strong>on</strong>structi<strong>on</strong> technology withinengieering and geocryological districts we have suggested designdecisi<strong>on</strong>s that provide engieering c<strong>on</strong>structi<strong>on</strong> stability.To observe requirement of preserving thc naturalgeocryological c<strong>on</strong>diti<strong>on</strong>s and c<strong>on</strong>structi<strong>on</strong>s stability it is necessaryto take various measures aimed at regulating ground temperatureand depending <strong>on</strong> the c<strong>on</strong>structi<strong>on</strong> type. First, these are varioustypes of refrigerating facilities (ventilated basements and foundati<strong>on</strong>s,cooling tubes, thermopiles, heat insulating fillings). Besides,it is very important to install efficient water-c<strong>on</strong>ducting systems,belt-formcd frozen fillings for preventing slidings etc.In addti<strong>on</strong> to the general engieering and geocryological mapsand the general ecological and geocryological maps there were developedlegends for special geocryological maps and a gas field areamapping by ccrtain permafrost characteristics and cryogenic processcsdevelopment were carried out.On the special map or salinized frozen soil and cryopegs at thescale of 1:25,000 there were distinguished three types of salinizati<strong>on</strong>- a chloride, a sulphate, and a hydrocarb<strong>on</strong>ate type, with heavydominating of the first type (Slide 5). Soil salinizati<strong>on</strong> in certaincases exceeds 1 %. On flood lands and slope terraces, upper parts ofsecti<strong>on</strong>sto thc depth of 2-10 rn are formed by unsalinized andlow-salinized soils that have famed under c<strong>on</strong>tinent c<strong>on</strong>diti<strong>on</strong>s.Below them there occur salinized sca deposits. On the surface,salinized permafrost soils are deposited <strong>on</strong>ly within the surfaces ofsea terraces that are not affected by denudati<strong>on</strong>.Therc were determined mechanisms of cryopeg forming andwide-spread occurence in the salinized frozen and,cooled soil. Itwas found that cryopegs occur at absolute marks from +20 m to-200 m within all the geomorphological levels but the most lensesare deposited at the 5-40 m depths in flood land.Cryopegs have formed in the course of the Pleistoccnc and theHolocene, they keep <strong>on</strong> forming at present as well. the map showstwo types of cryopegs, their mineralizati<strong>on</strong>, temperature, and brinepressure in lenses. Cryopegs of the first type are deposited at depthsfrom 4 rn to 10 m and are dynamic, their lenses are thin and differentin horiz<strong>on</strong>tal dimensi<strong>on</strong>. The existence of the lenses and theirmineralizati<strong>on</strong> are closely c<strong>on</strong>nected with short-period temperaturevariati<strong>on</strong>s in the upper part of permafrost. Cryopcgs of thesec<strong>on</strong>d type are deposited at the depth of 10-40 m and deapcr, theyare characterized by quasi-stati<strong>on</strong>ary c<strong>on</strong>diti<strong>on</strong> and c<strong>on</strong>siderablepressure. Lenses are up to several meters thick, they reach 300m in.,extent, and cryopeg properties are less dependent <strong>on</strong> the surfacec<strong>on</strong>diti<strong>on</strong>s. IOn slide 6 ydu can see the map df permafrost thickness inBovanenkovo gas field at the 1:200,000 scale. The map presents thethickness of the negative temperature soil layer c<strong>on</strong>taining ice andthe depth of the zero isotherm. It was verified that the thickness ofpermafrost grows with the geomorphological level age increase.Within the third sea .terrace, the thickness if permafrost c<strong>on</strong>tainingice makes up 200-225 m, the zero isotherm goes at thedepth of 325 m. For flood land the figures are 150-175 m and250-275 m respectively. ,Slide 7 presents the thormokarst forecast map. It gives informati<strong>on</strong><strong>on</strong> the process dynamics under different types of the surfacedamages (vegetative cover destructi<strong>on</strong> and cutting away ground ofdfferent thickness) with today’s climate and the forecast globalclimate warming.Technogenic damages of different scale can lead to reversableand irreversable changes of the initial geocryological situati<strong>on</strong>. Inthe gas field area <strong>on</strong>e can identify three groups of sites according toa potential risk of thermokarst development. The most risky aregentle slopes with massive ice close to the surface- here <strong>on</strong>e can scethe c<strong>on</strong>necti<strong>on</strong> of thcrmokarst development with thermal erosi<strong>on</strong>and creeping processes. the map is built <strong>on</strong> thc data of field observati<strong>on</strong>sand computer model testing.To finish the presentati<strong>on</strong> wc would like to show the map oftechnogenic damage in Bovancnkovo gas field area at the scale of1:25,000.A forecast of changes in the geocryologic?l situati<strong>on</strong> in termsof the identified types of technogenic damages is also given at themap. The damages arc classified by three indicators. Ageocryological changes forecast for 10 types of damages is made forthe periods of 3-5 years and 20-25 years. 13-14% of the gas fieldarea under development is affected by technogenic damages. Theprinciple c<strong>on</strong>clusi<strong>on</strong> is that the today’s level Of tcchnogcnic exposurehas caused the development of separate ( not IIUmerOUS) localscats of the intensified cryogenic proctssta. Both field obamati<strong>on</strong>sand forecast indicate that within the boundaries of the most of thedamaged sites there goes a gradual rccovcry of the initialgeocryological c<strong>on</strong>diti<strong>on</strong>s. This process passcs ahead of theecological situati<strong>on</strong> recovery because the primary vegetati<strong>on</strong> communitiesare being replaced by the sec<strong>on</strong>dary vegetati<strong>on</strong>.The studies in Bovanenkovo gas field were carried out by thelarge group of PNIIIS’ explorers as well as by specialists from otherresearch institutes (MGW, Poundamentproyect. VSEGTNGEO).The authors of the report are very thankful for them for the ftuitfdand highly professi<strong>on</strong>al work without which the presentati<strong>on</strong>would not be possible.1061 -
METHODS OF LARGE SCALE ECOLOGICAL AND GEOCRYOWICAL CUSSIFICATIONOF THE NQRTHRRN PART OF WESTERN SIBERIAA.L. Chehovaky, 1.1. ShamanovaIndustrial and <strong>Research</strong> Institute for Engineering Investigati<strong>on</strong>s of C<strong>on</strong>structi<strong>on</strong>,Moscow, RussiaOn the basis of many yearn of complex engineering 'geocryological and ecological investigati<strong>on</strong>sin the northern regi<strong>on</strong> of Weatern Siberia new methods oi large ecaleecological and geocryological classificati<strong>on</strong> including general recommendati<strong>on</strong>s <strong>on</strong>possible engineering disturbances to nature have been developed.Ecological and geocryological classificati<strong>on</strong>has been made <strong>on</strong> the basis of estimati<strong>on</strong> of territorialdifference of landscape and geocryologicalc<strong>on</strong>diti<strong>on</strong>s and forecast calculati<strong>on</strong>s <strong>on</strong> thechanging of geocryological and landlrcape c<strong>on</strong>diti<strong>on</strong>sunder engineering disturbances to nature.Ecological protecti<strong>on</strong> of developing territoriesreguirem preservati<strong>on</strong> and minimum impactto natural landscape and engineering geocryalogicalc<strong>on</strong>diti<strong>on</strong>s and also provides safe design forengineering structures. While undertaking ecologicaland geocryological territory classificati<strong>on</strong>and napping, it is necelrsary to provide stabilityof buildings and structure8 with minimum engineeringinterference into nature. On the basis ofmany yearn of complex engineering geocrylogicaland ecological investigati<strong>on</strong>s in the northernregi<strong>on</strong> of Western Siberia (Yamal Peninsula), ourInstitute has developed new methods of large 1scale ecological and geocryologicaL classificati<strong>on</strong>including general recommendati<strong>on</strong>s <strong>on</strong> possibleengineering disturbances to nature.Ecological and geocryological claesificati<strong>on</strong>has been mads <strong>on</strong> the basis of estimati<strong>on</strong> of territorialdifference of landscape and geocryologicalc<strong>on</strong>diti<strong>on</strong>s and forecast calculati<strong>on</strong>e <strong>on</strong> thechanging of geocryological and landscape c<strong>on</strong>diti<strong>on</strong>sunder engineering disturbances-to nature.The final stage was the development of recommendati<strong>on</strong>s<strong>on</strong> providing for atability of engineeringstructures and preventi<strong>on</strong> of the development ofdangerous cryogenic processes.The diagram of natural divisi<strong>on</strong> ia bailed <strong>on</strong> indicati<strong>on</strong>sdetermining the main peculiarities ofengineering geocryological c<strong>on</strong>diti<strong>on</strong>s. Thepeculiarities of the given regi<strong>on</strong> axe geornorphology,meso and micro relief, slope of the surface,drainage,. vegetati<strong>on</strong>, surface rtediment compositi<strong>on</strong>.The stated types of natural micro-regi<strong>on</strong>sare complex indicators of gaocryological c<strong>on</strong>diti<strong>on</strong>s.The type designs of natural micro-regi<strong>on</strong>s .are made in accordance with c<strong>on</strong>structi<strong>on</strong> developmentc<strong>on</strong>diti<strong>on</strong>s. The determining parameters fortype designs of engineering and cryological rituati<strong>on</strong>aare:1) average annual temperature of permafrost;2) ice c<strong>on</strong>tent of upper layers of permafrost;3) presence and depth of menomineral ice beds;4) presence and depth of saline soil andcryopegs ;5) surface slope.Taking into c<strong>on</strong>siderati<strong>on</strong> these parametersthree type8 of mglneer-geological regi<strong>on</strong>s (EGR)have been distinguished.EGR Ir Flat terrace surfaces with slopes lessthan 1.5 and permafrost characterized by thetemperature from -5'C to -8°C. The deposits ofupper permafrost z<strong>on</strong>es are icy till 3-4 m. Icebed deposits are found as a rule below 10 m. Thesails m e saline al<strong>on</strong>g the entire geological secti<strong>on</strong>.EGR 11: Terrace slopes and lake depressi<strong>on</strong>swith surface slopes more than 1.5 and characteristicpermafrost temperature from -1°C to -6'C.The deposits of upper pennafrort layerer are characterizedby high ice c<strong>on</strong>tents. The depth ofsheet ice occurs below 2 m. The soils are salineal<strong>on</strong>g the entire geological secti<strong>on</strong>. The cryopegz<strong>on</strong>es are found at various depths and i.n someplaces they are having hydrostatic pressure.EGR 111: River flood plains with lake depressi<strong>on</strong>sand surface slope8 less than 1.5 and permafrostcharacterizing by the temperature from-1'C to -4°C. The deposits of upper ,z<strong>on</strong>es are highice c<strong>on</strong>tent. Sheet ice deposits are possiblebelow 10 metres. The soils possess salinity below4-5 m depth. Cryopegs with hydrostatic pressureoccur below 6-8 m.EGR I is most suitable for c<strong>on</strong>structi<strong>on</strong>. Lowaverage annual temperature of rocks, the absenceof sheet ice below 10 m depth creates favourablec<strong>on</strong>diti<strong>on</strong>s €or foundati<strong>on</strong> of engineering strnctureseven with the presence of salinity soil#.EGR XI is le88 suitable for c<strong>on</strong>structi<strong>on</strong> sincec<strong>on</strong>siderable surface slope determines the developmentof dangerous slope processes, soil'ssalinity over the entire secti<strong>on</strong>, high Ice c<strong>on</strong>tentof soils with sheet' ice and a wide tempereture interval of permafrost. The complex of negativefactors presents c<strong>on</strong>siderable difficultiesfor c<strong>on</strong>structi<strong>on</strong> and engineering exploitati<strong>on</strong>.EGR I11 occupies an intermediate positi<strong>on</strong> betweenthe EGR I and EGR 11. The difficulty Oferectinq enqineerihg structures is c<strong>on</strong>nected withrelatively high permafrost temperature, presenceof cryopegs with hydrostatic pressure and at the
low plain flood lands with flooding of the surface.The absence of salinity soils to the'depth4-5 metres and sheet ice to the depth 10 metresare favourable factors for c<strong>on</strong>structi<strong>on</strong>.Nature protecting measures include a number ofactivities providing structural stability of soilunder the foundati<strong>on</strong>rs according to principle I(preserving soil in permafrost .-c<strong>on</strong>diti<strong>on</strong>). Themost characteristic four types of engineeringstructure8 c<strong>on</strong>sidered are:I) apartment huildinga and industrial structures;11) gaa pipeline (gas transportati<strong>on</strong> with subzeroaverage annual temperature is being planned):111) embankments of linear structures;IY) above-ground pipelines <strong>on</strong> piles.For each type of ntructurea the maximum poasiblechangee of geocryological c<strong>on</strong>diti<strong>on</strong>s (depthof seas<strong>on</strong>al thawing, average annual temperatureof pemafrost) and engineering loads (types of engineeringdisturbances) are given here which naycanse the change@ in tolerance limits of engineeringgeocryological c<strong>on</strong>diti<strong>on</strong>s. The increase ofsoil foundati<strong>on</strong> temperacure and active layerthickness even in area8 most suitable for buildingc<strong>on</strong>structi<strong>on</strong> areas of EGR I, is not permittedfor apartment and industrial buildings. This canbe explained by the fact that mils are salineand the rise permafrost temperature to -4OC andmore will transform soils from solid into plasticfrozen state.The increase of active layer thickness maylead to the formati<strong>on</strong> of impoundments under build-ings and structures, thawing a€ soils and loss ofstructural stability. At the sites with averageannual temperature of permafrost higher than -4'C(EGR XI,. III), it is necessary to diminich thefoundati<strong>on</strong> soil temperature to its transformati<strong>on</strong>into solid frozen state. To prevent the slidingaf solids an the slopea (EGR If) it's neceraaryto decrease the thickness of the active layer.Under c<strong>on</strong>structi<strong>on</strong> and maintenance of structuresfor types I1 and 111 the necessary temparaturec<strong>on</strong>diti<strong>on</strong>s of foundati<strong>on</strong> soils are providedby the structure of the building it..self (roadand railway embankments) or by accepted temperaturemaintenance behaviour (gas pipelines withsubzero temperature of gas).For the structures of type IY - above groundpipelines an pilea, the sites with saline soilswith temperature higher than -4'c (EER If) areunfavourable. Such sitee need to diminish thefoundati<strong>on</strong> soils temperature for 3 - -4'c andkeep the temperature c<strong>on</strong>diti<strong>on</strong> of soils duringthe operati<strong>on</strong>al period with the urse of seas<strong>on</strong>alcooling devicsr. At the sites of EGR IXI with annualaverage temperature of permafrost higherthan - 4OC, the additi<strong>on</strong>al decreasing of soiltemperature is not needed since 4-5 m depth thesoils are not saline and are in solid permafroststate.The above menti<strong>on</strong>ed requirementa ofgeocryological character are reached by fulfillingnumber of engineering practices directed tothe regulating temperature behaviour of foundati<strong>on</strong>soils and which depends <strong>on</strong> the type of engineeringsites and geocryological situati<strong>on</strong> atthe c<strong>on</strong>structi<strong>on</strong> site. The main methods of thesoil temperature preserving are the providing ofvented space under a building and placing ofcoolingpipes and channels in foundati<strong>on</strong>s of structures.The choice of the method is baaed <strong>on</strong> thethermal engineering calculati<strong>on</strong>s for specific. sites.The c<strong>on</strong>structi<strong>on</strong> of underground pipelines withsubzero annual gas temperature and embankment8 oflinear structures do no+ need special acti<strong>on</strong>s forthe regulati<strong>on</strong> of temperature of foundati<strong>on</strong> soils.From the point of view of dangerous engineeringgeological processes <strong>on</strong> the territoriee closeto engineering structures, the most complex activitiesare needed for EGR 11. Active layerslides, which are widely apread <strong>on</strong> alapes innatural c<strong>on</strong>diti<strong>on</strong>s, may become more active underc<strong>on</strong>structi<strong>on</strong> development of the area. To preventthe development of thia process it ia recommendedto make earth fills of 1.2-1.5 m of height at thec<strong>on</strong>structi<strong>on</strong> siter and adjacent territory, toform a good water overflow, to c<strong>on</strong>struct a permafrostbarrier. Within the limits of EGR I1 andEGR 111, the main activity is directed to preventthe increasing or dacreasing of permafrost .temperature. The main problem here is to providefree drainage of ground water at the c<strong>on</strong>structi<strong>on</strong>cites, organizati<strong>on</strong> of drainage stmctures, maximumlimitati<strong>on</strong> of transport across the tundra insummer. EGR I11 requires also the preventi<strong>on</strong> offormati<strong>on</strong> of snow driftrs.The set of activities providing stability ofengineering structures and preventing the developmentof engineering geological processes in differentengineering-geocryologipal regi<strong>on</strong>s aregiven in a special table in the mapla explanati<strong>on</strong>.These are c<strong>on</strong>nected with the rrcheme ofnatural micro-regi<strong>on</strong>s by comm<strong>on</strong> figure indexes ofngtura protecti<strong>on</strong> activities.The map, made <strong>on</strong> the bwin of the givenmethodology c<strong>on</strong>tain the infomati<strong>on</strong> necessary foroptimal locati<strong>on</strong> of epwcific engineering sites,development of nature protecti<strong>on</strong> activities andrati<strong>on</strong>al use of geological envir<strong>on</strong>ment. Theyserve aa a cartographic basis af engineeringgeocryological m<strong>on</strong>itoring.
EXPERIMENTAL STUDIES ON ICE SEGREGATION AND THE MODES OF FROST HEAVINGChen Ruijie' and Kaoru Hofiguchi''State Key Laboratory of Frozen Soil Engineering, Lanzhou Institute ofGlaciology and Geocryology, Chinese Academy of Sciences, China.21nstitute of Low Temperature Science, Hokkaido University,Sapporo, JapanFrost heave rate of freezing soils has been paid close attenti<strong>on</strong> t;, andnumerous theoretical and experimental studies have been d<strong>on</strong>e since the beginningof research <strong>on</strong> freezing soils in cold regi<strong>on</strong>s. The temperature gradient acrossthe warm side of the ice lens has l<strong>on</strong>g been c<strong>on</strong>sidered as the driving force ofwater flow, and the existance of a frozen fringe has been thought of as adefin-iteness and used as a banis for further research. Some experiments werecarried out in which ice lens grew without temperature gradient in the soil. Thecomparis<strong>on</strong> between ice intrusi<strong>on</strong> temperature and equili,brium temperatureindicated that the frost heaving occurred under general c<strong>on</strong>diti<strong>on</strong>s (loose soilin natural field) usually is primary heaving.INTRODUCTIONSince Miller's putting forward the c<strong>on</strong>cept offrozen fringe, it has been accepted and usedwidely, and most of ice segregati<strong>on</strong> processeshave been dealed with <strong>on</strong> the basis of the theoryof sec<strong>on</strong>dary heaving. The existence of frozenfringe in frost heave process be seldom suspected,though it has hardly been observed up to now.And the temperature gradient in the frozen fringehas.been c<strong>on</strong>sidered as the driving force ofwater flow toward the ice lens.Frozen fringe is a thin z<strong>on</strong>e of frozen soilfrom the growth edge of-the ick lens to O°Cisotherm, according to Miller's theory (1978).K<strong>on</strong>rad and Morgenstern (1980) got a theoreticalc<strong>on</strong>siderati<strong>on</strong> for <strong>on</strong>e - dimensi<strong>on</strong>al frost heavewithout externally applied load, which was thatthe water intake flux is proporti<strong>on</strong>al to thetemperature gradient in the frozen fringe. Asearly as 1974, however, Vignes carried out amodel experiment by using glass tube andc<strong>on</strong>firmed that frost hea e rate is a functi<strong>on</strong>of the ice-water meniscua temperature and js *independent of the teeperature gradient of theunfrozen part al<strong>on</strong>g the capillary. Besides,Ishizaki,et al., (1985), performed frost heaveexperiments and obtained a linear relati<strong>on</strong>shipbetween water intake rate and the warm sidetemperature of the ice lens, Ozawa, et al.,,(1980), used micropore filter in the experimentsand had the ice grow <strong>on</strong> it, and also obtainedthe same results with lshizaki (1985), althoughthe experiments arc different in form. Horiguchi(1992) analyzed the frost heaving processtheoretically, wrote out the water and heat flowequati<strong>on</strong>s during ice segregati<strong>on</strong>, and obtainedthe linear dependence of water intake rate <strong>on</strong>segregati<strong>on</strong> temperature.So far, however, most of the researchersthought that water intake ,in the forming of icelens necessarily results from the temperaturegradient in the frozen fringe. Hence, we carriedout an experiment in which the temperature ofthe soil sample keeps homogeneous in ice segregati<strong>on</strong>process. More over, it becomes probable tomake cleat' the occurrence of the modes of frost:heaving by comparing ice in-trusi<strong>on</strong> temperatureand equilihrium temperature.EXPERIMENTS AND ANALYSISThe apparatus uscrl in the experjments isdiagrammed in Fig.1, the soil sample used isFujino Mori clay, its grain size distributi<strong>on</strong>is showed in the paper ahout ice intrusi<strong>on</strong>temperature.GTFig.1 Apparatusthat of the ice intrusi<strong>on</strong> experiment except thatThe experimental procedure bas similar tothe screw lid not be used here. Af!:er seeding atthe bottom tube, ice advanced to the bottom o€the soil sample, and ice lens formed here. Thewater lev,eI in tube GT was observed decreasinggradually.
'FiglZ and Fig.3 are the diagrammatic sketchof the experiments.c0-81sSKwx\\\\\\ \\\ \ \ \\\IbI.?bTf9, e,> 0,wndaty havingFig.2 Diagrammatic sketch of the ice segregati<strong>on</strong>in the experimentPig.4 Analysis of the modes of frost heavingc<strong>on</strong>fined pressure (see this proceedings, Chen,et el.).nAPIII .I \Fig.3 Temperature c<strong>on</strong>diti<strong>on</strong> of the experimentTb - buth temperature:Tf - warm side temperature of the ice lens,that is, ice segregati<strong>on</strong> temperature.Because of releasing of latent heat in formingof the ice lens, ice segregati<strong>on</strong> temperatureTf probably be slightly higher than the surroundingtemperature Tb. It indicated that the temperaturegradient <strong>on</strong> the side of water supply isin reverae to that of the so called frozenfringe. Tf though the latent hiat released isnot enough to make temperature Tf higher thanTb, Tf is equal to Tb at least. Then no temperaturegradient exists in the side of water supply.Now, measuring ice segregati<strong>on</strong> temperature Tfaccuratly is still a difficult problem. But in aword, temperature gradient and frozen fringe arenot always necessary in the forming of ice lens.Fig,& is a sketch map about the mod.es offrost heaving achieved by comparing ice intrusi<strong>on</strong>temperature with equilibrium temperature, accordingto the definiti<strong>on</strong> of ice intrusi<strong>on</strong> temperaturein the paper (see this proceedings). Whenthe ice intrusi<strong>on</strong> temperature Bi of a given soilis lower than the equilibrium temperature Bewhich comes from Clausius-Clapyrom equati<strong>on</strong>, icecan not intrude forwards to form pore ice in thegrowth side of the ice lens. The frost heavingthen be primary heaving, and no frozen fringeexists. Otherwise, the ice can intrude forwardsin the growth side of the ice lens to form poreice, frozen fringe, if the ice intrusi<strong>on</strong> tern- 'perature 8i of the soil i,s higher than theequilibrium temperature Be. And the frost heavingthen be sec<strong>on</strong>dary heaving.Tf and Tc is the ice segregati<strong>on</strong> temperatureand cold side temperature of the soil respectively.Fig.5 is the relati<strong>on</strong>ship between ice intrusi<strong>on</strong>temperature and c<strong>on</strong>fined pressure, thepotted line drawn up comes from Clausius-Clapyromequatipn. The curve represents change of ice+ntrusign temperature of silt or clay withFig.5 Analysis of the modes of frost heavingFor a given soil, if the cgnfined pressure4P reaches a critical value Ap, the ice intrusi<strong>on</strong>temperature 8i of it will be eqyal to the equilibriumtemperature Be. If PP
segregati<strong>on</strong> temperature:then, from equati<strong>on</strong>(l), we get:Comparing c<strong>on</strong>stan~s h and B which representsthermal and hydraulic c<strong>on</strong>diti<strong>on</strong> of the systemrcspcctively, we get three kinds of situati<strong>on</strong>sas follows:1) B >> AT t indicates that water intnke rate is c<strong>on</strong>trolledby thermal c<strong>on</strong>diti<strong>on</strong> of the system(Ozawa, 1989).2) H i< AB -"A+U - n
The Rclati<strong>on</strong>ship between Ice Intrusi<strong>on</strong> Temperatureacd C<strong>on</strong>fined prcssureChen Ruijie' and Kaoru Horiguchi'' State Key Laboratory of FTOXn Soil Engineering, Lan Zhou Institute of Glaciologyand Gcocryology ,Chinese Acadcrny of SciencesInstitute of Low Tempcrature Science,Hokkaido Univcrsity,Sapporo;JapanIce intrusi<strong>on</strong> tcrnperature is a temperature near and below OC at which the freezing ofpore watcr can advance c<strong>on</strong>tinuously with no water migrati<strong>on</strong>, and unfrozen water c<strong>on</strong>tentand hydraulic c<strong>on</strong>ductivity of thc soil decrease sharply at it. Thc cxperiments indicatcdthat ice intrusi<strong>on</strong> ternperaturc decreases with incrcasc of the c<strong>on</strong>fined pressure,that is, there are diffcrcnt ice intrusi<strong>on</strong> tcmpcrature for different pore size because ofdifferentdegrcc ofcompressi<strong>on</strong>,WTRODUCTIONIn cold regi<strong>on</strong>s, the downward freezing of soil surhcc,whcn winter corning, usually is not duc to ice nucleati<strong>on</strong>with occurrance of supercooling, but due to icc intrusi<strong>on</strong>.Thercforc, ice intrusi<strong>on</strong> temperture is a tctnperature whichdiffers from the stablc frcczing ternpcraturc aftcr supercoalingprocess and its dependcce <strong>on</strong> c<strong>on</strong>fir~cd prcssurc is significantfor study <strong>on</strong> thc proccss of icc scgrcgati<strong>on</strong>, cspccially<strong>on</strong> the modes of frost hcaving. Thc ficczing of fttcc watcrcan advance at about OC as wcll known. 7'hc frccing ofpore water, however, advance <strong>on</strong>ly at a tcmpcrature below0% , according to thc pore size because of adsorpti<strong>on</strong>. For agiven soil, different pore size resp<strong>on</strong>ds to difkrent c<strong>on</strong>finedpressure. The relati<strong>on</strong>ship between ice intrusi<strong>on</strong> temperatureand c<strong>on</strong>fined pressure wdS obtaincd through ice seedingat the bottom of the soil.A little watcr was put inside the cylinder holder firstand the rubber tube FT was stopped up by a stopper to assurethat no air bubblc exist in bore hole F. An air-free porousplate N1 was then put <strong>on</strong> thc bottom plate in the cylinderholdcr and adequate amount of slurry of the soilsample was put <strong>on</strong> thc porous platc. Afterwards ,the topplatc N2 was pushcd into the holder and thc excess waterrnovcd up into thc tubc GT. 0 ring was used for sealing upthe holder. Certain amount of load was used <strong>on</strong> the topplate C to comprcss thc samplc Tor cnough l<strong>on</strong>g time untilthe water lcvcl in tubc GT did not move. Then the lid Dwas screwed down to fix top plate C, and the laad wastaken away.APPARATUS AND MATERIALSThc apparatus uscd is diagrammcd in Fig.1, bras cylindcrA is c<strong>on</strong>nected with bottom alatc R in which thcrc is aborc holc F, 2 mrn in diamctcr, c<strong>on</strong>noctcd with a rubbcrtuhc FT. There is also a bore holc in thc ccnfcr of thc topplatc C, which is c<strong>on</strong>ncctcd with a rubbcr tube GT. Lidcan bc screwcd down al<strong>on</strong>g thc cylinder ta prevent plate Cfrom moving upwsrd. It means that soii samplc S, can bec<strong>on</strong>fined in the cylinder with certain pore size.The materials used in the expcrimcnts are CorundumA (3-7 pm), Corundum B (24 pm)? Fuiino Mori clay C,Alluvial clay 13 and Manaitabashi clay E. Fig.2 and Fig.3 isthe diagramm of particle size of Corundum A and Brespcctivcly. Fig.4 is the grain size distributi<strong>on</strong> of all matcrialsuscd.s I IICE INTRUSION EXPERIMENTSA cold liquid buth was uscd and c<strong>on</strong>trolled at a temperaturcnear and bclow OC , and its temperaturc wasmcasurcd by standard thcrmomcter.Fig. 1 Apparatus
The apparatus prepared was immersed in the cold liquidbuth which was c<strong>on</strong>trolled at -0.1C. A small length oftube GT was left outside of the buth so that the water levelin it could bc observcd. Tubc FT was then seeded by puttingit in liquid nitrogen after about 24 hours. The ternpcratureof the cold liquid buth was lowered by -0:lC step bystcp, and it was observed that thc water levcl in tube GTmarched a grcat dcal abruptly at ccrtain tcmperaturc. It indicatcdthat thc sccding icc had intruded into thc soil, thatis, ice intrusi<strong>on</strong> occurred. 'I'hc tcrnpcraturc showcd by thestandard thcrrnomctcr is thc icc intrusi<strong>on</strong> tcmpcraturc ofthis soil undcr givcn c<strong>on</strong>fined prcssurc. ,8'is5.360504c," 3002 2c!3z 100 IlL5 10 15 20 25Diameter of particle(pm)0.001 0.01 0.1 1Grain sizeFig.4 Grain size distributi<strong>on</strong>Fig.2 Particle size distributioaAIce intrusi<strong>on</strong> temperature ("C)Ii 00 1 2 3 4 5 6 7Diameter of particle (pm)Fig.3 Particle size distributi<strong>on</strong>P8xPore radius (pm)Fig.5 Relati<strong>on</strong>ship between ice intrusi<strong>on</strong>Temperature and c<strong>on</strong>fined pressure '
RESULTS AND DISCUSSIONThe Experimental results of thc rclati<strong>on</strong>ship betweenicc intrussi<strong>on</strong> temperature and c<strong>on</strong>fined pressure of the materialswere showcd in Fig.5 Curve A, R, C, D, and E represcntsCorundum A ( 3-7 pm), Corundum R ( 3-7 py),FujinoMori clay, Alluvial clay and Manahbashi clay ,.,rcspcctivcly. It can bc found that for fine soil, such asFujinoMori clay and Alluvial clay, thc icc intrusi<strong>on</strong> tcm- IPCrdtUrC dccreascs with incrcasc of thc c<strong>on</strong>fincd prcssurc.Thc icc intrusi<strong>on</strong> tcmpcraturc of cnrsc particlcs, such asCorundum, almost kccps c<strong>on</strong>stant with incrcasc of c<strong>on</strong>finedprcssurc, that of Manaitabashi clay, howevcr, showsrclativcly low valuc compared with other samples, becauseof its fineness, though there is <strong>on</strong>ly <strong>on</strong>e point obtained.Assuming that the freezing frant at each pore shows ahemispherical meniscus, thcrc will be a depress of thc freezingpoint. This depress corresp<strong>on</strong>ds to ice intrusi<strong>on</strong> temperature.The right hand axis in Fig.5 is pore radius calculatedfrom the following equati<strong>on</strong> which corncs from theClausius-clapyr<strong>on</strong> equati<strong>on</strong> and Laplacc equati<strong>on</strong>:in which r,, and 0,respresents pore radlus and ice intrusi<strong>on</strong>temperature, respectively, To, pi, and L respresents meltingpoint of ice, density of icc and latent heat of melting ice,rcspcctivcly.It can be found that thc pore radius dccrcascs with in+crease of c<strong>on</strong>fined pressurc for fine soil. That is, ice intrusi<strong>on</strong>temperature of fine soil decreases with decrease of poreradius. The two kinds of come particles, i.c, Corundum Aand B, keeps c<strong>on</strong>stant because it is almost incomprcssibleand its pore radius keeps almost unchangc with change ofc<strong>on</strong>fined pressure.REFERENCESKaoru Horiguchi 1989 Short Rcport: Relati<strong>on</strong>ship betweenC<strong>on</strong>fined Pressure of a Sample and Ice Intrusi<strong>on</strong> Temperature.Low temperature Sciencc,Ser.A,48.1069
PRELIMINARY TESTS OF HEAVE AND SETTLEME.NT OF SOILS UNDEIiC~OTNOONE CYCLE OF FREEZE-THAW IN CLOSED SYSTEM ON A SMALL C1ENTRIFUC;E
thouswd dayFig.5. Modelling of tuodels for prototype sand (2m) at lOOg and Z ~ levels JFIW dmost the same for the same soil. These facts indicate thatcc.mtrifug;c modelling of frost hcavr and thaw induced settlcment ofsoils is fcnsible if careful attenti<strong>on</strong> is paid to c<strong>on</strong>trolling the c<strong>on</strong>diti<strong>on</strong>sa d motlcl prcp;lratioll. Om can also fi11d from the figuresthat frost heave of china c1a.y is much larger (ncarly 1.5 times) thrtmthat of smd wihh the same thickness (2m), which can be mainlynt,trihuted to the larger wrttcr c<strong>on</strong>tcnt (0.93) in the forrncr thanthat (0.32) in tho latter.It is very interesting to observe in these tests that thaw inducedst.ttlement of sand are different from that of china day. Settlementof s a ~ is d almost qual to its heave, while that of china clay (slurryhefore freezing) is ncnr to twice its frost heave, and ils might hccxpctcd I,csulted iu a significnnt, hndy of water <strong>on</strong> the surface oftl~cllino. clay Irlodcls <strong>on</strong> completi<strong>on</strong> of the tcsts. A similar findingP:I.II 1-w S~CII ill kaolin (Fig.3). This fact indicatcs that freezingcscrts a clesiccating effect 011 clay to some extcut similar to thatI'r1~1::ci in frcczc/tllaw treatment of orgn.nic vwer sluclgc.On coIrlparing Fig.4 with Fig.5, it is seen that frost heavc ratio(frost heave amount to original soil thickness) of sand is less thanthat of clha chy for thc samr dimcnsi<strong>on</strong> (thick 2m) significantly,t111tl tllat tho hcave rato for sand changes from a slow to a sharpintrra.so and talm ahorlt 700 days (prototype equivalent) to reachits hcwr pdc, 011 the otllcr l ~ud, the latter (1.83mm/day or so)incretrscs almost c<strong>on</strong>stantly except during the very initial sta c,;mrl ils tlurati<strong>on</strong> of hravu is little l<strong>on</strong>gcr-ahout 975 days. For &etllaw inclucecl settlement patterns, s11nc1 differs from china clay. Tl~emtc of t,ho forlner cl~angcs from slow to very fmt, wllile the lattertlccrcast:~ ppdm~lly. Thc durati<strong>on</strong> nf scttling, however, is very closeIiloagll tllat of sand is slight,ly shorter (880 days for snnd and 910days for cllirlit clay).
, -011 comparing frost he;l.vc of the same soil at diffetent g-levels,it CXTI be seen that the henvt: ratio slightly decrcmes with increaseof g-lcvc~. Fur example, thc ~ w ~ ratios v e uf cllina c~ny are 9 andS.4 'X ut 100~-level and 200g-lcvc1, resprctivcly, (from F$4.). Thcstme trcnrl can be found for sand in Fig.5, Fig.6 and Ig.7, andfor silt in Fig.8 and 9. This fact indicates that g-level may hassome suppressina effccts OII frost l~cavc, that is, the greater the g-level, the slightly less t,he frost heave in closed systcrn. Howevcr itt n q be possible to attributc this to the radially varyiIlg g-field ofthe wnttifugr, which rimy hc significant yrt~icularly in this sn~allwntrifugc. Trsts urldcrtdxw i u largcr Inac lme may be less affected.% Fig.8. Heave and settlement UP Fig.9. Heave and settlement ofprolatype silt (2.5m)prototype silt (8.2m)Silt umlcrlfoes the 1;ugrst m;lglrit,tlde of frost heavc, as showrl.it1 Fig.8 and Fig.9. In thc fnrmcr the frost hcave ratio rcaches 6.8'X' ant1 ill t.1~ latter that is INWC tu 7 (K, drubst close to that ofchills clny ill which, l~owc~vc~r., watcr c<strong>on</strong>tcnt (0.03) is larger thant,hat (0.30) ill silt.To frccac a prototype rrp~ivdent. silt. layer of thickness 8.2m1let:ds more t,hn 9 years at a t,enlperatrlrc -15"C, to drfreeze it,howrver, last,s about more than 13 years if temper:tt,ure <strong>on</strong> the soilsurface itlcreitSes from -WC to +~P,~C' in ;lpproxinintely <strong>on</strong>e yearand is tlwl kcpt c<strong>on</strong>stant. To freczr silt of thickness 2.5m needs1.5 ycars tit B temperature -16"C, <strong>on</strong> ther other hand, to defraezeit liLst,s almost 2 years, according to the centrifuge modelling ofprotoype soil. One can find the freezing and thawing time for prototypechinn clay and sand in Fig.4, Fig.5, Fig.6 and Fig.7.The resu1t.s indicate that g-level does not appear to have obviousinflurnct: <strong>on</strong> patterns of frost hcave and thaw induced settlcmentof the same soil, a.9 shown in Fig.8 and 9; in Fig.4; in Fig.5, 6 and7.It sllould be noted that the frost heave ratio for testcd soilsseems lnrger for a clused system whcn their water c<strong>on</strong>tents are takeninto account. The frost heave of soil in cluued system is mainlyatt,rilnted to its water c<strong>on</strong>tent. If it is assulncd to be purely due't,o tlw cxpn.nsiou of watcr as it forms icr then tho expected heaver21,(,io is: WG x0 01 . 111 theso tests, however, the heave ratio of silttc:a&s 7% (expccted 4.4%) with water c<strong>on</strong>tent 0.3% that of clhaclay is about 9% (expecttd 6.4%) with watcr c<strong>on</strong>tent 0.93; that ofkaolin gets 6% (cxprcted S.S%) wit,h water crrritent 0.7; and tha.t ofsmd is proxinmtely 3.4% (expected 4.1%) with water corltent 0.32.'111~ rcsmn arc not char : d sho~~lcl I w furthrr investigatctl.CONCLUS1C)NSFroln tllc ;how! sotne 1)rclirninwy coldusi<strong>on</strong>s call LC presented.a). It appears possihlc to model frost hcavt: and thaw il~rlllcedsettlerneent of prototype soils accura.t,ely in small centrifuge, andthus by extrapolati<strong>on</strong> in large centrifuge, with time scah as N'ttnd displacement (heave, setticmmt) as N. This certain$ warrantsfurt,her investigat,i<strong>on</strong> and if substansiated will dem<strong>on</strong>stratetllc ccntrifuge to bc a useful tool for the invcstigati<strong>on</strong> of prototypefrost 11eavc and thaw induced scttlctnrnt prohlcmu in shortenedtinc sca1r.a.b), An incrcwsing g-levo1 tqqx:ars to have s<strong>on</strong>w suppressi<strong>on</strong> cffcct<strong>on</strong> frost hcavr of soils, i.c. frost ht:avc decreases very slightlywith increase of g-level. Howcver this may he due to the limitatinusof tlw g-fieltl in tlle snl;lll wntrifuge used md nccds furtlwrinvcstigati<strong>on</strong>.c,). Thc g-level docs not appmrs to have an olwious infinenre<strong>on</strong> patterns of frost henvr and tlmw induced settlsment.(1). Edge fricti<strong>on</strong> hstween soil nlodel side and model coIlt,zinersi& does not. Rppears t,o have it11 significant cffcct <strong>on</strong> frost hca.vrwhctl c<strong>on</strong>tainer sides are well grcasrd.e). The frost heave rat,ios of tested soils in closed system seemlrlrger than would he expcctcd fwnl calculat.i<strong>on</strong>s based <strong>on</strong> the waterc(.)lltcnt nlune.f). A slmll centrifuge of the typc used has boen shown to ha.vcLL vcry useful cnpaMity for perfurIning initid investigati<strong>on</strong>s to testtllc feasibility uf certain c<strong>on</strong>cepts relatively quickly and at a lowcost. The results show that further work <strong>on</strong> larger (more expensive)rnachine is wort,hwhile in this firld.ACKNOWLEDGEMENTSThe authors would like to thank the staff of the GmtcrhnicalCcnttifuge Centre of C~rnbridge University Engineering Dcpartmeritantl ANS 95 A for their kind help, especially Dr. R Phillips,N Baiter. Thc first author wislws to express his sincere gratitudrt,o his sn1)crvisor Professor A N Schofield for his very valuable adviceancl kimlIlrss, nncl to Dr. M D Bnlt<strong>on</strong> for his much appreciatedhelp and nominati<strong>on</strong> of the first nuther a Fcllow Cummorlcrshipin Churchill Collcgc Canbridge which offcred llim the postfnr 1992/93 with accommodati<strong>on</strong>, facilities and etc. And finally,thr first author is very grateful to Sir Y IC Pm Foundati<strong>on</strong> (H<strong>on</strong>gIC<strong>on</strong>g), the Cllinese Government and thr Britidi Council for theirfinancial aids.REFER.ENCESAndcrs<strong>on</strong>, D M, and Pcnner, E (1978) Physical nnd therrnalproperties of frozen ground (pp37-102); in: Geotechnical cngineerinfor cold regiorls.Iictcham, 8 A (1990) Applicati<strong>on</strong> of centrifuge tcsting to coldregi<strong>on</strong>s geotecllnical studics (internal Report of USACRREL).L~Iillcr, R I) (1OSO) Frcczing phenolnetla in soils (pp254-299); in:In applicati<strong>on</strong>s of soil physics.Nix<strong>on</strong>, .7 and Ladanyi, B (1978) Thaw c<strong>on</strong>solidati<strong>on</strong> (pp164-215);in: Geotrchnical engineering for cold regi<strong>on</strong>s.Palmer, A C, Srhofield, A N, Vins<strong>on</strong>, T S and Wadhams,P (1985)Centrifuge modclling of underwater permafrost and sea icc;Proc 4th Int. Offshore Mechanics and Arctic Enfirieoring Symposiium.Texas, Vol. 11, (pyGC9). ,Schofield, A N (1980) Cambric #e gcwtechnlcal ccl-ltrifuge opcrittiuns;Twentieth R.anltine Lvrture, Geotcchnique. (pp227-263).Sclltsficltl, A N ;Inrl Snlitll, C c' (1993/4) Cold Rrgi<strong>on</strong>s Eugineeringin: Gcotc:chnical centrifugc technology. cd. h'. TaylorSmith. C: C (1991) Thaw induced srttleInent of pipeline in centri-. fugc model t,ests; P11.D. disscrtati<strong>on</strong> of Camlxid c. University.Vinsnn, T S antl Ptllrnrr, A C (1DSS) Physical mode? study ofartic pipline setfletnrnt; Proc 5,th Int. C<strong>on</strong>f. <strong>Permafrost</strong>.Tr<strong>on</strong>dhcim. Vo1.2, (pp1324-1329).1072
FROST SUSCEPTIBILITY OF POWDERED CALCIUM CARBONATEChen Xiao-bail, Corte A.E?, Wang Ya-qing' and Shen yu''Lanzhou fnst, of Glaciology & Geocryology, Academia Sinica, Lanzhou, China'Regi<strong>on</strong>al Investigati<strong>on</strong> Centre of Sciences & Technology, Mendoza, ArgentinaFrost susceptibility tests of a powdered calcium carb<strong>on</strong>ate (FCC), collected fromthe Andes Mts near Mendoza, Argentina, were c<strong>on</strong>ducted both in closed and.opensystems, Experimental results show that an ice segregati<strong>on</strong> and c<strong>on</strong>sequently anice lens and str<strong>on</strong>g frost heave could occur in FCC while rich in moisture. Thefreezing point Tf('C) of PCC mainly depends <strong>on</strong> the moisture W ( X ) with a functi<strong>on</strong>of Tf=-Sl99.62 W-3*27'. The frost heave rate of PCC R (mm/day) in a closedsystem increases with its water c<strong>on</strong>tent W(%) intensively while W>17%. In anopen system, the frost heave ratio O(Z) decreases sharply with the frostpenetrati<strong>on</strong> rate Vf(cm/day), and its regressi<strong>on</strong> equati<strong>on</strong> is rl=4,495 VT'*'P9.AS a result, the frost susceptibility of PCC is very similar to that of clayeysoils. After moisture was c<strong>on</strong>trolled or mixed with a special agent, the PCCcould be very light or not frost susceptible and then could be used as amaterial in subgrades or base of buildings.- INTRODUCTIONEXPERIMENT RESULTS AND ANALYSESPowdered calcium carb<strong>on</strong>ate is rich in coldand arid areas, such as in the Padag<strong>on</strong>ia regi<strong>on</strong>sand Andes Mountains in Argentina, as well as inTaishan Mountains area of China. Up to now, alot of ancient buildings or structures in Chinaremain unchanged because of stabilized basesmixed with powdered lime. At present, the limestabilizer is widely used as an anti-heavecushi<strong>on</strong>s in China.The purpose of this paper is to determine thefrost susceptibility of PCC collected from theAndes Mts near Mendoza, Argentina and to find away of using it as a c<strong>on</strong>structi<strong>on</strong> material.EXPERIMENT COUDITIOBSFreezing PointThe experiment results showed that the freezingpoint <strong>on</strong>ly depends <strong>on</strong> the moisture. Fig.1illustrates the relati<strong>on</strong> curves of the poweredcalcium carb<strong>on</strong>ate. After regressi<strong>on</strong>, the curvefuncti<strong>on</strong> can be expressed by:Tf=-S199.62 W-3'274, rm.943 (1)T.(C 1The samples of FCC, collected from the AndesMts near Mendozs, Aryent.i.na were less than 1 mmin size. The freezing point was determined bythe supercooling method with various waterc<strong>on</strong>tent. - For the .f,rost susceptibility test, thessmples with a given density and moisture wereput in plexiglass cells, 11 cm in diameter and2 cm in height. A thin grease layer and amembrane were set up between the surface of thecells and samples in order to reduce the fricti<strong>on</strong>resistance. The cells were surrounded byinsulati<strong>on</strong>. The multi-stages of temperat.ure atthe surface and the bottom of the samples werec<strong>on</strong>trolled by cycle' refrigerator baths with asensitivity of ?O.O2"C and an accuracy of tO.l"C.The temperature and the displacement of sampleswere determined by thermocouples and displacementgauges and were collected by HP 305L-SAutomatic Data Acquisiti<strong>on</strong> and C<strong>on</strong>tra1 System.For an open system, tht. distilled water wassupplied from the sample bottom towards thefrost fr<strong>on</strong>t from a special reservoir with ac<strong>on</strong>stant water level. After testing, thessmples were cut into pieces for observati<strong>on</strong> of.ice segcegati<strong>on</strong> and measurement of the moistureprofiles al<strong>on</strong>g the depth.Fig.1 Freezing point of PCC vs water c<strong>on</strong>tentin where, Tf - freezing point of PCC, 'C:V - water c<strong>on</strong>Fent of samples, X :r -,?orrelati<strong>on</strong> coefficient.Frost SusceptibilityThe results of 5 groups 3f frost susceptibilitytests for the PCC with different water c<strong>on</strong>tentand almost the same density, as well assame boundary temperature, are listed in Tablel,In which, sample CC-I. is in an open system, The1073
Table 1. The results of frost susceptibility tests <strong>on</strong> powdered CaCO,under different water c<strong>on</strong>diti<strong>on</strong>scc-1 126 1.62 25.51 -.13 22.58 lWLh 4.35openCC-2. 78 1.62 25*76 -.13 10.11 *3.11 closedcc-3 98 1.63 19.80 -.30 7.031.72 closedcc-478 1.62 15.15 -.71 0.270.08 closedcc -5 94 1.59 17.97 -.41 1.06 0.27 closed*t - elapsed time; h - frost heave; Q - water intake,frost heave and water intake processes are shownin Fig.2. It is obvious that the increase ofheave is resp<strong>on</strong>dent to water intake.Q(4xxl"-4-""""" ""0 '"fl4 \h(m1- I0 20--------- - --I I I I40 60 m a 0Hqrrsd tlina(h.s) *Pig.4 The temperature isothermal line and frostheave process of Sample CC-3O ~ " " " ~ ~ 1 1 l l0 20 49 60 8 o w o mElrpJcd tbne(hs)cc-2Fig.2 The frost heave and water intake processesof Sample C,C-IPig.3 and 4 illustrate the temperatureisothermal lines and heave processes. It isshown thst the heave will reduce with thedecrease of moisture in a closed system."II I L0 20 40 60 80Hrplsd tb(WFig.3 The temperature isothermal line and frostheave process of Sample CC-2Fig.5 is the frost acti<strong>on</strong> profiles of SampleCC-I, CC-2, CC-3 and CC-4 after freezing,respectively. In which a large amount of icelenses occurred in Sample CC-1, 1 to 2 mm inthickness and 1 to 2 mm in interval, bec.ause ofwater supply during freezing (sev l'hoto), frostheave occurred as well. For Sample CC-2 withan'initial water c<strong>on</strong> ten^ oi 25.76%, a s.naI1pingo developed in' the top of ice lenses, 0 .2to 0.5 mm in thickncss and 0.3 to 0.5 mm inFig.5 Frost acti<strong>on</strong> profiles of Sample CC-1,cc-2, CC-3, cc-4interval. For Sample CC-3 with an initialmoiscure c<strong>on</strong>tent of 19.80%, a fine ice crystaldeveloped in the centre of the top and ii fewice 3.enses under the crystal. For Sample CC-4with $111 initial water c<strong>on</strong>tcnt,of 15.15%, therewas <strong>on</strong>ly a thin ice layer 0.2 to 0.5 mm inthickness, which covered the upper surface. Thewater redist-ributi<strong>on</strong> profiles of Sample CC-1,CC-2, CC-3 and CC-4 are illustrated in Fig.6.1074
of the frost penetrati<strong>on</strong> rate as shown in Fig.8and the regressi<strong>on</strong> equati<strong>on</strong> is as EoZlows:in where, 0 frost heave ratio, %;vf - frost penetrati<strong>on</strong> rate, cm/day;Eq.(2) is very similar to that of the authors'earlier works (Chen and Wang, 1983, 1987, 1988).Photo: Ice lensos occurred in Sample cc-I4 liHim)4 13-L------- Ec-2 10 20LP"40 60 80~1802803M]W%)Fig.6 Water redistributi<strong>on</strong> profiles of samplesafter free;..ingFrom Table 1 we also know that the frostheave rate of PCC in a closed system increaseswith the'moisture intensively whi1.e W>lhZ asshown i n Fig.7 which will be useful for c<strong>on</strong>trollingfrost heave by using limited water c<strong>on</strong>tent.Fig.8 Frost heave raiio vs penetrati<strong>on</strong> rate OfPCC in an open systemApplicati<strong>on</strong> of An Anti-heave AgentAs menti<strong>on</strong>ed above, the powdered calciumcarb<strong>on</strong>ate is frost susceptiblc while the moistureis large enough. In order LO use the PCCas a material for subgrades or bases, besldesc<strong>on</strong>trolling t.he water c<strong>on</strong>tent, a special antiheaveagent could be used for reducing the frostsusceptibility. As an example, if the PCC ismixed with a given c<strong>on</strong>tent of a special agentwith a lower cost, the freezing point might dropto -11.37OC. C<strong>on</strong>sequently, this kind of ant.iheaveagent is powerful for changing the powderedcalcium carb<strong>on</strong>ate with str<strong>on</strong>g frost susceptibilityinto a very light or n<strong>on</strong>-frost susceptiblemalerial.PRELTMINARY CONCLUSIONS1. The powdered calcium carb<strong>on</strong>ate collectedfrom the Andes Mts, Argentina is frost susceptihle,and 3 large amount of ice lenses will occurforming pingues when it is rich in moisture;2. After c<strong>on</strong>trolling the moisture or whenmixed with a special anti-heave agent, thepowdered calcium carb<strong>on</strong>ate could be very 1.ighLor n<strong>on</strong>-frost susceptible and then might be usedRS a material in subgrades or bases of buildings.REFERENCESIIQ -"i" I I Ix3 15 x) 25 30W(%)Fig.7'FrosL heave rate of PCC vs water c<strong>on</strong>tentin a closed systemChen, X.R., Wang, Y.Q. et af., (1983) .Influenceof penetrati<strong>on</strong> rate, surcharge stress andgroundwater tab.le or1 frost heave, Proceedingsof VT TCOP, 131-135.Chen, X.B., Wang, Y.Q. et al., (1987) IceseEregati<strong>on</strong> and frost susceptibility 01 sandygravel, Bulletin of sciences, 32(23): 181%-181 5.Chen, X.R., Wang, Y.Q. et al., (1988) Frosthcave model of sandy gravel in open system,Proceedings of V ICOP, 304-307.For Sample CC-1 in an open system, the frostheave ratio decreases sharply with the increasc1075
Comparis<strong>on</strong> of Two Ground Temperature Measurement Techniques at anInterior Alaskan <strong>Permafrost</strong> SiteCharles M. Collins. Richard K. Haugen, andTimothy 0. HorriganUS Army Cold Regi<strong>on</strong>s <strong>Research</strong> and Engineering LaboratoryHanover, Kew Hampshire 03755-1290Two temperature measurement systems, aremoved each time a series of readings was made.string of Chinese-fabricated mercury thermometersFor statistical analysis, we grruped theseand a thermistor assembly, were installed in depths into three z<strong>on</strong>es: the upper 1.2 m, theadjacent bnreholes drilled in fine-grained, peren- middle range from 2.1 m dowa to 4.5 m, and thenially frozen silt. The Chinese thermometers were lower Erom 6.0 m down to 10.0 m. During the summerprovided by the Chinese Academy of Railway Sci- m<strong>on</strong>ths of 1988 and 1989 (Fig. l), the thermometersences, LFzhou. The thermometers read to 0.1 "C, yielded higher readings (as much 1.5 as 'Cand were supplied with correcti<strong>on</strong> tables also to higher). C<strong>on</strong>versely, during the winter m<strong>on</strong>ths, th0.1 'C. The thermometers were assembled into a thermometer readings were lower. The pattern oflinear string to replicate, as closely pos- as seas<strong>on</strong>al differences was not evident during thesible, the thermometer strings that are comm<strong>on</strong>ly final year of the test evaluati<strong>on</strong> (1990). In theused in China for m<strong>on</strong>itoring ground temperatures. middle z<strong>on</strong>e (2.1 m through 4.5 m), the pattern wasThe sensors were installed at the Caribou-Poker similar, warmer during the warmer m<strong>on</strong>ths, andCreeks <strong>Research</strong> Watershed in interior Alaska (65' slightly cooler during the cooler m<strong>on</strong>ths. The10' latitude, 147" 30' l<strong>on</strong>gitude). The thermom- warmest period of the year at this z<strong>on</strong>e occurseters were placed at the surface and -0.6, at during the late fall. The thermometer readings for-1.2, -2.1, -3.0, -4.5, -6.0, -9.0, and -10.0 m, this middle z<strong>on</strong>e are skewed upwards <strong>on</strong>ly duringwith insulating spacers placed between each ther- the warmer period (during smer the and fall) andmometer. The cable was suspended in air 5-m- in a not during the winter cooling period. 6.0 Below mdiameter casing installed in a 10-m-deep borehole. (Fig. 3 ), the two time-series €or the lower z<strong>on</strong>eThe thermometers were pulled from the hole peri- were almost parallel to each other. The thermomodicallyto obtain the temperature readings. The eter readings were higher than the thermistorthermistor cable c<strong>on</strong>sisted of an assembly YSI of readings by an average of 0.17 'C, suggesting that4407 glass bead thermistors placed at the surface 'the calibrati<strong>on</strong> of the t,hemometers was higherand at -0.3, -0.6, -0.9,-1.2,-1.5, -2.1, -3.0, than that of the thermistors. (The average differ--4.5, -6.0, -9.0, and -10.0 m. The assembly was ential between thermometer and thermistor readinginserted in a similar 5-cm-diameter casing in- was 0.17 and 0.18 "C in the top and middle z<strong>on</strong>es.)stalled in a 10-m borehole located 30 cm from the Figure 4 shows the time series of the differencesthermometer string. The pipe c<strong>on</strong>taining the ther- between the thermometer and thermistor readings.mistors was filled with silic<strong>on</strong> fluid and capped. The upper and middle z<strong>on</strong>es show seas<strong>on</strong>al patternsThe cable was extended some distance from the pipe of difference for most of the record; the lowerto avoid surface disturbance. Simultaneous mea- z<strong>on</strong>e is stable in this regard.surements were made <strong>on</strong> the thermometer string and We attribute the minor differences inthe thexhistor assembly over three years. The measured values between the two sensor types t.othemistor string remained undisturbed within the apparent difference of about 0.17"C in calibrati<strong>on</strong>silic<strong>on</strong> fluid envir<strong>on</strong>ment. The thermometer string, between the two sensors, and a possible influencesuspended in air with the insulating spacers, was of ambient air temperature <strong>on</strong> the mercury thermom-
0.0mm7Om7-0.5-1 .o-1.5-2.0-2.5-3.0Figure 3 . Average temperatures (TI, below 6.0 m, thermwmet.er & thermistor methods. 1077
~~ .-L2 1.5.-leE 1.0alc+ 0.5Y50U50.0-0.5E -1.0OIc-1 5m" mu "--I -.- -DlFF top layer0 mF-DlFF med layer "-*- DlFF bottom layerI.F-m-Figure 4 . Difference between thermometer and thermistor readings.eters at the time of reading. Average annualthat <strong>on</strong>ly minor differences exist between the twoground temperatures calculated based an the ther- types of ground temperature measurements. Ourmometers and the thermistors were within O.0loC Chinese colleague, Ding Jingkang, has obtained afor all levels if the apparent calibrati<strong>on</strong> differ- similar set of data at the Fenghuoshan <strong>Permafrost</strong>ence is taken into account. We c<strong>on</strong>cluae therefore <strong>Research</strong> Stati<strong>on</strong> <strong>on</strong> the Qunghai Xizang Plateau.- 1078
PRELIMlNAHY STUDY ON THE FREEZING POINT I N SOILCui Guangxin and LiY iMining and Technology University, ChinaIt is pr'e3erlted that the freezing point aifected the depth of the freezing wallof B freezing shaft. due to thp differences of depth, water c<strong>on</strong>tent and load inminixg engineering. The study method a1111 some rcsults are introduced. ,c<strong>on</strong>ductivity; r--coodinate radius: 't--tirne;XI ,X2--heat c<strong>on</strong>ductivity of unfrozen and frozensoi 1, respcctivc1.y: E--the coordinate of thefrozen well; B--latent heat, 8"temperaturefunct.inn: Ro--coordinate of freezing tube:I. Y "temperature of cooling source: to--preliminary temperature of soil; tD--frcez,jngpoint.Fig.1 l'empcrature fieldali)r~g the freezing wallThe strength anrl s~.ability of the freezingwall arc very important for enginccring. Thethickness ol the frcczi.ng wall is determined <strong>on</strong>the basis of strength and stability. So far indesign and c<strong>on</strong>struc~i<strong>on</strong>, thc zero degree line isdefined as the boundary uf Lhe freezing wall,that is tD=O"C. Both in tests and engineeringpractice i t was proved t.ir;rL when there isuver~burtien P, the frcczing point of surface soil Iis lowrr tha11 0°C and not a c<strong>on</strong>stant, tD=f(p,w,s).Uowever the functi<strong>on</strong> has not been obtained, thcthickness of the freezing wall in design is not1079
equal to that in field. For example, the designedthickness of the freezing wall according to O0Cline is 7 m, while the boundary is al<strong>on</strong>g -2°Cline, so that the thickness in field is <strong>on</strong>ly5.6 m. It's dangerous to engineering. Designersand .technologists had to make them by decreasingthe boundary temperature lower than 0°C. 11'surgent and a requirement to obtain ttre functi<strong>on</strong>of to=i(l',w,s) in thc design and ~<strong>on</strong>structi<strong>on</strong> offreezing shafts.IIIPressuresystemINTKO~ucrIo~The study of freezjng point under ovrrburdcnbegan in the USSR in the 1960s, and it began i nthe 1970s in China.in recent years, the freezinp yuint of soilwas fiet.ermined by the temperature increasing dueto released latcnt heaL Crum the curve of te~peraturevs. time obtained by thermalmeterduring soil freezing. H!I~ Lhis mcthod is notadaptivs to wl~en thr temperature .is not increasing.So this methud has great locality and error.Liu Z<strong>on</strong>gc.hao (1987) proposed a criteri<strong>on</strong> ofdetermining thc freezing point using volt changeduring soil freezing, and experirnent,al researchwas studied for the range of 4 MPa in an opensystem and the range of 10 MPa i n a closedsystem. This method is simple, arid volt changeis obvious. ?owever, it needs the premise Lhatvolt change is unique. Jt was regretted chatthe volt change around the l-reeaing point wasnot unique, RO t.hrrt some mistaken determinati<strong>on</strong>was made.Vreezillg point can be determined accorriing tothe diftarence of resistivity between the frosenn<strong>on</strong>e and unfroz,en z<strong>on</strong>e. Gu Zh<strong>on</strong>gwci (1082) showedthat, resisti-vity of soil depended <strong>on</strong> water c<strong>on</strong>tent,salt c<strong>on</strong>tent and soil properties. Thcaathor and-assistants propose an idcntificati.<strong>on</strong>method to determine the freezing point underoverburdcn usi.ng the mutati<strong>on</strong> of resistivityduring soil Ireezing, and the freezirlg poinlfinder' is provided. He Ping (1'790) tasted thefreezing point for different. soils and 1,rovF'dthat there existed a11 obvious mutati<strong>on</strong> ofresist.ivity during soil freezing under lowoverburden.RESEARCH 0F"INGPOINT UNDER OVERBURDENR~!Z~USF it is required to dctcrmine thefreezing point under overburrlcn in producti<strong>on</strong>fi.c. freezing shaft.), we proposed a decisi<strong>on</strong>scheme of I he rreezing point i.11 the range uf8 KPa of uverlruriiel~ for clay, sandy clay, clay~ysand and sand usj.ng t.be changc of restivitychangc durj.ng freezixg.Fjguror 2 shows the test systcm. %t is composedof a test nell, ~emperaturc sensor, €Itlidpressurcrcll and freezing t.ubtr. Thc scnsorohserverl 1.h~ frost linc and temperat.ure. Tnsaturated soil, pressure t.ransfcr exists, sothat prcssurc is applied by iniecting highyressurc liquid through a pressure hulc. l.iquidpressure is 1:nntrollcd by a pressure-sensor andpressure-c<strong>on</strong>trol system. Liquj.d pressure in thefluid pressure cell i:; transferred to the saahplethrough a soft tubor Illembranc so as not to mixliquid wlth thc sample.It is important to det.erm'i.nc thc frost lineduring thc ,test. Although it. has proved thatresistivity changed obviously during soil freesing,the relati<strong>on</strong> het:ween thc spot of resistivity mutati<strong>on</strong> and freezing point (~f soil. has notheen idctntifiod by the !.est..UUFi.g.3 Freezing polnt finder'The 05 jective of the project is:1.. Find t,he relati<strong>on</strong> between resisti.vitychange and frost. line during soil freezing.2. CorPect the freezing point fin(1r.r wi.thunclear magnetic res<strong>on</strong>ance.PRlMARY RESULTS OF THE LAW OF RESTSTIVITY CHANGEDURING FREEZINGClay and sand are saturated and luadcd in thetest. The sensor with the rreezing point finderis composed of thermalcouples and clcctrodes tomeasure resistance. Tl~ermalcouples are locatedbetween two electrodes. The frozcn liquid isNaCT soluti<strong>on</strong> (-2°C). .Fig.4 shoks the processes of tcmperature andresistance i n saturatod sand. Where, linc 1 isthe curve of ternperal.ure v::. time, and line 2is the curve of rc$:iotnnce YS. tine. The Lemperaturehecorr~es obviously steady from 10 to 70mi~~rrtes, :~nd thc freezing point can be easilyde~ermined. Bcfore freezing, the change ofresistance is steady, after fieeP,irlg, itincreases rapidly. lt is intcresting thnr. the.distinct increase of resihtancc occurs at 60minutes, which curresp<strong>on</strong>ds to Lhe later period(not.. the beginning) of the temperature. It isindicated \.hat. ttre micro-phasc change heginsJ!: 10 minures. The ir:e forI:ls <strong>on</strong> B 1.arge scale athO mijiuteu and t.his res1rlt.s from a rapid increnseof rcsistance. Fig.5 shows Lhe relati<strong>on</strong> betweenLemperaturc and resistivity. There exists apoint. of inflecti<strong>on</strong> E that corresp<strong>on</strong>ds tu thefreezing pujnt (point A in Fig.4.). Fig.6 is theamplified irlflected point. from Fig.',. Hcorr~sp<strong>on</strong>ds to super-cooling tempcrature. Atthis moment, the resi.stance does ,lot have an' 1080 '
acute change, soil is unfroz<strong>on</strong>. The temperatureat. the inflected point is -O.Ob°C, that is thefreezing poinL.I., 16006r.. * I \/{ ,200 2-0 20 40 60 80 100 120Time (min.)Fj8.A Process o€ temperature and resistancein saturated sandY30 60 90 120 150Time (min.)Fig.7 The proccss of resistance and temperaturein saturated clayIOoo r-6 -4 -2 0 2 4 6Temperature ("C)Fi g.5 The relati<strong>on</strong> Irr.twecn resistance aridtemperature in saturaLed sc
CACULATION OF MAXIMUM THAWED DEPTH OF PERMAFROST UNDERTHE BLACK-COLOUR PAVEMENT BASED ON GEOTHERMAL GRADIENTCui Jianheng and Yao CuiqinThe First Survey and Design Institute of Highway,The Ministry of Communicati<strong>on</strong>s, Xian, China ,From the engineering state of roads, geological c<strong>on</strong>diti<strong>on</strong>s, present research situati<strong>on</strong> and accumulatedinformati<strong>on</strong> in the permafrost area of Qinghai-Xizang, the paper, evading the difiicult problem of thethermophysical process of seas<strong>on</strong>ally frozen-thawed layer, directly c<strong>on</strong>siders the thermophysical processof frozen-thawed boundary and uses the geothermal gradient caused by various factors(air temperature,terrain, height above sea level, geographical latitude, ground surface c<strong>on</strong>diti<strong>on</strong>, soil type,thermophysical property and the effect of water), presents a method to calculate the maximum possiblethawed depth of premafrost in a certain period.INTRODUCTIONOn the Qinghai-Xizang plateau. thc amount of heat absorbedby black colour road surface is in larger proporti<strong>on</strong> to that absorbed by ground surface. Asphalt pavement restrains the evaporati<strong>on</strong>of heat, in additi<strong>on</strong>, the erects of permeati<strong>on</strong> and c<strong>on</strong>vecti<strong>on</strong>of water have very large influences <strong>on</strong> the scas<strong>on</strong>ally thawed depth.when precipitati<strong>on</strong> permeates into soil, its heat and the radiati<strong>on</strong>heat of soil will be taken to the thawed boundary. It is difficult todescribe the complex thermophysid proccss by using athermophysical equati<strong>on</strong>. But the mthermal gradient effected byvarious factors can be found by the observati<strong>on</strong> of ground temperature.If the thermal flow al<strong>on</strong>g the road directi<strong>on</strong> is neglected, thetemperature accumulated under black road is expressed by a twodimensi<strong>on</strong>al Iield(Ding Dewen,1983):The horiz<strong>on</strong>tal and vertical heat flows caused by geothermalgradients (aT/ aX and aT / ah) make up the total heat flow of soil:the relati<strong>on</strong> of vertical heat flow to total heat flow is defined as theside radiati<strong>on</strong> coefficient,. aTI -dxdvum and the rclati<strong>on</strong> of vertical heat flow to total heat flow will bec<strong>on</strong>stant.The paper <strong>on</strong>ly discusses the relati<strong>on</strong>ship of maximumseas<strong>on</strong>ally thawed depth and the vertical geothennal gradient.HEAT EXCHANGE ON THE FROZEN-THAWED BOUND-ARYThe heat exchange <strong>on</strong> the from-thawed boundary obeys thelaw of energy c<strong>on</strong>servati<strong>on</strong> and exchange. For the frozen-thawedboundaty, the heat equilibrium c<strong>on</strong>diti<strong>on</strong> must be obeyed,, it can beexpressed by the Stafen equati<strong>on</strong>:where, I, and 1, arc heat c<strong>on</strong>ductivity of uppcr and lower layersfor phase change boundaty, t+nd t,are soil temperature of uppcrand lower layers, C is the thawed depth.Q, = L W Tdr is the c<strong>on</strong>sumpti<strong>on</strong> heat amount per unit volumeduring freezing or thawing, L is phase change latent heat Qf ioc, wis natural water c<strong>on</strong>tent, Tdis dry density of soil.The left porti<strong>on</strong> of the equati<strong>on</strong> is the differenm of heatamount getting in and out the boundary, the right porti<strong>on</strong> of theequati<strong>on</strong> means that the phase change boundary moves at the rateof dF / dz because the heat amount absorbed by the boundary iscansumed by soil during thawying or freezing. Equati<strong>on</strong> (1) is alsoexpressed as:when the boundary c<strong>on</strong>diti<strong>on</strong> of the temperature field is defined,the side radiati<strong>on</strong> c<strong>on</strong>diti<strong>on</strong> will certainly be in dynamic equilibri.1082
geothermal gradlent at upper and lower phase change boundary.< iq the moving rate of the boundary.If q, = qT, 5 = 0, the boundary docs not move. If' the heat flowof- cvery point is c<strong>on</strong>stant, the upper limit is in the steady state. Ifthe upper limit descends, it certainly absorbs heat from thefrozen- thawed boundary. The main c<strong>on</strong>diti<strong>on</strong> of the upper limitdescending is that annual average heat flow decreases jumpingfrom the upper laycr of soil to the lower layer. The dynamic state ofthe upper limit can be judged by the annual average geothermalgradient of the uppcr and lower layer of soil at the upper limitboundary, because a differcr,t geothermal gradient is corresp<strong>on</strong>dingto different heat flow. It has:If gT> (Am / A,.)gm, it is shown that the upper limit will descend. Ifthe annual avcrage heat current of the upper layer soil is equal tothat of the lowcr, the upper limit is in the steady state. Thegeothermal gradient at p,=(dm/ AT)gm is regarded as the criticalgradient of upper limit movement. If the thennophysicalparameters of permafrost do not change, the moving rate of theboundary may be expressed as the functi<strong>on</strong> of geothermal gradient(ET):If 5' =O , g, is the critical gradient at which the table starts moving.If- thc gradient is c<strong>on</strong>stant, the moving rate is an invcrscmensurcmcnt of'thc watcr amount (w - Td) of frozen soil.The above discussi<strong>on</strong> is for the uniform medium, but thc a~tual soil laycr is not uniform.VERAGE STEADY TRANSFER HEAT PROCESSThe idea of effective annual average temperature will be introducedhere. The purpose is that a uniform soil layre, in which theheat c<strong>on</strong>ductivity is equivalcnt to the actual <strong>on</strong>e, is used to expressthc actual soil laycr.If the state is steady and cffcctive annual average temperaturedoes not change, bccausc of no inner heat source, the averagc heatflow is c<strong>on</strong>stant, an average steady tempcrature field is formed andthe annual avcrage transfer heat amount is c<strong>on</strong>stant. Because theheat exchange between the ground surface and atrnosphcric layerchanges periodically, the heat exchange between the annual temperaturechange layer and the bottom of thc layer is relativelysteady. Therefore heat exchange between the annual change layerand outside is steady certainly in an annual period. The algebraicalsum of heat amount QT absorbed by the ground surface in an annualperiod with evaporati<strong>on</strong> heat Qm equal to the heat quantity(q,t,) absorbed into the layer under the annual change laycr. Theannual average heat flow in ground is:where,q, is the heat flow entering into the lowcr boundary of theannual change layer, A is equivalent heat c<strong>on</strong>ductivity, t, ispermafrost temperature, to is effective annual average temperatureof ground surface, h, is the annual average depth of ground temperature.Therefore, the soil layer with different heat c<strong>on</strong>ductivitycan be replaced by a. uniform soil layer with equivalent heat c<strong>on</strong>ductivity:where hiis the depth of the lower boundary and Ai is the heat c<strong>on</strong>--ductivity of'the soil layer of number i, respectively.It is shown that the heat exchange between thc annual averagestcady active layer and the bottom of the layer is not certainly equalto zero. The annual average temperature of frozen soil is not equalto the <strong>on</strong>e of ground surface and is also not equal to the annual averageair temperature.For a largc c<strong>on</strong>tinuous permafrost area, black road surface is<strong>on</strong>ly a limited boundary c<strong>on</strong>diti<strong>on</strong>, the heat transmitlcd from thesystem to permafrost is not enough to change the hcat state ofpermafrost. The temperature field under black road .may cornc toan equilibrium state in thc boundary c<strong>on</strong>diti<strong>on</strong> for a period. Theequilibrium is dynanic, IL stcady artilicial upper limit may beformed under the large area c<strong>on</strong>tinuous black road surface ofpermafrost, the equlibriurn is corrcsp<strong>on</strong>ding to the climate and envir<strong>on</strong>mentc<strong>on</strong>diti<strong>on</strong>s for a period. The formati<strong>on</strong> of a stcady upperlimit under the black road surfacc is essentially the equilib:iumquesti<strong>on</strong> of excessive absorbing hear of black surface and heat currentin ground. In an average steady state, the average heat currcntpassing through the permafrost upper limit in a annual period is:where, tT is effective annual avcrage temperature at the steadypermafrost table, h, is tne cffective depth of a steady <strong>Permafrost</strong>table. Therefore the critical gcothermal gradient can be obtained inthe average steady equilibrium state:The observati<strong>on</strong> data of ground temperature shows that theannual average tcmperature at 0.h under the black road surface isa plus. It is shown that seas<strong>on</strong>ally thawed depth is more than thefrozen depth for black road surrace in the average steady equilibriumstate. Therefore the unfro7xn layer exists ccrtainly betweenpermafrost and the seas<strong>on</strong>ally frozen soil layer. The annual avcragetemperature at the uppcr limit is zcro. The equati<strong>on</strong> (9) may bewri ttcn as :The above discussi<strong>on</strong> is <strong>on</strong>ly for a <strong>on</strong>e dimetlsi<strong>on</strong>al heat c<strong>on</strong>ducti<strong>on</strong>problem. But, in ground there is heat c<strong>on</strong>vecti<strong>on</strong> from wat-
er as well as heat c<strong>on</strong>ducti<strong>on</strong>, the temperature field is not <strong>on</strong>edimensi<strong>on</strong>al. Therefore the relati<strong>on</strong>ship of the average verticalground temperature gradient and maximum thawed depth depends<strong>on</strong> ground temperature. The critical average vertical geothermalgradicnt (g,) is determincd by ohscrvcd ground tcmpcrature.whcrc, A is the change rate of Ah,. with g, , At a c<strong>on</strong>stant healflow c<strong>on</strong>diti<strong>on</strong>, the influencing factors <strong>on</strong> A are the frozen soil typeand heat quantity (0,) c<strong>on</strong>sumed during ice thawing. It is shown asequati<strong>on</strong> (9) that the critical gradicnt of ground tempcrature is theratio of equivalent heat c<strong>on</strong>ductivity of the upper layer Soil to lowerlayer soil at the tablc and times of average gradient of grdund ternperaturein the annual change layer. when the heat c<strong>on</strong>ductivity isc<strong>on</strong>stant, go is related to (t.,.-tc) / (hc-hT). Generally VeakinL thetemperature (1, ) of frozen soil and the annual change depth (h,) isrelated to the height above sea level and latitude, By C<strong>on</strong>vertingnatural soil of every observati<strong>on</strong> point into gravel (&=2.56- 01i. 1DATA ANALYSTS3 4.. ~-0.5 1 / -0.51 /The data was observed every ten days in the period of plurtcmperature. Obscrvati<strong>on</strong> intcrval is 0.Sm in depth. Because roadsurfacc tcrnperature is intluenced very largelyby the periodic airtempcrature of daytime, the deviati<strong>on</strong> of the data is large. But theground tcmperature at 0.5m depth is influenoed very little by airtcrnpcrature of daytime, and for artificial road, the boundary c<strong>on</strong>diti<strong>on</strong>sarc similar in each of the road secti<strong>on</strong>s. The thermophysicalc<strong>on</strong>diti<strong>on</strong>s at the depth of 0.5m may be defined as the upper-0.5boundary c<strong>on</strong>diti<strong>on</strong> in the research system. In additi<strong>on</strong>, thc changeof ground temperature in a year is periodic, average ground tcm- l.O}AhlIxraturc in a plus temperature period is a c<strong>on</strong>stant proporti<strong>on</strong> tothe <strong>on</strong>e year period, and thawing happens in a plus temperature pkriod. The unfrozen layer exists in the average steady equilibriumstate. When a seas<strong>on</strong>ally frozen Iaycr exist, the heat cannot bc11-ansimitted into the unfrozen laycr. After the seas<strong>on</strong>ally frozenlaycr thaws, the permafrost layer can absorbed the hcat from theupper layer. Thcrcforc, thc train of thought to look for the relali<strong>on</strong>shipof average ground tcmpcrature at 0.5m in plus temperatureperiods and maximun lhawed depth of' permafrost does notchange the substance of thc problem.Table 1 shows thc obscrvati<strong>on</strong> data of ground temperature and-0.5 -0.51Fig.1 h vs. gcaicula!inn results ol' 6 ohscrvati<strong>on</strong> points in different heightsnhovc sca level and latitudc from 1YS5 to 1990. Where Te is fhe averageIcmpcrature Iiom June to October at 0.5m depth, gr is calledthc calculated avcragc gcothermlal gradient, is the 1-atio of thcaverarre temperature differepcc bctwccn at 0.5m dcpth and at max.imum thawed depth from June to October to thc seas<strong>on</strong>ally thawedwhcrc, K. is c<strong>on</strong>verting coefficient of soil layer (K =A, / An), thercgrcssi<strong>on</strong> coefficient is 0.94.From rhc definiti<strong>on</strong> of calculati<strong>on</strong> gradient of ground tempcradcpth.T!lc thawed dcpth is the depth where thc tempcrature is ture. thc actual maximum thawed depth of calculati<strong>on</strong> points at a-0. I'C. Figure I shows the relati<strong>on</strong>ship of thawed depth h ofcvcry c<strong>on</strong>stant c<strong>on</strong>diti<strong>on</strong> can be obtained:observati<strong>on</strong> point year by ycar and calculated average geothermalgradicnt (gT). The line, passing through the points whert: g-, arestn;~ileI and Ah, arc largcr, is in unfavourablc c<strong>on</strong>diti<strong>on</strong>s. The intersectingpoint of the straight line with g, axis is the critical calculardgradicnt (go). Wndcr the unlhvourable c<strong>on</strong>diti<strong>on</strong>, Ihc rclati<strong>on</strong>- where, Te is the avctagc tcrnperature at O.Sm dcpth from June toship ol-g, and Ah,. is:October(T).Ah, = A(g, --x,) (1It is c<strong>on</strong>firmed by observati<strong>on</strong> infomati<strong>on</strong> that the g also ex-1)ists under na:ural ground surface. The natural upper limit isw/ m "C), the rclaticnship (see table 2) of g,' and height (Hs)above ses level and latitude (L) is:thought as thc average steady equilibrium limit of permafrost (seeTable 3,.Fig.?, Fig.3). The relati<strong>on</strong>ship of the geothermal gradientundcr natural ground surface and seas<strong>on</strong>ally thawed depth can bethe referencc of' black colour pavement.CONCLUSIONThe theory of average steady heat transfer processes are introducedto research'the rciati<strong>on</strong>ships of steady table and the gradientof average ground lempcrature by means of the uniform soil layrereplacing the natrual soil layer with different c<strong>on</strong>ductivity.The vertical porti<strong>on</strong> quantity of geothermal gradient measured
4750fable 1. The observati<strong>on</strong> informati<strong>on</strong> of ground tempcrahucTable 2. Thc deta of do , H, and LNO.Ha L 1 Bo 8'0(rn) ("1 (W /mV) cC/m) ("C/ m)1 4149 35.61 1.65 2.70 1.742 4615 35.28 1.80 2.05 I .443 4140 35.18 1.66 2.31 t .544 4579 35.36 1.78 2.13 1.485 I34.77 1.70 2.60 I .756 4940 34.12 1.92 2.15 2.06"5.00 1 2.23Table 3. The temperatun: informati<strong>on</strong> of the natural groundsurface in the wcst of Xiesui riveryear-TC Tr h, gr"Ah,("C) ("c) (m) I0Cc/m) (m)85 2.586 4.10 "0.S 2.5 2.30 087 4.40 -0.5 2.67 2.45 0.1188 4.40 -0.5 2.67 2.26 089 3.9 -0.4 2.38 1.98 -0.2990 5.0 -0.1 2.75 2.71 0.37Note: g, is calculated by using gT-Te-T,r / h,-0.5.T, andr,. are the mean ground temperatures at 0.5 rn and the permafrosttable from June to October, h,last year.is the depth of the permafrost table0.5 /I 21'-0.50 lTT-kFig.:! H vs. g (natural ground surface in the north of Xieshui river)may be c<strong>on</strong>sidered (the actual gradient of ground lemperaturc is influtnoedby heat c<strong>on</strong>ducli<strong>on</strong>, heat c<strong>on</strong>vecti<strong>on</strong>, et a].) by means ofthe statistical method of pure theroy which is uscd to develop theresearch of heat c<strong>on</strong>ducti<strong>on</strong>, it is in accord with the actualsituati<strong>on</strong>.The method given in he papcr can be used to calculate themaximum thawed depth not <strong>on</strong>ly for the pavement in large areas ofpermafrost but also for the natural ground surfacc and engineering.The method may be as used as a train of thought for c<strong>on</strong>tinuing research.ACKNOWLEDGEMENTS4 Eip.? Mean ground temperature8cw~pt's in Kekcxili from Juneto October in 1995,1987,1989The authors wou 11d lil ce to thank very sinccrcly Plofcssors YuWenxue and Wu Jingming for the valuable help given.REFERENCESDing Dewen, 1983, A New Theory <strong>on</strong> 'I'cmpcrature and IJcat Regimein the Annual Average De$h of Ground Temperature.Proceeding of Sec<strong>on</strong>d Nati<strong>on</strong>al C<strong>on</strong>l'erence cn <strong>Permafrost</strong>.Ding Dewen, 1983, Determinati<strong>on</strong> of Characteristic Valw of TcmperatureField in Annual Average Depth Gf Ground Temperature.Proceeding of Sermd Nati<strong>on</strong>al <str<strong>on</strong>g>C<strong>on</strong>ference</str<strong>on</strong>g> <strong>on</strong><strong>Permafrost</strong>.
OBSERVATION ON PSRTGLACIAL YASS MOVEMENT IN THE HEAD AREA OFURUMQT RTVEK AND LAERDONG PASS, TIANSHAN MOUNTAINSCui Zhijiu', Xi<strong>on</strong>gHeigang' and Liu Gengnian''Department of Geography, Peking University'Department of Geography, Xingjiang UniversityObservati<strong>on</strong> of the movement rare and forms of talus, rock glacier, active layerand geliflucti<strong>on</strong> in the periglacial envir<strong>on</strong>ment in Tianshan Mountains have beenc<strong>on</strong>ducted since 1986. The talus, which is str<strong>on</strong>gly developed between 3300 and3900 meters above sea level, is supplied by snow-avalanche, rock fall andalluvial forms. The down-slope moving rate of surface gravel <strong>on</strong> talus is 0.82-10.4 cm/yr, the mean value is 3.15 cmlyr: and the mean rate of the fr<strong>on</strong>t lineof the talus is 2.22 cmlyr. The rock glaciers evolved from talus and have theshape of lobate. and are distributed at 3300-3950 meters a.s.1. Fr<strong>on</strong>t movementrate is 0.96-49 cmfyr, mean rate is 21 cmlyr. The active layer is at 3460-3540meters, with a slope dj.p angle of lO"-lf' and slope orientati<strong>on</strong> of 9O-17Ov, andit creeps down slope with a mean surface rate of 1.13 cm/yr. A 1,arge amount ofgeliflucti<strong>on</strong> lobates are distributed at the north-ward slope near Ltierd<strong>on</strong>g Passwith an altitude of 2800-2900 meters, mean surface rate of 13.9 cm/yr and fr<strong>on</strong>trate of 2.16 cmlyr.C1,TMATIC CONDITIONSRased <strong>on</strong> the data from Daxigou MeteorologicalStati<strong>on</strong> at 3545 meters in the head'aren ofUrumqi Qiver, where the annual mean temperatureis -5.34"C and annual mean precipitati<strong>on</strong> is 430em, the times of temperature oscillati<strong>on</strong> around0°C are 130. The Hydrographic Stati<strong>on</strong> at 3805meters in the empty cirque at the head of UrumqiKiver shows an annual mean temperature of -7.5'C,and an annual precipitati<strong>on</strong> of 380-Lf10 mm (1987-1.989). Annual mean temperature is -2.h'C andprecipitati<strong>on</strong> is 830-840 mm (deduced from dataOE Snow Avalanche Observati<strong>on</strong> Stnti<strong>on</strong>).TALUSTalus is <strong>on</strong>e of the most comm<strong>on</strong> alpine features,and ranges widely from the piefirn<strong>on</strong>t t,othe divide and is distributed mainly in analpine periglacial envir<strong>on</strong>ment with greater size,density and activity. Tn periglacial areas,str<strong>on</strong>g freeze and thaw acti<strong>on</strong>s favour the breakingof bedrock and the abrupt valley side byglaciati<strong>on</strong> offers a favourable relief for talusformati<strong>on</strong>. Talus appears greatly at. 3609-3950meters above sea level.Observati<strong>on</strong> was made to measure surface gravelmovement and baseline movement of talus in 198h-1991 fXi<strong>on</strong>g Aelgang, et al, 14921, for- theresults see Table 1. Talus-1, located beneathGlacier 5, c<strong>on</strong>sists of til? from Glacier 5 andweathering debris from the upper slope. Talus-2is located at the trough base to the right ofGlacier 5 and mainly c<strong>on</strong>sists of frost. weatheringdebris from the upper slope. Talus-3 and Talus-4are located at the back and left side of theempty cirque. The observati<strong>on</strong> started in June,*+The research was supported by NSFC and TianshanGlscial Observati<strong>on</strong> Stati<strong>on</strong>1986 and c<strong>on</strong>tinued until August, 1991. Talus-5 ,and Talus-h are located at the western side ofthe empty cirque, Talus-7 is located at theriegel of the empty cirque, Talus-8 and Talus-9are located at the trough of Glacier 8. Thesurface gravel movement of the upper, middle andlower lines was taken to show the differentmovement ra~es at the talas. Ir<strong>on</strong> poles wereused as the datum point to determine the baseline movement of the talus. The results areshown in Table 1. Mean movement rate of thesurface gravel is 0.82-10.4 cmfyr, total meanrate is 7.15 cm/yr; the mean rate of the upperline is 2.7 cmfyr, middle line is 3.6 cmfyr,lower line is 3.0 cm:yr. Velocity of talus baseline is 0.26-5.7G-cm/yr, total mean rate is2.22 cmfyr.BLOCK SLOPEZhu Cheng** arranged a block slope measuringsite at 3990 meters, with br?dr.,ock slope angleQ€ 27", slope aspect of llOo, slope length of275 meters, debris width of 5.5 meters, debrisslope angle of 34', and debris s1op.e length of69 met-ers. Lithology is quartz schist. Remeasurementwas made in 1990 and it shows a 30-80 cmdisplacement am<strong>on</strong>g 13 points, the mean displacementis 38.46 cm and mean rate of surface gravel/-<strong>on</strong> the block slope is 7.69 cm/yr.The processes of surface gravel <strong>on</strong> talus arevery complex (Washburn, l97Y), they can be roll--ing, sliding, creeping and subsiding, etc. Themovement is sporadic. The measurement may <strong>on</strong>lyrepresent the c<strong>on</strong>di til.'. in >I limited period.For example, surface gravel mean rare of 2.5cm/yr and maximum rate of 5.8 cmfyr was measuredby Rampt<strong>on</strong> (1974) at 25' slope.talus in Yuk<strong>on</strong>**Zhu Cheng, 1990, comparis<strong>on</strong> of periglacialprocess am<strong>on</strong>g Tianshan Mountains, WesternAntarctica and Andes, Ph.D. thesis, PekingUniversity, 171 pp.1086 '
Table 1. Altitude, form and movement rate of the talus (Talus 1-4 in 1986-1991, Talus 5-9 in 1990-1991)Altitude Slope Slope length Middle width Slope angle Height of the Slope angle Rate of Rate ofNumber a.s.1, aspect of the talus of the talus of the supply area of supply surfacegravel base line-1meter degree meter meter talusdegree meter area cm yr degree cm yr-lTalus-1 3700 35" 270 115 25"-30" 4 50 450-55O 1.8 0.261.26 . 0Talus-2 3700 40' 90 65 30"-35' 450 60"-75" 10.4 4.1.88.40.8Talus-3 3950 135O 175 110 25'-32" 375 45"-60' 0.9 1.520.821 .h8Talus-4 3900 230" 210 95 25"-32" 350 , 50"-70' 1.25 1.821.49Talus-5 3900 75" 45 40 28" 560 41' - 1.4Talus-6 3920 80' 65 60 30" 610 .40" - I .03Talus-7 3040 230' 70 35 27' 355 39" - 0.88Talus-E 3640 265' 130 1728" 520 32" - 3.1Talus-9 3680 265' 180 35 28" 720 34.5" - 5.78n rL.3Territory, Canada. Rate of 6.5-111.0 cmfyr <strong>on</strong>25' slope talus was measured by Gardner (1973)in Lake Louise, Canada. The rate is 1-450 cmfyrin Chambeyt<strong>on</strong>, French Alps (Michard, 1950). Therate is 0-22 cm/yr <strong>on</strong> 14"-38.4' talus slope inLapland (Rapp, 1960). It is suggested that therate of surface gravel <strong>on</strong> talus is in the scaleof several centimeters, the extreme scale canbe several meters per year. The activity and thesize of the talus are related to topography,climate, lithology and geulogical structyre.ROCK GLACIERThe rock glaciers in the head of IlrumqiRiver, mostly lobate-shaped and a few torrgueshaped,are distributed at 3300-3950 metersa.s.1. <strong>on</strong> the northward slope (Schatter Seite).Most of the rock glaciers are evolved fromtalus, known as talus rock glacier: a few frommoraine, known as glacial rock glacier (Barsch,1969; Corte, 1987). Form, compositi<strong>on</strong>, velocityand structure type have been measured since 1986(Cui and Zhu, 1989: Zhu;19891, the results areshow in Table 2. RC-1 is t<strong>on</strong>gue-shaped with aratio of length and width of 1.6; the othersare lobate-shaped with a ratio of length andwidth of 0.2-0.58. The directi<strong>on</strong> of movement ismainly northward, RG-5 is westward and RG-6 issouthward, Moving rate of the rock glaciers is0.96-49 cmlyr, mean rate is 21 cmfyr. The rateof rock glaciers in the Alps is 7-500 cmfyr,mustly 140 cm/yr (Vietoris, 1972: Aarsh, 1969:1975; Chaix, 1943). The rock glaciers in AlhertaPark of Canada move down slope by 0.3-0.8 cm/yr(Osborn, 1975). The rate of rock glaciers inAlaska Range is 36-69 cm/yr (Wahrfaftig, 1959).The rate of rock glaciers in Fr<strong>on</strong>t Range,Colorado and Galena Creek is 2-15 cm/yr and 32-217 (mean 133) cm/yr (White, 1971; Potter,1969).The rate of rock glaciers in a maritime envir<strong>on</strong>mentis up to 1 meter or more, whereas in ac<strong>on</strong>tinental envir<strong>on</strong>ment the rate is severalcentimeters,ACTIVE LAYERThere are l<strong>on</strong>g distance teleph<strong>on</strong>e wires,which were built in 1979, that have inclineddown slope by a slowly act.i.ve layer creepingsince then, passing through the head of UrumqiRiver. The amount of displacement representsthe down slope creep of the activc layer, sothe surface creeping rate of the active laycrcan be deduced. The dip angle of 77 wire poleswere measured and the slope features werec<strong>on</strong>sidered at an altitude of 3460-35L0 metcrs.It is assured that the creep of the active layerand the incline of the wire poles are simultaneousand equally-quantitative, the surfac.ecreeps quickly and the pole end is nearlyinactive. The distance hetwcer~ two poles is 25meters and the underground part of the poles is1.5 meters. The surface creep distance:S=hxsina/sin(90'-a/2)where: S displacement distance s.itlce (1979 (cm). a 90' minus dip angleh 150 cmThe mean moving rate of t.he active laycr surfaceR=S/12R: cmiyrThe results are shown in Table 3.The first part A of 25 poles, striking 245"with slope directi<strong>on</strong> of 170' and slope angle of10"-15", creeps down-slope by 0.22-24 cnliyr andthe mean rate is 1.0 cm/yr. The pole A-2 wasloosened until iL crept down-slope 28.8 rm,since 1979, with a mean creep rate of 2.4 c-nlfyr.The sec<strong>on</strong>d part B uf 29 poles, striking 240'with slope direct:i<strong>on</strong> of 150' and slope angle of11"-17", creeps down-slope 0.22-2.4 cm/yr andthe mean rate is 1.11 cm/yr. The pole B-1 atthe block strew> crceps 2.4 cm/yr and is themost active. The third of 23 poles, striking215' wit.h siope directi<strong>on</strong> of 90'-140" and slope1087
I rm~~ITob1.e 2. Form and uovement rate of the rock glaciersThicknessp[umber Length Widthrneter meters met e r sAltitude of rockFr<strong>on</strong>tp,l.acier tcrmina?Movingslope angledmeter a.s.1.irecti.<strong>on</strong>dep,reecm yr3350KG- 2 70 120 3.600R$": 60 15083.9 350044" 35" 0.96352" 60" 11.23305" 41" 45.0' KG-4 27 101 27 3950 352" 35" 15.5tlG-5 55 130 100. s 3500 2800 43 O 49.0RG-6 20 100.5 41,5 3900 200 32" 6.2+,. ,.. lable 3. Creep rate of the active layer at the head of Urumqi Riverdeduced from inclined wire polesDip Total Dip Totalanglr mcveaent Mean angle movement MeanNo, of the at rats Slope feature No. of the at rate Slope feature" pol,@ surface cm yr- pole surface cm yr-I" -cm-A-J 88 5*24A-2. 79 20.80' A-3 86 10.47A-4 84 15.71A-5 a7 7.85A-6 86 IC,&-?A-7 na 5.24A-8 a2 20.95A-9 83 18.33A-10 85 13.09A-11 85 13.09A-12 84 15.71A-13 07 7.85A"14 85 13 .09A-15 YO 0!.-I6 89 2.62A-17 80 0A-18 05 13.09A-19 85 13.09A-20 84 15,71A-21 87 18.33A-22 a5 13.09A-23 '35 13.0YA-24 ' 82 20.95A-25 80 5.24H-1B '- 2E-3R- 4E-50-6B-78-88-9R-10E-11B-12E-13B-14B-15R-160-1779818687868987888587858887a084828228.ao23.5610.477.8510.472.627.855.24Y 3.097.8513.095.247.855.2415.7120.9520-950,442.400.87I .310.650.870.441.751.531.091.091.310.65I.. 0900*22(i1.091.091.311.531.091.091.750.442.401.960.070.650.870.220.650.41,1.090.651.090.440.650,441.311.751.75Part A, Strike245", slopeaspect 1709,A1-12 dry grassland, slopeangle loo,A8 at. blockstream.A13-19, Wet grassland, slope anglell', A15, 16, 17were supported bywire.A20-25, Dry grassland, slope angle1l0, A20, 21 atblock streAmslope 15"."-Part 8, Strike240", slopeaspect 150",81-12., Yet grassland, slope ll",B1, n2 at blockstream, B6, 8supported, &I1at thcrmalslump.R13-24, Dry,grass landslope 140,R16, 17 at stge am8-18 88R-19 86R-20 86R-21 86R-22 ahB-23 86B-24 86R-25 80B-2h 81R-27 79B-28 83E-29 85C-l 89c-2 88c-3 80C-4 87c-5 81C-6 86c-7 84C-8 89c-9 a4C-10 84c-11 83C-12 87c-13 83c-14 84C-15C-16 a6C-17 86c-laC-19c-20c-21c-22C--23".5.2410.L710.4710.4710.4710.4710.4726.1823.5628. 8018.3313.092.440.870.870.870.870.870.872.181 .Yh2.041.53I .09B18 supported"B2.5-29 Wet.grass land,slope 15'-17",B25 at stream,R29 at blockstream.2.625.2410.477 .BY23.5610.4715.712.6215.7115.7118.330.220.440.870.651,960.871 I 310,221.311.311.53Part C , St.rike%15", slopeaspect 9Oo-14O0(21-13 Wet grassland, Cl, 4, 8,12, 16 supported,C5 at. blockstream, C9 atthermal-karstdcpressi <strong>on</strong>,C.L3 at block7.85 0.65 stream, C14-2338.33 1.53 Dry grass larid,15.71 1.31 slope aspect83 18.33 1.53 YO', slope 14'.10.47 0.8710.47 0.8786 10.47 0.8786 10.47 0.8786 10.47 0.8786 10.47 0.0786 10.47 0.8786 10.47 0.87"
angle of 12', creeps down-slope 0.22-1.96 cm/yrand the mean rate is 0.99 cm/yr. The pole C--5at the block stream creeps 1.96 cm/yr and isthe most active. The total mean c-reep rate ofthe surface of the active layer is 1.13 cm/yr.The sorted stripe ground at 1900 meters inNorthwest B.C., Canada, creeps 15-33 cm/yr(Makey, 1974), which is greater than that inTianshan. The down slope creep rare by freezingand thawing and geliflucti<strong>on</strong> is mostly around0.1-12 cmlyr and the mean is 2.5 cm/yr(Washburn, 1979. Table 6.2). The movement ofthe active layer is influenced by climate.slope directi<strong>on</strong> and angle, ground-water c<strong>on</strong>tent,landforms and compositi<strong>on</strong>.GELTPLUCTlONMeasurement and sampling were made to studythe geliflucti<strong>on</strong> near Laerd<strong>on</strong>g Pass (43"10'N, 'r'84'20'T; 2888 meters a.s.1.) i.n August 1990 andremeasurement was made in 4ugust 1991. grainsizeand water c<strong>on</strong>tent of a pitting at <strong>on</strong>egcliflucti<strong>on</strong> lobate were measured according torhe stratificati<strong>on</strong>, the result are shown inTable 5. The form of the geliflucti<strong>on</strong> i s shownin Table 4. The surface moving rate of lhegeliflucti<strong>on</strong> is in Table 6 and the fr<strong>on</strong>t movingrate is shown in Table 7.The form of the geliflucti<strong>on</strong> in this area islobate shaped. The ratio of length to width is0.33-0.95 for most. of the geliflucti<strong>on</strong>, and themean ratio is 0.59, <strong>on</strong>ly TLG-4 is t<strong>on</strong>gue shapedwith a length to width ratio of 1.51. The heightin the middle fr<strong>on</strong>t of the geliflucti<strong>on</strong>s is1.55-2.55 melers and mean height is 1.86 meters.The slope angle of the top surface is 10"-30."and mean slope angle is 20". The fr<strong>on</strong>t slope is48"-70' and mean i.s 59". 'The ground surfaceslope in fr<strong>on</strong>t of the geliflucti<strong>on</strong> is 12e-330and the mean 1.s 20". Vein-ice 0.5-1.0 mm wasfound at the depth of 106 cm as pitting. grainsize analysis shows the mean c<strong>on</strong>tent of sand,silt, and clay are 41%, 41X and 18s: respecL.ivelyWater c<strong>on</strong> ten^ rangcs from 9.74% to 75.217: witha mean of 31X. The water c<strong>on</strong>t~nt is an inverseratio to sand c<strong>on</strong>tent and direct ratio to clayproporti<strong>on</strong>. Hard plastic tubes-of 120 rm wercinserted into the geliflucti<strong>on</strong> in August 1'390and their, angles were remeasured in August.1991 (for results see Tahle 6). Rate of thegeliflucti<strong>on</strong> surface is 6.28-16.8 cm/vr andmean rate is 13.9 cm/yr. Wood bars were stuckin the fr<strong>on</strong>t of the gel iflucti<strong>on</strong> to determinethe fr<strong>on</strong>t movcmcnt rate in Augus~ 1.990 andremeasured in August 1991 (for results sccTable 7). The minus values of the cast-ern sideat TLG-3 show movement: of the ground in fr<strong>on</strong>t.of the geliflucti<strong>on</strong> is greater than that of thefr<strong>on</strong>t of the geliflucti<strong>on</strong>. The mean rate of thegeliflucti<strong>on</strong> fr<strong>on</strong>t relative to thc grourld is2.76 crn/yr wi.th a maximum of 12.5 c.m/yr. 'Thcqoving rate of geliflucti.<strong>on</strong> varies in dirferentenvir<strong>on</strong>ments with the range of 0.5-10.0 cm/yr'(Dyke, 1981; Ragint<strong>on</strong>, 1985: Frcnch, 19711:Mackcy, 1981). In Laerd<strong>on</strong>g Pass, t.he grcat.f.rmovement is suggrsted to result from the greaterslope gradicnt, precipitati<strong>on</strong> and grounrl wat-el-.CONCLUSTONThe talus, which str<strong>on</strong>gly developsat. 3f)OO"". . . . . . .Table 4. Forms of the geliflucti<strong>on</strong> at Laerd<strong>on</strong>g Pass (measured <strong>on</strong> August 8, 1990)Gcliflucti<strong>on</strong>Number Length Width HeightaspectmeterSl.opeangleGelif 7 uct.i<strong>on</strong>Fr<strong>on</strong>t Groundsurr~ceangleang I eAlti cude21.3.1.m c L e rFr e :; t. 19" 590 2 3 OTLG-1 18.3 25.7 2.5 15" Middle 1.0 52" 20"East 175' 540 24"2800West 70 4U0 3 1 OTLE-2 8.55 17.5 1.55 150 Middle 2Y" 54.50 J 2" 2890East 7.2" 58" 1hWest 25" 6 'i" 22"TLG-3 2.8 . 4 30.0 2 .O 13' Middle 2'7 6 1 " 17.5' 2895East 20" 70" 21"TLG-4 15.7 10.4 1.65 3 7 1 6
~~ ~~Table 6. Hate of top surface movement of the geliflucti<strong>on</strong> at Laerd<strong>on</strong>g Pass1'ri.mary dip The dip angle Length of theMoving rateNumber angle of the of the next tube undergroundtube (Aug. 1990) 1991) year cm (Aug.cm yr""" "TLE-1TLG-:!I'LG-3TLE-4'TLG-512012012012012016.814.76.2815.016.6Table 7. Fr<strong>on</strong>t moving rate of the geliflucti<strong>on</strong>nt Laerd<strong>on</strong>g Pass (in 8,8, 1990-24,6, 1991)NumberTLG-1'SLG-2TLG-3TLG "4TLG-5TLE-6Western side Middle Eastern sidecm cm cm1.10.52.0--7 .O 1.00.7 -0.5-2.0 01.75 1 .o -12.5 I3950 meters above sea level in the head ofUrumqi. River, shows a surface gravel moving rateof 0.82-10.4 cm/yr and a mean rate of 3.15 cm/yr,a base linc creeping rate of 0.26-5.78 cm/yr anda mean of 2.22 cm/yr.The'block slope, which develops <strong>on</strong> the slopeangle of 34" and slope orientati<strong>on</strong> of 110" at3900 meters a.s.1. in the head of Urumqi River.shows surface gravel moving rate of 7,69 cm/yr.The lobate-shaped rock glaciers, whichdevelop at 3300-3950 meters a.s.1. in the headof Urumqi River, move down slope 0.96-49 cm/yrand the mean rate is 21 cm/yr.The active layer, which is measured <strong>on</strong> theslope gradient. of 10"-17" and slope orientati<strong>on</strong>of 90"-170° at 3460-3540 meters a.s.1. in thehead of Ilrumqi River, creeps down slope with asurface mean rate of 1.13 cmlyr.The lobate-shaped geliflucti<strong>on</strong>s, whichdevelop <strong>on</strong> the slope angle of 20' and slopeorientatioh nort,hward at 28811-2900 meters a.s.1.near Lacrd<strong>on</strong>g Pass, snows the surface movementmean rate is 13.9 cm/yr and fr<strong>on</strong>t rate is 2.75cm/yr."-REFERENCESRarsh, D., (1969) Studien und Messungen anElockgletschern in Macun, Unterengadin,Icitschrift fur Geomorphologie, Suppl. Bd.,8, pp 11-30.Baruh, D. and Hell, G., (1975) PhotogrammetrischeRewegungsmessungen am Blockglet.scher Murtel1, Oberengadln, Schweizer Alpen: IeitscherGlerscherkunde, U. Glazialgeologic 2(2),pp 111-142.Chaix, A., (1943) Les couless de blocs du ParcNati<strong>on</strong>al Suissei Le Globe, Memoires R2,pp 121-128.Corte, A.E., (1987) Rock glacier tax<strong>on</strong>omy, inROCK GLACIERS ed. Giardino; Shroder andVitck, Allen & Unwin, Bost<strong>on</strong>, pp 21-39.Cui, Zhijiu and Zhu Cheng, (1969) The StructuralType of Temperature and Mechanism of Movementof Rock Glacier at the Ycad of Urumqi Fiver,Tianshan Mountains,, Chinese Science Bulletin,V01.34, N0.15, pp 1286-1291.Dyke, A.S., (1981) Late Holocene soliflucti<strong>on</strong>rates and radio-carb<strong>on</strong> soil ages, central.Canadian Arctic, Geological Survey of Canada,Paper 81-1C, pp 17-22.Eggint<strong>on</strong>, P.A. and French, H.M., (1985) Soliflucti<strong>on</strong>and related processes, easternBanks Island, N.bI.'P., Canadian Journal ofKarth Science, 22, pp 1671-1676.French, H.M., (1974) Mass wasting at SachsHarbour, Yanks Island, N.W.T., Canada, Arcticand Alpine <strong>Research</strong> 6, pp 71-78.Gardner, J.S., (1973) The nature of talus shift<strong>on</strong> alpine talus slope, in <strong>Research</strong> in PolarGeomorphology, cd. Fahey and Thomps<strong>on</strong>, 206pp. ,Mackey, J.R. and Mnthews, W.H., (1974) Movementof Sorted Stripes, the Cinder C<strong>on</strong>e, FaribaldiPark, B.C., Canada: Arctic and Alpine<strong>Research</strong> 6, pp 347-359.Mackey, J.R., (1981) Active layer slope movementin a c<strong>on</strong>tinuous permafrost envir<strong>on</strong>ment,Garry Island, N.W.T., Canada Canadian JOU~IIAI.of Earth Sciences 18, pp 1666-1680.Michard, J.,(1950) Emploi de marques dans l'etudedes mouvements du sol: Rev. EeomorphuloguieLdynamique 1. pp 180-18Y.Osborn, G.D., (1975) Avancing rock glaciers inthe Lake L,ouise area, Banff Nati<strong>on</strong>al Fark,Alberin, Canadian Journal of Earth Science12, pp 1060-1062.Potter, N.J., (1969) Rock glaciers and masswastagein the Galena Creek area, northernAbsaroka Mountains, Univ. Minnesota Ph.D.thesis, 150 pp.Rampt<strong>on</strong>, V.N. and J.S. nugal, 11974) Quatcrnarystratigraphy and geomorphic processes <strong>on</strong> theArctic Costal plain and adjancent areas,Demarcati<strong>on</strong> Point, Yuk<strong>on</strong> Terri'tory, toMalloch Hill, n.M., Canada, Geol. SurveyPaper 74-1, Part A, p 283.Rapp, A., (1960) Recent davclopment of mountains'slopes in Karkeragge and surroundings, N.Scandinavia: Geugrafiska Annaler 42(2-3),pp 65-200.Vietoris, I,., (1972) Ilden den Blockgletacherdes Ausseren Hochebev-kars: Zei tschr,Gletscherkunde und Glazialgeologie R(1-21,pp 169-168.Wahrhaftig, C. and A. Cox, (1.959) Rock glaciersin the Alaska Ranee: Geol. SOC. America Rul1.70, pp 383-636.Washburn, A.L., (1979) Geo~ryology, RdwardArnold, pp 230-231,White, S.E., (1971) Rock glacier studies i n LheColorado Range, 1967-1968: Arctic and Alpine<strong>Research</strong> 3, pp 43-64.Xi<strong>on</strong>g Hcigang and Liu Gengnian, (1992) Measure-ment and c<strong>on</strong>siderati<strong>on</strong> <strong>on</strong> talus in TianshanMountains. Geomorphological yrucesscs andenvir<strong>on</strong>ment management c<strong>on</strong>lerencc papercollecti<strong>on</strong>, in press.
. .Zhu Cheng. (1989) The characteristics of thesurface movement of the lobate shape rockglacier from the Debris fabric, Tfanshan,China, Journal of Glaciology &.Geocryology,V01.11, No.1, pp 82-88.1091
LONG-TERM SHEAR STRENGTH OF FROST-THAW TRANSIT ZONEDing Jingkang', Xu Xueyan2 and Lou' Anjing'State Key Laboratory of Frozen Soil Engineering, LIGG, AS, China'Northeast Institute Chinese Academy of Railway Sciences*Harbin Building Engineering InstituteThe frost-thaw transit z<strong>on</strong>e is a complicated soil z<strong>on</strong>e with a certain thickness,a beginning freezing temperature, frozen and thawed soil existing together,obvious rheological characteristics and a l<strong>on</strong>g term shear strength. The 10118term shear strength equati<strong>on</strong> is obtained by Using several groups of relaxati<strong>on</strong>curves of the shear strength in the frost-thaw transit z<strong>on</strong>er The ability toresist sheqr stress is mainly due to the cohesive strength and the inner grindangle being quite small, The l<strong>on</strong>g term shear strength is about <strong>on</strong>e-sixth, l<strong>on</strong>gterm cohesive strength is about <strong>on</strong>e-fifteenth and the l<strong>on</strong>g term internal fricti<strong>on</strong>angle is about <strong>on</strong>e-twelfth when compared with their different instant values.INTRODUCTIONThe thaw of permafrost in foundati<strong>on</strong>s resultsin the strength of Eoundati<strong>on</strong> soil decreasinggreatly. So the stability of foundati<strong>on</strong>s is aproblem that should be c<strong>on</strong>sidered above all whenbuildings are designed according to the pri.ncipleof allowing the permafrost foundati<strong>on</strong>s tothaw, The strength of melting soil is small andthe temperature of the soil layer with a c'ertainthickness near the thawing fr<strong>on</strong>t maintains thebeginning to freeze temperature. The soil z<strong>on</strong>eis high in water c<strong>on</strong>tent and temperature and isthe transit z<strong>on</strong>e of melted and frozen soil andis naturally a weak layer in the foundati<strong>on</strong> offrozen soil. It is significant in the design ofslope foundati<strong>on</strong>s in permafrost regi<strong>on</strong>s and ininvestigating the mechanical. properties of thetransit z<strong>on</strong>e (S. Goto and K. Minegisgi, 1988:B.J.A. Stukert and L.J. ?lahar, 1983).The frozen soil in the transit z<strong>on</strong>e haveobviously rehological properties. This kind oftransit z<strong>on</strong>e, with melted soil in low temperatureand frozen soil of high temperature comm<strong>on</strong>lyexisting, is a more complex z<strong>on</strong>e of soilcorresp<strong>on</strong>ding to the melted and frozen soil. Tounderstand the characteristics of the transitz<strong>on</strong>e and to provide a basis for building design<strong>on</strong> slopes in permafrost regi<strong>on</strong>s, research wascarried out <strong>on</strong> the l<strong>on</strong>g term shear strength ofthe frost-thaw transit z<strong>on</strong>e, and the results arepresented as follows.TESTING METHODSUsing different shear load with the samevertical load, a set of shear creep curves canbe obtained. Then, the l<strong>on</strong>g term strengthequati<strong>on</strong> and l<strong>on</strong>g term strength can be obtainedand calculated with different vertical loads.Meanwhi1e;the l<strong>on</strong>g term strength curves andl<strong>on</strong>g term value C, @ in the soil of the frostthawtransit z<strong>on</strong>e can be obtained.Apparatus being used in the shear strengthtest is a large scale, sheet creep apparatus,Test specimens were subclay taken from the FenhuoMountain regi<strong>on</strong> of the Qingahang Plateau.The particle compositi<strong>on</strong> is that >0.05 mm takesup 37.7 percent, 0,05-0.005 mm takes up 47.7percent, CO.035 mm takes up 14.9 percent. Thephysical properties of the teat specimen areshown in Table 1.Table 1. Physical properties of the test specimenTemperature ofW(X) WL WP IP beginningfreeze ("C)to23.4 28.6 16.1 12.5 -0.1The specimen used in the test was remoldedsoil, with the density being c<strong>on</strong>trolled by thedesign dema:d of the earth filled foundati<strong>on</strong>,r=19.9 KN/~ , rd-16 KN/~. The specimen was acylinder 9.5 cm in height and 11.28 cm indiameter. The finished specimen was placed intoa low temperature cabinet to freeze for 24 hours.For the purpose of c<strong>on</strong>trolling the positi<strong>on</strong>s ofthe frost-thaw transit z<strong>on</strong>e, two pieces ofthermoelectric cell were put into the shearz<strong>on</strong>e of the specimen,The test of l<strong>on</strong>g term shear sttength is ashear test with c<strong>on</strong>stant load, c<strong>on</strong>solidati<strong>on</strong> anddrainage. The rest procedures were as follows:1) ForminR and C<strong>on</strong>trolling the Frost-thawTransit Z<strong>on</strong>e2) Addin Vertical LoadWhen :he temperature of the shear z<strong>on</strong>e is-1.5"C. half of-the vertical load is added andwhen temperature of the shear z<strong>on</strong>e is -1.O"C.the whole vertical load is added.. 1092
3) C<strong>on</strong>solidati<strong>on</strong> Time: 2.5 Hours4) ShearAfter the specimen is c<strong>on</strong>solidated, the testcan begin. During the shear process the temperaturein the frost-thaw transit z<strong>on</strong>e and shearload is kept stable.5) Failure Criteri<strong>on</strong>When shear displacement reaches 30 mm, namely27 percent of the specimen diameter, we defineit as the limited failure.6) Grade of Added L3adFor the l<strong>on</strong>g term shear strength, the gradeof added load is shown in Table 2.Horiz<strong>on</strong>talVerticalTable 2. Grade of added load(N)2800 2500 2300 2100 1900 1700 1500 13004000 J J J J J J J3000 J J J J J J2000 J J J J JThe grade of vertical load is 4000, 3300 and2000 N in the test of c<strong>on</strong>solidati<strong>on</strong> and quickshear for the frost-thaw transit z<strong>on</strong>e and meltedsoil.TEST RESULTS1. The relati<strong>on</strong>ship between shear displacementand time. Under the acti<strong>on</strong> of applied load,the she,ar deformati<strong>on</strong> obviously has the rheologiccharacteristics in the frost-thaw transit z<strong>on</strong>e.When shear stress does not change, shear strainincreases with time. When the stress is smallerthan a certain value, shear strain appears as acharacteristic of attenuati<strong>on</strong>. When the 'stressis over a certain value, shear strain shows 'thecharacteristic of n<strong>on</strong>-attenuati<strong>on</strong> as shown inFig.1, 2,, and 3. ,hf!et (mill.)Fig.2 Relati<strong>on</strong>ship curver between shear displacementand time when vertical load is P=3400N10or'1900, 170001 So0t (min.)Fig.3 Relati<strong>on</strong>ship curver between shear displacementand time when vertical load is P=4000NFig.4 shows that the strength of the frostthawtransit z<strong>on</strong>e is located between the meltedand frozen soil, its cohesive strength is largerand internal fricti<strong>on</strong> angle is smaller whencompared with melted soil, and its cohesivestrength is smaller and internal fricti<strong>on</strong> angleis larger when compared with frozen soil, asshown in Table 3. This sufficiently indicatesthe transit properties of the soil in the z<strong>on</strong>e.Testing temperature of the frozen soil below thetransit z<strong>on</strong>e is about -2.5'C (the temperatureat the beginning of freezing is -0.1"C).19001300t (min.)Fig.1 Relati<strong>on</strong>ship curver between shear displacementand time when vertical load is P-2400NFigures 1, 2 and 3 show that the curves ofshear deformati<strong>on</strong> in the frost-thaw transit z<strong>on</strong>eare teh typical creep curves of frozen soil.Under acti<strong>on</strong> of the vertical and horiz<strong>on</strong>talload in each grade, the shear deformati<strong>on</strong> offrost-thaw transit z<strong>on</strong>e has the characteristicsof creep deformati<strong>on</strong>. This indicates that thesoil in the frost-thaw transit z<strong>on</strong>e mainly hasthe characteristics of frozen soil.Fig.4 Comparesi<strong>on</strong> of shear strength2. L<strong>on</strong>g term shear strength of soil in thefrost-thaw transit z<strong>on</strong>e. As shown in the former,the soil in the frost-thaw transit z<strong>on</strong>e chiefly1093
Table 3. Instantaneous value C, c$of tested soilType of specimen C(KPa) bFrozen soil under frostthawtransit z<strong>on</strong>eFrost-thaw transit z<strong>on</strong>e 3007 ao 2629l/rI0.007 'u= 240 Kpa . ,m.Melted soil above frostthawtransit z<strong>on</strong>e47320.005 -has the characteristics of frozen soil and thusexists as a l<strong>on</strong>g term strength.Fig.5 shows a set of relaxati<strong>on</strong> curves ofshear strength in the soil frost-thaw transitz<strong>on</strong>e obtained by Fig.1, 2, and 3.k 260O.OO30 1 2 3 'dFig.6 Lgt--l/-r curveTable 5. L<strong>on</strong>g term shear strength offrost-thaw transit z<strong>on</strong>eIloo 200 300 400t (min.)Fig.5 Relaxati<strong>on</strong> curves of shear strengthFrom Fig.5 it can be seen that the curveswith different vertical load are similar.Therefore the l<strong>on</strong>g term strength of the soilin the frost-thaw transit z<strong>on</strong>e can be expressedwith the same equati<strong>on</strong> with different parameters,that is:T =- RlgAtWhere A, B - parameters determined by thetest, which the unit of A is llminute, B is KPa,t - time, minute, T - shear strength, KPa.To obtain A and R, the curve of lgt-l/t isdrawn, as shown in Fig.6, where the slope oflines is 1/B. The calculated value is exhibitedin Table 4. The l<strong>on</strong>g term s:rength of !=50 and100 years are shown in Tablr 5.Table 4 , Parameters of the rquati<strong>on</strong> for l<strong>on</strong>gterm strengthVertical400034002400(N) loadA R2955ah2216BOO800800Drawing curve of 0-T with the value inTable 5, l<strong>on</strong>g term value C, 4) of the frost-thawtransit z<strong>on</strong>e can be obtained, as shown inTable 6.40034024080.978.574.3.78.576.372,3Table 6. L<strong>on</strong>g term value of C, 9 in thefrost-thaw transit z<strong>on</strong>eLimit of C(KPa) year+50 642.410062 2.4From Table 6 , we can notice that the cohesivestrength decreases with the increase of time,but value of 4) does not vary basically and isvery small.3. Comparis<strong>on</strong> of l<strong>on</strong>g term shear strengthwith instantaneous shear strength in the frostthawtransit z<strong>on</strong>e.According to the boundary c<strong>on</strong>diti<strong>on</strong>s of thetest for l<strong>on</strong>g term shear strength, an instantaneousshear test is carried out in the frost-.thaw transit z<strong>on</strong>e. The speed of added load isc<strong>on</strong>trolled by time, that is the specimen issheared with the time of 40 to 60 sec<strong>on</strong>ds.Figure 7 shows the comparis<strong>on</strong> of l<strong>on</strong>g termshear strength with instantaneous shear strengthin the frost-thaw transit z<strong>on</strong>e. From Fig.7, itcan be understood that the l<strong>on</strong>g term shearstrength is much smaller than the instantaneousshear strength, with the former being <strong>on</strong>e-sixthof the latter. For the values of C and $, thevalue of C of the former is approximately <strong>on</strong>efifthof the latter, the value of Q of theformeris about <strong>on</strong>e-twelfth of the Latter. Thel<strong>on</strong>g term and instantaneous value of C andin the frost-thaw'tfansit z<strong>on</strong>e are.listed inTable 7.1094
~ work0 200 400 600u &Pa)Fig.7 Cornparts<strong>on</strong>. of shear strengthTable 7. Comparis<strong>on</strong> of value C and 1 in thefrost-thaw transit z<strong>on</strong>eTime C(KPa) 1L<strong>on</strong>g (50 years) 64 2.4Instantaneoustime (1 minute)300 29 .O4. Temperature variance of the shear z<strong>on</strong>eduring the shear process. It was found by thetest that the temperature of the .soil In theshear z<strong>on</strong>e increases. This indicates that thed<strong>on</strong>e by the exterior force, except forthe shear deformati<strong>on</strong>, partly c<strong>on</strong>verts intoheat. The c<strong>on</strong>versi<strong>on</strong> of energy results in alarger affect <strong>on</strong> the mechanical characteristicsof the soil in the frost-thaw transit z<strong>on</strong>e andfrozen soil in high temperature. ,In Table 8lists the variance of temperature of the centerand the border of the specimen in the fast sheartest.Table 8. Variance of soil temperature duringthe process of fast shearing (C)Type of,specimenFrozen soil undertransit z<strong>on</strong>eThe soil in frostthaw transit z<strong>on</strong>ePositi<strong>on</strong>Center Roundarv0.345 0.2540.166 0Melted soil abovefrost thaw transit 0.110 0.102 .z<strong>on</strong>e. .RemainThevaluesin thiscable ...all areaverageThis is because more heat in the border of theshear z<strong>on</strong>e is lost. During the process of shearing,the envir<strong>on</strong>ment temperature is c<strong>on</strong>trolledat -2°C and heat produced by shearing radiatedthrough the shear box. Naturally the loss ofheat at the border is more and the increase oftemperature is smaller. The rise of soil tempera-.ture in the shear z<strong>on</strong>e has a certain relati<strong>on</strong>with the appearance of the peak strength of shearstress, in which the temperature of soil rises<strong>on</strong>ly after a certain amount of displacement isproduced. In frozen soil, in general, when sheardisplacement reaches 9 percent of the specimensdiameter, thb temperature of the soil willincrease, but in melted soil and soil in thetransit z<strong>on</strong>e this value is 6 percent. Followingclosely with the rise of soil temperature, thepeak value of shear stress appears. After thatthe temperature of soil increases c<strong>on</strong>tinuously,but the shear stress decreases gradually untilthe specimen is sheared.CONCLUSIONS1. In clay, the soil in the frost-thaw transitz<strong>on</strong>e i8 a mixture of frozen soil at O°C andmelted soil with obvious rheological characteristics,and its l<strong>on</strong>g term shear strength can becalculated with the equati<strong>on</strong> of l<strong>on</strong>g termstrength presented in this thesis.2. In clay, the ability of resisting shearstress of the soil in the frost transit z<strong>on</strong>e ismainly composed of cohesive strength since the 'internal fricti<strong>on</strong> angle is very small.3. In the frost-thaw transit z<strong>on</strong>e itsinstantaneous shear strength is larger than theshear strengch of melted soil. When the stabilityis calculated for the slope in permafrostareas. the indexs C and @ should be determinedaccording to the length of time that load willbe added.REFERENCESB.Y.A. Stukert and L.J. Mahar, (1983) Proceedings,4th <str<strong>on</strong>g>Internati<strong>on</strong>al</str<strong>on</strong>g> <str<strong>on</strong>g>C<strong>on</strong>ference</str<strong>on</strong>g> <strong>on</strong><strong>Permafrost</strong>.S, Goto and K. Minegisii, (1988) Direct sheartest at a frozen/unfrozen interface,- Proceedings. 5th <str<strong>on</strong>g>Internati<strong>on</strong>al</str<strong>on</strong>g> Symposium<strong>on</strong> Ground Freezing..a .From Table 8 It can be seen that during theprocess of fast shearing the variance of soiltemperature is the largest in frozen soil,sec<strong>on</strong>d in the transit z<strong>on</strong>e and smallest in themelted soil, It also can be understood fromTable 8 that the variance of soil temperaturein the center is larger than in the border.1095
THE COMPRESSING PROPERnBS AND SALT HEAVINGMECHANISM STUDY OR SULPHATE SALTY SOILFei Xucliang'fLi Bin''The State Key Laboratory of Frozen Soil EngineeringLIGG, Chinese Academy of Sciences, China'Xian Highway and Transportati<strong>on</strong> Wniversity,Xian;ChinaIn the paper, a set of salt heaving laws of sulphate salty soil which is made by adding 3% Na,SO, inXian-loess in different dry density is obtained through simulated test. It dem<strong>on</strong>strates that when the.temperature is decresed from +25"C to -15T and the initial water c<strong>on</strong>tent is cehain, the relati<strong>on</strong> betweenthe salt heaving value of sulphate salty soil and initial dry density presents a type of parabolic. Italso exists a minimum value interval. In this test c<strong>on</strong>diti<strong>on</strong>, this interval is within the range of1.80g/cm3 when water c<strong>on</strong>tent is the best <strong>on</strong>e of the heavier compacti<strong>on</strong> standard test. It is quite importantto discover the interval for saline soil areas of highway engineering. In additi<strong>on</strong>, the analysis oftest result reveals the mechanism of salt heaving in sulphate salty soil under different initial dry density.It shows why sulphate salty soil heaving ratio changes with the initial dry density.INTRODUCTIONThere is a large area of sulphate salty soil in China. In thewareas, there arc some peculiarity in highway engineering. First,when sulphate salty soil meets water, its strength is degraded fastand occurs deformati<strong>on</strong> easily when vehicles go through. Sec<strong>on</strong>dly,sulphate salty soil can create salt heaving when temperature lowering.It leads to the dry density of the base and subgrade d&grading and strength reducing. The parts of salt heaving influencehighway's using quality greatly. These two main drawbacks dccreaseusable years of highway and cause much loss in finance.* The purpose of this study is, by simulated test in laboratory, toobtain the relati<strong>on</strong> of salt heaving ratio to initial dry density(expreeed with rd) of sulphate salty' soil subgrade, then proposing arange of initial dry density for engineering. In the proposed range,thc salt heaving can be prevented from creating. And by analyzingtest result, the salt heaving mechanism has been c<strong>on</strong>cluded why saltheaving changes when initial dty density changes.TEST METHOD " AND MAIN PARAMETERS~ ~-~Test MethodSulphate salty soil samples used are made by adding 3%Na,SO, in Xian-loess, in order to obtain the salt heaving valueand salt heaving laws ofsulphate salty soil in quantity when free*ing. Formed temperature of the samples is +2OoC; formed methodis based <strong>on</strong> Highway Civil Engineering Test Rules (JTJO51-85 ofChina), Basic test plan is showed below.- Main Parameters ." of SoilMain parameters of soil are showed below.Test C<strong>on</strong>diti<strong>on</strong>s"There is a insulating material which is 15 cm in thick aroundthe model. Freezing of sample is c<strong>on</strong>trolled by Program Tempera.ture C<strong>on</strong>troller and Cooling Bath, freezing rate is 0.5'C/ hour.Temperature range is from +25"C to -15°C.Size of sample is 8 cm in height and 10 cm in diameter. Temperatureand deformati<strong>on</strong> of sample are detected by thermal-coupdensitywaterc<strong>on</strong>tentTable 1 Test design table1.2 1.4 1.6 1.7 1.8 1.89 1.9410% d J J13.5% J d J 4'15.5% d d d d d d J17% J d d dNote: J is indicated which sample is tested in freezing; unit ofdry density is g/ cm3.le8 and displacement sensors. All data is collected by Data Taker.TEST RESULT AND ANALYSISResultBy simulated test, S-T curves (salt heaving value changingwith temperature) which deformati<strong>on</strong> ir- :hanged while cooling areobtained; as shown in Fig.] ,2,3,4.Tab.3 is the final salt heaving value taken from Fig.1,2,3,4,under every water c<strong>on</strong>tent and initial dq density.
plain mil 2.647 36.1 18.2 18.5 1.89 14.24sulphateaalty soil33.86 15.65 18.21 1 .a9 15.51Q rcU I I/ 2Tempcrature ("C)Temperature ("C)Fig. 1 Salt heaving value vs. temperature (initial water c<strong>on</strong>tent Fig.3 Salt heaving value w. temperature (initid water c<strong>on</strong>tentis 10%) (initialdrydcnsity(g/cm3)is: 1"1.3,2"1.65,3--1:5) is 15.5%) (initial dry density (g/*n') is: 1-1.89, 2-1.54,3-1.2, 4-1.6,5"1.7 6-1.8)15 > 5 -5 -15Temperature ("C)1097
~ .Table 3. Final salt heaving value (mm)waterc<strong>on</strong>tentdrydensity10% 13.5% 15.5% 17%1.2 2.982 7.088 5.109610H,O and separates from soluti<strong>on</strong> existed am<strong>on</strong>g soil grains. Saltheaving of samples increases faster in the S-T curve when temperatureis between +25T and -5OC. And the temperature range where1.3 4.3781.4 ' 2.156 5.6 4.33361.5 1.51 *1.6 1.81 4.53341.65 1.842 *1.7 4.362 3.5865 3.5881.8 2.73981.87 4.34741.89 8.933I .94 7.044* : initial dry density (g / cm3) of samples has been adjusted.According to S-T curves (Fig,l,2,3,4), <strong>on</strong>e could know that:no matter which initial water cantent and initial dry density ischosen, the salt heaving increases c<strong>on</strong>stantly while cooling. Frominspecting of all the curves, <strong>on</strong>e can discover that salt heaving is increasingquickly in range of from +lS°C to -5"C, increasing slow inrange of from +2SoC to +iST and -5'C to -15OC. Especially,when temperature is in range of from -5°C to -15"C, salt heavingin many samples increases a little or does not increase.From Fig.5 <strong>on</strong>e can see: under same initial water c<strong>on</strong>tent, withinitial dry density increasing, salt heaving ratio decreases when initialdry density docs not surpass a certain point and increases wheninitial dry density is over that point.Mechanism Analysis of Salt HeavingDuring cooling, expending of sulphate salty soil is mainly d&pended <strong>on</strong> crystallizing of NalS04 - IOH,O. Its crystallizing equati<strong>on</strong>is :. "_Na,SO,+IOH,O==Na,SO, - 10H,OAfter crystallizing, Na,SO,becomes Na,SO, IOH,O, and value ofNa,SO, * 10H,O is 3.1 times over that of Na,SO,; sometimesNa,SO, - 10H,O crystal in soil can cause more expansi<strong>on</strong>, which isdepended <strong>on</strong> the positi<strong>on</strong> that crystal lies am<strong>on</strong>g soil grains.Solubility of Na,SO, is affected greatly by temperature.When cooling (higher than -5°C). lot of Na$O,bccomes Na,S04 -(I)Initial dry density (B/ cm')Pig5 Salt heaving ratio vs. initial dry density(initial water c<strong>on</strong>tent (%) is: 1"10.0,2--13.5, 3"15.5,4--17.0)salt heaving increases fastest is between +15OC and -5'C. It is because that Na,S04 10H,O fills into gaps am<strong>on</strong>g soil grains ormakes soil grains displace when temperature is higher than +lS°Cand causes samples expanding when tempcraturc is lower than thatvalue.It should be pointed that: during cooling, as temperature ofsample being negative (
Photo. 1. Test c<strong>on</strong>diti<strong>on</strong> is :rd= I.dg/ cm', Photo. 2. Test c<strong>on</strong>diti<strong>on</strong> is : rd= I.8g/cm3, Photo. 3. Test c<strong>on</strong>diti<strong>on</strong> is :magnified I500 rimes magnifid 6500 times rd = 1.89g / cm', magnified 4000 timcsIt brings about soluti<strong>on</strong> in adjacent little or a little and crystallizingis the same. At the same time, interacti<strong>on</strong> between soil grains restrains salt heaving also. Therefore salt heaving value is smallerthen.3). When rd over than critical range, no matter whether poresare filled up by soluti<strong>on</strong> or not, Na,SO, crystal crstallizcs from soluti<strong>on</strong>in pore first with lowering of temperature. If pores are notfull of soluti<strong>on</strong>, crystallizing of crystal will make it fill up so<strong>on</strong>.Then crystal crystallizes c<strong>on</strong>tinuously and cau8es the volume ofcrystal as well as soluti<strong>on</strong> increasing incessantly. Since pores are filledup, increasing of volume will cause pores bulk and lead to oc.curing salt heaving of sample.After crystal crystallizing from soluti<strong>on</strong> in pore, crystal beginsto crystallize from soluti<strong>on</strong> combined weeker to soil grains and adjacent(then distance of soil grains has been expanded) with furthercooling. Its principle of.salt heaving is similar to that of above. Itshould be noticed that a part of crystal makes progress from portto adjacent following farther cooling (Photograph 3). It intensifiesdegree of salt heaving. Though rd is very large and moreinteracti<strong>on</strong>s between soil grain then, these forces can not resist theacti<strong>on</strong> of salt heaving force and result in salt heaving ratio rising. Ifpores in Soil have been filled up before cooling, its salt heavingprinciple is similar to above, the different is crosses the process thatcrystal needs to fill pore up.CONCLUSIONIn simulating test, salt heaving value versus tcrnperature infrozen proceeding, S-T curves show that the quickest increasingsalt heaving value range of sulphate salty soil is from +1S0C to-5'C. Salt heaving ratio will be a little when temperature is higheror lower than that range. As temperature is lower than -5'C, espelsially, salt heaving alrnostly does not be occured. Total bulk of icevolume which is crystallized by water and Na,SO, crystal causedby rising c<strong>on</strong>centrati<strong>on</strong> because of ice crystallizing in the lowertemperature is very small.As the other advantages, water c<strong>on</strong>tent,salt c<strong>on</strong>tent and coolingrate is same, the rclatio between initial dry density and the finalsalt heaving ratio of samples is approximately parabolic, with aminimum salt heaving ratio interval. For sulphate salty Soil made , 'by $ding 3% NafiO, in Xian-loess, the lowest value is in therange of 1.80g / cm3 of initial dry density when water C<strong>on</strong>tent isthe best water c<strong>on</strong>tent (this dry density is about 95% of the best drydensity).By analysis of test results, the mechanism of salt heaving hasbccn revealed, that shows why salt heaving ratio of sulphate saltymil changes with initial dry density changing. When rd is smallerthan critical value, principle of salt heaving reducing with the increasingof rd is that: positi<strong>on</strong> of soluti<strong>on</strong> in soil changes, from adjacentto pore, and so docs the crystallizing, thus bulk acti<strong>on</strong> ofcrystal in soil is reduced. The increasing restraint forcc in soil restrainsthis acti<strong>on</strong> again. As a result, salt heaving ratio decreaseswith increasing of r,, in macroscopic. As r, being critical valuerange, generally, crystal crystallizes in pore <strong>on</strong>ly, it is little or a littlecrystal crystallizing in adjacent. and restraint forcc is bigger .than.So salt heaving ratio becomes smaller. When r., is over that. range,most part of pore is filled up with the soluti<strong>on</strong>, the principle of saltheaving changes a lot with the decreasing of temperature. Crystaloccurs in pore first, it makes the POFC bulk and part of soluti<strong>on</strong> inpore transfers to adjacent. Further cooling will get the crystalcrystallizcd in adjacent, volume of sample bulks again. A part ofcrystal in pore, at the same time, goes ahead to adjacent, salt :Ieavingvalue increased <strong>on</strong>ce more. These cause salt heaving ratio increasinggreatly with adding of rd.The author wish to express his appreciati<strong>on</strong> for the financialsupport of the State Key Laboratory of Frozen Soil Engineering,LICG AS, China. Thanks also given to the staffs of the State KeyLaboratory of Frozen Soil Engineering for their help.
A.C. Fowler mcl C.G. No<strong>on</strong>Mathematical Institute, Oxford UniversityW.R. KrantzDepartment of Chemical Engineering, University of ColoradoFollowing ptwious work by Holden and co-workers, we have carried out an asymptotic reducti<strong>on</strong> forthe O'Neill-Miller model of frost, heave, which is a quantitatively accurate representati<strong>on</strong> of the originalmodel, but which <strong>on</strong>ly involves the soluti<strong>on</strong> of two first order ordinary differential equati<strong>on</strong>s. Thisreducti<strong>on</strong> call be made <strong>on</strong> the Imsis that the frozen fringe is thin, c<strong>on</strong>ducti<strong>on</strong> of heat dominates advecti<strong>on</strong>of heat,, a.nd (import,ant,ly) thc permeability of the frozen fringe is str<strong>on</strong>gly sensitive to the water c<strong>on</strong>tent.Soluti<strong>on</strong>s of t,lw reduced model give predicti<strong>on</strong>s of heave versus time and of time of formati<strong>on</strong> andthickness of discrete ice lenses, which agree with O'Neill and Miller's numerical results. Furthermore,the results can be interpreted in accord with the idea that clays heave large loads, but slowly; silts heavesmall loads, hut fast; while sands may not heave at all. An explicit heaving rate parameter can bedetermined, whose size depends <strong>on</strong> the soil type through its permeability, characteristic sucti<strong>on</strong>, and <strong>on</strong>the applied load. The method of reducti<strong>on</strong> can he applied to generalised versi<strong>on</strong>s of the O'Neill/Millermodel, and ill particular we have ca.rried 0~11, similar analyses in respect of compressible soils, saline soils,and we have also initiated work <strong>on</strong> the extensi<strong>on</strong> of the model to allow for differential frost heave.1 BACKGROUNDFrost heaving occurs when moist soil, particularly clavor silt, is frozen from the surface downwards (fig. 1). 11is manifested by an upward heaving of the surface,which is due not so much to the expansi<strong>on</strong> of watkr 011freezing, as to an upwards sucti<strong>on</strong> of the subsurfacegroundwater towards the freezing fr<strong>on</strong>t. This sucti<strong>on</strong> isthought to be due to various effects which c<strong>on</strong>tri1)ute LOcapillary-like forces; these include surface tensi<strong>on</strong>between ice and water phases, a chemical potelltial dueto an electrical double layer <strong>on</strong> clay particles, anddisjoining pressure efiects due to short range forces inthin water films. A general descripti<strong>on</strong> of frost he;lviugis given in the article by Miller (1980).As the water is drawn upwards to the freezing frollt,.it for,ms a series of discrete ice lenses in the soil. 11 isthe formati<strong>on</strong> and growth of these ice Ienses whicllcauses the heaving at the surface, which can besubstantial. Frost heave is a natural phenomenol-l whichoccurs in most northerly regi<strong>on</strong>s. It is resp<strong>on</strong>sible forwidespread damage to roads and pavements (even inEngland, where the c<strong>on</strong>structi<strong>on</strong> of the M 1 in 1959 wasf 1100
Regi<strong>on</strong> 2, frozen fringeH = qI0.1 0.2 0.3 0.4 0.5Figure 1.: Schematic picture of a heaving soil2 THE MILLER MODELMiller (1972) distinguishes between primary heave alldsec<strong>on</strong>dary heave. In the latter, a thin paltially froze11fringe of ice exists below the lowest ice lens. This regi<strong>on</strong>of soil c<strong>on</strong>tains both pore ice and pore water, and isc<strong>on</strong>sidered to be in thermodynamic equilibrium.Moreover, the freezing temperature TI within tllr Frillgris given by a generalisati<strong>on</strong> of the Clapeyroll relatio~.such that TI is related to the pore pressure exertd I.)yeach of the ice and water phases; this relati<strong>on</strong> ca.11. hetheoretically derived (Loch 1978).In allowing separate ice and water pressures pi andpw, a c<strong>on</strong>stitutive relati<strong>on</strong> between them n-lust beprescribed. Miller (1980) takes this ill the formpi - p, = f(W), where W is the volumetric waterfracti<strong>on</strong> in the fringe (fig. 2). As menti<strong>on</strong>ed, t,llis call heascribed to surface tensi<strong>on</strong> as well as ot1tc.r elk:t,s,although the physical interpretati<strong>on</strong> of. what this 11ttw1sfor ice-water re-distributi<strong>on</strong> is less clear. In fact, Millvr's'rigid ice' c<strong>on</strong>cept assumes that the pore ice is rigidlyc<strong>on</strong>nected to the lowest ice lens, and in order for lleavcto take place due to water freezing <strong>on</strong> to the IowesL Irns.this requires the rigid ice to move past the equally'rigid' (i.e. undeformable, in the model) soil particles.This is accornplished by the process of tllernlal. 1101
3 MATHEMATICALFORMULATIONThe Miller model was implemented mathematically byO’Neill and MilUer (1982,1985). They treat the frozen,unfrozen and partially frozen fringe w three separatec<strong>on</strong>tinua, and formulate c<strong>on</strong>servati<strong>on</strong> laws of heat andmass transport in each regi<strong>on</strong>. Because of the finespatial and temporal scale of the model, it is, as Black(1991) says, “hardly ready for use <strong>on</strong> practicalproblems. Computati<strong>on</strong>al difficulties are unusuallyformidable ...”. Both for this reas<strong>on</strong>, and also’ because,notwithstanding its complexity, the Miller model isc<strong>on</strong>ceptually too simple (it c<strong>on</strong>siders soil to be rigid alldsaturated, pore water to be chemically pure; and isessentially limited bo-<strong>on</strong>e-dimensi<strong>on</strong>al heaving), O’Nrilland Miller’s formulati<strong>on</strong> needs simplificati<strong>on</strong>. The wayto do this lies in making judicious approximati<strong>on</strong>s,which simplify the model without surrenderingaccuracy. Initial work by Holden (1983), Holden el al.(1985) and Piper e2 ai. (1988) has been extended byFowler (1989) and more recently Fowler and Iira~~tz(1993), using four basic approximati<strong>on</strong>s: heat transportby advecti<strong>on</strong> is small, gravitati<strong>on</strong>al effects ar? small, t.befrozen fringe is thin (due to the fact that the freezingtemperature variati<strong>on</strong> in the Clapeyr<strong>on</strong> relati<strong>on</strong> issmall), and the permeability variati<strong>on</strong> with waterfracti<strong>on</strong> is large (specifically k a WY, with -y (x 9)(O’Neill and Miller 1985) being large).These four approximati<strong>on</strong>s allow <strong>on</strong>e to reduce thecalculati<strong>on</strong> of frost heave in the O’NeiH/Miller Inodcl tothat of solving two simple first order differentialequati<strong>on</strong>s for the freezing fr<strong>on</strong>t positi<strong>on</strong> and the soilsurface elevati<strong>on</strong>. We now detail the effect, of thesesimplificati<strong>on</strong>s.Firstly, the fringe is thin compared to the length ofthe soil column, and is c<strong>on</strong>sequently seen as a surfaceby the rest of the soil. Sec<strong>on</strong>dly, c<strong>on</strong>vective transport ofheat is small compared with the c<strong>on</strong>ductive flux (i.e.the Peclet number, Pe < 1). The energy equat,i<strong>on</strong>soutside the ‘fringe then reduce to:J - 2T = f -(Tb - To)-,f - (3)*tbin zf > z > zs.Using these expressiorls to evaluate the temperaturegradient <strong>on</strong> each side of the fringe, the fringe equati<strong>on</strong>smay be solved to tieternline the locati<strong>on</strong>s of the movingboundaries z, and 2,. This c m he ~ d<strong>on</strong>e using the factthat the effects of gravity are negligible, and theexp<strong>on</strong>ent in the permeability functi<strong>on</strong> is large. This factgives rise to a bourdary layer below the lowest ice lensin which the wat,er pressure c1lalrge.s rapidly.Asymptotic methods applied to Barcy’s equati<strong>on</strong> leadto a uniformly valid espressiolr for LIE water pressure asa functi<strong>on</strong> of water c<strong>on</strong>tellt. On the formati<strong>on</strong> of a newlens, water c<strong>on</strong>terrb within t,lw boundary layer relaxesrapidly to’a steady sI,iiI,t’ illltl SO I,IW water pressure canbe c<strong>on</strong>sidered t,o l)c quasi-st(.al.ic‘.The remaining diC[iwnbial equati<strong>on</strong>s in the fringeexpress c<strong>on</strong>servatiuir of IMSS ant1 energy. The smallPeclet number anti thirr rringc allow these equati<strong>on</strong>s tobe written as a sct of algcl)raic quati<strong>on</strong>s for variables Ievaluated at each aitl(, or ~h Irillgc. Using the formsfound for the ta~Ip(~raI~tIrv a1rt1 prtwure profiles and alsothe remaining frilly(: rrlat.iolls, it is possible to reducethese algebraic q u a 1 iolls I,O ~lle 1.w0 (dinlensi<strong>on</strong>al)orchary differenlial rquatiorrs:1:, =-- +--.13(4)4 RESULTSZS - 2, ”1 - :b(5) ,in 2, > z > %f and zj > z > Zb with boundaryc<strong>on</strong>diti<strong>on</strong>s T = T, <strong>on</strong> z z,, T = To <strong>on</strong> : 2 25 andT = Tb <strong>on</strong> z = za. The soluti<strong>on</strong> to this eqbati<strong>on</strong> ill OIICdimensi<strong>on</strong> is then’ 1102
heave (mm.)0.40.3-.-.---.-P-20 kPaP-30 kPaP-40 kPb/there is an asymptot,e tit H finik ,value of N = nT,,bey<strong>on</strong>d which Iwaviltg i n this ~nodt! does not occur,since no lens forrIl;l1icm is pussiblc. On the basis of fig.5, it is possible IO ulldws1.wd IJIP absence of heave insands, <strong>on</strong> the bais ha1 No > N,., while if NO < N,,then <strong>on</strong>e expects heave LO occur, but not for arbitrarilylarge loads. These observatiwis are qualitatively similarto reported heaving characteristics, but furtherquantitative validatory work is necessary.0.20.11 2 3 4time (le sec<strong>on</strong>ds)Figure 3: Heave against time for different overburdensFigure 4: Heave paranwt,rr cy versus effective overburdenN (log-hear st:i1le), clay-type soilpermeability and the characteristic functi<strong>on</strong> f(W) infig. 2. LY is proporti<strong>on</strong>al to (saturated) permeability,which explains (obviously) why clays should heave moreslowly. than siltg.The dependence of a <strong>on</strong> load N is more complirat.rrl.Firstly, since N is an effective pressure, zero lo;tdcorresp<strong>on</strong>ds to a positive value of N = No = pa - yw,where pa is atmospheric pressure, and pm is the far fieldgroundwater pressure. In fig. 4, we plot the variati<strong>on</strong> ofa with N for values N - O(1) bar, for a characteristicrelati<strong>on</strong> f 0: (1 - S)P/S9, where S is the saturati<strong>on</strong>. aridp = 0.3, q = 0.3. This choice of p and q gives a steeplyincreasing sucti<strong>on</strong> as S is reduced, and .may beappropriate for finer soils. Depending <strong>on</strong> the size of No,we see that heave decreases more or less exp<strong>on</strong>entiallywith increasing load, but is maintained for arbitrarilylarge load. Fig. 5, <strong>on</strong> the other hand, shows cy versus Nfor p = 0.3, q = 0.1, the lower value correspording tolower sucti<strong>on</strong>s at low S, and thus a coarser soil. Here1NFigure 5: HKLW paratllrtvr LI versus effective overburdenN (log-linear scal~), mrd/silt soilI
5 CONCLUSIONS 9. Kooplnans,It.\Z'.IC. atld lt.13. h'liller 1966 Soilfreezing a dO'Neill and Miller's model wm grid locked because its Sci. Soc. AIII. l'roc. 30. (380-695.exhaordinary numerical complexity did not allow thepossibility of making any realistic extensi<strong>on</strong>s to it. Inparticular, it is c<strong>on</strong>ceptually wr<strong>on</strong>g, insofar &s theassumpti<strong>on</strong> that the ice lens velocity vi is spatiallyc<strong>on</strong>stant is (generally) inadmissible for athree-dimensi<strong>on</strong>al process. Our previous work not <strong>on</strong>lyrenders the model tractable, it allows the possibility ofextensi<strong>on</strong>s by adding new physics to the simplifieclmodel, and thus obtaining generalisati<strong>on</strong>s of this simplemodel. As an example, frost heave of saline soils lcadsto a similar reducti<strong>on</strong> as for pure pore water, thedifference lying in'that the coefficients in the result,ingeiuati<strong>on</strong>s are more complicated.The applicati<strong>on</strong> of the model simplificatio~ls out.lilletlhere to saline and compressible soils is outlined in t . 1 ~thesis by No<strong>on</strong> (1993), and further developents toinclude unsaturated soils, as well as three-dinre~~sio~~;lmodelling of differential frost heave, are in progress.6 REFERENCES1. Beskow, G. 1935 Soil freezing and frost heavingwith special applicati<strong>on</strong> to roads and railroatlx.Swed. Geol. SOC. C, no. 375, Year Book No.3.Reprinted in Black and Hardenberg (1991).2. Black, P.B. 1991 Historical perspect,ive of frost.heave research. In Black and Hardeuberg (lWl),pp.3-7.3. Black, P.B. and M.J. Hardenberg 1991 Historicalpewpectives in frost heave research. The earlyworks of S. Taber and G. Beskow. CRREL spwiitlreport 91-23. Hanover, NB.4. Fowler, A.C. 1989 Sec<strong>on</strong>dary frost heave ill f~~rrzi~~gsoils. SIAM J. Appl. Math. 49, 091-1008. '5. Fowler, A.C. and W.B. Krantz 1993 Generalizrdsec<strong>on</strong>dary frost heave model. SIAM J. Appl.Math., submitted.6. Fowler, A.C. and C.G. No<strong>on</strong> 1993 A si1t1plili(dnumerical soluti<strong>on</strong> of the Miller Inodel of suco~~rl;~~frost, heave. Cold Reg. Sci. Teclurol., in press.7. Hioklen, J.T. 1983 Approximate soluti<strong>on</strong>s forMiiler's theory of sec<strong>on</strong>dary heave. Proc. FOII~I,IIInt. C<strong>on</strong>f. <strong>Permafrost</strong>, Fairbanks, Alaqka,pp.498-503.8. IIoldcn, J.T., Piper, D. and R.H. J<strong>on</strong>es 198.5 SnlI-I(bdevelopments of a rigid ice model of frost. hravr..Proc. Fourth Int. Symp. <strong>on</strong> Ground Freczing,Sapporo, Japan, pp.93-99.soil-wnt.er clIaract.crist,ic curves. Soil
GEOCRYOLOGY IN MT. TIANSHANA.P.GorbunovKazakhstan Alpine <strong>Permafrost</strong> Laboratory of The <strong>Permafrost</strong>Institute of Siberian Branch, Russian Academy of SciencesThe total area of pcrmafrost regi<strong>on</strong> in Tianshan is 180-200 thousands Km’, which the masses ofcryolithoz<strong>on</strong>e -- 90-100 thousands Km2 in total area and 16 thousands Km3in total volume. Usually,the alpine permafrost is located above 2700-3300 m a.s.l., but in some special cases it can occur at 2000m a.s.1. or lower. The lower limit of c<strong>on</strong>tinuous permafrost lies at 3500-3700 m a.s.1.; there might not befrozen ground under some large glaciers.The permafrost in Tianshan started fornling no later than Pliocene. The rock glaciers are comm<strong>on</strong>seen in Tianshan and can be divided into two categories: the near-glacier and the near-slope area.Thefbrmcr are transformed from moraine material and the latter-from talus or rock-avalanche bodies.Tianshan, as an unitary geocryological regi<strong>on</strong>, occupies thearea in 40-46”N. latitude and 67-95’E. l<strong>on</strong>gitude. The mountainregi<strong>on</strong>s, distributing in the tempcrate z<strong>on</strong>e, el<strong>on</strong>gate al<strong>on</strong>g thebaundary between thc temperate and subtropic z<strong>on</strong>es. This determinessome of thc characteristics of the geocryological regi<strong>on</strong>.The major ridges and ranges that c<strong>on</strong>stitute this mountain systemare: Junggar Alatan, Borohoro, Yirengabirtag, Bogdashan,Karliktag, Xeliktan, Kakshaaltoo, Maigstag, Fergan, Talas andtheir offshoots. Some scientists c<strong>on</strong>sidered the Mt. Junggar Alatanas an independent mountain, but, geocryolopically, it should be includedinto the Tianshan system.The first infbrmati<strong>on</strong> of the cryogenic phenomena in Eastern(Middle) Tianshan occurred in the paper written by V.I.Roborovski, who visited the Youldos Basin in 1893. He decribedthe frost cracks and frost mounds. The first informati<strong>on</strong> ofprmaliost in Tianshan was reparted by the pedologist A.I.Rezs<strong>on</strong>ov, who visited the AK-Sai Basin in Inner Tianshan in1913. However, the systematic and purposeful research <strong>on</strong>permafrost and other cryogenic phenomena in Tianshan started <strong>on</strong>lyat 50’s and 60’s of this century.Nowadays, the area of permafrost regi<strong>on</strong>s estimated by us is180-200 thousands Km’, while the masses of cryotithoz<strong>on</strong>e -about 90-100 thousands KmZ in total area and no less than 16thousands Km3 in total volume. The following pattern could bexcn in Tianshan: the permafrost area is 10 times of the modernglaciers (about 18 thousands Km2) and two times of the total areaof masses of cryclithoz<strong>on</strong>e. This pattern is very localized, it depcnds<strong>on</strong> the helgnt of mountain and climatic factors dependentup<strong>on</strong> the geographical positi<strong>on</strong> of the regi<strong>on</strong>.If the volumetric ice c<strong>on</strong>tent is 1 % of the whole cryolithoz<strong>on</strong>e,then the total volume of ground ice ( excluding the buried glacialice) in cryolithoz<strong>on</strong>e should be 160 Km’.The permafrost z<strong>on</strong>e could be divided.into three’subz<strong>on</strong>es, i.e.,[he island ( cxtremely unstable), disc<strong>on</strong>tinuous (unstable) and c<strong>on</strong>tinuous(stable) <strong>on</strong>cs.The altitudinal limit of permafrost distributi<strong>on</strong>, dependent up-On the geographical latitude, local climate and lithological charaGteristics ( thickness of’ snow cover, compositi<strong>on</strong> of loose sediments,c~c), might be at 2500-3600 m a.s.1. with a negative mean annualair tempc:ature and above the upper limit of forest belt. However,under a special microclimatic c<strong>on</strong>diti<strong>on</strong>, for example under the coverof c<strong>on</strong>iferous trees, the small permafrost masses could be formedunder a positive mean annual air temperature, even down to the altitudeof about 2090m. Such kind of permafrost masses were fountin Northern Tianshan, Inner Tianshan and Eastern Tianshan,down to the latitude of 42”N. Thus, the Tianshan might be thesouthmost mountain systemin the Northern Ramispherc that thepermafrost could be found in forest z<strong>on</strong>e. This should be a noticeableproblem in forestry.The lower limit of the c<strong>on</strong>tinuous or stable permafrostsubz<strong>on</strong>e varice from 3500 to 3700 m a.s.I., there might not bepermafrost undcr the large glaciers, even at a c<strong>on</strong>siderable high absoluteelevati<strong>on</strong>. Comparing the altitudinal positi<strong>on</strong> of snowlineand the lower limit of c<strong>on</strong>tinuous permafrost in Tianshan, someimportant c<strong>on</strong>clusi<strong>on</strong>s could be made:The distance between snow line and the lower limit of c<strong>on</strong>tinuouspermafrost was named the c<strong>on</strong>tinentality index of permafrostsubz<strong>on</strong>e (Gorbunov,1976). Later, S.A. Harris suggested thec<strong>on</strong>tincntality as the characteristic index, made it clearly in definiti<strong>on</strong>and used it to evaluate the geocryological c<strong>on</strong>diti<strong>on</strong> in themountains of Northern America (Oral communicati<strong>on</strong>). In the paper,it is called the index of geocryological z<strong>on</strong>e ( AA ).The above indices determine the cryogenic state of the endedmoraine of modern glacier.The index in Western Tianshan shows that many endedmoraines are in the disc<strong>on</strong>tinuous and island permafrost subz<strong>on</strong>es.
, - T ITable 1. index of geocryological z<strong>on</strong>e in TianshanInner Regi<strong>on</strong> TianshanAA 0.4-1.5 (Km)such an altitudc, the wind has no a determinant cffect <strong>on</strong> snow cov.cr as seen at high elevati<strong>on</strong>, so that it can carry out its effect of protectingthe soil against cold. All of these result in the occurrence ofpcrmafrost masses down to the elevati<strong>on</strong> as low as 1800 m a.s.1. inthe regi<strong>on</strong> with little snow, while in the regi<strong>on</strong> with heavy snow,Northern Tianshan 0.3-0.4Eastern Tianshan 0.4-1.5there would be no permafrost even at 2700-2800 m. The peculiarityof landform will aggravate the difference of geocryological c<strong>on</strong>di-Junggar Alatan 0.2-0.5ti<strong>on</strong> in different altitude. Below 3500-3700 m in Tianshan, thereare many intermount depressi<strong>on</strong>s characterized by the plainlandform. There, the calm weather is dominant in winter, where thesnow cover, if it is formed, will not be distroyed by wind. At theThus, it could be said that the moraines might be completely orsecti<strong>on</strong>s in mountain valleys with a hardly flowing cold air (partially in an unfrozcn state. The formative c<strong>on</strong>diti<strong>on</strong> of glacialUrumqi river valley in the area of the Chinese Tianshanmud flow there would c<strong>on</strong>siderably differ from that morainesGlaciological Stati<strong>on</strong>) or in the depressi<strong>on</strong>s of Sysumir, Arpin,bound by permafrost. Such a c<strong>on</strong>diti<strong>on</strong> is dominant in most partsAK-can, Great and Small Uldous, the anormal cold winter couldof the Northcrn Tianshan, Inner Tianshan, Eastern Tianshan andbe encounter, At those depressi<strong>on</strong>s with c<strong>on</strong>tinuous and thick snowThe Mt. Junggar Alatan. In these rcgi<strong>on</strong>s, the large glaciers runcover, permafrost is absent, even at an elevati<strong>on</strong> as high as 3000 m,down to the disc<strong>on</strong>tinuous or island permafrost z<strong>on</strong>es, the endedbut at the places without thick and c<strong>on</strong>tinuous snow cover, themoraincs might be unfrozen or <strong>on</strong>ly a small part of the endedfrozen ground could be seen at relatively low altitude.moraines could be subject to the perennially freezing. So, theseIn the intcrmount depressi<strong>on</strong>s higher than 3500 m, becausemoraines arc distineguishcd in their poor stability and worse prestheyarc inside the mountain area (Chatir-Kelskaya,ervati<strong>on</strong> in comparis<strong>on</strong> with those moraines bound by permafrost.Kek-Ala-Chan, Kym-Terskyi Sirt), the trifling snow cover has ncThe frozen and unfrozen moraines also differ significantly fromany influence <strong>on</strong> the altitudinal positi<strong>on</strong> of the lower limit of theeach other in the internal structure. The former is characteried bythe existence of intermoraine cavities filled with the c<strong>on</strong>siderablec<strong>on</strong>tinuous permafrost subz<strong>on</strong>e, even at the plain c<strong>on</strong>diti<strong>on</strong>.amount of melt water. Their burst is usually the origin of the greatThcre is another circumstance that forms the distinctive feaglacialmud flow.tures of perennial frost in the lower and upper gcocryologicalThere is another point to be noticed. On the surface of thesubz<strong>on</strong>es of Tianshan i.e. the alpine landforms dominant in thefrozen moraine, the c<strong>on</strong>diti<strong>on</strong> is far more favourable to take formc<strong>on</strong>tinuouspermafrost subz<strong>on</strong>e.ing, because practicallySince the predominance of steep bedrock slope, the snow coverno water could infiltrate through the frozenloose-block sediments, this is quite different from the unfrozenhas no effect of protecting the ground against cold.moraine.All of these, as menti<strong>on</strong>ed above. also determine the stabilityGeocryological data in Tainshan should that, at a same latiofthe boundary of the c<strong>on</strong>tinuous permafrost subz<strong>on</strong>e and thetude, the elevati<strong>on</strong> of lower limit of the c<strong>on</strong>tinuous permafrostunstability of the boundary of the lower geocryological subz<strong>on</strong>es.didn't change significantly from placc to placc. The snowline, how- Thermal measurement in Tianshan dem<strong>on</strong>strated that the seauver,displaces very obviously with the positi<strong>on</strong> of the mountain s<strong>on</strong>al fluctuati<strong>on</strong> of ground temperature could penetrate down to aranges. Even at a same geographical latitude in Tianshan, thedepth of 20-30 m in bedrock. The minimum value of temperaturesnowline varies from 3500 to 5000 m, while the lower limit of c<strong>on</strong>wasrecorded to be -4.Y°C in bedrock (420Om a.s.I., 42'N latitude)tinuous permafrost subz<strong>on</strong>e -- <strong>on</strong>ly within 3500-3700 m a.s.I., bc- and -6.S'C in moraine (4050 m, 42'N latitude). The maximum valcausethe snowline is sensitive to the total amount and regime of . uc of thickness of cryolithoz<strong>on</strong>e was observed to be 270 m (4160matmosphere precipitati<strong>on</strong>, while the limit of the permafrost subz<strong>on</strong>e a.s.l., 42'N latitude).is mainly dependent up<strong>on</strong> the thermal c<strong>on</strong>diti<strong>on</strong> changing littleThe permafrost in Tianshan started forming no later thanfrom the periphery of Wes!ern Tianshan to the Inner Tianshan or Pliocene, before the first occurrenw of mountain glacier. Duringthe Eastern Tianshan.the period of Pliocene, Pleistocene and Holocene, the permafrostThe law decribed above doesn't deny the influence of precipi- area becamelargcr, especially in the ice ages of Quaternary. In Latetati<strong>on</strong> <strong>on</strong> the thermal regime of ground.PIeistoccne, the lower limit of permafrost extended down to theThe thing is that, at B high elevati<strong>on</strong> (higher than 3500-3700 hillfoot of Northern Tianshan at about lo00 m ad. Unlike the Mt.m), the atmosphere precipitati<strong>on</strong> will reduce in winter, and the Alps, there is no any recorded unquesti<strong>on</strong>able case to prove thestr<strong>on</strong>g and c<strong>on</strong>stant wind will form the disc<strong>on</strong>tinuous and corn- degradati<strong>on</strong> of permafrost in Tianshan, nowadays.pacted snow cover that could not protect the ground from freezingpractically.By the island permafrost subz<strong>on</strong>e, the situati<strong>on</strong> is different atthe altitudinal tang6 from the regi<strong>on</strong> with little snow to the rcgi<strong>on</strong>Special attenti<strong>on</strong> should be paid to rock glaciers. According totheir origin and positi<strong>on</strong>, the rock glaciers can be divided into twotypes, i.e., the near-slope <strong>on</strong>es and the near-glacier <strong>on</strong>es. Accordingto their age and dynamics, rock glaciers can be divided into a0with heavy snow the geographical envir<strong>on</strong>ment changes tive, inactive and ancient <strong>on</strong>es. The active rock glaciers in Tianshansignificantly. This is beduse of that in the regi<strong>on</strong> with heavy snow are no less than 4000 in number, or rather than 4000 far more.the permafrost could not form under a thick and c<strong>on</strong>tinuous snowThe near-slope rock glaciers are transformed from talus andcover, while in the regi<strong>on</strong> with little snow, the absence or thinness rock - avalanche bodies near the slope feet, the near -glacier rockof snow cover could promote ,the perennial frgczing of soils. At glaciers - mainly from the mordine materal. The formati<strong>on</strong> of the1106
near-slope glacicr is less dependent up<strong>on</strong> the evoluti<strong>on</strong> of' glacier,and the lalter, however, -- directly up<strong>on</strong> the ice advance and rctreat.When ice advance, it could be completely or partially destroyed.Thus, under the other c<strong>on</strong>diti<strong>on</strong>s being equal in thoseplaces, where the glaciers distinguish themself in high mobility thenear-glacier rock glaciers will be seen less than that in those placeswhere :he glaciers arc morc stable. This should be noticed when therock glaciers are used as the paleogcographical indicator.
THE FREEZING AND FROST HEAVE REGULARITIES OF BASE SOIL .FOR ARBITRARY SLOPE DIRECTION AND GRADIENTGuo Dianxiang, Wei Zhengfeng and Ma YijunInstitute of Hydraulics, Shan 'D<strong>on</strong>g ProvinceAfter calculating the solar radiati<strong>on</strong> energy for-arbitrary slope directi<strong>on</strong> andgradient and analyzing the effect of udnerground water table <strong>on</strong> freezing depth,relati<strong>on</strong>ships of frost and frost heave with mean annual temperature, solarradiati<strong>on</strong> energy and underground water table are set up. Mathematical models forpredicting freezing depth and frost heave of base soil are established forarbitrary slope directi<strong>on</strong> and gradient. The calculati<strong>on</strong> is checked by usingobserved data of the temperature, freezing depth and frost heave of the basesoil.I. CALCULATION OF DAILY SOLAR RADIATION FOR ,ARBITRARY SLOPE DIRECTION AND GRADIENT' In unit time, the solar energy flux projecting<strong>on</strong> unit area id defined as the solar radiati<strong>on</strong>'intensity (Si, the unit is W/m'). The planeperpendicular to the solar-ray has the maximumradiati<strong>on</strong> intensity, but, the plane parallel tothe solar-ray has the minimum radiati<strong>on</strong> intensity.The solar radiati<strong>on</strong> intensity of horiz<strong>on</strong>talground is directly proporti<strong>on</strong>al to the sinus ofthe solar height (h). C<strong>on</strong>sidering the distancebetween the sun and the earth and the influenceof atmospheric transparence, the solar radiati<strong>on</strong>intensity reaching the ground is:SSi = 7 Pm sinh (1-1)PWhere S is solar c<strong>on</strong>stant, about 1326 W/m':p is vector radius of the earth, in January, pais about 0.97; Pm is atmospheric transparence; his solar height.groundFig.1 Calculated figure of the solar radiati<strong>on</strong>intensity of canal slopeWhen the slope angle of a. canal bed is a,from the triangular relati<strong>on</strong> of Figure 1, weknow that the angle Y between the solar ray andcanal slope'can be written as Y=h + a. Therefore,when the slope directi<strong>on</strong> is perpendicular to thesolar ray, the radiati<strong>on</strong> intensity of the canalslope can.be written as:SSN 7 P, siny- 3 P, sin(h+a)P 4 P, (sinhcosr +.coshsina) (1-2)PThe solar radiati<strong>on</strong> intensityvfor an arbitraryslope can be divided into the vertical andhoriz<strong>on</strong>tal quantity. The vertical quantity ofsolar radiati<strong>on</strong> doesn't depend <strong>on</strong> any directi<strong>on</strong>,its projecti<strong>on</strong> <strong>on</strong> arbitrary gradient slopeequals P,,sinh cosa, The horiz<strong>on</strong>tal quantityof solar radiati<strong>on</strong> has to do with the varyingsolar azimuth (y), therefore, it has the strictslope directi<strong>on</strong>ality, and the projecti<strong>on</strong> of thehoriz<strong>on</strong>tal quantity <strong>on</strong> arbitrary gradient slopePm coshsinacos(y-6). At any time, <strong>on</strong>a diffeeent gradient slope, the solar radiati<strong>on</strong>intensity can be expressed as follows:SSB.,~ = ;;" Pm(siny)= -% pm[ sinhcosa+coshsinacos(y-B)]Pwhere: y is the arbitrar.y solar height <strong>on</strong>arbitrary gradient slope:(1-3.sinh = sin8sih6 t cos@cos~cosw (3-4)sinycosscosw=cosh(1-5)cos~sin~cosw-cos~sin6cosy -cosh(1-6)Where f3 is slope directi<strong>on</strong> angle, it equalszero in the north, clockwise rotati<strong>on</strong> is 360"G;y, w are respectively ,solar azimuth and hourangle, at high no<strong>on</strong>, all of them are zero, inthe afterno<strong>on</strong> positive, in the morning negative:3 is gradientangle: @ is latitude; 6 is equatoriallatitude, when the sun is to the south ofV1108
Ithe equator, 6 is negative, to the north, it ispositive.Putting (1-4), (1-51, (1-6) into (1-3) we canobtain:Spras-r Pm sinyb7 S ~~[sin~sin~cosa-cos@sinssin~cosSP+cos~cos6cosucoswtsin$cos~~inacos~oos~+cos6sin~sinBsintul (1-7)From sunrise ( ~ 1 ) to sunset (WZ), we Integrate(1-7), this is daily solar radiati<strong>on</strong>:Y'sinhdw(1-16)WlOn the .horiz<strong>on</strong>tal ground, the sunrise and.sunset hour angle can be calculated as follows:The solar radiati<strong>on</strong>s of the arbitrary slopedirecti<strong>on</strong> an$ gradient and horiz<strong>on</strong>tal groundhave a relati<strong>on</strong> as follows:(1-18)+si~~cos~sinocos~cosw+cosssinusinasinw)d~ Result are listed in Table 1.(1-8)Where,wl, w2 are sunrise and sunset hourIT. CALCULATION OF FROZEN SOIL DEPTH FORangles. The calculati<strong>on</strong> method of sunrise andARBITRARY POSITION ON THE SLOPE OF ARBITRARYsunset hour angle is the following: in theSLOPE DIRECTION ANTI GRADIENTformula (1-7), let siny=O. we can obtain:1. Calculati<strong>on</strong> of Geothermal Difference <strong>on</strong> thesin~s~n6cos~-cosQsin6sin~cosB+cos4cos~cos~cos~ Slope of Different Slope Directi<strong>on</strong> and GradientThe formula 121 between the hear flux fromtsin$cos6sin~cosBcosw+cosmsinssin6sinw-0solar radiati<strong>on</strong> ground heat interchange is asfollows:*Ve solve for w, these are sunrise and sunsethour angle. The calculati<strong>on</strong> expressi<strong>on</strong> is:nwhere:C1-cos~cos6cosa+sinQcos6sin~cos!3 (1-10)."Cz=cos6s-inusinB (1-11)C~=cosmsinssinucosB-sinQsin6cosa ,(1-12)where b,6,8 are known numbers, a is the shadedangle of a point <strong>on</strong> the canal slope, it isdivided into the leaveslope angle a and thesunslope shaded angle a! The sunslope shaded'angle U 'is under the influence of the desertedsoil height of the canal top <strong>on</strong> the oppositeshore, canal bottom width, and slope point, wecan calculate it.with the following formula:slope bottom: a'- +g -1 1(M+N'(1-13)1 1slope middle: a'= tg-(3M+ZN'(1-10)the leaveslope shaded angle equals the canalgradient angle, that i 5: \1a - +g- (+) (1-15)Iwhere M is side slope coefficient, N 1s thebottom width.'When we calculate the sunrise and sunset hourangle for different gradient and slope with theformula (1-9), at first, we should determinewhether the sunrise (or sunset.) of the slope isthe leaveslope shaded angle (a) or the sunslopeshaded angle (a'). If we put U=O into theformula (1-8). we can obtaln the daily solarradiati<strong>on</strong> of horiz<strong>on</strong>tal ground:Where Te is the earth's surface atmospherictemperature (regarded as ground surface temperature);Td is the ground surface temperaturewithout solar radiati<strong>on</strong>; B is groupd heat emissi<strong>on</strong>coefficient; As is coefficient of thermalc<strong>on</strong>ductivity of SO'i1 body: he--viscous layerthickness. (Te-Td) is the increase of groundtemperature <strong>on</strong> the horiz<strong>on</strong>tal plane under thesolar radtati<strong>on</strong>, that is (Te-Td)"At.. From theformula (2-I), we can write:The calculati<strong>on</strong> formula of the increase ofground temperature for arbitrary slope directi<strong>on</strong>and gradient can be written as follows:Atg = KtG %Where G is the rate of ground heat absorpti<strong>on</strong>;G-l=q (q is reflecti<strong>on</strong> ratio), other symbols arethe same as above.In winter, the relati<strong>on</strong> between Lhe canalbed temperature and slope directi<strong>on</strong> is veryobvious, the negative temperature ar'ea. isapproximately symmetrical with the distributi<strong>on</strong>of slope directi<strong>on</strong>. On the north slope, thedurati<strong>on</strong> of negative temperature is the l<strong>on</strong>gest,and the negative number is the largest. Centralto the north 'slope, the distributi<strong>on</strong> of negativetemperature <strong>on</strong> the two side slopes are symmetrical.With the,rotati<strong>on</strong> of slope directi<strong>on</strong>, thefreezing time'ts lagged, the thawing time isadvanced. On the south slope, the negativetemperature is the highest, the durati<strong>on</strong> ofnegative temperature is the shortest. The temperaturedifference of 5 cm deep soil layer is0 to 5'C, the temperature difference of 20 cm.deep soil layer is 2.5 to 3.0"C.
0Tahle 1. The rativ Kt of lining canal slope and horiz<strong>on</strong>tal groundin seas<strong>on</strong>ally frozcn ground regi<strong>on</strong>sLatitudeGradientSlope directiunS SE(SW) E(W) NE(NW) ElN37"Cr=c)O"45"33.7026.6"21 .8"I. 5501.8411.7321 .6271.5400.9141.3361.3601 .3291.2960.4030.7773.8iO0.8900.9160.0680.2470. 3660.4680.550000.0190.1890.318N40"9 = 9 1)45O3 9 . 7 O26.6"21.8"1 .6781.9551 .8251 .70b1 . hOh0.9741.42%1.4081 .3701 :3320.4110.7790.8690 * 8880.9140 ~ 0 30.2180.3280.42'10.5120000.1130.254N430'L=YO"45"33.7"2h.h021.8'1.8242.0801 .9291.7921.6821 .n351.4831.4601.4161.3720.4200.7810.8480.8860.9110.0580.1890.2830.3860.6700000.0460.182N46"a=90045-33.7026.6"21 -8"1.9362.2132 .Ob5I .8921.7681.0391.5461.5171.4661.4170.4270.7830.8570.8840.9080.0520.1610.2460.3380.42200000.104RemarkTo calculate the sunslopc shaded anglebottom width and canal depth.fa') according t.o t.he ratio 3:1 of the canal2. NeRative Temperature Index Calculati<strong>on</strong> forArbitrary SlopeIn China '<strong>on</strong> the study of canal base soilfreezing, according to the St-efan formula, manyresearchers provided that the relati<strong>on</strong> betweenfrozen soil depth (X) and negative temperatureindex (F) can be written AS follows:2 = Efibut, because it is difficult to solve the negative'temperature index of arbitrary slopedirecti<strong>on</strong> and gradient. and the formula can't bedirectly used to calculate the frozen soil depthof arbitrary slope directi<strong>on</strong> and gradient, thus,we regard the negative Lemperature indcx as ac<strong>on</strong>stant. According to the prartically observeddata of frozen soil, we inversely solve a seriesof canal trend coefficients, canal bed positi<strong>on</strong>coefficients, etc., thus, we calculate thefrozen soil depth for different slope directi<strong>on</strong>and gradient plane (Table 2), but, the computingwork is very complex, and the theoreticalevidence is not complete.According to the regressi<strong>on</strong> analysis ofgeothermal materials, we know that geothermalannual change regulati<strong>on</strong> can be approximatelydescribed with the sinusoid. The axis of thesikusoid is the annual mean ground temperature(Te), the half of the difference between thehighest and lowest of the curve is the georhermalamplitude (A). Fig.2 is the regressedgeothermal change procedure line of the slope,rhe shaded area is the accumulating value ofmean daily negative temperature, therefore weintergrate the shaded area from TI to TZ andwe can obtain the negative temperature index.The slopes under the solar radiati<strong>on</strong>, inwinter, the ground temperature of the slopeincreases At, the negative temperature index ofthe slope will decrease. Therefore, we integratetIFig.2 Calculated diagramture indexof the negative tempera-the ghosted shaded area from Ti to r:, and canobtain the negative t.emyerature index of theslope under the solar radiati<strong>on</strong>. Fpy arbitraryslope directi<strong>on</strong> and gradient, the generalexpressi<strong>on</strong> of the geothermal annual change is asfollows:T =(Te tAt ) t A sin-raBAfter being integrated we can obtain:(2-5)7. is c<strong>on</strong>versi<strong>on</strong> coefficient of days and degrees,3d5/360=1.01, we can c<strong>on</strong>sider that <strong>on</strong>e dayequals <strong>on</strong>e year.
ITable 2. The comparis<strong>on</strong> of the measured and computed frozenground depths for different slope directi<strong>on</strong>s:;nfii;h;;EFrosheavingfieldLubei inShangd<strong>on</strong>gSlope CalcumiddlelatedSlope Calcubottomlated0.80 1 .Oh 0.96 0.04 . 0.69 0.510.71 0.94 0.86 0.74 0.61 0.50Kz 1 .OD 1.32 1.20 1.05 0.86 0.71Calcu-SloDe latedmiddle M ~ ~ ~ -ured0.35 0.62 0.53 0.39 ' 0.23 0.090.36 0.61 0.47-0.51 0.31 0.15-0.20 0:10-0.08Kz 1 .oo 1.76 1.51 1.13 0.67 0.263. Correcti<strong>on</strong> Coefficient of Ground FreezingDepth C<strong>on</strong>sidering the Sunshine FactorThe relati<strong>on</strong>al expressi<strong>on</strong> between the freezingdepth of arbitrary slope directi<strong>on</strong> and gradientplane and horiz<strong>on</strong>tal ground can be written as:Where Zg is frozen soil depth of arbitraryslope directi<strong>on</strong> and gradient plane: X. is frozensoil depth of horiz<strong>on</strong>tal ground: F 'is negativetemperature index of arbitrary slofe directi<strong>on</strong>and gradient plane; Fo is negative temperatureindex of horiz<strong>on</strong>tal ground.AKT changes with the value of -, whenATe+Atg AT,+At -1, there is no frozen ground: -TetAtg >'the sfope yields the negative tempera.ture index,because of the different values of AtB, itcauses the difference of slope directi<strong>on</strong>ality,with the increase of A , the difference ofT tAtslope directi<strong>on</strong>ality ggts imall. In the highlatitude regi<strong>on</strong>s where solar radiati<strong>on</strong> intensityis smaller, the difference of slope directi<strong>on</strong>alityof KT is very small, but, <strong>on</strong> the south edge 'of seas<strong>on</strong>ally frozen ground regi<strong>on</strong>s, the differenceof the slope directi<strong>on</strong>ality KT is larger.When the frozen ground depth of the horiz<strong>on</strong>talground is known, we can calculate the frozenground depth of arbitrary slope directi<strong>on</strong> andgradient plane with the values of KT, under thec<strong>on</strong>diti<strong>on</strong>s of the same soil properties andburied depth of ground water.4. To Determine the Influence Coefficient ofthe Buried Depth of Ground Water <strong>on</strong> the FrozenGround DepthTo the freezing depth of the base sol1 ofcanal bed, not <strong>on</strong>ly is there the difference ofslope directi<strong>on</strong>ality <strong>on</strong> the same height, butalso there is the differehce of the up-downpositi<strong>on</strong> in the same secti<strong>on</strong>. The research foryears "about frozen ground shows, under thec<strong>on</strong>diti<strong>on</strong>s of the same soil properties andnegative'temperature, the freezing depth ismainly under the influence of the water c<strong>on</strong>tentof soil. The general regulati<strong>on</strong> is: the moreshallow the buried depth of underground water,the more the bottom moisture will migrateupwards, the phase transiti<strong>on</strong> heat which themoisture yielded resists the development of thefreezing fr<strong>on</strong>t. The freezing rate is smallerthan that of the soil layer with a low waterc<strong>on</strong>tent. !n fact, the deeper the buried depthof Eround .water,,the more the freezing depth ofthe soil body is deep, and the more shallow theunderground water table, the more the freezingdepth of the soil body is shallow. The influenceranEe (I1) 06 undernround water <strong>on</strong> the freezinndepih is.the aum OF the capilla r y elevati<strong>on</strong>height (hm) and freezing depth ( z) of soil body,that is:LSh,+zWhen L>h+z, the freezing dep t h isn't underthe influence of underground wa t er table, soKd=l. According to the material of the frostheaving test o? Zhang Ye, Gansu Province, withinthe range of LShmtZ, with the decreaae of thedistance between the underground water table andthe freezing depth, the influence of the burieddepth of underground water <strong>on</strong> the freezingincreases. The influepce coefficient of the"buried depth of underground water <strong>on</strong> the freezingdepth is Kd:- 0.96 t 0.65e-D (clay and ,silt ofdhigh and middle liquid limit) (2-10)1 = 0.94 + 0.5e-' (clay and silt of.Kdlow liquid limit),hFor the above re s<strong>on</strong>s, the freezing depth ofarbitrary point <strong>on</strong> a bitrary slope directi<strong>on</strong>and gradient plane ca be calculated a8 follows:(2-11)Where Z is the freezing depth of horiz<strong>on</strong>talground around the canal: KT ia correcti<strong>on</strong>coefficieat c<strong>on</strong>siderin4 the c<strong>on</strong>diti<strong>on</strong>s of thesunshine of different slope directi<strong>on</strong> andgradient; Kd is the influence coefficient ofthe buried depth of underground water <strong>on</strong> the,f.reezing depth.1x1. FROST HEAVING PREDICTION OF ARBITRARY SLOPE IDIRECTION AND GRADIENT PLANEAccording to the frost heave mechanism, thethree main factors causing the froat heaving are
the soil propertiea, soil moisture (it standsfor the influence of underground water table),and the negative temperature idnex. Accordingto the research achievements <strong>on</strong> canal frostheaving for years in China, the expressi<strong>on</strong> ofthe 'calculati<strong>on</strong> about frost heaving is:Ah6 - y .ZB (3-1)Where ZB is frozen ground depth <strong>on</strong> thearbitrary slope directi<strong>on</strong> and gradiedt planeunder the c<strong>on</strong>diti<strong>on</strong> of the arbitrary burieddepth of underground water, it can be calculatedaccording to the formula (2-11); y is the meanfrost heaving strength of soil (X).The relati<strong>on</strong>ship between the mean frostheaving strength and water,c<strong>on</strong>tent of soil canbe calculated as follows:1. For shallow buried underground water, thecapillary elevati<strong>on</strong> height reaches the frozenground layer, the water c<strong>on</strong>tent is larger, andthe complimental source is full. The main factoraffecting <strong>on</strong> y is the buried depth of undergroundwater, that is:-blDy = ale (3-2)Now we put the'tested values of a, b intoTable 3.2. To deep buried underground water, thecapillary elevati<strong>on</strong> height can't reach thefrozen layer, there is no compliment of theunderground water. So the relati<strong>on</strong> between yand the water c<strong>on</strong>tent before freezing is close,that is:IV. CONCLUSIONS1, The annual mean ground temperature (T,!)and the annual geothermal amplitude (A) determinedthe negative temperature index in thisregi<strong>on</strong>. The increased ground temperature At6with the daily radiati<strong>on</strong> is an important facLor..causing the differences of the negative temperatureindex.2. The buried depth of underground water andcapillary properties of soil are the importantfactors yielding the differences of frozenground depths and frost heaves in the verticaldirecti<strong>on</strong>.3. The annual mean ground temperature (Te),the annual geothermal amplitude (A), thetemperature difference bf slope directi<strong>on</strong> (AtB),and the buried depth of underground wa'ter (D)are four basic factors <strong>on</strong> the freezing of thebase soil and the predicti<strong>on</strong> of calculati<strong>on</strong> ofthe frost heaving.REFERENCESYao Zhensheng, (19 ) The principle of climatology,The Press of Sciences.Zhu Bofang, et al., (19 , ) Temperature stressand c<strong>on</strong>trol of hydraulic engineeri.ng c<strong>on</strong>cretestructure, The Hydraulic and Electric Press.Pan Shouwen, (19 ) The theoretical basic andapp1,icati<strong>on</strong> of small climatic investigati<strong>on</strong>,The Meteorological Press.Central Meteorological Bureau, (19 ) Theclimatic atlas of China, The Press of Map.y = aa(W-baWp) (3-3)where W is the mean water c<strong>on</strong>tent (X) in therange of t.he freezing depth before freezing:Wp is the plastic water c<strong>on</strong>tent (X); a,, b.are coefficients, solved in accordance withthP tested materials for years.Table 3. The statistic list. of the tested values of ai, bl in our country ~District , .Gansu Lia<strong>on</strong>in Heil<strong>on</strong>gjiang Xinjiang Shangd<strong>on</strong>gCoefficient40.0 (silty soil) 37 -0 27 .D 16.9 (silty cl-ay?a1 14.3 (sandy soil) 18.5 20.0 16.24 (soil) 46.3914.58 (sandy soil) (sandy soil)1.25 (silty soill 1.21.47 (sandy soil) 1.40.85 0.62 (silty clay)0.5 0.37 (soil)1.0 (sandy soil)0.963(sandy soil)1112
PERIGLACIAL PERIOD AND PLEISTOCENE NATURAL ENVIRONMENTOF WESTERN MOUNTATNS OF BEIJINGSeveral fossil periglacial phenomena found <strong>on</strong> the Western Mountains of Beijing enabled us to divide thePleistocene periglacial period into 6 epochs in the area. During the periglacial epochs the surface temperature waslower than that at present by 12-15°C: precipitati<strong>on</strong> in winter was higher than that at present; depth of permafrostreached -3- -20m or more; and the natural envir<strong>on</strong>ment was a savanna or tundra. The southern boundary of theperiglacial area extended to 38'N.1 Iniroducti<strong>on</strong>During the last years research <strong>on</strong> the Quaternarq periglacialphenomena has been rising to a new he1 in the world, lhe scopeand depth of the research increased significantly Intensiw researchof various recent petiglacial processes in polar and sub-polarregi<strong>on</strong>s and in some high-latitude regi<strong>on</strong>s has promoted theQuatcrnaty perlglacial rewnrch (Kaisser, 196'). Pewe.1075,Wnshhurn, I')?o) Alan! sclmtists time compared the envir<strong>on</strong>mentof formati<strong>on</strong> of the Pleistocene periglacial phen<strong>on</strong>lena with that offormati<strong>on</strong> of the recent periglac-ial phen<strong>on</strong>lena of sunilar activity.estimated the paleoclimatic c<strong>on</strong>diti<strong>on</strong>s, and rec<strong>on</strong>structed theancient natural envir<strong>on</strong>ments (Washburn, 1980; Bra& 1976,Mears, 1981) Since 1976 when periglacial involuti<strong>on</strong>s andc<strong>on</strong>gelifolds were found in China and the perigdcial climate wassuggested, the problem has attracted the attenti<strong>on</strong> of scientists, thenthe research works <strong>on</strong> thc periglacial processes and periglacialepochs in northern China were successively reported (GuoXud<strong>on</strong>g, 1984. Liu Tungsheng et al ,1087. Ciuo Yud<strong>on</strong>g. 1988. SunJianzh<strong>on</strong>g, 108 I )(1) Ice (soil) wedges. They are well preserved in ZhaitangVillage (i e. D<strong>on</strong>grhaitang) and <strong>on</strong> a platform by a hill east ofQiansangyu BrickfieldLithologically a layer of sec<strong>on</strong>dary MaIan loess and yellowishbrownloess-like soil intercalating with sand-gravel layer areexposed <strong>on</strong> the profile The sand and gravel are mostly angular andcomposed hasically of debris after weathering of diabase <strong>on</strong> thehills It indicates that this layer of loess is indigenous deposits Itsgeomorphic positi<strong>on</strong> corresp<strong>on</strong>ds to the sec<strong>on</strong>d. step terrace <strong>on</strong> theQingshuihe kver 4 iarye ice (soil) wedge was found <strong>on</strong> theprofile Hole of the wedge was filled with sand and soil and formeda soil wedge (Fig 1) The ice wedge is I O6m wide at its top and11 Discovery of Fossil Periglacial PhenomenaIhe Western Mountains are situated in the western and northcmparts of the Beijing Plain, i e In a trmslti<strong>on</strong> z<strong>on</strong>c between TaihangMowtams and Yanshan hlountalns 'The trend of the mountains ICapprownately northeast 1111: hlghest peak of the WesternMountains. D<strong>on</strong>gling Mountam. 1) at an elevati<strong>on</strong> of 2 303 m andthe sec<strong>on</strong>d peak, Baihuashan Mountain. at I 991 m most of theother mountains are Inner mounts and hdlb at ele*ati<strong>on</strong> lower thanI 000 m The main wcam, In thc rl~ca arc Yungdinghe Riber andits tnhutarie,. Qmphulhe K~tol-. ctc Quaternan depos1:s oremostly distributed <strong>on</strong> both banks of mer \alleys and ininterm<strong>on</strong>tane basins. The deposits are mainly loess and loess-likesoil and less alluvial-colluvial sand-gravels The fossil periglacialphenomenafound by LIS are most11 developed in late PleistoceneMalm loess and middle Pleistocene Lishi loess These periglacialphenomena ari ice (soil) wedges, ice (sand) wedges, periglacialinvoluti<strong>on</strong>s, c<strong>on</strong>gelifolds, c<strong>on</strong>geliturbati<strong>on</strong>s, etc.1113
0.2m wide at its bottom in an U-shape, extending to a depth of 1 60m. The fillings in the ice wedge represent coarse-grained sandgravelin its lower part (A). fine-grained sand-sail in middle partwith inclined bedding (B), and fine-grained sand-soil in upper partwith apparent involuti<strong>on</strong> bedding (C). It indicates that the icewedge after its melting was filled with c<strong>on</strong>geliturbatti<strong>on</strong> materialsfrom slope of hill(2) Ice (sand) wedges The fossil periglacial phenomena are welldeveloped and preserved <strong>on</strong> the Western mountains at QiansangyuA field observati<strong>on</strong> in 1977 indicated that the hlalan loess west of0ainsang)u Brickfield c<strong>on</strong>tains a browish-red fossil soil layer in itsupper part and a sand-gravel layer about zm thlck In its middle pari4 groups ofjuvtaposlted different.size fossil Ice (sand) wedges werefound at the bottom of the sand-gravel layer The depth of frwcracking of the ice (sand) \\edges IS usually 0 5- I 0 m I'his profilewas destroyed by diging soil for brick nlaliiny(3) Periglacial involuti<strong>on</strong>s ,A profile exhibiting the periglacialinvoluti<strong>on</strong> IS found at a loess exca\atl<strong>on</strong> pi1 north of Lhaltang BrickFactory in ecident periglacial rn>olutl<strong>on</strong> was found in the. Lishiloess at eastern side of the protila (Fig 2) It can he seen in F I 1 ~that the cryogenic periglaclal process caused the homogeneouswater-saturated loess with horiz<strong>on</strong>tal hedding to be str<strong>on</strong>g bcnt anddeformed. exhibiting well structural form of per~glacial in\oluti<strong>on</strong>On the left top of Fig 2. an ice (sod) wedge ehout l m l<strong>on</strong>g wasfound It deeply indents Into a periglacial rnlnluti<strong>on</strong>, It indicatesthat the first cold-frost climatic event was folloued immediately bya next more severely cold climatic eventfluvium or usual colluvium, but is a c<strong>on</strong>geliturbate characteristic Ofmudflow terrace. It might be formed as a result of the downwardslow creeping of active layer of permafrost or seas<strong>on</strong>ally frost soilduring their melting111 Geologic Time of Formati<strong>on</strong> of the Fossil PeriglacialPhenomenaI Geochr<strong>on</strong>ology and Stratigraphical Correlati<strong>on</strong>On the Zhaitang profile the periglacial involuti<strong>on</strong> and ice(soil)wedge that ue found are located just at the bottom of Mdanloess to the upper part of Lishj loess. Thus we infer their formati<strong>on</strong>time must be the late stage of the Middle Pleistocene. A lithostratigraphicalcorrelati<strong>on</strong> indicates that the stratigraphic positi<strong>on</strong>sof the ice (soil) wedye and ice (sand) wedge swarm at both easternand western sides of the Qiansangyu Brickfield are the upper andlower part\ 01' the Malan loess, and hence their formati<strong>on</strong> time isthe early and lata stages of Late Pleistocene. The c<strong>on</strong>gelifoldsystem in the Lishi loess at Yanchi is located in the middle andlower parts of the whole protile and hence its formati<strong>on</strong> time is theearly-middle stage of Middle Pleistocene l-he c<strong>on</strong>geliturbati<strong>on</strong>found at Guanting Forest Center is inferred to be synchr<strong>on</strong>ous withthe Shizhuang Formati<strong>on</strong> of early Pleistocene from its c<strong>on</strong>tact withunderlying Pliocene red clay and higher geomorphic positi<strong>on</strong> of thefourth-step terrace <strong>on</strong> Y<strong>on</strong>gdinghe hver at which it was found.2 Paleomagnetic datingIn order to determine geologic aye for formati<strong>on</strong> of the fossilperiglacial phenomena <strong>on</strong> two profiles at Yanchi and ChantingForest Center. he have collccted 24 specimens for palecrnagneticdating ,211 the specimens were demagnetized at an alternative fieldIblth a peak of 250 Oe. their magnetic parameters were determined<strong>on</strong> an English rotati<strong>on</strong>al magnetometer and the data were processed:md mapped <strong>on</strong> a computet The obtained results together with the,rbo~e-de>cnbed stratigraphlc positi<strong>on</strong>s and age data of the fossilpenglaclal phenomena are shown in Fig.3 It can be seen in Fig. 30 2 m3BdQsFig 1, Protile across perigl:lcral In\olutl<strong>on</strong>: 11: i,:sh: low. ,IILhaitangI Colluvium with sandy soil. 2 Sand! IoE;< -3 1.141: Ioc):.-3 Periglaclal involutr<strong>on</strong>. 5 Ice (bod) \\edge(1) C'<strong>on</strong>gelifolds Thev resulted liom c<strong>on</strong>gelati<strong>on</strong> ;intideformatl<strong>on</strong> of soil layer in the Pleistocene perlglacial area underthe severe cold climate During our field Investiyatl<strong>on</strong> thec<strong>on</strong>gelifolds were lbund in Lishi loess at mlddk lower parr of aloess profile east of Yanchi Railway Stati<strong>on</strong> Ab II 15 shown 111 Ihcfigure that the homogeneous, more compact loess laver hasunderg<strong>on</strong>e sharp bending and deformati<strong>on</strong> due to tnultlplcc<strong>on</strong>gelati<strong>on</strong>s. and became loosc In structure charactemtlc ofperiglaciatl<strong>on</strong> of the loebs(5) C<strong>on</strong>yel~turbate 4 profile ,iC't(lES the c<strong>on</strong>geliturbate I\ locatedat the site by the hlyhway about <strong>on</strong>e kilometer north ofGu:lntingForest Center <strong>on</strong> t1.c northern toot of the Western 'IlountamsLower part of the profile c<strong>on</strong>sists of Pliocene red clap and middlelowerpart of a layel- of lithologically mlxed loess..lrhe depwth withwave relief and slightly tune beddlny. Mhlch occur 111 ;I hharplyunc<strong>on</strong>formable c<strong>on</strong>tact with Pliocene red clac Thc occcrrence ofgravel layer and thin layermg of the loess-like >oil ale ltnhrrcate Indescending order, and gravels arc angular It Indicates that this la$etofdeposits uas transporied at a small dlstance and is neither normal
of'o\erall posltive polarity there are 4 polarltl ~merd c>' en!%. !heirrnagnetic Inclinati<strong>on</strong> is negatike and !vgnltlcantl\ vane4 1 hr.represent ! rewrse polanty ekcnts. name11 (rctht.nburg eirnt k . '"I ( I clOOa I3 P Lacharnp event of23 OOOa H I> 13lacL elent n! 1' 11.)\la B I' and Biua event of. 0 2-0 5U 313 U P respectncll I hemiddle apper pan of the profile at GuantinS Cc:crt Cenlcr -how115 ney;r:l:e polarity and unly the l<strong>on</strong>er pati h)\.x positit pkrttyIt Indlc;ltcs that the polarity column al<strong>on</strong>g {he\.!:ole proli!e '5 lustat the iwtom of Matsuyama recersc p~llar;~~ epoch. and 11sIhreshc4d ;\ge value is 2 43 Ua B P thc earh P!t.!:,tocene3 I hernroluminescent datingI'he tlrermoluminescent age of llalan It*c\\ at Lharlans %asreported by Lu Yanchou et al(lQ87) Mc had dSturtnrnedthemdummescent age of fossil ice wdses found( (lr! theOian\;insq,u profile The samples wet'? collected ti <strong>on</strong>^ llllinl:n1ater1aIs in ice wedges. loess in which he I ,ire found,and Its overlying loess (see Fig I) 'The result sho\$s that tillingmaterials from ice wedges are mosth debns crl d~abass,thus no agevalue mas determined I'he age of ICI~SS in i4hich ICC wedpe'uasfound is 35 000*3 SO0 a B P The age of bottom of loess owlyingthe ice wedges is 14 20011 800 a B.P It IS lnierred from thesedata that the formati<strong>on</strong> time of these ice wedges is a very severecold climate stage after 35 000 a B P and before I4 200 a B P andmav corresp<strong>on</strong>d to the time of lowest world sea lekcl in a prexailinpstage of the last glacial period, i E I8 100 ;t R PIV .4 Prelimnary dtclsloll of Periglacial pcrirdA preliminary divlsl<strong>on</strong> of thi periglacial period <strong>on</strong> the WesternMountains of Beijng is shown In Fig 3 6-7 periylacial epochs canbe divided in the area including those at Guantmg Forest CenterThey are described in ascending order as follo~s(I) Chanting periglacial epoch It IS represented by thec<strong>on</strong>geliturbstl<strong>on</strong> at Guantinp Forest Center and is a reflecti<strong>on</strong> of theEarly Quaternary periglacd cold climate Its age corresp<strong>on</strong>ds tothe bottom of Matsuyama reversal, i e. 2 43 Ma B P(2) Yanchi pcrigalcial epoch It is represented bv the c<strong>on</strong>gelifold<strong>on</strong> Yanchi profile. The loess deposits have underg<strong>on</strong>e sharpbending and deformati<strong>on</strong> under the periglacial cold climate Its agecorresp<strong>on</strong>ds to Biwa event (I). about 0 5 Ma B.P But the overlyingloess has underg<strong>on</strong>e the c<strong>on</strong>gelati<strong>on</strong> The loose texture of the soillayer may represent another cold climate e\ent.(3) Zhaitang periglacial epoch (1) It is represented by the largerperiglacial involuti<strong>on</strong> beloh the sec<strong>on</strong>d layer of fossil soil <strong>on</strong>Lhaitang profile and its age corresp<strong>on</strong>ds to Riwa event (1). about0.3 Ma B.P(4) Zhaitang periglacial epoch (11). It is represented by the Fossilice (soil) wedge indenting into the abo\e-menti<strong>on</strong>ed periglacialinvoluti<strong>on</strong> and its age corresp<strong>on</strong>ds to Riwa event (II), about 0 2 MaB.P(5) Qianwngyu periglacial epoch (1) It is represented try thefossil ice (sand) wedge swarm at the bottom of the gravel layerbelow a fossil soil layer in the MaIan loess <strong>on</strong> a profile west ofQiansangyu Bxickfield The penglacial climate was more severelycold than that in the prwious four epochs. Its age corresp<strong>on</strong>ds toBlack event, ahout 0 13 Ma B P(6) Qiansangy periglacd epoch (11) It is represented 'bq alarger fossii ice (soil) wedge <strong>on</strong> the profile east of QiansanbyuBnckfield The ice (soil) wedge was filled ~hb~ously with the/c<strong>on</strong>pchturhati<strong>on</strong> materials after its formatlotl which Is the bestewdenr*r. for the warming of periglacial cold climate Its ,agecorresp<strong>on</strong>ds to (jothenburg ekent Inferred to be 18 200 a B Prepresenting the most cold per~ylar~al climate in the area\' \arum1 Ihlr<strong>on</strong>rnent in the PleistoceneI L rtnnat~<strong>on</strong> of PaleotemperatureIt 15 :walll; c<strong>on</strong>sidered that the depth of ice wedges or sandnedpcs IS an Indicator for the desree of' cold and frost periglacialclinwe and the width of ice wedges is an indicator for thev cquency of cold and frost periglacial climate The depth of ice~cdges In Malan and Lishi loesses at Qiansangqu (41'N. 115'8'E)ani Lhaitang (39"8'N. 1 15"1'E) is 1 0-1 '3 m and width of them isI 04 m The temperature at the time of their formati<strong>on</strong> atQiansanyyl and Zhmtang must be lower than thc present-day 10°Cby 16- I SL C', as calculated from the temperature of -6- -8°C of theisotherm indicator for the southern boundap of recently active icewedges in Alaska oi' horth America suggested by Pewe (1966). ButWashburn (1980) suggested that the temperature of -6- -ROC istaken as a standard for comparis<strong>on</strong> to be too IOU and temperatureof-S"(' may be ;I more reliable upper limit at the formati<strong>on</strong> time ofIce wed~es We suggest that the temperature during the time of theice wedge formatt<strong>on</strong> at Qiansrmgyu and %haitany may taken to belower than that at present bq IS"('. as the standard taken to be -5°CIn regard to the temperature c<strong>on</strong>diti<strong>on</strong> during the formati<strong>on</strong> timeof the periglacial in\oluti<strong>on</strong>s and c<strong>on</strong>gelifolds, it was rarelydiscussed up IO no\\ But some scientists suggested that thetemperature durlng the formati<strong>on</strong> time of chaotic periglacialinvoluti<strong>on</strong>s and plngos was -2°C'. For example, the prevailing epochof the Weichsel glacial period In Netherlands (52-5374) of NorthEurope was Inferred to be -2°C from the data of chaotic periglacialinwluti<strong>on</strong>s and pmyos. that is lower than that at present by IS"C,and is c<strong>on</strong>sldered as a southern boundary of permafrost(Washburn.1WQ) I!' ne take the temperature of -2'C ah Btemperature standard during the formati<strong>on</strong> time of periglacialinvoluti<strong>on</strong>s and c<strong>on</strong>yelifolds. than the temperature during theformati<strong>on</strong> time of periglacial involuti<strong>on</strong>s and c<strong>on</strong>gelifolds atZhaitang and Yenchi may bc lowet than that at present by I Z T Itcan seen that the Western Mountains of Bejing and the southernfoot of Yanshan Mountains (38"N) can be the southern boundary ofI'leistocene permafrost or ofperiplacial area in eastern China.2 Estimati<strong>on</strong> of Pennafrost Depth7 he observed meteorological data from Zhaitang MeteorologicalStati<strong>on</strong> indicate that the mcan tcmperature in Zhaitang area duringthe last IO years is 10.1"C. louer than that in the plain area by14°C' and down to -19°C in minimum. The averaqe depth ofpermafrost is 0.76 rn and reaches 0 Ob m in maximum If during thet'leistocenc perigalcial period the temperature at Zhaitang droppeddown to -5°C. lower thati that at present by 15T, than the depth ofpermafrost at that time must be similar to that at present in thenorthetn area of Pa Hingga Range and reached 20 m OF more (XieYouyu,,tYIl) If the temperature during the periglacial perioddropped down tu -2 'C, than the depth of permafrost may belikened to that at present In the northern area of' S<strong>on</strong>gliao Plain.reachins 3-10 M below the surf'ace (Guo D<strong>on</strong>gxin et a1.,1381)3 ksumati<strong>on</strong> of Precipitati<strong>on</strong>A certain moisture 'of soil layer's, like the temperature. i$ <strong>on</strong>e ofthe necessarv prec<strong>on</strong>diti<strong>on</strong>s for c<strong>on</strong>gelifracti<strong>on</strong> and other plasticdefbnnati<strong>on</strong> of the soil laycrs. Was the precipitati<strong>on</strong> duringPleistocene periglacial period hlgher or lower than that at receotthe" An annual mean preclpitati<strong>on</strong> in the last ten vears in Zhaitangarea IS 451 9mm and 508 8mm in maximum. 80-70% of thisprecipitati<strong>on</strong> is c<strong>on</strong>centrated in June.August and September andsnou in winter. that is rare solid precipltati<strong>on</strong> 'Therefore. the soillayer is usually more moist in summer and more dy in winter.Under this climatic c<strong>on</strong>ditmn mcentlb no c<strong>on</strong>gelati<strong>on</strong> can occur it11115
the soil layer and no ice wedges can be found. In the melting seas<strong>on</strong>from the late spring to early summer <strong>on</strong>ly a small-scale c<strong>on</strong>gelpti<strong>on</strong>and frost heaving <strong>on</strong> road surface, can be found in the area wherelocal lowlands, higher groundwater table and higher moisture in soillayer are present. As shown in Fig.1, the textural and structuralflows and plastic deformati<strong>on</strong> of the filling materials indicate thatsoil layer could undergo larger frost-cracking in the periglacidperiod and larger c<strong>on</strong>gelati<strong>on</strong>, deformati<strong>on</strong> and c<strong>on</strong>geliturbati<strong>on</strong>during melting seas<strong>on</strong>s It suggeststhat the moisture of the soillayer was higher than that at present. For this reas<strong>on</strong>, the soil layercould be water-saturated and could undergo plastic creep. Itfollows that the climate at the beginning of the periglacial periodwas comparatively dry and cold, but in the middle and late epochsof the penglacial period the climate could become more cold andhumid, under which the precipitati<strong>on</strong> might be higher than thepresent-day 452mm, especially solid precipitati<strong>on</strong> in winter wasmuch higher than that at present.4. Fossil Vegetati<strong>on</strong>The sporo-pollen compositi<strong>on</strong> and species in the filling materialsfrom periglacial ice wedges at Qiansangy are similar to those ininter-periglacial Malan loess at Moshikou (Go Xud<strong>on</strong>g etd.,1981) and Zhaitmb (Yan Fuhua et a1.,1986). The main flora isArtemisia and ('hcr~opdiuceuc. less Cbrnpnsitae, Humdus,Sela~tnclla and hphedru. Am<strong>on</strong>g the woody plants Pinw andindividual Arics are found. The sporo-pollens in the loess aroundthe ice wedges are approximately the same as in their fillingmaterials, mainly Artemisia, 'hcnopndiaceae and Sc6ugincllu andindividual Pitnt.9. It indicates that the vegetati<strong>on</strong> did not signiticantlyvary from the periglacial period to the inter-penglacial period.In general, from a viewpoint of ecologic envir<strong>on</strong>ment, the abovedescribedplants are tolerant of dry and cold climate. It indicatesthat during that time the surface plants were sparse under the moredry and cold climate and windy winter. The natural features weresimilar to those of a savanna steppe landscape. But the structuraldeformati<strong>on</strong> of filling materials in the ice wedges shows that theclimate in middle and late epochs of the periglacid pwiod was morecold and humid. Therefore, the savanna might be in a tundraenvir<strong>on</strong>ment.Kaisser, K.,1969, The climate of Europe during the QuaternaryIce Age. Quat- Geology and Climate, NAS, 1-12.Liu Tangsheng, Guo Xud<strong>on</strong>g. 1987, The periglacial phenomena<strong>on</strong> loess plateau, China. Loess and periglacial Phenomena, edited byMart<strong>on</strong> Pecsi and Huth M.French, Academia Kido,Pudapest, 141-149.Mars 8.,1981, Periglacid wedges and the late Pleistoceneenvir<strong>on</strong>ment of Wyoming's interm<strong>on</strong>tane basin. Quaternary<strong>Research</strong>, 15(2), 17 Z - 195.Pkwe,T.L., 1966, Ice wedges in Alaska-Clnssificnti<strong>on</strong>,distributi<strong>on</strong> and climatic significance. in: <strong>Permafrost</strong> Intematiod<str<strong>on</strong>g>C<strong>on</strong>ference</str<strong>on</strong>g> Proc., Natl. Acad Sci., Natl. Res. Counc. hrbl., 1287,76-81,P&.d,T.L.,1975, Quaternary geology of Alaska. U.S.G.S.ProfPap., 835,145.Washburn,A.L.. 1979, Geocryology, a survey of periglacidprocesses and envir<strong>on</strong>ments, 3 13-318.Washburn,A.L.,1980, <strong>Permafrost</strong> features as evidenceof climatic change. Earth-Science Review, 15(4), 3 17-393.ReferencesLu Yenchuo et al.,1987, Thermoluminescent dating of coarsegrainedquatz frbm Malan loess. Kexue T<strong>on</strong>gbao, Journal ofSciences, (1),47-50 (id Chinese).Yan Fuhua, Ye Y<strong>on</strong>gying, and Liu Yuexia, 1986, Sporo-pollenanalysis of loess at East Zaitang of Beijing. Quaternary <strong>Research</strong> inChina, 7(1),39-43 (in Chinese with English abstract).Guo D<strong>on</strong>gxin,Li Zuofu,1981, Historic evoluti<strong>on</strong> and formati<strong>on</strong>time of permafrost in northeastern China since late Pleistocene.Glaciology and Geocryology, 3(4) (in Chinese).(30 Xud<strong>on</strong>g et al., 1981, Possibility of Quaternary glaciati<strong>on</strong> inWestern Mountain area of Beijing from "glacial traces" atMoshikou. Glaciology and Geocryology, 3(2),63-66 (in Chinese).Guo Xudangl984, A preliminary study <strong>on</strong> Quaternary climatein China. Glaciology and Ceocryology, 6( l), 49-60 (in Chinese).Guo Xud<strong>on</strong>g, 1988, A discussi<strong>on</strong> <strong>on</strong> Quaternmy glacial climateand envir<strong>on</strong>ment in China. Scientia GBographica Sinica, 8(2), I 14-126(in Chinese with English abstract).Xie Youyu, 1981, Periglacial geomorphology of NortheastChina and its z<strong>on</strong>ati<strong>on</strong>.GlaciologyandGeocryology,3(4),17-23(in Chinese).Brack R.F.,1976, Periglacial features indicative of permafrost:ice and soil wedges. Quaternary <strong>Research</strong>, 6( 1),3-26.
Haiying FU, J. G. DASH, and L. WILEN,Department of Physics,and €3. HALLET,Department of Geological Sciences and Q.uaternary <strong>Research</strong> Center,Unersity of Washingt<strong>on</strong>, Seattle, WA 98195, U.S.A.We have studied the dependence of the unfrozen water c<strong>on</strong>tent of porous media at subfreezingtemperatures <strong>on</strong> the mineralogy, size and surface properties of particles. A seriesof well characterized m<strong>on</strong>odisperse powders and natural soils were examined by a variety oftechniques, including neutr<strong>on</strong> diffracti<strong>on</strong>, quasi-elastic neutr<strong>on</strong>,scattering, time domain reflectometryand mercury porosirnetry[l] [2][3][4]. The melting process and, hence the amountof unfrozen water remaining unfrozen in porous media at subfreezing temperatures, are gavernedby surface melting, curvature effects, and impurity effects. Current theoretical treatmentsof these effects are c<strong>on</strong>sistent with experimental results.'JNTRODUCTIONIt is widely recognized that the persistence of waterin the liquid form in porous media as temperature3 dropbvlow O°C underlies many important natural phenomenainvolving freezing, including frost heaving[5][6] andfrost weatheriag[7] [8]. It is also related to a diversityof other processes ranging from ice particle sintering tocloud electtificati<strong>on</strong>[9][10]. The amount of unfrozen waterin frozen soils and rocks has been well documented,but there is no c<strong>on</strong>sensus as to its causes.Through an interdisciplinary research program weexamine the properties of unfrozen water in porous mediausing of modern experimental techniques and newtheoretical developments in c<strong>on</strong>densed matter physics11 11.We relate the persistence of unfrozen water at sub-zerotemperatures to the tendency for ice to premelt at thec<strong>on</strong>tact with foreign substrates below its bulk meltingpoint and for the freezing point to be lowered due tointerfacial curvature and solute effects. The currentstudy focuses <strong>on</strong> how much ice melts at the c<strong>on</strong>tact ofa substrate and how this melting depends <strong>on</strong> the propertiesof the substrate.EXPERIMENTSTo ensure maximum experimental sensitivity, finepowders are used as substrates in order to have a largec<strong>on</strong>tact area with ice. Powders of spherical particleare used for a c<strong>on</strong>cise theoretical treatment. We usetime domain reflectometry(TDR) to mearjure the waterfracti<strong>on</strong> in such frozen icilpowder mixtures. TDRemploys an electromagnetic wave (EM) pulse and measurathe dielectric c<strong>on</strong>stant of a medium by analyzitlgthe reflected EM pulse against the incident pulse. Thetechnique provides a sensitive indicator of minute quantitiesof water because the dielectric c<strong>on</strong>stants of waterand ice differ greatly at the observing frequency.We tested m<strong>on</strong>osized spherical powders of varioussizes and diverse cornpasiti<strong>on</strong> ranging from polystyreneto silica beads. The measured unfrozen water c<strong>on</strong>tentwas found to be c<strong>on</strong>sistent with a theory[l2] accountingfor surface melting, and the effects of curvature andsolutw (Figures 1 and 2; the apparent discrepancy inFigure 2 below lo from melting point is due to the factthat the beads are porous). Despite the wide range ofsurface properties of these powders, we found no detectablevariati<strong>on</strong> of the unfrozen water c<strong>on</strong>tent withsurface property.Powders c<strong>on</strong>sisting of irkgularly shaped particles werealso tested, including some natural soils. The simiiaritiesin n<strong>on</strong>wetting behavior of ice and mercury <strong>on</strong> mstknown materials make it possible to employ mercuryporosimetry(MP) to characterize the melting behaviorof ice in the porous media[3]. The volume of mercuryvapor is equated to that of water and the pressure P ofthe mercury is related to the temperature AT = T, -Tof ice by1117
where T, ia the melting point, p, and qm the densityand fusi<strong>on</strong> beat of ice at Tm and < the surface energyratio of ice-water to mercury-vapor. The unfrozen waterc<strong>on</strong>tents deduced from mercury pormimetry are incle accord with direct TDR measurements for a diveisityof artificial pawders(31. For samples such as naturalsoils, mercury porosimtry and TDR yield similar results,provided apparent impurity effects are taken intoaccount (Figure 3). In a freezing ice/powder mixture,impuritia are expelled into the unfrozen water a telativelypure ice crystal form giving rise to significantmelting point depressi<strong>on</strong> even for pore waters that areinitially very dilute.The temperature dependence of the unfrozen waterc<strong>on</strong>tent for diverse porous substances agrees quantitativelywith descripti<strong>on</strong>s of both curvature effects andsutface melting, a phenomen<strong>on</strong> comm<strong>on</strong> to many typesFigure 1. Water fracti<strong>on</strong> in frozen mixtureof water/polystyrene beads(5pm in radius):0: TDR; -: theoretical calculati<strong>on</strong>s[ll].1of mlida, and ~lt) actively studied topic in c<strong>on</strong>densedmatter pbyaics(ll1. A simple practical model haa beendeveloped to determine the amount of unfrozen waterbzwd <strong>on</strong> measutements of pore size distributi<strong>on</strong> andsimple theoretical atirnates of Van der Walls interacti<strong>on</strong>saffecting the water, which are insensitive to theporous media compositi<strong>on</strong> and rnineralogy[3]. In additi<strong>on</strong>,novel experiments are currently under way to determinewater transport rates over a wide temperaturerange in single film betwen ice and foreign surfaces,to provide detailed data for comparis<strong>on</strong> with theory.REFERENCES1 Gay, J.-M., Suzanne, J., Dash, J.G. and Fu, Haiying(1992) J. Cryst. Growth 123, 33.2 Maruyama, M., Eienfait, hl., Dash, J.G. and Coddens,G. (1992) J. Cryst. Growth 118, 33.3 Fu, Haiying and Dash, J.G. (1993) J. Colloidal interf.Sci., 159, 343.4 Fu, Haiying (1993) PhD Thesis, University of Washingt<strong>on</strong>,Seattle.5 Anders<strong>on</strong>, D.M. and Morgenstern, N.R. (1973) in<strong>Permafrost</strong>, Proc. 2nd Int. C<strong>on</strong>f., Natl. Acad. Sci.,Wash. D.C., pp.257-288.6 Dash, J.G. (1992) C<strong>on</strong>f. <strong>on</strong> Quantum Fluids andSolids, Penn State U.,,June.7 Walder, J. and Hallet, B. (1985) Geo. Sac. Am.Bull. 96, 336.8 Ballet, B., Walder, J.S. and Stubbs, C.W. (1991)Perma. Perigla. Prm., 2, 283.9 Gilpin, R.R. (1980) J. Colloid Surf. Sci. 77(2), 435.10 Baker, M.B. and Dash, J.G. (1989) J. Cryst. Growth,97, 770.11 Dash, J.G. (1989) C<strong>on</strong>temp. Physics 30,89.12 Cahn, J.W., Dash, J.G. and Fu, Haiying (1992) J.Cryst. Growth, 123, 101.k2 .01; .003Figure 2. Water fracti<strong>on</strong> in frozen mixtureof waterlquartr beads (1 35pm in radius):0: TDR; 0: deduced from MP; "-: theoreticalcalculati<strong>on</strong>s[ll]..oo 1.001 .01 .1T,-T1 10(K)tooFigure 3. Water fracti<strong>on</strong> in frozen mixtureof water/Faubanks silt: 0: TDR; 0: deducedfrom MP; -X-: deduced from MPwith impurity correcti<strong>on</strong>[3].
A STUDY OF THE THERMAL STATE IN THE PERMAFROSTAT THE SEJONG STATION, ANTARCTICAUk' Han andH.C. JungDept. of Env. Sci., Korea Military Academy, Seoul, Korea 139-799Borehole temperature measurements at Sej<strong>on</strong>g stati<strong>on</strong> were made by geothermaldatalogger which was designed by the investigator. During December 31, 1991 -February 1, 1992 six temperature data (at the depth of 28cm. Scm, .-12cm, -32cm,-52cm, and -70cm) were obtained by resistive sensors of CRlO and SM716 every <strong>on</strong>eminute. Fast Fourier Transformati<strong>on</strong> was made <strong>on</strong> seven temperature data includingsurface air temperature of meteorological center at Sej<strong>on</strong>g Base every thirty minutes.Profiles of surface and subsurface temperature variati<strong>on</strong>s represent freezing, thawing,and heat transfer mechanism at the boundary between active layer and permafrost tableThe thermal diffusivities are determined by the Angstrom method, using undergroundtemperatures. The thermal c<strong>on</strong>ductivities of the drilled cores and outcrops are measuredby the transient method. The thermal diffusivitv and c<strong>on</strong>ductivity measurementsof rockand soil samples give a significant signal <strong>on</strong> the inferred climatic temperature of thepast millenium at Sej<strong>on</strong>g Base by the inversi<strong>on</strong> technique with well-documentedmeteorological data. The geothermal data in ice-bearing permafrost at Sej<strong>on</strong>g scientificstati<strong>on</strong> are interpreted in terms of the temperature history <strong>on</strong> a time scale of 2,000years. Two theories are developed: a "forward" theory to calculate the resp<strong>on</strong>se ofice-bearing permafrost to a surface temperature disturbance, and an "inverse" theory tocalculate parameters characterizing the surface temperature history from suitablemeasurements in the permafrost.INTRODUCTIONThe c<strong>on</strong>structi<strong>on</strong> of the King Sej<strong>on</strong>g scientificstati<strong>on</strong> at King George Island, Antarctica, hasprovided an unprecedented opportunity for the strdyof the subsurface thermal regime in an area of tpin,ice-bearing permafrost as shown in Figure 1.Korean Antarctic <strong>Research</strong> stati<strong>on</strong>, King Sej<strong>on</strong>gBase is located near the southern shore of MatianCove which is <strong>on</strong>e of the tributary basins ofMaxwell Bay. Bart<strong>on</strong> Peninsula is free of snowduring austral summer and the exposed area isestimated to 15km': At the coast, raised beachs andmoraines are developed 5 or 7 m above sea level.The raised beaches of Fildes Peninsula whose heightis less than 20 m are known to be formed inHolocene. So all the raised beaches around KingSej<strong>on</strong>g stati<strong>on</strong> are c<strong>on</strong>sidered to be formed inBolocene(Y ang and Je<strong>on</strong>, 1990).Han(1991) and Lachenbruch et a1.(1982) analyzedthe data to obtain the characteristics of the globalwarming during the last century and an estimate ofthe equilibrium heat flow. Harris<strong>on</strong>(l991) studiedsurface temperature change and its implicati<strong>on</strong>s forthe 40,000-year surface temperature history atPrudhoe Bay, Alaska.The meteorological data are collected fromDecember 31. 1991 to February 1, 1992 at KingSej<strong>on</strong>g stati<strong>on</strong>. The near stati<strong>on</strong> level pressure wasrecorded as 989.8 mb during the period ofobservati<strong>on</strong>. The annual mean air temperature was-2.0 C and the mean wind speed was 8.0 m/s.Predominant wind directi<strong>on</strong> was northerly and themean relative humidity was 85 96. In 1991, B lowest,temperature of -24.4 C was measured at the.5th ofAugust and the greatest gust of 46.6 m/s wasobserved <strong>on</strong> the 11th of September.In King George Island, 95 96 of land surface iscovered by glaciers and snow all the your round. Thethickness of the glaciers is estimated 100 m. Theymove slowly and creep over their own bed. Ingeneral, sea surface is frozen frequently in the coldseas<strong>on</strong>. The thickness of sea-ice reaches 25 - 30 cm.1119
ce' 5t I-z04-0'0 4 8 12 16 20 24 28date (lS91.12.31-1992.2.11ANTARCTICA4- SOUTH POLEFigure 1. Locati<strong>on</strong> of the Korean Antarctic <strong>Research</strong>stati<strong>on</strong> at King Sej<strong>on</strong>g Base.Temperature measurements from <strong>on</strong>e hole atsej<strong>on</strong>g stati<strong>on</strong> were made by geothermal dataloggerwhich was designed by the investigator andCampbell Scientific Inc. Thermal properties from coresamples were measured. Six temperature data at thedepth of 28 cm, 8 em, -12 cm, -32 cm, -52 cm, and-70 cm were obtained by resistive sensors of CRlOand SM716 during every <strong>on</strong>e minute. The subsurfacetemperatures which were relatively free of thedisturbance from drilling are shown in Figure 2.The thermal diffusivities were determined by theAngstrom method using ground temperature data andlaboratory measurements. The thermal diffusivity atthe depth of 52 cm are calculated as shown in Figure3. The thermal c<strong>on</strong>ductivities from drilled samplesand outcrops were measured by the quick thermalc<strong>on</strong>ductivity method. The typical values of rocks areused to calculate the resp<strong>on</strong>se of the permafrost tosurface temperature disturbance.Fast Fourier Transformati<strong>on</strong> was made <strong>on</strong> seventemperature measurements including surface airtemperature of meteorolpgical center at Sej<strong>on</strong>g stati<strong>on</strong>during every thirty minutes. Profiles of temperaturevariati<strong>on</strong> represent freezing, thawing, and heattransfer at the boundary between the active layer andpermafrost table.Figure 2. Subsurface temperature variati<strong>on</strong>s at depthwith 52 cm. 'The time c<strong>on</strong>stant c<strong>on</strong>trolling the resp<strong>on</strong>se of theSej<strong>on</strong>g stati<strong>on</strong> permafrost thickness to a surfacetemperature change is of the order of 8,000 years.The results indicate the evidence of a complexclimate history in King George Island, Antarctica.The tentative c<strong>on</strong>clusi<strong>on</strong> drawn from geomorphic andgeothermal measurements can be rec<strong>on</strong>ciled.This study is devoted to the development of aforward theory of the resp<strong>on</strong>se of the permafrost to Hsurface temperature changes, and the development ofan inverse theory for the estimati<strong>on</strong> of thermalparameters characterizing climate history.FORWAFQ PROBLEMSince the permafrost at Sej<strong>on</strong>g Base is close tobeing in equilibrium with the surface temperature, itis adequate to use a simple analytic approximati<strong>on</strong>(Harris<strong>on</strong>, 1991).thermaldiffysivityfl depth : 32 ant depth : 52 cm016 IO 14 16 22 26 30time (day)Figure 3. Thermal diffusivityby Angstrom method.' 1120
0,. We assume that the heat transport is purelyc<strong>on</strong>ductive and that the thermal c<strong>on</strong>ductivity isc<strong>on</strong>stant except for a disc<strong>on</strong>tinuity at the base of thepermafrost.In forward theory, we find the resp<strong>on</strong>se of thepermafrost to a surface temperature To of the formTo=T,Il+e$s(t)) * (1)where Tm is the mean surface temperature, Bo is asmall n<strong>on</strong>dimensi<strong>on</strong>al parameter characterizing theamplitude of the time-dependent surface disturbance,and fs(t) is the generalized periodic functi<strong>on</strong>where the C. are Fourier coefficients, the n areinteger, and w is the angular frequency of thedisturbance. If Bo f the equilibrium permafrostthickness L, is determined bywhere kl, kp are the thermal c<strong>on</strong>ductivities of thepermafrost and of the material ben'eath it, and ktVT,is the equilibrium geothermal heat flow.For a small 90, the permafrost thickness L and thetemperature gradient VT immediately beneath thebase of the permafrost behave as follows:(11) '* -xl and aa are the thermal diffusivities of thepermafrost and of the material beneath it, and I isthe latent heat per unit volume of the permafrost.eo is real, but q", P' are complex because thethickness resp<strong>on</strong>se and the temperature gradientresp<strong>on</strong>se are not in phase with the surfacetemperature disturbance.We examine the resp<strong>on</strong>se of the permafrost atSej<strong>on</strong>g Base to the simple harm<strong>on</strong>ic surfacetemperature perturbati<strong>on</strong> and calculate the dependenceof the resp<strong>on</strong>se <strong>on</strong> frequency. The numerical valuesused are summarized in Table 1. The results are inFigure 4. In the case of the Sej<strong>on</strong>g Base, thecharacteristic frequency wc, at which the gradientresp<strong>on</strong>se parameter goes through a broad res<strong>on</strong>ance,has the value 5.46 X IOL4 yr-'. For o I* w., thepermafrost remains almost in eauilibrium with thechanging surface temperature.We also calculate the permafrost resp<strong>on</strong>ses for thesimple harm<strong>on</strong>ic surface temperature distrubance withangular frequency 0 = 7.85 X 10 yr"(the 8,000 yearperiod). The thickness and gradient amplitudes are0.54 and 0.1, respectively. In additi<strong>on</strong>, the thicknessand gradient are phase shifted: they lag the surfacetemperature by 1,150 yrs and 150 yrs.If we assume the disturbance functi<strong>on</strong> fe(t), thenthe inverse problem is to solve the equati<strong>on</strong>s (l), (31,Table 1. lnputnu, I* are n<strong>on</strong>dimensi<strong>on</strong>al parameters charactekzingthe thickness resp<strong>on</strong>se and the 'temperature gradieptresp<strong>on</strong>se, respectively.whereParameterkl 1 .o W m -'K -'ka 2.0 W m -'Ka1 52.0 m'yr"aa 22.0 m'yr"1 1.2X10⁸ Jm'3T.'" -2.0 KL (P) 30.0 mVT 30.0 Ckm-ltl 4 8.7 yearsta 20.5 yearsts 1712.3 yearsValuekl, k2 and al, RZ represent thermal c<strong>on</strong>ductivities andthermal diffusivities of the permafrost and of thematerial beneath it. Volumetric latent heat 1, surfacetemperature the permafrost thickness L(D) andthe temperature gradient beneath the permafrost VT(D)are listed. tl, ta and ts are time c<strong>on</strong>stants c<strong>on</strong>trollingthe resp<strong>on</strong>se of the permafrost.1121
Timet ( to3yrs)Figure 4. Frequency resp<strong>on</strong>se of the permafrostthickness and of the temperature gradient beneath thepermafrost for a simple harm<strong>on</strong>ic surface temperatureperturbati<strong>on</strong>.Figure 5. Profiles of the resp<strong>on</strong>ses of the permafrostthickness and the temperature gradient for the simpleharm<strong>on</strong>ic temperature perturbati<strong>on</strong> functi<strong>on</strong> with aperiod of 8,000 years.(4), (5) for Bo and T,, which are the parameterscharacterizing the surface temperature history, at t=O.After some manipulati<strong>on</strong>s, <strong>on</strong>e obtainswhere Ais defined by(13)A is disequilibrium parameter. If the permafrost isin equilibrium, then 5 = 1.Since 0. a 1, equati<strong>on</strong> (13) is accurate <strong>on</strong>ly if I *1.When Bo has been determined, T,, L, VT,,, arefound, therefore, we can determine the permafrosttemperature history.In the case of the Sej<strong>on</strong>g Base, we coulddetermine the temperature histories for the simpleharm<strong>on</strong>ic and the sawtooth disturbances. Th.e resultsare in Figure 5 and Figure 6, respectively.Ifjp =A' +fy, (14)Bo, and the surface temperature history, areindeterminate. But we have fe'" = 0.707. fl(P) = 0.533,fu(r) = 0.077 for the simple harm<strong>on</strong>ic disturbance andfe") = -0.738, fltP) = 0.313. f.'D' = 0.063 for thesawtooth functi<strong>on</strong>.The durati<strong>on</strong> of the memory of the permafrost canbe expressed in terms of t3, the time required for thepermafrost thickness to adjust to surface temperaturedisturbance. In the case of the Sej<strong>on</strong>g Base, weemphasize the 2,000-year average temperature. The-10 -a -6 -4 -2 QTime t ( IO3 yrsFigure 6, Profiles of the resp<strong>on</strong>ses of the permafrostthickness and the temperature gradient for thesaw tooth temperature perturbati<strong>on</strong> functi<strong>on</strong> with aperiod of 8,000 years.2,000-year average temperatures are -2.05 C, -2.13C for the simple harm<strong>on</strong>ic and the sawtoothdisturbance, respectively.This study is to analyze the geothermal data andsurface temperature at Sej<strong>on</strong>g Base <strong>on</strong> a 8,000-yeartime scale. Two theories are developed, a forwardproblem for calculating the resp<strong>on</strong>se characteristics ofpermafrost to surface temperature perturbati<strong>on</strong>, andan inverse problem for estimating parametersx122
~ thicknesscharacterizing the surface temperature and thermalhistory from the permafrost.The effects <strong>on</strong> the permafrost resp<strong>on</strong>se of thethree time c<strong>on</strong>stants tl, tr, and ts are calculated, andc<strong>on</strong>trol the rate of permafrost resp<strong>on</strong>se to the surfacetemperature perturbati<strong>on</strong>s. The time c<strong>on</strong>stant tl 8years is 'a measure of the temperature within thepermafrost to adjust to surface temperature change.The time c<strong>on</strong>stant tr = 20 years is a measu,re of thetime required for the temperature beneath thepermafrost to adjust to the positi<strong>on</strong> change of thebase of the permafrost. Two c<strong>on</strong>stants characterizethe effects of the sensible heat within and beneaththe permafrost. The time c<strong>on</strong>stant ts 1,712 years isa measure of the time required for the permafrostto adjust to surface temperatureperturbati<strong>on</strong>s. The third c<strong>on</strong>stant characterizes theeffects of latent heat at the base of the permafrost.Although there are three time c<strong>on</strong>stants (tl. tp, ts),the durati<strong>on</strong> of the memory of the permafrost can berepresented in ts, 1,712 years. The informati<strong>on</strong> thatcan be estimated depends <strong>on</strong> the form and the phaserelative to the present time. Therefore it is important'to c<strong>on</strong>sider the uncertainty. This uncertaintyincreases with increasing time into the past. Thepermafrost remembers best what has happened in thelast 1,712 years. In our analyses it seems desirable toemphasize the surface temperature history over thelast 2,000 years.The sawtooth and the simple harm<strong>on</strong>ic oscillati<strong>on</strong>with a 8,000-year period are used to a reas<strong>on</strong>ableapproximati<strong>on</strong> to these data. We determined thetemperature history for the sawtooth. The memoryby the permafrost is the subsurface temperaturebeneath the active layer. The comparis<strong>on</strong> of theperiodic sawtooth and the simple harm<strong>on</strong>ic is anexample of how the choice of fe affects the results.The present thermal regime at Sej<strong>on</strong>g Base putsc<strong>on</strong>straints <strong>on</strong> the subsurface temperature over thelast 2,000 years. On this time scale there has beenvery small change and the subsurface temperatureover the period was roughly the same. The 0.1 Cwarming of the past century is calculated.Han. U. Il99l) Global warming from boreholetemperature evidence. J. Kor. Earth Sci. SOC. 12,93-99.Harris<strong>on</strong>, W. D. (1991) <strong>Permafrost</strong> resp<strong>on</strong>se tosurface temperature change and its implicati<strong>on</strong>sfor the 40,000-year surface temperature history 'atPrudhoe Bay, Alaska. J. Geophys. Res. 96,683-695.Lachenbruch, A.H., H.H. Sass, B.V. Marshall, andT.H. Moses, Jr. (1982) <strong>Permafrost</strong>. heat flow, andgeothermal regime at Prudhoe Bay, Alaska. J.Geophys. Res. 87. 9301-9316.Yang, J.S. and D.S. Je<strong>on</strong> (1990) A study forenvir<strong>on</strong>mental impacts assessment <strong>on</strong> naturalenvir<strong>on</strong>ment in the new c<strong>on</strong>structi<strong>on</strong> area aroundthe Korean Antarctic stati<strong>on</strong>. Kor. .J. Polar Res. 1,25-34.
TWO-DIMENSIONAL STEFAN PROBLEM AROUND A COOLED BURIED CYLINDERH. Haoulani A.M. Cames-pintaw and J. Aguirre-puenteLaboratoire d'aerothennique du C.N.R.S4 ter, route des Gardes, 92190 -Meud<strong>on</strong>, FranceA two-dimensi<strong>on</strong>al finite element numerical method using the enthalpy as thermal variable is used totreat the Stefan problem around a shallow cylinder placed at a finite depth in the ground.Systematric calculati<strong>on</strong>s for a certain numbcr of specific cases c<strong>on</strong>duct to:the knowledge of the thermal behaviour of shallow buried pipes; a particular study of sensitivenessof the thermal systems to the pricipal parameters as boundary c<strong>on</strong>diti<strong>on</strong>s and geometrical andthermophysical characteristics; a proposed empirical model, based in rigorous calculati<strong>on</strong>s to predict theevoluti<strong>on</strong> of the freezing or thawing fr<strong>on</strong>t.The investigati<strong>on</strong> <strong>on</strong> the heat transfer phenomena in soils with change of phase leads to either asimple method to easily predict the movement of the first line around a buried pipe or a rigorous numericalcalculati<strong>on</strong>.INTRODUCTIONThe "LABORATOIRE d'AEROTHERMIQUE DUC.N.R.S" has c<strong>on</strong>ducted studies <strong>on</strong> cooled buried cavities andpipes. This group has devcloped several numerical models to solvephase change problems allowing the determinati<strong>on</strong> of the thermalregime in freezing or thawing grounds.Two relevant models have been used in many geotechnicalproblems. They make possible the determinati<strong>on</strong>, as functi<strong>on</strong> oftime, of the progressi<strong>on</strong> of the interface seperating the frozen andunfrozen z<strong>on</strong>es, and the thermal field within the domain.In this paper, we focus our attenti<strong>on</strong> <strong>on</strong> shallow buried pipes.Axi--symmetrical ModelAn axi-symmetrical, <strong>on</strong>e-dimensi<strong>on</strong>al model with phasechange was developed by Cames-pintaux et al. This model,adapted to cylindrical coordinates, allows to locate the fr<strong>on</strong>t bysolving the Neuman equati<strong>on</strong> <strong>on</strong> the interface accompanied by theequati<strong>on</strong>s of heat diffusi<strong>on</strong>.For the case of deep buried pipes, the positi<strong>on</strong> of the groundsurface does not seem to have a significant influence up<strong>on</strong> the generalevoluti<strong>on</strong> of the thermal process. Thus, the Stefan problem canbe investigated in an axi-symmetrical domain.In order to solve the problems encountered in the case of shallowburied cavities, the axi-symmetrical model presents some limitati<strong>on</strong>s.The use of a two-dimensi<strong>on</strong>al model then becomes necessary.The minimal depth at which the-problem may be treated withthe axi-symmetrical scheme needs to be defined.Enthalpy ModelA finite element enthalpy method, developed byCames-pintaux and Larnba, was used to solved the phase changeheat transfer problem by c<strong>on</strong>sidering either a disc<strong>on</strong>tinuous surfaceor a transiti<strong>on</strong> area, seperating the frozen and unfrozen z<strong>on</strong>es.This model has particularly c<strong>on</strong>tributed:to the study of the thermal bchaviour of the ground around cylindricalcavities for cryogenic Storage,to the determinati<strong>on</strong> of the domain where the axi-symmetricalmodel may be accurately used to describe or predict the thermal regime.APPLICATION OF THE TWO-DIMENSIONAL MODELTheoretical AspectEnthalpy formulati<strong>on</strong> are well adapted to the treatment ofproblems where the change of phase occurs.Two mathematical changes of variable combined with theenthalpy formulati<strong>on</strong> are used in finite element enthalpy methodproposed by Cames-pintaux and Lamba. This two-dimensi<strong>on</strong>alapproah was exploited to solve enthalpy equati<strong>on</strong>s for different geometry's of the domain under different boundary c<strong>on</strong>diti<strong>on</strong>s andfor different thennophysical characteristics of soil.Geometry of the domainA cylindrical cavity with a radius Roand at buried depth R', isc<strong>on</strong>sidered. In every case presented in this paper, R,& equal to 0.1m.The symmetry c<strong>on</strong>diti<strong>on</strong> reduces calculati<strong>on</strong>s to <strong>on</strong>ly a half ofthe system Figure 1 I T,is the plane of symmetry, r,the cylindricalsurface of the cavity and r,the surface of the ground and the otherjudiciously chosen limits of the domain. d is the width of the domainalways chosen equal to &R,. .Boundary C<strong>on</strong>diti<strong>on</strong>sThe heat flux is null <strong>on</strong> r,(d@ / 6n= 0), the temperature in thecavity @=@,,and the temperature at the surface and at theother boundary r,is 8 = Q,
The variati<strong>on</strong> of density comapanding to the transf<strong>on</strong>nati<strong>on</strong>water / ice is neglected. Thus:p,=p, = 2.01~10'kg.cm". calculati<strong>on</strong>shave been made for four hypothetical soils defined by combiningthe two extreme values of diffusivity a and two extreme Valuesof the latent heat L.Table 2 shows the four soils characterised by the product axL.hTable 2a* L latent heat latent heatFig. 1. Underground cavity scheme.The following numerical values of temperatures have beenchosen to be studied.'a1 =0.401x1o6(m2.s")thermal diffusivitya2 = 1.729~ 10"(m2.s-')23.86 79.12102.87 341.13These temperatures arc suddenly imposed at t = 0.It is assumed that the initial distributi<strong>on</strong> of temperature@,within the system is linear (Pigure 2).~-RESULTS3.7These geometrical and thennophysical characteristics wereused to solve the Stefan problem by the finite element enthalpvmethod. For the four soils, thc buried depth R'= 1.10. m and thetemperature in the cavity op, = -I 5C are c<strong>on</strong>sidered . For the foursoils, the evoluti<strong>on</strong> of the upper vertical and lower vertical frostlines arc represented respectively'oo Figure 3 and Figure 4.Fig. 2. Temperature distributi<strong>on</strong> at t =O.Thermophyaical Characteristics of the GroundTo study the effect of the thennophysical properties, particularlythermal diffusivity a and latent heat L, we have usedgeotcchnical &ita employed in previous papers. The chosenthennophysical characteristics corresp<strong>on</strong>d to extreme values ofthose c<strong>on</strong>sidered as probable in a group of soils presented bySawada and Ohmo. These values are given in table 1.Domaintable 1frozen clay unfrozen clayCIcx0.60.30.03.a, * L,100 200 300a1 a2 a1 a2 fig. 3. Frost fr<strong>on</strong>t progressi<strong>on</strong> al<strong>on</strong>g the upper vertical plane ofsymetry.heat capacity-103 ~~~0.686 c,=0.978 c,= 1.254 %= 1.291(J.K~-'.K-')k thermal(W.rn-'.K-')Time tIn previous papers, we have studied the thermal behaviourk,=O.554 k,=3.400 k,=0.236 kl=2.0m around a cooled urban pipe but <strong>on</strong>ly with help of the axi-symmet- .rial <strong>on</strong>e-dimensinal model.(day)1125
t x 106 (9)8 ' 16 24Io A,-L, x A,-L, o A,-L, A,-L,Yx a2* L,I 100 200 300Timet (day)fig. 4. Frost fr<strong>on</strong>t progressi<strong>on</strong> al<strong>on</strong>g the lower vertical plane ofsymetry.To numerically study the Stefan problem around a buried pipewith an <strong>on</strong>edimensi<strong>on</strong>al scheme, it is necessary to make a fictitiousradious R' (Fig. 5). R'delimits the domain and the sameboundary limits are utilized <strong>on</strong> r,for the tempraturc Tp,,in thepipe and <strong>on</strong> r,for the temperature TI& the surface of soil. The influence<strong>on</strong> R'and @,,positi<strong>on</strong> were studied for the four soil (Fig.6).0' 100 200 300 330R*+AR* TD;,=-lsOCTie t (day)Fig. 6 Incidence of the "R 0,' couple <strong>on</strong> the frost line positi<strong>on</strong>up<strong>on</strong> vertical axis as a functi<strong>on</strong> of time.* Intluencc of latent heat L:The influence of latent heat L <strong>on</strong> the freezing fr<strong>on</strong>t behaviourtakes place <strong>on</strong>ly for transient porti<strong>on</strong> of soluti<strong>on</strong>.This influence is negligiblc for materials with a high thermaldiffusivity, at every time t, but important for materials with a Iowthermal diffusivity a,during the transient porti<strong>on</strong> of the problem.PRACTICAL METHODfig. 5 Axi-symmetrical buried pipe.The two-dimensi<strong>on</strong>al and <strong>on</strong>e-dimensi<strong>on</strong>al numericalsimulati<strong>on</strong>s have shown the influence of the principal parameters<strong>on</strong>, the thermal behaviour around the pipe during the freeze / thawcycle.1). Incidence of the pipe depth R':For a given temperature in the cavity @,and for a given time t,it is noted that the upper vertical frozen z<strong>on</strong>e thickness increaseswhen the pipe depth R' increases.2). Variati<strong>on</strong> of the temperature @,within the cavity:For a given buried depth R', it is interesting to remark that theupper vertical freezing fr<strong>on</strong>t movement increases when the temperature@,,in the cavity decreases. Nevertheless, a limit value is im.posed by the boundary c<strong>on</strong>diti<strong>on</strong>s at the qround surface.3). Effects of the thermal properties a and L.* Effect of thermal diffusivity a:The establishment or absence of establishment of steady-stateis directly c<strong>on</strong>diti<strong>on</strong>ed by the diffusivity a. Thus,thc permanentstate is rapidly reached in media (a2,Ll) and(a2,12)presenting ahigh diffusivity.The use of an elaborate two-dimensi<strong>on</strong>al model to solve thenumerical problems for shallow buried pipe implies expensive calculati<strong>on</strong>s.Itis interesting to have a simple model to quickly predictthe interface behaviour during a time period T.The interpretati<strong>on</strong> of results leads to empirical expressi<strong>on</strong>s andgrhhs permitting a valuable synthesis of the results in the exploiteddomain.The results arc presented ai.dimensi<strong>on</strong>lcss variables with rbgard to curve of frost line obtained for:(T), = 300 days (referenced time),(e),=-1% (referenced temperature within the cavity),(It),= 1.lO.m (referenced cavity depth),(a,,L,) (referenced soil).Variati<strong>on</strong> of Pipe Buried Depth R'The referenced value Ais chosen equal to 0.71 m.For a given values of Q,,and T,, we can predict about the table3 the upward freezing fr<strong>on</strong>t locati<strong>on</strong> with the help of equati<strong>on</strong> (I):A(R)(Q,,T,)I=-(R)(O,,,T,)I.A,where a(R) can be calculated by a linear interpotati<strong>on</strong>'functi<strong>on</strong>:('11126
”-a(R)(0,,,Tl),=(0.9286.R+0.0714) (2)for 1.05m
PERMAFROST MAPHNG USING GRASSRichard K. Haugen, Nancy IT. Greeley and Charles M. CollinsU.S.Anny Corps of Engineers, Cold Regi<strong>on</strong>s <strong>Research</strong> and Engineering Laboratory, 72 LymeRoad, Hanover, NH 03755-1290Knowledge of the spatial Occurrence of permafrost is critical for hydrologic and engineering purposes.The site for our study is the Caribou-Poker Creeks <strong>Research</strong> Watershed, a 37-square-mile areanear Fairbanks, Alaska. The m<strong>on</strong>itoring of air, surface and subsurface ground temperatures since 1986in this disc<strong>on</strong>tinuous permafrost upland taiga envir<strong>on</strong>ment has provided ground truth data for proximalpermafrost and n<strong>on</strong>-permafrost underlain terrain. In our initial analysis, we found a significant correlati<strong>on</strong>(rZ=0.68) between observed mean annual surface temperature and calculated equivalent latitude foreach of the scven drill hole sites. Equivalent latitude is a theoretical index of direct solar radiati<strong>on</strong> incident<strong>on</strong> a surface, which serves as a measure of thermal energy received at that point. The use of a GIsto provide a spatial distributi<strong>on</strong> for the equivalcnt latitude index was an obvious next step in mappingpermafr4st. Arc-Info DLG files of elevati<strong>on</strong>, soil and vegetati<strong>on</strong> developed previously were translatedand imported into GRASS.An equivalent latitude map was developed in GRASS using the equivalent, latitude algorithm and an algorithm derived from the observed variati<strong>on</strong>s of mean annual air tempcraturewith elevati<strong>on</strong> within the watershed. Further development of our permafrost mapping approachwill include the locati<strong>on</strong> of all temperature recording sites with a global positi<strong>on</strong>ing system (GPS) for en-. try into the CIS and the refining of mapping algorithms to reflect differing surface energy balance regimeswithin the soil and vegetati<strong>on</strong> mapping units.~ MAP " . DEVELOPMENT " I -AND CIS PROCESSES USEDThe data used in this projcct was translated from an Arc-Infodatabase of the Caribou-Poker Creek <strong>Research</strong> Watershed developedunder the supervisi<strong>on</strong> of Leslie Morrisey for NASA. The datawas translated into a GRASS4.0 geographic informati<strong>on</strong> systemdatabase <strong>on</strong> a SUN Sparcstati<strong>on</strong> 330 system. The data resoluti<strong>on</strong> is30 meters. The projecti<strong>on</strong> used is univcrssl transvets mercator.The trnnslatcd clcvati<strong>on</strong> map was used as input to create slopeand aspect maps using the GRASS r.slopc.aspect command. Thereapcearcd to be a few placcs where slopc and aspect data wereabcrrant. These are visible in our final maps as small horiz<strong>on</strong>tallinear patterns. An attempt was made to smooth the linear data byusing GRASS'S smoothing filters, however we felt that the resultswere not worth the loss of data that occurred throughout the rest ofthe map after the filtering process.To create the equivalent latitude map we input the followingequati<strong>on</strong> into GRASS'S rmapcalc command:equivalent latitude = sin"(sin(s1ope) * cos(aspect) *cos(actua1 latitudc)+cos(slope) * sin(actua1 latitude).GRASS's r.mapcalc command didn't have a sin functi<strong>on</strong>, so thederivative equati<strong>on</strong> was used:equivlat= atan((sin(@slope.rec) * cos(@aspect.values) *cos(65.18288))+cos(~slopc.rec) * sin(65.18288))/(sqrt(I-exp((sin(@slope.rec * cos(@aspect.values) *cos(65.I 8288))+cos(@slope.rec) * sin(65.18288)),2)))The rmapcalc command processed this formula for each 30 meterdata cell of our study area and output a map of the results for eachdata cell, an equivalent latitude map. The "@"-sign is required inGRASS to enable the use of the category value instead of the cat&gory number in each of the map layers used.To create the mean annual surface temperature (MAST) map,a regressi<strong>on</strong> cquari<strong>on</strong> was developed using elevati<strong>on</strong>, cquivalent latitudeand temperature data from data sites in the study area.R.mapcalc was run using this equati<strong>on</strong>:mastactual = 21.704-0.003 * elevati<strong>on</strong>-0.29 * equivlat.Temperatures of iryersi<strong>on</strong> z<strong>on</strong>es were then added to the MASTmap using the GRASS command r.infer to extract the inversi<strong>on</strong>z<strong>on</strong>es from elevati<strong>on</strong> and slope maps. Docket inversi<strong>on</strong> z<strong>on</strong>es at elevati<strong>on</strong>sfrom 250-599 meters were assigned a MAST of -2.O'Cand other inversi<strong>on</strong> z<strong>on</strong>es from 195-249 meters were assigned aMAST of -4.O'C.Decisi<strong>on</strong>-making rules were developed that would define areas with underlying permafrost. We then used these rules in a scriptfile with GRASS'S r.infer command to create the pcrmafrost maplayer. The following is the inference Tules table script file used tocreate a map predicling permafrost according to the predictedMAST map, clcvati<strong>on</strong>, slope and equivalent latitude:IFMAP mast-plus104-10THENMAPRYP9(mast permafrost z<strong>on</strong>e)IFMAP elevati<strong>on</strong> 195-249THENMAPHYP l0-4.6(inversi<strong>on</strong> z<strong>on</strong>e)IFMAP elevati<strong>on</strong> 250-599ANDIFMAP slope.rtc0-5THENMAPHYP 1 I(pocket inversi<strong>on</strong> z<strong>on</strong>e)IFMAP equivlat 67-90THENMAPHYP 12 (permafrost).GRASS evaluates each data cell of the map layers named inthis table (MAST, elevati<strong>on</strong>, slope and cquivalent latitude) andcreates a new map layer in which the cell is placed into a category1128
according to the "rules" of the table. In this caw cells which fall intothe following categories would be put into the permafrost category in the new map Iaycr: MAST Categories from -6OC to O'C, elevati<strong>on</strong>categories from 195-249 meters, elevati<strong>on</strong> categories above67'north latitude. (Notice that the category numbers into whichthese cells were placed were originally 9 through 10. These were laterreclassilied into category 2 while every other data cell in the newmap was reclassified into category I).The predicted MAST and predicted permafrost maps shown inthis study have areas of solid black%olorati<strong>on</strong> which are not de-Lined in the legends. These are actually areas,in which the patternsare so dense that the area outlines or patter'ns create the blackeffect.FUTURE RESEARCHAlthough the Caribou-Poker <strong>Research</strong> Watershed has beenextensively studied by many researchers since it was first designatedas a research area in the early 1970's. this study is the first systematic,l<strong>on</strong>gterm attcrnpt to measure ground temperatures within thewatershed with the objective of defining permafrost distributi<strong>on</strong> relati<strong>on</strong>ships.The sites selected for ground temperature m<strong>on</strong>itoringin Caribou-Poker Creeks <strong>Research</strong> Watershed were selected to;ample a wide diversity of atmospheric, vegetative, and geologiccharacteristics, all of which influenct ground temperature patternsand therefore the distributi<strong>on</strong> of permafrost. The ground temperatureinformati<strong>on</strong> from this study combined with detailed informati<strong>on</strong><strong>on</strong> site characteristics will permit the analysis of the complexdistributi<strong>on</strong> of permafrost in thc watershed.-The equipment neededto c<strong>on</strong>tinually record air temperatures and near-surfacc groundtempetiatures at each of the borehole sites is expensive, and <strong>on</strong>ly recently have we been able to begin acquiring and installing thisinstrumentati<strong>on</strong>, Three four channel data loggers were installed atthree sites(T-I, K-25, and K-20A) in 1990. They are recording airtemperature, temperature at two levels in the organic layer, and atthe organic/mineral soil interface. In August 1991 a 12 channellogger with senors ranging from "150 cm above the mineral / organicsoil interface to -140 cm below this surface, was installed at avalley bottom site near T-IA. These instruments, together withadditi<strong>on</strong>al sensors designed to measure other comp<strong>on</strong>ents of thesurface energy flux which will be installed as funding permits, willprovide a more comprehensive analysis of permafrost distributi<strong>on</strong>within thc watershed.Future plans also include a deep (100 to 200 m) bore hole inthe valley bottom of Poker Creek is planned for the future. The intentis to penetrate the bottom of the permafrost in this area. ThePredicted Mean Annual Surface TemDerature
orehole will be Equipped with a multi-channel datalogger toc<strong>on</strong>tinually record ground temperatures and complete surface energybudget instrumentati<strong>on</strong>..The spatial delineati<strong>on</strong> of permafrost / n<strong>on</strong>-permafrostboundaries will require a complex model which includes the terrain,vegetati<strong>on</strong>, and energy balance comp<strong>on</strong>ents projected to afine-mesh grid over the watershed. We plan to do this utilizingGeographic Infromati<strong>on</strong> System (CIS) technology. The initial attemptswill be d<strong>on</strong>c utilizing the more detailed air and surface temperatureinformati<strong>on</strong> obtained beginning in 1990, together with thesubsurface temperature data which have been acquired beginningin 1986.."REFERENCESBilello, M A(1974) Air masses, fr<strong>on</strong>ts and winter precipitati<strong>on</strong> incentral alaska. U.S. Army Cold Regi<strong>on</strong>s <strong>Research</strong> and EngineeringLaboratory, <strong>Research</strong> Report 319.Brown, R.J.E. and T.L.Pewe (1973). Distributi<strong>on</strong> of permafrost inNorth America and its relati<strong>on</strong> to the envir<strong>on</strong>ment; a review.Proceedings, Sec<strong>on</strong>d <str<strong>on</strong>g>Internati<strong>on</strong>al</str<strong>on</strong>g> <str<strong>on</strong>g>C<strong>on</strong>ference</str<strong>on</strong>g> <strong>on</strong>Pennafrost,pp.71-100.Collins,C.M., R.K.Haugen,and R.A.Krcig (1988) Natural groundtemperatures in upland bedrock terrain, Interior Alaska. Proceedings,Fifth <str<strong>on</strong>g>Internati<strong>on</strong>al</str<strong>on</strong>g> <str<strong>on</strong>g>C<strong>on</strong>ference</str<strong>on</strong>g> <strong>on</strong> <strong>Permafrost</strong>,Tr<strong>on</strong>dheim, Norway, p56-60.Dingman, s.L. and Koutz F.R. (1974) Relati<strong>on</strong>s am<strong>on</strong>g vegetati<strong>on</strong>,permafrost, and potential insolati<strong>on</strong> in Central Alaska. Arcticand Alpine <strong>Research</strong>.(6),1,37-42.Haugen, R.K. and J.Brown (1978) Climate and dendroclimatic indicesin the disc<strong>on</strong>tinuous permafrost z<strong>on</strong>e of the centralAlaskan uplands. Proceedings Sec<strong>on</strong>d <str<strong>on</strong>g>Internati<strong>on</strong>al</str<strong>on</strong>g> <str<strong>on</strong>g>C<strong>on</strong>ference</str<strong>on</strong>g><strong>on</strong> <strong>Permafrost</strong>, pp 392-398.Haugen, R.K., C.W. Slaughter, K.E.Howe, and S.L.Dingman(1982) Hydrology and climatology of the Caribtiu-PokerCreeks <strong>Research</strong> Watershed, Alaska, CRREL Report 82-26.Haugen, R.K., S.1.Outcalt and J.C. Hark, (1983) Relati<strong>on</strong>ships between estimated mean annual air and permafrost temperaturesin north-central Alaska,Proceedings, Fourth <str<strong>on</strong>g>Internati<strong>on</strong>al</str<strong>on</strong>g><str<strong>on</strong>g>C<strong>on</strong>ference</str<strong>on</strong>g> <strong>on</strong> <strong>Permafrost</strong>,pp.462-467.krgens<strong>on</strong>, M.T., C.W.Slaughter, and LA. Viereck (1984) Rec<strong>on</strong>naissancesurvey of vegetati<strong>on</strong> and terrain relati<strong>on</strong>ships in thePoker-Caribou Creeks Watershed, Central Alaska.Unpublished report and map. Institute of Northern Foreltry,U.S.Forcst Service, Fairbanks, Alaska, 99701. On file at INP.Koutz, F.R. and C.W. Slaughter (1972) Geologic setting of theCaribou-Poker Creeks <strong>Research</strong> Watershed, Interior Alaska.Unpublished memo, CRREL.Morrisscy,L.A., L.L.Str<strong>on</strong>g and D.H.Card (1986) Mapping<strong>Permafrost</strong> in the Boreal forest with Thematic Mapper satellitedata. Photogrammetric Engineering and Remote Sensing.V.52, p.1513-1520.Rieger, S., C.E. Furbush, D.B. Schoephorster, H.Sumrnerfield, andL.C. Gieger (1972) Soils of the Caribou-Poker Creeks <strong>Research</strong>Watershed, Alaska.CRREL Technical Report 236.Viereck, L.A., C.T.Dyrness, and A.R. Batten (1982), the 1982reas of Predicted <strong>Permafrost</strong>:aribou-Poker Creek <strong>Research</strong> Watershed, Alaska, USA1f-J ....,.:: Predicted <strong>Permafrost</strong> ' @ NO <strong>Permafrost</strong>1130
Revisi<strong>on</strong> of Preliminary Classificati<strong>on</strong> for Vegetati<strong>on</strong> of Alaska.Unpublished report. Institute of Northern Forestry, U.S. ForestService, Fairbanks, Alaska. 72 pp. On file at INE.Vicreck, L,A., C.T. Dyrness, and A.R. Batten (1986) The 1986Revisi<strong>on</strong> of Alaska Vegetati<strong>on</strong> Classificati<strong>on</strong>. Unpublished report.Institute of Northern Forestry, US. Forcst Scrvicc,Fairbanks, Alaska.141 pp, On file at INF.Vogel, T.C. and C.W. Slaughter (1972) A prclirninary vegetati<strong>on</strong>map of Caribou-Poker Creeks Rcsearch Watershed, interiorAlaska. CREEL Technical Note(unpub1ishcd).Wahrhaftig, c.(1965) Physiographic Divisi<strong>on</strong>s of Alaska. U.S. GeologicalSurvey Professi<strong>on</strong>al Paper 482.1131
CIRCUMAKCI’IC MAP OF PERMAFROST AND GROUND ICE CONDlTIONSJ.A. Heginbottom’, J. Brown2, E.S. MclnikoG, and O.J. Ferrians Jr4,’Geological Survey of Canada, Ottawa, Canada,2Chairman, IPA Editorial Committee, Arlingt<strong>on</strong>, VA.Slnslitulc for Hydro eology and Engineering Gcology (VSEGINGEO), Moscow,‘US. Geological Survey, Anchorage, AK,The <str<strong>on</strong>g>Internati<strong>on</strong>al</str<strong>on</strong>g> <strong>Permafrost</strong> Associati<strong>on</strong> undertook to compile and publish this circumarctic permafrost map, inrcsp<strong>on</strong>se to a recognized need for a single, unified internati<strong>on</strong>al map to dcpict the distributi<strong>on</strong> and properties ofpermafrost in the Northern Hemisphere at a scale that would be useful to both permafrost and n<strong>on</strong>-permafrostspecialists c<strong>on</strong>ccrned with global climatic change, resource development in polar regi<strong>on</strong>s, and protecti<strong>on</strong> of thcenvir<strong>on</strong>ment. The map shows the estimated permafrost exlcnt by percent area (90-lOO%, 50-90%, 10-SO%, 20%, 10-20%,
c<strong>on</strong>tinuous and disc<strong>on</strong>tinuous z<strong>on</strong>es (e.g. Brown, 1973). Some mapsin this group show areas of alpine or mountain permafrost (e+Brown, 1967; Gorbunov, 1978) and subsea permafrost (Mackay,1972; P&v< 1983). A sec<strong>on</strong>d set of maps show specific attributessuch as thickness and temperature of permafrost (Judge, 1973;Ershov, 1989) and the distributi<strong>on</strong> of geomorphic features indicativeof the Occurrence of ground ice, of frozen ground, or of the formerextcnt of frozen ground (Popov et al., 1966), including pingos(Hughes, 1969), ice-wedge polyg<strong>on</strong>s or ice wedges (Shumskiy andVtyurin, 1966), and ice-wedge casts (Williams, 1969). A third groupof maps relates permafrost c<strong>on</strong>diti<strong>on</strong>s to envir<strong>on</strong>-mental c<strong>on</strong>diti<strong>on</strong>sincluding temperature (Crawford and Johnst<strong>on</strong>, 1971), extent ofglaciati<strong>on</strong> (Hughes, 1973), and geology, hydrology or vegetati<strong>on</strong> (e&Fcnians, 1965; Fotiev, 1978, Bliss, 1979). Complex maps c<strong>on</strong>tainenvir<strong>on</strong>mental, permafrost and ground ice informati<strong>on</strong>. Such mapshave more often been prepared in the former Soviet Uni<strong>on</strong> (e.gBaranov, 1956, 1965, 1982; Kudryavtsev et al., 1978; Melnikov, 1966;Fotiev et al., 1978; Vtyurin, 1978; and Ershov, 1989).PRINCIPLES AND METHODS OF COMPILATIONScandinavia and central Europe, the Cordillera of North Americaand mountainous regi<strong>on</strong>s of southwestern, central and eastern Asia.A Lambert Polar Azimuthal Equal Area map projectian, centred <strong>on</strong>the north pole, was selected for the map, so that regi<strong>on</strong>s of similarlatitude would have comparable areas. Th~s feature of theprojecti<strong>on</strong> was c<strong>on</strong>sidered important for global changec<strong>on</strong>siderati<strong>on</strong>s related to potential changes in areal extent of permafrostand ground ice distributi<strong>on</strong> and volumes. A base map wascomputer generated by the U.S. Gcologicsl Su~vey, Rest<strong>on</strong>, Virginia,USA, using existing World Data Bank I1 data bases for coastlines,drainage, the latitude and l<strong>on</strong>gitude grid, and internati<strong>on</strong>alboundaries. Glaciers and ice caps for North America, includingGreenland, are based <strong>on</strong> digitized files from Canadian sources.Bathymetry was handscribed aftcr Perry and Fleming (1986).Although not currently available in digitized form, it is hoped tohave the map attributes available in a digital form in the near future.The Canadian c<strong>on</strong>tributi<strong>on</strong> was prepared from computerised databases (Heginbottom and Dubreuil, 1993).MAP DFSIGN AND THEMATIC CONTEEA major problem in the compilati<strong>on</strong> of maps of complex naturalphenomena over very large areas is the variati<strong>on</strong> in the level andaccuracy of the available data and informati<strong>on</strong>. The principles andmethods used in compiling this circumarctic map recognize andaccommodatc this difficulty. The variati<strong>on</strong>s encountered relate bothto disparities in the level of field observati<strong>on</strong>s, and to variati<strong>on</strong>s inenvir<strong>on</strong>mental and geological factors which c<strong>on</strong>trol the distributi<strong>on</strong>and attributes of the permafrost and ground icc.The mapping strategy originally proposed was to delineatelandscape units, employing a comm<strong>on</strong> physiographic classificati<strong>on</strong> ofthe Northern Hemisphere, and to assign legend attributes in eachidentifiable unit. This approach was not feasible, however, since nophrjiographic map of the northern fegi<strong>on</strong>s of the earth, at thedesired scale and level of detail, was readily available and it wasbey<strong>on</strong>d the scope of this project to prepare <strong>on</strong>e. It was decidedtherefore to use existing physiographic or landscape maps in each ofthe three major nati<strong>on</strong>al permafrost regi<strong>on</strong>s (Russia, Alaska, andCanada). In preparing this map no attempt was made to c<strong>on</strong>ductnew field studies and every attempt has been made to use all readilyavailable published and unpublished informati<strong>on</strong>.Map units in Alaska are based <strong>on</strong> the 1965 map "PhysiographicDivisi<strong>on</strong>s of Alaska" (Wahrhaftig 1965) and c<strong>on</strong>tain informati<strong>on</strong>being used to revise the 1:2,5500,000 map of Alaska (Fenians 1965).The Canadian c<strong>on</strong>tributi<strong>on</strong> utilizes the 1967 map "PhysiographicRegi<strong>on</strong>s of Canada" (Bostock, 1970) as a base map and c<strong>on</strong>tainsmuch of the informati<strong>on</strong> presented <strong>on</strong> the new permafrost andground ice map prepared for the 5th editi<strong>on</strong> of the Nati<strong>on</strong>al Atlas ofCanada, (Heginbottom and Dubreuil, 1993, in prep.). Russian mapunits are derived from the geosystems or landscape approachdescribed by Melnikov (1988), in which natural geosystems are delineatedaccording to comm<strong>on</strong> relief, vegetati<strong>on</strong>, soil and soil-formingmaterials and climate. Units for China and M<strong>on</strong>golia are based <strong>on</strong>recompilati<strong>on</strong>s of the maps by Shi and Mi (1988) and from Sodnomand Yanshin (1990), respectively. Existing informati<strong>on</strong> for theNordic countries, Greenland, and other mountainous regi<strong>on</strong>s ofEurope and Asia were modified and compiled from numerouspublished and unpublished sources, with the assistance of regi<strong>on</strong>alspecialists, as listed in Table 1.A preliminary legend wis agreed to by the principal authors inAnchorage, Alaska, in September 1991 and revised by the sameauthors in Ottawa, Canada, in April 1992. The map scale of1:10,oMl,oM) was selected so that all regi<strong>on</strong>s of permafrostoccurrence in the Northern Hemisphere could appear <strong>on</strong> a single,map sheet. The map extends southward to WN latitude andihcludes mountain or high altitude pcrmafrost c<strong>on</strong>diti<strong>on</strong>s in Tibet,The map is a comprehensive summary of permafrost and groundice c<strong>on</strong>diti<strong>on</strong>s in the northern circumpolar regi<strong>on</strong>. The basic mapunits are described in terms of the extent of permafrost, the quantityof ground ice, and the relative abundance of large1 bodies of groundice: pingos, ice wedges and bodies of massive ice. Note that no distinctibnk made between massive ice of intrasedirnental origin(Mackay and Dallimore, 1992) and massive ice rcculting frum theburial of ice formed at the ground surface, such as buried glacier orriwr ice. Informati<strong>on</strong> <strong>on</strong> permafrost thickness and ground temperaturesis given for selected localities across the regi<strong>on</strong>.<strong>Permafrost</strong> ExtentThe general distributi<strong>on</strong> of pcrmafrost and ground ice is dividedfint into two broad classes, based <strong>on</strong> regi<strong>on</strong>al elevati<strong>on</strong>,physiography and surface geology. Group 1 comprises areas oflowlands, highlands and intra- and inter-m<strong>on</strong>tane depressi<strong>on</strong>scharacterized by thick overburden, wherein ground ice is expected tobe generally fairly extensive. The semnd group covers areas ofmountains, highlands, and plateaus characterized bv thin overburdenand emed bedrock, where generally lesser amounts of ground iceare expected to occur. For the purposes of this map compilati<strong>on</strong>,thick overburden is defined as being greater than 5 lo 10m.The estimated extent of permafrost in each map unit is presentedin four classes, based <strong>on</strong> the percentage of the ground that isunderlain by permafrost (c<strong>on</strong>tinuous, 90-1M)%; disc<strong>on</strong>tinuous, SO-90%; sporadic, 10-501; and isolated patches of pcrmafrost, 0-10%).Areas generally free of permafrost are also indicated. For areas ofphysiographic class 1, the colour scheme uses t<strong>on</strong>es of purple forc<strong>on</strong>tinuous permafrost, blue for disc<strong>on</strong>tinuous permafrost, green forspradic permafrost and yellow for areas where permafrost occurs inisolated patches. For areas of physiographic class 2, the colourscheme uses t<strong>on</strong>es of brown for c<strong>on</strong>tinuous permafrost, orange fordisc<strong>on</strong>tinuous permafrost, gold for sporadic permafrost and yellowfor areas where permafrost OCCUIS in isolated patches.Areas of subsea and relict permafmt, based <strong>on</strong> both direct andextrapolated measurements, are shown by stippling. The 100 anduxhn submarine c<strong>on</strong>tours arc shawn to indicate possible Occurrenceof subsea permafrost <strong>on</strong> the c<strong>on</strong>tinental shelves of the Arctic Basin.For Russia, map units known to c<strong>on</strong>tain cry~pegs (layeis of unfrozenFund with high salt c<strong>on</strong>tent), are rnapptd beneath land areas.Ground IceThe relative abundance of ground ice in each map unit ispresented in the form of qualitative estimates of thc percentage ofice in the upper 10 to U)m of the ground. These estimates include1133
Table 1: Regi<strong>on</strong>al C<strong>on</strong>triiutms to tbe proiectDRegi<strong>on</strong>Russia, M<strong>on</strong>goliaGreenland, North Atlantic Islands,Fenno-ScandiaCentral EuropeSouthern EuropeRumaniaMountains of Central andSouthwestern AsiaChinaC<strong>on</strong>tributorsGF. Gravis, LA. K<strong>on</strong>chenko, and L.N. Kritzuk, Committee of Geology; and K.A. K<strong>on</strong>drat kva andS.F. Khrusky, Faculty of Geology, Moscow State University, Russia.H.J. Akerman, University of Lund, Sweden, and Matti Seppiji University of Helsinki, Finland.W. Haeberli, Swiss Federal Institute of Technology, Zurich, Switzerland, and L. King, Justus-LiebigUnivrrsity, Giessen, GermanyF. Dramis, University of Camerino, and C. Smiraglia, University of Milano, Italy.A. Kotarba, Polish Academy of Sciences, Krakow, Poland.A.P. Gorbunov, Alma-Alta, Kazakhstan.Guo .D<strong>on</strong>gxin and Qiu Guoqing, Ianzhou Institute of Glaciology and Geocryology, Lanzhou, China.the volume of segregati<strong>on</strong> ice, injecti<strong>on</strong> icc and reticulate ice. Threeclasses are used for ground ice c<strong>on</strong>tcnt (high, >2070; medium,10-20% and low, < 10%) in arcas in physiographic class 1, that is forareas of generally thick overburden. For arcas of generally thinoverburden (physiographic class 2). <strong>on</strong>ly two classcs of ground ice 'arc mapped, medium to high (> 10%) and low (.:lo%), due in partto paucity of data.Gradati<strong>on</strong>s in the map colours reflect these distributi<strong>on</strong>s, withshades of each colour denotihg map units with more ground ice andtints indicating map units with less ground icc.'The distributi<strong>on</strong> and relative frequency of known occurrences oflarge identifiable underground ice bodics are treated separately andshown by symbols. Ice bodies included in this manner comprise theice cores of perennial fmst mounds, especially pingos; ice wedges;and bodies of massive ice, generally tabular in shape. A simple,three step scale of "abundant, sparse, and absent' is used. Surfaceice features, including ice caps, glaciers and very large icings, areshown by patterns and symbols.Ground Temaerature and <strong>Permafrost</strong> Thickness,V:llues and ranges of mean annual ground temperatures (Cclsius)and permafrost thicknesses (metres) are shown for selccted localitiesacross Ihe mapped area. These are based either <strong>on</strong> measured valuesor extrapolated observati<strong>on</strong>s. Ihe placcmcnt of the values in themap unit generally corresp<strong>on</strong>ds to the geographic locati<strong>on</strong> of themeasurements.Landscape Classificali<strong>on</strong>For Russia, six principle morphogenetic landscape groups areidentified: lowland plains, high plains, inlra- and inter-m<strong>on</strong>tanedepressi<strong>on</strong>s, plateaus or flat highlands, ridges, and nmantains.Overall, for the Russian porti<strong>on</strong> of the map, 19 morphogenetic typesof landscapes are identified including, 15 within the firs1 thrcegroups, where accumulative sediments of diffcrcnt origins are welldeveloped. No landscape units are shown withln the categories ofplateaus and mountains. Erosi<strong>on</strong>al or denudati<strong>on</strong>al landscapecategories have four types.Major litlrological classes present in the upper 10 to 20m of theground are divided into unlithificd and lithified material; the formerincluding peat, clay and silt, sand, and coarse claslic deposits ordebris and the latter comprising soluble rocks (eg: limest<strong>on</strong>e ordolomite), insoluhlc racks and undifferentiated rocks.Transects of the <strong>Permafrost</strong> Regi<strong>on</strong>,Eight north-south oriented transects of the permafrost regi<strong>on</strong> areshown as insets to the map. The transects illustrate the major characteristicsof the permafrost body and its ground ice c<strong>on</strong>diti<strong>on</strong>s <strong>on</strong> ahemispheric basis, and in an idealized but representative manner.Alaska: The 1280-km l<strong>on</strong>g trans-Alaska pipeline mute providesextremely useful data from a series of shallow borehole extendingfrom Prudhoe Bay in the north to Valdez at the southern terminusof the pipeline. Additi<strong>on</strong>al data from deeper holes has been used,where it is available - mainly in the vicinity of Yrudhoe Bay.Mackenzie Valley: The various Mackenzie Valley pipeline andhighway routes, both proposed and c<strong>on</strong>structed, have provided a vastdata base for mapping permafrost. These data have been used incompiling this transect. Deeper boreholes, in the Beaufort Sea andMackenzie Delta areas were also relied <strong>on</strong>.Central Canada and Arctic Islands: In the Arctic Islands, thetransect is based <strong>on</strong> data from numerous boreholes drilled forhydrocarb<strong>on</strong> explorati<strong>on</strong>. On the northern mainland, it is based <strong>on</strong>data from the few mineral explorati<strong>on</strong> boreholes which have beendrilled, al<strong>on</strong>g wjth a limited number of shallow geotechnica1,borings.Eastern Canada: Thk transect is based <strong>on</strong> limited data fromboreholes drilled at a few sites for mineral explorati<strong>on</strong> andproducti<strong>on</strong> purposes.European Russia: The transect has been compiled from datafrom a number of mineral explorati<strong>on</strong> holes.West Siberia: Many borcholes have been drilled for purposes ofhydrocarb<strong>on</strong> explorati<strong>on</strong> throughout west Sibctia. This transect isbased <strong>on</strong> data from these boring, supplemented with data fromdeep geophysical soundings.Fast Siberia: The transect is based <strong>on</strong> data from boreholes drilledfor hydrocarb<strong>on</strong> explorati<strong>on</strong>, mineral explorati<strong>on</strong> (especially fordiam<strong>on</strong>ds) and geological structural research <strong>on</strong> the SiberianPlatform.Qinghai-Xizang (Tibet) Plateau: This transect is based <strong>on</strong>research carried out al<strong>on</strong>g the line of the highway from Golmud,Qinghai Province, to Lhasa, Xizang Province.Boundaries, Imend and SourcesBoundaries of permafrost and ground ice map units are shown bya solid line where they are well defined and follow a physiographicunit boundaly. Where unit boundaries are gradati<strong>on</strong>al or are estimated,a dashed line is used. The approximate positi<strong>on</strong> of thenorthern limit of trees (compiled from several Nati<strong>on</strong>al GeographicSociety nlapsj is ,shown, since this major change in vegetati<strong>on</strong> has
important implicati<strong>on</strong>s far ground temperatures and other ecologicalparameters.The explanati<strong>on</strong> of the c<strong>on</strong>venti<strong>on</strong>s of the map, the colour schemeand the symbols is given in the map legend. A subsidiary legendprovides informati<strong>on</strong> <strong>on</strong> the landscapc units used for the Russiansector of the map. The principle burces relied <strong>on</strong> in thecompilati<strong>on</strong> of the map are listed.REGIONAL DISTRIBUTION OF PERMAFROSTAND GROUND ICE CONDITIONSFor the first time, a permafrost map of the entire circumarcticregi<strong>on</strong> has been compiled using a comm<strong>on</strong> legend, so thatpermafrost and ground ice c<strong>on</strong>diti<strong>on</strong>s can be accurately evaluated,thus enabling regi<strong>on</strong>al and global comparis<strong>on</strong>s to be made. Thedistributi<strong>on</strong> and characteristics of permafrost and ground ice arcbriefly described in thc accompanying report, according to majorregi<strong>on</strong>s of the Northern Hemisphere Gable 2).The map illustrates how the regi<strong>on</strong>al distributi<strong>on</strong> of permafrostand the nature and extent of ground ice within the permafrostregi<strong>on</strong> of the northern hemisphere vary not <strong>on</strong>ly with latitude andaltitude, but also in resp<strong>on</strong>se to differences in climate, topography,bedrock geology and surficial geology. Quaternary history, withalternating episodes of glaciati<strong>on</strong> and deglaciati<strong>on</strong>, and phases ofmarine and lacustrine submergence and emergence of the land, alsohad profound effect <strong>on</strong> the nature and distributi<strong>on</strong> of bothpermafrost and ground ice.As has l<strong>on</strong>g been known, there is c<strong>on</strong>siderable variability in thequantity, distributi<strong>on</strong> and reliability of basic data <strong>on</strong> permafrost andground ice. Compilati<strong>on</strong> of the map has made this particularlyapparent to the authors. While these variati<strong>on</strong>s reflect realdifferences in geocryological c<strong>on</strong>diti<strong>on</strong>s, they are mainly the result ofthe different amount of research undertaken in different regi<strong>on</strong>s,differences in accessibility, natural exposures, resource developmentactivity, and different nati<strong>on</strong>al philosophies in the c<strong>on</strong>duct ofnati<strong>on</strong>al surveys of natural phenomena.Plans to make the map and data available in digital form arebeing developed.Many individuals and organizati<strong>on</strong>s have c<strong>on</strong>tributed pers<strong>on</strong>neland other resources to the compilati<strong>on</strong> of this map. Several individualsdeserve special recogniti<strong>on</strong> for their thoughtful involvementearly in the project, including, in particular, Ray Kreig and YuriShut, Kreig Associates, Anchorage, Alaska; Vladimir Solomatin,Moscow State University; Stanislav Grcchishchev, VSEGINGEO,Moscaw; and F.E. Nels<strong>on</strong>, Rutgers University, USA. The assistanceand support of J. Akerman, W. Haebcrli and L. King in obtainingdata has been especially helpful. Notwithstanding the valuable inputfrom those named, plus many others, the presentati<strong>on</strong> of theinformati<strong>on</strong> and mapping approach utilised are, the sole resp<strong>on</strong>sibilityof the authors.REFERENCESTable 2. Regi<strong>on</strong>s Used for Descripti<strong>on</strong>s of Pcmdnxt and Groundla C<strong>on</strong>diti<strong>on</strong>sBaranw! I.Ya., ed. 1956. Geocryological map of the USSR MainDepartment for Geodesy and tsrtography (GUGK), Moscow,North Americascale l:lO,MH),OOO (Russian).Canada (7 regi<strong>on</strong>s)Earancw, I. Ya. 19S9. Geographical distributi<strong>on</strong> of seas<strong>on</strong>allyUSA - Alaska (3 regi<strong>on</strong>s)fmen ground and permafrost. Nati<strong>on</strong>al <strong>Research</strong> Council ofC<strong>on</strong>terminous USACanada, Technical Translati<strong>on</strong> N0.1121; Ottawa.MexicoSub-Sea <strong>Permafrost</strong>North AtlanticGreenland IIcelandSvalbardFenno-SEandiaAsiaBaranov, I. Ya., ed. 1965. Principles of geocryological z<strong>on</strong>ati<strong>on</strong> ofthe permafrost regi<strong>on</strong>. Nauka, Moscow, 152 pp. (Russian).Baranov, I. Ya. 1982. Geocryological map of the USSR. MainDepartment for Geodesy and Cartography (GUGK), Moscow,scale 1:7,500,000.Baulin., V.V., cd. 1982. Map of geocryological regi<strong>on</strong>s of the WestSiberian Plain, USSR Ministry of Geology, VSEGINGCO, scale~:1,500,000, 4 sheets (Russian).Russia (8 regi<strong>on</strong>s)Black, R.F. 1954. <strong>Permafrost</strong> a review. Bulletin of theM<strong>on</strong>goliaKorea and JapanCentral AsiaSouthwest.AsiaCentral and Alpine EuorpeGeological Society of America, Vol. 65, pp, 839-856.Bliss, L.C. 1979. Vegetati<strong>on</strong> and revegetati<strong>on</strong> within permafrostterrain. i~ Pqeedings of the Third <str<strong>on</strong>g>Internati<strong>on</strong>al</str<strong>on</strong>g> <str<strong>on</strong>g>C<strong>on</strong>ference</str<strong>on</strong>g><strong>on</strong> <strong>Permafrost</strong>. Nati<strong>on</strong>al <strong>Research</strong> Council of Canada, Ottawa,Vol. 2, pp. 31-50.Bostock, H.S. 1970. Physiographic regi<strong>on</strong>s of Canada. GeologicalSurvey of Canada, Map 1254A, scale 1:S,OOO,ooO.CONCLUSIONSBrown, R.J.E. 1967. <strong>Permafrost</strong> in Canada. Nati<strong>on</strong>al <strong>Research</strong>Council of Canada, Publicati<strong>on</strong> 9769, and Geological Survey ofIn preparing this new map, c<strong>on</strong>clusi<strong>on</strong>s were drawn about our cur-Canada, Map 1246A, Ottawa, scale 1:7,603,200.rent knowledge <strong>on</strong> the distributi<strong>on</strong> of permafrost and ground ice inBrown, R.J.E. 1973. <strong>Permafrost</strong>. Nati<strong>on</strong>al Atlas of Canada.the Northern'Hemisphere and some future informati<strong>on</strong> needs. TheDepartment of Energy, Mines and Resources, Ottawa, Plate 11-present map differs from earlier maps of permafrost, first, because it12, scale 2:15,OOO,oM3.provides informati<strong>on</strong> for the whole. of the northern circum-polarBrown, HJ.E. 1978. <strong>Permafrost</strong> = Phgelisol [Canada].regi<strong>on</strong> and, therefore, for effectively all of the northern hemisphereHydrological Atlas of Canada, Department of Fisheries and thqpermafrost regi<strong>on</strong>. Sec<strong>on</strong>darily, the map shows for the first time,Envir<strong>on</strong>ment, Ottawa, Plate 32, scale l:lO,OOO,~.informati<strong>on</strong> <strong>on</strong> the distributi<strong>on</strong> and nature of ground ice in aCrawford, C.B,, and G.H. Johnst<strong>on</strong>. 1971. C<strong>on</strong>structi<strong>on</strong> <strong>on</strong>systematic manner. All this informati<strong>on</strong> is presented in relati<strong>on</strong> topermafrost. Canadian Geotechnical Journal, Vol. 8, pp. 236-251.landscape or physiographic units, which should facilitate its use inBrshov, E.D., ed. 1988,1989. Geocryology of the USSR. Nauks,other, global, hemispheric or regi<strong>on</strong>al studies of the interacti<strong>on</strong>Moscow, S volumes (Russian).between the lithosphere, the crymphere and other envir<strong>on</strong>mentalparameters.1135
Ferrians ,O.J., Jr. 1945. <strong>Permafrost</strong> map of Alaska. U.S.Geological Survey, Miscellaneous Geologic Investigati<strong>on</strong>s, Map1445, scale 1:2,5W,M)(3.Fotiev, S.M. 1978. Effect of l<strong>on</strong>g-term cryometamorphism of earthmaterials <strong>on</strong> the formati<strong>on</strong> of ground water.Proceedings ofthe Third <str<strong>on</strong>g>Internati<strong>on</strong>al</str<strong>on</strong>g> <str<strong>on</strong>g>C<strong>on</strong>ference</str<strong>on</strong>g> <strong>on</strong> <strong>Permafrost</strong>, Nati<strong>on</strong>al<strong>Research</strong> Council of Canada, Ottawa, Vol. 1, pp. 181-187.Fotiev, S.M., N.S. Danilova, and N.S. Shevleva. 1978. Z<strong>on</strong>al andregi<strong>on</strong>al characteristics of yrmafrost in central Siberia. fiPcmafrost -- The USSR C<strong>on</strong>tributi<strong>on</strong> to the Sec<strong>on</strong>d<str<strong>on</strong>g>Internati<strong>on</strong>al</str<strong>on</strong>g> <str<strong>on</strong>g>C<strong>on</strong>ference</str<strong>on</strong>g>, Nati<strong>on</strong>al Academy of Sciences,Washingt<strong>on</strong>, D.C., pp. 104-110.Gorbunw, A.P. 1978. <strong>Permafrost</strong> investigati<strong>on</strong>s in high-mountainregi<strong>on</strong>s. Arctic and Alpine Rcsearch, Vol. 10, pp. 283-294.Hcginbottom, J.A. 1984. The mapping of permafrost. CanadianGeographer, Vol. XXVIII, pp, 78-83.He@nbottom, JA., and L.K. hdburn. 1992. <strong>Permafrost</strong> andground ice c<strong>on</strong>diti<strong>on</strong>s of Norlhwestern Canada. GeologicalSurvey of Canada, Map 1691A, scale 1:1,ooO,M)O.Hcginbattom, J.A., and "A. Dubreuil. 1993. A new permafrostand ground ice map for the Nati<strong>on</strong>al Atlas of Canada. @ProceedinF, Sixth <str<strong>on</strong>g>Internati<strong>on</strong>al</str<strong>on</strong>g> <str<strong>on</strong>g>C<strong>on</strong>ference</str<strong>on</strong>g> <strong>on</strong> <strong>Permafrost</strong>,Reijing, vol. 1, pp. 255-260.Heginbottom, J.A., and M-A. Dubreuil. (in prep.) Canada --<strong>Permafrost</strong>. Nati<strong>on</strong>al Atlas of Canada, 5th editi<strong>on</strong>, scale1:7,500,000, Plate 2.1 (MCR 4177).Hughes, O.L. 1969. Distributi<strong>on</strong> of open system pingos in centralYuk<strong>on</strong> Territory with respect to glacial limits. GeologicalSurvey of Canada, Ottawa, Paper 69-34,8 pp.Hughes, T. 1973. Glacial permafrost and Pleistocene ice ages. h<strong>Permafrost</strong> -- the North American C<strong>on</strong>tributi<strong>on</strong> to the Sec<strong>on</strong>d<str<strong>on</strong>g>Internati<strong>on</strong>al</str<strong>on</strong>g> <str<strong>on</strong>g>C<strong>on</strong>ference</str<strong>on</strong>g>, Nati<strong>on</strong>al Academy of Sciences,Washingtan, D.C., pp. 213-223.Judge, A.S. 1973. Deep temperature observati<strong>on</strong>s in the Canadiannorth. <strong>Permafrost</strong> - the North American C<strong>on</strong>tributi<strong>on</strong> to theSec<strong>on</strong>d <str<strong>on</strong>g>Internati<strong>on</strong>al</str<strong>on</strong>g> <str<strong>on</strong>g>C<strong>on</strong>ference</str<strong>on</strong>g>, Nati<strong>on</strong>al Academy of Scicnces,Washingt<strong>on</strong>, D.C., pp. 3540.Kudryavtsev, VA., KA. K<strong>on</strong>drat ha, and A.G. Gavrilov. 1978.Geocryulogical map of the USSR. General <strong>Permafrost</strong> Studies;Materials for the Third <str<strong>on</strong>g>Internati<strong>on</strong>al</str<strong>on</strong>g> <str<strong>on</strong>g>C<strong>on</strong>ference</str<strong>on</strong>g> <strong>on</strong> <strong>Permafrost</strong>.Nauka, Novosibirsk, scale 1:2,500,000 (Russian).Mackay, J.R. 1972. 'he world of underground ice. Annals of theAssociati<strong>on</strong> of American Geographers, Vol. 62, pp. 1-22.Mackay, J.K. and S.R. Dallimore. 1992. Massive ice of theTuktoyaktuk area, western Arctic coast, Canada. CanadianJournal of Earth Sciences, Vol. 29, pp. 1235-1249.Melnikov, E.S. 1988. Natural geosystems of the plaincryolithoz<strong>on</strong>es. & <strong>Permafrost</strong>, Fifth <str<strong>on</strong>g>Internati<strong>on</strong>al</str<strong>on</strong>g> <str<strong>on</strong>g>C<strong>on</strong>ference</str<strong>on</strong>g>,Proceedings. Tapir Publishers, Tr<strong>on</strong>dheim, Nomy, vol. 1,pp. 208-212.Melnikw, P.I. 1966. Geocryological map, Yakustkoi A.S.S.RAkademia Nauk SSSR, Moscow, scale l:S,MW),Mw) (Russian).Nikiforoff, C. 1928.. The perpetually frozen subsoil of Siberia. SoilScience, Vol. 26, pp. 6161.Perry, RK., and H.S. Fleming. 1986. Bathymetry of the ArcticOcean. Geological Society of America, Boulder, scale1:4,704,075.PBX4 T.L. 1982. Geologic hazards of the Fairbanks area.Divisi<strong>on</strong> of Geological and Geophysical Surveys, Fairbanks,Special Report 15, 109 pp.P&< T.L. 1983. Alpine permafrost in the c<strong>on</strong>tiguous UnitedAlaskaStates: a review. Arctic and Alpine <strong>Research</strong>, Vol. 15,p ~ 145-156. .Pop, A.I., S.P. Kachurin, and N.A. Grave. 1966. Features of the 'development of frozen geomorphology in northern Eurasia. & ' ,Proceedings -- <strong>Permafrost</strong> <str<strong>on</strong>g>Internati<strong>on</strong>al</str<strong>on</strong>g> <str<strong>on</strong>g>C<strong>on</strong>ference</str<strong>on</strong>g>, Nati<strong>on</strong>alAcademy of Sciences, Washingt<strong>on</strong>, D.C., NRC Publicati<strong>on</strong> 1287,pp. 481-487.Pop, A.I., et al. 1985. Map of cryolithology of the USSRFaculty of Geography, M.V. Lom<strong>on</strong>osw University, Moscow,scale 1:4,OOO,oM), 4 sheets (Russian).Pop, A. I., et al. 1990. Cryolithological map of North America.Faculty of Geography, M.V. Lom<strong>on</strong>osov University, Moscow,scale 1:6,000,000, 4 sheets (Russian).Rapp, A., and L. Amersten. 1969. <strong>Permafrost</strong> and tundra polyg<strong>on</strong>sin northern Sweden. & The Periglacial Envir<strong>on</strong>ment, T.L. P&
<strong>Permafrost</strong> Studies in GreenlandHenrik Mai and Thorkild ThomsenArctic C<strong>on</strong>sultant Group,Sortemosevej 2 DK 3450 AllerCd Denmarka Greenland Power CompanyPilestrffde 52 P.O.Box 2128 DK 1015 Copenhagen K DenmarkINTRODUCTIONData collected for mainly hydro-power purposes since the late seventieshave been used €or a new permafrost of south-west map Greenland and topermafrost related studies to hydraulic studies.Mean yearly air- and rocktemperature have been calculated. A linearregressi<strong>on</strong> of airtemperature have been established for an overall temperatureprofile <strong>on</strong> the westcoast. Rocktemperature have been used in measureddepth., The drawn permafrost map have been drawn with a limit to discountinouspermafrost with airtemperature -0,5 to -O,l"C, and c<strong>on</strong>tinous permafrostwith airtemperature -4 to -5°C.A study of hydraulics structures in permafrost at the locati<strong>on</strong> ofPakitsup Aku. is presented with respect of temperature in rock and watersurroundings of water filled tunnels.-:The l<strong>on</strong>g-term energy political intenti<strong>on</strong>are to base a major part of the energysupply system in Greenland <strong>on</strong> hydropower.This objective have resulted inc<strong>on</strong>siderable hydrological and c<strong>on</strong>structi<strong>on</strong>allyinvestigati<strong>on</strong>s also in the field ofpermafrost.The investigati<strong>on</strong>s started in the endof the seventies and had for the time beinga culminati<strong>on</strong> in the middle of theeighties. Data collected since that periodeare the basis for detailed temperatureand permafrost studies.PERMAFanST_"-ENLANDAs disc<strong>on</strong>tinous permafrost occur interrain with a mean air temperature ofless than about -0,5"C, it is obvious thatit plays a significant role in the terrestrialporti<strong>on</strong> of the hydrological cycle.The precipitati<strong>on</strong> and the radiati<strong>on</strong> .energy balance are importent c<strong>on</strong>trollingaspect of the arctic bydrological/permafrostregime. It has influence <strong>on</strong> the supplyof energy to evaporati<strong>on</strong> and throughits supply of heat to the ground that istantamount to spreading of the arctic layer.Because of the tilt of the axis ro- oftati<strong>on</strong> of the Earth in high latitudes solarenergy is received a at low angle, sothe net energy <strong>on</strong> each square meter isrelative much less than in the tropics. Atlatitudes higher than 66,7'N (the Arcticcircle) no direct energy is received ata11 from the sun for at least of part theyear, at the same time heat is radiatedfrom the surface perpendicularly. spa- intoce.As a result, there is a str<strong>on</strong>g loss netof energy from high latitudes. This lossmust be made by transport of heat from Lowlatitudes through ocean current and atmosphericcirculati<strong>on</strong>.These factors make the regi<strong>on</strong>al climateof polar areas very dependent <strong>on</strong>transport of heat from low latitudes- the heat trapping effect of clouds andgreenhouse gasesChange in global energy balance or circulati<strong>on</strong>which have an effect <strong>on</strong> these mechanismsof heat delivery or heat loss,can thus have an exaggerated effect <strong>on</strong> theclimate and envir<strong>on</strong>ment of high latituderegi<strong>on</strong>s.The various parameters will be documentedin the following:T e e - .Available temperature data are shown intabel 1. The stati<strong>on</strong>s with temperaturevalues in different depth are locati<strong>on</strong>swith rocktemperature thermisters. The calculatedyearly mean temperature are nottime c<strong>on</strong>sistent for all stati<strong>on</strong>s but theshortest time period is 5 years.The inland stati<strong>on</strong>s al<strong>on</strong>g the westcoastwith airtemperature censors (40 stati<strong>on</strong>s)are plot with yearly average temperatureagainst northern latitude, figur1. The databasis are not for all stati<strong>on</strong>sc<strong>on</strong>sistent in time.The regressi<strong>on</strong> curve for airtemperaturewith height al<strong>on</strong>g the west-coast "AIRcor"curve is iterated found with a correlati<strong>on</strong>coefficient of 0.91. The resulted temperaturegradient (average lapse rate) is0.6'C/100 m.1137
LOCATIONcj PaarnlutH 62'13'N.W13'WIJ62'13'N,J9'17'W63"15'N,50'21'WK PhgelluarsaruscqL M'OI'NJO'WWM Nu&N 65'09N.SO'WW0 M'IR'N.51'1B'WP Man~ilsoq0 SlsirnfulR KangcrlusruaqS 67'1lI'Nj3'lh'Wv ~asiglantiuarW IlulissatX OeqenarsuaqY h9'2Y'N50eI?'WZ h9'27N.50'r'WTabel 1IVALUE("C)+1.7+o 7+l.3-I 64.7+I 1+I I-4 0-1.8-1 8-1.7-1.9-0.5-2 4-u. I+o I-2.5-0 n-n 34 4-6 540 3+[I5-1.0-4 Y-3 5-3.Y-1.3-6.8-4 2-3.0-9 d-h.?-5 44 1-6 9-I h-3 9-5 Y-5 4-2 2-l.Y-1 9-2.2-4 8-7 0-3 8-3.5-3 5-3 Y-3 h-1 1-4 n-4 0-6 4-3 3-4 d-4.5-Data basis for permafrost map <strong>on</strong>figur 3.Data from Denmark MeteologicalInstitute and Greenland HomeRule Hydro-climatological databaseby Greenland Fieldinvestigati<strong>on</strong>s.4 4. .-4 ' 60 62 64 66 68 70 712Latitude O NFigur 1.Airtemperature regressi<strong>on</strong>curvefor inland stati<strong>on</strong>s in West-Greenland.The present precipitati<strong>on</strong> c<strong>on</strong>diti<strong>on</strong>shave for Greenland as whole been presentedby Ohmura and Reeh (1991), se figur 2.Alltogether, 251 pits and cores havebeen used to calculate the distributi<strong>on</strong> ofthe annual accumulati<strong>on</strong>the ice sheet.The precipitati<strong>on</strong> data at coastal siteswere collected at 35 meteorological st+ti<strong>on</strong>.The main features of the precipitati<strong>on</strong>distributi<strong>on</strong> are a str<strong>on</strong>g l<strong>on</strong>gitudinalgradient exist in southein Greenland,south of 6S"N <strong>on</strong> the west and south of70'N <strong>on</strong> the east coast, Ohmura and Reek(1991)The mean annual precipitati<strong>on</strong> for a11of Greenland is 340 mm w.eq. The mean accumulati<strong>on</strong><strong>on</strong> the Greenland ice sheet isestimated at 310 nun w.eq.For more detailed local variability <strong>on</strong>the west coast it is nessary to establisha more accurate map taking into accountthe dominant south-north and west-eastprecipitati<strong>on</strong> gradient.n balance.Measurement of comp<strong>on</strong>ents af the radiati<strong>on</strong>balance equati<strong>on</strong> for the arctic areaare <strong>on</strong>ly found to a limited extent, Prowseand Onunanney ed.(1990) and Thornsen (1991).1138
Figur 2. Yearly total precipitati<strong>on</strong> in m, after 0-aand Re& (1991).’ 1139
PERMAFROST MAP
50'20' ' Mol0On the basis of the shown temperatureand precipitati<strong>on</strong> distributi<strong>on</strong> and also agreat deal of subjective knowledge of hydrologicalinformati<strong>on</strong> a permafrost maphave been drawn, as shown <strong>on</strong> figur 3.Besides the c<strong>on</strong>tour of temperature parameters,there are shown a calculated inlandairtemperature at sea-surface based<strong>on</strong> the temperature/latitudes correlati<strong>on</strong><strong>on</strong> figur 1.The shown permafrost boundaries aredrawn with a limit to disc<strong>on</strong>tinous permafrostwith airtemperature -0.5 to -1.0-Cand to c<strong>on</strong>tinous permafrost with airtemperature-4 to -5'C.xL!lwsA study of hydraulics structures inpermafrost have been carried out <strong>on</strong> theexistingcknowledge from temperature andc<strong>on</strong>structi<strong>on</strong>ally investigati<strong>on</strong>s. Any hydraulicstructure in permafrost area isbased <strong>on</strong> knowqedge of the initial temperaturec<strong>on</strong>diti<strong>on</strong>s in the surrounding rockprior to establishment of the structure.Scarce data requires drastic assumptiansto be made. In recent years, finiteelement and finite difference models havebeen used to investigate temperature distributi<strong>on</strong>resulting from freeze-thaw cyclesIn rock and steady state and transientsoluti<strong>on</strong>s have been derived for stratifiedrock/soils, Irmen Christensen and Mal( '88).For the purpose of having waterfilledtunnels in permafrost detailed studieshave been carried out to investigate temperaturec<strong>on</strong>diti<strong>on</strong>s in water-rock interfaceboth in an arctic lake and in a tunnelfor hydro-power plant, Mal (1987 - a)and Mai ed. (1993 - first draft).Scheme for a hydro-power plant in permafrozenrock have made it necessary tostudy the thermal regime around the watertunnels and in the water body In the reservoir.The studie have been carried outat the basin Paakitsup Akuliarusersua(69"29'N,5O0l8'W), figur 4.The hydrological regime is dominated byablatl<strong>on</strong> water from the Icecap. The lakesin the area 187 and 233 (the level abovesea) will effect,the temperature in thesurrounding rock and give the initial c<strong>on</strong>diti<strong>on</strong>sfor resulting temperature developmentin the water-tunnels.The lakes have a relative stabilizedtemperaturec<strong>on</strong>diti<strong>on</strong>, and will never gobelow 0°C. Compared to the average airtemperatureat the locati<strong>on</strong> about -6 to -7'C .this will be a much warmer body. The lakesare characterize as "arctic lakes", wheretemperature never get over +4'C, gee figur5."-Figur 4,50° 20' 50- 10Drainage basin at Paakitsup Akuliarusersua,after H.Thomsen,Geological Survey of Greenland1141
0"""_Active layer*""Seas<strong>on</strong>oilycryoticFigur 5.Lakg temperature profile in thearctic lake 187 at PaakitsupAkU .Figur 6. Rocktemperature gradient at PaakitsupAku, surface level 237 m.above sea.Fresh water have its maksimum densityat +doc, which means that the warmest wateralways will remain in bottom and thecoldest water in the top. Lake 187 separateaa little from lake 233 due to the glaciergoes direct into the water.in lake187. This means that lake 187 in generalare colder than lake 233.In lake 187 the summertemperature inthe surface will be around 1.5 to 1,8'C.,and in lake 233 around to 3 4°C. In wintertemperaure drop at the surface to O'C, butstill a little warmer in Lake 233.The bottomwater in the lakes reflectsthe summertemperature and can be 1 to 3'Cwarmer than the'surface temperature. TOgetherwith temperature profile measurementain the lakes intensive temperatyremeasurements in the rock have taken place.On <strong>on</strong>e locati<strong>on</strong> situated 237 m abovesea level temperature has been measureduntil 250 m below surface. Rocktemperaturemeasure at the atati<strong>on</strong> is shown <strong>on</strong> figur6. The gradient is calculated to0,0167'C/m ll'C/60m).With the known temperature and rockc<strong>on</strong>diti<strong>on</strong> the hydro-power scheme was chosenwith a lower level headrace as shown<strong>on</strong> flgur 7 to get as little impact <strong>on</strong>rocktemperature below O'C as possible.With the topographic informati<strong>on</strong> and ' ithe temperature c<strong>on</strong>diti<strong>on</strong> in the water androck a dynamic model was runned to simulatethe temperature field close to the tunnel,with the power plant in operati<strong>on</strong>.The model should also be able to describepossible of ice in the water c<strong>on</strong>duct duringdisc<strong>on</strong>tinous operati<strong>on</strong> Mai (1987 - b)and Mai ed. (1993).The tailrace of the power-plant terminateswith a submerged outlet in the fiord.1142
1REFERENCES.Fiyur 7. Hydro-power scheme at Paakitsup Akua, with lowlevel headrace.Irmen Christensen, M. and.Mai, H. (1988):Subsurface temperature predicitati<strong>on</strong>for hydropower developments. The 7thNorthern <strong>Research</strong> Basin symposium/workshop. Ilulissat, June 1988.Mai, H.(1987 - e):Hydropower tunnels in <strong>Permafrost</strong>, C<strong>on</strong>f,Underground Hydropower Plants Oslo,june 1987.Mai, H., Stigebrandt, A. and Bergander, 8.(1987 - b):Submerged outlet into,a fiord from apowerstati<strong>on</strong> in Greenland. C<strong>on</strong>f. Hydropower in Cold Climates, Tr<strong>on</strong>dheim, july1987.Mai, H. ed. (1993) - draft:<strong>Permafrost</strong> studies for Hydro-Powerpermafrostgruppen: ArCtiC C<strong>on</strong>sultantGroup,LIC-C<strong>on</strong>sult end VBB-VIAK.Prowse, T.D. and Ommanney, C.S.L. ed..( 1990) :Northern Hydrology Canadian Rerspective,NNRI Science Report No. 1. Envir<strong>on</strong>mentCanada.Thornsen, T. (1991):Arctic Hydrology in Greenland - Perma-frost hydrology and data technology.Arctic Hydrolcgy - present and futurotasks. Seminar L<strong>on</strong>gyear byen Svalbard.Norwegien Nati<strong>on</strong>al Committee for Hydrology.Report NO. 23 - Oslo 1.991.1143
SNOW AND PERMAFROST IN THE TIAN SHAN MOUNTAMSHu Ruj and Ma H<strong>on</strong>gXinjiang Institute of Geography, Chincue Acidemy of Sciences, U mqi 83001 1, ChinaThe existence of snow and permafrost is a result of a cold climate in high latitudes and high mountainareas, and they affect <strong>on</strong> the ec<strong>on</strong>omic and social developments dircct1y.h the Tian Shan mountains, theseas<strong>on</strong>al snow cover within the permafrost mne plays an important role in c<strong>on</strong>trollin8 he growth andthaw of unstable permafrost, and it's distributi<strong>on</strong> exhibits almast a sama pattern in areal extent with thatof permafrost. Snow and permafrost are interdependent, co-existmce, and play a positive role in balancingthe ecological envir<strong>on</strong>ment in the mountain areas.INTRODUCTIONSnow and permafrost are extensively distributed in the TianShan mountains. As for snow, reliable records were kept in literatureas early as 1,200 yeras ago. Since late the 1950%. the ChineseAcademy of Sciences has organized many integrated surveys, inveatigati<strong>on</strong>s,and fixed-positi<strong>on</strong> observati<strong>on</strong>s of snow and permafrostin the Tian Shan mountains and has achieved a lot of importantscientific achicvments.DISTRIBUTION OF PERMAFROST IN THE TIAN SHANMOUNTAINS"It can be seen from Fig.1, the distrihti<strong>on</strong> of permafrost in theTian Shan mountains shows almost a same pattern with the distributi<strong>on</strong>of SHOW cover. The lower permafrost limit in shady slopes isgenerally lower than that in sunny slopes, i.e. about 2,700 m inshady slopes and 3,100 m in sunny slopes, with a difference of 400m in altitude. The lower limit of permanent snow is about 3,600 ma.s.1. in shady slopes and 4,400 m in sunny slopes, the dimerencc inaltitude is about 800m. Thc altitude differences between the lowerlimits of permanent snow and permafrost varies grestly from <strong>on</strong>elocati<strong>on</strong> to another, with a distance ranging from 870 to 125h.Those suggest that altitude is a dominant factor c<strong>on</strong>trolling the dietributi<strong>on</strong> of snow and permafrost in the Tian Shan Mountains.The area of permafrost is approximated at 6.3 X 10 Km (QiuGuoqing ,1983), while the area of permanent snow cover is <strong>on</strong>ly 1x 10 Km (Hu Ruji; 1989). The large difference in coverage area between them indicates a more dependenoe of existence ofpermanent-snow up<strong>on</strong> the raising altitude.Seas<strong>on</strong>al frozen soils are also widely distributed in the TianShan mountains, and they are almost totally covered by snow coverduring the winters. The existence of them affecbs <strong>on</strong> landscape andrsological envir<strong>on</strong>ment of the area significantly, and this effect isFig.] Distributi<strong>on</strong> of permafrost in the Chinese Tian Shanmountains1144
largely determined by the intensity of interacti<strong>on</strong> between snow SEASONAL SNOW WITHM THE PERMAFROST ZONE IN0cover and the seas<strong>on</strong>al frozen soils. Kii " TIAN SHAN MOUNTAINSDISTRIBUTION OF PERMAFROST WITH VARYING LAT- The ground tempcratures near the lower permafrost limit are~T~SDE AND LONG~TUDE". ,,. I " usually higher and permafrost layers are shallow with a depth nodeeper than 20 m. It was recorded that fhe depths of active laycrshave been increased to 3.5 m due to increased meltwater from snowThe distributi<strong>on</strong> of permafrost and snow cover in the Tianand precipitati<strong>on</strong> in the mountain areas (Qiu Guoqing and others,Shan mountnins exhibit an identical trend al<strong>on</strong>g the latitude andl<strong>on</strong>gitude dirccti<strong>on</strong>s. The higher the latitude is, the lower the lower 1983).permafrost limit. Moreover, the descending magnitude of the lower Between the lower permafrost limit and stable permafrost arelimit for each degree of latihdc increment increased with increasing as, an unstable permafrost z<strong>on</strong>e existed. The depth of permafrost inlatitude. ,Table 1. Lower permafrost limits in different areas of the TianShan mountains(from Qiu Guoqing)1Qiu Guoqing and others (1983) proposed an empiricai cquati<strong>on</strong>for calculating the lower permafrost limit in the Tian Shanmountains:II = I1089.5-10.6~-171.2~ (1)where, H is the altitude of lower permafrost limit (m 11.s.I.),x isthe east l<strong>on</strong>gitude, y is the north latitude.From this equati<strong>on</strong>, the lower permafrost limit wil decrese171.2 m for each degree of latitude increment, and decrease 10.6 mfor each degree of l<strong>on</strong>gitude increment towards the east. Therefore,the lower permafrost limit shows a pattern of being higher in westand south parts, and lower in cast and north parts of the Tian Shanmountains,The snow cover is extremely uneven in the Tian Shan mountains.From Fig.2, for example, a snow depth of 70 cm occurs in theYili River basin in the west part of the Tian Shan mountains,'Whilein east part, a snow cover with such depth can <strong>on</strong>ly be found in the,top of the Haerlike mountain, the difference in altitude betweeneast and west ends of snow depth c<strong>on</strong>tour can be as large as 2,200m, while the altitude difference betw8cn the lower permafrost limitin the east and west parts of the Tian Shan mountains is <strong>on</strong>ly about220 m.this z<strong>on</strong>e varies greatly, depending <strong>on</strong> the integratd effects. of externalc<strong>on</strong>diti<strong>on</strong>s, especially the effects !now cover and snowfallevents. In the west part of the Tian Shan mountains, the depth ofpermafrost will incream SO m with an increasing altitude per 100 m,and in the east part of Tian Shan mounatins, that will increase <strong>on</strong>ly20 m with each 100 rn increase in altitude. In additi<strong>on</strong>, severalgeomorphological landscapes formed due to the inpcti<strong>on</strong>s betweensnow and permafrost in this unstable permafrost z<strong>on</strong>e. Thctypical landscapes are as follows:Mountain TerrEThe snow erosi<strong>on</strong> landforms are widely distributed in unstablepermafrost z<strong>on</strong>es in the Tian Shan mountains. Snow erosi<strong>on</strong> depressi<strong>on</strong>s are also comm<strong>on</strong>ly obsericd in this area. The mountainterraces are usually steps of 1 to S meters wide and the surface materialsdiffer from <strong>on</strong>e locati<strong>on</strong> to another. This landform oftenstretches into the stable permafrost-z<strong>on</strong>e. Professor Qiu Guoqinghad <strong>on</strong>cc observed the multi-stage mountain terrace in the upperreaches of Alaxig<strong>on</strong>gjing Valley in the Tian Shan mountahis.Mudflow and Mudflow TcrracesMudflow acti<strong>on</strong> z<strong>on</strong>es are usually dispersed below the* 1145
Fig.2 Distributi<strong>on</strong> of snow covers in the Chinese Tian Shanmountainsfrost-weathering and scattered gravel slopcs. Under the acti<strong>on</strong> ofrepeated thaw-freeze cycles, the meltwater from snow can accumulateabove the permafrost layer, the mud stated saturated soil thusleads to mud sliding and forms a variety ofmicro-geomorphological landscapes, such as, mudflow t<strong>on</strong>gue,and mudflow terrace etc. These geomorphological landscapes arewidely distributed within the unstable permafrost z<strong>on</strong>es, espccialyin east slopes of Watecrdegen and Xile mountains, south slopes ofYuximolegai mountain and east slopes of Aiken mountain pass.Thaw depressi<strong>on</strong>s are also formed in this area and can be obviouslyobserved. Thaw depressi<strong>on</strong> mainly occurs in the area wherethe ice c<strong>on</strong>tent of permafrost is relatively high, and especially inareas with deep layers of under ground water, especially in the are+as near the Kuixian and Haxilegen mountain pass.St<strong>on</strong>e Stripes, St<strong>on</strong>e Circles,and Block Streams ~St<strong>on</strong>e stripes, st<strong>on</strong>e circles, and block streams are also com-ly much thicker and can be as deep as several meters. In the TianShan mountairis, snowfall in this permafrost z<strong>on</strong>e mainly occursduring the summers. Influenced by local topography,avalanchesare comm<strong>on</strong> in this area,and exhibiting a alpine avalanche landscape-ecologicalz<strong>on</strong>e during the summers.THE SNOW COVER WITHIN THE AREAS OF SEASONAL~~ . "_"~ "" ,.."FROZEN SOILSThe snow distributi<strong>on</strong> in the areas of seas<strong>on</strong>al frozen soil varieswith altitude and changing climate c<strong>on</strong>diti<strong>on</strong>s and thus followsa typical vertical z<strong>on</strong>ality of landscape in the mountain areas. FromFig,3, a vertical z<strong>on</strong>ality of mountain ecological landscape exists inthc Tian Shap mountains. Thc lower permafrost limit in the mountainareas of the Tian Shan mountains is generally above the forestmne. In the south slopes of the Tian Shan mountains, the forestbelts are disc<strong>on</strong>tinuously distributed, and the lower permafrost limitthus lies in the meadow gravel z<strong>on</strong>e of high mountains.1146'.
II I IT---"-I80VIII0v1NFig.3 The vertical natural belts of Tianshan mountains northern and southern slope in China95'8508 0 r 4 1 I 1 -.Dec. Jan. Fcb. Mar.REFERENCES, ."Qiu Guoqing and Huang Yizhi (1983) Basic Characteristics of<strong>Permafrost</strong> in The Tian Shan, China. In Proceedings of Sec<strong>on</strong>dSymposium <strong>on</strong> PerrnafrostLanzhou, Gansu People's PublishingHouse p.22Hu Ruji and Jiang Fenqing (1989) Avalanche and it's c<strong>on</strong>trol inthe Tian Shan Mountains, China. Bei,jing, People'sCommunucati<strong>on</strong> Publishing House, P.14.1147
fFHOS'T-ACTTON DESlGN AND AFF1,TCATlONS OF ENLARGED TYPEPI LF, FOUNDATTON BRlDGE IN WATERLOGGED AREA- OF SONGYOUNGIluang Junhcng: Xu Zhenghni:Gc ~Iu~nyou~ and Zuu Li4'Cr~rnmissio~~ for Urban .& Rural C<strong>on</strong>structimn of qingdau Municipality, Chinazl'eoplc's C,uverrrment of Hci l<strong>on</strong>gjiang Province, China3Watcr Resources Burcou of Rayan County, Heil<strong>on</strong>gjiang'W~t.er Resourcrs Dvpartnlent of Hei l<strong>on</strong>gjiang Province1'hc princ iyle nf sel f-anchorage by. frosL heave reacti<strong>on</strong> force were usr-d to design *and c<strong>on</strong>str~ct. the 15 enlargca type pile foundati<strong>on</strong> bridges in the heavily frozensoi I i3r'e.a of Heil<strong>on</strong>gjiang Frovince. 'The buried depth of the pile foundat.i<strong>on</strong> wasrrducetl to 1.8-2.0 mcters. Which should have heen 12-18 meters according to ther~rjrmal rules. 'I'hc 10 yl+nr's operati<strong>on</strong>al uti lizati<strong>on</strong> shows Chnt the c<strong>on</strong>structi<strong>on</strong>is in good c<strong>on</strong>diti<strong>on</strong> ; + 1 8 d no pheno.mcna oi frost heave occurred. In additi<strong>on</strong>. Thefrost hcavc I(~r(tt Tor the pile found;+Licln was measured for the firsl time inthis country wi1.11 reinforcemcnt S L ~ C R Y meters laid in splittcd seams. Aftcr themcnsurcmtlnt. h:is heen carried out for '3 years. i.c. 2 frozen cycles, the relat.iveerror Iretween the measurcd values and the rlc.signcd values for the maximum Unitfrost heave forcc lies i n the range of 4.4-12.52.I N'!'KOT)UC.TTONSinr-e 1082 wc' havv USI!I~ the principle of srl f-anchoragc. by trost. henvt, reacti<strong>on</strong> forcc forprcvl-nt i ng frost hcavc occur,renr.e, and c<strong>on</strong>st ruc1.-CII 15 rlllarged typv pilc iounda~.i<strong>on</strong> bridgvs wiChr,r~~~forced cuncrt!te. The huried dcpth of !.he pileiollndnti<strong>on</strong> is 1.8-2.0 meters. Our aim is to (:<strong>on</strong>ductthc trost-oct.ior1 design of the cnlrrr.ge~l pileT I I I I ~ I ~ ; ~ I . 011 ~ I ) a ~ quantitative basis, which nevds1 0 IJSP the in-sit.r~ [measured c<strong>on</strong>venti<strong>on</strong>:tl d ~ t a i njr(~7yrl soil and to follow thr theory of antilrost-:i~.t.i<strong>on</strong>:ohtain thc frost heave reacti<strong>on</strong>Iur'i c quantitatively; cc~lc.ulnl.e the size ofcavcs <strong>on</strong> [.he enlarged foundz t.i <strong>on</strong> rlecessary fort>t:;jr'ing t.he reacti<strong>on</strong> furc.e, det.ermine thereas<strong>on</strong>able huried depth of pile foundati<strong>on</strong>, andchcck over t.he strength of anti-irost-damagestructurc required for the cnlargrd pile founda-L i <strong>on</strong> .FROST HEAVE REACTION AND PRTNCIPLE OF SELF-ANCHORAGE OF PT1,E FOUNDATIONThl? frost heave reacti<strong>on</strong> force is a reactiunforce produccd by t.he lrost heave stress orshear force. Tt. acts <strong>on</strong> the lower laying soilan? t.hus produces thj s ext.rH faundati<strong>on</strong> rcac.ti<strong>on</strong>force (scc Fig.1).Tf the pile is bo be built -as an enlargedfoundati<strong>on</strong>, i.e., a foundati<strong>on</strong> with TI anchoredshect at depth Z, to make the eaves bear thereacti<strong>on</strong> fnrce, it will result in a betterstabi1it.y 1.0 resist thc effect of frost heave<strong>on</strong> t.he pile foundst.i<strong>on</strong>.FROST-ACTlON T)ESIC,N OF ENLARGED TYPE PII,EFOIINDA'I'IONStructure C<strong>on</strong>figurati<strong>on</strong> <strong>on</strong>? Rasis for SizeSelecri<strong>on</strong>a) The b~lried depth of eaves of enlargedfounrlal.i<strong>on</strong> should be chosen to be close to orequal to the maximum frozen depth of soil as farNFig.1 Forces and their distribu.ti<strong>on</strong>s acting <strong>on</strong>a pileHfrozen depth;h, - frost heave amount <strong>on</strong> the ground surface;Z buried dcpth of anchored sheet;1 length of eaves:7 - tangential frost heave force;Nupper load;L, distributi<strong>on</strong> scope of T;Pa - frost heave reacti<strong>on</strong> force;G - deight of pile;Fl,Fz-- frost heave fricti<strong>on</strong>al force;Ft soil weight <strong>on</strong> eaves;L - distributi<strong>on</strong> scope of reacti<strong>on</strong> farce.as possible in order to retrain from stressattenuati<strong>on</strong> in the course of transfer of frostheave reacti<strong>on</strong> force in the thawed soil layer.b) The eaves length 1 determines the bearingproporti<strong>on</strong> of the frost heave reacti<strong>on</strong> force.It should be as small as possible <strong>on</strong> c<strong>on</strong>diti<strong>on</strong>thar. the eaves can meet the requirement for thestability of anti-frost-heave.
einforced3) The enlarged type pile foundati<strong>on</strong> shall d) Computati<strong>on</strong> examplesmeet the requirements for the load-bearing capa- The stabilityof anti-frost-heavebility and the stability of pile.We chose Y<strong>on</strong>gchangd<strong>on</strong>g Bridge and Y<strong>on</strong>gchangxi K=(P,+N+C,tFtPt+G,)/CrBridge as the experimental works. The upperDarts of these two bridRes are made of reinforced ANTI-FROST-ACTION EFFF,CT OF CASE HISTORYhollow flat slabs and their lower parts areenlarged type pile foundati<strong>on</strong>s. The eaves are A. The Number of Enlarged Type Pile Foundati<strong>on</strong>made of reinforced c<strong>on</strong>crete base slabs wi.th BridRes Built in the Waterlogged Area ofdimensi<strong>on</strong>s of 2.0x2,0xO.6 and 1.8x1.8xO.h meters S<strong>on</strong>Ry<strong>on</strong>R Totals 15 (see Table 3)respectively for the two bridges, the diameterof pile is 0.5 meter and the buried depths of B.. TanRential F.H. Force Measurement at Y<strong>on</strong>gchangfoundati<strong>on</strong>s are 2,O and 1.8 m respectively. Experimental Bridgesa. Layout of instrumentsComputati<strong>on</strong> of Anti-Frost-Heave Stability3 sets of reinforcement stress meters ModelKLa) Criteri<strong>on</strong> of stability20 manufactured in Nanjing were buried respective-Fa + N + G + F(1) ly in the midpiles of Y<strong>on</strong>gchang Experimental.t Pt2Z.IRridaes (see Fig.3). The reinforcement stressb) Frost heave shear forcemeteis wcre welied to the force-bearing reinforcedbars of the pile column <strong>on</strong> a level of 1.8 m aboveET = TIDH~T~the ground and the reinforced c<strong>on</strong>crete column wasblocked with an ir<strong>on</strong> plate to ensure that thewhere D - diameter of pile, and I bars were solely acted <strong>on</strong> by the forceunit frost heave $hear force, referring during frost heaving of the pile. Variati<strong>on</strong>s ofto Table 1.resistan.ces and resistance ratios were measuredThe distance h from the acting point of the with a proporti<strong>on</strong>al bridge for hydraulic engineerresultantforce to the top surface of theing use and the values of tangential frost heaveenlarged foundati<strong>on</strong> can be calculated as follows: force wereh=z --"inb. Measurement results3 for the type of frost heave whlch is (i) Tangential frost heave force (Fig.2,3 andbigger at the upper part and n<strong>on</strong>e at 41. AccomDaris<strong>on</strong> between the calculated frosth=z --Hm2for other types,where !Im is the maximum frozen depth of soil,c) Frost heave reacti<strong>on</strong> forceAccording to the recommendati<strong>on</strong> by Heil<strong>on</strong>gjiangInstitute of Hydraulic Engineering, thefrost heave reacti<strong>on</strong> force can be obtained byusing the formula:Pa= -nlslr(0.5h-0.31)h'when lSh and h=i-- H2given in Table 4,The error of unit frost heave shear forcelies between 4.48 to 12.5X, which is within thepermissible range of errors; while the error ofmaximum frost heave force ranges from 3.3% to29.2%. The reas<strong>on</strong> for this bigger error is thatthe magnitude of frost heave shear force isalso dependent <strong>on</strong> the frozen force between thepile column and its neigltbouring soil. At theend of November, the frozen depth is below 50mm, and the unit frost heave shear force willreach its maximum, moreover, the frozen surfacewill experience a,distructi<strong>on</strong> process; afterTable 1. Design reference values of unit frost heave shear force in kg/cm'(from Hcil<strong>on</strong>gjiang Institute of Hydraulic Engineering)Class of Weak frost Medl.um frostf rosr heave heave heaveStr<strong>on</strong>g frost heaveGrade 1 Grade 2 Grade 3Frost heaveratio X1.0-3.53.5-6.06.0-10 10 - 1515 - 20Unit frost heaveshear force0.3-0.50.5-0.80.8-1.2 1-2-1 *a1.6-2.0Table 2. Computing results for the stability of anti-frost-heave7 0.9, 25.4 10.97 1.83 steady10 1.2 33.9 14.66 1.48 steady13.3 1.4 40 18.56 1.36 steady1149
~'Table 3. Sta'tistics of enlarged type pile foundati<strong>on</strong> bridgesbuilt in waterlogged area of S<strong>on</strong>gy<strong>on</strong>g-tPile foundati<strong>on</strong>BuriedSame ofLocati<strong>on</strong>Time ofBridge completj un 'pan depth Diameter Enlarged , Thickness(m) of pile foundati<strong>on</strong> of base Remarks(m) slab (m) slab (m)T<strong>on</strong>gchangd<strong>on</strong>gBr itlgeY<strong>on</strong>gchangBrigadeJuly, 82 2x6 2.00.52x20.6Ynngchangxi Y<strong>on</strong>gchang AUK., 83 2x6BrldgeBrigade1.80.51..8x1.80.55 samebridgesSanmenxangBridgeSanmeniinngjiaAug. ,' 83 2x6 1.80.51.8x1.80.60.52x20.68 samebridges'2 -20-0.5EFig.4 Observed results of tangential frost heave'tig.2 Observed results of (.ungent.ial lrost heave force for Y<strong>on</strong>gchangxi Bridge in 1983-84force for Yorlpc hiingri<strong>on</strong>g Dridgc in 1982-83that, the frost heave shear force tends to besmaller than the theoretical calculated value,thercfore, the measured frost heave shear force .,ris; mgsmaller than the calculated value. The\str<strong>on</strong>ger the frost heaving of the foundati<strong>on</strong>Msoil is, the closer wil.1 be the calculated value2.0 -20-* of shear its force measured to value.(i.i) Deformati<strong>on</strong> observati<strong>on</strong>s (see Fig.5).1.5 -15-Two measoring points (3) and (4) ( see Fig.5)were set <strong>on</strong> thei.r mid-plles at G<strong>on</strong>gchangd<strong>on</strong>gRridge and Y<strong>on</strong>gchangxi Rridge. The measured1.0 "10-results obtained in the two freezing and thawingcycles between 1982-1981, indicated that the0.5 - 5 -defurmati<strong>on</strong> of the mid-piles due to frost heavewas less than 1 centimeter, no phenomen<strong>on</strong> ofNO". Dec. Jan. Feb. March frost heaving <strong>on</strong> the bridge surface occurred.-.during the process of frost'heave, and theEtime operati<strong>on</strong> of the whole works was in good c<strong>on</strong>di-Yti<strong>on</strong>, thus achieving the aim of anti-frost-heave2 50-4) for these works.m- CONCLUSIONS.Q 1000e A) The operati<strong>on</strong>al practice of these works150 -.frlr 10 years has dem<strong>on</strong>strated t-hat the enlargedtype pile foundati<strong>on</strong>, <strong>on</strong> which the frost heave 'Tr.g.3 0l)servrri rcsults of Langrt~t.ii
Table 4. Comparis<strong>on</strong> between calculated and measuredfrost heave valuesTangential Unit tangehtialFrost hcavcName ratio . frost heave .frost hcavef orccforce( X )(t<strong>on</strong>)(kg/cm2)Ycngchangd<strong>on</strong>gBridge-1982-1983DesignedMeasuredError ( X )1983-1984DesignedMeasured .Error (7)77101025.42021.333.')2429.20.90.9h4.b1.21 .n512.513.31'3.34038.73.31.41.5510.7- 1983-84 (4).*I& 1"E 5 t Nov. "eY/, --1Dec. Feb. MarchIY<strong>on</strong>gchangxi Bridge"10 - NOV.1983-841982-83(4)W -c. Jan. Feb. March1983-84Y<strong>on</strong>gchangd<strong>on</strong>g Bridge1151
THE SHALLOW COVER DESIGN AND CONSTRUCTION TECHNOLOGY OF BUILD.ING FOUNDATIONS IN DAQING REGIONJiang H<strong>on</strong>gju Cheng knyuanDaqing Academy of Oilfield Design, ChinaThe perennial observati<strong>on</strong>s show that Daqing soil has different frost heave properties from freezingshrink to very str<strong>on</strong>g frost heave. Because of differential heave and thaw collapse in foundati<strong>on</strong> soil, theoilfield building structures are destroyed and the engineering quality is heavily influenced. So, foundati<strong>on</strong>sin saes<strong>on</strong>ally frozen ground regi<strong>on</strong>s, shallow buried building foundati<strong>on</strong>s, and frost damage preventi<strong>on</strong>techniques were studied. Meanwhile, the results obtained from research are applied directly tothe engineering design and c<strong>on</strong>structi<strong>on</strong>. The results were very good.TWE SHALLOW BURIED FOUNDATION OF BUILDINGSAND DESIGNS FOR PREVENTING FROST DAMAGEThe Design of Shallow Buried Foundati<strong>on</strong>s of BuildingsBecause of the different properties of frost heave <strong>on</strong> the basement soil this will result in the deformati<strong>on</strong> of external wall of thebuilding during freezing. During thawing the difference in meltingtime and velocity. of the basement soil under the external wall bottom,the wall produces uneven settlement deformati<strong>on</strong>. If thetangential stress or tend stress of external wall which caused by thetwo kinds of acti<strong>on</strong> is bigger than the limit of material strength,cracking and deformati<strong>on</strong> would merge in the wall body. In orderto guarentee the normal operati<strong>on</strong> of the building structure, the followingwork was d<strong>on</strong>e:%e correct determinati<strong>on</strong> of the frost heave grade of basement soil-For the frost heave grade of basement soil applied in design,two main factors should be c<strong>on</strong>sidered. One was the frost heavegrade in investigati<strong>on</strong>. The other was the change of the frost heavegrade of basement soil produced in the building c<strong>on</strong>structi<strong>on</strong> or usage.The frost heave grade of basement soil in researched years wasprovided by Chinese design standards of building basements andfoundati<strong>on</strong>s (GBJ7-89). The best way of determinati<strong>on</strong> was <strong>on</strong> thebasis of locally observed results.Howcver, if the frost heave grade of basemcnt soil determinedby the method menti<strong>on</strong>ed above was c<strong>on</strong>sidered as the design basis,two problems would appear:First, the annual air temperature and precipitati<strong>on</strong> in the areais random. If the year of observati<strong>on</strong>'and investigati<strong>on</strong> wag aridwith high temperatures and a low frozen depth, the frost heavegrade of the soil is lower. On the other hand, if the year has heavyrains and low temperatures the grade could be improved.Sec<strong>on</strong>d, if the original ground level was decreased during theprocess of c<strong>on</strong>structi<strong>on</strong>, or since the other buildings affected drainageof the ground water, or the buildings were c<strong>on</strong>structed in regi<strong>on</strong>sof low temperatures and water weren't drained properly, thisresults in rise of c<strong>on</strong>tent of the basement soil and rise of theunderwater level, the property of frost heave in the soil would increase.When determining the applied frost have grade in engineeringdesign, we think that if <strong>on</strong>ly <strong>on</strong>e of the two factors menti<strong>on</strong>edabove exist, the frost heave grades of three kinds of soilwhich are initially determined as n<strong>on</strong>-frost have soil, less frostheave soil and frost heave soil should rise respectively. The reas<strong>on</strong>is that the critical values of the frost heave ratio in the three kindsof frost heave grades are <strong>on</strong> the low side )Le. the average frostheave ratio of n<strong>on</strong>-frost heave basement roil was q < = 1 %. Theaverage frost heave ratio of less frost heave basement soil was1%
~The geologic st-mcture of basement soil, the physical and mechanical index of soil, the hydrological engineering and geologicalstate. As well as c<strong>on</strong>sidering the homogenitity and stability of theshallow layer soil.The sizeof the building, the important degrees, grades andStates of use, with or without a basement, ahd the foundati<strong>on</strong> types,etc.The c<strong>on</strong>diti<strong>on</strong>s of various diskes, hollows and holes, as well asthe cross-pipes under the building foundati<strong>on</strong> and the structuralc<strong>on</strong>diti<strong>on</strong>s.The buried depth of foundati<strong>on</strong>s neighboring the building.The c<strong>on</strong>diti<strong>on</strong> of frost heave and thaw settlement of basementsoil, etc.The six main factors listed above show: it is <strong>on</strong>e of six elementsthat seas<strong>on</strong>al frozen soil influences the buried depth of foundati<strong>on</strong>sbut it isn't <strong>on</strong>ly the elements. Through research and practicc it canreach purpose of reliability and safety, if the buried depth of build.ing foundati<strong>on</strong> is above the freezing depth of soil. The methods canbc divided into two stages: the first stage was before 1980, undersatisfying the c<strong>on</strong>diti<strong>on</strong>s of the strength and stability of basementsail, thc buried depth of the building foundati<strong>on</strong> was determinedbetween 0.8 and 1.4 rn from no frost heave to str<strong>on</strong>g frost heave accordingto classificati<strong>on</strong> of the frost heave grade of the basementsoil and characteristics of the building. However, some importantbuilding foundati<strong>on</strong>s should be deepened. After 1980, through testsand research of various elements for several years, a more rati<strong>on</strong>alcalculating method was obtained to c<strong>on</strong>sider the minimum burieddepth of building foundati<strong>on</strong>s in frost soils (Jiang H<strong>on</strong>gju, 1988).After the minimum buried depth of the building foundati<strong>on</strong> wasdetermined by this method and c<strong>on</strong>sidering the influence of otherelements, the suitable adjustments (total or partial deepening ) werec<strong>on</strong>sidered as design values. Through experiments and observati<strong>on</strong>for Several years, we think that the building cracks were not producedby tangential frost heave force and caused by an unevenfrozen soil layer under the foundati<strong>on</strong>.During the thawing stage of foundati<strong>on</strong> soil, due to,the diffcrentdirecti<strong>on</strong>s of the wall body and the different irradiating degreefrom the sun, as well as the different thinkness of the frozen soillayers and different deformati<strong>on</strong>s of frost heave, different thawingtimes and velocities of the frozen soil layers under the foundati<strong>on</strong>would occur. This resulted in an unequal subsidence and bendingdeformati<strong>on</strong> of the wall body. The deformati<strong>on</strong> in the two wings of'the wall body,was the most obvious and caused cracking when thedeformati<strong>on</strong> exceeded the allowable deformati<strong>on</strong> value.The analysis stated above was proved by a large amount ofobservati<strong>on</strong>s and testing of local practical engineerings. The influenceof tangential frost hcave force couldn't be c<strong>on</strong>sidercd <strong>on</strong> thethree kinds of soils( no, weak and normal frost heave). With soil ofstr<strong>on</strong>g or very str<strong>on</strong>g frost heave, preventi<strong>on</strong> measures should bec<strong>on</strong>sidered for safety against the tangential frost heave force of thefoundati<strong>on</strong> sidewall in the range of 3 meters from the c<strong>on</strong>vex cornersof the exterior wall ( Fig.]) The tangential frost heave forceneedn't be removed at a range of total frost depth in unheatedbuildings and the preventi<strong>on</strong> measures against tangential frostheave should be <strong>on</strong>ly c<strong>on</strong>sidered at half the depth of the outdoorground.Preventi<strong>on</strong> measures for frost heave damage in building foundati<strong>on</strong>sThe effective and ec<strong>on</strong>omical methods in Daqing regi<strong>on</strong> wereintroduced as follows:' The foundati<strong>on</strong> depth of an unheated building was determinedaccording to the method menti<strong>on</strong>ed in secti<strong>on</strong>ed above. But withthe heat building, whether <strong>on</strong>e or multiple stories, was deepened by20-30 cm in the corners and c<strong>on</strong>vex comers. The deepened lengthwas prol<strong>on</strong>ged 3-4 m ( especially at the c<strong>on</strong>vex corners <strong>on</strong> the basisof the c<strong>on</strong>er point). N<strong>on</strong>-frost heave riplacement material could beused in the deepened parts.For the basement soil of heated buildings with str<strong>on</strong>g and verystr<strong>on</strong>g frost heave, the deepencd length at the corner points (c<strong>on</strong>vexc<strong>on</strong>ers) was prol<strong>on</strong>ged 3 m in the directi<strong>on</strong> of the length and width.N<strong>on</strong>-frost heave replacement material was used at the exterior wallof the foundati<strong>on</strong>. In unheated buildings; n<strong>on</strong>frost heavereplacement material was used at the c<strong>on</strong>er points and internal andexternal walls of the foundati<strong>on</strong>. The replaced depth was half of thefoundati<strong>on</strong> buried depth al<strong>on</strong>g the foundati<strong>on</strong>. On the other hand,the foundati<strong>on</strong> could be made with a ladder-shaped cross secti<strong>on</strong>with a slope degree of 1:7 (see Fig.2 ) in order to eliminatetangential frost heave force.Thc apr<strong>on</strong> slope of the wall root should be d<strong>on</strong>e properly andit would prevent side wall of thc foundati<strong>on</strong> or bottom soil from being permeated by excess water. So as to reduce the acti<strong>on</strong> of frostheave and thaw settlement of soil.The foundati<strong>on</strong> wasn't designed <strong>on</strong> the first storey balc<strong>on</strong>y ofthe building and the balc<strong>on</strong>y floor was used in the beam structure.Under c<strong>on</strong>diti<strong>on</strong> of shallow foundati<strong>on</strong> determined by methodsof this paper, for safety res<strong>on</strong>s, the c<strong>on</strong>crete periphery beamshould be added <strong>on</strong> the top of the foundati<strong>on</strong> and the upper part ofthe wall body. The reinforcement of the periphery beam should beal<strong>on</strong>g the l<strong>on</strong>gitude is needed to increase the diameter of the rein-AA 2!r 'A31IFig.] A stretch map of the building planeNote: A-c<strong>on</strong>vex corner, E-c<strong>on</strong>cave corner, I-l<strong>on</strong>gtitudinalwall, 2, gable, 3-internal wall.forcement within the c<strong>on</strong>vex walls of building and the two ends ofthe l<strong>on</strong>gitudinal walls from 10 meters. The reinforcement of otherparts were d<strong>on</strong>e with the basis being reinforcement of other partswere d<strong>on</strong>e with the basis being reinforcement bars of the structurein order to improve the ability of preventing against freezing-thawingdeformati<strong>on</strong> of the wall body.P1153
~~ -.~r\Pig.2 A secti<strong>on</strong>al drawing of trapezoidal foundati<strong>on</strong>Table 1. The thickness of the allowable remaining frozen soillayer beneath the foundati<strong>on</strong> durin8 sprinrthawingThe frost heaveStr<strong>on</strong>gNo frost Weak Frostgrade offrostheave frost heavebasement soil heave heaveThe thickness oflimitrcmainingfrozen 70 50 30 15lesssoil layer (cm)Str<strong>on</strong>gerfrostThe foundati<strong>on</strong> of outer step8 bf the building should be separatedfrom the foundati<strong>on</strong> of the wall body. The soil under doorwaysteps should be replaced with n<strong>on</strong>-frost heave material andthe depth should be equal to the buried depth of the wall foundati<strong>on</strong>.The designed temperature of the ends at the corners should beraised properly. ,The Design of Frost Damage Preventi<strong>on</strong> in The Field of C<strong>on</strong>structi<strong>on</strong>In order to not add or reduce the grade of frost heave in thefield of c<strong>on</strong>structi<strong>on</strong>, the drainage desipp in the field of c<strong>on</strong>strueti<strong>on</strong> was important. The following issues should be payed close attenti<strong>on</strong>to:In order to have a good verticle design at the site, the ground..should have a proper slope degree which allows rainwater or waterseepage from pipes or taps to be drained away quickly so as not topermeate into the ground. Or a blind ditch should be planned usingthe materials of coarse sand and gravel, etc., at a depth of 0.5-0.7m to drain ground water.The comprehensive drainage system for domestic sewage, industrialpolluted water and atmospheric precepitati<strong>on</strong> should bec<strong>on</strong>sidered and linked with the urban drainage system. Meanwhile,drainage measures such as a cable, centrally heated dike and variousother pipes and dikes, and a cutting well should be irnplemented.Water can’t be allowed to permeate into the structures toprevent against frost damages.A BRIEF INTRODUCTIONTECHNOLOGY- ~ ~ .OF CONSTRUCTION ANDIN SEASOGE-EZTGOIL REGION^.On the basis of the climatic features and the freezing-thawingprocedure <strong>on</strong> basement soils in Daqiri regi<strong>on</strong>, the c<strong>on</strong>structi<strong>on</strong>stage of engineering could be divided into three stages:spring-thawing, summer and winter. The summer c<strong>on</strong>stnrcti<strong>on</strong> wasthe normal c<strong>on</strong>structi<strong>on</strong>, but in winter it was c<strong>on</strong>trary. Measuresused during spring-thawing c<strong>on</strong>structi<strong>on</strong> (from March 11-20 toJune 11-20) will be mainly introduced.The landform, land vegetati<strong>on</strong>, cave ~ etc. have effects <strong>on</strong> thefreezing state of basement soil. The grade of frost heave of basernent soils, freezing depth and important physical and mechanicalparameters of frozen soil ( Which were the water c<strong>on</strong>tent, dry density,thaw settlement factor and thaw compressi<strong>on</strong> factor, etc.)should be surveyed and the calculati<strong>on</strong> of thaw settlement shouldbe d<strong>on</strong>c.The bench mark of measuring the site altitude couldn’t be act-ed by the frost heave. The design should use the height of sea level(altitude) and couldn’t use a relative height.Because the natural griiund was not even, if frozen soil layersremained under the bottom of the basic trench when the depth ofthe basic trench was dug to the designed altitude, the allowable remainedthickness of frozen soil should be determined in accordancewith the table 1. If the basement soil of <strong>on</strong>e building has differentgrades of frost heave, the thickress of the frozen soil laycr would beadjusted in various parts and make the amount of thaw settlementas equal as possible. The total amount of subsidence would be restricted to the range of 10-1 5 mm.When the c<strong>on</strong>structi<strong>on</strong> field had a complicated landform andmore caves or a large area of moved buildings, and there was afrozen soil and warm soil areas and a great difference of frozendepth under the new building, all of the frozen soil should be removed to assure the safety.If the building had a large volume and the grade of the frozensoil layer under the bottom of the basic trench was also high, theremaining frozen Roil can be exposed thoroughly by the method ofa thaw trench and the c<strong>on</strong>structi<strong>on</strong> could begin when the c<strong>on</strong>diti<strong>on</strong>sallowed.Because of the thawing of the frozen soil layer during processof c<strong>on</strong>structi<strong>on</strong>, the water c<strong>on</strong>tent in the soil was large and a largersubsidence could appear. So to ensure the safety the followingpoints should be payed close attenti<strong>on</strong> to:a), When c<strong>on</strong>structing the foundati<strong>on</strong>, each part should bec<strong>on</strong>structed simultaneously so as to avoid unequal subsidence.b), For preventing c<strong>on</strong>structing water from flowing into thebgsic trench of frozen soil, when the foundati<strong>on</strong> was c<strong>on</strong>structed,the quality should be ckecked and the soil of the side wall should bkfilled into each layer.c),When c<strong>on</strong>crete was poured, we should avoid the c<strong>on</strong>crete tobe poured <strong>on</strong> the frozen soil layer the measures of maintaining thetemperature should be d<strong>on</strong>e well in order to prevent the c<strong>on</strong>cretefrom freezing.d), Air temperature during March 11-20 drops sharply, so themeasures of maintaining the temperature should be d<strong>on</strong>e well duringprocess of the c<strong>on</strong>structi<strong>on</strong> mortar and hardening.REFERENCESJiang H<strong>on</strong>gju and Cheng Enyuan, 1988, A method for calculatingthe minimum buried depth of building foundati<strong>on</strong>s, V ICOP<strong>Permafrost</strong> Proceedings, V01.2, ~1253-1255.
THE PREVENTION AND TREATMENT OF FROST DAMAGE ONBUILDINGS AND CANALS IN PERMAFROST REGIONSJim TianbaoYitulihe Branch of Harbin Railway Brueau,Heil<strong>on</strong>gjang,ChinFIn forest regi<strong>on</strong>s of permafrost,thc frost damage of buildings and canals is caused by bigger water c<strong>on</strong>tentsof,mils,lower bearing capacity and air tempcraturc,uneven frost heave and thawing settlementctc.This paper introduces mainly how to protect and utlize the bearing capacity of frozen soils, removeunderground water,strmgthen the whoie strength of c<strong>on</strong>structi<strong>on</strong> and coldproof and heatproof propertyetc.ta prevent and treat frost damage.INTRODUCTIONDa Xinggan Ling fortst regi<strong>on</strong>s located from 119'40'to127'00% and 46'30'to S3'21'N are pcrmafrost regi<strong>on</strong>s where meanannual air temperature is about -4'C. In these regi<strong>on</strong>s,thc buildingsand canal arc often subjmttd to frost damage in varying degree.So,in this paper,we put forward some measurements of pmventing and treating frost damage.save the heating fuel. Since the total practical transmitting heat re.sistance of pad R,(1 .6m2h "C/Kcal) is bigger than the necessarytotal transmitting heat resistan& R, (I.4m2h 'C/Kcal),So itsheatproof property completely satisfies with requirement of groundsurface.ITHE PREVENTION AND TREATMENT OF FROST DAM-AGE ON BUILDINGSThe Base of Chassis C<strong>on</strong>nected with Buildings of Filling Instead ofRigfig and The Preventi<strong>on</strong> and Treatment of Frost Damage ofThe Old Wooden Buildings.Since the wooden buildings arc fairly c<strong>on</strong>venient in forest regi<strong>on</strong>s,sothis is a main subject to study, prevent and treat the frostdamage. The main advantage of new wooden buildings arc:Tcobble,slag,lime slagI IThe smaller weight and pressure and the well-adaptabilityFrom structure drawing,we can obtain that the pressure underchassis is <strong>on</strong>ly 0.098MPa. When transfercd to original ground surfacethrough pad, this pressure becomes to 0.02MPa. and to thebottom of suffered pressure layer,it is 0.04MPa, which <strong>on</strong>ly equalsto minimum allowable bearing capacity of silt which has maximumwater c<strong>on</strong>tents. So,this type of building can be built everywhere.Forold'wooden building which need digging base to lay chassis andbury pillars,it can not be built in regi<strong>on</strong>s of silt and poor-geologicalc<strong>on</strong>diti<strong>on</strong> etc.(Pig.l and Fig.2).The well-heatproof and radiative property6. The heatproof property is good,so,this type of building canFig.1 The secti<strong>on</strong>al drawing of house c<strong>on</strong>nected with chassisCompared with the ground surface of red brick or yellowday,the ground suiface of lime slag may reduce the heat-low61.5Kcal/ m'h. So,for <strong>on</strong>e ye& (heating 7 m<strong>on</strong>ths),the house(30m') can save coal 2.1 T.b). Protecting original geological c<strong>on</strong>diti<strong>on</strong>s arc preventingthawing settlement and frost heave. Namely protecting soil can&ti<strong>on</strong>r of comm<strong>on</strong> haating buildings in the ranges of the thawingplats of f 20% span not to change.In aspect of absorbing heat: Since the apoorbing heat paramat-k155 0,
lar strip of outside wall,this method can prevent damage of -buildings.The lower cost andc<strong>on</strong>venient c<strong>on</strong>structi<strong>on</strong>Since slag and sawdust are fairly universal in forestregi<strong>on</strong>s,and the base filling instead of digging is not limited by c<strong>on</strong>-.diti<strong>on</strong>s,so,thc cost of this type of building is lower, and the c<strong>on</strong>-'stmcti<strong>on</strong> is also fairly c<strong>on</strong>venient.But it is difficult for the oldwooden building.rubble base'of inside wallFig.2 The secti<strong>on</strong>al drawing of old wooden houseer of lime ground (0.29) is smaller than that of brick ground (0.7),So,the thawing settlement can be reduced 4.13m.In aspect of heat c<strong>on</strong>ducti<strong>on</strong>: Since the heat c<strong>on</strong>ductivity ofpad is smaller than that of clay ground surface,So,tha thawing settlementcan be reduced 1.98111.In aspect of heat diffusi<strong>on</strong>: Since we lay the apr<strong>on</strong> slope ,protecti<strong>on</strong>of 3m in every sides of building,which increases theradiative volume of pad,the thawing settlement also can be reduced0.85m.For old wooden buildingqthe buried depth of wall pillar is <strong>on</strong>lysituated in place of maximum frost heave force.The tangent frostheave force of a pillar is about 8.4 T,and the normal frost heaveforce is 18 T. So,the join forces (26.4T) is much bigger than theprcssure of a, pillar(2.2T). In additi<strong>on</strong>,according to local climaticc<strong>on</strong>diti<strong>on</strong>s, for average 3m frost depth, the amount of repeatedfrost heave and thawing settlement is about 18 cm, and, for 7mthawing layer inside house,the minimum amount of settlement is20cm over,So,the difference of 38cm between freezing and thawingcan cause serious damage of buildings.The well-entirety can,prevent uneven frost heave and thawing-set.tlcment ofbuiidings.According to theoretical calculati<strong>on</strong>, the padcan prevent completelyfrost heave and thawing settlement of frozen ground layerundcr buildings. Even some uneven frost heave and thawing settlement,the loose pebble layer can be atljusted,and the floor of reinforcedc<strong>on</strong>crete and the chassis c<strong>on</strong>neyted with buildings can alsobe balanced. Since the chassis of inside and outside wall are c<strong>on</strong>nectedtogether and do not produce relative displacement, so, thefrost damage of buildings will not occur.For old wooden buildings, since different C<strong>on</strong>ductivity of insideand outside wai1,the inside wall is often produced crackle anddamage.So, we design a settled crack with felt to inlay two triangu-The foot of-wall do not produce damage and form frost,and the insidehouse is dry and do not produce seepage.We design a hopper of 45' <strong>on</strong> top of wall.The hopper maynot <strong>on</strong>ly increaw thickness'of coldproof layer but makc coldproofmaterials fill into space of wall at any time so that it can avoid disadvantagesof ventilati<strong>on</strong> in winter also.For the old wooden building,wealso use this method to improve its disadvantages.The acti<strong>on</strong> of eaves, dado, apr<strong>on</strong> and pad are that they may eitherkeep room drying and foot of wall not breaking etc. or preventthawing settlement of ground surface and forming frost of outridewall etc.. But they are just serious disadvantage of old buildings.The method by which frost damage of' building can be preventedthrouth filling instead of digging is <strong>on</strong>ly suitablc for woodenbuildings but also for brick buildings.." _- ~~The Base of Plug-in Pile of Reinforced C<strong>on</strong>crete of Protecting.-".".." . . -. - . . . .. . .Original Vegetati<strong>on</strong>.-. " . -. . .-. - " " . . . -. .Tn the ice-rich z<strong>on</strong>e ofswamp and tussock hummocks, therearc humus soil, silt and layered ice under most of' ground surfacewatcr,so,the comm<strong>on</strong> built method bf digging groove and liningbase is difficult to c<strong>on</strong>struct and prevent frost damage. From198O's, according to < > in 1977,wedesign the turret pile of 30cm corner radius.Meanwhile,we still laytussock hummocks or slag of' 45cm thjckncss <strong>on</strong> orignial groundsurfact(Fig.3) to prevent damage of vrgetati<strong>on</strong>. The buildingswhich we adapt this methodto build arealwaysgood through perennialuse.'Fig.3 Ventilated and insulated base with reinforced c<strong>on</strong>creteplug-in piles and whole circle beam1156
~ ,- ..C<strong>on</strong>crete C<strong>on</strong>e-secti<strong>on</strong> Mound Base for Advoiding Frost HeaveEn? Reducing Compressive Pressure.-In permafrost area, Tussock hummocks grow prosperly <strong>on</strong>slope, and surface water is found everywhere, while clayey frozenground is found under tussock hummocks. It is impossible to useideal reinforced c<strong>on</strong>crete plug-in pile base, and it is unec<strong>on</strong>omicaland can not avoid frost damage to use general strip base.So, ac<strong>on</strong>e-secti<strong>on</strong> mound base with linking circle beam is selected in anew school -building. Good effects are obtaincd, and the maincauses are as follows:Cement apr<strong>on</strong> with l<strong>on</strong>g eaves, high doda and asphalt groutingcracks can protect not <strong>on</strong>ly rain water from permeating intobase but also apr<strong>on</strong> from cracking due to cohesi<strong>on</strong> with wall duringseas<strong>on</strong>al frost heaving and thawing Settlement.Raising the the ground surface by 0.45m, thc heating wouldnot affect the thawing depth.Half filling and half digging not <strong>on</strong>lyrcduccd loss and digging soil, but also was used to intersect upperslope water and to remove ground water.Two circle beams increased the whole rigidity. and thiscanprevent the influence of uneven freeze-thaw <strong>on</strong> building.Grains beside the bottom of beam can fill the soil settlementand prevent cold air from flowing into room from the bottom ofthe circle beam.Thc air layer between floor arrise can prevent either the heatinside room from transfering to increase thawing depth, or floorand beam from decaying during air flowing.It is more importantthat when uncvcn frost heave occurs beneath circle beams, thegrains below beams squecze up cement apr<strong>on</strong> outwards and pushtoward air laycr so as to prcvcnt circle beam from damage.Rase boundary, blind canal and seepage wcll are filled withgrains, and no water and damage <strong>on</strong> basc boundary occured:Using elliptic c<strong>on</strong>e-secti<strong>on</strong> mound c<strong>on</strong>crete base is more cc<strong>on</strong>omicalthan using strip base.The tangent and normal frost heavingforce bctween ground and flanks of base could bc cleminatedbecause of the smooth surface and the shape of the elliptic base,meanwhile,the normal frost heaving fofce and campressive pressure<strong>on</strong> the bottom of base was reduced.(Fig,4)Complete. Preventi<strong>on</strong> and Treatment of Frost Damage <strong>on</strong> FdBuildings.A forest bureau built a four-floor living building including aclosed balc<strong>on</strong>y and a brick-c<strong>on</strong>crete structure in 1985. Cracks appeareddue to settlement in summer of 1986.By the begining of1988, more,than ten large cracks showed <strong>on</strong> the south wall from thebottom of the wall to the arrise of the room. Doors and windowspassing toward balc<strong>on</strong>y were compressed to be damaged bycrushed bricks. The widthes of some large cracks are more than50mm. Although most of the widthes of the cracks <strong>on</strong> inside wallwere less than 20cm, but dense cracks caused an unsafty state.The building was originally desingned as a 2.55m nigh rubblebase-top' with a 150 reinforced c<strong>on</strong>crete circle beam(40cm width,40cm height), 14 reinforcing bars of 12mm, and 2.95m deep base.However, during c<strong>on</strong>structi<strong>on</strong>, a reinforced c<strong>on</strong>crete circle beamwith 49cm width and 90cm height was set up <strong>on</strong> a rubble base-topwhose height was <strong>on</strong>ly 0.7m, and22 reinforcing bars of @ 14mmFig4 Profile of house with double-circle c<strong>on</strong>e-secti<strong>on</strong> moundbase..were in$talled.The depth of the basc is I .6-1.7m, which is just In theranjic 01. the maximum frost heaving within 2m from ground surfjce.Thcre was not measurementto prevent cooling, drainage, andrefilled insidc the room.A closed storage warminc room u x cformed around heater pipe under floor. and this rapldc the raw itnddepth of thawing of undcrground liozen layer insidc the room. Inadditi<strong>on</strong>, three 30-50mm soil-icc layers existcd within the 2 m ofthc base-bottom, which caused heavy thawing scttlcmcnt andcracks <strong>on</strong> the outstde walls. Thc soil around base boundary. whichwas wetted by rain in autumn, resulted in frost heave inwintcr.Therefore. about 20cm of seas<strong>on</strong>al frost heavc and settlcnlentoccured yearly, which caused veriical cracks <strong>on</strong> rhe outsidewalls. On the other hand, the horizental norm:ll frost heanng force<strong>on</strong> the flanks of' base reached to 10T / m'. unfilled so11 inside roomcould not support rcsistence. This resultcd in hnr17cntal cracks 011thc outside walls. In later c<strong>on</strong>struc~l<strong>on</strong>, it was found that manyparts of under the outside circle beam\ wcre hanged in air owing tothawing settlemcht of soi1,and the mcximum hanged depth at bothsides of southwest corner was up to 2-3m.Combining investigati<strong>on</strong> with local hydrogeological c<strong>on</strong>diti<strong>on</strong>,the following treatments are suggested:Avoiding-frost heaving form around base boundary.In order to prevent rain water from permeating into base tocause frost heaving force, besides raising ground surface and addingc<strong>on</strong>crete apr<strong>on</strong> with grouting a*>halt cracks: dry slag, sandygrain, pebble and cobble are filled in order from the depth of0-0.3111 to the bottom of base. This treatment play a role of coldpreventi<strong>on</strong> and insulati<strong>on</strong> so as to reduce the frost Forcb <strong>on</strong> theflank of base. At the same time, underground water is permitted topermeat into blind canal to flow to hidden well.There is no water in
the dry base boundary,so there is not any frost.damage.Avoiding the thawing settlement of base bottom.Firstly, heaters under floor are moved floor,so the heat sourcereleasing down iseleminated. Sec<strong>on</strong>dly, insulated felts, asphalt feltsand new floor are paved. Water <strong>on</strong> floor are not allowed premeatingdown to wet thcbelbw insulated materials, and the heat in roomcan not c<strong>on</strong>duct down. In order to prevent floor from decaying andreleasing residual heat down to floor, a few vantilating holes arebuilt in additi<strong>on</strong> to retain a air layer of 25cm beneath floor. A sawdustlayer of 30cm with lime is paved <strong>on</strong> the top of filled dry slag toinsulate heat and prevent thawing. By use of these measurements,the frozen layer does not settle and crack does not appear <strong>on</strong> theinside wall.. - ." "Repairing" __ crushed brick walls.The crushed brick. walls are comm<strong>on</strong>ly rebuilt. Large cracksare firstly mended using high level cement mortar.Aftcr the groutingwater is dry, cracksc, whose widths are mare than Smm, aregrouted into mixed glass-ccment mortar,and small cracks of lessthan 5 mm are compressed into water glass. Some small cracks <strong>on</strong>walls and ceilings are smoothed with dilute cement mortar.Atiet'doors and windows are paintcd,the building looks like a new <strong>on</strong>e.The measurements for preventing frost heave, drainage, insulati<strong>on</strong>,and preventing thawing settlement are carried out well duringc<strong>on</strong>structi<strong>on</strong>. Since'the project was finished in 1989,the buildinghas been worked well.THE PREVENTION AND TREATMENT- OF FROST DAMPAGE - ON ". CANALS ."-The comm<strong>on</strong> buried depth of local canals is 3.3m, which liesbetween thc minimum frost depth(2.9m) and maximum frastdepth(3.5m).Although the damage of seas<strong>on</strong>al ,frozen layer isavoided within the depth, the menace of permafrost layer of 2.5mstill exists. Therefore, the shallow buried insulated pipeline isused.This kind of pipcline is made mainly by: packing polystyreneof 7cm thickness around tht pipeline of @ 1 SOmm; packing asphaltfelts and placing it <strong>on</strong> the wooden block (<strong>on</strong>e cach pipe) with thesize of 12cm width,20cm height and 70cm length; covering rcinforcedc<strong>on</strong>crete semicircle pipe with the size of Im diameter and7cm thickness;and paving slag of 0.Sm thickness and clay of 0.2mthickness(Fig,5). The 600m length pipeline,which was built accordingto the above method, has been running well for six years, especiallyin rock layer z<strong>on</strong>e. This c<strong>on</strong>firmed that these measurementsare effective. The better methods are:(]) Replacing the c<strong>on</strong>necti<strong>on</strong>of screw of flange plate with specific hoop, the c<strong>on</strong>structi<strong>on</strong> wouldbe rapidly carried out, and the tenacity to resist the uneven freezingand thawing could be strengthened.(2) Replacing alphalt felt andir<strong>on</strong> line with plastic film and nyl<strong>on</strong> rope to pack polystyrene, costcould be reduced, and tenacity could be strengthened.(3)Replacingreinforced c<strong>on</strong>crete semicircle pipe with reinforced c<strong>on</strong>crete pipe of0.6m diameter, c<strong>on</strong>structi<strong>on</strong> becomes easier, and the rigidity issterngthened when vehicles pass above the canal. A layer of 15 cmthickness (more than comm<strong>on</strong> ground surface frost heave 147mm,and slight less than the average thawing settlement of base)of slag isfilled <strong>on</strong> the bottom and the flanks of base. This can adjust unevenfrost heave and thawing settlement. The clay layer of 0.3m thick-ness is slight higher than ground surface. This not <strong>on</strong>ly prevents thetop of pipeline from breaking out by behicles but also makks thedrainageeasy. (4) Hanging the pipeline <strong>on</strong> the wall of reinforcedc<strong>on</strong>crete pipe,a good air layer is maintained and penetrati<strong>on</strong> ofground water is avoided..The feature of this kind d pipeline facilitates the c<strong>on</strong>structingFig.5 Cross-secti<strong>on</strong> of buried shallow pipelineand repair of pipeline besides preventing frost damage.In swamp z<strong>on</strong>e with tussock hummocks; is the reinfomd c<strong>on</strong>- 'mete pipeline is changed into the shape of groove, and placed <strong>on</strong>the pad of refilled grains of 0.3m thiclncss, and if dag is paved aGcording to thermal requirement. and rainproof layer of clay is covered.the pipeline would be more effective.REFERENCEDesign Standard and Criteria of Base and Foundati<strong>on</strong> in<strong>Permafrost</strong> Regi<strong>on</strong>s, in USSR.Moscow. The House of Amhitecture,1977.Translated by Northwest Institute of ChieseAcademy of Railway Scienccs.Proceedings of Architectural Design(l-3).Beijng Institute of IndustrialC<strong>on</strong>structi<strong>on</strong>, Architecture Engineering Ministry. TheHouse of Chinese Arehitecture Industty(1973-1978).1158
DETERMINATION METHOD FOR THF. COEFFICIENT OF THE DEGREEOF SUNSHINE AND SUNSYADE ON CANALSLi Anguo and Chen QinghuaNorthwest Aydrotechnical Science <strong>Research</strong> Institute,Yangling, Shaanxi. ChinaThe coefficient (K1) of sunshine and sunshade extent is a basic parameter forpredicting frost penetrati<strong>on</strong> in engineering design. In order to get an accuratevalue for the coefficient tallying with theiactual case, the total radiati<strong>on</strong> <strong>on</strong>each part of the canal secti<strong>on</strong> and level ground in a freezing period (ZQ, and ZQ)are determined respectively based <strong>on</strong> geographic latitude, elevati<strong>on</strong> of the canal,local topographic c<strong>on</strong>diti<strong>on</strong>s, trend of the canal and shape of the secti<strong>on</strong>. Thenthe coefficient <strong>on</strong> each part of the secti<strong>on</strong> may be determined byK~ - (CQaB-CQ)*asltF..BINTSODUCTIONThe coefficient Kd of the degree of sunshineand sunshade is a basic parameter in forecastingthe engineering-design frozen depth (Professi<strong>on</strong>Standard of Water C<strong>on</strong>servancy and Electricity inP.R. China, 1991). At present an experimentalmethod is used to obtain the value, which israther limited and is too rough. It has beenproved in practice that the degree of sunshineand sunshade in each engineering site variesnot <strong>on</strong>ly with geographic latitude, sea levelheight and topographic c<strong>on</strong>diti<strong>on</strong>s at theengineering site but also greatly with differentengineering patterns. Therefore, according tothe above factors and the strike of the canaland the shape of the cross secti<strong>on</strong>, etc., theclimatology method is used to calculate respectivelythe total radiant amount of the sun <strong>on</strong>each part of the canal and horiz<strong>on</strong>tal ground inthe frozen period and the increment of accumulatingtemperature <strong>on</strong> each part of the canalcorresp<strong>on</strong>ding to the horiz<strong>on</strong>tal ground. Thecalculated formula of the value Kd can beobtained and the Kd can be determined accurately.1. Determinati<strong>on</strong> of the -Time of Sunrise andSunset <strong>on</strong> SlopeLet - w ~ and +WH be the time angles of sunriseand sunsei under the c<strong>on</strong>diti<strong>on</strong>s 0: no terrainsheltering and at the height H above sea level.h cr and Sfia are the height and radiant flux of" t8e sun <strong>on</strong> the sl.ope with slope directi<strong>on</strong> B,gradiant a. When there is no other sheltering,the necessary and sufficient c<strong>on</strong>diti<strong>on</strong>s for thesun to shine <strong>on</strong>to the slope are:-WH 5 w 5 +w H (1)S B ~ 2 . 0 (or hBuzO) (2)can be deduced:W~=COS "1 (-tan&tan6-0.0177di secQsec6)(3)SBa=I(~sinG+vcos8cosw+sinBsinacos6sinw)~ (4)where, 4 geographic latitude;6 - the sun l<strong>on</strong>gitude;H height above sea level (kilometer);I - the radiative strength of the sun1.94~10- Kcal/cma .min.u.-sin&cos~-cos&sinacosBv=cosQcosa+sinQsinacos8Since the necessary c<strong>on</strong>diti<strong>on</strong> of sunshine isSB~ZO, then obviously the time angl7.w~ withS a-O is the Aitical angle when Sga turns fromtie negative to the positive or turns oppositely.Let the right side of (4) be equal to zero,. ,the expressed equati<strong>on</strong> of the critical timeangle ws can be obtained as follows:From the first part of (6) the two absolute'values of the ws can be determined, and thesymbols for the sec<strong>on</strong>d half can be given.Supposing that the two values of ws are us! andwsz separately, and wS2>wSl, since SB~LO 1snecessary for the slope surface to be exposedto the sun. we can easily see that the timeangle w1 of sunrise and w2 of sunset <strong>on</strong> theslope should satisfy the following c<strong>on</strong>diti<strong>on</strong>s:where w is the time angle of the sun.Using the astr<strong>on</strong>omical formula, the following1159
At the same time, since it would be possiblefor slo e surface to be exposed to the sun <strong>on</strong>lywhen lwPS 1 ~ ~ wl, 1 , wp should also satisfy thefollowing c<strong>on</strong>diti<strong>on</strong>:2, Determinati<strong>on</strong> of the Time of’Sunrise andSunset <strong>on</strong> Each Part of the CanalAs shown in Fig.1, choosing a free point A<strong>on</strong> the trapezoid canal with the strike being y,width of the bottom being B, depth of ‘the canalbeing H., gradient of the sideslope being a, ifthe heights of both canal banks a, b do notvary greatly and the canal, is very l<strong>on</strong>g, pointA is sheltered from the sunlight by the canaland is equal to that of the two imaginary slopesurfaces Aa and Ab. The gradients of them arerespectively equal to the elevati<strong>on</strong> angle aa,observed from point A to the bank top in thedirecti<strong>on</strong> of the perpindicular bank s-(that is,the maximum angle of sheltering from bank a topoint A or the maximum angle of sheltering <strong>on</strong>the horiz<strong>on</strong> made by point A), and the elevati<strong>on</strong>angle ab, observed from point A to the bank topin the dfiecti<strong>on</strong> perpendicular to bank b. There.-fore, the time angle WA) of sunrise at p<strong>on</strong>t Ashould be equal to the later of the two imaginedslope surfaces Aa and Ab, and the time anglewA2 should be equal to the first of the two. Intwo other c<strong>on</strong>diti<strong>on</strong>s, such as the very l<strong>on</strong>gcanal in U shape and arc shape and the canal <strong>on</strong>the edge of the plateau, a method similar tothe <strong>on</strong>e menti<strong>on</strong>ed above can also he used todetermine the time angle of sunrise and sunsetor the amount of sunshine in every day.ZFig.1 Sketch of the canal and related parameters(see text for details)In Fig.1, the coordinates of points a, b, andA are: a(Xa, Z,)-a(B/2+Ho/tanu,Ho), b(Xb, zb)=b(-B/Z-Ho/tana.Ho) and A(XA, ZA), respectively.The gradients of slope Aa and Ab are separatelyaa=(Za-zA)/(Xa-XA) and “b=(Zb-xA)/(XA-Xb). Theazimuths of slope Aa and Ab are Ba=Yt90° and6b=Y-9Oo.Time angles of sunrise and sunset.^,,, waZ<strong>on</strong> slope Aa, Ub2 and b <strong>on</strong> slope Ab, can becalculated by the rule described in the firstpart of this paper by substituting the givendata into the relative equati<strong>on</strong>s, and then,according to the possible c<strong>on</strong>diti<strong>on</strong> that pointA could be exposed.to the sun.The time angles of sunrise and sunset can beobtained at point A.I_ 3. Calculati<strong>on</strong> of the Total radiant Amountnirectly ReachinR Each Part of the CanalThe daily total radiant amount of the sun <strong>on</strong>each part of the canal and horiz<strong>on</strong>tal ground(corresp<strong>on</strong>ding to the c<strong>on</strong>diti<strong>on</strong> that theatmosphere is completely transparent or thereare no obstructi<strong>on</strong>s <strong>on</strong> the earth) can becalculated with the following:’<strong>on</strong> each part of canal (Fu Baopu, 1983):3n horiz<strong>on</strong>ta1 7vo = rR’1Iground:where, WBao’ io - total daily radiant amount ofthe sun <strong>on</strong> each part. o r thecanal and horiz<strong>on</strong>tal r;rnun-’.T. - c<strong>on</strong>stant of the sun, 1.94~10”~~ 11;cm’.min.R - distance between ZIIF bun and gt,.~.with the sun-ground averagedistance as the unit.* - the length of time in B d;jy f=L.’60 minutes).w1,W~ - time angles of sunris~ andsunsut <strong>on</strong> each part of tht? , Idetermined by the methoddescribed in the sec<strong>on</strong>d pjr-t o !this paper.the meaning of the other signs is simi1.1r tothose in the previously equati<strong>on</strong>s.In any period of time, the total astr<strong>on</strong>omicalradiaht amount is the sum of total dailyastr<strong>on</strong>omical radiant amount in this period..Tne radiant amount directly reaching thehoriz<strong>on</strong>tal ground can be calculated by theexperience formula (Gua Guod<strong>on</strong>g and Lu Yur<strong>on</strong>g,1982).So = a + b.Qo.Sl (10)where, So - total m<strong>on</strong>thly radiant amountdirectly reaching horiz<strong>on</strong>talground, unit (Kcal/cm’.m<strong>on</strong>th).Qo -- total m<strong>on</strong>thly astr<strong>on</strong>omical radiantamount 0: horiz<strong>on</strong>tal ground, unit(Kcal/cm .m<strong>on</strong>th),S1 - average daily sunshine ratlo in amL)n th .a, b ere coefficients related to the transparencystate of the atmosphere, which can bec<strong>on</strong>sulted from Fig.2 (Gao Guod<strong>on</strong>g and Lu Yur<strong>on</strong>g.1982).From (10) the following can be obtained:,So/Qo = s/Qo t b.S1 = f (illwhere f is the functi<strong>on</strong> of atmosphere transparency<strong>on</strong> horiz<strong>on</strong>tal ground.With the research of Fu Baopu, 1983, it canbe known that in the rano.? of our country, thefuncti<strong>on</strong> of atmosphere transparency above a
11 - average total cloud amount in a m<strong>on</strong>th.HI, h, are the coefficients indicating thetransparcncy degree 1)f the atmosphere, which canbe found Frunl Fig.3 (Cao Guodvng and 1,u Yur<strong>on</strong>g,1982).Fig.3(a) Distributiun graph of coctficient a1calculting formula of ~c~t.teringradiati<strong>on</strong> in winter (Kcallcm')inEig.?(h) Distrihu~i<strong>on</strong> graph of coefficient bl incrllculting formul~ of scatteringradiati<strong>on</strong> in winter (Kcal/cm')('sing f' AS the transparency degree of theatmosphere, (13) can bc changed into:where, SAa - total m<strong>on</strong>thly amount of radiati<strong>on</strong>direct I y reaching each part of thecanal, unit. (Kcal/c.m'.m<strong>on</strong>th).QBao- total m<strong>on</strong>thly amount of astr<strong>on</strong>omicalradiati<strong>on</strong> <strong>on</strong> each part of thecanal, ut) it. (Ycal/cm'.m<strong>on</strong>th).4. calculati<strong>on</strong> of the Total Scattered RadiantAmount, <strong>on</strong> Each Part of the CRnalTht. scattered radiant. amount <strong>on</strong> the horiz<strong>on</strong>talground can he calculated with the experienceformula of Lao Guod<strong>on</strong>g and Lu Yur<strong>on</strong>g, 1982.Do = a1 t bl.Qo.n (13)where, 1, - thr! total m<strong>on</strong>thly amount of ntat-Lel-ed radiati<strong>on</strong> <strong>on</strong> horiz<strong>on</strong>talground, unit. (Kcal/crn'.m<strong>on</strong>th).Qo - total m<strong>on</strong>thly amount of astr<strong>on</strong>omicalradiati<strong>on</strong> <strong>on</strong> horiz<strong>on</strong>tal groundun't, (Kcal/cm'.m<strong>on</strong>th).Do = f'.L),=(L t b,n).L),00(14)SuylJosiuR that the scattering and the radia--Li<strong>on</strong> are similar in all directi<strong>on</strong>s, the caltulatingformula of scatter~d radiati<strong>on</strong> flux, byFu Baopu, 1981, can be referred to.- -D =& ~(cosa,tcosa~)cosa-(sina,-sinu~)s~nalRa 2-where, DRa-the density 'of the average daily(15)flux of scattered radiati<strong>on</strong> <strong>on</strong> slope- surface, unit, (ca~fcm'.min).no- the density of the average dailyflux or scattered radiati<strong>on</strong> <strong>on</strong>horiz<strong>on</strong>tal site, unit. (caZ/cm',min),.a - gradient of slope surface.1 a, ab are thc maximum angles of shelteredarea respectively from ridges a, b to thestudied point.The flux formula of scattered radiari<strong>on</strong> at 'each part of the canal can be writtep in theform of:
-where, asai - the density of.average flux ofscattered radiati<strong>on</strong> <strong>on</strong> any tartof the canal, unit. fcal/cm .min).manab - maximum angles of sheltered areaseparately from the canal banksa. b to 8 certain degree.If c<strong>on</strong>sidering the model different in alldirecti<strong>on</strong>s, referring to the method put forwardby many scholars, that the models are differentin all directi<strong>on</strong>s is used to calculate thescattered radiati<strong>on</strong> amount <strong>on</strong> slope surface andare an improvement to the models that are similarin all directi<strong>on</strong>s, and approximately using thecorrected value given by Li Zhangqing and WengDuming:A(ho.u.n,fJ)~F(n).cosl.09ho.sinl.42a.cos~35 1=0.~503F(n).cos1.09ho.sinl.42u.cos~(17)where, ho - aveiage height angle of the sun atno<strong>on</strong> in the period of calculati<strong>on</strong>.F(n)-l-(O.En+O.O2nL).A(ho,u,n,$)- correcting value, cal/cm'.min.a the gradient of slope.6 - the azimuth of slope directi<strong>on</strong> tocalculating part.n - the average total cloud amount ina m<strong>on</strong>th.nL - the average low cloud amount in am<strong>on</strong>th.The equati<strong>on</strong> to calculate the average dailyflux density of scattered radiati<strong>on</strong> <strong>on</strong> each partof the canal can be derived as the following:+0.0503~(n).cos1.09ho.~~n~.L2a.cos~From (18). the calculating equati<strong>on</strong> of them<strong>on</strong>thly summary amount of scattered radiati<strong>on</strong>at each part of the canal can be found easilyusing:where, t - is the number of days in a m<strong>on</strong>th,5. Calculatinn the Total Radiant Amount <strong>on</strong> EachPart of the CanalTotal radiant am0unt.Q is the sum of thedirectly reaching gradiant amount and scatteredradiant amount D, that is:Q - S + l l (20)The m<strong>on</strong>thly sum of total radiati<strong>on</strong> <strong>on</strong> each partof the canal:The m<strong>on</strong>thly sum of total radiati<strong>on</strong> <strong>on</strong> the hori- ., /z<strong>on</strong>tal ground:Q'=So t DoIn a l<strong>on</strong>g period the sum of the total radiati<strong>on</strong>is the accumulati<strong>on</strong> of the total m<strong>on</strong>thlyamount of total radiati<strong>on</strong> for every m<strong>on</strong>th in theperiod.6. Determinati<strong>on</strong> of the Vale Kt! for Each Partof the CanalFrom the beainninn .? - of calculating the frozenindex to the day when its maximum value appears,with the following equati<strong>on</strong>s (21) and (22),separately calculating the total radiant amount<strong>on</strong> each part,of the,canal and. horiz<strong>on</strong>tal ground,day aEter day, then accumulating them separately,the total radiant sum CQ and CQ can be obtained<strong>on</strong> each p,prt of the canafaand horiz<strong>on</strong>tal groundin the frozen period. In the period the incrementof accumulating temperature <strong>on</strong> each part ofthe canal corresp<strong>on</strong>ding to the horiz<strong>on</strong>tal groundsurface is:(23)where, 8- thermal diffusive coefficient jete'-mined by average wind velocity (ZhuBaifang and yang T<strong>on</strong>dsheng, t97h),unit. Kcal/m .h.'C.as- thermal absorbing coefficient, taking0.65 for c<strong>on</strong>crete surface.Therefore, the degree of sunshine and sunshadeis c<strong>on</strong>sidered by formulati<strong>on</strong>, the-value Kd Ofthe revised coefficient of the frozen depth ateach part of the canal can be computed as:where, Fo -- frozen index.H6,,H0 - the value of frozen depth of eachpart of canal secti<strong>on</strong> and groundsurface.For example, in Yingchuan frost-heave testingfield, Its geographical latitude is 38.4872,height above sea level (H) is 1.113 km, thestrike of canals in the field are different inE-W, NE45', N-S, NW45O,, the size of the canalsin the cross secti<strong>on</strong> ail are 3.10 m in bottomwidth, 1.8$5 m in canal depth, 1:1.35 in sloperatio of side slope. According to the analysisof atmospheric data obtained in the last 30years, the aierage frozen index is hhh.7"C day,the average frozen depth is 105 cm, the frozen 'period is from Nov. 20 to Mar. 13, the averagewind velocity in the freezing period is I.R4m/s.On the basis of the calculating methoddescribed above, we can get the value Kd ateach part of the canal, as shown in the table.REFERENCESFu Raopu, (1983) Atmosphere in Mountains,Science Press, 2-55.Gao Guod<strong>on</strong>g and Lu Yur<strong>on</strong>g, (1982) Balance ofradiati<strong>on</strong> and balance of heat en groundsurface in China, Science Press, 9-35.G.Y. Partridge and C.M.R. Platt, (197h) Developmentsin atmospheric science, 5, radiativeprocesses in meteorology and climatology,Elsevier Scientific Puhlishing Company,Amsterdam-Oxford-Ndw York, 37-41.L1 Zhanqing and Weng Duming, (198,) The distributi<strong>on</strong>and computing model of \he diffused.
adiati<strong>on</strong> <strong>on</strong> slopes, Acta MeteorologicalSinica, Vo1.46, No.3, 349-356.Zhu Baifang and Wang T<strong>on</strong>gsheng, (1976) Thetemperature stress arid temperature c<strong>on</strong>trolmentof hydraulic c<strong>on</strong>crete structures, WaterResources and Electric Power Press, 28-35.1163
SIMILARITY ANALYSIS OF MODELING TESTOF FROZEN SOIL UNDER LOADLi D<strong>on</strong>gqing Zhu LinnanState Key Laboratory of Frozen Soil EngineeringLanzhou Institute of Glaciology and GeocryologyChinwe Academy of SciencesThe article is based <strong>on</strong> the principle of similarity theory , analyzed the static questi<strong>on</strong>of thawed and frozen soil <strong>on</strong> Similarity analysis systematically, derived the similarc<strong>on</strong>diti<strong>on</strong>s of mechanics which modeling test of frozen soil under load must be satisfiedwith ;and <strong>on</strong> the basis of the c<strong>on</strong>diti<strong>on</strong>s, we propose a approximate method of modeling' te$t of freezing and thawing settlc ment under load.INTRODUCTIONAccording to the similarity analysis of modeling test offrozen soil without load(Zhu Linnan etc. 1993) ,we canwrite the followifig similar ctiteria of thawing and freezingmodeling test without load :si2Dotand -Adwhere ( q = Lpw(B, - 0. + A0 )), in whichBU,AQ, 0,respcctivcly are the unfrozen water c<strong>on</strong>tent , water c<strong>on</strong>tentof migrati<strong>on</strong> , and initial water c<strong>on</strong>tent . L is the potentialbeat of phase change . p, is the density of water, 1 is thethermol c<strong>on</strong>ductivitj of soil , D is the diffusive coefficient, t is time , I is the geometric length . In order to study, the interacti<strong>on</strong> between engineeting building and basementsoil, and the engineering stability . the article , <strong>on</strong> the basisof c<strong>on</strong>clusi<strong>on</strong>s above , applied the similarity theory to drawthe similar c<strong>on</strong>diti<strong>on</strong>s of mechanics of modeling test offrozen soil under load , at two angles of dimensi<strong>on</strong>al and' equati<strong>on</strong>al analyses , and we proposed a c<strong>on</strong>crete appliedmethod of modeling test of freezing-thawing settlement .SIMILARITY ANALYSISThis paragraph applied the exp<strong>on</strong>cntal method of thedimensi<strong>on</strong>al analysis (Xu Ting 1982) to derive the staticsimilarity criteria of the questi<strong>on</strong> of unfrozen and frozensoil and c<strong>on</strong>strvct the similar relati<strong>on</strong>s . Although the stressand displacement in thawing-freezing soil. are not linearlyproporti<strong>on</strong>al to the external load , In this case , the stress uhas a relati<strong>on</strong> to the load P (supposed, here <strong>on</strong>ly is ac<strong>on</strong>centrating force P) , the basement dimensi<strong>on</strong>s andthickness I of soil layer, elastic coefiicients E and p ,and volume weight y . therefor , the stress in the soil can bewritten as :o=f (P, 1, E, N, 1 (11According to the theory of dimensi<strong>on</strong>, when thephysical quantity y is a functi<strong>on</strong> of physical quantities x,,xt, x,, ,.., x, , the dimensi<strong>on</strong> Cy3 ofy isequal to themultiplicati<strong>on</strong> of dimensi<strong>on</strong>s CxJ of x,, x2,. x,, ..., X,.thus, ifand theny= f(xI,xz,xq...,xJtherefor, the dimensi<strong>on</strong> of the stress u can be written as[m] = Cp]' 9 [IIb [E]" bId [yl0 (2)where , a ,b ,c ,d ,e are unknown exp<strong>on</strong>ental c<strong>on</strong>stants .from the dimensi<strong>on</strong>al tdble (MLT) (Xu Ting 1982) ofquality, length , and time, we find all the dimensi<strong>on</strong>s ofphysical quantities above and put them into the formula (2),we can obtain[IilL",T-2] = [MLT-'Ja 9 [Lib ~L"T-']'O O O d[M L T ] [ML-*T-']'Making a comparisi<strong>on</strong> between same dimensi<strong>on</strong>s oftwo sides of the above formula, we can obtaina = l-c-e,b = 2&3e-21164
we introduce them into (2) and rewrite it as2[$I =[$IC. [$I 3 0a12We respectively regard - ,- El2,El2(from-P P Pandvi3 - ) ,p as a quantity, according to equati<strong>on</strong>(3)Pand taking c = e = d - 1 , we can write their functi<strong>on</strong>alrelati<strong>on</strong>ship (4) , and then (4) is a dimensi<strong>on</strong>lessexpressi<strong>on</strong> of the formula (1).c,= 19.1, in order to satisfy x;=lr, . in terms of thereferences(An Weid<strong>on</strong>g 1990; Zhu Yuanlin and Carbee1984): tests results between the relati<strong>on</strong>s of the stress-stmincurve and initial elastic module E of frozen soil andtemperature T , we choose the case in which the soil ofmodel and prototype have the same c<strong>on</strong>diti<strong>on</strong>s of waterc<strong>on</strong>tent and temperature change, thus, the initial andc<strong>on</strong>diti<strong>on</strong>s of modeling test without external load(Zbu Linyan etc. 1993) ?re satisfied, in this case, we regardE'== E, p - p, then x4- x4 is also satisfied.From n2 = x,, we arrive at c, =.,cy = 19.1', thus,the c<strong>on</strong>centrating form (to pile basement) <strong>on</strong> model,' P p =-- =- P ; 'and according to (4) , we arrive atc: 19.1the areal load(to buildings) p = p , the line load(to l<strong>on</strong>g basement) q' = 4 = -'q.CI lY.lc, 1thus (4) is rewritten as From n, = x , , wc arrive at cy = - = - , thus,c, 19.1This is the equati<strong>on</strong> of similar criteria of the n<strong>on</strong>linearthawing-freezing soil , where xz, z,, n4 aredeterminati<strong>on</strong>al criteria .We supposed above, there is <strong>on</strong>ly a c<strong>on</strong>centrating force. if there are a linear load q , a areal p and a moment m ,we also c<strong>on</strong>si&r them as factors influenced <strong>on</strong> the stress ,and introduce them into (1) . thus , we can arrive at similarcriteria comprised of them , which is to say , the criteri<strong>on</strong>Elx1 = - is respectively inverted into :PMODEL DESIGNthe volume weight <strong>on</strong> the model y =c,y = 19.1~.According to the,equati<strong>on</strong> (5) of similar criteria, it isimpossible to satisfy n3 = n3, because we can't find thematerial, the volume weight of which is 19.1 times as weightas that of natural soil, but other characters (for example E,I(, etc.,) are unchanged. we known, in the procedure ofthawing-freezing and heaving of soil, the weight can't beomitted ,which is regarded as the key c<strong>on</strong>trol factor causedthe settlement of thawing. in order to satisfy the similarrelati<strong>on</strong>s between the gravitati<strong>on</strong>al stresses of the model andprototype, we can approximately regard-the partial gravityof the nfodel diminished when the length scale of the modelis diminishing as a additi<strong>on</strong>al stress of a external load. atthe same time; according to the result of similarity analysisof thawing-freezing heat and mass migrati<strong>on</strong>, we write thesimilar ratioes of temperature , moisture, geometry andtime:According to the paragraphaiteria are:x,=-,zz-p,z3=-,)x4=pa12 ElZYlPEWhen designing model, the model mustwith similar criteria of determinati<strong>on</strong>:two, mechanic similarin other words, the following criteria are equal to 12be satisfiedAccording to the factors of thc c<strong>on</strong>diti<strong>on</strong>s of addingload, test field, workmanship of making model, etc., we takeTHAWING-FREEZING MODELING TESTOF SETTLEMENT UNDER LOADTo state the applicati<strong>on</strong> of similarity theory andmodeling test in the frozen soil, at first we use thecalculati<strong>on</strong> of thawing settlement to state the principle ofabove those paragraphs. as far as the soil of basement,whether it is thawing settlcment of frozen soil or settlementof unfrozen soil, the soil body gives birth to two kinds ofstresses: <strong>on</strong>e is the gravitati<strong>on</strong>al stress; the sec<strong>on</strong>d is theadditi<strong>on</strong>al stress within basement, resulted from theexternal load. so far as undisturbanced or unfrozen naturalsoil, it have experienced prol<strong>on</strong>ged geologic eras, and havefully c<strong>on</strong>solidated under thc gravity, in this case, <strong>on</strong>ly theadditi<strong>on</strong>al stress under the external load gives birth to tbecompressi<strong>on</strong> and c<strong>on</strong>solidati<strong>on</strong> of soil body; and in thefrozen soil, since there is ice, its characters ofphysics,mechanics and thennology arc obviously not the same these1165
I -of unfrozen soil, with the result that although there is notany external load <strong>on</strong> the frozen soil(exactly speaking,under a finny load), the thawing soil body also yields ac<strong>on</strong>solidati<strong>on</strong> and settlement. thus, when solving thethawing settlement of frozen soil, at first we shouldcalculate the additi<strong>on</strong>al stress of basement soil underthe external load,According to the theory of elastic mechanics(Xu Zhilun 1978) and geotcdhnics (Qian Jiahuan 1988),under a uniform load, as far as a rectangular and circle Ibasemcnt, below the central point, the additi<strong>on</strong>al stress ofarbitrary point can be written as the formula= K.P (7)where p is the uniform areal load of the bottom ofbasemcnt, K, is the tidditi<strong>on</strong>al stress' coefficient relativeto the dimensi<strong>on</strong>s of basement, depth@) and theirproporti<strong>on</strong>al dimensi<strong>on</strong>s, undcr the c<strong>on</strong>diti<strong>on</strong>s whitch thedimensi<strong>on</strong>s of basement and the thickness of soil layer aresatisfied with the similar proporti<strong>on</strong> of geometry, theadditi<strong>on</strong>al stress cocfficient o$ the basement of model andprototype are cqual, Kf=.K, . in this case, according tothe c<strong>on</strong>diti<strong>on</strong>s of mechamc similarity c,,- cg= 1, then,c - 1 . that is to say, to the satisfacti<strong>on</strong> of the c<strong>on</strong>diti<strong>on</strong>su*of mechanic similarity, the additi<strong>on</strong>al stress in the modeland prototype soil are both equal.We have known the additi<strong>on</strong>al stress nz thenaccording to references and documents(An Weid<strong>on</strong>gctc. 1990 and Tsytovich, N.A. 1973) , under uniform load,the'thawing-settlement of frorxn soil can be expressed asS=AoH+autH (8)Here & is the thawing settlement coefficient; u, is theaverage additi<strong>on</strong>al stress of thawing compressi<strong>on</strong> layer;-a is the thawing compressi<strong>on</strong> coefficient; W is thethickness of thawing compressi<strong>on</strong> layer.Obviously, if the, model has the same initial c<strong>on</strong>diti<strong>on</strong>sof soil moisture and tempcrature change as the prototype,then A, and a are unchanged, at the same time, thec<strong>on</strong>diti<strong>on</strong> of mechanic similarity is satisfied, that is to say,C - 1 , ck =c,, thusc, =c,.urnTherefor, when thc external load is satisfied with thesimilar c<strong>on</strong>diti<strong>on</strong> of mechanics, the ratio of the main settle-.ment values of model soil and prototype soil is equal to thegeomctric proporti<strong>on</strong>.As far as the settlement value of the n<strong>on</strong>uniform frozensoil under load, we can use tho method of geotechnics(QianJiahuan 1988) to write:- -S= ZS, - zA,Hi f ~ a,p,Hi (9)1-1 1-1 1-1Since the procedure of analog simulati<strong>on</strong> is the same asthe uniform soil, herc we do not state it detail.. inCONCLUSIONSUnder the c<strong>on</strong>diti<strong>on</strong>s c<strong>on</strong>tent with similarities of heatand mass migrati<strong>on</strong> , we added the following similarc<strong>on</strong>diti<strong>on</strong>s of mechanics , that is :are three similar unchanged quantities(1)The linear load(q) ,the moment (m) ,and the arealload (p) of the prototype and the model should be satisfiedwith :(2)The stresses and the displacements of the prototypeand the model have the following relati<strong>on</strong>s:is,- U=c,sIn which ,c, is the geometric !tale between theprototype and the model , u and S are the stress and thedisplacement of the model , u and S are the 5hSs and thedisplacement of the prototype .These c<strong>on</strong>diti<strong>on</strong>s above, gave the practicabletheoretical proofs of experiments in order better to studythe interacti<strong>on</strong> between engineering buildings and basementsoil, and the engineering stability, at same time, accordingto these similar c<strong>on</strong>diti<strong>on</strong>s , we proposed a c<strong>on</strong>crete appliedmethod of modeling test of freezinp-thawing .REFERENCESZhu Linnan and Li D<strong>on</strong>gqing(l993), Similarity analysisofmodeling test without load, Journal of .Glaciology and Geocryology 15(1) ,189-192.Xu Ting(1982) , Similarity Theory and Modeling Tat,Agromachinery Press of China, 34-62, Pecking.An Weid<strong>on</strong>g etc.(1990), Interacti<strong>on</strong> Am<strong>on</strong>g Temperature,Moisture and Stress Fields in Frozen Soil,Lan Zbou University Press, 244-246, Lan Zhou.Xu Zhifun (1978), Mechanics of Elasticity,Higher Educati<strong>on</strong> Press, 105-108 , Pecking.Qian Jiahuan (1988), Mechanica of Soil,He Wai University Press, 53-69, Pecking.Zhu YuanLin and Carbee ,D.L.(1984), Wuiaxialcompressive strength of frozen silt under c<strong>on</strong>stantdeformati<strong>on</strong> ,Cold Regi<strong>on</strong> Science TechnologyVoh, No.1 , pp.3-15.Tsytovich , N.A.(1973) Mechanics of Frozen Soils.High Educati<strong>on</strong> Press, Moscow, 250-276.1166 *'
A COMPOSITE MODEL OF MULTIPLE ACTIONS FORFORMING.PATTR9NED GROUNDLi Guangpan and Gao MinLanzhou Institute of Gla'ciology and Geocryology,Chinese Academy of Science, Lanzhou 730000,ChinaThis paper paints out that the patterned ground is a spatial ordered structure 'which naturally exists and is called a "dissipative structure" in the branch ofn<strong>on</strong>equilibrium thermodynamics, During freezing and thawing, the soil-watersystem is in a state far from equilibrium and the ordered c<strong>on</strong>vecti<strong>on</strong> in n<strong>on</strong>equilibriumis formed at critical c<strong>on</strong>diti<strong>on</strong>s because of the various acti<strong>on</strong>s indynamics such as the buoyancy, the gravity, the force of migratory water causedby frozen field, the diffusi<strong>on</strong>, and the surface tensi<strong>on</strong>, etc. The c<strong>on</strong>tinuousacti<strong>on</strong>s of c<strong>on</strong>vecti<strong>on</strong> change the combinati<strong>on</strong> between soil particles and slightlydepict spatially structural patterns of c<strong>on</strong>vecti<strong>on</strong> in ground. Each c<strong>on</strong>vectiveacti<strong>on</strong> al<strong>on</strong>e is very weak. However their effect.^ are enhanced when frost heaveand desiccative shrink are superimposed <strong>on</strong> the processes of ordered c<strong>on</strong>vecti<strong>on</strong>.And these processes repeat again and again, finally resulting in the formati<strong>on</strong>of macroscopic visible patterned groundINTRODUCTIONThe regular polyg<strong>on</strong>s in permafrost ground andin periglacial envir<strong>on</strong>ments or near water bodiesin cold regi<strong>on</strong>s has attracted geoscientists fora century, Recently, mathematicians andphysicists have also undertaken this study andhave made the research range be expanded andshe research c<strong>on</strong>tent be d.eepened. The researchincludes (1) the existence of polyg<strong>on</strong>al net andits characteristics (Guo D<strong>on</strong>gxin, 1990, Li Shude,1990); (2) the envirunmental c<strong>on</strong>diti<strong>on</strong>s for .theformati<strong>on</strong> of patterned ground, the property ofpolyg<strong>on</strong>s and its regularity (Troy I,. PPwP, 1969);(3) the frozen polys<strong>on</strong>s.appeared $gain inlaboratory (Edwin J. Chamberlain et al., 1979);' (4) the origin and the formati<strong>on</strong> mechanism ofpolyg<strong>on</strong>s (R.Y. Ray, 1983); (5) Climate andenvir<strong>on</strong>mental change informati<strong>on</strong> recorded bypolyg<strong>on</strong>s (Wang Baolal , 1991),R.Y. Ray and W.B. Krantz reviewed the historyof formative mechanism research <strong>on</strong> patternedground and evaluated the .thesessuch as the frostcracking, the desiccative and shrinking crackingand the Rayleigh c<strong>on</strong>vecti<strong>on</strong>. The crack theseshave not gripped the basic problem--wheie theregularity originates from? R.J. Ray and othersproposed their Rayleigh c<strong>on</strong>vecti<strong>on</strong> model andpointed out that Rayleigh c<strong>on</strong>vecti<strong>on</strong> is thecause for the formati<strong>on</strong> of patterned ground.Through Linear stability analysis they obtainedthe critical Rayleigh number and the ratios ofthe width of polyg<strong>on</strong> to the depth of seas<strong>on</strong>alfrozen layer (W/L), which is 3.18 for polyg<strong>on</strong>and 2.7 for parallel stripes. Sut they did notclearly show the process from c<strong>on</strong>vecti<strong>on</strong> cellsto patterned ground and <strong>on</strong>ly emphasized theundulatory pattern forming by c<strong>on</strong>vective acti<strong>on</strong>at the interface between the seas<strong>on</strong>al thawedlayer and permafrost. Though Lhe physicalprocess bf this model is very simple, it isstill of significant meaning.In this,paper, the stresses are payed to theformative mechanism of patterned ground usin,gmodern physics theories and a composite model ofmultiple acti<strong>on</strong>s is put foruard.THE THEORETICAL BASIS OF THE COMPOSITE MODELFOR MULTIPLE ACTIONSThe main thermodynamic processes in groundare the heat transfer, the migrati<strong>on</strong> of particlesand water and the c<strong>on</strong>vecti<strong>on</strong> of water.Although these processes bel<strong>on</strong>g to the categoryof n<strong>on</strong>equilibriun, but it can be determin.ed withquasi-equilibrium when the temperature gradient(s-) or the c<strong>on</strong>centrati<strong>on</strong> gradient of particles(+) is not large. By adopting the principleofsuccessive stable state and the Stephen boundaryc<strong>on</strong>diti<strong>on</strong>, we can solve equati<strong>on</strong>s of thermalc<strong>on</strong>ducti<strong>on</strong> and calculate the depth of permafrost,the temperature field of the active layer (G.M.Feldman, 1973) and the temperature field of nanmadefreezing walls (Gao Min,'1989). But theequilibrium theory of thermodynamics is incapableof solving p.roblems of the patterned groundand st.r<strong>on</strong>g moisture migrati<strong>on</strong>. While the n<strong>on</strong>equilibriumtheory devdoped recently can playan Y.mportant role.The n<strong>on</strong>equilibrium theory in thermodynamicsaffirms that there is a kind of macroscopicspacial and temporal ordered structure existingwidely in nature, Prigogine called I.t "dinsipativestructure". Tt is different from orderedcrystals at a molecular level. Under the c<strong>on</strong>diti<strong>on</strong>swhen open gystem is.far from equilibrhmthis ordered c<strong>on</strong>figurati<strong>on</strong> of n<strong>on</strong>equilibriumwill appear (for example, i € the temperaturegradient is large enough). The system exchangesmass and energy with the outside envir<strong>on</strong>ment,and it can form and keep B certain macroscopicorder through the mechanism of n<strong>on</strong>lineardynamics and the dissipative process of energyin the system itself. For example, the Benard'spattern (Fig.1) the circle in granite (Fig.2)and the order of Rio:organizati<strong>on</strong>. In quantita-
the reeedrch the n<strong>on</strong>equilibrium theory is based<strong>on</strong> the mas~-balance equati<strong>on</strong>s, the equati<strong>on</strong> ofmomentum c<strong>on</strong>servati<strong>on</strong>, the equati<strong>on</strong> of energyc<strong>on</strong>servati<strong>on</strong> and entropy-balance equati<strong>on</strong>. Therelati<strong>on</strong>ship bf force X and fluxes J in thermodynamicsis deduced from these equati<strong>on</strong>s:J = LXa2Jt +( 7 ) o X'+ ......axaJwhere I. = ( E )oWhen the system is far from thermodynamicequilibrium i.e. the force of thermodynamics isnot weak, the high power of X can not beneglected and the equati<strong>on</strong> is a n<strong>on</strong>linearpartial differential equati<strong>on</strong>. The main workof this theory is to analyse its stability. Forexample, Benard's pattern, starting from massbalanceequati<strong>on</strong>, momentum c<strong>on</strong>servati<strong>on</strong> andenergy c<strong>on</strong>servati<strong>on</strong> and adopting the method oflinear stable analyses, the Rayleigh number isderived:R, = na = 657.51g,(To-Td)d'R =YkWhen R>Rc, the Benard's pattern can be produced.Another school of thought of n<strong>on</strong>equilibriumIn thermodynamics is syneryetics founded byH. Haken (H. Haken, 1982; Jin Baishun, 1982),It studies the system which is c<strong>on</strong>stituted by ELlot of subsystems. Under certain c<strong>on</strong>diti<strong>on</strong>sthe macroscopic ordered state will be formedcoordinately by the interacti<strong>on</strong> and cooperati<strong>on</strong>of thk subsystem. The parameters desc'ribing themacroscopic order degree of the systea arecalled order parameters. Through analyzing thestability of equati<strong>on</strong>s of order parameters forvarious processes, the results and evoluti<strong>on</strong>aryprocesses at the critical state can be obtained.ACTUAL EV~DENCES AND THEIR CHARACTERSThere were ma'ny data of patterned ground inthe literature about permafrost and periglacialenvir<strong>on</strong>ments. We selected some photm as areexample, the polyg<strong>on</strong>s in natural envir<strong>on</strong>mentsare shown.in Fig.3, 4 and 5, the frozen polyg<strong>on</strong>sof simulating tests in laboratory are shown inFig.6. Though',there are a few photos, they areenough to identify the existence of the patternedground.The photos obviously show that the patternsare very -regular. The patterns are generallyhexag<strong>on</strong>s or other polyg<strong>on</strong>s or parallcd stripes,the shape mainly depends <strong>on</strong> envir<strong>on</strong>mental c<strong>on</strong>diti<strong>on</strong>s,According to literature, these patternsare formed <strong>on</strong> seashores and lakesides or at thedrying lake bottoms or in, regi<strong>on</strong>s which have hadrich water historically. These areas not <strong>on</strong>lyare severely cold but also have warm seas<strong>on</strong>s.It is a miracle for the desert field to havesuch regular patterns. It is obvious that thesepatterns arc not man-made, so they are calledself-organizati<strong>on</strong> patterns. It Is undouhtfulthat the reas<strong>on</strong>s for their formati<strong>on</strong> are theopening of the system or the unbalanced tomperatureand water c<strong>on</strong>tent. This coincides with theformati<strong>on</strong> c<strong>on</strong>diti<strong>on</strong>s of the macroscopic orderedc<strong>on</strong>figurati<strong>on</strong> in n<strong>on</strong>equilibrium and n<strong>on</strong>linearthermodynamics. Therefore, we need not feelpuzzled by this phenomen<strong>on</strong>, it is just Bdissipative structure existing in nature,.SOME MAIN TYPES OF ORDERED CONVECTIONS 'Soil is a cdnplex mixture mainly made ofparticles of silicate minerals, water and void.There are many physical and chemical acti<strong>on</strong>sbetween soil and water. Soil influences thefrozen threshold and c<strong>on</strong>ductibility of water, ,and the surface soil particles can absorb water.The freezing and thawing of water can compressor loosen the soil-.body. Compared with soil,water is a very active fac,tor. Because thebulk of water can move (cpnvecti<strong>on</strong>), the watermolecule can diffuse and water phase change can.occur. Thus various phenomen<strong>on</strong>s of the watersoilsystem have str<strong>on</strong>g relati<strong>on</strong> to the wateracti<strong>on</strong>s.The types of water c<strong>on</strong>vecti<strong>on</strong>s in the soilwatersystem are different in dynamics becauseit is caused by different acting forces underdifferent c<strong>on</strong>diti<strong>on</strong>e. But ordered ca'nvecti<strong>on</strong>s.in physics have a comm<strong>on</strong> point which is thea<strong>on</strong>equilibrium phase change (sec<strong>on</strong>d phase change)and the mathematical models are similar. Whenthe temperature gradient is larger and thesystem exceeds the critical state, the.regularstructure of c<strong>on</strong>vecti<strong>on</strong> would occur mainly bythe acti<strong>on</strong> of buoyancy-gravity. That is <strong>on</strong>ly<strong>on</strong>e kind of the ordered c<strong>on</strong>vecti<strong>on</strong>s. Similarto that in R.J. Ray's literature, when thefrozen ground is thawing, it is assumed thatthe ground surface is at or qear 277°K and theinterface between frozen and thawing ground isat 273°K. According to the character of water,the density of upper water is large and thegravity is larger than buoyancy, the upper waterwill tend to sink, The density of lower wateris small and tends to rise. But it cannot movein both opposite directi<strong>on</strong>s at the same placeand time. Uniier the influence of other factors(such as permeability) the water movement wouldappear in a regular distributi<strong>on</strong> (Rayleighc<strong>on</strong>vecti<strong>on</strong>). As shown in Fig.7(a), the neighboringwater flows of the c<strong>on</strong>vecti<strong>on</strong> circlehave an opposite directi<strong>on</strong>. According toanalysis of Bernard's pattern, hexag<strong>on</strong>al c<strong>on</strong>vec-,ti<strong>on</strong>s should be in the form shown in Fgg.Y(b).The striped pattern of c<strong>on</strong>vecti<strong>on</strong> is shown isFig.7(c).The c<strong>on</strong>vecti<strong>on</strong> patterns can also appear infreezing process. The frozen polyg<strong>on</strong> shown inFlg.6 was formed in a horiz<strong>on</strong>tal directi<strong>on</strong> inlaboratory, this study showed ,increased permabilityin a vertical directi<strong>on</strong> during freezingand thawing (Edwin J. et al., 1979). Theseresults make known the exi,stence of orderedc<strong>on</strong>vecti<strong>on</strong>. It isn't doubted that during thefreezing period, the soil-water system is in an<strong>on</strong>equili.brium state and may be in a state ofstr<strong>on</strong>g n<strong>on</strong>equilibrium. It had been known for al<strong>on</strong>g time that water migrates to the freezingfr<strong>on</strong>t (Kinosita seiiti, 1985; N.A. Cytovich,1973), No matter what the mechanism of migrati<strong>on</strong>is, we can think that a kind of forcesacts <strong>on</strong> the water in the thawing regi<strong>on</strong> withdirecti<strong>on</strong> to the freezing fr<strong>on</strong>t. In literature(Li Guangpan, 1982) it is calculated that thevalue of binding energy of ice is larger thanthat of water, Binding energy takes a negativesign, so the potential energy of water is higherthan that of ice. From the water of hightemperature to the water near the freezing pointand then to the ice, the potential energy formsa varying potential field. .According to therelati<strong>on</strong>ship of potential Q and force F,
IF"K , the force should point to the icesurface. Under the acti<strong>on</strong> of this force, thewater. migrates to the freezing fr<strong>on</strong>t and accumulatesthere and as a result the water increasesthere. Taking the downward freezing from theground surface to underground in winter as aexample, Eirst, the water migrates to the freezingfr<strong>on</strong>t, and after water far from the freezingfr<strong>on</strong>t had migrated, the water migrati<strong>on</strong> becomesdifficult. The water c<strong>on</strong>tent of the freezingfr<strong>on</strong>t may be larger than that at the bottom, thediffusi<strong>on</strong> from top to bottom will appear. A tthe same time the gravity is a downward force,therefore the feedback system of dynamics willbe formed. These factors as a whole c<strong>on</strong>stitutethe basic c<strong>on</strong>diti<strong>on</strong>s for the forming of amacroscopic ordered structure and the hasicc<strong>on</strong>diti<strong>on</strong>s are proved by the theory of n<strong>on</strong>equilibriumthermodynamics. IJnder the nfluences ofother factors, ordered c<strong>on</strong>vecti<strong>on</strong> 4 will be formed.The third kind of ordered c<strong>on</strong>vecdi<strong>on</strong>s in soilis caused by surface tensi<strong>on</strong>. In lahoratory 'test were c<strong>on</strong>ducted by heating the thin liquidlayer with a thickness of 50 micr<strong>on</strong> and ahexagnol pattern was also observed. The orderedand dried cracking polyg<strong>on</strong> at the bottom ofpools could appear in the field after the poolsdried up in summer. In the evaporating processof the soil-water system, the water rises al<strong>on</strong>gthe ca'pillary because, of the acti<strong>on</strong> of surfacetensi<strong>on</strong>. This leads to a change of.waterc<strong>on</strong>tent at various soil layers. Accompanied bythe downward gravity acti<strong>on</strong>, it c<strong>on</strong>stitutes afeedback system of d:ynamics in n<strong>on</strong>linear andn<strong>on</strong>equilibrium stares and the ordered c<strong>on</strong>vecbi<strong>on</strong>therefore appears. The actual cases could bevery complex, Such as the decreasing of surfacetemperature during the 'night, the buoyancy ofwater is smaller than gravtty which may lead toan increasing downward force.At present the theoretical analyses are toassess critical c<strong>on</strong>diti<strong>on</strong>s for the formati<strong>on</strong> ofordered patterns, that is to analyse the stabilityof stab1.e state soluti<strong>on</strong> for the differential.equati<strong>on</strong>sand to find the critical c<strong>on</strong>diti<strong>on</strong>sof losing stability. What kind of realisticmacroscopic scructure will appear is relativeto the boundary c<strong>on</strong>diti<strong>on</strong>s and the realisticdynamic processes, and it is very difficultto calculate. Tf the principle of synergeticsis utilized and the c<strong>on</strong>sider that we.. patternsin the n<strong>on</strong>equilibrium system are relative tosynergic c<strong>on</strong>sistency of the subsystems, then itis easy to explain the reas<strong>on</strong> to the formati<strong>on</strong>of hexag<strong>on</strong>al nets of the water c<strong>on</strong>vecti<strong>on</strong>. Thewater molecules link in the tetrahedral strutturethat bel<strong>on</strong>gs to the hexag<strong>on</strong>al system (Pig.8). The molecules of laminary silicate are alsojoined by hexag<strong>on</strong>al nets (Fig.9). These hexag<strong>on</strong>sin the subsystem may be relative to the hexag<strong>on</strong>allin the soil-water system in a certain way, justas the snow-flake is always hexag<strong>on</strong>al.ACOMPOSITE MODEL OF MULTIPLE ACTIONSFirst, the multiple and composite acti<strong>on</strong>smean that the acti<strong>on</strong> of formed patterned groundnot <strong>on</strong>ly is the ordered c<strong>on</strong>vecti<strong>on</strong> hut also mustbe accompanied by other processes of physicalacti<strong>on</strong>s. Sec<strong>on</strong>d, the ordered c<strong>on</strong>vecti<strong>on</strong>s ofwater are caused by buoyancy or by the.acti<strong>on</strong>a1force of freezing field or the surface tensi<strong>on</strong>as menti<strong>on</strong>ed-above, When the soil-water systemis far from equilibrium, the ordered c<strong>on</strong>vecti<strong>on</strong>of water is the origin of the formati<strong>on</strong> ofpatterned ground, but its .not the sole reas<strong>on</strong>.Before the ordered c<strong>on</strong>vecti<strong>on</strong> appeared, the waterdistributi<strong>on</strong> can be regarded as nearly homogeneous(at least it is true at the Bame la-yer). thewater distributi.<strong>on</strong> becomes panuniform- after thec<strong>on</strong>vecti<strong>on</strong> started. In Flg.Tl(b), the water flowin the boundary of the hexag<strong>on</strong> centralized moreand joined the strips. Though the water flowin the centre of the hexag<strong>on</strong> is also centralised;it is <strong>on</strong>ly an isolated regi<strong>on</strong> and the acti<strong>on</strong> ofwater flow is not.str<strong>on</strong>ger than that at theboundary. The water flow slightly scours Outthe soil. In general, the c<strong>on</strong>vecti<strong>on</strong> not <strong>on</strong>lyexists' in transient, but c<strong>on</strong>tinues for a timeand is repeated mqny times. The results ofprol<strong>on</strong>ged acti<strong>on</strong> make the combinati<strong>on</strong>s betweenparticles in soil became relaxed and the structuralpatterns of n<strong>on</strong>uniform distributi<strong>on</strong> ofwater are slightly carved in the soil body. Butthis acti<strong>on</strong> is very weak, the obvious andmacroscopic patterns can not appear. When other,acti<strong>on</strong>s or processes superimpose <strong>on</strong> the aboveacti<strong>on</strong> in the soil-water system, the originaland cutting traits can be enhanced. The superimposingacti<strong>on</strong> may be the freezing or the dryshrinkage. During the freezing period theordered c<strong>on</strong>vecti<strong>on</strong> and phase change in the equilibrium(ice up) are simultaneously. In placeswhere the water flow is centralized there i s alot of ice. The volume of ice expanded thedistance betweet1,particles of soil there. Thelarge voids can c<strong>on</strong>tain a lot of water. Whenenvir<strong>on</strong>mental c<strong>on</strong>diti<strong>on</strong>s do not change basically,,the c<strong>on</strong>vecti<strong>on</strong> of water will appear at the sameplace the next year (next freezing period). The Imore the n<strong>on</strong>-uniformity of water, the more waterin the boundary. Year after year, this processcycles several times to form more large cracks.the macroscopic ordered pattern then appears.The freezing'force may be large and then .soilbody can be sunk in thawing. Through severalcyclical processes of freezing and thawing therock underground can be moved to the groundsurface. In the drying processes, the soil. bodygradually loses water c<strong>on</strong>tent and will shrink.The shrinking and the ordered c<strong>on</strong>vecti<strong>on</strong> arealso in progress simultaneously. The watergreatly influences the soil body in the boundaryof the c<strong>on</strong>vecti<strong>on</strong> pattern, therefore the combinativeforce between particles of soil isrelatively weak. So in shrinking processecl itis easy to form the tiny cracks in phe boundary.According to the principle of fracture mechanics,<strong>on</strong>ce the cracks appeared, it can be developedquickly. The cracks developed al<strong>on</strong>g the boundaryof c<strong>on</strong>vective patterns can form the o'rderedpatterns i'n the macrocosm. The above-menti<strong>on</strong>ed,the buoyancy-gravity, the acting force,offreezing-difftisi<strong>on</strong> and grqvity or the surfacetensi<strong>on</strong>-gravity etc. caused various types ofordered c<strong>on</strong>vecti<strong>on</strong>s, these c<strong>on</strong>vecti<strong>on</strong>s and frostheave or the dried shrinking superimpose <strong>on</strong> eachother and repeat their acti<strong>on</strong> <strong>on</strong> the soil eyertern,these acti<strong>on</strong>s repeat again and again and finallythe ordered ground patterns in the macrocosm are formed.That is the composice model of multiple acti<strong>on</strong>s.ACKNOWLEDGEMENTSThe works of Prof. Cheng Guod<strong>on</strong>g, AssociateProf. Guo D<strong>on</strong>gxin and Mr, Li Shvde helped .ua toput forward this model. Mr. GUQ D<strong>on</strong>gxin andMr. Li Shude and Ph. n. Zhao Xiufeng providedphotos for this paper. The authors wish toacknowledge their support here.1169
REFERENCESEdwin J. Chamberlain and Anth<strong>on</strong>y J. Gow (1979)Effect of Freezing and Thawing <strong>on</strong> the Permcabilityand Structure of Soils; EngineeringGeology V01.13, 73-92.G.M. Feldman'(1973) The Calculati<strong>on</strong> Method ofTemperature Field <strong>on</strong> Frozen Ground (inRussian)(>uo D<strong>on</strong>gxin, (1990) The <strong>Permafrost</strong> of China,Gansu Educati<strong>on</strong> Press.GRO Min, (1980) Mathematical Model of the Variatiunof Freezing Wall with Double Circle ofFreezing Pipes and its Numeral Calculati<strong>on</strong>;Proceedings of the Third Chinese c<strong>on</strong>ference<strong>on</strong> <strong>Permafrost</strong>, 395-399.H. Aaken, (1983) Synergetics and its RecentRealms of Applicati<strong>on</strong>; Nature Journal Vol.6,No,6, 1983, 403-410 (in Chinese)Jin Raishun, Zhang Jiyue and Guo Zbian, (1982)Synergetics-A New Subject; Nature Journalv01.5, No.3, 1982, 189-195.Kinosita Seiiti, (1985) The Physics of FrozenGround (in Japanese)Li Guanypen and Gacl Min, (1982) Study <strong>on</strong> theCalculating Method for Bound Water; SoilsV01.14, No.1, 20-24, ,Li Rusheng, (1986) N<strong>on</strong>-equilibrium Thermodynamicsand Dissipative Structure; Qinghua UniversityPress.Li Shude and He Yixian, (1990) Features of<strong>Permafrost</strong> in the west Kunlun Mountains;Proceedings of Fourth Nati<strong>on</strong>al <str<strong>on</strong>g>C<strong>on</strong>ference</str<strong>on</strong>g><strong>on</strong> Glaciology and Geocryology (selecti<strong>on</strong>),1-8.N.A. Cytorich (1973) The Mechanics of FrozenGround (in Russian).Ray R.J., W.R. Krantz et al., (1983) A Model forSorted Patterned Ground Regularity; Journalof'Glaciology, Vo1.29, No.102, 317-337.Ray R.J., W,B, Krantz et al., (1483) A MathematicalModel for Patterned Ground: SprtedPolyg<strong>on</strong>s and Stripes and Underwater Polyg<strong>on</strong>s.Troy L. PbwL (1969) The Periglacial Envir<strong>on</strong>ment,M<strong>on</strong>treal, McGill-Queen's University Press,Wang Raolai, (1991) Some Advances in PeriglacialEnvir<strong>on</strong>ment Studies: Journal of Glaciologyand Geocryology, Vo1.13, No.3, 273-28b.Fig.4 Patterned frozenground in the Aksaygin L(photo taken by Li Shude000IS)Fiy.5 Sorted frozenpolyg<strong>on</strong> in Qinghai-Xizang Plateau (phototaken by Zhao Xiufeng)Y.(photo selected fromLiteratdie of Edwin J.Chamberlain et al. 1979)Fig.7 Schematicdrawing of the circleof water c<strong>on</strong>vecti<strong>on</strong>in soilFig.1 Benard's patternFig.2 The circle ingraniteFig.8 Schematic drawing ofhexag<strong>on</strong>a cell (The corn- Fig.9 Schematicbinati<strong>on</strong> of water molecules drawing of microstruci-sa tetrahedral arrange- ture of laminaryment and bel<strong>on</strong>gs to a silicathexag<strong>on</strong>al system)1170
CONSOLIDATION OF DEEP LAYERFROZEN SOILS IN TRIAXIAL TESTSLi Kun Wang Changshmg Chcn XiangshengCentral Coal Mining <strong>Research</strong> Institute, China ,Before triaxial shear test. the results of the deep layer frozen mil tests arc greatly effected by the c<strong>on</strong>solidati<strong>on</strong>or n<strong>on</strong>-c<strong>on</strong>solidati<strong>on</strong> of the sample. The papcr qivtr the preliminary c<strong>on</strong>clusi<strong>on</strong>s of the c<strong>on</strong>solidatedand n<strong>on</strong>-c<strong>on</strong>solidatcd samples, and Comparis<strong>on</strong> bclwttn the c<strong>on</strong>solidated mmples &fore and afterfreezing. According to these rcsuots, the authors propose thet before the triaxial test the samplesshould be tcatcd with hydrostatic pressure c<strong>on</strong>solidati<strong>on</strong>. so that the earth pressure is molded as much aspossible after the sample reached the original density, sa thar the test results are more reliable. ClayeySoil samples should be c<strong>on</strong>solidated before freezing and samdy soil samples should be c<strong>on</strong>solidated afterfreezing.TNTRODWCTIONThe method of artificially fazing ground has been widelyused in sinking .shaft engineering in soft and friable soil layer regi<strong>on</strong>s. Under ground the frcczini wall is in a three dimensi<strong>on</strong>alstress state.In order to understand frozen soil characteristics in athm dimensi<strong>on</strong>al stress state it is necessary for frozen samples atdifferent depth to bc taken for mechanical test. As so<strong>on</strong> as thesamples arc taken out of the ground, the volume will expand as thethree dimensi<strong>on</strong>al pressure disappears, the unit weight will decreasewith the volume expansi<strong>on</strong>. Generally speaking, the fromu soiltriaxial shear strength increases with the unit weight increasing. If asample can not recover its original unit weight, the triaxial shearstrength will be lower than the "real" strength. This is more evidentwhen the original sample is replaced by a remolded sample. It isimprobable that remolded samples co;taining air can be avoided,the original structure of these samples has been disrupted. Due tothe air c<strong>on</strong>tent, the triaxial strength of the remolded samples is low- .cr, it can not reflect the teal strength.The deeper the soil layer is, the larger the geostatic pressureand unit weight are..If the samples are not c<strong>on</strong>solidated, the errorbetween the triaxial strength of the remolded sample and the "real"strength will increase. The above menti<strong>on</strong>ed tests arc different fromthose in the shallew layer.To reduce the error between ground samples a@ remoldedsamples, c<strong>on</strong>solidati<strong>on</strong> tests should be c<strong>on</strong>ducted, so that the originalpressure state can bc molded and the unit weight can be as closeas possible to the oiginal. Hydrostatic pressure (P) of c<strong>on</strong>solidati<strong>on</strong>tests is usually calculated with the heavy liquid theory, Le.:P = 0.13H (1)where, P - lateral earth pressure; MPaH -- depth 01 sample; mAnother method to attain the value of P is to measure the lalcralearth pressure with a prcssure transducer, the method is wore expensiveand takes more time. In these tests the anthors found thec<strong>on</strong>solidated hydrostatic valuc by calculatiog with Formula (1).PRELIMINARY RESULTS OF THE TEST AND COMPARI-SONSample size: diameter rp + 61.8mm. height h = 1 Sem, Naturalunit weight:r= 19.012KN/rn3 , Water c<strong>on</strong>tent:W=32.03%, Soiltype: day.The tests were c<strong>on</strong>ducted <strong>on</strong> the FS-I triaxial sheer (creep)machine, the machine was made in Bcijng <strong>Research</strong> Institute ofMine C<strong>on</strong>structi<strong>on</strong>. The samples were taken from Jining,Shand<strong>on</strong>g Provinm, The samples were fmm clay and the depth ofthe samples was 170 m. The tests were c<strong>on</strong>ducted under the followingthree c<strong>on</strong>diti<strong>on</strong>s:(1) Freczin~unc<strong>on</strong>solidatccJ (FUC) triaxial shear test;(2) Freezing bcfore c<strong>on</strong>soiiduti<strong>on</strong> (FC) with exhausted andundrained triaxial shear tesc(3) C<strong>on</strong>solidati<strong>on</strong> before freezing with exhausted andundrained (CF) triaxial shear test.Thetriaxial shear testswerc c<strong>on</strong>ducted rtspcctively for c<strong>on</strong>diti<strong>on</strong>s(1) FUC, the samples werc frozen at -30°C for 48 hours, thenwere stabilized at the appropriate test ternpcraturc -10°C for 48hours; (2) PC, the first two steps of sampla preparati<strong>on</strong> arc thesame as in (I), after this the samples were c<strong>on</strong>solidated under c<strong>on</strong>stantpressure; (3) CF, the samples werc c<strong>on</strong>solidated at room tempcrature.then were frozen at the test temperature under canstantpressure for 48 hours.The c<strong>on</strong>solidati<strong>on</strong> time depends <strong>on</strong> the arrival of the principalc<strong>on</strong>solidati<strong>on</strong> point, during tests the c<strong>on</strong>solidati<strong>on</strong> c<strong>on</strong>diti<strong>on</strong> of the1171
specimen was dem<strong>on</strong>strated by the liquid volume entering the prepsure cell under c<strong>on</strong>solidati<strong>on</strong> pressure, The relati<strong>on</strong>sthip betweenthe liquid volume (AL) entering the pressure cell adtime is shownin Figure 1. The principal c<strong>on</strong>solidati<strong>on</strong> point and principal c<strong>on</strong>solidati<strong>on</strong>time can be obtained from Figure 1.It can be seen from Figure 1 that the regularity of the two c<strong>on</strong>solidati<strong>on</strong>curves is almost the same or Similar Curves 1 and 2 indicatec<strong>on</strong>solidati<strong>on</strong>s under c<strong>on</strong>diti<strong>on</strong>s (I) and (2) respectively. Thevolume changes of the two curves are different. Curve 2 is belowcurve 1, thisshows that the volume compressi<strong>on</strong> of curve 2 is morethan that of curve 1, but the difference is very small, about 2-5 ml,the principal c<strong>on</strong>solidati<strong>on</strong> time is close as well. After the principal.I- CFFig.2 Triaxial shear yield line of frozen clayt (mi4Fig.1 Clay c<strong>on</strong>solidati<strong>on</strong> curve(1-c<strong>on</strong>solidati<strong>on</strong> after frozen)(2-frozen after c<strong>on</strong>solidati<strong>on</strong>)(start from A)CCF reaches a maximum value under three c<strong>on</strong>diti<strong>on</strong>s, <strong>on</strong>e ofthe main reas<strong>on</strong>s is the unit weight under-this c<strong>on</strong>diti<strong>on</strong>. From Figure1 it can be seen that the unit weight of sample FC is less thanthat of sample CF.In trfaxial shear tests the difference of the test c<strong>on</strong>diti<strong>on</strong>s affects<strong>on</strong>ly the cohesi<strong>on</strong> C. with the Drucker-Prager law it doesn'tarfect the value of 8, but affect the value of K, i.e.:c<strong>on</strong>solidati<strong>on</strong> point of the curve 2 appears for 1-2 hours, the samplewas frozen under c<strong>on</strong>stant pressure at the temperature of-1OOC. From A the curve starts to bend upwards, i\ shows that theliquid is squeered out from the pressure cell, and indicates that thesample was frozen and the volume also expanded. Curve 2 is belowcurve 1, the unit weight of sample CF is slightly larger than that ofsample FC. If we want to obtain the failure curve of frozen soil intriaxial shear tests, 2-3 Mohr's circles are usually needed. To attainthe goal there are several types of loading. In tests a group ofMohr's circles are obtained with changing c<strong>on</strong>fined pressure. Eachsample was tested under three different c<strong>on</strong>fined pressures, themiddle <strong>on</strong>e of the three c<strong>on</strong>fined pressurcs is the pressure born bythe sample under ground. Under c<strong>on</strong>diti<strong>on</strong>s FUC, FC and CF, thetriaxial shear test results are plotted in Figure 2.From Figure 2 it is clear that the difference of the test results isdue to different test c<strong>on</strong>diti<strong>on</strong>s. This difference is reflected mainlyin the cohesi<strong>on</strong> C of the frozen clay, the angle of internal fricti<strong>on</strong>hardly changes with the test c<strong>on</strong>diti<strong>on</strong>s. The cohesi<strong>on</strong> C is of thefolliwing rule: C, > C, > Cwc In the artificial freezing sinkingengineering, the earth is frozen under earth pressure, howeverthe c<strong>on</strong>diti<strong>on</strong> CF is similar, so that triaxial test result is clise to thereal value under this c<strong>on</strong>diti<strong>on</strong>. The c<strong>on</strong>diti<strong>on</strong> PC and FUC d<strong>on</strong>'tc<strong>on</strong>form with the c<strong>on</strong>diti<strong>on</strong> of the artificial freezing earth layers,there is a significant difference between the test result and the realvalue.Drucker--Prager law iswhere I, is the first invariant of the stress, I, is the sec<strong>on</strong>dinvariant of the stress, fi is a parameter, K, is a yield value.From Equati<strong>on</strong> 4 it cag be seen that the difference of the testc<strong>on</strong>diti<strong>on</strong>s affect directly the yield value.Recently, triaxial shear tcsts were c<strong>on</strong>ducted in frozen clayfrom (No.305) Chen Si Lou Mine, the clay lay at a depth of 305 m,through the test comparis<strong>on</strong>s the tendency was found to be thesame as those menti<strong>on</strong>ed above.In additi<strong>on</strong>, the difference of the test c<strong>on</strong>diti<strong>on</strong>s affects therelati<strong>on</strong>shipof stress-strain as well, however an essential changedoesn't occur, <strong>on</strong>ly the c<strong>on</strong>stants differ.SUGGESTIONSFrom above it is known that the yield values of the triaxialshear strcngth change with the test c<strong>on</strong>diti<strong>on</strong>s, When the frozen soilwas measured in the laboratory, the testing c<strong>on</strong>diti<strong>on</strong>s (includingstress state, freezing pattern, water c<strong>on</strong>tent, etc.) in situ should besimulated as much as possible, so that more reliable data inaccordance with the in situ testing are obtained, which can bemore1172 *
dependably applied to engineering. The c<strong>on</strong>diti<strong>on</strong> CF accords wellwith the test circumstanccs of the ground sample, but the c<strong>on</strong>diti<strong>on</strong>FC and FUC have a large difference, for this rsas<strong>on</strong> it can be deduced that the other two c<strong>on</strong>diti<strong>on</strong>s are not quite in accord with theFa1 circumstanccs. Therefore, for the triaxial shear strength offrozen soils in deeper qround, the test c<strong>on</strong>diti<strong>on</strong>s should be cansid- .ered. The most suitable c<strong>on</strong>diti<strong>on</strong> is the c<strong>on</strong>diti<strong>on</strong> CF.For flow sand in ground layer the c<strong>on</strong>diti<strong>on</strong> CF can not reflectthe real value, if the test is c<strong>on</strong>ducted under the c<strong>on</strong>diti<strong>on</strong> CF the *water will bc squeezed out from the sample, thcreforc thc test results will be affected. So, the authors suggest that for sand samples,freezing should be prior to c<strong>on</strong>solidati<strong>on</strong>, in case the test resultslose their true value.This paper gives <strong>on</strong>ly the preliminary test results. and providesthe informati<strong>on</strong> for scientific discussi<strong>on</strong>.The authors hope that the triaxial shear test can be perfectedand more unified.REFERENCESChengXiangsheng,' 1988, Mechanical Characteristics of ArtificialFrozen Clays Under Triaxial Stress C<strong>on</strong>diti<strong>on</strong>, Ground Freezing88, pp 173-179.Huang Wenxi, 1983, Engineering Properties of'Sul11173
~~ ~ ..~ cryotextureIPERMAFROST AND PERIGLACIAL LANDFORMS INKEKEXILI AREA OF QINGHAI PROVINCELi Shude and Li ShijieLanzhou Institute of Glaciology and Geocryology,Chinese Academy of SciencesKekexili area is located in the hinterland of Qinghai-Xizang Plateau, where themean elevati<strong>on</strong> is more than 5000 m. Climate is arid and cold, the freezing-period is as l<strong>on</strong>g as eight m<strong>on</strong>ths, and mean annual air temperature ranges from-&.lac to -1.O'C. Mid-low latitude, high elevati<strong>on</strong> permafrost is special toChina, the formati<strong>on</strong> of permafrost is c<strong>on</strong>trolled by the height, the thicknesschanges from 1 m tu 128.5 m and much more in rock mountains. The geologicaltect<strong>on</strong>ics and surface water body induced taliks, permafrost was formed duringthe late glaciati<strong>on</strong> and neoglaciati<strong>on</strong>, and periglacial landforms are widelydistributed in this area.1. PRRHAFROSTThe Qinghai-Xizang Plateau is called thethird pole of the globe and is famous for itslofty heights, special geological and geomorphologicalc<strong>on</strong>diti<strong>on</strong>s. and natural envir<strong>on</strong>ment.<strong>Permafrost</strong>, is a product of the natural envir<strong>on</strong>mentevoluti<strong>on</strong> during the forming process of theplateau, and is widely distributed. Climate andthe natural envir<strong>on</strong>ment have brought aboutvarious changes with the uprise of the plateau.Kekexili area, with mean elevati<strong>on</strong> of 5000 m,is located in the hinterland of the Qinghai-Xizang Plateau, where the climate is arid andcold and terrain is lofty. The height rangesfrom the maximum peak Bukaleike summit of 6860 m(also called Xin,qing summit) to the lovest sitein the south piedm<strong>on</strong>t of Kunlun mountains,transcending Rekaleike mountain to H<strong>on</strong>gshuiRiver bend, where elevati<strong>on</strong> is C200 m.The studied area extends northward, to themain ridge of mid-Kunlun mountain, southwardsto the Geladant<strong>on</strong>g glaciers in Tanggula Mountains,east as far as the Qinghai-Xizang highway,and westward to the boundary of threeprovinces or regi<strong>on</strong>s: Qinghai, Xizang andXinjiang (Tig.1). The area is approximately 0.83milli<strong>on</strong> km .Kekexili Is the most intact area of preservedplateau surface <strong>on</strong> the plateau and also is themost developed area for permafrost. The cold andarid envir<strong>on</strong>ment and thermal c<strong>on</strong>diti<strong>on</strong>s providea good c<strong>on</strong>diti<strong>on</strong> for the formati<strong>on</strong> and developmentof periglacial geomorphologics andpermafrost.z<strong>on</strong>es from north to south.(1) Ice, snow and perennially frozen rock inthe lofty mountains of Kunlun ridge, where thereare many modern glaciers, and the mean annualground temperature is below -3.5-C. The thicknessof permafrost exceeds 120 m and approaches400 m in the rock mountains.(2) <strong>Permafrost</strong> z<strong>on</strong>e within the drainage basinof the high plain within Chumer River <strong>on</strong> thesouth piedm<strong>on</strong>t of Kunlun mountains, where, themean annual ground temperature ranges from-1-.2'C to -3.5'C and permafrost is from 40 to100 m thick.(3) <strong>Permafrost</strong> z<strong>on</strong>e in hills and high mountains,(more than 5000 m) such as, Kekexili hill,'Wulanwula, Wuerkewula. D<strong>on</strong>gbule, Fenghuo Shanand Wudaoliang, where mean annual. ground temperatureis -1.4 to -4.O'C. and permafrost is36 m to 120 m thick. Ground ice is a welldeveloped periglacial form and appears widely.(4) <strong>Permafrost</strong> z<strong>on</strong>e in the expanse of thevalley and basin in Tuotuo River, where meanannual ground temperature changes from zerodegrees to -l.OqC and permafrost is I m to 50 min thickness. Thefe are fluvial and permeabletaliks occurring within the z<strong>on</strong>e.(5) Perennially frozen z<strong>on</strong>e in lofty mountainsof Geladand<strong>on</strong>g in Tanggula ranges, wherethe height is more than 5000 m. mean annualground temperature ranges from -1.7'C to -4.5".There are a lot of mcidern glaciers and welldeveloped ground ice. The thickness of permafrostchanges from 10 m to 128.5 m and reaches300 m <strong>on</strong> mountain rocks (see Table 1).1.2 Ground Ice and Crvotexturk1.1 Distributi<strong>on</strong>..~Temperature .and Thickness of<strong>Permafrost</strong>Ground ice forms an important but variableof frozen grThi .S area is more than 500 km l<strong>on</strong>n from south in the upper laver of permafrost in this area.to north, about 400 km wide from east to west, such as the density, network and layer cryotex-<strong>Permafrost</strong> is c<strong>on</strong>tinuously. distributed andture, and layer cryotexture of them is comm<strong>on</strong>..occu'pies about 90 per cent of the investigated The variable ice layer is from a few millimetersarea, and permafrost can be subdivided into five to several meters thick, alternately occurs in. ..1174
the upper layer of permafrost, ice layer withthe level bedding regularly develops in thelacustrine sediments of Chumerhe high plain, andchanges from a few centimetres40 tens of cent$metres(Zhou Youwu, 1981). The ?ce layer, 10 to12 cm thick was found at the depth of 20.6 m inthe lacustrine sediments near No.68 maintenacestati<strong>on</strong> of Qinghai-Xizr-..g highway. The volumetricice c<strong>on</strong>tent of permafrost approximates 30to 50 per cent. The ground ice can'be subdividedinto three types in this area, by their forma,-ti<strong>on</strong> c<strong>on</strong>diti<strong>on</strong>s and distributi<strong>on</strong> features. Thatis cemented, segregated, buried glacier ice andfissure ice.1,3 The Formati<strong>on</strong> and Development of TaliksThe causes of the formati<strong>on</strong> of taliks in th isarea are complex. The formati<strong>on</strong> and evoluti<strong>on</strong>and characteristics of taliks are c<strong>on</strong>trolled b Ythe climate, envir<strong>on</strong>ment. geological tect<strong>on</strong>icsand hydrogeologic and surface cover c<strong>on</strong>diti<strong>on</strong>sGeological tect<strong>on</strong>ics is an underground factorthat always influences <strong>on</strong> taliks. Based <strong>on</strong> thepredominant factors determining the appearanceand existence of taliks, the taliks in thisarea can be divided into three classificati<strong>on</strong>sas follows:1.3.1 Tect<strong>on</strong>ical talikThis type of talik is related to the tect<strong>on</strong>icalfaulting and magmatism, it is formed whenheat ground water arises al<strong>on</strong>g the fault z<strong>on</strong>esand brings about heat influences around thestratum. It often occurs in the faults in thesouth of Kunlun Mountain ridge. For example,there are a lot of hot springs in the southpediment of Buhadaban Peak (temperatures up to90"C), it is estimated that the talik extendsmore than 200 m from south to north: others,such as, the talik,extending from Tanyang Laketo H<strong>on</strong>gshui River.1.3.2 Talik of surface waterThis type of talik was formed due to thethermal influences of surface water bodies <strong>on</strong>permafrost, it is also subdivided into fluvialand lacustrine taliks by the category of waterbody and the features of talik. For perennialrivers,the river surface is frozen during winterbut river water still flows. The heat transmissi<strong>on</strong>and insulati<strong>on</strong> from the water body causeslinear talik to form in the beds and lateralsof rivers. There are fluvial taliks under TuotuoRiver, T<strong>on</strong>gtian River and Buqu River, and the<strong>on</strong>e in Tuotuo River is as wide as 875 m, and isthe largest <strong>on</strong>e <strong>on</strong> the plateau (Qiu Guoqing,1982; Shang Jianyi, 1982 and Guo D<strong>on</strong>gxin, 1982).1.3.3 Permeable and radiati<strong>on</strong> talikThe formati<strong>on</strong> of this type of talik is aresult of atmosphere precipitati<strong>on</strong> permeati<strong>on</strong>and solar radiati<strong>on</strong>. Such as those in the terracewith sandy sediments <strong>on</strong> the north bank of 'TuotuoRiver, crescent dune near Wuxijin lake and inbare gravel surface in the valley of Buqu River.The presence of the taliks menti<strong>on</strong>ed abovecauses the integrity and stability of permafrostto he damaged, the c<strong>on</strong>tinuity, temperature andthickness of permafrost to be disturbed andcomplicated.1.4 The Development' History of <strong>Permafrost</strong>Many data (geologic, geographic, pale<strong>on</strong>tologicalpalso-glaciers and palao-preglacial) haveshown that the mean height of the plateau wasabout 2000 m in early Pleistocene,. 3000 m inmid-Pleistocene.and 4000 m in late Pleistocene.Evidence of glaciati<strong>on</strong> in the high plain ofChumer River, and involuti<strong>on</strong> layers in lacustrinesandy clay in Kunlun Shan pass, dating to aboutthe early Pleistocene, indicated the glacialand preglacial envir<strong>on</strong>ment existed <strong>on</strong> theplateau in mid-Pleistocene, when permafrost wasexpansive. After glaciati<strong>on</strong> of mid Pleistocene,air temperature rose and deglaciati<strong>on</strong> commenced.Air temperature at that time was higher by 11°Cthan at the present, in Qingshuihe area, permafrosthas been disappearing mostly, with theexcepti<strong>on</strong> of the high mountains. The air temperaturedecreased again in the b,eginning ofthe late Pleistocene when the glaciers advanced,for example, the Zhufeng glaciati<strong>on</strong>. The sec<strong>on</strong>dor third glaciati<strong>on</strong> had occurred in Kunlun andTanggula Mountains. Although we found noevidence of Pleistocene glacier advancing inKekexili area, it is a fact that periglacialenvir<strong>on</strong>ment covered this area at that time. Asa result, permafrost expanded, other evidencefor this are sand wedges in the No.2 terrace ofTuotuo River (dating 23500*1200"C B.P.), andsand and gravel wedges were also found in theNo.2 terrace of Chumer River, Gangqiqu, Mazhangcuoqing,T<strong>on</strong>gtian River and Buqu River. About3'000-1500 year ago (Zhou han cold stage) neoglaciati<strong>on</strong>commenced <strong>on</strong> the plateau. The grcuundwas refrozen aad coincided with the perenniallyfrozen layer formed during the late Pleistocene.The hole in Xidatan indicates that the permafrostlayer and underlain humus 4,4 m thickwere formed during neoglaciati<strong>on</strong>: <strong>on</strong> the No.1terrace of Nachitan, involuti<strong>on</strong> developed inthe upper layer of sandy soil with charcoalfragments which gives a date of 4910f100'4Cyears B.P. indicating it as the north lowerboundary of permafrost during neoglaciati<strong>on</strong>(Pu Qingyu, 1982),1.5 CoolinR SoilThere is a special soil occurring in thedried and seas<strong>on</strong>al lakes of this area. A grey 'or grey white salinized soil, underlying thesilt and sandy clay of the lacustrine orfluviolacustine facies, with 30-40 percentmoisture c<strong>on</strong>tent and high salt c<strong>on</strong>tent, measurementsshow that it will freeze at,temperaturesbelow -4°C - -7°C.2. PERIGLACLAL LANDFORMS 'Due to the circulati<strong>on</strong> of freezing and thawinga lot of cryogenetical phenomena were formedin the active layer and upper part of perma-frost'in the expansive permafrost regi<strong>on</strong>. The developmentand movable process of periglacial landformsare mainly c<strong>on</strong>trolled by the exog<strong>on</strong>icforce, whose property is related to the specialheight and geological-geographical factors inthis area. Based <strong>on</strong>,the dominant acti<strong>on</strong> formingthe varied periglacial landforms, which can be, divided into seven classificati<strong>on</strong>s includingmore than 70 forms which are presented asfollow (FIg.1).2.1 Frost MoundsBoth perennial and seas<strong>on</strong>al frost moundsdegelop in this area. Such as those in the basinof Kunlun Mountain pass, in the headwater ofSema River and in the gorge and divide betweenGangqiqu and Mazhang Cuoqin. The famous perennialfrost mound in the basin of Kunlun Mountainpass, is up to 18 m high, 140 m l<strong>on</strong>g, and 45 m .Iwide. There are two depressi<strong>on</strong> from the mound1175
Map of Periglacial Landforms in Kekexili Area1. rock streams bl.ock field: 2. block slape rock glaciers: 3. periglacial pillarperiglacial loess; 4. debris c<strong>on</strong>e icing; 5, sand dune soli.flucti<strong>on</strong> t<strong>on</strong>gue;6. macro sorted circles micro sorted circles: 7. frost mound earth hummocks;8. patterned ground palsas; 9. frost block wedge shaped body; 10. explosivefrost mound involuti<strong>on</strong>; 11. settlement lake settlement depressi<strong>on</strong>; 12. glaciofluvialterrace massj.ve ice: 13. periglacial castle hot spring; 14. glacier.General Table of the Seas<strong>on</strong>al Thawing Depth and the Temperature and Thickness of<strong>Permafrost</strong> in Kekexi.1i Area, Qinyhal Province , .SiteLatitude Elevati<strong>on</strong> MAAT (oc)Thickness of Seas<strong>on</strong>al thaw(NO 1 (m) MA' ("C), .permafrost depth (MIKunlun Shan 35040' 4800-5000 below -3.5 -2.8 - -3.5 7 5- 100 1.5ChumerRiver 350207 ~480-4500 -6,2 -1.2 40 2-3Wudaoliang 35"15' 4610 -6*5 -1.4 36-h0 3-3.2Fenghuo Shan 34'20' 4700-5100 -0.6 -2.0 - -4.0 60-120 , 1-2Tuotuo River 33"50' 4500-4700 -4.4 0.0 - -1.0 1-50 0.8-6T<strong>on</strong>gtian River 33"30' 4500-4600 -4.4 -0,3 - -1.0 25 1-4Tanggula Mt. 32-57' 4900-5300 -6.4Tangquanguo 32"40' 5000 below -6 4- 10-1.20 1-3- 128.5 2.8Zhu<strong>on</strong>an Lake 3.5'18' Area 4800 about -6.5 74 .a 2.4-
subsidence occurring in the north anfi southsides of the mound enclosed by a soil ridge,which is more than 10 m high. Groundwater overflows<strong>on</strong> the top of the mound to form theseas<strong>on</strong>al icing which is 1.5-20 m high.2.2 Earth HummocksThese dome shaped hummocks were formed by theair circulati<strong>on</strong> of frequent freezing and thawing,small plactic moun;:s are usually covered withgrass 20 to 40 cm in diameter and 10-30 cm high.2.3 RockglaciersIt is a special geomorphological form in thecold permafrost regi<strong>on</strong>, it is also called amovable permafrost body, and c<strong>on</strong>sists of clasticdebris, breccai and ground ice. Such as therockglacier in Kunlun Mountain which is uniqueto China (Cui Zhijiu, 1981).REFERENCESGuo D<strong>on</strong>gxin and Li Shude, (1982) The formati<strong>on</strong>and history of massive ground ice inFenghuo Shan <strong>on</strong> Qinghai-Xizang Plateau.Proceedings of <str<strong>on</strong>g>C<strong>on</strong>ference</str<strong>on</strong>g> <strong>on</strong> Glaciology andGeocryology (Geocryology), Science Press.Pu Qingyu, (1982) History of permafrost al<strong>on</strong>gQinghai-Xizang highway. Proceedings of<str<strong>on</strong>g>C<strong>on</strong>ference</str<strong>on</strong>g> <strong>on</strong> Glaciology and Geocryology(Geocryology), Science Press.Shany Jianyi, (1982) The development featuresof permafrost al<strong>on</strong>g Qinghai-Xizang highway.Proceedings of <str<strong>on</strong>g>C<strong>on</strong>ference</str<strong>on</strong>g> <strong>on</strong> Glaciology andGeocryology (Geocryology), Science Press.Cui Zhijiu, (1983) Discussi<strong>on</strong> <strong>on</strong> rockglacier,inKunlun Mountains. Proceedings of Sec<strong>on</strong>dNati<strong>on</strong>al <str<strong>on</strong>g>C<strong>on</strong>ference</str<strong>on</strong>g> <strong>on</strong> Glaciology andGeocryology, Gansu People's Press.2.4 Settlement Depressi<strong>on</strong>s or LakesThe landforms in the handwatcr of ChumerRiver, near Xinxing Lake and between XijinwulanLake and Y<strong>on</strong>gh<strong>on</strong>g Lake are surface disturbancesresulting from disrupti<strong>on</strong>s of the thermalequilibrium of underlying permafrost due to thevariati<strong>on</strong> of surface c<strong>on</strong>diti<strong>on</strong>s.2.5 Periglacial Loess and Sand DunesWith a lofty and expansive terrain, cold andarid climate and the effects from violentlyaerological west wind currents make this areabecome <strong>on</strong>e of the areas with maximum wind speedwithin the plateau or in China*The loess deposited under the periglacialenvir<strong>on</strong>ment is called perlg.lacia1 loess, itwidely occurs in pediment, terraces and valleys.Sand dunes, crescent dunes also'occur widely inthe north side of Xijinwulan Lake and al<strong>on</strong>gQinghai-Xizang highway, and impedes <strong>on</strong> thehighway.2.6 Frost Jacking of St<strong>on</strong>esA lot of frost jacking of st<strong>on</strong>es are'oftendiscovered in this area. Some of them stand ingreat numbers like trees in a forest <strong>on</strong> theslope. Such as those <strong>on</strong> the slope <strong>on</strong> the bankof Kekexi1.f Lake, where sandst<strong>on</strong>e and slateare widely distributed.*Informati<strong>on</strong> from investigati<strong>on</strong> for Kekexili.
REGIONAL FEATURES OF PERMAFROST IN MAHAN MOUNTAIN ANDTHEIR RELATIONSHIP TO THE ENVIRONMENT'Li Zuofu, Li Shude and Wang YinxueLanzhou Institute of Glaciology and Geocryology,Chinese Academy of SciencesDrilling and ground temperature measurements at some sites in the study areademenstrated that the presence of permafrost within the loess plateau in Chinais an irrefutable fact. <strong>Permafrost</strong> distributi<strong>on</strong> is sporadic and island.,varyingin extent from tens of square metres to l.5x105m2 and in thickness from about3 or 5 m to 30 m. Sporadic permafrost was first discovered in China. A key topermafrost occurrence is high elevati<strong>on</strong>, through 2 range of above 3500 m, thespatial dis'tributi<strong>on</strong> of permafrost areas is complicated by the local c<strong>on</strong>diti<strong>on</strong>sSTUDY AREANahan Mountain, (35"45'N and 103"45'-104°00'E)3670.4 m above sea level, located about 40 kmsouth of the city of Lanzhou, is the highestpoint within the loess plateau. The summit is aplanati<strong>on</strong> surface formed in the Pliocene epoch(Liu and Li, 1991) and has a generally subduedrelief. There are scattered rock outcrops andpoorly developed Quaternary sediments includingremnant blocks formed by frost weathering.The climate of Mahan Mountain is subhumid andcold although it is located in the expanse andarid loess plateau due to the lofty height andair temperature abruptly decreasing with theincrease of height. Mean annual air temperatureand precipitati<strong>on</strong> are -2.3-C and 494 mm (observedin 1961, after by Re Binghui, 1981). The freezingdurati<strong>on</strong> is as l<strong>on</strong>g as seven m<strong>on</strong>ths. Especiallylapse rate of air temperature in winter (fromDecember to February) is <strong>on</strong>ly 0.3"C/100 m, lessthan the normal value, based <strong>on</strong> the relativestatistics between air tempwature and heightat 24 weather stati<strong>on</strong>s near the study area.PERMAFROST DTSTBIRUTIDNIn this a'rea, mean air temperature is -2,3'Cyearly and 9.2'C in July, the difference betweenthe ground and air temperature is 2.8'C (observati<strong>on</strong>in 1991). <strong>Permafrost</strong> was found in Oct.1985. Therefore, four secti<strong>on</strong>s, including 12sites, where holes and pits were dug wereselected for the programs of the investigati<strong>on</strong>of permafrost distributi<strong>on</strong> and measurement ofground temperature in 1991. At least, eight ofthem have been identified to have existingpermafrost (Fig.1).Of the four secti<strong>on</strong>s, Secti<strong>on</strong> A (termed Xiaohutan),3560 m above sea level, an area of"The project supported by Nati<strong>on</strong>al NaturalScience Foundati<strong>on</strong> of China. ,approximately 0,5 km', situated <strong>on</strong> the northfacing slope of Mahan Mountain, is an ellipticalhollow with poorly drained and well developedhummocks. In winter it is free of snow pile,<strong>on</strong>ly thin snow fills in the trenches of theearch hummocks. Four holes were drilled <strong>on</strong> thebottom of the hollow in July and September 1991to obtain informati<strong>on</strong> <strong>on</strong> perennia.11~ frozenground and bedrock and to install thermometersfor m<strong>on</strong>itori.ng ground temperature. The results(Fig.2) indicate that permafrost occurs <strong>on</strong> the 'bottom of the hollow varying in extent of about1.5x105m2, almost cpincident with the occurrenceof the well developed earth hummocks in thicknessfrom about 5 m <strong>on</strong> the edge and 30 m in thecentre of the hollow. The depth of the activelayer is 1.5 m <strong>on</strong> the edRe and 1.2 m in thecentre of the hollow. No permafrost occurs <strong>on</strong>the slope around the hollow, where the depth ofseas<strong>on</strong>al freezing varies from 3.5 m to 4.0 m.Secti<strong>on</strong> B, adjacent to Xiaohutan, situated <strong>on</strong>the back well of the paleo-cirq'ues of Doulingtrench, Three holes were drilled <strong>on</strong> the soliflucti<strong>on</strong>sediment and nivati<strong>on</strong> holloy. Of the three ,holes, the first was selected in R nivati<strong>on</strong>hollow with well developed earth hummocks and. ,soliflucti<strong>on</strong>, Prevailing north westerly winter .,wind accumulated a thick snow cover (thickness:40-50 cm), near the surface soil moisture wasvery high, the depth of seas<strong>on</strong>al freezing was2.5 m, The ground temperature at a depth of 5.lmwas 0.8'C during early July to early August. Nopermafrost exists in this site. The sec<strong>on</strong>d andthird were all selected <strong>on</strong> the soliflucti<strong>on</strong>tougues with an average gradient of 12". Thereis no redistributi<strong>on</strong> of snow in winter, thedepth of snow varies <strong>on</strong>ly from 10 cm to 15 cm.Although they have a steeper gradient and arewell drained, near the surface soil.moisture insummer is very high. As a result, the maximumdepth of seas<strong>on</strong>al freezing reaches to 4.0 m.the ground temperature at a depth of 3.5 m wasfrom -0.1'C to -0.2'C during early July tu, .1178
hFig.1 The map of permafrost and periglacial Landforms in Mahan Mountain1. Bush upper limit; 2. Island permafrost; 3. Sporadic permafrost(amplified): 4. Icing; 5. Earth hummocks; 6. Nivati<strong>on</strong> hollow:7. Glacial deposits; 8. Soliflucti<strong>on</strong> terrace; 9. Block fields;10. Cirque; 11. Boreholes and pi.ts; 12. Roads: 13. Investigati<strong>on</strong> secti<strong>on</strong>TemDcraturc PC) . .-2-1 0 1 2Temperature ("C)-3 -2 -1 0 1 2 3O 7guessedmeasuredeHYb: June 176- c: Nov. 228-d DGC. 151012--IIFig.2 Ground temperature envelopes at islandpermafrost in Xiaohutanearly August and up to 1.2'C until late Sept,There was also no permafrost in these sites,However, permafrost was found between thesesites in October 1985, where a 1.2-m-thick layerof clay with debris overlying dolomitite withdeveloped fissures in which ground ice, primarllyin the form of fissure ice up to 2 m thick(average thickness beimg from 5 to 12 cm), wasencountered at a depth of 8 m below Eroundsurface (Li Shude, 1986). Based <strong>on</strong> the abovementi<strong>on</strong>ed and hydrochemical analysis of icesamples taken at the depth of 8 m below theground surface, permafrost exists at the bedrockin this site (Fig.3).Fig.3 Ground temperature curve of sporadicpermafrost in bedrock'Secti<strong>on</strong> C, from H<strong>on</strong>ghalang trench to thesummit. At Hutanliang, <strong>on</strong>e hole was drilled ata modern nivari<strong>on</strong> hollow at 3640 m elevati<strong>on</strong> <strong>on</strong>a scattered meadow, with coarse grained materialand a snow patch 0.3-3,4 m thick. Although meltwaterfr<strong>on</strong> patches of snow accumulated in thehollow flows near the hole, the soil moisture inlate Autumn is low owing to the steeper gradient(gradient of 15 to 20°), the maximum depth ofseas<strong>on</strong>alfreezing was 3.2 m, the ground temyeratureat a depth of 3.6 m was 0.1OC in early Julyand increased to 2.2"C in early August; At3520 m elevati<strong>on</strong> <strong>on</strong> the soliflucti<strong>on</strong> t<strong>on</strong>gue atthe bottom of Douling trench has an average
gradient of 3" to So. Vegetati<strong>on</strong> c<strong>on</strong>sis~s ofalpine azalea and c.ryptomeria up t.ij SO cm highwith' scattered growth. Recaust. thc surface ru11-off from the upper slope flows arounrl thv soliflucti<strong>on</strong>t<strong>on</strong>gue therc was no organic laycr butsoil moisture was very high or the soil remainr.11essentially saturat-ed through the thawing seas<strong>on</strong>.The runoff has no thermal affcct <strong>on</strong> the chitrlgeof soil temperature. Ground tempcr,oture at adepth of 3.5 m was -0.Z'C from esrly July tolate October. The maximum depth of seas<strong>on</strong>althawing occurs until mbd-December (depth: 2.Om).A t this time, however, thc ground temperarure nta depth of 3.5 m was -0.1"C (Fig.4). It isestimated that permafrost is about 3.0 m inthickness and a few tens of square metres inextent.4tFig.4 Ground temperature curve of sporadicpermafrost at H<strong>on</strong>ghalang trenchSecti<strong>on</strong> D, situated at a paleo-cirque withsubdued terrain in Tudixian at 3520 m elevati<strong>on</strong>,and plant cover c<strong>on</strong>sists of an alpine meadow.Local swamp or soliflucti<strong>on</strong> t<strong>on</strong>gues with welldeveloped hummocks also occur at these sites.Snow cover in winter varies from 10 cm to 20 cmin thickness, two holes were drilled at theswamp and the no swamp soliflucti<strong>on</strong> in July 1991,respectively, to c<strong>on</strong>trast the freeze and thawprocess at different microterrain units, but themeasurement results of ground terrpurature aredifferent between them.The distance between them is unly 30 m, <strong>on</strong>eat the swamp soliflucti<strong>on</strong> t<strong>on</strong>gue with permafrost(Fig.5) and at the other with n<strong>on</strong>e.4tTemperature ("C)Fig.S Ground temperature curve bf sporadicpermafrost at swamp soliflucti<strong>on</strong>t<strong>on</strong>gue in cirque of Tudixian'The above menti<strong>on</strong>ed ~'erntafrcrst, distributi<strong>on</strong>in this :.lrc>a is quite complex.Alpine pttrmnfro.;t i n M;lh<strong>on</strong> Yuuntain can alsohc suhdivided inio isl;i~~d rind sporadic pcrmafrost.'The former is similar 1.0 those in othfrregi<strong>on</strong>s ot China,' the lnean ar~nual nt[,un(l t1.mper;lt.urt!is between -0.Z"C and - 0 . 3 O C . 'lhe~r(~un(I tempcraturc grorlicnt prufilc is almostzero, so, i t. is wnrm prrmafru5t which usually issusceptible to the envir<strong>on</strong>mrnt;~I nhanges but itstill exisLs uit.hir~ t.he luess p:3t.(!:ru with <strong>on</strong>arid or scmi-arid climate in mid--Latituderegi<strong>on</strong>s rrnd is about 30 m in thickness. Thedepth of' annual zero amplitudc was e11r:ounteredat a depth'of 12 m below t,he grourld snrl;i(.t+.The thickness of the active layer and the depthof annual zcru amplitude arc all lower thanthose, in uther alpine permafrost regi<strong>on</strong>s ofChina. These at-e largely due to t,he originallayer mear the surface (thickness; 30 to 40cm)which ~-crntoins much morc moisture, and acts asan insulaiing c(~vcr, just 8s those above Klunc1,akr (Var,ris, 1987), partly due to the present-eof supra-perm.Jfrost war-er in !.he hi11 lnw. Tnarid i t. i <strong>on</strong>, massivc ice and ice-rich soi 1 develnfre~lin the 11pprr layer ut pcrmafrost which retardspermafrost degradati<strong>on</strong>. As a result, i t can bepreserved i.1 the loess plateau as secn atpresent.The sporadic permafrost was first suggestedhy Gorhunov (1978) who found perennially frozenhurlies, that occur in the debris and clasticsediments and exist. for & few years in the mid-Asian mountains, its occurrence has heen notreported in China. So it is unique, that <strong>on</strong>e ofthem was encountered in bedrock with fissures,it has B thickness of about 10 m, and its meanannual ground temperatqre approximates zero, thedepth of seas<strong>on</strong>al thawi.ng probably exceeds 4 m,and mean annual air tcmperaturE is below OOC.The reas<strong>on</strong> for scattered distributi<strong>on</strong> appearsto be that it is located near the lowcar limit of'alpine prrmafrost and in thcrmal fquil'ibriumwith the present surface temperature or nlter~ativelymay represent remnant permafrost degradingin resp<strong>on</strong>se tu an incrcase of surface temperaturcto above O'C. Especially snow patches insulatethe ground from the cold in winter, so that nopermafrost occurs in the sit.es menti<strong>on</strong>ed above.Other sites with permafrost are at soliflucti<strong>on</strong>deposits at Hc~ngh~l<strong>on</strong>g trench and swampsoliflucti<strong>on</strong> t<strong>on</strong>gue at the cirque of Uudixian,which have zero gradient in ground temperatureprofile and mean annual ground temperature isabove 0°C. <strong>Permafrost</strong> is about 2 m to 3 m inthickness. They may he largely a functi<strong>on</strong> oflocal c<strong>on</strong>diti<strong>on</strong>s. For example, there is thinsnow cover and much moisture fur fine grBinedsoil in summer in these cases. They may he inthermal cquilibrium with the local surfacetemperature, so that sporadic permafrost <strong>on</strong>lyexists in the microterrain.EROUNI)ICEUp to now, epigenentic ground ice has beennot found in the study area, although someresearchers think the sediments at. Doulingtrench to be rock glaciers. Syngenetic groundice, huwever, including fissure icc in bedrock,and segereti<strong>on</strong> ice, is c<strong>on</strong>trolled by localgeological and geomorphological c<strong>on</strong>diti<strong>on</strong>s.Fissure ice in bedrock develops <strong>on</strong> the summit or
"Isecti<strong>on</strong>s al<strong>on</strong>g the ridge. For example, thoseencountered in the exposure dug at the backwallof the cirque of Douling trench, Hydrochemicalcompositi<strong>on</strong> for the Ice sample taken in a depthof 8 m below surface is different from those ofgroundwater from the soliflucti<strong>on</strong> t<strong>on</strong>gues, icingand snow samples taken around the site. Tritiumc<strong>on</strong>tent of 11.63 TU indicates that the fissureice was formed before the 1950's (Li Zuofu andLi Shude, 1986). In additi<strong>on</strong>, fissure icc inbedrock occurred <strong>on</strong> a mining exposure in e3rlyJuly and was preserved until late July 1991.Ice stalactite formed at a man-made cave in thesummit and was preserved until late August.Durati<strong>on</strong> is as l<strong>on</strong>g as eight m<strong>on</strong>ths.Segeregated ice mainly develops in the microterrainwith thickly fine gralne'd soil. So inthis area, Xihuotan is an unique site wheresegregated ice develops, Borehole data shows thevertical variability of ground i.ce c<strong>on</strong>tent.Total ice volume decreases from values of morethan 90 percent at depths of 1.2-1.7 m belowsurface to 45-55 per cent at depths of 1.7-3.5111,and frozen sediment at depths of 3.7-6.2 mc<strong>on</strong>taining no visible needle ice. They may beclassified in terms of the field observati<strong>on</strong> andhave a relati<strong>on</strong>ship to enclosing scdiments.Lens ice or an ice layer with silty particles53 cm thick. Grey silty particles were apparentlyin suspensi<strong>on</strong> within the ice, roughly 3-7 percent by volume, lens with uniform coarse crystal.size was simllar to columnar. Vert-ically orientedand el<strong>on</strong>gated crystal structure i s perpendicularto the overlying sediment: Layer tce occurs at adepth of 1.7 m below the surface, the totalthickness is 2.0 m (each layer being 1-2 cmthick) layer cryotexture and short columrrar icecrystals. When it was melted :he core lookswhorled.M A ~ N FACTORS EFFECTING PERMAFROSTa Elevati<strong>on</strong><strong>Permafrost</strong> found in this area exipted at thelowest heights of ahovc 3530 m and at the highestelevati<strong>on</strong> of 3620 m (<strong>on</strong> the north facing slope),which were determined by many investigati<strong>on</strong>s inthe s~te. Especially, the rec<strong>on</strong>naissance studyof permafrost distributi<strong>on</strong> in detail and measurementof ground temperature which was carried outin 1991. Through a range of the heights, <strong>on</strong>esite has permafrost but another will have n<strong>on</strong>e,even though they are <strong>on</strong>ly a few meters apart.Meanwhile, <strong>on</strong> the north facing slope permafrostoccurs at lower heights, but no permafrostexists at higher elevati<strong>on</strong>s. Thus:, the highclevati<strong>on</strong> is a key factor to determik~e whethcrpermafrost occurs or no^, through Lhe range ofthis height, regi<strong>on</strong>al factors have a great dealof effect <strong>on</strong> the occurrence, Lemperature. andthickness of permafrost and Rround ice." FacinK SlopeFrom statistics, within the alpine permafrostregi<strong>on</strong> in the Northern Hemisphere, the lowerhoundary of permafrost <strong>on</strong> the south facing slopeis high, 300-400 m more than that <strong>on</strong> the nort-hfacj.ng slope (Qiu, Huang and Li, lYR2). Based <strong>on</strong>the difference between the south and northfacing slope mentiorled above. The 3600 m heightappears to be a critical <strong>on</strong>e for permafrostoccurrence in this are3 from Lhe geogruphiclocati<strong>on</strong>, mountain height ancl cryogenic phenomenadeveloped <strong>on</strong> the north facing slope and <strong>on</strong>. thesummit. Through a range of the elevati<strong>on</strong>, steeprelief or. the north facing slope is advantageousto the blocking of the cold 'current in winter,so that cold durati<strong>on</strong> becomes much l<strong>on</strong>ger <strong>on</strong> thenorth facing slope than that <strong>on</strong> the south facingslope, In summer, it makes a vertical currentdevelop, so t.hat <strong>on</strong> thc north facing slope cloudcover increases, and incoming radiatiorl reduc.es,which are also advant.ageous to the decrease ofmean annual surface temperature, meanwhile, itis much wetter <strong>on</strong> the north facing slope.' Forexample, there js alpine azalea up to above3600 m above sea level, and <strong>on</strong>ly <strong>on</strong> t-he alpinesteppe <strong>on</strong> the south facing slope. These differencesbetween them have a great.effect to thermalinterchange between the air and the ground.There is no possi.bility of existing permafrost<strong>on</strong> the south facing slope in this area.Terrain and Soil""As menti<strong>on</strong>ed above, the loosened sediments instudy area are thin and overlifs the coarsedebris 0.3-1.0 m thic.k. 'Thus, under thp samec<strong>on</strong>diti<strong>on</strong>s, the thlckness of line grained soilis very import.ant for the absence or presenL ofpermafrost. in the sites with a thin layer IY'?fine grained soil, Pcrrneati<strong>on</strong> from water, makesheat in soil qujckly migrat.e downwards, so thatthe rate of thawfng of t.he sol1 would be fasl,owing to suitable permeabil.ity and steepergradient.Measurement3 of gruund teaperature at thev.atious sites near Hutanlieng show that isogeothermsuf 3.2"C at e depth of 1.2 m occurted <strong>on</strong>.July 15 at tlfe site wifh coarse debris. Sut atthe sites with fine grained soil it occurs at adepth of 0.5 m until. 1at.e September and hasncver been at the depth of 1.2 m annually. Thisvariati<strong>on</strong> was largely duc to the difference inthe thickness uf finr gr~ined soil with time asthe water permeates through the fine gratlnedlayer to the coarsc debris.Tn tldditi<strong>on</strong>, island pormefrust exists inXiaohutan and its active laycr varies from 1.2 mto 1.5 m in thickness. Thr rcasirn for thiv isprobab1.y partly due to organic rich muck andpoor drainage 111 summer and partly due to thccool jng of the snow cover in trenches UT hummockstcl the ground surface 'in winter. Thus, under thesame c<strong>on</strong>diti<strong>on</strong>s, the thickness of fine grainedsoil. .in 1.he study 8rt-a appcars LO be the majortact.or c<strong>on</strong>trolling the absence or yresencc 05permafrost.Snow CoverSnow C O V ~ J inrluenccs t.he hcat t.ransfcrhetwecn the .lLr and thrt ground, and, hcnce,affccts the distrjhuti<strong>on</strong> 01' permatrust, due turedistributi<strong>on</strong> of snow (-over Ly wind. The snowcovcr dl. the study area exhibits c<strong>on</strong>s~derabicspatial vatia1,i<strong>on</strong> in deyt.1~. Sump snow patches33-53 cm thic-k per-sist. <strong>on</strong> the nivati<strong>on</strong> hollowsthrough wi.nter to retluce winter heat loss. 'I'hr.hollows havc relatively thick loosened deposits,hut a thin snow cover filled in t.he trrnches ofearth hummocks rema1113 for u l<strong>on</strong>g t,imu, most ofthe area studied is exposed LO wind. 'Thus theeffect ot the snow covcr 1.0 grou~~d surtace isboth insulat.i.ng and cooling i n this arva.Insuloting; insulati<strong>on</strong> of snow cdver to groundsur,fal:t? is with a relati<strong>on</strong> to heat c~rrles insoil, because the alca studied is In thc iangt'of 3500-3650 10 elevati<strong>on</strong> whicl~ is a criticalheight for permafrost tu exist a1111 which I?RSviulent heat cirtles in soil. Therrfore, snawCOVF.~ insulates the ground from thc wint.er cold.For rxt+mple, <strong>on</strong> the Lack wal I of thc cirque inDouling trench, a snow patch <strong>on</strong> t.he hollow was
50 cm thick, the depth of seas<strong>on</strong>al freezing wasabout 2.5 m. But Snow cover <strong>on</strong> the soliflucti<strong>on</strong>t<strong>on</strong>gue varies from 15 to 20 cm in thickness. Thedepth of seas<strong>on</strong>al freezing was about 3.5 m toh.0 m, observed at Xiaohutan <strong>on</strong> December 15,1991 showed that the temperature at no<strong>on</strong> was2.0"C in ground surface, -0.6'C in snow surfaceand -1.6"C under snow; and that temperature inafterno<strong>on</strong> was -1O'C in ground surface and -13.2'Cunder snow.In additi<strong>on</strong>, snow patches <strong>on</strong> the north faci.ng-slope cause the thawing data to be postp<strong>on</strong>ed for20 days. It appears that the snow cover acts asa cooling cover when it is thinner than 20 cmand as an insulating cover when thicker than30 cm.In summary, <strong>on</strong> the north facing slope inHahat1 M0~11taln the occurrence of permafrost iscomplicated by the general influences of soilmicroterrain, and gradient, and the alternativeacti<strong>on</strong> fr<strong>on</strong> insulating and cooling of snow coverto the ground.REFERENCESRe Binghui, (1981) A study <strong>on</strong> Quaternary glacierand periglacier in mountains near Lanzhou,Journal of Glaciology and Geocryology,vo1.3(1).Liu Yun and Li Jijun, (1991) Late Quaternaryglacier and envir<strong>on</strong>ment in Mahan Mountains,The Quaternary Glacier and Envir<strong>on</strong>ment ofWestern China, Science Press, Beijing, China.Li Shude, (1986) <strong>Permafrost</strong> was found in MahanMountain near Lanzhou, Journal of Glaciologyand Geocryology, Vo1.8(4).Li Zuofu and Li Shude, (1986) <strong>Permafrost</strong> <strong>on</strong> theloess plateau in China, GeographicalKnowledge, No.9.Qiu Guoqing, Huang Yizhi and Li Zuofu, (1982)Features of permafrost in Tianshan of China,Proceeding: 2nd Nati<strong>on</strong>al <strong>Permafrost</strong> <str<strong>on</strong>g>C<strong>on</strong>ference</str<strong>on</strong>g>,Gansu Press, p.21-29.Gorbunov, A.P., (1978) Proceedings Third <str<strong>on</strong>g>Internati<strong>on</strong>al</str<strong>on</strong>g><str<strong>on</strong>g>C<strong>on</strong>ference</str<strong>on</strong>g> <strong>on</strong> <strong>Permafrost</strong>, Vol.1,p.349-353.Harris, S.A., (1978) Arctic, Vol.40, No.3,p.179-183.
A SOLUTTON FOR THE ICINGHEAVE OF FOUNDATIONS INPERMAFROST REGIONS BY LOWERING THE GROUND WATER TABLELiu Shifcng and Zou XinqingThe Institute of Forestry Design of Da Hinggan Ling'The frost heave of foundati<strong>on</strong>s is <strong>on</strong>e of the most important problems damaging buildings in permafrostregi<strong>on</strong>s. Prom many years of surveying the damage to the buildings in Da Hinggan Ling regi<strong>on</strong>, particularlyin dealing wity the heave of foundati<strong>on</strong> of residential buildings in Gulian mining area, we propose amethod of lowering the ground water table to solve the frost heave of foundati<strong>on</strong>s in permafrost regi<strong>on</strong>sand to obtain some results. Through two years of observati<strong>on</strong> it was found to be cfftctive.ANALYSIS OF FEASIBILITYBased <strong>on</strong> the freezing principle, the frost heave that ocam insoil must be qualified with three c<strong>on</strong>diti<strong>on</strong>s: 1) susceptible soil, 2)preliminary water c<strong>on</strong>tcntand externally supplied water. 3)optimum freezing c<strong>on</strong>diti<strong>on</strong>s and time. The frost heave can be r esisttd by the weakening of <strong>on</strong>e of the three c<strong>on</strong>diti<strong>on</strong>s, so that thefrost damage is protected.When the soil properties arc c<strong>on</strong>stant, the amount of waterc<strong>on</strong>tent is <strong>on</strong>e of the basic factors affecting the frost heave. In aclosed system, the water capacity determines the frost susceptibility,In an open system, the cxternally supplied water can greatly raisethe susceptibility of soil, although the preliminary water c<strong>on</strong>tent issmall. Both the water c<strong>on</strong>tent of soil and externally supplied waterare related to ground water. There is rirrely rain in the developingpermafrost area in Da Wiggan Ling. The surface soil begins tofreeze from October to April, the water supplied from the surfaa isreplaced gradually by ground water. The groundwater table affectsdirectiy the water c<strong>on</strong>tent and the supplied water during soil freesing. As a result, the frost susceptibility of soil is decided. The moreshallow the ground water table, the lower the frost heave. Thus it is *feasible to decrease the frost heave by lowering the ground watertablc.SPECIFIC IMPLEMENTSAfter the structure of the foundati<strong>on</strong> of the four residentialbuildings is Gulian mining area were completed, a water z<strong>on</strong>e webled from the foundati<strong>on</strong>s in October that year and ice formed later..The exit was frozen in the middle of December, and an icingformed about 60m ling in size, 20m wide and 1.2m in averageheight. When the surface ice was dug out, a column of cinfincdground wadr was spread which reached to O.6m high and its fluxwas 1st / h. The coatcr column changed into welling water afterhalf an hour, and its flux was 6t/ h. The icing expandedc<strong>on</strong>tinuously with time, andthe girds ofthe foundati<strong>on</strong>s might ofken damaged at any time. In order to determine an optimum solvingmethod, we investigated the hydrogeological c<strong>on</strong>diti<strong>on</strong>.The area is located <strong>on</strong> the north slow of Da Hinggan Ling,where it experiences a c<strong>on</strong>tinental climate in a tempera1 frigid zore,and altitiude is 444)"--6oom. The summer is short and hot and thewinter is l<strong>on</strong>g and mld. The annual air tcmwrture is -ST,theminimum air tcmmrature is +PC, and the maximum air ternperatureis 36.8"C.The residcntial buildings were built <strong>on</strong> the low ridge and gentleslope. The topography declines from northeast to southwest. Thereare geomorphology units of denudated a&umulati<strong>on</strong> and frozensoil pcriglacial forms which arc in the expressi<strong>on</strong> of icing in winterswhich forms swamps after thawing in summer. There ir no obviouswelling water, and streams exist. The lithological character of thestratum is simple. The ground surface is clayey sand and loam withst<strong>on</strong>es formed of Quatmary slopc wash and deluvium. Thebedrock is tuffy gravel rock <strong>on</strong> the granite is variscian.REGIONAL HYDROG-EOLOGYOwing to the artificial influences and the destructi<strong>on</strong> of vegetati<strong>on</strong>,thc permafrost in the upper fringe of the :UW ridge decreases,but there is permafrost in most parts of the ama. Therefore, theclassificati<strong>on</strong> and moti<strong>on</strong> of the ground water is limited bypermafrost. Based <strong>on</strong> this, the ground water is divided into twotypes: supcrpcrmafrort water and subpcrmafrost water.1183
The SUpcerpcrmafrost water which is affected greatly by mercntSEas<strong>on</strong>s is stored in the pores of the Quaternary unc<strong>on</strong>solidatedlayer and in the pores and crevasse of str<strong>on</strong>g weathering gravel. Aftcrthe seas<strong>on</strong>ally frost soil thaws, the water is directly supplicdfrom the rain and the meltcd water from ice and snow."he subpermafrost water is stored in the pores and ccvaw ofbedrock. The result of hydrogeological explorati<strong>on</strong> illustrated thatthe crevassc of badrock is developed and provides the c<strong>on</strong>diti<strong>on</strong>sfor the storing and flow of water. The subpermafrost water powsa c<strong>on</strong>fined character, because the fmzing layer is a water-mistinglayer. Moreover, because there is no permafrost in some areas, anda hydraulic relati<strong>on</strong> exists between the two layers. Analyzing thefigures of the c<strong>on</strong>tours of the water table and the iaoline of the ds~RC of mineralizati<strong>on</strong>, the main part of the two layers ofgroundwater ara drained away to Gulian River, another part to theground nurface from springs and forms icings in the winter.The distributi<strong>on</strong> of ground water is homogeneous due to theUneven distributi<strong>on</strong> of clay c<strong>on</strong>tent. Some run off channels formwhere the day c<strong>on</strong>tent is small and the water is rich. Most of thechannels have a linear distributi<strong>on</strong> from south to north. So that dishibuti<strong>on</strong> of ground water has the character of linear enric%ent.SOLVING - METHODn.zI *- 1-N4Based <strong>on</strong> the hydrogeological c<strong>on</strong>diti<strong>on</strong>sand analysis of variousfactors, the reas<strong>on</strong> that the icing forms in the foundati<strong>on</strong> is thelinear enrichment of the ground water due tQ the unev<strong>on</strong>ly distributed clay c<strong>on</strong>tent. The amount of the run-off of the ground wateris large and c<strong>on</strong>fined. At the same time, the excavati<strong>on</strong> of the foundati<strong>on</strong>of the residential buildings changes the layer into a weakbelt. This provides the drainage c<strong>on</strong>diti<strong>on</strong> for the ground waterthat directly flows to the basel pit. The superpermafrost water issupplicd c<strong>on</strong>tinuously from the subpermafrost water because of thehydraulic c<strong>on</strong>necti<strong>on</strong> between the two layers of groundwater.Afterthe temperature becomes negative, the icing gets larger and larger.In view of this situati<strong>on</strong>, we proposed a treatment method oflowering the ground water table. In July of the next year, anunwatering hole was excavated which was about 15m apart fromthe icing. The beginning diameter of the hole was 420mm, the enddiameter was lROmm and its depth was 120m. From the explora.ti<strong>on</strong> results, the distributi<strong>on</strong> of the ground water al<strong>on</strong>g the depth ismainly pore phreatic water of the Quaternary unc<strong>on</strong>solidattd layerabove 3m, pun and crevasse water in the weathering laycr from 7rnto IOm and ground water in tho bedrock crevasse and tect<strong>on</strong>ic crevasse from 70m to 90m. The ground water began to bc withdrawn12 houn each day <strong>on</strong> the 13th of August. The amount of wellingwater was 33 t<strong>on</strong>s each hour. A recording of the unwatering is liat.ed in Table 1 and the coresp<strong>on</strong>ding figures are shown in Figure 1.The sketch figure of lowcring the ground water table is shown inFigure 2. Three m<strong>on</strong>ths latcr, a linear withdrawing hopper formedthat was 300m from south to north and loOm from cast to west.D e decreased depth in the center was 2Sm.It was found during the withdrawing that phreatic water in thepres of the Quaternary unc<strong>on</strong>~~lidatcd layer was rich in.Septmbcr.and October. and the ground water in the poroa and crevasse of theweathering layer between 7m and 1Om became the main supply afterNovember. The large hopper formed around the residential; ; ; , *,Fig.2 The scheme diagram of the loweringground water tableTable 1 Record of withdrhinglastingtime(min.)groundw a t e rIevel(m)0.0 0.06.0 8.2620.0 14.2840.0 15.8060.0 16.90120.0 19.40180.0 21 .OS360.0 24.PO540.0 26.3 I1184
uildings was c<strong>on</strong>trollcd effectively by drainage of ground waterand by cutting the supply water of the icing, so that the icing didn'tform. At the same time, due to the decrease of the ground water inthe soil and the water c<strong>on</strong>tent reducti<strong>on</strong> from 17-24% to about12%, the frost heaving greatly decreased.EFFECTS AND - PROBLEMS"" ".Since the foundati<strong>on</strong> of the residential building in Gulian rniningarea was treated by withdrawing, there has not occurred anywelling water and icing. Therefore, the engineering geological c<strong>on</strong>diti<strong>on</strong>sin thc area, located <strong>on</strong> the footslopc that easily causes frostheave, are greatly improved. The susceptibility of the frost heave ofthe foundati<strong>on</strong>s decreases clearly and the safety of the residentialbuildings is ensurcd. Bccause the method is a radical treatment, theeffect is stable.Higher expense is the disadvantage of the method. But aftermaking the well better, it becomes a tubular well to supply waterfor boilers and for drinking.CONCLUSIONS ...Through treating thc frost heave of foundati<strong>on</strong>s in DaHingganLing and other regi<strong>on</strong>s, it is c<strong>on</strong>sidered that the frost heave causedby the rich groundand surface water can be solved ty artificiallylowering the ground water table. The extent of the lowered groundwater table should be in the state that the water c<strong>on</strong>tent of soil inthe range of the capillarity is less or slightly higher than that of theinitial frost heaving. In general, the ground water table is 2rn lowerthan the frost depth. Through many c<strong>on</strong>trast tests, it is known thatlowering the ground watcr table should begin a m<strong>on</strong>th before thesoil freezing, which is from the beginning to the middle of Scptcmbcrin Da Hinggan Ling regi<strong>on</strong>. Therefore, there is enough time todecrease the water c<strong>on</strong>tent after the fround water table is lowered,the small water c<strong>on</strong>tent is ensured when the soil freezes and thewas<strong>on</strong>ally frozen soil freezes, which runs from the middle of Deamber. to January.The problem that is has a higher expense is solved by using thewithdrawn water €or boilers. Therefore, a well can be used formany aspects. It not <strong>on</strong>ly treats the frost heave of foundati<strong>on</strong>s, butalso keeps the water supply. The cost of the well will be decreasedand a good ec<strong>on</strong>omic benefit is obtained.REFERENCEST<strong>on</strong>g Changjiang and Guan Fennian (1985) Frost Heave of Soiland Preventi<strong>on</strong> of the Frost Damage to Building. Published byHydroelectricity.Jin Junde (1988) IceLake and Protecti<strong>on</strong> Informati<strong>on</strong> <strong>on</strong> ForestryScience ane Technology (Translated Proceedings), Vol. 10.Yang R<strong>on</strong>gtian and Lin Fent<strong>on</strong>g, 1986 Hydrogcology and EngineeringGeology in <strong>Permafrost</strong> Regi<strong>on</strong>s, Published byNortheast Forestry University.1185
THE GEOGRAPHIC SOUTHERN SOUNDARY 0F.PERMAFROST IN THE,NORTHEAST OF CHINA," 1Lu Euowei', W&dg Binlin' and Guo D<strong>on</strong>gxing2'Da Hinggan Ling Institute o f Fqrestati<strong>on</strong>, Inner M<strong>on</strong>golia'Lanzhou Institute of Glaciology and Geocryology,Chinese Academy of Sciences<strong>Permafrost</strong> has wide distributi<strong>on</strong> <strong>on</strong> the Hulunbeier Plateau and the S<strong>on</strong>glengplain, and in the forest regi<strong>on</strong>s of the Da Hinggan Ling and Xiao Hinggan Lingranges, in the northeast of China. It's geographic southern boundary has bee-ndecided. based <strong>on</strong> the abundant data obtained. The.southern boundary distributi<strong>on</strong>of permafrost is characterized by the integrated influences of geographicallatitudes and regi<strong>on</strong>al natural c<strong>on</strong>diti<strong>on</strong>s. However, the southern permafrostboundary has been moving northward because of the serious destructi<strong>on</strong> of naturalflora due to the frequent human activity during the last century. The <strong>on</strong>lyrelative stable northward-movement of the boundary occurs in the permafrostregi<strong>on</strong>s inside forest areas where the frozen ground is in a natural envir<strong>on</strong>mentwith most favourable forest restorati<strong>on</strong>.ISTOBIC OUTLINE OF THE DIVISION OF THE SOUTHERN{ERMAFROST BOUNDARYScientists have tried to decide the southernboundary of permafrost in the Da Hinggan Lingand Xiao Hinggan Ling ranges since the 19thcentury. For instance, A.Q. Migandolf (1864),M.N. Shumkin (1940), and others have given theThe frozen ground in the northeast of China,has a total area of 38 to 39x10'km2. The formati<strong>on</strong>,distributi<strong>on</strong> and development are influenced. southern boundar.4es in the geographical map Ofby the geographic latitudes and regi<strong>on</strong>al naturalc<strong>on</strong>diti<strong>on</strong>s, and is the southern extensi<strong>on</strong> of whichpermafrost z<strong>on</strong>es in the northern hemisphere, ofsix boundaries were outlined through thepermafrost <strong>on</strong> the high latitude Euroasian c<strong>on</strong>tinent.It can be divided into three types, withDa Hinggan Ling and Xiao Hinggan Ling rangesa range of latitude from 44' to 52'N (Fig.namely: large-sheet, island-melting, and islandl), which have important differences from thepermafrost, with latitude variati.<strong>on</strong>s and accord- real situati<strong>on</strong> in these regi<strong>on</strong>s.ign to the c<strong>on</strong>tinuity of its distributi<strong>on</strong>After investigati<strong>on</strong>s of frozen ground in(Table 1). In the island permafrost z<strong>on</strong>e, it ' these regi<strong>on</strong>s, Chinese geologists, e.g. Xing'QqVelops better in lower lands than <strong>on</strong> slopes Kuide and Ren Qijia(1956), indicated that theand it hardly exists <strong>on</strong> mountain tops. This southern boundary of permafrost in the twoshows Chat the regi<strong>on</strong>al natural c<strong>on</strong>diti<strong>on</strong>s have ranges traces through Artika, Hudukeand Tat0a significant influence. There are very sparse Aili in M<strong>on</strong>golia into Nan Hipgan, Buteha Qi,. distributi<strong>on</strong>s or no distributi<strong>on</strong> of permafrostsouth Paligen, Dedu and Shajindi of Dulu Riverin the area of the southern boundary (Zhou Youwu in China, and then crosses the Aeil<strong>on</strong>g Jianget el., 1981). River into the Uni<strong>on</strong> former (Fig.1). This SovietTable 1. Distributi<strong>on</strong> Types and the Characteristics of the Frozen GroundType of petmafrost z<strong>on</strong>a Divisi<strong>on</strong> characteristics C<strong>on</strong>tinuity ( X ) Coefficient of interrupti<strong>on</strong>Large-sheet permafrost Large-sheet 65-75 c<strong>on</strong>tinuous0.65-0.75Island-melting permafrost c<strong>on</strong>tinuousDisc<strong>on</strong>tinuous50-6540-500.50-0.650.40-0.50Island 20-40 ' 0.20-0.40Island permafrost z<strong>on</strong>e Sparse island 5-20 I 0.05-0.20Very sparse island (5 (0- 051186
(l-0.3x10⁴years B.P.), the permafrost retreatednorthward to Jinling and Gangyuan <strong>on</strong> the northpert of the Da Hinggan Ling range, and to thenorth side of Yilihuli Mountains. The permafrostat present was formed in the Neo-Ice Age, 3000years B.P.. which was a result pf the expansi<strong>on</strong>of the remnant permafrost and the restorati<strong>on</strong>of frozen ground in the melting areas, as wG11''as climate colling (Guo U<strong>on</strong>gxin, rpt al., 1981).These factors dem<strong>on</strong>strats that the southernpermafrost boundaries have advanced southwardand retreated northward several times due toclimate changes since the permafrost formati<strong>on</strong>in the Late Pleistocene (Fig.2).Fig.1 The Historic Outline Diagram of the Southern<strong>Permafrost</strong> Boundary in Da and Xiao HingganLingboundary c,orresp<strong>on</strong>ds to the annual average O°Cisotherm or to the January mean atmospherictemperature -24°C isotherm (Xin Dekui, et al.,1959). which is significant as a reference, aswell as showing the slight difference from theactual situati<strong>on</strong>.In the areas of Jiayin, Detu, Arshan andXinbarhu Youqi. dozens of separate field surveyswere carried out during Sept.-Nov. 1973 andduring May-July 1974. *The studies includedmeteorology, hydrology, geology, geomorphology,soil, paleobiology, botany, geocryology, glaciology,and periglaciology. At the present timethe southern boundary of permafrost has beeninitially based <strong>on</strong> the large amount of informati<strong>on</strong>obtained in the above menti<strong>on</strong>ed expediti<strong>on</strong>s.It has also been adjusted after two furtherexpediti<strong>on</strong>s to the areas of the Da Hinggan Lingand Xiao Hinggan Ling ranges, Hulunbeir grassland,Charigbaishan Mountains and Hua'ng Ganglingterritory, etc. These expediti<strong>on</strong>s were carriedout with practical research in mind, to studythe l<strong>on</strong>g boundary of 1300 km and complex variati<strong>on</strong>sof natural c<strong>on</strong>diti<strong>on</strong>s, as well as the needto understand the basic features of permafrostdistributi<strong>on</strong> and fluctuati<strong>on</strong> tendencies of thesouthern boundary in the last century.THE BASIC CHARACTERISTICS OF THE DISTRIBUTION OFTHE SOUTHERN PERMAFROST BOUNDARYSince the Late Quaternary, the permafrostdistributi<strong>on</strong> has been expanding and shrinkingas a result of climatic changes in the Ice Agesand Interglacial period, For example, during theGuxiangtun cold period of the Late Pleistocene(7-lxlo'years B.P.-Wisc<strong>on</strong>sin Ice Age), thepermafrost expanded southward in the Da HingganLing and Xiao Hinggan Ling ranges and has beenproven to be close to the average present annualaverage isotherm of 7-8°C al<strong>on</strong>g the boundarylinked with Aohan pi, Ganqika and Shuangliao,to the south 6f Xila Mulun River, and extendedeastwardly to Panshi, Huinan, Dunghua, etc,After that, in the warm period of the HolocenedFig.2 The Historic Evoluti<strong>on</strong>al Giagram of theSouthern <strong>Permafrost</strong> Boundary in the Northeastof China Since Late Quaternary Period1. The southern boundary of large-sheetc<strong>on</strong>tinuous permafrost now:2. The southern boundary of island-meltingpermafrost now:3, The southern boundary of island permafrostnow:4. The high-mountainous permafrost now;5. The southern boundary of permafrost inthe Late Pleistocene:6. The southern boundary of permafrost,in the' holocene high-temperature period;7. Rhinoceros tichorhmus fossil site:8. Mammoth fossil site;9. Fossil ice wedge:10. Hemiaric grassland:11. County,The western secti<strong>on</strong> of the southern permafrostboundary in the northeast of China iscomposed of southern boundaries of island meltingpermafro t, in Arshan Mountains, and in theisland permaTrost <strong>on</strong> the east slope of the DaHingpan Ling range and <strong>on</strong> the Hulunbeier Plateau.It was shown, after the expediti<strong>on</strong>s, that thepermafrost is sparsely distributed to the northside of Xingbarhu, Youqi, and Zuoqi regi<strong>on</strong>s,and no permafrost develops in the regi<strong>on</strong> betweenKelulun and Wurs<strong>on</strong> Rivers, <strong>on</strong> the island perma-1187
frost of Hulanbeier Plateau. Therefore, thesouthern boundary of permafrost east of M<strong>on</strong>goli'acrosses the upper course of Kelu River, andshould reach the boundary (Number 34) in theHulunbeier Plateau of China through Ba.Yangwulaand through Xinbarhu Youqi and Zuoqi al<strong>on</strong>g theHalaha River and come invertedly into the ArshanMountainous r'egi<strong>on</strong>. But, because the relief ofthe Arshan Mountains (above 700-1200 m) ishigher than the surrounding areas, the climateis very cold, the frozen ground is more developedand shows the vertical regi<strong>on</strong>al change. Thelower limit of the frozen ground links with thesouthern boundary of frozen ground in the HulunbeierPlateau,, as well as being to the south ofArshan Mountains and the east ern slope of DaHinggan Ling. That is to say, it extends fromthe Halaha River, the Arshan Mountains, Wuchagou,through to Chaihe, Namu. and to the north ofthe S<strong>on</strong>gl<strong>on</strong>g Plateau.The middle secti<strong>on</strong> of the southern permafrostboundary in the northeast of China is composedof the sduthern boundaries of the northern Dermafrostin the S<strong>on</strong>glpng Plateau. The altitude islower (200-400 meters), and has a plain relief.The soil is fertile and there is a river runningthrough the regi<strong>on</strong>. The permafrost and thenatural flora have a closely interdependentrelati<strong>on</strong>ship. In the last decade the lumber andagricultural producti<strong>on</strong> ranges have expandedand have caused the southern boundary of perma-'frost to cro8s south of the L<strong>on</strong>gjian River and *has developed to the south of Xiao Hinggan Ling.The boundary also,extends from the eastern slopeforest district into this district. The range 'isfrom the. north of Chaihe, Nanmu, Ar<strong>on</strong>qi, throughLaochai, Detu, etc., then into the southernmountainous regi<strong>on</strong>s of Xiao Hinggan Ling.The eastern secti<strong>on</strong> of the southern permafrostboundary, in the northeast of China, is composedof the southern boundaries of the low mountainsand hill regi<strong>on</strong>s of Xiao Hinggan Ling through tothe southern permafrost boundary of Da HingganLing. It has shrunk northward by two latitudesmore than that of the southern secti<strong>on</strong> of DaHinggan Ling. But, because the relief of thesouthern secti<strong>on</strong> of Xiao Hinggan Ling is higher(above 403-700 m,eters), the southern permafrostboundary in the north of S<strong>on</strong>gleng Plain extendsto the southeast. It also extends to the southernsecti<strong>on</strong> of Xiao Hinggan Ling, crosses the PingHeishan Mountains, Hei L<strong>on</strong>gjian River and intothe former Soviet Uni<strong>on</strong>. That is to say, theregi<strong>on</strong> is from the south of Detu. Qingan,Tianshan, Nancha, through the south of Jia YinRiver, to the opposite shore of the Hei L<strong>on</strong>gjianRiver to the Buleya Mountains.Because of the factors stated above, thesouthern permafrost boundary in the northeastof China is about 1300 kilometers l<strong>on</strong>g, itehasa western distributi<strong>on</strong> and is under the influenreof global climate, flora, relief, human activity.etc. Generally speaking, the western amplitudeof the southern boundary is the range of theannual average isotherm between 0 to '-l.O°C, themiddle secti<strong>on</strong> is in accordance. with the isothermO'C, and the eastern secti<strong>on</strong> crosses between theisotherm 0 to l.O°C.THE RECENT CHANGING TREND OF THE SOUTHERN,PERMAFROST BOUNDARYIn the'last century, the change of thesouthern permafrost boundary of Da Hinggan Lingand Xiao Hinggan Ling has had a close relati<strong>on</strong>shipwith the frequent human activities and the- .increasingly warm climate. According to the-...statistics of Han Sen and others (1987), sincethe last century the global mean atmospherictemperature has risen 0.5'C -every year, from1880 to 1940. From 1940 to 1965 it decreased by0.2'C and fror 1965 to 1980 it rose by 0.3"C.From the observati<strong>on</strong>al data -it was found that1981, 1987, 1988 and 1990 were the four warmestyears, with a progressive rise in temperature(Li Peiji, 1991). This is in accordance with themeteorologic observati<strong>on</strong> data obtained fromSheng Yang and Harbin since 1906. In the lastcentury, disregarding the decreasing fluctuati<strong>on</strong>trend in the atmospheric temperature in 1969,generally speaking there has been a warmingtrend (Zhu Kezheng, 1972b. Thus.. because of thewarming trend of thh global climate and thefrequent human activity, such ai. the expandedrange of agricultural reclamati<strong>on</strong>, excessivegrazing.<strong>on</strong> grasslands, large scale lumbering,etc., there has been a'profound influence <strong>on</strong> thesoil, flora, climate, water c<strong>on</strong>diti<strong>on</strong>s, etc..of the regi<strong>on</strong>. These factors have caused then0rthwar.d' trend of the southern permafrostboundary in the last century.The Hulanbeier Plateau is <strong>on</strong>e of the semiaridregi<strong>on</strong>s in China. Because of the 8-9 m<strong>on</strong>thsof dry wind from M<strong>on</strong>golia the regi<strong>on</strong> is semiaridfor l<strong>on</strong>g periods. For examp$e, from 1958to 1962 the annual mean rainfall?.was 308.3 mm.in Xinbarhu Xiqi. From 1963 to 1980 it was220.5 mm. From 1980 to present, the yearly rainfallhas had a decreasing trend {in 1981 it wasOnly 141.5 mm). This seriously influences thegrowth of grass, particularly in Kerlun, Saihatala,Hanwula and in southwestern regi<strong>on</strong>s. Thearidity is very serious and because of theexcessive grazing the grassland regressi<strong>on</strong> andthe desertizati<strong>on</strong> phenomen<strong>on</strong> is increasing.Thus, in the permafrost of the-low ground and,in the moist z<strong>on</strong>e, thb temperature has risen(0 to 0.5"C) and the permafrost thickness hasdecreased ( 5 to 10 m) and the permafrost hasgradually vanished. The southern permafrostboundary has shrunk from the semi-arid regi<strong>on</strong>sto the semi-moist forests of the north and theeast. Therefore,, the l<strong>on</strong>g term aridity is <strong>on</strong>eof the main causes of the northward movement ofthe southern permafrost boundary in this regi<strong>on</strong>.The S<strong>on</strong>gleng Plain and the Hulunbeier Plateauextends to the south of Da Hinggan Ling, the zarea is about 17x104km2. The regi<strong>on</strong> has atemperate and semi-moist c<strong>on</strong>tinental m<strong>on</strong>so<strong>on</strong>climate. The rainfall can be as high as 400-500mm. From 1841 until 1897, in this regi<strong>on</strong>, theQing Government had three policies, no reclaiming,no hunting and no lumbering, so the naturalforest envir<strong>on</strong>ment was maintained. From 1897until 1945 there was a large influx of immigrantsfrom inner districts. the Bin*zhou Xailwaywas c<strong>on</strong>structed, and destructive lumbering wascarried out in this regi<strong>on</strong>. These factors causedthe lumbering range between Qiqihar and N<strong>on</strong>gjiancounty to be expanded and the natural flora was,destroyed. As well, the natural covering acti<strong>on</strong><strong>on</strong> the permafrost layer vani5he.d causing theseas<strong>on</strong>al freezing and thawing aepth to increase.The very sparse island permafrost started toshrink and vanish. In a few decades the southernpermafrost boundary of the regi<strong>on</strong> retreatednorthward more than two latitudinal degrees.The southern permafrost boundary in thesouthern secti<strong>on</strong> of Da Hinggan Ling has beenrelatively more stabilized in recent times, moreso than that of the Hulunbeier Plateau and theS<strong>on</strong>gleng Plain. The main reas<strong>on</strong> for this is the
c<strong>on</strong>trolling and influencing factors of thealtitude height. Thus, to some extent, thedistributi<strong>on</strong> of frozen .ground abides by the lawof vertical z<strong>on</strong>e properties. For instance, thelowest altitude height of the permafrost distributi<strong>on</strong>is about 800 m in the Artaishan Mountainsof Da Hinggan Ling, and there is also biennialfrozen ground <strong>on</strong> the slope bottom with a thickclayey soil layer in Wuchagou and Bailan. Withan increase in the altitude, the climate of theregi<strong>on</strong> gets colder and the frozen groundevelopsbetter. the frozen ground area is 40 to 50% ofthe total area of the regi<strong>on</strong>. The mean annual.ground temperature of the frozen ground is -0.5to -1.O'C. The thickness of the frozen groundia more than 20 to 30 m. Xinan Larix gmelini isthe main wood seed of the forest flora, whichis advantageous because the natural regenerati<strong>on</strong>is above 90X (Lu Guowei, 1989). We can assertthat, under the c<strong>on</strong>structi<strong>on</strong> policies offorestry the forest area will be graduallyincreased in China. To have the optimum naturalenvir<strong>on</strong>ment, the rate of the northward movementof permafrost must decrease and the southernpermafrost boundary must be stabilized.REFERENCESGuo D<strong>on</strong>gxin, et a1.;(1981) The <strong>Permafrost</strong>Historic Evoluti<strong>on</strong> and Formati<strong>on</strong> Period in.the Northeast of China Since Late Pleistocene,, Glacioloiy and Geocryology, Vo1.3, No.4.Li Peiji. (1991) Greenhouse Effect and ClimateChange, Glaciology and Geocryology, Vo1.13,N0.3.Lu Guowei, (1989), Xinan Pine Vegetati<strong>on</strong> andVariati<strong>on</strong> of the Ecalogical Envir<strong>on</strong>ment of<strong>Permafrost</strong> in Northeast China, The Proceedingsof.the Third Chinese <str<strong>on</strong>g>C<strong>on</strong>ference</str<strong>on</strong>g> <strong>on</strong> <strong>Permafrost</strong>,The Press of. Sciences.Xin Dekul et 81.. (1959) The Geological KnowledgeAbout the <strong>Permafrost</strong> Distributi<strong>on</strong> in theNortheast of China, No.10.Zhou Youwu, et al., (1980) <strong>Permafrost</strong> and IceEdge Geomorphology, the Natural Geographyof China (Geomorphology) The Press ofSciences.Zhu Kezheng, (1972) The Preliminary Study <strong>on</strong> theRecent Five Thousand Year Chinese ClimaticFluctuati<strong>on</strong>, Zhu Kezheng M<strong>on</strong>ograph, ThePress of Sciences.
ROAD DESIGN AND RENOVATIONS OF THE NORTH SLOPEIN DA HINGGAN LING!,uoWeiquanDesign House of Management Forest Bureau,Eer Guna Lift, InnerM<strong>on</strong>golia Aut<strong>on</strong>omous pegi<strong>on</strong>, China<strong>Research</strong> and practice have been carried out for many years to determine a methodof selecting the road line, renovati<strong>on</strong> against frost heave and thaw settlement,determinati<strong>on</strong> of embankment height, foundati<strong>on</strong> depth for bridge culverts,foundati<strong>on</strong> type, and preventing pingoes and icings. These methods have beenused in recent c<strong>on</strong>structi<strong>on</strong>s of roads in cities and towns, espe'cially in thedesign and c<strong>on</strong>structi<strong>on</strong> of c<strong>on</strong>crete pavement in secti<strong>on</strong>s with massive ice,measures are taken to choose a reas<strong>on</strong>able embankment height, dredging, pavingsoil material, protecting the'natural envir<strong>on</strong>ment and berm, enhancing thestrength of the pavement layer and base course, and to ensure that the 12 mwidth of c<strong>on</strong>crete road is safe for transportati<strong>on</strong> in cities and towns.INTRODUCTIONMengui Forest Bureau is <strong>on</strong> the north slope ofDa Hinggan Ling, the climate is frigid and theyearly- average temperature is below -5'C. Theextreme temperature is -54'C and th.e frost seas<strong>on</strong>is as l<strong>on</strong>g as 8 m<strong>on</strong>ths of the year, <strong>Permafrost</strong>has an extensive distributi<strong>on</strong> and is from severalmeters to around 100 m, but the large riverbedis talik. The Quaternary covering layer iscomposed of st<strong>on</strong>es with loam gravel, cobble soiland peat loam,stratum. The surface vegetati<strong>on</strong>is mainly a heavy growth of eriophorum tussock,and swamp ground is distributed in the basin andwide valley of the regi<strong>on</strong>. The largest depth ofseas<strong>on</strong>al thawing is from 0.5 m (peat secti<strong>on</strong>) to3.2 m (cobble and gravel, st<strong>on</strong>e secti<strong>on</strong>). Thepermafrost includes a large amaunt of ground ice.More than 350 km of road and 200 bridge :ulvertswere c<strong>on</strong>structed from 1960 to 1983. and mosthave some extent of frost damage. The damageis mainly shown in the n<strong>on</strong>-uniform subsi.denceof the roadbed, wrenching and inclinati<strong>on</strong> ofbridges and culverts, pingo and ice erosi<strong>on</strong> ofthe road and the formati<strong>on</strong> of potholes in thespring. This causes the ecological equilibriumto be destroyed as the buildings do not adaptto the natural envir<strong>on</strong>ment of frozen soil, aswell as the causes of unreas<strong>on</strong>able design andc<strong>on</strong>structi<strong>on</strong>. In general, in several m<strong>on</strong>ths oryears, deformati<strong>on</strong> or destructi<strong>on</strong> of the buildingaoccur. Roads change their original lineand culverts have to be renovated. The lightdamage needs to be repaired and prevented andthe cost of repairing 180 km of road is motethan two milli<strong>on</strong> Reminbi Yuan a year.ROAD DESIGN AND RENOVATION OF FROST DAMAGERoads and bridge culverts in the north slopeof Da Hinggsn Ling suffer damage due to thelarge amount of ground ice in the permafrost.plentiful surface water and groundwater,suitable freezing c<strong>on</strong>diti<strong>on</strong>s, and loam sto'neswith str<strong>on</strong>ger frost heave sensitivity, etc. Roaddesigns and methods for renovating the frost 'damage should take into account the abovementi<strong>on</strong>ed factors, For the north slope regi<strong>on</strong>of Da Hinggan Ling, the renovati<strong>on</strong>s of frostdamageshould stress the aspects of drainage ,water, heat preservati<strong>on</strong> and the filling soilused in the past. Combined with choosing theline, design and renovati<strong>on</strong> can often be moreeffective.Choosinn the LineThe north slope of na Hinggan Ling is mainlya hilly land of middle-low mo,;ntains; The roadoften crosses the basin,and valley. Whenchoosing the line in the permafrost regi<strong>on</strong> withthese natural c<strong>on</strong>diti<strong>on</strong>s, the basic designprinciples are: sufficient filling and littleexcavati<strong>on</strong>, selecting a high site and avoidinglow sites. The-line in the,hills should have ahigher site, and cross from the top of the lowpitch in fr<strong>on</strong>t. of the mountain, and a sunexposed site' is preferable. When built al<strong>on</strong>g .the river valley, a high terrace and river talikshould be chosen. Based <strong>on</strong> selecting the lineand investigati<strong>on</strong>, poor geological secti<strong>on</strong>sshould be avoided when possible. The lineshould cross the embankment in the upper fr<strong>on</strong>tof the massive ice secti<strong>on</strong> or in the lower partof the thaw slumping body. The possibility ofchanging hydrogeological c<strong>on</strong>diti<strong>on</strong>s in the roadshould be prevented in the regi<strong>on</strong>s where groundwater exists, surface water should besdredgedand the roadbed peripher-y should be kept dry.Design and c<strong>on</strong>structi<strong>on</strong> should protect thenatural envir<strong>on</strong>ment of permafrost and theecological equilibrium. Designs of bridgeculverts, except for the flood table area withthe largest flow amount, jammed height of pingoand icing and foundati<strong>on</strong> handling should bec<strong>on</strong>sidered. In recent years, the above mentf<strong>on</strong>edprinciples have been used when choosing the
line and design and the frost damagegreatly decreased.of roads hasRoadbed EngineeringFillinn heiRht of embankment: A larRe amountof investigati<strong>on</strong>s and testing have shoin thatthe minimum filling height of the embankment inthe regi<strong>on</strong> of the north slope of Da Hinggan Lingis determined by using the following experienceequati<strong>on</strong>:H = h, t hc (1)where H - embankment height (m)hi- dry soil thickness of embankment (m)in general hl=0.6 mhc- dangerous capillary height of roadbedso.il. (m)- ,The relative soil types and degrees af compacti<strong>on</strong>are given in Table 1.THE MEASURES OF WATER DRAINAGE AND STOPPAGEA water stoppage ditch, water drainage ditchand retaining waLl are often used to drainsurface water in road engineering. A blankditch and water penetrati<strong>on</strong> ditch are used todrain ground water or decrease the ground watertable. The drainage ditch should be kept adefinite diatance from the slopefoot of the roadbed.The di'stance can not be less than 1.5-2.0min general c<strong>on</strong>diti<strong>on</strong>s and the drainage ditchmust be c<strong>on</strong>solidated to prevent penetrati<strong>on</strong> andto have enough vertical gradient. A taperedgutter to preserve heat should be set up toavoid pingo and icing from formilg. When theground water table is higher an insulating layershould be set up to insulate the ground water(see Fig.1)Table 1. Dangerous capillary heightof types of roadbed soil (m)Soil typeCompacted soj.1approaching optimunwater c<strong>on</strong>tentSoil of airSoil of~ ~ n<strong>on</strong>-compacted~ ~ ~ c ~SandSandy loamSi 1 t,LoamClay0.100.200.500.400.400.200.300.20 - 0.600.30 - 0.601.0 - 1.20 0.80 - 1.500.80 1.50 - 2.000.80 1.50 - 2.00W-e,tiv1c,O I layer of seperutinglayer of penetrating waterI original ground surfaceFig.1Insulating layer structure of roadbedROADBED WITH FROST HEAVE AND THAW SETT1,EMENTThe handling of roadbeds with frost heave inthe north slope of Da Ilinggan Ling often usesthe method of changing the soil, gravcl soil,cobble gravel and medium coarse sand are oftenused instqad of frost heave soil, the replacementsoil should be less than 809: of the maximumdepth of freezing. The road after the soil hasbeen changed must meet the demands of strengthand water insulati<strong>on</strong>. Thc heat preservati<strong>on</strong>method is chiefly used in the secti<strong>on</strong>s withmassive ice, eriophorum tussock at the locati<strong>on</strong>can be used HS the heat yreservat.i<strong>on</strong> material.One layer is paved in the original surface andberm with heat preservati<strong>on</strong> is c<strong>on</strong>structed (Fig.2).Except for increasing the heigh~ of the roa&bed (minimum value is 1.2 m), the measure ofdraining insulating water is used in the c<strong>on</strong>creteroad i n the town of Yengui. Three layers ofsoil are used as a cushi<strong>on</strong> in the bottom of thepavement, and undcrneath, 15 cm of soil materialis added. This method not <strong>on</strong>ly enhances theacti<strong>on</strong> hut also quickly diffuses water so thatthaw settlement. cannot be produced in thesecti<strong>on</strong>s of massive ice (Fig.3). It is alsoc<strong>on</strong>sidered impurtant in protecting the naturalsurface beside roadbed. The ground surfacewithin thc range of 10-15 m of the ruadhed cannot have its general c<strong>on</strong>diti<strong>on</strong> destroyed. Zheng 'Yang road was c<strong>on</strong>structed with this method andbasically no changes have occurred from 1987 topresent,PINGO AND ICTNG PREVENTIONI'xcept. for the naturally forming pingoes andicings, pingoes icings and some small risingpingoes are caused by the changing movement lawof ground water after the road c<strong>on</strong>sti-ucti<strong>on</strong> clrrthe nor~herrr slope z<strong>on</strong>e uf lla flinggan Ling.The drainage ditch and freezj.ng ditch aregenerally installed above the embankment toblock and drain ground water, meanwhile enoughfield accumulated ice remained for the emhankmcntor blank ditch for penetrating water, torlec.rease the pressure and hea~ preservati<strong>on</strong>, re1191
}xi/berm of heatembankment of loam\ preservati<strong>on</strong>inverse putting tatou tussockFig.2 The secti<strong>on</strong>of heat preservati<strong>on</strong> embankment300 1200 1\50Fig.3 Sketch mapof cross secti<strong>on</strong> <strong>on</strong> c<strong>on</strong>crete roadbed in YenguiembankmentFig.4 A sketch map of a pingoinstalled in the upper part of the embankmentto divert ground water to the lower part of theembankment, Engineering renovati<strong>on</strong>s at manysites show the effect of the blank ditch forpenetrating water, decreasing pressure and heatpreservati<strong>on</strong> is very good, Success or failureof this measure depends <strong>on</strong> the heat preservati<strong>on</strong>and drainage c<strong>on</strong>diti<strong>on</strong>s.BridRe Culvert EngineerinqMost of the bridge culverts were provisi<strong>on</strong>alwood structures and-have been changed toc<strong>on</strong>crete structures to meet road standards.Frost damage of the bridge culvert is mainlyshown to be an upfreezing of objects causingsubsidence'and wrenching inclinati<strong>on</strong>. A deepfuundati<strong>on</strong> is used for the pit foundati<strong>on</strong>. Formeeting the design demand for the bridge pileof roads its embedded depth H is determined bythe following equati<strong>on</strong>:H - 2nrhoT-PZtrrfThe expanding column foundati<strong>on</strong> of reinforcedc<strong>on</strong>crete exploded short pile and pilot pile areused in shallow foundati<strong>on</strong>s. Practice shows ''that the effect of preventing frost heave withpilot pile foundati<strong>on</strong> is better. One layer ofheat preservati<strong>on</strong> needs to be paved, as well asthe sand cushi<strong>on</strong> undet the foundati<strong>on</strong>, in orderto prevent hear transfer of the foundati<strong>on</strong> andthe preventi<strong>on</strong> of frost heave of the foundati<strong>on</strong>is enhanced, as with soil changing the chemicaladditi<strong>on</strong> is used to enhance the hydrophobicityof the subsoil.CONCLUSIONTo summarize that menti<strong>on</strong>ed above, the prevcntativesteps against froat damage and comprehensiverenovati<strong>on</strong> of damages are used with thelocati<strong>on</strong> c<strong>on</strong>diti<strong>on</strong>s for a better effectiveness.1. The main methods of protecting the roadbedstability are that the envir<strong>on</strong>ment in the permafrostregi<strong>on</strong> should be protekted, and theembankment height should meet the criticalheight.2, Effective drainage, the better form ofdrainage ditch is with a shallow width andmultiple dams.3. Choosing coarse soil for c<strong>on</strong>structing theroad and using soil material to quicken thewater drainage and enhance the roadbed.4. Reas<strong>on</strong>ably choosing the line and c<strong>on</strong>structi<strong>on</strong>method ensures roadbed stahility in permafrostregi<strong>on</strong>s.where r pile radius (cm)h - maximum thaw depth (cm)+ OT tangential frost heaving force (kPa)'fnormal fr.ost heaving forces (kea)P - surcharge load (kN)1192
PRACTICE OF REINFOHCED CONCRETE STRIP FOUNDATIONIN PERMAFROST REGIONSMen ZhaoheAmuer Design Housc Forestry Rureau, Management Bureau ofDa Hinggan Ling, Heil<strong>on</strong>gjiang, ChinaIn A~nuer permafrost regi<strong>on</strong>, various of building foundati<strong>on</strong>, for example, rubblefoundati<strong>on</strong>, rubble-sand pad foundati<strong>on</strong>, c<strong>on</strong>crete foundati<strong>on</strong> with sand pad, piletoundati<strong>on</strong>, and reinforced c<strong>on</strong>crete strip foundati<strong>on</strong> have been used. It is provedthat the former three types uf foundati<strong>on</strong>s are not approp'riatc to be built inpermafrost regi<strong>on</strong>. The designing principal of reinfore c.<strong>on</strong>crete strip foundati<strong>on</strong>permils t.he foundat.i<strong>on</strong> ground t.o thaw, that is the irost state of foundati<strong>on</strong>ground is unc<strong>on</strong>sidcrable. 'l'he mechanical properties, such as, bend, shear,Lensiorl and deformati<strong>on</strong>, can be complete1 y c<strong>on</strong>tributed. According to variousfrost henving soil and the depth of maximum thawing plate, the depth of sand padand the secti<strong>on</strong> size of base (mainly the height of base) are designed andcalculated. Meanwhile, hy adopting relevant: technical measurements,'suEficientrirlidity and strcngth of the structure of base and upper soil are assured, so asto resist various stress and uneven settlement of frozen ground foundati<strong>on</strong> duringfrost heaving and thawing.based <strong>on</strong> thc engineering informati<strong>on</strong>, corresp<strong>on</strong>dingmeasures are taken such as reinforcement andAmuer Forestry Rureau is located in the north t.rying to restrengthen and restabilize theof na Hinggrrn Ling, about 52"15'-53"34'N,destroyed frozen soil subgrade. If the subgrade122"39'-124"14'E. The total area of the regi<strong>on</strong>has normal or str<strong>on</strong>g thaw settlement, fissuresis 5576.06 km'. It belungs tu a hilly regi<strong>on</strong>for settlement and girds are set up to reinforceand the altitude is 80011000 m. <strong>Permafrost</strong> hasthe integral rigidity of the building in thean extensive distributi<strong>on</strong> and the largest thick- sand cushi<strong>on</strong> in designed thickness under theness of permafrost is about 50-80 m. The yearly bottom of foundati<strong>on</strong>. The calculated thicknessuvcrage temperature is -3.8 - -6.3"C, the freez- of the sand cushi<strong>on</strong> is based <strong>on</strong> the followinging index is 3810 day OC, The extreme lowestformula:temperature is -49.7"C, the highest temperatureis 35OC. The average ground temperature is -1.0'12- -4.2"C. 'Thc winter is as l<strong>on</strong>g as 7.m<strong>on</strong>ths andthe summer is about 5 m<strong>on</strong>ths. 'The yearly preci- where - additi<strong>on</strong>al stress of sand cushi<strong>on</strong>pitati<strong>on</strong> is 397.70 mm. The maximum depth ofbottom (kg/cm')accumulating snow is 36 cm. The seas<strong>on</strong>ally.. I'C - self-weigRt stress of sand cushi<strong>on</strong>thawed depth is 1.0 m in the permaErost regi<strong>on</strong>bottom (ky/cma)with vegetati<strong>on</strong>,IR1 - bearing allowance of soft layer atcushi<strong>on</strong> bottom (kg/cm')REINFORCED CONCRETE STRIP FOUNDATIONAccording to the abservati<strong>on</strong> of base in thepast, the causes of fissures and deformati<strong>on</strong>are due to three aspects.1) The foundati<strong>on</strong> is not stable, and thedeformati<strong>on</strong> of freezing and thawing is no.tuniform.2) The rigidity of the base is not str<strong>on</strong>genough to prevent various styesses'from deformati<strong>on</strong>in the frozen soil foundati<strong>on</strong>, such asbending stress, tensile stress, shear stress,etc.3) The foundati<strong>on</strong> type and embedded depth arenot reas<strong>on</strong>able.The t'hree aspects are analyzed as fo.llows:1. DesiRn Principle of Frozen Soil Subnra"deThe subgrade is designed without c<strong>on</strong>sideringthe depth of frozen soil under the foundati<strong>on</strong>and the effects of the freezing state of thesubsoil and the effects of gradual thaw. Then2. Desidn of Foundati<strong>on</strong> RigidityTn order to increase and reinforce the rigidityof the foundati<strong>on</strong>, the following steps aretaken:1) Material with the best mechanical propertiesis chosen for the foundati<strong>on</strong> to reinforcethe c<strong>on</strong>crete.2) The strip foundati<strong>on</strong> is chosen because thepressure of the subsoil is small and uniform andthe thickness of the bearing stratum can bedecreased for this fouhdati<strong>on</strong> type.3) The foundati<strong>on</strong> secti<strong>on</strong>al shape chosen isthe inverse "T" shape or the "I" shape secti<strong>on</strong>which have a large bending rigidity.4) Checking the calculati<strong>on</strong> of wall ridigity.The height of the c<strong>on</strong>crete foundati<strong>on</strong> (h) ischanged into the height of the brick b<strong>on</strong>dingbody H., and is the following:H, = 0.9h'- (2)1193
After the c<strong>on</strong>verted height is Calculated, theintegral rigidity of the wall is accounted foraccording to L/H
thus, Hp15.51 m, Hs=11.91 m (Fig.2). LF=22 m,Ls=27 m, then:L~/H~=1.42
thus: As-z'-28.4-20.4=7.6 cmP=AslLs=7.h/2703
A MICROSTRUCTURE DAMAGE THEORY OF CREEP rN FROZEN SOILMia0 Tiandc'p2, Wei Xuexia ', Zhang Changqing''State Key Laboratory of Frozen Soil Engineering, LIGG,CAS,China'Lanzhou UniversitvIn the paper damage mechanics was used into mechanics of frozen soil to study the infer relati<strong>on</strong> bctweencrbcp deformati<strong>on</strong> and it change of microstructure. Based <strong>on</strong> a series of creep test of frozen soil,and also observated its change of microstructure by "Duplicati<strong>on</strong>-electr<strong>on</strong>microscopd' method. Wec<strong>on</strong>sider that the sticky force of ice rcmaincd in frozen soil, the dcgrcc of directi<strong>on</strong>al of mineral grain andthe area damage (include the produsti<strong>on</strong> of microcrackle and its later extensi<strong>on</strong> c<strong>on</strong>trol) the whole creepprocess. So analysis in theory, we start at the basic equati<strong>on</strong>s of c<strong>on</strong>tinuum mechanics, introduce the icec<strong>on</strong>tent in frozen soil. The factor of damage area and the factor of arca .occupied by directi<strong>on</strong>al mineralgrains as the three internal variables which characterizc the change of microstnrcturc of frozen soil.NI"I'ODUCTI0~Crccp is <strong>on</strong>e of the most important mechanical behavior offrozen soil. Sincc 1930, when Tsytovich (1930) published the firstpaper <strong>on</strong> the subject, many investigati<strong>on</strong>s have been reported. Sewera1 theories to explain creep in frozcn soil were forwarded,most ofthese studies were based <strong>on</strong> the macroscopic tests. However, because the complexity of the microstructi<strong>on</strong> changes, and sensitity toternpreture, these very facts make it very difficult to study the creepmechanics at microscopic level.In 1967, S. S. Vyalov(ACPEL,1952) reported his first observati<strong>on</strong>of the microstructure changes of frozen soil in creep process.He used "area" and "orientati<strong>on</strong>' factors -I- to characterize themicrochanges. This might be the initial c<strong>on</strong>siderrati<strong>on</strong> ofmicrostructure damage in studying behavior of frozen soil. Sincethen, no significant progress was made in the area. there isn't anyrelated published work in china.In past few decades darnage mechanics as <strong>on</strong>e of the disciplinesof solid mechanics was been firmly founded, and has beensuccessfully applied in many scientific fields. In light of the damagemechanics, we have studied the relati<strong>on</strong>ship bctween crecpdeformati<strong>on</strong> and the microstructure changes of frozcn soil. Limitedby the paper length, <strong>on</strong>ly part of theoretical analysis is given in thispaper. Experements results will be reported in separate paper.Through a series of creep tests and microstructure obvervati<strong>on</strong>by so called "duplicati<strong>on</strong>-eletromicroscope" technique, we foundthat the cohesive force created by ice, the orientalizati<strong>on</strong> of soilgrains, and the creatati<strong>on</strong> with irs late extensi<strong>on</strong> of microcrack c<strong>on</strong>trolthe whole process of creep in frozen soil. Starting from thesebasic points, we dcvcloped a 3-dirncnsi<strong>on</strong>al damage theory for thecreep deformati<strong>on</strong> in reference to the principles of c<strong>on</strong>tinuum mechanics and the frame of damage mechanics.A detailed analysis has been made for the case of uniaxialcompressi<strong>on</strong>, a predicti<strong>on</strong> cauati<strong>on</strong> for the l<strong>on</strong>g-term strength hasbeen dcrived. The theoretical curves correlate with the corrc.sp<strong>on</strong>ding test <strong>on</strong>es.~-BASIC " EQUATIONS OF CONTINUUM .DAMAGE MECHANICSwhen we treat frozen soil as a c<strong>on</strong>tinuum medium, the followingequilibrium and thermodynamic restricti<strong>on</strong>s should be satisfied:9 + (PV,), = 0 C<strong>on</strong>servati<strong>on</strong> of mass (2-1)atuk,J + P(f, - G t) = 0 Balance of momenta (2-2)uk, = nk Balence of moment of momentum (2-3)Pi - gktdlk - qhk == 0 C<strong>on</strong>servati<strong>on</strong> of energy (2-4)P4 - (qk @,a 0 Principle of entropy (2-5)wherep-- the mass density;vk--- the comp<strong>on</strong>ent of displacement velocity, k= 1.2,3;ukI--- the comp<strong>on</strong>ent of stress tensor; .:'fk---- the cornp<strong>on</strong>cnt of the body rorcc per unit mass;dk,-"-- the comp<strong>on</strong>ent of strain velocity tensor;q,---- the comp<strong>on</strong>ent of the heat vector per unit area;e--- the intcrnal energy'density per unit mass;1"- the entropy density;8" the absolute temperature.dIn additi<strong>on</strong>, ()=-( ) indicates the differentiati<strong>on</strong> with 10-dispect to time t.Introducing the free-energy functi<strong>on</strong>1197 9
10)INTERNAL VARIABLES DESCRIBING THE",l.__l_.-_"IMICROSTRUCTURE DAMAGEand thinking rp is the functi<strong>on</strong> of elastic strainei, , temperature0 and internal damage variables uicp = rp(e;17@yi) (2- 7)Substituting (2-6), (2-7) into (2-5), and using (2-4), we obtainBy the method of "duplicati<strong>on</strong>-eletr<strong>on</strong>microscope", themicrostructure of frozen soil has been observed at different crcepstages. Examining result of our observati<strong>on</strong> and refering toVyalov's work, we chose three internal variables which are mostimportant to characterize the microstructure change in the CrCCpprocess.1) The cohesive force of ice in frozcn soil plays a key role in thedclormnti<strong>on</strong> of frozen soil. So we chboseHere we uscwhere e: is the plastic strain.Because rp, 1 , u,,and q,arc independent ofinequality (2-8) can't be maintained unless:b >i;k and i,,, theto be <strong>on</strong>e of the internal damage variables.Where:p---- thc mass density of frozen soil;P(i)" the mass of ice in unit volume of frozen soil.Following Vyalov's work, we introduce(3 - 2)the factor of damaged area.(2 ~(3 - 3)andAssuming(2-1 I) becomes(2- 11)(2 - 12)oklk: + Aji 20 (2 - 13)One of the methods to handle (2-1 3) is to choose a functi<strong>on</strong>aldissipativcpotcntial,F=W,,,A,) (2 - 14)The hypersurface expressed by (2-14) should be c<strong>on</strong>vex, thisleads tothe factor of oriented area of mineral grainas the other two intcrnal damage variables. where w definesthe area damaged by the microcack and its extensi<strong>on</strong>, while n represents thc area occupied by the oriented grains.A,---- the effective area <strong>on</strong> which force acts;A,----- the area which mineral grain are not orientalized;A,---- the initinal area.Let a, = t"', = a, a,= w, then a,(i= 1,2,3) are theinternaldamage variables, and Ai(i = I ,2,3) which menti<strong>on</strong>ed before, are thecorresp<strong>on</strong>ding thermodynamic force of ai.A YIELD CRITERION FOR SOIL / ROCK"" ~~ ~A yield criteri<strong>on</strong> suitable for sail / rock is suggested. The criteri<strong>on</strong>can be expressed by genernal stress comp<strong>on</strong>ents with advantageof that it has asingle expressi<strong>on</strong>, and it coincides withCoulomb yield criteri<strong>on</strong> at thespecial stress c<strong>on</strong>diti<strong>on</strong>---purecompressi<strong>on</strong> and pure stretch. It's yieldfuncti<strong>on</strong> G is expressed asG==ii+hJ~/u3+uJ,-H (4 - 1)(2 - 15) wherewhere I is a scolar factor.(2-15). gives the evoluti<strong>on</strong> equati<strong>on</strong>s of the plastic strain.8:and the internal damagc variables c1;:119%
a is a material c<strong>on</strong>stant which characterize the compressi<strong>on</strong>behavior.PARTICULAR EXPRESSION OF THE DAMAGE EVOETION EQUATIONSThe functi<strong>on</strong> of dissipative potential F is usually composed oftwo parts: <strong>on</strong>e part P,(G) is to express the effect of viscoplasticity,while the other part F,(x) relates to effect of internal stress x, x isthe strength of x .Bacause the viscous flow occours before the plasticdeformati<strong>on</strong>, thusF - F, (G(u- X))H(G(u - x)) + q3 (5- 1)where H( ) is Heariside unit functi<strong>on</strong>.F, and F, adaptable extensively to creep deformati<strong>on</strong> ispowerfuncti<strong>on</strong>:(5 -4(5 - 3)where N, M, n, m are all c<strong>on</strong>stants depending <strong>on</strong> temperature.There are some additi<strong>on</strong>al assumpti<strong>on</strong>s:1) The cohesi<strong>on</strong> C of frozen soil depends <strong>on</strong> ["and w (based<strong>on</strong> test), we simply assume,(5 - 4)Fig.1 Forms of yieid criteri<strong>on</strong>s <strong>on</strong> c planeI. Coulomb yield criteri<strong>on</strong>2. The suggested yieldcriteri<strong>on</strong>where j? is a material c<strong>on</strong>stant.substituting (5")-(5-7) into (2-15), we arrived at a set of3-D damage evoluti<strong>on</strong> equati<strong>on</strong>s:where (j3)k,indicates the algebraic complement of J'3.(indicates that cot plus with k, 1, and ( .,shows cr is all displacedby u-x in every expressi<strong>on</strong>.whereC,---- the initial value of C;#--- the original icc c<strong>on</strong>tent;b a material c<strong>on</strong>stant dependent <strong>on</strong> temperature.2 ) The orientati<strong>on</strong> factor fl leads frozen soil to be anisotropic,which relates to vector x of the center of yield hypersurfacex = x(n), also causes change of the fricti<strong>on</strong> angle 4, thusdl = dm = (5 - 5)3) The effect of the thermodynamic pressure x <strong>on</strong> F can bec<strong>on</strong>tained in the yield functi<strong>on</strong> G by the following equati<strong>on</strong>:where(5 -I(5 - 9)10)4) to simplify the calculati<strong>on</strong>s, we suggest particular functi<strong>on</strong>sof thethermodynamic forces A, with ai by(5 - 7)(5 - 13)1199
(5 - 14)As the creep developes, x is absolutely relaxed, so the effect of*Fl(x) is neglected in (5-13).THBCASE OF UNIAXIAL COMPRESSIONIf uj, =-n and all other uk1= 0, then (5-S)-(S-14)to <strong>on</strong>e dimensi<strong>on</strong>al for whichdegenerate1E.' = - A(1 - u){- [(I - U)(U - X) - - Te]\' (6- I)NaH am+ aw)G(6 - 3)Fig.2 The variati<strong>on</strong> of e(t) and o(t) in'the whole creep processThe expressi of 7ah aH ah H,T,- ,nnd-are given bya{ a< aw am(+lO),and R({"),o) will be determined in lateranalysis.I ;p/;I= - T ",(2" io)
Thus we c<strong>on</strong>sider Q is the l<strong>on</strong>g-tenmstrength of frozen soil,while t is the shortest time when the rate of plastic strain homeszero. For a certain material and t * are all c<strong>on</strong>stants.c) phase 3 (tz< t < t3)-e' =C,r -I- C6,(r2= 4, = C<strong>on</strong>st.< r < r 3)' 2 2(I- w)2 - (I- = - ~ c,T~ (I - rl)(6 - 16)(6 - 17)(6 - 18)where w2= w(tl).d)phase 4 (t t,)-eC=C,t +C, (6>t,) (6719)I$ = 4, = C<strong>on</strong>st. (6- 20)' 4 4(l-~)'-(l-~~)'=-2C,Tc,(t-t,) (6- 21)where a, = w(t,).C<strong>on</strong>sidering smoothness of creep curves, the c<strong>on</strong>tinue c<strong>on</strong>diti<strong>on</strong>sat each ti(i = 1,2,3) must be satisfied.c'(t+)=eP(t,-) (6- 22)in(t;)=i#(t,-) (6- 23)The variati<strong>on</strong> of w(t) in the whole creep process is shown asFig.2.Matcrial C<strong>on</strong>stants &(i = 1,2,3)-wi = a(tJ (i = 1,2,3) corresp<strong>on</strong>ding to the time when <strong>on</strong>e phasetransit to another is determined by temperature, but not related tothe level of load, therefore, ai = w(ti) are material c<strong>on</strong>stants. Substitutingit into (6-12), (6-14) and (6-20), we getCl(r: -2r rl)=A, (6 - 24). C3(t2 - t,)=A, (6 - 25)A js also material ,c<strong>on</strong>stants <strong>on</strong>ly depending <strong>on</strong> temperature.One can see thatA,is equal to the increment of plastic deformati<strong>on</strong>at every corresp<strong>on</strong>ding phase.The Equati<strong>on</strong> of L<strong>on</strong>g-Term StrengthBy substituting (6-14) to (6-25), and letting $=b, thel<strong>on</strong>g-termstrength equati<strong>on</strong> is obtained asTime (h.)Fig.3 Comparis<strong>on</strong> of calculated strain with test dataREFERENCESTsytovich,N.A.(1930)?Petmafrost as a bast structures. matcrial ofthe permanent Commiossi<strong>on</strong> for the study of the Nature ProductiveForce of the USSRW,(1980):USSR Academy of SciencesPress.ACFEL(I952):'lnvestigati<strong>on</strong> of descripti<strong>on</strong> classificati<strong>on</strong> andstreigth properties of frozen soils".Vol. 1 and 2.WSA arctiaC<strong>on</strong>structi<strong>on</strong> and Frost Effects bboratpry (ACPEE)TwhnicalReport 40.AD721745 and AD721746Vialov,S.S.(1978),Rheological principles of soil wchanics, HighmEducati<strong>on</strong> Publisher.Wu H<strong>on</strong>gyao(l990),Damage Mechanics.Tstovich N.A.(1973), The Mechanics of Frozen Soil, Higher Educati<strong>on</strong>Publisher.(6-27) 'If uo = 0, t, = 0, 1 / n = a, N;Al = T , then (6-27) degeneratesto the l<strong>on</strong>g-term strength equati<strong>on</strong> given by S. S. Vyalov-.(6 - 28)which have been extensively used in cdd engineerin'g.Predicting The Creep Curves and Comparing to Test DataMaterial c<strong>on</strong>stants Aiand t can be fixed from a n<strong>on</strong>declinecreep curve d<strong>on</strong>e by test. N,, n and have to be determined by threetest curves with different load level each. After that we can predictthe crecp behavior at any load level.Fig.3 shows a comparis<strong>on</strong> of the predicted curves with the test<strong>on</strong>es at temperature of -5C. A good agrement exists bctbrecn thetwo types of curves.
Pan AndrngDepartment of Cicography,Lanzhou University,l,anlho~J 730000,C'hinaThis paper advances the arguments <strong>on</strong> the corresp<strong>on</strong>dence of cold-wet or warn1-Jry periods under rhespecial geographical envir<strong>on</strong>ment 01 Xiniinnp Gnce the late Quatcrnnry. Evtdcncc is cited and approachedfrom varlous aspects, the paper pmnts out that the m<strong>on</strong>so<strong>on</strong> was thc main f'actor in formingthe combinati<strong>on</strong> of warn-wet and cold-dry periods in eastern China. With thc typical c<strong>on</strong>tinental climate,Xinjang had a c<strong>on</strong>trary combinati<strong>on</strong> of temperature and humidity since"the late Quaternary. Theauthor does not deny the possibility that some short periods of warm-humid or cold-dry climate existedin Xinjiang since the late Pleistocene. But the corresp<strong>on</strong>dence ol'cold-we: or warm-dry should bethe main features of climatic type in Xinjiang, the special arid regi<strong>on</strong>.FTRODUCTIQN .".Under thc domains of m<strong>on</strong>so<strong>on</strong> climate, the combinati<strong>on</strong> ofdry with cold or warm with wet climate is comm<strong>on</strong> knowledge inenstern China,in the past and present.But it is not so in Xinjiang.The cold glacial epochs were not extremely dry and the warminterglacial epochs werc not wet since the late Pleistocene.On theother hand, in line with the sandards of the aridity index in the naturaldivisi<strong>on</strong>s of China, there almost are no humid areas inXinjang. Picea schrenkiana forest belt is located in the greatestprecipitati<strong>on</strong> belt of Tianshan Mountain and represents the mosthumid, envir<strong>on</strong>ment of Xinjiang with a yeurly precipitati<strong>on</strong> ofabout 400-800 mm. While this tree species should be included inxerophilous undoubtedly by the standards in eastern China, andoften is used as the representative of a dry-cold envir<strong>on</strong>ment of aglacial epoch in paleoclimatic research. For this reas<strong>on</strong>, humid,thcword used in this paper, is just a comparative c<strong>on</strong>cept under thespecial situati<strong>on</strong> of an arid area, which is different from the humidclimate of eastern China. But this relatively humidity benefits thec<strong>on</strong>servati<strong>on</strong> of soil moisture and the decrement ofevapo-transpirati<strong>on</strong>, and causes the great difference of ecologicalenvir<strong>on</strong>ment in the extremely dry regi<strong>on</strong>." CHARACTERISTICS-. OF -...I SPORO-POLLENASSEMBLAGESThere were a series of str<strong>on</strong>ger temperature dropping epochsand remarkable high temperature epochs since the late Quaternaryin northern Xinjiang,bascd <strong>on</strong> the analysis and computati<strong>on</strong> ofsporo-pollen identificati<strong>on</strong> results and 14C dating.The characteristicsof sporo-pollen asscmblages in the cold periods were similarwith that of the surface samples from various grasslands. In whichthere were variety of mesophilous herbs such as Gramineae,Labiatae, Alhagi, Ranunculaceae, etc. Still more pollen ofhygrophytcs or hydrophytes Typha, Acorus, Sparganiaceae,Cyperaceae, ctc. could be found and the pollen of Salix, Ulmus,and Rosaceae appeared occasi<strong>on</strong>ally in some samples. It reflectedthc climatic envir<strong>on</strong>ment with low temperature and humidity,which was favorable to form Grasslands and Marshlands, at thesame time, the altitude of forest belt of picea was lower so that thec<strong>on</strong>ifer pollen often added to the deposits at the foot of the mountains.The climate c<strong>on</strong>diti<strong>on</strong>s then was more humid and colder thanpresent. In the hot period, the c<strong>on</strong>tent of xerophte pollen asChenopodixceae I11 and IV, Ephedra, Artemisia, etc. rose abruptly,which often reached to the highest value in each of the cores or seeti<strong>on</strong>s, taking the ZK-024 drilling in Balikun Lake as ancxample.The sporo-pollen assemblages were divided by visual andcomputer inspecti<strong>on</strong> into six z<strong>on</strong>es (Fig I). Z<strong>on</strong>e I(89.05-65.09 m)is the z<strong>on</strong>e of Chenopodiaceac-Cuperassaceae-Gramintae, thatreflected the cold-wet climate of grasslands or grassy marshlands.And from 74.63 to 79.01 is a special cold-wet stage with a highersporo-pollen influx. Z<strong>on</strong>e I1 (65.09-23.49 m) is the z<strong>on</strong>e ofchenopodiaceae-Artemisia-Alhagi-Ephedra. The vegetati<strong>on</strong> bel<strong>on</strong>gsto deserts-grassland, the climate was becoming warm anddry. This z<strong>on</strong>e can be further divided to two warm-dry and acold-wet stages. Thje third z<strong>on</strong>e (23.49-10.76 m) is that ofChenopodiaceae-Rosaceae-Gramineae. The ancient envir<strong>on</strong>mentrecovered to grassland in the cold-wet climate, the sporo-polleninflux increased to the highest point. The forth z<strong>on</strong>e (10.76-7.84m), Chenopodiaceae-Leguminosae-Acorns Z<strong>on</strong>e, reflected the flo+ra of shrub-grasslands in the cold-wet climate. Z<strong>on</strong>e V (7.84-2.96rn) is Chenopodiaceae-Artemisia-Ephedra z<strong>on</strong>e,the assemblagesare similar to the modern desert in a warm-dry climate, and thesporo-pollen influx is low here. Z<strong>on</strong>e VI (2.96-0.75 m) isChcnopodiaceae-Artemisia-Gramineae Z<strong>on</strong>e, which can be furtherdivided into two parts. The lowot part has some pollen ofshrubs and trees, Such as Picea, Betula, Cupressaceae etc., and rep
pnts the slightly cold and wet climate. The higher pollen percentageof Ephedra, Artemisia and Gramineae in the upper part reflectedthe desert envir<strong>on</strong>ment of warn-dry climate. The wholesecti<strong>on</strong> shows four cold-wet and four warm-dry climatic epochs.Each cold-wet stage shown by sporo-pollen assemblages and influxcorresp<strong>on</strong>ds to the fresh or slight salutes water layer providedby mussel-shrimp analysis, and the watm-dry stage to the saltwater layer. The paleo-ecologic envir<strong>on</strong>ment evoluti<strong>on</strong> reflectedthe paleo-climate changes. When the arid regi<strong>on</strong> cntcrcd acold-wet stage, the lower air temperature dropped the evaporati<strong>on</strong>power so that the relative humidity rose, and the vegetati<strong>on</strong> didwell. The sporo-pollen assemblage represented flora in a great variety,thesporo-pollen influx was raised to a hightr point, and thepercentage of xerophyte and salt herb decreased in the assemblagesat those times. When the arid regi<strong>on</strong> returned to $e warm-dry orhot dry clirnate,the plant's growing was blockcd,the sporo-pollenassemblages displayed the dry features and the influx in lower valuesbecause of the higher temperature, the str<strong>on</strong>ger evaporatingpower and &he less effective precipitati<strong>on</strong>. Then the percentages ofxerophyte and salt herb increased. The characteristics! ofsporo-pollen assemblages corresp<strong>on</strong>ded to that of surface samplesfrom the general or driest deserts.PARTICULARS OF THE PALEOCLIMATE IN XINJIANGThe correlati<strong>on</strong> of warm-dry and cold wet climate seems c<strong>on</strong>traryto the traditi<strong>on</strong>al ideas <strong>on</strong> cold-dry stages in glacial epochsand warm-wet stages in interglacial epochs. In this c<strong>on</strong>necti<strong>on</strong>s theauthor makes the following approaches:I) The research <strong>on</strong> the climate of Xinjang had showed clearly,that the relative humidity is smaller even though there is more water-vaporc<strong>on</strong>tent in the air, if the air temperature is higher (ChenHanyao,1963). Table 1 shows the c<strong>on</strong>tradictory situati<strong>on</strong> inWrumqi as an example. The water-Vapor c<strong>on</strong>tent of the airUrumqi in July is 5.6 times and the water-vapor pressure is 7.4times as much as those in January. The relative humidity in July ,is40 percent lower than that in January, for the mean m<strong>on</strong>thly temperaturein july is 39°C higher than that in January. The statisticaldata <strong>on</strong> the m<strong>on</strong>thly relative humidity reported (Chen Hanyao,1963), that the relative humidities were higher in winter than insummer in all of the meteorological observati<strong>on</strong> stati<strong>on</strong>s ofXinjiang. The rower relative humidity in high-temperature periodsincreases the evaporati<strong>on</strong> power and transpirati<strong>on</strong>, hastens the vanishingof surface water and soil moisture c<strong>on</strong>tent, and restricts thegrowing of mesophyie. 'Tablc 2 shows that the increasing water-vapor pressure causeda variati<strong>on</strong> of the precipitati<strong>on</strong>, which rises by a greater proporti<strong>on</strong>in eastern China. In Xinjang, however, the water-vapor pressurqin Urumqi is greater by 640 percent in July than in January, but theprecipitati<strong>on</strong> increased <strong>on</strong>ly 150 percent in the same period; thcwater-vapor pressure in Turpan, where it is hotter and dryer, isgreater by 710 percent in July than in January;nevertheless, the prbcipitati<strong>on</strong>, is increased <strong>on</strong>ly by 50 percent. The facts illustrated theincrement of water-vapor to a great extent in hot periods. But thestr<strong>on</strong>g evaporati<strong>on</strong> power at the same time,however, counteracted,,the effect of water-vapor greatly, and made the little difference inprecipitati<strong>on</strong> between summer and winter become more slight.Thus it can be seen that the dry envir<strong>on</strong>ment is not followcd bycold but by a hot stage at the present time.2) We can see the similar situati<strong>on</strong> from the research <strong>on</strong> thedimate periodicity in Xinjang (Zhang Jacheng,l974) that around1970 could be taken for a transiti<strong>on</strong> in periodic variati<strong>on</strong>. Table 3shows the extreme minimum temperature that took place in thecold period before 1970, and the extreme maximum temperature inthe warm period after 1970, which reflected the feature of theperiodicity. In the warm period, the precipitati<strong>on</strong> decrrased by7.4-16.4 percent, evaporati<strong>on</strong> increased by 1.649.9 percent. Theevaporati<strong>on</strong>-precipitati<strong>on</strong> ratio shows the air became dryer in thewarm period.3) The archaeological evidence. The 1,000-year cold periodFrom the end of the Yin Dynasty to the beginning of the ZhouDynasty (about 1,000 B.C) had been divided <strong>on</strong> the base of theph<strong>on</strong>ology and historical records (Zhu Kezhen,1973). and was providedand received by many scholars. Xinjiang was also in a coldenvir<strong>on</strong>ment in 3,000-2,000 B.P. Li Guangli, a general of HanDynasty,attacked the Xi<strong>on</strong>gnu pun) at Tianshan Mountain withthirty thousand cavalry in the autumu of 99 B.C. General Li orderedthe soldiers to take big pieces of ice as a beverage in the assault.It is thus shown that the weather was cold. Now the lakewater can not ice up to such a thickness, even <strong>on</strong> Tianshan Mountaina height to 1,000-2,000 meters in the autumn. The chief ofXi<strong>on</strong>gnu wcnt <strong>on</strong> a punitive expediti<strong>on</strong> for Wusun, the ancientKazakh, in the winter of 72 B.C. Being caught in heavy snow withdepths to 240 cm, the pers<strong>on</strong>al and domestic animals died in largenumbers. This period was named the New Ice-epoch (WangQingtai,l981). At that time, the lakes had larger areas in the TarimBasin and there were many hydrographic nets around it. The famousSilk Road was rather brisk at 2,000 B.P. According to thenarratives in the Shan HAi Classic and the Annotati<strong>on</strong>s <strong>on</strong> theWater Classic, the books <strong>on</strong> ancient Chinese Geography, therewere 8 rivers distributed over the east, the south, and the northwhich flowed into Luobubo Lakee. Based <strong>on</strong> the American satellitephotographs and the textual criticism(2hou Tingru,1978), the areaof Luobubo Lake was indeed larger during the former Qin Dynastyand Han Dynasty. Which c<strong>on</strong>firms the 'records in the ancientbooks. Some researchers (Yang Huairen,l981) c<strong>on</strong>sidered thestiuati<strong>on</strong> wkich "did not accord with the comm<strong>on</strong> law of dry glacialepoch", reflected " the size of the lakes and the rivers in Tarim Basinwere not absolutely dominated by the dry or humid period".The author thought that stiuati<strong>on</strong> is just another piece of evidencefor the coexistence of cold and wet climates.4) The formati<strong>on</strong> and development of most interior lakes inthe northwest of China related to the Quaternary glacial acti<strong>on</strong>.Each glacial acti<strong>on</strong> made up a depositi<strong>on</strong>al cycle together with therelevant new depositi<strong>on</strong>. When the glacier had the str<strong>on</strong>gest acti<strong>on</strong>,the lakc was provided with the highest water level, the largest area,and the thickest depositi<strong>on</strong> layer. The c<strong>on</strong>tracti<strong>on</strong> of the lake surfaceand the thinning of the depositi<strong>on</strong> layer was accompanied withthe reccssi<strong>on</strong> of the glacial acti<strong>on</strong>. The relati<strong>on</strong>ship between coldclimate and precipitati<strong>on</strong> was also reflected therefrom.5) The evidence of annual rings of trees. The restrictive factorof the naturally survived trees is not temperature but moisture inXinjiang. In the dryer years, the photosynthesis was weakened andthe cell divisi<strong>on</strong> of cambium was restrained, thus the annual rings
~ 107)'0 50 1~~~~mirabilite oozc clay silt sand humusFig. 1 Sporo-pollen percentage diagram,Balikun Lake CoreZK-024were narrow. The annual rings widened at the year with more hu+midity.6) The research results <strong>on</strong> mean winnd-field and the transportedvapor quantity in the atmosphere a%ove China showed (QiChengyu,l986),the compound quantity of the whole atmosphereabove China comes from three annual air flows. The vapor carriedby the southwestly airflow from the Indian Ocean and the Bay ofBengal made the greatest c<strong>on</strong>tributi<strong>on</strong>. We can see from the 5,500meter uper-air charts, the thermodynamic acti<strong>on</strong> of theQinghai-Xizang Plateau was strengthened in summer, it thenintensified the wet m<strong>on</strong>so<strong>on</strong>, which carried a great quantity of vaporand made the precipitati<strong>on</strong> increase largely in the area whichwas effected by the m<strong>on</strong>so<strong>on</strong> in summer. The moti<strong>on</strong> height of thewet m<strong>on</strong>so<strong>on</strong>, however, is <strong>on</strong>ly about 3,500 meters (XisXuncheng.l985), little of it could go over the Qinghai-Xizang PlatcaUof 5,000 meters in mean height. In the northwest of theplateau, the upward air current from the surfacc of the plateaucomes down and the subsidence heating effect caused the air to bedryer in summer;Xinjiang could not get cnough moisture to form plentifulsummer rainfall as a c<strong>on</strong>clusi<strong>on</strong>.There was hardly any change in theswelling state of the Qinghai-Xizang Plateau since the lateQuaternaryJt is deducible that the great moisture increase were notable to make a significant influence to Xinjiang in the warminterglacial epoch.In summary, the high temperature was bound to cause.aridity,and <strong>on</strong>ly low temperatures enable the humid climate trend. Thecorresp<strong>on</strong>dence between dry and warm or humid and cold periodshas been a general law in Xinjiang since the late Pleistocene.ON THE FORMING MECHANISM I.""HOT-DRY CLIMATES-OF THE COLD-WET ORXinjiang is located at the middle-latitudes, the movement ofthe planetary fr<strong>on</strong>tal z<strong>on</strong>e does not c<strong>on</strong>stitute the most importantinfluence <strong>on</strong> its humidity and precipitati<strong>on</strong> for many res<strong>on</strong>s, whichwas greatly different from the situati<strong>on</strong> in eastern China, where themain cause of the greater rainfalls in the warm period was thesouthwest m<strong>on</strong>so<strong>on</strong>. Thc beginning and the end of the rainy seas<strong>on</strong>and the moti<strong>on</strong> of the, rain-band were also closely related to theadvance and retreat of the summer m<strong>on</strong>so<strong>on</strong> there. The research <strong>on</strong>18,000 B.P. climagraph showed that the precipitati<strong>on</strong> decreased 20percent in the northern hemisphere in the glacial epochs (YangHuairen,l981). But this decrement was not homogeneous everywhere.InChina, this situati<strong>on</strong> might find expressi<strong>on</strong> in the easternpart with the m<strong>on</strong>so<strong>on</strong> climate.Xinjiang was not affected by rhe1204
, Table 1 A comparis<strong>on</strong> of the m<strong>on</strong>thly mean temsetaturc andhumidity betwtcn:January and July at Umqi,XinjangTimes ' Jan. Jul. 'Water c<strong>on</strong>tent inthe air (g / cm')Water-vapourpressure (hpa)Precipitati<strong>on</strong>(mm)Temperature("C)Evaporati<strong>on</strong>(mm)Relativehumidity (YO)0.49 2.711.6 11.88.7 21.4-15.4 23.510.1 357.178 38m<strong>on</strong>so<strong>on</strong>, so the increment and decrement of the precipitati<strong>on</strong>caused by the m<strong>on</strong>so<strong>on</strong> had hardly any effect <strong>on</strong> Xinjaing. Merelythe incrcment and decrement of evaporati<strong>on</strong> in the global sea-sur.face might cause the variati<strong>on</strong> of the water-vapor transpirati<strong>on</strong>volume in the prevailing westerly jet stream above Xinjianght thescale of this variati<strong>on</strong>, as illustrated by the facts cited in table I, wasminor, compared with the change scale of the temperature andevaporati<strong>on</strong> power in the'arid area. Therefore the warm interglacialepoch could not bring about the humid envir<strong>on</strong>ment. On the otherhand, the cycl<strong>on</strong>e actrivities were enhanced in the middle latitudeareas,and the depressi<strong>on</strong> of the dew point in upper-air droppedgreatly during the glacial epoch, which enabled the water vapor tosaturate easily and c<strong>on</strong>tribute to the formati<strong>on</strong> of precipitati<strong>on</strong>.Though the water vapor in the air current decreased to someextent, the precipitati<strong>on</strong> did not decrease distinctly.Fig.2 shows the relati<strong>on</strong>ship between the saturati<strong>on</strong> vaporpressure (Ew) and the air temperature. The lower the temperature,the smaller the satuati<strong>on</strong> vapor pressure, which decreses by the indexrate. When the temperature decreses from O°C to -lO°C , Ewdecreases from 6.1 hpa to 2.61 hpa; and when the temperature doceases from 3OoC to 20°C, Ew deceases from 42.4hpa to 22.9hpa. Itis the same in a decrease by 10 'C, but the Ew value decreased withheat is over five times as much as with cold. Thus it can be seen thatthe lower temperature greatly c<strong>on</strong>tributed to the c<strong>on</strong>densati<strong>on</strong> andprecipitati<strong>on</strong>, not dryness. Because of the great disparity of watervapor c<strong>on</strong>tent between summer and winter, the promotive effect ofTable 2 A comparis<strong>on</strong> of mean m<strong>on</strong>thly vapour pressure andprecipitati<strong>on</strong> of the typical m<strong>on</strong>ths of winter and summer betweeneastern and western China+Placcname Warbin Peking Nanjing Chcngdu Yaxian Taibei Ururnqi TurpanMcanm<strong>on</strong>thlyvapour(Jan)Pressure (hpa) (Jul)1.1 I .9 5.3 7.2 18.3 10.9 1.6 1.821.0 25.4 30.6 27.8 32.0 21.6 11.8 14.5Mcan m<strong>on</strong>thly (Jan) 3,,3 .O 30.9 5.9 7.2 87.8 8.7 1.5prccipitati<strong>on</strong>160.7 192.5 183.6 235.5 142.9 227.5 21.5 2.3(mm)(Jul) . ,Thcmultiplc orvapourprcssurc 19.1 13.4 5.8 3.9 1.8 2.0 7.4 8.1of Jul/ JanThe multiplc ofprccipitati<strong>on</strong> or 43.4 64.2 5.9 39.9 19.8 2.6 2.5 1.5Jul/ JanThc incrcmcnt ofprccipitati<strong>on</strong> in 157.0 189.5 152.7 229.6 135.7 ' 139.7 12.8 0.8fuly (mm)* The data cited from Zhang Jacheng et al, 1985* The data cited from Zhang Jaeheng et ai, 1885i
Table 3 A comparis<strong>on</strong> of climatic fluctuatidn in Borne regi<strong>on</strong>sof northern Xinjiang within thirty years , .place Dabancheng Ururnqi Paotai Mucuuowan Buolcclimate periods cold warm cold warm cold warm cold warm cold warmthe years when the extremetemperaturc happened1969 1973 1951-i977 1956 1974 1969 1975 1960 1974decrement ofprccipitai<strong>on</strong> 7.4 15.0 14.7 16.412.4in warm periods(%)mean annualcvaporati<strong>on</strong> (mm)2700 2745 1508 2262 1802 1865 1894 2003 1534 1592\increment ofcvaporati<strong>on</strong> inwarm periods(%)1.6 49.9 3.5 5.8 3.9mean annualcvaporati<strong>on</strong>- 40.6 44.6 5.1 9.1 12.0 14.5 15.0 18.9 7.9 9.4prccipitai<strong>on</strong> ratioincrement of E-Pratio in 10.0 18.4 20.0 26.0 19.4warm period(%)predipitai<strong>on</strong> anomaly perccntagein the year whcn thc 3 -23 -13 -42 19 -55 20 -13 46 -44cxtrcrnc tcmpcralurc appcarcd(%)* The data were sorted out from the records of surface observati<strong>on</strong>low temperature to humidity is c<strong>on</strong>cealed in eastern China. But inXinjiang, with an exceedingly low c<strong>on</strong>tent and smaller changing ratioof water vapor, the humid effect of low temperature can manifestitself. It can be seen from the research results <strong>on</strong> the advanceand retreat of ancient glaciers. It was provided by the research <strong>on</strong>the glaciology that the development of glaciers must have two ofmain c<strong>on</strong>diti<strong>on</strong>s.One islow temperature, and the other is precipitati<strong>on</strong>. Theglacier is unable to advance by a wide margin if it is in lowtempcraturee but the accumulated snow is insufficient. It is providedby the research <strong>on</strong> tho relati<strong>on</strong>ship between the ten-years periodicclimate fluctuati<strong>on</strong> of China in the last eighty years and theprocess of glacial advance or recessi<strong>on</strong> <strong>on</strong> the Mount Qomolangmaand Tianshan Mountain, that the scale and moving speed of theglacier could increase <strong>on</strong>ly in the periods when cold corresp<strong>on</strong>dedwith humidity. Therefore, the periods when the ancient galciers advancedby a big margin should be the cold-wet envir<strong>on</strong>ment.(hpa)Fig.2 A diagram of interrelati<strong>on</strong> curve of saturati<strong>on</strong> vapour CONCLUSIONS AND DISCUSSIONS- ..I .-~pressure with respect to water and temperatureIn summary, under the spccial geographical envir<strong>on</strong>ment of9 1206
Xinjiang, the corresp<strong>on</strong>dence of a cold-wet or warm-dry period isthe general climatic law in the arid regi<strong>on</strong> since the late Pleistocene.Though the vapor c<strong>on</strong>centrati<strong>on</strong> of the upper air current was less incold periods, the relative humidity near thc ground was higher thanthat in warm periods.The interior arid regi<strong>on</strong> got dryer and"dryer 8s a result of theQinghai-Xizang Plateau getting higher since the late Pleistocene.Humidity, the word used in this paper is just a comparativec<strong>on</strong>cept. The vegetative cover rate was lower regardless of the dryinterglacial epoch or humid glacial epoch. It is for this res<strong>on</strong> thatduststorms or sandstorms were able to be formed in any epoch inthe arid regi<strong>on</strong>. In the warm inter-glacials, the higher vapor c<strong>on</strong>.centrati<strong>on</strong> of the upper air current makes the tiny dusts into thec<strong>on</strong>densati<strong>on</strong> nucleus and drops back to the ground with the rainsdespite the fact that the rainfall still cannot c<strong>on</strong>tend with the str<strong>on</strong>gevaporati<strong>on</strong> power. On the other hand, the vapor c<strong>on</strong>centrati<strong>on</strong> ofupper air currents was lower in cold periods. The dusats, failed tocollect vapor to form raindrops drifted with the air currenteastward to the m<strong>on</strong>so<strong>on</strong> regi<strong>on</strong>, then c<strong>on</strong>densed and dropped toform loess depositi<strong>on</strong>.me author does not deny the possibility that some short periodsof warm-humid or cold-dry climatc existed in Xinjiang sincethe late Peistocene. But the corresp<strong>on</strong>dence of cold-wet orwarm-dry periods should be the main features of climatic type inXinjiang, the special arid regi<strong>on</strong>.Wang Qingtai (1981) Ancient Glaciers at The Head of UrumqiRiver, Tian shan, Journal of Glaciology and Cryopedology,Vo1.3, Secial Issue.Xia Xuncheng and Fan Zili (1985) On The Envir<strong>on</strong>ment and ClimaticChanges in Luobubo Regi<strong>on</strong>, -Collected Papers <strong>on</strong>Quaternary <strong>Research</strong> in Xinjiang, Xinjang Press, Urtlmqi,8-26.Yang Huairen and Xu Xin (1981) The Influence of QuaternaryIce-Age Climate <strong>on</strong> The Loess and Desert, Selcctcd Papers <strong>on</strong>Quaternary and Glacial' Geology of Xinjiang, XinjiangPress,pp.6-18:Yang Ruairen and Xu Xin (1981) The Physical Evoluti<strong>on</strong> of Chinain Quaternary, Geography Science and Technical Informati<strong>on</strong>,Nanjiang University Press,pp. 4-6.Zhang Jiacheng et al (1974) Preliminary Approach of The ClimateChanges of China, Science Bulletin, 4.Zhang Jiacheng and Lin Zhiguang (1985) The Climate of China,Shanghai Science and Technical Press, Shanghai, 178,579-588.Zhou Tingru (1978) On'The Remove of The Luobunor Lake,Journal of Beijing Normal University, 3.Zhu Kezhen (1973) Premary <strong>Research</strong> <strong>on</strong> The Climate Changes ofChina in Recent 5,000 Years, Science Sinica.ACKNOWLEDGMENTSI would like to thank Dr. Zhang Xuewen, the Senior Engineerof Xinjiang Meteology Service, for helpful SuggeFtios and critiquesof the manuscript,REFERENCESChen Hanyao et a1 (1963) Xinjiang Climate and The Relati<strong>on</strong>shipbetween It and The Agriculture, Science Press, Beijiang,pp.62-118.Qi Chengyu et al (1986) The General Expressi<strong>on</strong> of Chinese Climate,Science press, Beijiang, p.34.. 1207
THE INTRODUCTION OF APPLICATION METHODS FOR CTIN FROZEN SOIL EXPERIMENTAL RESEARCHPu 'fibinState Key Laboratory of Frozen Soil EngineeringWGG,CAS,ChinaThis paper introduces the basic theory and method for experimenting with frozen soil samplesn<strong>on</strong>destnrctively, quantitatively and dynamically using CT (Computer Tomograph). Accurately ob.serving the digital imagea inside the samples in experiments, we can find a new technique for studyingfrozen soil in engincciing.THE SIGNIFICANCE OF INTACT QUANTITATIVE EXAM-INATION SAMPLESAl<strong>on</strong>g with intensively developing scientific study, computertechnology has beeen widely applied to analyse expcrimental processesfor many experimental equipment. On the other hand, intactexaminati<strong>on</strong> of frozen soil and other samples is a very efficaciousmethod in theoretical studying and engineering applicati<strong>on</strong>s in differentenvir<strong>on</strong>ments (tempcratute, pressure, compositi<strong>on</strong> of samplesand their changes). We hope to find some way of c<strong>on</strong>nectingthe two fucti<strong>on</strong>s of reflecting the physical shape and properties ofmatpials in experiments. The CT equipment is an efficaciousmethod. Using data analysis, We can find the regularity inside exchangesamples, and get new theorys for qnginccring applicati<strong>on</strong>s.0THE TECHNOLOGY INDEX OF'mDifferent material has different absorbing cocfficicnt p ofX-ray. The image of scanning and rec<strong>on</strong>structi<strong>on</strong> shows quantitativep maps. Professor Housfield has given a definiti<strong>on</strong> of CTcount, air is -1OO0, water is 0. The biggest examinable materialI I+1H.VoltngeTHE THEORY OF CT EXAMINATION"CT" is the abbreviati<strong>on</strong> for the computer tamography. It usesX rays to penetrate the object slice which is revolving. Detectorsgather the X-rays which have bccn attenuated from the object. Thecomputer gets this informati<strong>on</strong>, does A/D transformati<strong>on</strong> andcalculates according to algorithms. Then the absorbed coefticient p,which corresp<strong>on</strong>ds, with the physical properties of everypoint ofthe object, is quantitively displayed as data images and the instrubti<strong>on</strong>s ate dynamically analysed, quantitatively and dynamically.Because the samples are not damaged in the whole process, thesamples can be examined many times for every slims, the image8can be recorded, processed and analyzed. CT is ordinarily used toexamine the human body, but it also can be used to check n<strong>on</strong>-metallic materials. With some improvements, the instrument may becomean efficient examinati<strong>on</strong> tool for samles. The principleschematic diagram bclow shows the system.Dig.1 CC system working whemitic diagramdensity is about 4 grcm / cm', and a munt of 3000. This densitymeasurement range can fully cheek every n<strong>on</strong>-metallic material.The CT munt caculati<strong>on</strong> c<strong>on</strong>tents linear equati<strong>on</strong>:In the equati<strong>on</strong>, CT-CT count, p*-the X-ray absorbing coemcient1208
of examined ob#& pW4e X-ray absorbing coefficient of pur^water.In 20 years of development , there are 5 designed types of CT.The equipment of our laboratory may complete examinati<strong>on</strong> of aJice within 5-10 sec<strong>on</strong>ds, the diameter of the sample extqnda to 42an, It has 523 datectors, 576 pulw exposures for a slice. The detected data is calculated by computer. Spatial resoluti<strong>on</strong> reaches 0.8x 0.8 mm and smaller linear objGCts and 0,065 mm diameter metalpoint can also be found. The density c<strong>on</strong>trast resoluti<strong>on</strong> reaches to0.5%. Since calibrating has been d<strong>on</strong>e by using standardpolyethylene phantom, which has the same shape as samples, theCT counts have absolute quantitative significance, more accurateray and display data. The images would be enhanced, distinguishedand compared with other data. So we shall get better results of experiments.THE EXAMINING METHOD OF SAMPLESAdding some equipment to the comm<strong>on</strong> CT, making somesample c<strong>on</strong>tainers and models which comply with experimentstandardizati<strong>on</strong>, using programmed software for data calibrating inthe scanning process, making the apparatus of pressure and temperatureinside the sample c<strong>on</strong>tainer for examining c<strong>on</strong>structi<strong>on</strong>changes in different envir<strong>on</strong>mental c<strong>on</strong>diti<strong>on</strong>s, pre-burying somephysical quality materials, we can analyse temperature and stressfield in samples according to the changes of form positi<strong>on</strong>. We alsocan use new software to display 3 dimensi<strong>on</strong>al images and to analysesample quality more clearly. Combining physical principlesand other techniques, we may design many efficient experimentsdepending <strong>on</strong> the purpose, and so that extensive research may bed<strong>on</strong>e.THE SIMPLE EXAMPLEThe photo 1 is an image which shows the layers of a sample. Itindicates that there is great differance of CT data am<strong>on</strong>g ice, water,air, and soil. The split of ice appears very clearly. In the differentareas, the statistical data shows the expansi<strong>on</strong> or c<strong>on</strong>tracti<strong>on</strong> of thesamples. The positi<strong>on</strong> change of image point reflccta movemtnt ofthe matter in the examining process. The display c<strong>on</strong>trol of the imagesis very useful for spectators to distinguish different materials.Because the examinati<strong>on</strong> study of CT is just beginning, thenew method is <strong>on</strong>ly introduced so that it may be of usa in krturescientific studies.1210 '
" Preliminary Data for <strong>Permafrost</strong> Thermal Regime and itsCorrelati<strong>on</strong> Meteorological Parameters near the SpanishAntarctic Stati<strong>on</strong>"M. Rarnos. Department of Physic. UAH. 28871- Alcal6 de Henares. Spain.During 1991/92 Antarctic summer a turbulent atmospheric parameters measuring devicewas installed near the Spanish Antarctic Stati<strong>on</strong> (SAS), in order to register theexchanged energy flux between the soil and low the atmosphere.Temporal evoluti<strong>on</strong> of permafrost was also registered using several temperatureprobes.Base <strong>on</strong> the energy exchanged flux data and the movement of the free boundaryin permafrost. We will study the permafrost evoluti<strong>on</strong> as functi<strong>on</strong> as the energy change inthe soiVatmosphere surface.INTRODUCTION.Soil thermal evoluti<strong>on</strong> in coldregi<strong>on</strong>s where permafrost exists depends<strong>on</strong> the energy exchange between soilsurface and low atmosphere and this willbe a boundary c<strong>on</strong>diti<strong>on</strong> in the heat andmass transfer process in the permafrostactive layer. This frost and thaw 1processes could generate differentgeomorphy surface structures which canbe quantified.In the study area, Livingt<strong>on</strong>(South Setlhand Island. Antarctica) seefigure 1 where the Spanish AntarcticStati<strong>on</strong> is, the active layer of permafrostis about 0.7 to 1.0 m. deep Hall (1992).The aim of this study is tomeasure, using the aerodynamic method.Dyer(1974), Cancillo (1991) with atwo levels micro meteorological towerthe energy flux exchanges between soiland low atmosphere in differentturbulents regimes in 1991192 summerpolar c<strong>on</strong>diti<strong>on</strong>s.The measured flux energyexchange in the soiVatmosphere will beuse as a c<strong>on</strong>diti<strong>on</strong> in the heat transferpermafrost problem Sorbjan (1989).Theoretical thermal evoluti<strong>on</strong> ofthe permafrost active layer study will becompared with experimental thermaldistributi<strong>on</strong> data measured with severalthermal probes Ramos (1 993).Figure 1Experimental area.1211 '
EXPERTMENTAL METHOD. 'Characteristic parameters, of theturbulent atmospheric flux inatmospheric surface layer, air speed,temperature, relative humidity areramd<strong>on</strong> hncti<strong>on</strong> of space and time. Anysoihtmosphere energy exchange modelhas restricti<strong>on</strong> and there is not exactsoluti<strong>on</strong> to the problem.To study thermal evoluti<strong>on</strong> inpermafrost a necessary c<strong>on</strong>diti<strong>on</strong> is toknow the energy exchange flux insoiVatmcrsphere interface. And it will.define boundary c<strong>on</strong>diti<strong>on</strong>s in the heatmass transfer permafrost process.' The most important energyexchange flux between soil and thelower atmospheric layer, are:- The soil (as a grey body) visibleradiati<strong>on</strong> absorpti<strong>on</strong>.- SoiVsky infrared radiati<strong>on</strong> exchange.- Airhi1 sensible heat flux.- Airhail latent heat flux' (less important)Lunardini (1 98 1).A two levels micrometeorological tower was designed andinstalled near SAS in the Antarctic1991/92 summer to measure wind ,speed, temperature, relative humidity,incident and reflected radiati<strong>on</strong> into thesoil. So base <strong>on</strong> this and using theaerodynamlc method we studied thesoiVatmosphere energy flux evoluti<strong>on</strong>.The tower was equipped withtwo comm<strong>on</strong> anemometers (180,,560cm. height) and three thermocouples fortemperatures measuring (90, 180, 560cm. height ). Data was registered everyminute and average value was storedevery thirty minutes. Local airtemperatures were also measured (0, 5,10, 20 cm. height) at the same rate.Figures show the evoluti<strong>on</strong> offollowing parameters in a typical day:fFiguie 2,- wind speed evoluti<strong>on</strong> in bothlevels,-176Meteo 8/11/9 20 5 10 15 20 25ti- ull (H)Figure 3.- Daily tower temperaturesevoluti<strong>on</strong>.9008007008005004003002001000-100 0 , 510 limp0 w11 (H) I5 20 25Figure 4.- Incident and reflected visibleradiati<strong>on</strong>.
-12IO8,E2 6Coef.Pelicula 8/ll/9 2thermal distributi<strong>on</strong> in the soil and thequasiestaci<strong>on</strong>ary method for sine wavepropagati<strong>on</strong>.1 4Suelo V 8/11/9200 5 10 IS 20 25Ti-W (H)Figure 5.- Daily temperatures of the close tosoil layer.With data acquired and usingaerodynamic method we will find outsensible and latent heat flux evoluti<strong>on</strong> insoillatmosphere boundary.Thetd distributi<strong>on</strong> in thepermafrost active layer was measured atdifferent deeps (between 0 to 1 m.).Steady-state analyze of the thermalevoluti<strong>on</strong> measures will allow us tostudy the fluxes inside sail arid itscorrelati<strong>on</strong> with the soillatmosphereexchanged energy flux balance.Figures 6 and 7 show typicaldaily evoluti<strong>on</strong> <strong>on</strong> two of the group offive temperature probes used in ourmeasuring system.+ l q(90) 4 llrp("10) + Tlrp.(-50)Figure 7.- Daily active permafrost layerevoluti<strong>on</strong> in probe V.CONCLUSIONS.1 .- Aefodynamics method is suitable forstudiing turbulent flux balance in the lowatmospheric layer.2.- Thermal spatial evoluti<strong>on</strong> inpermafrost is suitable for analyzing theactive permafrost behavior and itscorrelati<strong>on</strong> with the surface energyfluxes.IO9- 68,Suelo IV 8/ll/9 2REFERENCES.Cancillo. N,L; Baludio e iosfluyo8 de energfa @n lacapa lieite de suparfieieITesis. Dnv Igrtraaadura . (1 991 ) .A.J; A Review of FiuxProfile Relatimsrhips *.Boundary Layer Meteor.pp 363-372. (1971).Figure 6.- Daily active permafrost layerevoluti<strong>on</strong> in prove lV.Data analysis will allow to findout soil roughness. So, thermaldifusivity, could be obtained usingIJc,L Xechrpn.ica1Weathering <strong>on</strong> Livicst<strong>on</strong>xslma south metlandIslande, AIlttU-ctica*.Recent PragresB inAntarctica Earth Scieace .)757-762. (2992).Lunardini, V.J; Heat Transferin Could Climates a. mwYork. VNR. (1981).1213
R~UZOS, I; "An Exact Soluti<strong>on</strong> forthe Finite Stefan Problem Sorbjan, 8; Structure of thewith Temperature-dependent attmsphexic Boundarythermal C<strong>on</strong>ductivity and Layer* Prentice HallSpecific Beat* Int. J. (1989) IRefrig. Vol 16, n* 5(1993) 91214
AN EXPERIMENTAL STUDY OF CANAL LIWING PREVENTEDFROM FROST DAMAGE AND SEEPAGERen Zhizh<strong>on</strong>gNorthwest Hydrotechnical Science <strong>Research</strong> Institute ,Yangling Town, ChinaThis paper prcsents the observati<strong>on</strong> results during the two freezing periods of 1985-1987 for an experimentalcanal with a ltngth of 400m and the operati<strong>on</strong> investigati<strong>on</strong>s from 1988-1991 for the lined canalwith a length of 49.8 Km. The results show that the canal should adapt, limit or partly eliminate thefrost heave and cut off seepage loss. For the canal secti<strong>on</strong> types, the best structural type of lining slabs isthe trapezoid with an arc at the down slope angle. The best material type of lining is the c<strong>on</strong>crete slabcombined with a layer of plastic film. The better structural types of lining slabs are the c<strong>on</strong>crete slabswith 18 and 10 cm thick, the "II" shape c<strong>on</strong>crete slab (6 cm thick), the 6 CM thick asphalt c<strong>on</strong>crete slab,and the cast-in-site ribbed c<strong>on</strong>crete slab (8 cm thick, 20cm rib hcight).MTRODUCTIONIn D<strong>on</strong>gying of Shangd<strong>on</strong>g province, an arterial canal wasbuilt with a 49.8 Km length, 16.5-11.0 m bed width, 3 m depth,1:1.5 slope coefficient, 2 m water depth, 1:7000 in water slope ratio,35 m'/ s in design flow capacity. In order to find reas<strong>on</strong>able typesof materials and structures for canal linings which can be preventfrost damage and seepage, a length of the arterial canal, when c<strong>on</strong>structed,was used as an experimental canal with a length of morethan 400 rn. In the arca, the mean annual air temperature is about12.2'C. the days of mean daily air temperature below O'C are about76-87 days. The negative surface temperature indices are250-350'C day. The frozen depth is about 55 cm. More than 80%of the area distributed under the canal bed is composed of sandyloam with the ground water table ranging from 0.7 to 1.9 m. Fineand loam particle c<strong>on</strong>tent in the sandy loam is about 68.6-87.7%.The capillary water is up to 1.7-1.9 m. The dry density and plasticlimit water c<strong>on</strong>tent are 1.4-1.5 g / cm3and 17.2-20.3%.DESIGN PRINCIPLEFrom a technical and ec<strong>on</strong>omical point of view and due tostr<strong>on</strong>g frost.damagc in the area, the experimental canal design principlewas that the structural type of canal lining should adapt, eliminateand limit partly the frost heave, and cut off seepage loss.From the design principle, the structural typcs of canal liningsc<strong>on</strong>sisted of:(A). (I) Prefabricated slab (8-10 cm thick) and a layer of plasticfilm (0.2 mm thick), (2) "II" shape prefabricated c<strong>on</strong>crete slab (6an thick) and plastic film;(B). Cast-in-situ ribbed c<strong>on</strong>crete slab (8 cm thick, 20 cm ribheight) and plastic film;(C). 6 cm thick asphalt c<strong>on</strong>crete slab;(D). Prefabricated c<strong>on</strong>crete slab (8 cm thick) and sealcd subsoil(40-60 cm thick) with plastic film;(E). (I) Prefabricated c<strong>on</strong>crete slab and plastic film, (2) prefabricated reinforced c<strong>on</strong>crete slab and plastic film ( the two types arewidely used in canals ).OBSERVATION AND RESULTSAfter the experimental canal was built, systematic observati<strong>on</strong>swere c<strong>on</strong>ducted from 1985 to 1987. The distributi<strong>on</strong> ofobservati<strong>on</strong>points al<strong>on</strong>g the canal secti<strong>on</strong> is as shown in Fig.1. The mainresults are decribed as follows:In the two freezing periods of 1985-1987, the lowest and highestair temperatures were -16.4'C, -20.4OC and -12.6'C, -19.4'C,the lowest and highest mean daily air temperatures were -12'C,-10.3'C and -ll°C, -8.S'C, and the negative surface temperatureindices were 282.2"day and 141.4'C day, respectively. The distributi<strong>on</strong>property of ground temperature and frozen depth are shown inTab.1, and Fig.2. It is clear that the lowest ground temperature was-6.8OC and the maximum frozen depths was 83 cm for structure A.The ground water tabla underlying the canal bed was about I rn in1986, and 0.1-0.5 m in 1987. The subsoil water c<strong>on</strong>tent was about27-35% for the shaded slope and bottom, and about 20-25% forthe sun exposed slope.The maximum frost heave amount of the observati<strong>on</strong> points isshown in Tab.2. The greatest and the lowcst displaccment were 200rnm and 29 rnm respectively for structure I3 and D.The structures of A, B, C and I3 had been opcratcd well during1988-1991. They cpuld effectively prevent the canal from frostdamage and seepage after undergoing several freezing-thawing cyclcs,except for a small crack <strong>on</strong> the shaded slope for C structure(see Fig.3). Rut E type or lining slab suffered from frost damage.The damage circumstance are shown in Fig.4, 5, and 6.
1 canal secti<strong>on</strong>Fig.] Distributi<strong>on</strong> of observati<strong>on</strong> points al<strong>on</strong>g canal secti<strong>on</strong>Fig.2 Distributi<strong>on</strong> of frozen depth in A structureFig.5 Frost heave stagger in structure EFig3 Sliding circumstance of test secti<strong>on</strong>Fig.4 Frost heave circumstance in structure EFig.6 Slide and collaps in structure E1216
ITable I. Maximum frost depth (cm) and lowest ground tern- heave and high ground water table areas, it is the best canal secti<strong>on</strong>peraturc ('(2) at 10 cm depth undcr slabshape.sexi<strong>on</strong>ground map.frozen depthground tcmp.frozen depthground temp.frozen depthground tcmp.frozcn depthground temp.frozen depthground tcmp.frozcn depthground tcmp.frozen depthasphalt EM.l slab 8 cm slab scald slab cretc1986-5.8I1-4.454-3.653-3.249-2.040-1.2291987 1986-6.873-5.0 -6.859 83-4.0 -6.844 65-2.9 -4.237 56- -4.049- -2.842- -1.4281981 1986 1987-4.853-6.5 ' -6.058 50* 50-6.2 -5.852 so* 45-3.8 -3.834 50. 44--5041 3931slab1986 1987-5.2I1 53-5.012 55-3.662 38Effective Methods of Preventing Canals from Frost DamageThe methods to prevent canals from . damage - are follows: as(1) In order to adapt canal to the displacement offreezing-thawing, the trapezoid secti<strong>on</strong> canal with an arc at thedown-slope angle and bcd can be selected.(2) For materials, the structure c<strong>on</strong>sisting of a c<strong>on</strong>crete, slaband plastic film is the best <strong>on</strong>e. It combines the advantages of bothc<strong>on</strong>crete and plastic film. ,(3) Through the c<strong>on</strong>trast of structure and cost analysis, thebetter structural types of lining slabs are arranged as A(I), A(2), C,and B. For D, if the c<strong>on</strong>structi<strong>on</strong> problem, can be solved, it is also abetter <strong>on</strong>e. For the structures of A(2) and B (see Fig.7), because ofthe effect of air insulati<strong>on</strong> between slabs, and films and ribs aroundthe slab, frost damage is reduced. In additi<strong>on</strong>, using link expansi<strong>on</strong>pints, c<strong>on</strong>crete slab failure is avoided.Design of Frozen Depth and Calculati<strong>on</strong> of Frost Heave Amount"The relati<strong>on</strong>ships between negative temperature index of thec<strong>on</strong>crete slab and of the air and frazen depth are shown in Fig.8.The subsoil frost heave properties and corresp<strong>on</strong>ding structures aredetermined by the maximum value of frozen depth. The calculati<strong>on</strong>method is described as follows:ground temp.frozen depthground temp.frozen depthground temp.froLen depth-0.621-0.623-1 .o22-1.0 4,821 14-0.5 -0.619 19-0.3 -0.621 11-1.5 -1.221 20 18-1.0 -1.2I8 21 18-1.3 -2.221 23 21-1,414 18-0.520 20-1.217 20Design ,.- . Of frozen aepthS,observati<strong>on</strong> point for A(l) structure:h = 34.45 + 4 . 2 8 zS,obscrvati<strong>on</strong> point for A(2) structure:h = 45.72 + 3 . 3 2 cground tcmp.frozcn,depth-4.948-2.8* The maximum depth measured is 50 cm.41RESULT ANALYSIS" plastic film0n slab rib I slabaSubsoil Frost Heave PropertyBecause the frost heave amount is from 5 to 10 cm, accordingto (SL23-91), the subsoil engineering classificati<strong>on</strong> offrost heave bel<strong>on</strong>gs to the TI1 class.Frost Damagc Types for Differett Canal Sccti<strong>on</strong>.~ShapesBecause of the restraint of the down-slope angle to the frostheave displacement, the displacement failure often occureed in thecentre ot the bed for narrow canal, and the displacement drack OGcurs near the down-slope angle for the wide bed canais.The trapezoid canal with an arc at the down-slope angle,compared with trapezoid secti<strong>on</strong> canal, it has some sepcial advantages,such as eliminating the restraint at the down-slope angle, decreasingthe inequable frost heave, better anti-heave capacity, betterhydraulic properties and low cost. Therefore in str<strong>on</strong>g frostFig.7 Local effect of structurewhere hlis frozen depth (mm), T,,is surface negative temperatureindex of lining slab ("C day). For A( I):Tal =-3.09+0.67Tb, r~0.999. (3)For A(2):T,, --2.97+0.55Tb, r =0.999. (4)Tbis daily lowcst negative air temperativc index ('C day), r isregressi<strong>on</strong> coefficient.Frcst heave amount (the displacement of lining slab)S,observati<strong>on</strong> point for A(1):bl=-1.73+0.15+(hl * W,), r=0.97 (5)S,obcrvati<strong>on</strong> point for A(2): '6, = 1 .04+0.13+(hl- Wl), r = 0.84 (6)1 1217
Table 2. Maximum frost heave amount of observati<strong>on</strong> point(mm)ycarstmcturc 10 cm lI 8cm scal asphalt stmcturce slab slab slab slab slab B86 12.5 0.83 19.0 13.0 3.0 12.0 6.7a7 -20.0 17.0 23.0 15.0a6 33.3 12.5 58.0 31.9 4.0 32.0 39.1 8 cm slaba7 44.0 41,O 43.0 60.0a6a786a1868748-200 46.6 7a 69 14 45 77.447 51 79 a3 Negativ temperature index <strong>on</strong> slab37.4 58.2 69 16 54.0 72 68.2 ' ("C day)20.0 5330.8 53.2 63 73 29 101 70. I368660.0 70.022.0 74.086SI 167.0 62.08637.4 9.2 61.0 64.018.0 4.0 44. I8625.a 4.2 7.0 29.02.0 6.0 3.387868786878687-13.0 -I6-5.0 5.0 2.0 6.07.0 -10-1.7 8.3 7.0 2.03.0 -6.0I .7 6.7 14.0 6.04.0 5.0-I8 -26 negative air temperature index(OC day)8.0 9.0 0.838.0 -IO4.0 6.0 -0.83-14.0 5.00 5 ' 0-7 -5Fig.8 Relati<strong>on</strong>ships between the frozen depth and negativetemperature index <strong>on</strong> c<strong>on</strong>crete slab and of thc airwhere S,is frost heave amount (cm), W,is soil water c<strong>on</strong>tent atS,point (mean value of IOOcm soil depth).REFERENCESThritovize, H.A., 1985, Mechanics of Frozen Soil, PublishingHouse of Science.Mathematical <strong>Research</strong> Institute, 1977, Chinese Academy of Sciedce,Comm<strong>on</strong> Mathematic Statistics Methods, PublishingHouse of Science.
THE! IMPACT OF SALT TYPE ONDEFORMATION OF FROZEN SALINE SOILSRoman L.T.',Alifanova A.A.', Zhang Changqing''Department of Geology, Moscow State University, Russia2State KeyLaboratoryof Frozen Soil Enginccring,LIGG,CAS,ChinaThis paper c<strong>on</strong>tains data <strong>on</strong> l<strong>on</strong>g-term deformati<strong>on</strong> of frozen soils c<strong>on</strong>taminated with solium chlorideand magnesiam and sodium salphates. The results show that testillg of samplcs with similar physicalpropcrties which differ <strong>on</strong>ly is salt c<strong>on</strong>tent gives a family of creep curvcs.Relativc deformati<strong>on</strong> increascsproporti<strong>on</strong>ally to salt c<strong>on</strong>tent rise and the time necessary to achieve the same magnitude of deformati<strong>on</strong>reduces. Thus, higher salt c<strong>on</strong>tent accelerates crccp. The impact of salt c<strong>on</strong>tcnt <strong>on</strong> deformati<strong>on</strong> is idcnticalto the effect of time.This reduces the time requircd for detormati<strong>on</strong> analysis and to apply salt-timcanalogy to predict l<strong>on</strong>g-tcrm deformati<strong>on</strong> of frozen saline soils based <strong>on</strong> shorter experiments.It is gcncrally rccognized that salts present in soil water reduccstrength of frozen soils and increasedeformati<strong>on</strong> since during dissoluti<strong>on</strong>salt i<strong>on</strong>s dissociate into ani<strong>on</strong>s and cati<strong>on</strong>s thus c<strong>on</strong>tributingto water coherence. The freezing point of soil water drops and theamount of unfrozen waterincreases. The above processes depend<strong>on</strong> the quantity of dissociated i<strong>on</strong>s which, in turn, is affected by thechemical compositi<strong>on</strong> of salts and theirc<strong>on</strong>centrati<strong>on</strong>.Hence, theextent to which salts affect strength and deformati<strong>on</strong> of frozen soilsdepends <strong>on</strong> the same parameters, i.e., salts sompositi<strong>on</strong> and poresoluti<strong>on</strong>c<strong>on</strong>centrati<strong>on</strong>.Soilsgencrally c<strong>on</strong>tain a complex of salts and it is difficult toidentify the effect of each salt type. The c<strong>on</strong>centrati<strong>on</strong> of pore soluti<strong>on</strong>is unstable and varies with moisture c<strong>on</strong>tent. That is why to assessthe impact of salt type <strong>on</strong> soil strength and deformati<strong>on</strong> totalsalt c<strong>on</strong>tent is most comm<strong>on</strong>ly used which is the ratio between saltand dry salt masses. The experimental evidence available establishes<strong>on</strong>ly relati<strong>on</strong>ship between mechanical properties of salinesoils and total soil c<strong>on</strong>tent. Such an approach does not permitinvestigators to establish the nature of impact of salt type <strong>on</strong> thestrength and deformati<strong>on</strong> of frozen soils andobtainreliable quantitativevalues for design.characteristics.Only purposeful investigati<strong>on</strong>s based <strong>on</strong> extensive experimentalevidencc can eliminate this gap. This paper c<strong>on</strong>tains data <strong>on</strong>l<strong>on</strong>g-term defoqnati<strong>on</strong> of frozen soils c<strong>on</strong>taminated with sodiumchloride andmagnesium and sodium sulphates.Tests and data processing were carried out following salt-timeanalogy method. The validity of time analogymethods to predictl<strong>on</strong>g-term dcformati<strong>on</strong> of frozen soils, including saline, has beendem<strong>on</strong>strated before (Roman,l987,1990). Frozen saline loam hasbeen tested for uniaxial compressi<strong>on</strong> under isothermal c<strong>on</strong>diti<strong>on</strong>s.The test samplcs were 89.8-92.5 mm high and 44.8-45 mm in diameter.Major physical properties were assumed to be c<strong>on</strong>stant.Given below are theirmean values: frozen soil density = 2.0g/ cm3; soil particle density = 2.71 g / cm3; moisture c<strong>on</strong>tent =30%. The salts were NaCI, Na2S04 and MgS04 and salt cOntCnt= 0.2, 0.4, 0.6, 0.8, I .O, 1.5%.Three tests were c<strong>on</strong>ducted for eachsalt c<strong>on</strong>tent case. Mean deformati<strong>on</strong> values were used in the analysisof test data.The results show that testing of samples with 'similar physicalpropertics whichdiffer <strong>on</strong>ly in salt c<strong>on</strong>tent gives a family of creepcurves. Fig. 1 shows such a family of'MgS04 frozen loam.Itfollows from Fig. 1 that relative deformati<strong>on</strong> increasesproporti<strong>on</strong>ally to salt c<strong>on</strong>tent rise and the time necessary to achievethe same magnitude of deformati<strong>on</strong> reduces.Thus, higher salt c<strong>on</strong>tent accelerates creep. The impact of saltc<strong>on</strong>tent <strong>on</strong> deformati<strong>on</strong> is identical to the cffcct of time.This rcducestime required for deformati<strong>on</strong> analysis andapply salt-timeanalogy to predict l<strong>on</strong>g-term deformati<strong>on</strong> of frozen saline soilsbased <strong>on</strong> shorter experiments.Both the results of short-term experiments and expected valuesof l<strong>on</strong>g-term deformati<strong>on</strong> modulus yielded by salt-time analogywere analysed to determine the impact of salts <strong>on</strong> frozen salinesoil deformati<strong>on</strong>, Themajor task of such an approach is to definetransmissi<strong>on</strong> coefficient, i.e., correlati<strong>on</strong> betwecn times t,and t,duringwhich similar deformati<strong>on</strong>s offrozen saline soils are ,achievedfor each given salinity.Creep test data permit <strong>on</strong>e to define transmissi<strong>on</strong> coefficientthrough time-dependent compliance which is a relativedeformati<strong>on</strong>-stress Relati<strong>on</strong> ( Ji= E, / a). A family of curves J,-lntis plotted for each series of isohetric c<strong>on</strong>stant-stress tests. Heresalt c<strong>on</strong>tent is the <strong>on</strong>ly factor which accelerates compliance. Therest physical properties of samples remain stable. According totime-analogy theory(Wrzhumtsev,l982) determinati<strong>on</strong> of transmissi<strong>on</strong>coefficient is much easier when opmpliance curves of such afamily arc similar. Our investigati<strong>on</strong>$, revelled that compliancecurves of saline soils are observed if stress is attributed to the area- 1219
D ~ 1.5 ~ % ~ =1 .oTable 1 L<strong>on</strong>g-term deformati<strong>on</strong> modulus(50 years) or frozen saline loam, MPaF-T4 2-t (min)Fig. I. Creep curve family for frozen loam with differentMgS04 c<strong>on</strong>tent. Uniaxial compressi<strong>on</strong> test.Stress = 1.26 MPa,temperature = -3'c (p=2.0g/cm3;p,=2.71 g/cm3; W,=0.3).occupied by solid comp<strong>on</strong>ents (soil particles and ice) instead of thecross-secti<strong>on</strong> area of the sample. With 'accuracy acceptablcfbrpractical purposes this area (Fk) can be assumed to be proporti<strong>on</strong>alto the c<strong>on</strong>tent of solid comp<strong>on</strong>ents in volume unit of soil (k) whichcan be easily calculated provided basic physical properties areknown (soil particle density, p,; dry soil density, pd; ice, p,;totalmoisture, W,and unfrozen water c<strong>on</strong>tent, W,,1 (W - W ),f' = I- - 2-c 1p, p,With this assumpti<strong>on</strong>taken into account the area occupied bysolid comp<strong>on</strong>ents (Fk) will bc F, = F K and mess attributed to thisares uk= u/ K . Here compliance is the relati<strong>on</strong>shipbetween therelative settlement at a given instant of' time t (E,) and stress uk,J,, = el / u,(where F is area and u is stress attributed to the samplecross-secti<strong>on</strong>).The obtained crcep curve families for saline loam are shown<strong>on</strong> Fig.2. It follows from Fig.2 that compliance of loamc<strong>on</strong>taminatedwith NaCl is scvcral timeshigherthan for Na,SO,andMgSO,, all other things beingequal.The effects of the two latter salts <strong>on</strong> the compliance diffcrslightly. Thc transmissi<strong>on</strong> coefficient is also salt-dependent. NaUlhas a more pr<strong>on</strong>ounced cffcct <strong>on</strong> the transmissi<strong>on</strong>cocfficicnt in.crcase with increasing salinity than two other salts. Thcsc cxamplcsalso illu
-" 2.0p 1.5k 1.00.50 . . . , . -i0.5 1.0 1.5 2.0Fig 2. J,vs Igt,. Uniaxial compressi<strong>on</strong> test data for loam withTable 2 Freezing point of loamy sand(p =2;p,=2.71 ; Wa=0.3)M~SO, i -0.2 -0.6 -0.8 - -1.0 -1,2 -1.68- -- "."-0.81 - -1.01 -1.21 -1.7" - - "" ,- ,-NaCl -0.2 -0.68 -1.08 - -1.61 - -2.21 -3.21"" -REFERENCES"Fig, 3. Jp / uq vs T / Tblfor frozen loam c<strong>on</strong>taminated withdifferent salts (salt c<strong>on</strong>tent between 0 and IS%, temperature = -3,-5, -7'c), time = 8 h.Glinka N.L.,1976, General Chemistry.Chemistry PublishingHouse, Moscow,p.712.Roman L.T.,1987, Frozen peat as foundati<strong>on</strong> soil of engineeringstructures.Science Publishing House,Moscow.p.229Roman L.T., Kuleshov Yu.V.,1990, Predicti<strong>on</strong> of' l<strong>on</strong>g-termdeformati<strong>on</strong> of saline soils with time analogies. In: Frozen SalineSoils As Foundati<strong>on</strong> of Engineering Structures. SciencePublishing House, Moscow.p.73-83.Roman L.T., Artyushina V.T., Ivanova L.C.,1992, Relati<strong>on</strong>ship betweenfrozen saline soil strength and soil water freezing point.Moscow State University Publishing House,Moscow.Urzhumtsev Yu.S.,1982, Predicti<strong>on</strong> of l<strong>on</strong>g-tcrm resistance ofpolymeric meterials.Scienccs Publishing House,Moscow.p.22IFerry G.,1963, Visco-elastic properties of- polymcrs.LiteraturePublishing house, Moscow.p.535.1221
..GEOPHYSICAL METHODS OF CRYOLOGY ECOLOGICAL MONITORINGB.M. Sedov, Yu.Ya. VashchilovNorth-East Interdisciplinary <strong>Research</strong> Institute, Russia Academy of Sciences, MagadanGeocryological wells are peculiar as they can be drilled without muds, and so-called “dry” drilling allowsto avoid thawing of rock. There are some difficulties in making geophysical investigati<strong>on</strong>s of suchwells due to impossibility to use electrical logs. But this can be easily d<strong>on</strong>e by using a series of radiactivcmethods, seismic log and caliper log, which allows to take into account the effect of change in a well diameter.The series of radiactive methods iucludes gamma-log, gamma-gamma density log, neutr<strong>on</strong>gamma-log and X-ray radiometric log. The combinati<strong>on</strong> of all these methods allows to makelithological divisi<strong>on</strong> of the secti<strong>on</strong> to distinguish ice including very thin ice interbed, to determine the totalice c<strong>on</strong>tent. Seismic log method also allows to investigate the space between wells and to make soundingof well-surface rock mass. The sounding can be made to obtain three dimensi<strong>on</strong>al seismicgeocryological models.Cryology z<strong>on</strong>e depth to 20-30 m is permanently effected bySeas<strong>on</strong> temperature variati<strong>on</strong>. Human activity influences this partof secti<strong>on</strong> and this can cause the damage of the natural temperaturcregime. When rocks c<strong>on</strong>taining ice and water are higher or lowerthan O’C, cryology ccological situati<strong>on</strong> changes. The major m<strong>on</strong>itoringobjects of cryological ecological situati<strong>on</strong> in cryoz<strong>on</strong>e can bedivided into two groups according to the rate of the influence <strong>on</strong>the temperature regime of the rocksJhe first group is c<strong>on</strong>nectedwith warmth additi<strong>on</strong> which cause the temperature increases tillOT. In c<strong>on</strong>trast, in the sec<strong>on</strong>d group the temperature decreases todegrees below zero. In the first case ice thaws out in frozen rocks, inthe sec<strong>on</strong>d case water freezes. The process of transiti<strong>on</strong> of temperatureto degrees above or below zero is accompanied by an abruptchange in some physical.and mechanical properties of rocks.The sharp change in seismic electrical properties of friable andfractured rocks, which c<strong>on</strong>tain water and ice, are the most interestingfor geophysical methods. This allows to use electrical andseismic methods of geophysical investigati<strong>on</strong> to determine physicalc<strong>on</strong>diti<strong>on</strong> of frozen or thaw rocks, to find out their locati<strong>on</strong> inmanydimensi<strong>on</strong>al space including time coordinate.In north-east Asia the geophysical methods of geocryologyecological c<strong>on</strong>diti<strong>on</strong> m<strong>on</strong>itoring is used to do the following: toidentify taliks and to watch their development during the cxploita.ti<strong>on</strong> of dambs and during the filling of water collecting areas; todiscover the places of water leakage; for open and undergroundmining of natural resources; to search for aband<strong>on</strong>ed mines, for agriculturalworks; for engineering-geocryological investigati<strong>on</strong>; farpredicti<strong>on</strong> of possible change in geocryological c<strong>on</strong>diti<strong>on</strong> and forsome other purposes. The human influence is accompanied by therock temperature decrease which cause increase in permafrostthickness or the beginning of permafrost. For instance, whenground dambs are being built, there is natural freezing or artificialcooling of their bodies; when show is removed from aerodromesand roads this is accompanied by drop in annual average rock temaperature; the permafrost appears in the places of taliks of drainedlakes, which are used for haymowing.As compared with other gcophysical investigati<strong>on</strong>sgeophysical methods of cryology ecological m<strong>on</strong>itoring have someadvantages, mainly, they d<strong>on</strong>’t have additi<strong>on</strong>al influence <strong>on</strong> thetemperature regime change. For instance, the study of temperatureregime of perennial rock warming, up to its thawing out in thewell’s walls at some depth. To restore temperature regime it takesmuch time during which it is impossible to distinguish bctwccn thestudied cryological changes and the influence of drilling.When wells are used during a l<strong>on</strong>g period of time they need tobe properly equipped to be always in the working c<strong>on</strong>diti<strong>on</strong>.The practical USE of geophysical methods of cryologyecological m<strong>on</strong>itoring in cryologyz<strong>on</strong>e evidences its effectiveness. Ithelps to make detailed and rapid investigati<strong>on</strong>s, it may be moreec<strong>on</strong>omical than other methods.1222
PERMAFROST IN THE SELENGE RIVER BASIN(ON THE MONGOLIAN TERRITORY)A.SHARKHU,WInstitute of Geography and Geocryology, M<strong>on</strong>golianM<strong>on</strong>goliaAcademy of Sciences, Ulaanbaatu,210620,In this paper, the basic results cf permafrost investigati<strong>on</strong> in the Selenge River are c<strong>on</strong>sidered, includinga territory of more than 300,000 Km'. The study of the thermal regi<strong>on</strong> in the rock and ground, dcpending<strong>on</strong> different natural factors, serves as a scientific methodical basis for discovering qualitativeand quantitative parameters of permafrost c<strong>on</strong>diti<strong>on</strong>s, On the basis of this analysis and field rcsearchsmall scale permafrost map has been complied of the Selenge River Basin, in which basic parameters ofpermafrost distributi<strong>on</strong>, thickness, temperature and compositi<strong>on</strong> are shown.INTRODUCTION".The z<strong>on</strong>e of permafrost occurrence embraccs all thc territoryof the Selenge River Basin which is a basic ec<strong>on</strong>omical regi<strong>on</strong> ofM<strong>on</strong>golia. The circumstances required a comprchcnsive study ofpermafrost in the given regi<strong>on</strong>.The first summarized characteristics of M<strong>on</strong>golian permafrostwere determined by N.L<strong>on</strong>gid(l969), G.F.Gravis (1974) andN.Sharkhuu (1 975). In the last 20 years, permafrost investigati<strong>on</strong>shave been c<strong>on</strong>centrated by the author in the Selengc River Basin.As a result all materials obtained were generalized and compiled intoa number of large and middle scale geocryological maps of industrialareas, and a small scale map of this Basin.(1978,1982,1989).The main purpose of this paper was to discovcr the gencraland regi<strong>on</strong>al regularities of permafrost occurrence <strong>on</strong> the basis ofanalysis of the changing ground temperature regime depending <strong>on</strong>various factors ornatural c<strong>on</strong>diti<strong>on</strong>s.NATURAL CONDITIONS- .-The Selengc River Basin is situated in the central part ofM<strong>on</strong>golia and is surrounded by the high ridges(2,OOO-3,500 m) ofthe Hubsugul, Hangai and Hentei mountains from the west, southand east. Betwecn these mountains is the Orh<strong>on</strong>-Selengemiddle-low mountain depressi<strong>on</strong>.The basin has a sharp c<strong>on</strong>tinental climate. Mean annual air' temperature changes from -22°C to -30°C in January and from12OC to 18°C in July. The mean annual value is from -6OC in thehigh mountains to 3'C in the depressi<strong>on</strong>.A large part of the Hubsugul and Hentei areas is charactcrizedby a taiga z<strong>on</strong>e and the Hangai area - by a forest steppe z<strong>on</strong>e. Forestcoverage occurs predominantly <strong>on</strong> the north facing slopes of themountains. Only the south part of the Orh<strong>on</strong>-Selenge depressi<strong>on</strong> ischaracteristic of a steppe z<strong>on</strong>e.GROUND TEMPERATURE REGIME"" .. . ~An important indicator of the ground temperature regime isthe mean annual ground temperature at the level of zero annualamplitude. The penetrati<strong>on</strong> depth of zero annual amplitude temperaturesin a large part of the given territory is about 10-15 m.However it decreases to 5-10 m at the swamp sites of valleys andwatersheds and reaches to 15-30 m in the sand - pebbles depositsand in the fissuring solid rocks.The analysis of the.permafrost map secti<strong>on</strong>s of this basin hasgiven the quantitative characteristics of general regularities in thechanging of mean annual ground temperatutes. In particular, themean annual ground temperature by the mountain altitudinal beltdecreases about 0.4-0.6"C for each 100 m rise above the absolutesurface height, and by the latitudinal z<strong>on</strong>ati<strong>on</strong> it increases0.9-I.0"C for each 100 kilometers moved from north to south (N.Sharkhuu, 1975).The regi<strong>on</strong>al regularities in the changing of ground temperatureregime have been studied in the sites of geocryological investigati<strong>on</strong>ssuch as the sites of the Hatgal, Erdenet, Wlaanbaatar andother areas. On the basis of approximate calculati<strong>on</strong>s and factoranalysis carried out by using data of geothermal measurements inmore than 450, boreholes with depths from IO m to 200 m, the authorestablished a number of quantitative parameters of changingmean annual ground temperature depending <strong>on</strong> basic factors ofnatural c<strong>on</strong>diti<strong>on</strong>s.As <strong>on</strong> ground compositi<strong>on</strong> and moisture, slopeaspect, vegetati<strong>on</strong> and snow cover, rain infiltrati<strong>on</strong> water and otherfactors. Therefore, the mean annual ground temperature in theSelenge River Basin changed within the large ranges of plus 6OC tominus PC, including the predominant ground temperature of the1223 -
magnitude of plus 2'C to minus PC.The value of geothermal gradient at depths exceeding the layersof yearly temperature fluctuati<strong>on</strong>s ranges from Ioc to 3°C forevery 100 m. The geothermal gradient in the transiti<strong>on</strong> from valleysto watersheds under similar geological and geographical c<strong>on</strong>diti<strong>on</strong>sdecreased by almost 1.5-2.0 times. Therefore, the gradient <strong>on</strong> thewatersheds and slope of mountains averages 0.01-0.02 deg / m indIn the valley bottoms it is 0.02-0.03 deg/ m. C<strong>on</strong>sistent with this ,the thickest permafrost is observed at the mountain uplands andthe relative cancellati<strong>on</strong> of permafrost thickness is characteristic ofthe valley bottoms.PERMAFROST FEATURES' <strong>Permafrost</strong> is determined by the features of it's occurrence,thickness, temperature, cryogenic structure and evoluti<strong>on</strong> history.These features are closely c<strong>on</strong>nected with ground temperature.Especiallyoccurrence, thickness and temperature of permafrost whichhave a direct relati<strong>on</strong>ship not <strong>on</strong>ly between each other and but withgeneral and regi<strong>on</strong>al regularities in the changing of ground temperatureregime( Gcocryological C<strong>on</strong>diti<strong>on</strong>s of The M<strong>on</strong>golianPeople's Republic, 1974).As the result of the above established regularities, the authorcompiled, in 1982, an engineering geocryological map of theSelenge River Basin <strong>on</strong> the scale 1:1,000,000. On a generalizedbasis, this map had been made the permafrost map or the map ofgeocryological regi<strong>on</strong>alizati<strong>on</strong> of this territory <strong>on</strong> the scale1:6,000,000, in which are shown <strong>on</strong>ly interrelati<strong>on</strong> indicators of occurrence, thickness and temperature of permafrost. (see figure...).This map has three geocryological secti<strong>on</strong>s, which is a sufficientlyillustrated altitudinal belt of permafrost occurrence. Besides , moregeneralized characteristics of latitudinal z<strong>on</strong>ati<strong>on</strong> and thealtitudinal belt of permafrost occurrence in the Selenge River Basinis presented in summary tahle I. ~The permafrost map of this Basin is divided into the followinggeocryological two z<strong>on</strong>es and five areas, in particular : the areas'ofc<strong>on</strong>tinuous (>85%) and disc<strong>on</strong>tinuous (50-85%) permafrost arecharacteristic of the z<strong>on</strong>e with predominant permafrost and theareas of widespread (lO-50%) and rare spread (1-10%) islandpermafrost and sporadic permafrost are Characteristic of the z<strong>on</strong>ewith predominant seas<strong>on</strong>al freezing (of thawed grounds.) As wellthc map is subdivided into ten geocryological sub areas (or sites),distinguished,by the magnitude qradati<strong>on</strong>s of occurrence and mcanannual temperature of permafrost sequences.The above represented map and table shows clearly that Ihcoccurrence, thickness and temperature of permafrost are submittedto gcncral rcgularitics or to latitudinal z<strong>on</strong>ati<strong>on</strong> and the altitudinalbelt of natural landshafts. So according to the latitudinal belt, witha rise of absolute hight of the earth's surface in the mountains ofthe Alpine type and in the mountain taiga and forest steppe z<strong>on</strong>e ofthe Selenge River Basin there is a regular increase in the c<strong>on</strong>tinuityand thickness of permafrost and decrease in temperature. Thelatitudinal z<strong>on</strong>ati<strong>on</strong> of permafrost occurrence is characteristic ofthe steppe and forest steppe z<strong>on</strong>e of this Basin.The territory of the Selenge River Basin is charactcrizcd byunextendcd permafrost. Thercforc, thc depth of seas<strong>on</strong>al groundthawing or thickness of the active layer corresp<strong>on</strong>ds to theFig.1 <strong>Permafrost</strong> map of the Selenge River Basinpermafrost table or to the upper boundary of the permafrost sequence. The average thickness of seas<strong>on</strong>ally thawing or active layersis about 2-3 m.An important feature of permafrost is thc cryogenic structureof permafrost sequence characterized mainly by freezingtype,cryogenic texture and ice c<strong>on</strong>tent of rock a-nd ground. In general, overwhelming masses of permafrost sequence in the z<strong>on</strong>e withpredominant permafrost are c<strong>on</strong>fined to solid rocks and in the z<strong>on</strong>ewith predominant seas<strong>on</strong>al freezirlg which is c<strong>on</strong>fined to loose depositsor grounds.Epigenetic frozen solid (magmatic, sedimentary andmetamorphic ) rock have inherited cryogenic texture, which correspo,nds to the character of rock fracturing and to the type of undergroundwater, in particular ice is arranged in rock fissures, fractures and joint chacks. They are characterized by cold rocks. However,in the upper (0.5-3.0 m) layers of the rock weathering z<strong>on</strong>e,the ice c<strong>on</strong>tent is 3-10%, until the depth of20-30 m -- 2-5% andlower than 100-150 m it is less than 03%.Predominan,rly epigenetic and partically syngenetic frozenloose (alluvial, lacustrine, glacial and their mixed ) dcposits havecryogenic or ice c<strong>on</strong>necti<strong>on</strong> which depends <strong>on</strong> facial, cryotextureand ice c<strong>on</strong>tent of loose deposits. In most cases loamy frozenground has layered and nctting cryotexture, sandy frozenground-massive cryotexture and gravelly frozen ground - ring visiblecryotcxturc. One may approximately account that permafrostwith massive and ring cryotextures has a poorly (5-15%) icc c<strong>on</strong>-
Table 1. Characteristics of the latitudinal z<strong>on</strong>ati<strong>on</strong> andaltitudindl belt of the permafrost occurrencepermafrostaltitudinal beltoccurrcncc areas of and latitudinal areasnumberz<strong>on</strong>ati<strong>on</strong>permafrostoccurrence .1golets and mountain<strong>on</strong> golets andc<strong>on</strong>tinuousmeadow belt of 11.6 meadows ofpcrmafrostalpine typcmountains2mountaln taiga,rneadowdisc<strong>on</strong>tinuous<strong>on</strong> all typcand steppc beltoftaiga 85.6permafrostof landshaftand Carcstslcppc z<strong>on</strong>eWidespread is mountain Corcst in valley bottoms3 lands of and steppe belt 64.5 and <strong>on</strong> north-facingpermafrost of forcst steppe z<strong>on</strong>e dopes of mountains4mountain-forestrarespreadlandssteppe belt ofof permafrostforest steppe z<strong>on</strong>e93.15mountain steppe<strong>on</strong> swampsporadicbelt of 15.5 sitcs oroemafroststeppe z<strong>on</strong>evalleys1-5forest in bottoms vallcyislandstcppc 336.3 and <strong>on</strong> northpermafrostz<strong>on</strong>efacing slopesof mountainstent, permafrost with netting cryotexture - a greatly (2040%) icec<strong>on</strong>tent. In general, the Selenge Rivcr is characterized relatively bypoorly and middle ice c<strong>on</strong>tent Ioosc deposits with predominant ofmassive tcxture. Lacastrine and lacusrine alluvial deposits are usuallyrelated to the more ice c<strong>on</strong>tent permafrost.At present, a stability of permafrost evoluti<strong>on</strong> is characteristicof all the territory of the Sclenge River Rasin. Relic permafrost hasnot discovered here. Howcvcr, <strong>on</strong> some local sites of the basin degradati<strong>on</strong>and agradati<strong>on</strong> tendencies of permafrost evoluti<strong>on</strong> arenoted, which have <strong>on</strong>ly local characteristics. In particular, thepermafrost agradati<strong>on</strong> is noted <strong>on</strong>ly <strong>on</strong> some sites situated in thetaiga'z<strong>on</strong>e of the Hentei mountainous regi<strong>on</strong>. The permafrost degradati<strong>on</strong>is observed comparatively often in some local sites locatedin the other territories of the Basin. The notcd aggradati<strong>on</strong> anddcgradati<strong>on</strong> or permafrost in the Selenge River Basin is closelyc<strong>on</strong>nccted with a large dynamic evoluti<strong>on</strong> of relatively high temperature(minus 0-I@) and low ice c<strong>on</strong>tent (about 8-15%)permafrost scquences, which is characteristic of territory in thesouthern fringe t<strong>on</strong>e of permaliost occurrence. Especially the largedynamic evoluti<strong>on</strong> of permafrost predominantly in the directi<strong>on</strong> ofdegradati<strong>on</strong> is rapidly manifested under ec<strong>on</strong>omic development ofncw territories in the Basin.PERMAFROST ASSESSMENT.... ~The degrcc of' complicated permafrost c<strong>on</strong>diti<strong>on</strong>s of theSclengc River Rasin may be divided into threc ycocryological rc-pi<strong>on</strong>s:1. The regi<strong>on</strong> of c<strong>on</strong>tinuous and disc<strong>on</strong>tinuous permafrost ischaracterizcd by complicated permafrost c<strong>on</strong>diti<strong>on</strong>s for ec<strong>on</strong>omicdevelopment of terfitory caused by widespread comparatively lowtemperature (minus 1-4'C), large ice c<strong>on</strong>tent (about 10-40%) andthe thickest (100-200 m and more )Qermafrost sequenks. ..2. The regi<strong>on</strong> of widespread and rare spread island permafrostis characterized by middle complicated permafrost c<strong>on</strong>diti<strong>on</strong>s forec<strong>on</strong>omic developmcnt. The main cause of,difficulties for ec<strong>on</strong>omicdevelopment is a large dynamic evoluti<strong>on</strong> of high temperature (minusO-IOC) permafrost sequences.3. The regi<strong>on</strong> of sporadic permafrost is characterized by nocomplicated permafrost c<strong>on</strong>diti<strong>on</strong>s for ec<strong>on</strong>omic development becausethe ice c<strong>on</strong>tent of permafrost sequences is practically absent.CONCLUSIONSThe most rati<strong>on</strong>al method of geocryological investigati<strong>on</strong> forstudying the occurrence, thickness, dynamic and other indicators ofpermafrost may be based <strong>on</strong> the discovery of general and regi<strong>on</strong>alregularities in the formati<strong>on</strong> of the ground temperature regime.A compilati<strong>on</strong> of permafrost maps <strong>on</strong> small scales is advisableto carry out a united (table form) legend determined by theinterdependent characteristics of occurrence, thickness and temperatureof permafrost i s. as in thc compilati<strong>on</strong> of the pcrmafrost mapof the Selenge River Basin.Further investigati<strong>on</strong>s, especially <strong>on</strong> the dynamic evoluti<strong>on</strong> of
permafrost in the Selenge Rivcr Basin situated in the southernfringe z<strong>on</strong>e of permafrost occurcnce, are presented for scientificand practical interest for geocryologists and other specialists. Theymay be at a high scientific level, and carried out <strong>on</strong>ly under closecollaborati<strong>on</strong> with scientists-geocryolists from interested countrieswho arc adhering members of the <str<strong>on</strong>g>Internati<strong>on</strong>al</str<strong>on</strong>g> <strong>Permafrost</strong> Associati<strong>on</strong>."- REFERENCES"Geocryological C<strong>on</strong>diti<strong>on</strong>s of The M<strong>on</strong>golian People's Republic,1974, Transacti<strong>on</strong>s of Joined Soviet-M<strong>on</strong>golian Scientific-<strong>Research</strong>Expediti<strong>on</strong>; Vol.10, Moscow, pp30-48,74-91.Sharkhuu, N., Lubsandagva D. and Zhamsran S., 1975, Basic Featuresof <strong>Permafrost</strong> in M<strong>on</strong>golia, Ulaanbaatar,pp22-66,90-103.Sharkhuu N., 1982, Engineering Geocryological C<strong>on</strong>diti<strong>on</strong>s of TheSelenge River Basin, In Proceedings: Materials of VIII-th <str<strong>on</strong>g>C<strong>on</strong>ference</str<strong>on</strong>g>of Young Scientists and Aspirants <strong>on</strong> Gcocryology ofGeologic Department of Moscow State University by M.V.Lom<strong>on</strong>osov.Sharkhuu N., 1989, Geocryological C<strong>on</strong>diti<strong>on</strong>s <strong>on</strong> Territory ofHubsugul Phosphorit Deposits, In Bulletin of M<strong>on</strong>golianAcademy of Sciences, 4, Ulaanbaatat.
DEFORMATION OF THAWING DISPERSED LARGE DETRITAL ROCKS OF CRYOLITE ZONEShesternyov D.M.Institute of <strong>Permafrost</strong>, ChitaThe paper is c<strong>on</strong>cerned with the compositi<strong>on</strong> and structure peculiarities of largedetrital rocks of cryolite z<strong>on</strong>e. Classificati<strong>on</strong> diagram <strong>on</strong> basic structures oflarge detrital rocks has been suggested, which is put into the basia of analysisof deformati<strong>on</strong> changes of thawing dispersed large detrital rocks of cryolitez<strong>on</strong>e. It has been established, that for large detrital rocks with c<strong>on</strong>tactcryogenic textures and frame structures cryogenic textures have greater influence<strong>on</strong> thawing coefficient values than ice saturati<strong>on</strong> (total moisture) af rocks asa whole, and the curyes of thawing coefficient variati<strong>on</strong>s of different genesisrocks are identical.An intensive nati<strong>on</strong>al-ec<strong>on</strong>omic exploitati<strong>on</strong>of cryolite z<strong>on</strong>e of platform and mountain foldedregi<strong>on</strong>s of Russia and other countries is beingd<strong>on</strong>e during the last decades. According to ourcalculati<strong>on</strong>s the cryoliie z<strong>on</strong>e in these regi<strong>on</strong>s<strong>on</strong> the depth of annual temperature variati<strong>on</strong>sc<strong>on</strong>sists of 60-90X of seas<strong>on</strong>ally and perenniallyfrozen large detrital rocks (LD). LD are c<strong>on</strong>sideredto be the rocks which c<strong>on</strong>tain more than 10%of detrital rocks and minerals, the diameter ofwhich is more than 2 mm.Comparatively few papers are devoted to thestudy of deformati<strong>on</strong> of thawing LD. (Vedernikov,1959; Tsytovich, Kr<strong>on</strong>ik, 1973;Ilshkalov, 1974; Votyakov, 1975; Vyalov, 1979:Davidenko, 1981; Ziandirov, Kilbergenov, 1987;et al). In these works some regularities ofthawing coefficient variati<strong>on</strong>s (A,) and compressi<strong>on</strong>Coefficient variati<strong>on</strong>s (a) for LD withdifferent genesis, compositi<strong>on</strong>, structure andproperties are shown, the methods of field andlaboratory investigati<strong>on</strong>s are offered: correlati<strong>on</strong>regressi<strong>on</strong>LD models of regi<strong>on</strong>al importance arebuilt. However, though the authors have made agreat c<strong>on</strong>tributi<strong>on</strong> to the study of thawing LDdeformati<strong>on</strong>s it should be noted that someproblems in their works have been paid littleattenti<strong>on</strong> to. The main of them is the absenceof profound investigati<strong>on</strong>s <strong>on</strong> the influencelithogene structures (L S L D) and cryogenictextures (C T L D) <strong>on</strong> deformati<strong>on</strong>s of thawingLD. Rut satisfactory soluti<strong>on</strong> of the problemcould not have been solved because profoundresearch into structure and cryotexture formati<strong>on</strong>in LD has not yet been d<strong>on</strong>e. That is whywe had to pay great attenti<strong>on</strong> to the soluti<strong>on</strong> ofthis problem when studying the deformati<strong>on</strong> ofthawing LIj*Using methodical approach offered by V,I.Osipov (1965) and taking into account thepeculiarities of LD compositi<strong>on</strong> and structurewe shall treat the LD structure in regard tospace distributi<strong>on</strong>, interrelati<strong>on</strong>,>,size andgeometrical form of LD-forming Branulometric* elements and their groups (Table).Classificati<strong>on</strong> of Structures ?f LD.Class Group Subgroup/50>KvL10 MixedFrameless (LD partic les,sand, dust andclay parti cles)90>K,klO90>K,~50FrameSimple(<strong>on</strong>ly LDparticles)KVr90Sand,clayUnf ullyc<strong>on</strong>tact50’KV
"hot stamp uf an area of 5000 cm in pits rindshafts up tu 10 m in dept-h. A t thc same timcdetailed descripti<strong>on</strong> of the distribut,i<strong>on</strong> oflarge-detrital particles i n LJI was performcd,the int-errelati<strong>on</strong> of definite I. S 1, D and C ?'L 1)types was revealed, identificati<strong>on</strong> of the lattcrwith the A, and "a" coefficient values was d<strong>on</strong>e.The regularities of ice inclusi<strong>on</strong> diStrihuti<strong>on</strong>in a finely-dispersed LO comp<strong>on</strong>ent and the characterof ice cuvering of large detrital [)arLicleswere paid attenli<strong>on</strong> to. The research wasd<strong>on</strong>e by the author sirice 1976 to 1986 under H.A.Kydryavtsev and R.D. Ershov at the geocryologychair of the Moscow State llr~iversity, then hythe author himself or under his direct guidanceat the hydrogeology and e'ngineering geologychair of the Chits Politechnical Institute, andsi.nce 1986 up to now in t.he laboratury of engineeringcryogeodynamics of the Chita Departmentof the <strong>Permafrost</strong> Institutc of t.he RussianAcademy of Sciences Siberian Department.The processing of thc dat-a obtained has beend<strong>on</strong>e in two 'stages. A t the first stage thranalysis of the change of granulometric L1 cumpositi<strong>on</strong>of differellt genesis was performcd andtheir inf1uenc.e <strong>on</strong> litho- and (;ryogenic Lnstructures was eslahlished. A t the secunrl stagestandard values KtoL, p,, p (total moisture,density of Lll skelet<strong>on</strong> and 1.D density i u naturalstatel, A and "a" were established for rockswith different I, S L n and C '1' 1, 0.It made possible 1.11 establish the following:1) nispersity incrc:ise in the series sandsandyloam-luam, fur <strong>on</strong>e subgroup of I,0 st.ruc-, ./tures with LD particle c<strong>on</strong>tent, practicallyalways leads to the increase of values Wtot;2 ) LD particle c<strong>on</strong>tent. increase with <strong>on</strong>e andthe same finely dispersed comp<strong>on</strong>ent type reducesWtot and increasr F, PC (there is no c<strong>on</strong>siderabledifference bet.ween Wtott 3nd PC for theframe 1,D structures, irrespective of the FCdispersity increase, but we could nor. say thesame ahout fhe r-ange of their variati<strong>on</strong> series).Clearly, the changes of P M P (physicomechanicalproperties) of large detrital rocks,1, S I, r) and C '7 L 1) affect. in a definite waythe formati<strong>on</strong> of A and "a" roefficicnt v~lues.'rhus, fur example, in'layer 3 (Fig.la\, gravelpebbleLO with sandy SC: is charart.erized byframe and unfully c<strong>on</strong>tact L S L 0.Similar L S I, n types are typicnl for separatelevels of gravelpcbble I,D, the scctiuns ,of them are shuwn in Fig.lb and LC. Sut C 1' L Dand \Jtot differ greatly from each other inevery c<strong>on</strong>crcte case. C<strong>on</strong>tact-fully crust-massiveC 'I L 4 (W~~)t=0.20-O.I8) are dcveloyrid in therange from 4.0 t u 6.0 m (Fig.la), c<strong>on</strong>La~tunfullycrust-massive C T L D (Wtnt=0.12-0.08)-i n the range from 5.[) 1.0 8.0 m. In thr firstcase the ice crust thickness un the c<strong>on</strong>tactsbetwccn rock dehris equals 1-2 mm, in the s~~c<strong>on</strong>d- 2 -3 mm. In the process of thawing ht'al settlcmcntor rocks A, with less values Wtrrt werc1 .5-2.0 tlnles highc,r than in the rucks w ~ t hgreater values Idtot. Tt. shows that the pussibi-l i t y 1.0 evaluate A, arcording to Wtt,t ch<strong>on</strong>gre,even i n the quantitative respcct, is rRt.herproblematic fur 1.n. That thc ahuve-menti<strong>on</strong>ed-a P,"1228
example is not the <strong>on</strong>ly <strong>on</strong>e is seen from thedata in Pig.lb and Fig.lc. Tn Fig.lb c<strong>on</strong>tactcrust-lentiformC T L D are developed al<strong>on</strong>g thesoil profile of gravelpebble LD with loamy FC(layer l), and they differ <strong>on</strong>ly in the thicknessof ice crust <strong>on</strong> rock debris, In the rock profilefrom 9.0 and down and from 3.0 to 4.0 the ice -crust thickness <strong>on</strong> large detrital particlesequals 1-2 mm, in a layer between these depththe ice crust thickness <strong>on</strong> rock debris hardlyaverage 1 mm, but <strong>on</strong> the c<strong>on</strong>tacts between themit equals 1-3 mm. That is why A, values arehigher in LO with the same C T I, T) t.yyeu butwith lower values of their '{tot.Geologo-genetic anti regi<strong>on</strong>al peculiaritiesof formati<strong>on</strong> greatly influence deformati<strong>on</strong>values of thawing larpe detrital rocks of80-cryolite z<strong>on</strong>e. A, dzpendence <strong>on</strong> large detritalparticles c<strong>on</strong>tent (K,) for large detrital rocksof different genesis is shown in Fig.2.There were no^ less than 5 separate definiti<strong>on</strong>swhen calculating A, and Wtot in everycase. Generalized curvcs were obtained for LDof diffcrent genesis wit.h sandy (Fig.2a)., sandyloam (Fig.2b) and loamy (Fig.2~) finely dispcrstdcomp<strong>on</strong>ents. It follows from the deeendenccsindicated in the figure that when Kv c<strong>on</strong>tent inLD increases from 0.1 to 0.9, A, values- decreases. In the first part of the segmentKv=0.1-0.5, the rate of the decrease is t4t'highest for all tD genetic types and increasr.~with the increase of FC dispersity. Its largestvalues are typical for. alluvial, fluviolacialand diluvial-soliflual LD deposits: i.c. deposits$-la-18060i404012020100080i2010080604020"6040200.1 0.3 0.5 O?Fig.2 Standard thawing coeific lent v~luc chanu~s [Ao\ of diffcrent genesis large detrilsl ror;hs forseparate regi<strong>on</strong>s of Russia. C<strong>on</strong>diti<strong>on</strong>al symhols: l-Udokall range, 2-Vit. im-Patorn plateau, 3-Stanovoyrange, 4-Chulman hollow, 5-Chita-lngoda qullow: ?,(Is, fg, H -corresp<strong>on</strong>dingly LD of eluvial,diluvial-soliflual, fluvio-glacial, di luvial arlri alluvial genesis, Yto,:=24-10 - st.~nrlard values oftotal moisture (the first number - when K,=O.55-0.15, t.hcSCCOII~ - whcn Kv=0.85-0.90j.-- 1229 -
that are characterized by comparatively highvalues Wtot. great variati<strong>on</strong>s of C T L D, weaklithificati<strong>on</strong> or good roundness of largedetrital particles, its least values are typicalfor eluvial and diluvial LD. An excepti<strong>on</strong> iseluvial LD having been formed in weatheringgranites of Stanovoy range, the variati<strong>on</strong> rangeWtot (Fig.2a) is similar to variati<strong>on</strong> rangeWtot for diluvial-soliflual LD deposits withloamy FC (Fig.Zb). Tn the segment of Kv from0.5 to 0.9 the rate of A, changes drastically.nut differentiati<strong>on</strong> of its values for LD ofdifferent-genesis is practically invariable.Here the Wtot influence <strong>on</strong> the rare of A,changes reduces drastically, because though Wtotvalues are practically the same for LD ofdifferent genesis, the differences between 7.are rather great. Tn this c<strong>on</strong>necti<strong>on</strong> ourhypothesis about the predominant influence ofthe distributi<strong>on</strong> character of ice inclusi<strong>on</strong>s(C T L Dl over Wtot <strong>on</strong> A. changes becomes, inour opini<strong>on</strong>, more evident.Thus, based <strong>on</strong> the results of this study,it is c<strong>on</strong>cluded that:-in the segment of ,changes of Kv c<strong>on</strong>tentfrom 0.5 to 0.9 1ithogene.structures andcryogenic textures of LT) have predominantinfluence <strong>on</strong> A, value:-the largest A. values and the highest rateof their decreasing with the Kv increase from0.1 to 0.9 are typical for alluvial, fluvioglacialand diluvial-soliflual LD deposits.-changes of A,=f(Wtot, Kv, Kfc) in thesegment KV=O.1-O.9 irrespective of LD genesisand FC type are descibed by the followingcquat.i<strong>on</strong>t:A. - wtot . KFC (n,K, + "2KFC)where nl, n2 - empirical coefficient; K~c=l-K,bi,e KFC - volume compositi<strong>on</strong> FC in LD.The results of the research are tested andput into practice in desitning and c<strong>on</strong>structingof large mini'ng complexes of Eastern Siberia.REFERENCESnavidenko V.P., (1981) Classificat,i<strong>on</strong> of Complexityof <strong>Permafrost</strong>-Engineering-GeologicalC<strong>on</strong>diti<strong>on</strong>s <strong>on</strong> the Basis of Setting Evalua~iunin Frozen Large Detrital Grounds Thawing (<strong>on</strong>the example of central districts in theMagadan regi<strong>on</strong>), In the hook "Thawing Groundsas Strdcture Foundati<strong>on</strong>s". -M.: Nedra,pp.72-92.Osipov V.I., (1985) C<strong>on</strong>cept "Ground Structure"in Engineering Geology. In the Journ. Eng.Geology, No.3, -M. Nauka, pp.4-20.Shesternyov D.M., (1986) On the Problem ofC1,assificati<strong>on</strong> of Large Detrital RockCryogenic Textures. In the book: Eng. Geol.Investigati<strong>on</strong>s in the <strong>Permafrost</strong> Regi<strong>on</strong>.Rlagoveshchensk, pp.331-333,Shesteryov 9.M., Yadrishchensky G.E., (1990)Qock Structure and Properties of iJdokanCryolite Z<strong>on</strong>e. Novosibirsk.: Nauka, p.126.Tsytovich N.A., Kr<strong>on</strong>ik Ya. A., (1973) Physicaland Mechanical Properties of Frozen andThawing Large Detrital Grounds. In the book:TT Tnternati<strong>on</strong>al <strong>Permafrost</strong> <str<strong>on</strong>g>C<strong>on</strong>ference</str<strong>on</strong>g>. Rep.and inform., Vo1.4, Yakutsk, pp.52-62.llshkalov V.P., (1974) Building Properties ofPerennially Frozen Rasis and Quick Methodsof their Determining. Novosibirsk: Yauks,p.84.Vcdernikov L.E., (1959) <strong>Research</strong> into FrozenLarge Tletrital Grounds. Proceedings ofAll-llni<strong>on</strong> <strong>Research</strong> Institute-Magadan, Vol. 13,pp.43-267,Votyakov T.N., (1975) Physicomechanical Propertiesof Frozen and Thawing Grounds in Yakutia.Novosibirsk: Nauka, p.2715.Vyalov S.S., (1979) Engineering "ioblems inGeocryological Investigati<strong>on</strong>s <strong>on</strong> sites ofRAM, In the book "Engineering <strong>Permafrost</strong>ology"M.: Nauka, pp.149-156.Ziangirov R.S., Kilbergenov R.G., (1987)Deformability Evaluati<strong>on</strong> of Large detritalGrounds. Engineering Geology, No.3, M.:Nauka, pp.107-109.1230
PALSA FORMATION IN THE DAISETSU MOUNTAINS, JAPANToshio SONE1 and Nobuyuki TAKAHASHI'Institute of Low Temperature Science,Hokkaido University, Sapporo, 060, Japan'Hokkai-Gakuen University, Sapporo, 062, Japan ,Palsas and peat plateaus, in different stages of development, exist in a mire(1,7201~1 a.s.1.) in the Daisetsu Mountains (43'37' N). They c<strong>on</strong>sist of peat cover about 1 mthick and permafrost core of sand and silt. Many segregated ice lenses were visible inthe silt layer. The permafrost base is at a depth of 5m. Ground temperature observati<strong>on</strong>sin the palsa indicates that temperature is in equilibrium with the present climate, andthat permafrost can develop under present climatic c<strong>on</strong>diti<strong>on</strong>s. On thebasis of two tephralayers in the peat, the palsa was initiated to heave in around A.D.1830.INTRODUCTIONPalsas and peat plateaus are comm<strong>on</strong> features in manypermafrost regi<strong>on</strong>s. According to the definiti<strong>on</strong> of palsas, theyare peaty permafrost mound possessing core of alterati<strong>on</strong>layers of segregated ice and peat or mineral soil material(N.R.C.C.,1988). They are c<strong>on</strong>sidered to be the <strong>on</strong>ly reliableindicator of the disc<strong>on</strong>tinuous permafrost (Brown,1974).However, palsas or palsa-like mounds are recently reportedalso In c<strong>on</strong>tinuous permafrost (Washburn, 1983a).In Japan, palsas were first discovered in 1986 and theirfOrmS.Si28S and distributi<strong>on</strong>s were reported (Takahashi andS<strong>on</strong>e, 1988:S<strong>on</strong>e et a1.,1988). The authors attempted tomeasure the ground temperature profiles of a palsa andinvestigated its internal structures by drilling. In this paper,we describe the results and discuss the type and age of palsasin the Daisetsu Mountains.ENVIRONMENTAL SETTINGS OF THE DAISETSU MOUNTAINSThe Daisetsu Mountains are located in central Hokkaido,northern Japan. Thay are.cornposed of Pleistocene pyroclasticor lava plateaus with several younger strato-volcanoes. Manykinds of periglaciai phenomena and landforms, such as earthhummocks. sorted polyg<strong>on</strong>s, block fields and slopes, and frostcrack polyg<strong>on</strong>s have been reported. Disc<strong>on</strong>tinuous permafrostis distributed mainly of the windward bare ground above 1650m (S<strong>on</strong>e.1992). Palsas were dtscovered in a mire. Theyindicate geornorphologicaly the existence of permafrost ataround the lower limit of permafrost in the DaisetsuMountains.The mire at the south of Mt.Hira$a-take IS located at analtitude of 1720 rn(43'36'54"N, 142'54'06"E). <strong>on</strong> a broad passof the lava plateau between Mt.Chubetsu-dake and Mt.Hakuundake(Figure 1). The length of the mlre is about 650m fromeast to west, and 350m from north to south. The surroundingvegetati<strong>on</strong> of the mire is Pinus pumila community, The mireis characterited by palsas, peat plateaus and string bogs. Inthe Daisetsu Mountains. palsas and peat plateaus develop <strong>on</strong>lyin this mire.Figure1 Locati<strong>on</strong> of the palsa mire in the Daisetsu MountainsThe elevati<strong>on</strong> of the timber line around the mire Is about1,500 - 1.600m a.S.1. The mean annual air temperature, and thefreezing and thawing indexes at the mire are estimated to be -2.0'C, 2,OOo"Cdays and 1 ,50OoCdays respectively (S<strong>on</strong>e,l992).1231
2PAULAND PEAT PLATEAUS IN THF MIRE AT M E SOUTH OFKSIIRAGATAKEAbout twenty palsas and peat plateaus exist at thislocati<strong>on</strong> with SiZBS ranging from 4 to 80 m in diameter andfrom 0.2 to 1 m in hoight. Their plan figure is generallycircular ar elliptic. Mostare poat plateaus in morphologicalclassiflcati<strong>on</strong>, and mineral.cored palsas in structuralclasslficati<strong>on</strong>. These are characterized by flat upper surfaceand relatively Steep side slopes, sometimes accompanied withp<strong>on</strong>ds just around thern(Figure 2). <strong>Permafrost</strong> is observed<strong>on</strong>ly under the palsas in the mirs. Severe westerly winds inwinter sweep away the snow deposit of the ground surface,and the snow depth of the mire is less than Im. The top ofpalsas is often exposed partly during awhole winter seas<strong>on</strong>(Takahashf and S<strong>on</strong>e,1988)..For an Investigati<strong>on</strong> of internal structures and m<strong>on</strong>itoringthe ground temperature. a palsa was chosen. Palsa 6. namedby Takahashi and S<strong>on</strong>e(1988), is 80cm high and 1 Om l<strong>on</strong>g,el<strong>on</strong>gated in north-south directi<strong>on</strong>. The palsa is composed ofa peat layer of 60 - IlOcm thick underlain by silty sand andgravel layer. The permafrost table is about 70cm deep and wasnearly parallel to the palsa's surface in late September. Thepermatrost table is nearly cotncident with the boundarybetween the peat and the silty sand and gravel layers. Thesnow cover thickness was measured as much as 40- 60 cmdeep or! the east and west side of palsa <strong>on</strong> 29th December,1986. However, the snow was less than 40 cm deep <strong>on</strong> the topof palss D, and some parts of palsa were exposed. A small p<strong>on</strong>d<strong>on</strong> the south part of palsa indicates that part of this featurehas begun to decay.BORING CORE ANALYSIS OF PALSA BDrilling of the top of the palsa was attempted in late June,1988 and 1989. Core samples with a diameter of 4.5 ctn wereollected from the ground surface to a depth of 423 crn foranalysis of stratigraphy, water c<strong>on</strong>tent, bulk density andigniti<strong>on</strong> loss tn 1988. The depth of permafrost base wasobserved to be 500 cm in 1989.Figure 3 shows the internal structure of palsa 6. It's topwas peat with a thickness of 80 cm, the lower part of whichc<strong>on</strong>tained sand and gravel. The peat layer was underlain bysand and gravel with a silty matrix (80- 170 cm). At thedepth of 150 cm. a thin ice lens was visible. The sand andgravel layer was underlain by silt with sand and gravel (170- 220 cm). Thin ice lenses (1 ~ rnm) were found in this siltlayer. This silt laye: was underlain by sand and gravel withsilty matrix (220 - 250 cm). From the depth of 250 cm, siltlayer extended to the bottom of the core sample. This lowersilt layer includes alternati<strong>on</strong>s of ice-lenses and frozen soillayers indicating rhythmic ice-lens formatl<strong>on</strong>. The thicknessof the ice-lenses in this silt was 1 - 3 cm. These ice layerswere corkentrated in the lower part at.the depth of 320 cmfrom the ground surface.0 500 1000 0 1.0 '2.0 0 50 100WATER CONTENTIWt %) BULK IGNI'IION@ENSITYlg/cm31 LOSS(Wt %IFlgure 3 Water c<strong>on</strong>tent, bulk density and igniti<strong>on</strong> loss of the blring core of palSaB
Care samples were transported to a low temporaturelaboratory In frozen state. Each sample was cut and secti<strong>on</strong>edwith thickness of 3 - 7 cm. In analysis of bulk density, eachsecti<strong>on</strong>ed sample was welghed in air and In kerosene at -10°Cin the laboratory. After drying for 2 hours at a temperature ofll0"C. the alr-dried weight was measured. The results of theanalyses are alsa shown In Flgure 3.The water c<strong>on</strong>tent of the upper peat layer was more than200 %,while those of the mineral layers down to 2.6 m werelower than 110 %.The high water c<strong>on</strong>tent of the upper peatlayer, does not, however, indicate the richness of ice. Sinceorganic materials are lighter than the mineral <strong>on</strong>es, theformer show higher water c<strong>on</strong>tent of a percentage dry weightbasis, In fact, hlgh igniti<strong>on</strong> loss of the peat layer Indicates ahigh organic c<strong>on</strong>tent in the upper peat layer than the lowerpart of the core. The bulk density of the peat layer was lowerthan 1.0, while that of mineral layers until 2.6 m deep fromthe ground surface was higher than 1.5.Water c<strong>on</strong>tent in the lower sllt layer was variable, partlyvery hlgh and partly low: 438.3 %, 891.2 %and 624.8 96 atdQpthS of 341 -345 cm, 345-351.5 cm and 398.5-404. 5 cmrespectively, while 60 %, 63.9 %and 69.4 % at depths of285.5-291 cm, 310.5-361 cm and 367-371.5 cm respectively.The bulk denslty was also variable in the lower silt layer.A high percentage of water c<strong>on</strong>tent and relatively low bulkdenslty suggest that the mineral samples are rich in icelenses. Silt is usually very frost-susceptible. In fact, the icel<strong>on</strong>ses or layers develop mostly in silt layors, eepeclally inthe lower silt layer below the depth of 320 cm, where'theyc<strong>on</strong>sist of pure ice.These ice-lens layers are surely formed not by ice injecti<strong>on</strong>but by ice segregati<strong>on</strong>, because they are parallel to thefreezing surface and alternate with frozen silt layers.THERMAL -- REGIME IN PALSA EThe authors carrled out a c<strong>on</strong>tinuous m<strong>on</strong>itoring of groundtemperature at the top of palsa €3, where the ground surface isoften exposed in winter. As a result, nearly year-round groundtemperature data were obtained.(A) TEMPERATURE(.C) (B) TEMPERATURE('C)-30 -20 10 0 10 20Figure 4 (A) Every fivo day profiles of mean daily groundtemperature (E>) Maximum, minimum and mean groundtemperatures at palsa B from September 1987 to SeptemberI 9aaOn palsa B, the temperature sensors (Pt 100) were insertedin another bore hole at the depths of 0 cm, 30 cm. 70 crn;100cm and 150 cm. Ground temperature records were obtained atevery two-hour interval from September 14, 1987 toSepternbar 21, 1988 except for 10 days in June. Figure 4Ashows every five day profiles of mean daily groundtemperature for this durati<strong>on</strong>. The temperature ranges andmean values of mean daily ground temperatures at eachpositi<strong>on</strong> of palsa are indicated in Figure 48.The seas<strong>on</strong>al fluctuati<strong>on</strong> of alr temperature affected theground temperature variatl<strong>on</strong> at each positi<strong>on</strong>. From October,toDecember in 1987, the ground temperatures of the paisa atdepths of 70.100 and 150 cm were neably c<strong>on</strong>stant, and veryclose to the freezing point; these periods should corresp<strong>on</strong>d tothe "zero curtain" at each depth. The ground temperatureremained below 0°C at below a depth of 150 cm. The depth ofthe permafrost table is estimated to be 105 cm <strong>on</strong> the basis ofFigure 40. The temperature measurement of palsa indicatesthat the temperature of the upper porti<strong>on</strong> <strong>on</strong> the ground isadjusted to the present climate, and that permafrost candevelop at sites with thin snow cover, even under presentclimatic c<strong>on</strong>diti<strong>on</strong>s in the mire.The thermal properties of peat c<strong>on</strong>tribute to thepreservati<strong>on</strong> of permafrost (Brown and Pewe, 1973). Theannual mean ground temperatures are calculated to be -3.5"C,-3.1 and -2.9 at 70 cm, IOOCm and 150 cm deep respectively(Figure 48). The mean annual temperature of the groundsurface of palsa is calculated as to be ;2.6'C. while themean annual temperature of the ground at depths of 70, 100and 150 cm are lower than that of the ground surface. Thisfact reveals that the thermal properties of peat affect thetemperature profiles at this site.DSAND AGE OF PALS.A FORMATIONWashburn (1Y83b) proposed that palsas comprise twodifferent forms: <strong>on</strong>e is an aggravati<strong>on</strong> form due to frostheaving by growth of ice; the other is degradati<strong>on</strong> form due tothe disintegrati<strong>on</strong> of an extensive peaty deposit. The twotypes of palsas are difficult to identify by shape (Washburn,1983b). Whlle the degradatl<strong>on</strong>al type indicates thermokarstprocesses, the aggrzdatl<strong>on</strong>al <strong>on</strong>o indicates the growth ofpermafrost undorneath.On the basis of the comparis<strong>on</strong>s of air photos taken in1955, 1966, 1971, 1978 and 1982, the changes in site andareal extent of palsas and peat plateaus during the period of1955-82 were examined (Takahashi and S<strong>on</strong>e, 1988). Theirtotal area was reduced by 36 %over 27 years. However, thereare several palsas that were hardly reduced.On the c<strong>on</strong>trary, a palsa appeared <strong>on</strong> the photograph takenafter 1971. It was not visible <strong>on</strong> the photographs taken in1955 and1966. This indicates That the paisa grew after 1971,In additi<strong>on</strong>, another palsa. which was discovered in the fieldsurvey, seems to be iwan early stage of devetoprnent. Hence,some palsas seem to be In the growth stage.While string bogs around the palsa develop in harm<strong>on</strong>y withthe present slope directi<strong>on</strong>, traced <strong>on</strong> the string bogs remain<strong>on</strong> the surface <strong>on</strong> palsa 8. Therefore, the palsa began to growafter the string bogs were formed. This shows that the palsawas upheaved recently by permafrost aggradati<strong>on</strong>, becausethere is no permafrost underneath the string bogs, developingat lower places than surroundings. The palsa c<strong>on</strong>tains thesegregated ice layers in the lower silt layer, and the groundtemperature profiles of the paisa indicate that at least theupper part of the palsa was affected the present seas<strong>on</strong>alalternatlGns of air temperature. Therefore, ice-lens layers ofpalsa can bo formed under present climatic c<strong>on</strong>diti<strong>on</strong>s.. 1233
ACKNOWLEDGMENTSxcrophilous pcathydrophilous pcatTa-a ashKO-cz ashThe authors wish to thank ProJessors M. Fukuda and Y.Ono(Hokkaido University) and Dr.M.Sumita (GEOMAR, KielUniverslty) for their suggesti<strong>on</strong>s and her instructi<strong>on</strong>s <strong>on</strong>tephra layers. They are also indebted to Mr.Y.Watanabe(Photographer), Mr.N.Yasuda (Curator, Sounkyo Museum),Mr.H.Daimaru, Mr.T.Sato, Mr.H.Muto, Mr. K.Yoshikawa,MrONagaoka, Mr.DtOgawa, Mr.S.lshimaru, Mr.A.Ozawa (graduatestudents, Hokkaido University, at that time) for theirencouragements and assistances in the field.Figure 5 Columnar secti<strong>on</strong> of surfacial peat layer of palsa BThe peat layer in palsa B c<strong>on</strong>sists of two types of peat;xerophilous peat in tho upper part and hydrophilous peat in thelower part (Figure 5). Two tephra (volcanic ash) layers areembedded in the peat layer at depths of10,0-12.5 cm and 14.0-15.0 cm from the surface. These layers are "Tarumai-a ash(Ta-a) and "Komagatake-c2 ash" (KO-cP), deposited in A.D.1739and A.D.1694 respectively (Endo et a1.,1989). The boundarybQtWeen the xerophilous and hydrophilous peat is at a depth of6 crn from the surface. On the basis of the rate of peataccumulati<strong>on</strong> between the tephra layers, the hydrophilous peatceased to accumulate in A.D.1829. The change from thehydrophilous to the xorophilous peat indicates anenvir<strong>on</strong>mental change from wet c<strong>on</strong>diti<strong>on</strong>s to dry c<strong>on</strong>diti<strong>on</strong>s atthe site. Therefore, it is c<strong>on</strong>sidered that the upheaval of palsabegan in around A.13.1830.The authors c<strong>on</strong>clude that some palsas and peat plateaushave been formed under present climatic c<strong>on</strong>diti<strong>on</strong>sassociated with permafrost aggradati<strong>on</strong> in the DaisetsuMountains.A c<strong>on</strong>siderabla thickness of peat is required for palsaformati<strong>on</strong> at thls locati<strong>on</strong>, because the thermal properties ofpeat c<strong>on</strong>tribute to the formati<strong>on</strong> of a palsa (Zoltai andTarnocai,l971). According to Seppala (1988), the minimumthickness of insulating peat layer, nlwded for paisa formati<strong>on</strong>in a regi<strong>on</strong> with a mean annual air temperature of -2.O"C, isabout 40 cm. In the mire, a peat cover of more than 60 cmthick is necessary for the growth and persistence of palsa(Takahashi,l990). The14Cage of the peat samples at 40 cmbelow Ko-cl layer (A.D.1694), was measured at 4,520*130B.P.(NUTA-455) (Takahashi et al.,l988). The mean rate of peataccumulati<strong>on</strong> iT! the mlre Is calculated to be about 0.1mmlyear. The thickness of the peat of palsa is 80 cm.According to the mean rate of peat accumulati<strong>on</strong>, 6,000 yearsare required to accumulate the peat thicker than 60cm, in thethermal c<strong>on</strong>diti<strong>on</strong> for peat glowing is c<strong>on</strong>stant. The peataccumulati<strong>on</strong> In the mire of the Daisetsu Mountains beganaround 7,000B.P. (Takahashi, 1990). The beginnlng of the palsaformati<strong>on</strong> In this mire, therefore, is calculated to be after1,000 B.P., though more data are required for therec<strong>on</strong>structl<strong>on</strong> of the developmental history of palsas and peatplateaus in the mire.From a view of the internal structure, palsas and peatplateaus in this locati<strong>on</strong> are not easy to grow in their earlystageof development. Because frost-susceptible silt, inwhich ice-lenses grow effectively, is under 2.5 m deep from?he ground surface, the paisas and peat plateaus do not beginto heave untll freeztng penetrates to the silt layer,REFERENCESBrown, R.J.E.(1974) Some aspect of airphoto interpretati<strong>on</strong> ofpermafrost in Canada. Nati<strong>on</strong>al <strong>Research</strong> Council of Canada,Divlsi<strong>on</strong> of pullding <strong>Research</strong>, Technlcal Paper, 409,20p.Brown, R.J.E. and PbwB. T.L. (1973) Distributi<strong>on</strong> of permafrostin north America and its relati<strong>on</strong>ship to the envir<strong>on</strong>ment:Areview,..l963-1973. <strong>Permafrost</strong> North AmerlcanC<strong>on</strong>tributi<strong>on</strong>, Sec<strong>on</strong>d <str<strong>on</strong>g>Internati<strong>on</strong>al</str<strong>on</strong>g> <strong>Permafrost</strong> <str<strong>on</strong>g>C<strong>on</strong>ference</str<strong>on</strong>g>,Yakutsk, USSR, Nati<strong>on</strong>al Academy of Science Publicati<strong>on</strong>2115, 71-100.Endo, K., Sumita, M. and Uno, R. (1989) Late-Holocene tephrasequences in eastern Hokkaido and their source volcanoes.Journal of Geography, 98, 506-510.Nati<strong>on</strong>al <strong>Research</strong> Council of Canada (1988) Glossary ofpermafrost and related ground-ice terms: TechnicalMemorandum No.142, p.156.Seppala M. (1988) Palsas and related forms. In "Advances Inperiglaclal geomorphology" edlted by Clark M.J., 247-278,John Wiley 8 S<strong>on</strong>s Lid.S<strong>on</strong>e, T.(1992) <strong>Permafrost</strong> envir<strong>on</strong>ment of the DaisetsuMountains, Hokkaldo, Japan. P.P.P., 3, 235-240.S<strong>on</strong>e, T., Takahashi, N. and Fukuda, M. (1988) Alpine permafrostoccurrence at Mt.Talsetsu, central Hokkaido, in northernJapan, <strong>Permafrost</strong>; Proceedings vol.1, Fifth <str<strong>on</strong>g>Internati<strong>on</strong>al</str<strong>on</strong>g><str<strong>on</strong>g>C<strong>on</strong>ference</str<strong>on</strong>g> <strong>on</strong> <strong>Permafrost</strong> in Tr<strong>on</strong>dheim, Norway, August1988, Tapir Publishers, Tr<strong>on</strong>dheim, 253-258.Takahashi N. (1990) Envir<strong>on</strong>mental-geomorphological study <strong>on</strong>the Holocene mire development in the DaisetsuzanMountalns, central Hokkaido, northern Japan. Envir<strong>on</strong>.Sci.,Hokkaido University, 13(1), 93-156.Takahashi, N.and S<strong>on</strong>e, T. (1988) Palsas in the DaisetsuzanMountains, central Hokkaido, Japan. Geographical Review ofJapan, 61, 665-684.Takahashi, N., Nakamura,T., S<strong>on</strong>e, T. and Igarashi, Y. (1 988) 14Cdates around the bottom of peat layer in the bogs <strong>on</strong> theDaisetsuzan Mountains, central Hokkaido, Japan. TheQuaternary <strong>Research</strong>, 27, 39-41,Washburn, A.L. (1983a)Palsas and q<strong>on</strong>tinuous permafrost,<strong>Permafrost</strong>, Forth Inter?. C<strong>on</strong>f. Proc.. Nat. Acad. Press,Washingt<strong>on</strong>, D.C., 1372-1377.Washburn. A.L. (1983b) What is a palsa ?. Akad. Wiss. GottingenAbh., Math.-Phys. KI. Folge 3, 35, 34-47.Zoltai. S.C. and Tarnocal, G. (1871) Property of a wooden palsain northern Manitoba. Arctlc and Alpine <strong>Research</strong>, 3, 115-129.'1234 -
A STUDY ON CHARACTERISTICS OF ICE-DAMAGE ANDPRVENTION OF HYDRAULIC PROJECTS IN NORTH CHINASu Shtng hi and Zhang TiehuaTian Watat Reoourccs and C<strong>on</strong>scnjancy Bureau-heed OD investigati<strong>on</strong> and analysis, thiu paper introduces th6 characteristics of ice damage, the effect ofiw damage <strong>on</strong> hydraulic projects, the counter measure and design for preventing icc damage, and someobtained result8 in the North China. Thaai prcscntnti<strong>on</strong>s could c<strong>on</strong>tribute to a reference of assuring asafe operati<strong>on</strong> and denim of hydraulic projbets.INTRODUCTIONTht North China is about 0.32 milli<strong>on</strong> square killometers inuta. It is close to the Bohai ICP <strong>on</strong> the eaat, naar by Taihang moun-Win <strong>on</strong> the west, attained to Yellow river <strong>on</strong> tha south and againstthe her M<strong>on</strong>golia platenu <strong>on</strong> the notth. It bohp to thelemi-dry rn<strong>on</strong>qo<strong>on</strong> climata of tefipcruc =ne. In winter, the (1~tkg north wind runs cumntly, and al<strong>on</strong>g aeaohore, river and mr-voir etc. the hydraulic projseto have auffcmd from acrioua ice damageand brought about certain effect <strong>on</strong> the living of people.In North China, Northeast and Northwest area, there are differentdcgrce processes of freezing-thawing in water areas of river,mcrviors etc. in winter. In Northeast area, there are a l<strong>on</strong>ger freezeand a thicker ice layer, such as, the thickness of ice layer is1.8-2.8m in Heil<strong>on</strong>gjang river and the frcczc is 180 days. or so.The characteristic of ice damage is that the damage of frorcn soil ismore serious than thrt of the running ice. Northwest area has ashorter freeze bccause of the effect of alpine air flow, BO the periodof running ice is l<strong>on</strong>ger before freezing. The characteristic of ice' damage ia that the damage of running ice is more serious than thatof frozea soil. In regi<strong>on</strong> of North China, the freeze is about 120days. Thickness of ice layer is 0.3-0.5m and the maximum thicknessof icc layer is 1.2m. The characteristic is double damagcs offrozen soil and running icc:The characteristic shows that the icedamage in North China is more serious than that in Northeast andNorthwest ma.Tianjn is a typical regi<strong>on</strong> of ice damage in North china . Bocause of affecti<strong>on</strong>s of dynamic, static and fricti<strong>on</strong>al force etc produdby ice layer and ninning ice during the process offreezing-thawing in winter, the hydraulic project al<strong>on</strong>g river andseashore etc. suffered from serious damage.According to records of Feb. and March in 1936,1947,1957,1969 and 1977, the coart of Bohai sea bay <strong>on</strong> the north-ern regi<strong>on</strong> was formed c<strong>on</strong>tinuous icc layer. This caused many facilities(e& ship and platform of petroleum ctc.) suffered from seriousdamage. ,.In water arcas of river, canal and rescrvior etc, because of iceresistance produced during the process of ict growing, there are affecti<strong>on</strong>of static ice pressure after ice tha wing and affecti<strong>on</strong> of dynamiclash and fricti<strong>on</strong> when ice thawing. particularly, there is anaffecti<strong>on</strong> Qf obstructi<strong>on</strong> during the period of running ice in spring.So, thcse acti<strong>on</strong>s will bring violent hit to bucpier of bridge andagueduct and result in serious loss of projxts.In short, the damage of ice, and hydraulic projxts arc fairly seriousin winter in North China. Therefore, we must investigate andanalyzc eeriousiy c<strong>on</strong>diti<strong>on</strong>s, sum up these experiences and take efficientmcnsurcs to ensure a safe operati<strong>on</strong> of hydraulic project.THE EFFECT OF ICE DAMAGE IN WINTERThe Obstructi<strong>on</strong> of Canal and Trashrack Produced by IceAl<strong>on</strong>g hydraulic project line, there are trashracks, which arccomposed of steel belts weldded and has a interval of 7-8cm betweenbelts, in the fr<strong>on</strong>t pool of every pump itati<strong>on</strong>. Since the thinice is unsteady and broken easily in early winter, so, thcsc hrokcnices flow to the fr<strong>on</strong>t of trashrack with water and mass to form II icestack besides a fracti<strong>on</strong> of broken ice ipto fr<strong>on</strong>t pool throughtrashrack. Meanwhile, the bottom of ice stack dives with rivers andnestles closely against trashrack. This results in the rcducti<strong>on</strong> rfflowsecti<strong>on</strong> and decrease of water level. So, it often causes accidentof cuttinl off water when water level of the fr<strong>on</strong>t pool drops dnanto critical submerged water level of.the flow entrace. When icc laverof canal thawes in the yeany middle of Febrary, there will be manyrunning ice of different size massing in fr<strong>on</strong>t of trashrack: In thisstage. since the body of running ice is thickness in size, softer in tex-1235
ture and bigger in buoyancy, so they do not dive generally and notbring about the the phenomen<strong>on</strong> of ice stack also. But when theymeet the pile of grass in fr<strong>on</strong>t of trashrack, they will form a "mixtureof ice-grass". This will not <strong>on</strong>ly result in reducti<strong>on</strong> of flo,w, butalso form an ice-dam in fr<strong>on</strong>t of trashrack. During proecss of therunning ice advancing in open canal in spring, if there is ice stack toresist flow in fr<strong>on</strong>t of the backward siph<strong>on</strong> tunnel. This will causeincrease of water level of upoer reaches and form ice flood. -Damage Under Static Ice Pressure of C<strong>on</strong>ti<strong>on</strong>uous CloyIce Cover- , . . . ". . ", -In early winter, the ice cover becomes more stable with thechange of air temperature in day and night, the expansi<strong>on</strong> of icecover takes <strong>on</strong> periodic change. Meanwhile, the static ice pressurealso increases with increase of expansi<strong>on</strong>. vice versa; In thawingstage of ice, the expansi<strong>on</strong> of ice layer increases c<strong>on</strong>tinuously withgradual increase of air tempcrature. The value of static ice pressure /which put itself brokenness of ice layer as a maximum limit relateswith thickness of ice layer, boundary c<strong>on</strong>diti<strong>on</strong>s, allowabledeformati<strong>on</strong> and rigidity. That is, the thicker the ice layer, the biggerthe boundary rigidity, the shorter the affecting, span, and thehigher the air temperature, the bigger the static ice pressure.Otherwise, it is oppsite. So, the damages of different degrees occur<strong>on</strong> the bank-wall of fr<strong>on</strong>t pool, both side slopes of canal, slope ofreservior and wall of anti-wave al<strong>on</strong>g Yinluan line.Since the slope of canal or reservior is pushed by the static icepressure or'ice layre, so, the slope which has slope of 1:3 anduneven surface can be damaged. Its law of damage is that slopeprotecti<strong>on</strong> which has slope protecti<strong>on</strong> built by laying st<strong>on</strong>es isdamaged and surface of dyke without slope protecti<strong>on</strong> is damaged.Positi<strong>on</strong> of damape generally occurs <strong>on</strong>to sun slope or corner ofdyke. In thawing stage of ice layer, the temperature is different atday and night. At night, the ice layer c<strong>on</strong>tracts forming c<strong>on</strong>tinuousor disc<strong>on</strong>tinuous crack, then is filled with water forming a new c<strong>on</strong>tlnuousice layer. From 8 to 14 o'clock <strong>on</strong> the next day, with thein.:rease or air tcmpreature, the ice layer expands and climbs upintermittently al<strong>on</strong>g sun slope of dyke,. As a result of climbing, thepush force of climbing ice is produced. This push force can bringabout serious damage IO the wall of anti-wave or sub-cofferdam.For cutting offpassagewavwhich the ice layer climbed up, thethawing z<strong>on</strong>e was cleared out by artificial way to protect'the wall ofanti-wave, but the cost of artificial clearing needs 6000 Yuan everyyear.Because of c<strong>on</strong>tinuous acti<strong>on</strong> of static ice pressure of ice layer,the fr<strong>on</strong>t pool of pump stati<strong>on</strong> often suffered from damaged. Suchas the fr<strong>on</strong>t pools of pump stati<strong>on</strong> in Yinluan project which arecomposed of two sidc upright walls of pump room and canal of enteringwater, the damaged place was mainly <strong>on</strong> the two side uprightwalls of sheet pile of reinforced c<strong>on</strong>crete. Under static ice pressure,the expansi<strong>on</strong> joint of sheet pile wall was moved 3-5cm. On thec<strong>on</strong>tact place of ice layer and the side wall, the epidermis of c<strong>on</strong>-crete fell off and had a devoloping rate of I-2mm every year.COUNTERMhASURE FOR AVOIDING ICE DAMAGETake the project of Diverting Water from Luan River toTianjnDWLT project)as an example. In order to enssure a normaloperati<strong>on</strong> of water transport in winter, electric heat c<strong>on</strong>ductingpipe, high water pressure pipe and high air pressure pipe were stUP <strong>on</strong> edges of sluice gate respectively. It was c<strong>on</strong>firmed that beforea c<strong>on</strong>tinubus ice layer was forrned,it was effective to disturb thcfreeting water surface not to form a frozen area by successivepasses of electricity, warter and air, except for a greater c<strong>on</strong>sumpti<strong>on</strong> of power. Once the ice layer was formed, it would be very dimcultto melt the ice using the method.According to lilrious features in DWLT project, the followingmethods were proved to be effective.Countermeasure for Preventing Runing Ice From Blocking up Ca-"nal and Trashrack.r-The failure of icC layet is the reas<strong>on</strong> that the trashrack isblocked up 'in &rry wih't'er. TherCfore, oh6 of the following threemethods may be effective: avoiding' freezing in 'fr<strong>on</strong>t of trashrack;transportink water at a 'sped of less thad0.67m / s, at which icclayer can't be brokdn; trad6ySbrting dater normally afer temporarystop in order to form a c<strong>on</strong>tinuous ice layer.The key to prevent trashrack from blocked up is to avoid theformati<strong>on</strong> ofice-grass mixture in fr<strong>on</strong>t of the trashrack in spring.In order to clear out the ice-grass mixture, the grass grown in winterin fr<strong>on</strong>t of the trashrack has to be cleared out. As l<strong>on</strong>g as nograss exists, the runing ice floaded <strong>on</strong> water wmld'rnelt with thewarming of climate in spring.In the aspect of the blocked up siph<strong>on</strong> with runing ice, afterobservatios fori ten siph<strong>on</strong>s; <strong>on</strong>ly the siphob in Bcijn drainage riverwas blocked up in 1984. It is c<strong>on</strong>sidercd that the soluti<strong>on</strong> is to renewthe' iceproof pier at the entrace of tunnel. Meanwhile;trashrack should be settled within IOm outside the entrace oftunnel. The trashrack should be able to intercept the runing icewhich has"r width of a quacer of the width of tunnel,,resist thepunching of runing ice, and split runing ice.Countermeasure for Preventing The Ice Damage <strong>on</strong> Slopes of Canaland Reservior CofferdmThe k10pes of canal and reservior cofferdam, where the sunshines heavily <strong>on</strong> the North, are pushed off by ice layer. Accordingto obsentati<strong>on</strong> of ground coffer in the North China, the limit ofslope without dope protecti<strong>on</strong> is 1:5, that is, when the Slope isgreater than 15, the slope would be pushed off. The slow whichhas a siope of 1:2 was most heavily pushed off by icelayer, and amound was pushed up by about 1-2~1.The limit of slope, which has a smooth-faced st<strong>on</strong>e lining is1:3. Th&slopc which has a slope of )mort than 1:3. an uneven surfa&.or B unsteady base, would be suffered frqm failure in differentdegrees. Therefore, in the future design, slope protecti<strong>on</strong> must beaccepted. and it is better to use reinforced c<strong>on</strong>crete or COnCerteslope protecti<strong>on</strong> rather than st<strong>on</strong>e. Fabric filteT layer beneath theslope protecti<strong>on</strong> is. the best, The surface of slope protecti<strong>on</strong> shouldbe smooth as possible as it could be.. C<strong>on</strong>sidering the unhinderedclimbing up of the interface Ween ice layer and dop protecti<strong>on</strong>,safe slope should be adapted. Is possible, slippy coating can bepainted <strong>on</strong> the surfacc of lining or slope protecti<strong>on</strong>, SO that the icelayer can climb easily. This is an effective measure to reduce theslope protecti<strong>on</strong>s of canal and reservior cofferdam.1236
If.anti-wave wall, sub-cofferdam and other c<strong>on</strong>structi<strong>on</strong>s arcsit up <strong>on</strong> the top of the cofferdam, the capacity to resist thecompressive strength of ice layer must be calculated. The actingpoint should be checked at 1 / 3 or I /.2 of the height of the wall.This is an effective measure to c<strong>on</strong>troll tile anti-wave wall <strong>on</strong> theslope protecti<strong>on</strong>s of canal and rcservior cofferdam not to bc damagedbv the compressing stress of static ice layer.Countermeasure for Reducing the Static.!ce ,Pressen the Fr<strong>on</strong>t. " ."" .--"" -...Pool of Pump Stati<strong>on</strong>. ." . ""..Aker c<strong>on</strong>tinuous ice layer is formed in the fr<strong>on</strong>t pool in winter,the static ice pressure would be acting from stable stage to meltingstage. The ice pressure is defincd as the combined stress of thecompressive strength of the maximum thickness of ice layer. If theside wall has a greater stability and rigidity, the ice pressure is statedin accordance with the fracture or heave of ice layre. If the capacityto resist static ice pressure is lower, the ice prcssurc <strong>on</strong> theside slope wall is stated in accordance with its deformati<strong>on</strong> orunsteady.Su shengkui's formula is recommended for the calculati<strong>on</strong> ofstatic ice pressure. Based <strong>on</strong> icefield stability thocry, the calculatingmethod for static ice pressure is illustrated as follows:'Combining practice with the c<strong>on</strong>cept of lever stability in themechanics of material, authors proposed the icefield stabilitythocry in accordance with the research of the maximum horiz<strong>on</strong>talpressure <strong>on</strong> hydraulic buildings at the moment that the ice layer becomesunsteady. Basic assumpti<strong>on</strong>s are as follows:Ice layer is elastic and istropic material, and its stress-strainbehaviour is satisfied with Hooke's law.The compressing stress reaches to its maximum value at therncrnent that the icelayer changes to unsteady.C<strong>on</strong>necti<strong>on</strong> between ice layer and building is regarded ashinp,d joiht.&sed <strong>on</strong> above assumpti<strong>on</strong>s, before the compressed lever isout ol'stability, the differential cquti<strong>on</strong> of the bending deformati<strong>on</strong>ol'the let-er in the axial directi<strong>on</strong> is:EIY"P,Y = 0 (1)where: pptatic ice pressure(T / m');Y:vertical deformati<strong>on</strong> of ice layer(shown in Fig.1);E1:rigidity of ice layer.Solving the above equati<strong>on</strong> .with a hinged joint boundarycoundary c<strong>on</strong>diti<strong>on</strong>, we obtain:p =- z2 EZ (2)l2Where, 1 is the distance from building to the opposite bank ofice layer. Generally, the value of 1 is selected as 15 times of the netwidth in calculati<strong>on</strong>, but it should not be greater than 150m.If the thickness of ice layer h and the calculating width of theextruding of icc <strong>on</strong> building b are obtained, equati<strong>on</strong> (2) can betransformed to:Where, 1: the distance from' fr<strong>on</strong>t pool to opposite side wall; E:elastic modulus of ice, 88-98 (T/ m2); bl.Om; h:thichncss of ioclayer (m).In order to diminish the acti<strong>on</strong> of static ice pressure <strong>on</strong> the sidewall in the fr<strong>on</strong>t pool of Yinluan Pump Stati<strong>on</strong>, it turns out to beeffective that water is pumped from bottom by dive pump andsprayed out from a guiding pipe <strong>on</strong> the surface of fr<strong>on</strong>t pool, 80that a artificial spring is formed, which keeps water from freezingand a voids the acti<strong>on</strong> of static ice pressure. This kind of method isusedin a few hydraulic buildings, to eliminate the acti<strong>on</strong> of icepressure, for instance, Erwangzhuang reservior, canal and fr<strong>on</strong>tpool, At the same time, the natural surounding around pump stati<strong>on</strong>is improved.CONCLUSION^wIn short, the preventi<strong>on</strong> of ice damage for a l<strong>on</strong>g water transportis an important subject to ensure safe operati<strong>on</strong> in winter. Aftertransporting water of 8 winters, it is proved that the original design is still not perfect. In additi<strong>on</strong> to popularize above successfulcountermeasures, management and scientific research should bedevoloped; field observati<strong>on</strong> carried out; better combined measurestudied; and true operati<strong>on</strong> run, so as to ensure absolute safty oftransporti<strong>on</strong> of water in wintir.REFERENCE. "-Su Shengkui, 1980. Acti<strong>on</strong> of Ice Load <strong>on</strong> Hydraulic Buildings.Water Transporti<strong>on</strong> Engineering, No 5.Xu Bomen, 1985. Inflate Pressure and Calculati<strong>on</strong> of Ice Layer inReservior. Hydraulic Electric Tcchniquc. No Y5.Su-Shengkui, 1980. Problems of Analysis and Design of Anti-iceDamage in Y<strong>on</strong>gdinxin River. Hydraulic and Electric Technique.No6.Snib, B, 1982. Load and Effect of Water Wave, Iw and Ship <strong>on</strong>Hydraulic buildings. Haihe River Water Cc<strong>on</strong>servancy (Supplement). Nol.Xu-Jianfeng and Xu Caihua, 1986. Ice Damage and Preventi<strong>on</strong> inYollow River. China Water C<strong>on</strong>servancy. No3.Ice fieldFig. 1 Ice field calculati<strong>on</strong> sketch1237
THE LATEST PLEISTOCENE CRYOMERE IN THE REGION OF "KOPJES" AND THEBIG MESETAS, PATAGONIA, ARGENTINADario Trombottol & Bernd Stein2Centro Naci<strong>on</strong>al Patagbnico (Cenpat), Boulevard Brown 3000, 9120Puer to Madryn, Ch., Argentina.Universitat Bamberg, ,Physische Geographie, Am Kranen 1 D-8600Bamberg, Germany.In the northern area of south Patag<strong>on</strong>ia, near - he 46' S. L. and atdifferent sites we find clear cryogenic \ structu es that prove the,activity of freezing and thawing of the latest cryomere during thePleistocene in Patag<strong>on</strong>ia. The profiles show ice wedge-casts. At theflanking sides of the "Pampa del Castillo" the head penetrates intothe Tertiary forming droplike subhoriz<strong>on</strong>tal involuti<strong>on</strong>s. inter- Anmediate clay-layer could indicate a possible interstadial. Paleoclimaticand sedimentary indicators express c<strong>on</strong>diti<strong>on</strong>s of coldnesswhich aIe ameliorating towards the Holocene and Age a predominantlydry envir<strong>on</strong>ment with a str<strong>on</strong>g participati<strong>on</strong> of the wind.7The paleoclimatic rec<strong>on</strong>structi<strong>on</strong> ofthe Quaternary Patag<strong>on</strong>ia, or the.Neogene, has brought up many questi<strong>on</strong>sand different hypothesis. The idea ofenoEmous glaciati<strong>on</strong>s during the bigcryomeres c<strong>on</strong>trasts with r,atherrestricted glaciati<strong>on</strong>s near theCordillera or minor local"glacioblastos" (GROEBER, 1950, etc)associated to the big mesetas orPatag<strong>on</strong>ian mountains of over 2000 ma.s.1. The Patag<strong>on</strong>ian glaciati<strong>on</strong> helpedto explain theories about the origin anddispersi<strong>on</strong> of the famous "RodadosPatagdnicos" and certain hypothesis <strong>on</strong>geomorphology. Until now it is generallyassumed that the glaciati<strong>on</strong> coveredmainly the "Cordillera Austral1' reachingpartly into the extense Patag<strong>on</strong>ian area.In some cases the glaciatioqs approached70' W.L. but it: is <strong>on</strong>ly neax 52' S .L.where they reach the Atlantic Ocean(CALDENIUS, 1932, etc). Step by step newinformati<strong>on</strong> has been achieved and somecold periods in the past have alreadybeen documented. Geochr<strong>on</strong>ometric datingstold as about old glacials towards thelimit of the Messinian/Tort<strong>on</strong>ian(MERCER, 1985) .During all these years the pastgeocryology of the area has beenneglected. CALDENIUS (1940) holds thatthe fluvial deposits of the Eormati<strong>on</strong> ofthe "Rodados Patag6nicos", embedded withfine sediments or a kind of "loess",were influenced by'soliflucti<strong>on</strong> and heundeIlines an important denudati<strong>on</strong> cyclein East Patag<strong>on</strong>ia. CZAJKA (1955)menti<strong>on</strong>s rests of structures caused bythermal c<strong>on</strong>tracti<strong>on</strong> during thePleistocene at the "Pampa del Castillo"and <strong>on</strong> the 'IRodados Patag6nicos". Hesupposes that permafrq'st must havereached at least the mouth of the riverRio Negro. Ice wedge-cast's were placedat SE of the locality "Las Heras"(CORTE, ,1982). The important coldperiods however, left their traces offreezing and thawing through the courseof time. buring the Quaternary cryomeresand possibly even earlier the biggestpart if not the whole area was coveredby permafxost.Periglacial phenomena imprinted theirmarks during the Pliacene-Pleistocenewhen the IIRodados Patagbnicos" (shol tRP) were depositing and also aposteriori. It analyses indicators ofthe Late Glacial and proves relevantclimato-stratigraphical changes of theenvir<strong>on</strong>mental c<strong>on</strong>diti<strong>on</strong>s of selectedsites before the arid or semiaridc<strong>on</strong>di t<strong>on</strong>s of Patag<strong>on</strong>ia today.srunYBBEBThe study area corxesp<strong>on</strong>ds to thetypical Patag<strong>on</strong>ian landscape: bigmesetas , such as "Pampa del Castillo"(fig. 1) which have been classified intodifferent levels accordi.ng to theirheight and degree of erosi<strong>on</strong>. Apart from* 1238 .
Fig. 1: Locati<strong>on</strong> of the Study sites in Patag<strong>on</strong>iathe c<strong>on</strong>tinental mesetas and approaching The absolute min. temp. registered inthe coast we find mesetas of marine Sarmiento is -33' C (incomplete data) .origin. The mesetas, surrounded by bad The absolute min. temp. for PeritoLands, generally dry valleys' and Moreno is -17,5' C and the mean annual"bajos", together with mountains, table- precipitati<strong>on</strong> is 116 mm (CABRERA, 1976) .tops or Itkopjes1' and of course frequent Towards the Southern Andes cool..and different Neogene basaltic layers temperatures and their influence gainc<strong>on</strong>stitute the Patag<strong>on</strong>ian table land of more and more importance.the -study area.The study area is characterized byThe analysed profiles are situated at luvic yermosols in two typical layers.three characteristic sites close to the The upper layer c<strong>on</strong>sists of sand.and46 0 S.L. (fig. 1) where excellent silt mixed with gravel (-RP)) of aexamples of ice wedge-casts to,gether greyish-brown colour. Below we find awith other characteristics -of a thin chestnut-coloured clay-layer.periglacial paleoenvir<strong>on</strong>ment are found. The vegetati<strong>on</strong> bel<strong>on</strong>gs to theThe sites axe : "Holdich", "Kensel" and "provincia patag<strong>on</strong>ica" (CABRERA, 1976) ."Las Heras". The first site is located Thorny plants and species that grow inin the SE of Chubut and related to the form of "cushi<strong>on</strong>s" adapted to an aridflanking sides oE the geoform called and windy envir<strong>on</strong>mgnt prevail."Pampa del Castillo" (appr. 700 ma. s,. 1. . Site "Kensel", near "Ce~roKensel", is located in the NW of Sta.Cruz (appr. 720 m a.s.l'.), east of 'the"Meseta del Genguel" <strong>on</strong> the nat. road no40. The third site is located in the NEof Sta. Cruz, at a height of 350 ma. s. l., near the settlement "Las Heras".Here the level of tesraces is lower thanat site "Ho1dic.h". According to TROLLand PAFFEN (1969) the climate bel<strong>on</strong>gs toz<strong>on</strong>e 111, e.g. cool temperate, type No12: steppe climate: sernidesertic anddesertic climate.AGeologically the study area bel<strong>on</strong>gs to"Chubut extraandino", north of the"Nesocrat<strong>on</strong> del Deseado" . WINDHAUSEN(1924) carried out a very importantgeological and topographical investigati<strong>on</strong>in the area of golfo San Jorge".Quarternary geology and stratigraphyhowevex, are relatively unknown.In the whole study area a depositi<strong>on</strong>Of evaporites <strong>on</strong> top of the RP, volcanicashes and eolian sediments which wereretransported and then modified byfluvial, cryogenic and sedimentaryagents, can be observed.1239
During the expediti<strong>on</strong> different studytranssects in EW and NS directi<strong>on</strong> weretraced in order to investigate theNeogene stratigraphy and drawgeomorphological c<strong>on</strong>clusi<strong>on</strong>s. We madeprofiles at different sites whichrepresented cryogenic phenomena of the'past in and exemplary way and alsoproved to be related to those levelsexposed to paleoclimatic changes. Theprofiles were layed out al<strong>on</strong>g roads, inquarries or excavati<strong>on</strong>s of wastedeposits. Whenever this was impossible'drillings and excavati<strong>on</strong>s were made. Foroux analyses we applied classicalmethods as well as visua.1 and tactilecharacteristics. RepresenCative samplesof important layers and levels weretaken. In the laboratory mainlygranulometric analy'ses and analyses ofcarb<strong>on</strong>ates were realized and wherepossible the sand-quar tz grain sur facetextures were analysed in order tosupport the paleoenviromental genesis.DISCUSBIQNWRESULTSAt site "Holdich" we foundpseudomorphs of ice wedges (fig. 1)which penetrate up to 90 cm into themarine Oligocene at the flanking sidesof the "Pampa del Castillo". Theinterior of the ice wedge c<strong>on</strong>tains 7%silt, 9% clay and over 84% fine andmedium sand. The ice wedges were filledand later <strong>on</strong> covered and protected bythe head which reaches a thickness ofover 1 m. This deposit (sediments > -2phi) is composed mainly of fine sand(41%), appr. 13% of silt and 17% ofclay. It does not c<strong>on</strong>tain CaCO, and isrich in RP. At the inferior part of thehead a clay layer (49%), with athickness of 10-15 cm can be identified.This layer displays a polyhedralstructure, clay skins, 37% sand and 14%silt, a str<strong>on</strong>g carb<strong>on</strong>atic reacti<strong>on</strong> and ac<strong>on</strong>tent of gypsum.Site 14Holdichl' is evidently influencedby soliflucti<strong>on</strong>. The head penetrates insome cases into the Tertiary formingdroplike subhoriz<strong>on</strong>tal involuti<strong>on</strong>s.Soliflucti<strong>on</strong> can be identified with thehelp of the following pattern: 1-general characteristics of the depositwith sorting of certain levels and aspecial orientati<strong>on</strong> of the clasts; 2-c<strong>on</strong>tinuity of the covering layer even <strong>on</strong>the slope and spatial distributi<strong>on</strong> ofthe deposit; 3- geomorphology of thearea with characteristic soft relief and4- textural characteristics of thequartz grains.The eolian origin of the sediments canbe verified through quartz gIain surfacetexture analyses with SEM. The abundance(over 25%) of textures with high relief,angular outline, c<strong>on</strong>choideal fracturesof different size, striati<strong>on</strong>s, parallelsteps and arch-shape,d steps are due tocryogenic phenomena which added to theinherited textures, probably related tointerstitial material of the RP. Insidethe casts, the quartz grains showeolizati<strong>on</strong> and a higher frequency ofchemical textures due to differentenvir<strong>on</strong>mental characteristics and theage of the se&iments.Near "Cerro Kenselu1 the pseudomorphsvery frequently appear in form ofpolyg<strong>on</strong>s (with sides over 1 m) al<strong>on</strong>g theroad. The sediments of the casts are ofa darker colour than the host material.They are rich irl fine and medium sand(37% / 30%) and c<strong>on</strong>tain 15% clay and 10%silt. The RP appear in the filling aswell as in the host material and <strong>on</strong> thesurface. The host material c<strong>on</strong>tainsCaCO, (appr. 50%), very much clay (55%)and silt (19%) and c<strong>on</strong>trasts with thefilling because of its lighter colour.Site "Las Heras" is an example of thecharacteristic successi<strong>on</strong> and thelithologic model described for Pto.Madryn in Northern Patag<strong>on</strong>ia (TROMBOTTO,1992) . The upper layer c<strong>on</strong>sists of sandand silt of a greyish-brown colour. Itsthickness varies between 10 and 20 cmdepending <strong>on</strong> human influence. This layercovers another layer of brown sand witha thickness of 10-15 cm, polyhedralstructuIe and clay skins. Below thesetwo layers we find ice wedge casts witha depth of up to 70 cm. The pseudomorphspenetrate a sandy, calcareous layer withRP. A transversal cut reveals thecharacteristic polyg<strong>on</strong>al structure. Justas in the case of site "Kensel" there isa c<strong>on</strong>trast between the colour of thehost material which is less dark, sandy(44%) with CaCO, (27%; 10 yr 7/3 - 8/3)and the filling of the structure whichis darker and <strong>on</strong>ly slightly calcareous(10 yr 4/2 -5/3) At site "Las Herasq' thesediments of the filling are composed ofmedium sand mainly (52%), with 14% clayand 6% silt. At the lowest part of theprofile we find again RP impregnatedwith CaCO,, d'iisplaying a "nougatstructure" ( 50 cm) and subsequentlyforming "columns'! and subhoriz<strong>on</strong>talstructures as well as "windows1'(TROMBOTTO, 1992) . These last carb<strong>on</strong>aticdeposits, or "tosca" clearly prove therelati<strong>on</strong> between structures and thesubsuperficial water drainage and thewash-out of sediments and minerals.The sediments of the fillings of the1240
pseudomorphs at the thlee sitesmenti<strong>on</strong>ed can be very welJ compared.Analysing the granulometric cumulative ,curves, we obtain a Qd between 2.1 and2.5 phi, e.g. fine sand tending towardsmedium. The STD values (2-2.5) indicatea poor sorting of the material. Whilesite I1Holdich" displays an extremelyleptokurtic curve, the other two sites,very similarly, indicate leptokurticcurves. The symmetry of the frequencycurves gives us values of 0.3-0.6 in allcases. For "Kensel" and "Las Heras" weobtain exactly the same values. The peakin sand may be due to the transport ofcolloids during the pedogenesis.Comparing "Holdich" and "Las Heras" we ,find a remarkable c<strong>on</strong>tinuity andsimilarity with the dif Eerence thatI'Holdich1' is str<strong>on</strong>gly affected bysoliflucti<strong>on</strong> and influenced by itsgeomorphological positi<strong>on</strong>. Soliflucti<strong>on</strong>must have participated in thedecarb<strong>on</strong>izati<strong>on</strong> of the deposit.coNcLuBIQNsIn this first attemp.c and based <strong>on</strong> theinvestigati<strong>on</strong> of characteristic sites wedare a paleoclimatic and sedimen,tary,rec<strong>on</strong>structi<strong>on</strong> of, the area near' the 46'S.L in Southern Patag<strong>on</strong>ia. For thispurpose we developed the followinggenexal pattern of the paleoenvir<strong>on</strong>ment:1- The ice wedge casts we foundrepresent the latest glacial andprobably the coldest period of the LateGlacial appr. 20.000 years ago. Theexistence of those structures requiredpermafrost and a mean annual temp. of atleast 14' C below,the present temp.2- S.ome casts are filled withsoliflucti<strong>on</strong> eolian material. Apaleoenvir<strong>on</strong>ment of this kind wouldindicate still cold, but slightly morete.mperate c<strong>on</strong>diti<strong>on</strong>s and aridity orsemiaridity.3. A warm impulse allowed the creati<strong>on</strong>of the clay level through pedog'enesisfor which we suppose a win. mean annualtemp. of 5' C and a mean annualprecipitati<strong>on</strong> of 250 mm. ?\his momentmight be related to an interstadial.4- A posteriori this clay layer i scovered by soliflucti<strong>on</strong> which again isrelated to a cold impulse and a semiaridpaleoenvir<strong>on</strong>ment.5- Finally the predominating climateduring the Holocene was cool temperateand dry; c<strong>on</strong>diti<strong>on</strong>s which hardly allow apedogenesis and which are generallyvalid until today.-We would like to .thankDr. FrankSchdbitz (University of Barnberg,'Germany) very much €or the chance ofpartic.ipating in the expediti<strong>on</strong> andsharing with him a m<strong>on</strong>th of adventures.all over Patag<strong>on</strong>ia which enabled us torealize this study. We are indebted toALUAR, Puerto Madryn for offering us itslaboratories, to THEM-CONICET, Mendozafor its cooperati<strong>on</strong> with the SEM and weare especially grateful to SabineHerfert for the translati<strong>on</strong>.REFERENCESCabrera, A. (1976). Re'gi<strong>on</strong>es Fitogeogr6ficasArgentinas. EnciclopediaArgentina de Agricultusa yJardinerla, Tomo 11, 1, 85 pp.,Buenos Aires.caldenius, C. (1932). Las Glaciaci<strong>on</strong>esCuaternarias en, la Patag<strong>on</strong>ia y Tierradel Fuego. Geografiska Annaler, Haft1-2, 1-164.- - - (1940). The Tehuelche or Patag<strong>on</strong>ianShingle-Formati<strong>on</strong>. Geografiska Annalel,160- 181.Corte, A. (1982). Geocriologia general yaplicada. Revista del Instituto deCiencias Geolbgicas, UniversidadNaci<strong>on</strong>al de Jujuy, Nr . 5: 1-33 ps.Czajk'a, W. (1955). Rezente undpleistozane Verbreitung und Typen desperiglazialen Denudati<strong>on</strong>szyklus inArgentinien. Acta Geographica 14, Nr.10, 121.- 140, Helsinki.Groeber, P. (1950). Quartare VereisungNordpatag<strong>on</strong>iens. S<strong>on</strong>derdruck derZeitschrift "siidamerika", 6 pg., 'Buenos Aires.Mercer, J.H. (1985). Las Variaci<strong>on</strong>esGlaciales del Antiguo Cenozoico ensudamkrica a1 SUL del Ecuador. ActaGeocr iogbnica, Nr . 3, 86 - 206,Mendoza.Troll, C. und Paffen, KH. (1969). Karteder Jahreszeiten-Klim'ate der Erde.Erdkunde, Band XVZII, 28 pp.Trombotto, D. (1992). The CryomerePenfordd, Patag<strong>on</strong>ia. <str<strong>on</strong>g>Internati<strong>on</strong>al</str<strong>on</strong>g>Workshop: "<strong>Permafrost</strong> and PeriglacialEnvir<strong>on</strong>ments'in Mountain Ayeas", 33pp. , Calgary.Windhausen, A . (1924). Lineas Generalesde la.C<strong>on</strong>stituci6n Geol6gica de laRegi6n Situada a1 Oeste del GoLfo deSan Jdrge. Boletin de la AcademiaNaci<strong>on</strong>al de Ciencias, Tom0 XXYTI, 3,167 -320, C6rdoba.a1241
SEASONAL FREEZING AND THAWING GROUNDS OF MONGOLIAD. TumurbaatarInstitute of Geography and Geocryology. M<strong>on</strong>golian Academy of SciencesThe seas<strong>on</strong>al freeeing and thawing grounds of M<strong>on</strong>golia are subdivided into threeregi<strong>on</strong>s: the first is a seas<strong>on</strong>ally thawed ground regi<strong>on</strong>. the ground thaw depthin the loam is 1.8-2.8 m and in the loamy sand with gravel is 2.8-3..6 m. Thatthaw begins from June and c<strong>on</strong>tinues until October: the sec<strong>on</strong>d is seas<strong>on</strong>allythawed and frozen ground regi<strong>on</strong>, the depth of seas<strong>on</strong>ally thawed and frozenground is 2.6-2.8 m in the loam and 3.5-9.5 m in the .loamy sand with gravel.Ground frost' begins from the middle of October and c<strong>on</strong>tinues until April. Thethird is ground freezing regi<strong>on</strong>, permafrost does not occur here. Ground isfrozen seas<strong>on</strong>ally. Depth of frozen ground is 1.7-T.5 m in the loam and 2.5-3.2 mi'n the loamy sand with gravel, Ground freezing is from the beginning of Novemberto March.INTRODUCTIONThe seas<strong>on</strong>ally freezing embraces all of theterritory of M<strong>on</strong>golia. The first summary ofM<strong>on</strong>golian seas<strong>on</strong>ally freezing was given byP.I. Gukov (1961). N. L<strong>on</strong>gid (1969), S.I.Zabolotnuc (1974) and D. Tumurbaatar (1975).In the last 25 years, seas<strong>on</strong>ally freezinginvestigati<strong>on</strong>s have been c<strong>on</strong>centrated by theauthor in the territory of M<strong>on</strong>golia. All maierialswere generalized and complied into large andsmall scale seas<strong>on</strong>ally.frozen and thawed groundmaps of M<strong>on</strong>golia (1977, 1985).*In some industrial areas maps were compiled,of large and middle scale seas<strong>on</strong>ally frozen andthawed ground (1971, 1976, 1989).The main purpose of this report is the discoveryof the general and regi<strong>on</strong>al regularitiesin the seas<strong>on</strong>al freezing and thawing of ground,of changing of temperature and compositi<strong>on</strong> ofground and natural c<strong>on</strong>diti<strong>on</strong>s.NATURAL, CONDITIONSIM<strong>on</strong>golia Is situated in Central Asia, fromthe sea, to the border of the Russian Republicin the north and China in the south. The southwesternand western part of the territory iscomposed of the Altai, Khangai and Khubsugulmountains in the eastern-Khentei mountains. theeastern-north-Khingane mountains, the easternand south-steppe and Gobi desert.M<strong>on</strong>golia is <strong>on</strong> the whole a mountsinoue countrywith an average absolute height of 1580 metresabove sea level. The lowest point is the basinof Khukh-Nuur in the east, which lies a,t analtitude of 560 metres above sea level and thehighest point within the Republic is Khyiten inthe M<strong>on</strong>goli'an-Altai. which stands at 4374 metres.Average air temperature of the coldest m<strong>on</strong>th-January in -30°C in the north of M<strong>on</strong>golia and-14'C in the south. The value of the warmestm<strong>on</strong>th-July is 12'C in the north, and 24'C in thesouth, Average annual air temperature in thesouth part of country is -5.2'C and in the north4°C.M<strong>on</strong>golia has a sharp c<strong>on</strong>tinental climate andthese c<strong>on</strong>diti<strong>on</strong>s promoted the development ofpermafrost in 15% of the territory and thedeepening of seas<strong>on</strong>ally freezing ground <strong>on</strong> thewhole.THE THAWING OF'GROUND IN MONGOLIAThe main permafrost regi<strong>on</strong>s are in the Khangai.Khubsugul, Khentei and M<strong>on</strong>gol-Altai mountainterritories end'are characteristically seas<strong>on</strong>algrounds.The predominant absolute altitude of Khubsugulmountains country ranges from 2000'to'3460 m(a.s.1.). But absolute altitude in the Darkhatdepressi<strong>on</strong> ranges from 1500 to 1800 m (a.s.1.).At Dood Tsagan Nuur in.the Parkhadin depressi<strong>on</strong><strong>on</strong> the left bank of the Shishkid river, thedepth of seas<strong>on</strong>allthawing Is 1.3-2.3 m in theloamy lake grounds, 1.5-2.5 m in the loamy sand,and 2.6-3;3 m in the sand. In the beginning ofthe valley, in Sharga at the river, it is 3.3-3.5 m in the gravelly ground with sandy fill.Seas<strong>on</strong>ally thawing of ground in the northfacingslope of the mountain is 2.3 m in theloamy sand. On the south bank of Khubsugul lakeis situated the city of Khatgal (1650-1700a.s.1.). in which seas<strong>on</strong>al thawing is ;3.2 - 3.5min the gravel ground with loamy fill.The above research materials shows that thedepth of seas<strong>on</strong>ally thawed ground ranges from1.3 m to 4.0 m in Khubsugul mountain territoriea.. Deepest ground thaw is 3.3-3.5 m in the sandand gravel. Shallowest thaw of ground is observedto be 1.3-2.3 q in clay and loam.The river-heads Sharga and Tes are located <strong>on</strong>the lake plateau of the Khandai mountain regi<strong>on</strong>.Here the depth of the seas<strong>on</strong>al thawing is 2.2-3.1 q in the boulders with 'sandy fill.The depth of the seas<strong>on</strong>al thawing ground <strong>on</strong>1242
'the Tarbagatai raugc at the altitude of 3000-3200 m (a.s.1.) is 0.9-2.3 m in the loam andloamy sand ground, and at the height of 2000-2300 m a.s.1. it is 2.8-3.8 m in the same typeof ground.In the lake hollow, 'Terkhiin Tsagaan Nuur,the seas<strong>on</strong>al thaw of ground is 1-61 m <strong>on</strong> thehidrolaccolite in the loam.Seas<strong>on</strong>ally thawed ground (Northern Khangairange) in the regi<strong>on</strong> of Shiluustei at the altitudeof 2200 m a.s.1. is 3.8-4.5 m i n the loamysand and sand with gravel, in the settlementRajan Oboo som<strong>on</strong> near the lake valley (countrv)Tsagaan Nuur (1935 rn a.s.1.) it is 1.7 m in theloam, in the center of the settlcmmt Galuut som<strong>on</strong> itis 3.5 m in the sand wi~h gravel, and in thecenter of the settlement Bajanbylag som<strong>on</strong> (2200m a.s.1.) it is L.2 m in the sand with gravel.The above menti<strong>on</strong>ed data shows the depth ofseas<strong>on</strong>ally thawing changed from 0.9-4.5 m, inthe Khangai m0untaj.n country.The smallest thaw located <strong>on</strong> north-facingslope and lake and river valleys is 0.9-2.3 min the clay and loam, the deepest thew <strong>on</strong> southfacingslope is 3.5-4.5 m in the sand with gravelground. Absolute altitude of Khentei mountainouscounrry is 1500-2000 m.In Bajanzurkh som<strong>on</strong> and Nalaikh, located inthe south-west part of Xhentei mountains, theseas<strong>on</strong>al thaw is 2.h-2.8 m i n loam and 3.0-3.5 min sand.In th'c southern part of Khentei range, in theregi<strong>on</strong> of the settlement Manyunmorit som<strong>on</strong>, theseas<strong>on</strong>al thawing ground is 2.8-3.2 m in loamwith gravel.The abscllutc altitude 1620-1730 m i n locallowlands.marshlands and hollows, and the seas<strong>on</strong>althaw is 1.2-2.3 m in the loam and locallyis 2.3-2.8 m. In the eastern part of Khenteirange, in the regi<strong>on</strong> of Batshereet <strong>on</strong> the northfacing slopes, the depth of thaw is 3.0 m in lowmoisture (7-137) sand with gravel.The smallest depth of thaw in Khentei Mountainregi<strong>on</strong> is 0.6-1.3 m and occurs in the areasof the north-facing slopes, marshland, wet sandwith thick c<strong>on</strong>tinuous moss cover and water shed.The deepest thaw (3.5-4.5 m) occurs in theareas of the south-facing slopes and of thedisc<strong>on</strong>tinuous permafrost z<strong>on</strong>e and water shed.As well as i n the river deposits with the sand,loamy sand pebbles and gravels.Altai mountainous regi<strong>on</strong> is situated in thewest ddge of M<strong>on</strong>golia, and the absolute altitudeof Altai mountain is from 3000 m to 3474 m.There is c<strong>on</strong>tinuous and disc<strong>on</strong>tinuous permafrostin the regi<strong>on</strong>.The valley "Kh<strong>on</strong>ghor ulen" located betweenthe Altai mountainous regi<strong>on</strong> is situated at theabsolute altitude of 2420 m and the seas<strong>on</strong>althawing of ground is 2.6 m in the gravels orgravelly sand. And near to lake "Tsagaan Nuur"which is at the absolute altitude of 2100 m thethawing depth in the clay and loam is 1.8-2.2and in the sandy ground is 2.8-3,O m. Nearm,"Tsenghel" soman at the absolute height of 2150m, the thawing depth of sandy ground is 4.3 m.Lake "Tolbo" is at 2100 m and the thawing ofmuddy loam ground near the lake "Nogho<strong>on</strong>" is2.8-3.0 m.On the north facing slopes of the Altaimountainous regi<strong>on</strong> the thawing of broken st<strong>on</strong>eground is 3.0-3.8 m and <strong>on</strong> the south facingslopes the thawing of the same ground is 3.5-.0.5 m.The c<strong>on</strong>clusi<strong>on</strong> is that the thawing' of thelake mid clay and loamy ground in the valleybottoms between the mountains of the Altai mountainsregi<strong>on</strong> is 1.8-2.2 m, and in the sandyground is 2.8-3.0 m.Thawing of gravel and sandy ground <strong>on</strong> Lht.south facing slopes oE mountains is 3.5-4.5 rn.And the thawing of north fecing slnpcs of mountainsi n the same ground is 3.0-3.5 m.It was easier to reveal the altitudinalregularities in the changjng seas<strong>on</strong>al thawingground than to reveal the latitudinal rtigularities.The deepest thawing of ground in loam is2.8 m and in sand is 4.8 m under 1000 m heightfrom the latitude of LS in M<strong>on</strong>golia.A t the absolute altitude of 1700-2300 m inKhanghai. Altai, Khubsugul and Khentei mountainousregi<strong>on</strong> the deepest scas<strong>on</strong>al thawing is from2.0 m in loam and tu 4.5 m in sand. 4 t theheights of 2300-3000 m the thawing depthdecreases 1.5 m in loam, 3.5 rn in sand and atthe heights above 3000 m it is 1.0 m in loamand 2.0 m in sand. In the directi<strong>on</strong> from southto north the thawing depth of ground decreased.For example: the thawing depth,of ground nearGhalut som<strong>on</strong> situated i n fr<strong>on</strong>t side or Khangaimountains ridge is 2.5 m in loam and 3.5 m insand. But 500 km to the north in the Tsagaanlake va'llcy of Khubsugul province the depth ofthawing is 2.0 m in sand and 1.3 m i n loam(Fig.1).The change of the depth of seas<strong>on</strong>al thawing ;Iin loam ?x) and sands (0) in Khannav-Khuysg8l'rnountain regi<strong>on</strong>s of M<strong>on</strong>golia ITHE SEASONAL FREEZING OF GROUNDThe south part of M<strong>on</strong>golia is predominatedby the steppe and Gobi semidesert z<strong>on</strong>e.The.seas<strong>on</strong>a1 freezing of ground in this z<strong>on</strong>eis tightly c<strong>on</strong>nected with the natural complex.In the southern part of M<strong>on</strong>golia the precipitati<strong>on</strong>is low annually, 40-100 mm, snow cover isthin 3-5 cm, and is cold i n winter and warm insummer.The seas<strong>on</strong>al freezing ground c<strong>on</strong>sists genera1l.yof clay, loam, loamy sand, gravel, sandand different solid rocks of the Tertiary andQuaternary period.In the southernmost point of M<strong>on</strong>golia, ZaminUud, the amplitude of surface temperature is21-22'C, mean annual ground temperature is6-7"C, ground moisture is 8-12X, depth ofseas<strong>on</strong>al Freezing is 2.3-2.4 m in loam, and, 2.4-2.5 m in sandy ground. To the north near SainShand, moisture of sandy ground is 10-157, meanannual ground temperature is 4.5-5.0"C. anddepth of ground Preezipg is 2.2-2.4 m in loamand 2.4-2.6 m in sand (Table 1).Near Dalanzadghad the mean annual groundtemperature is 7-8'C, aid depth of freezing is1.7-2.1 m in loam and 2.2-2,4 m in sand.1243
Table 1.Depth of seas<strong>on</strong>ally freezing ground of M<strong>on</strong>goliaPopulatedarea(settlement)AmplitudeMeanoscillati<strong>on</strong>Depth Compositi<strong>on</strong> ofannualof Moisture of lithology seas<strong>on</strong>algroundtemperature of ground of the frozetemperatureI O F \ of ground groundground\ b jsurf aceSouthern part of M<strong>on</strong>goliaDalanzadghad 8.0' 18.6 10.0 loam. 2 .oZamiin Uud 7.1 21.5 8.0 sand 2.5Sain Shand 6.2 20.9 9.0 sandMandalgobi 5.0 18.6 5.2 loamy sand 2.5Central part of M<strong>on</strong>goliaB a j ii n 1 .(l 19.9 16.0 loamy sand 3.4Choir 3.1 20.0 15.3 loamy sand 3,OTsetsetleg 2.8 15.9 14.9 loamy sand 3.4Ulaanhaatar 0.6 25.0 18.0 loamy sand 3.7Northern part ofKharaa 2.1 22.0Errlenet. 1 .o 15.8Bulghan 1.6 19.3Ulaantolgoi 1.8 16.0M<strong>on</strong>Rolia . .16.5 sand13.4 loamy sand 3,O20.0 loamy sand 2.919.7 loamy sand 2.5The c<strong>on</strong>clusi<strong>on</strong> is that the seas<strong>on</strong>al freezingof ground in the southern part of_M<strong>on</strong>golia beginsfrom the beginning of November and is completelyIrozen,at. the end of Fcbcuary. The thaw of seas<strong>on</strong>alfreezing ground beklns from sec<strong>on</strong>d week ofYarch and ends in April.The. ground frcezina ?n the southern part ofM<strong>on</strong>golia' is 1.7-2.4 m in loam 'and 2.h72.6' m insandy ground.Examples of the ground seas<strong>on</strong>al freezing ofsteppe .and mountainous steppe e<strong>on</strong>e of the centralpart of M<strong>on</strong>golia can be seen in the regi<strong>on</strong>s nearto Bajan som<strong>on</strong>, Ulaanbaatar, Tsetserleg, Rajanh<strong>on</strong>ghorand Arcaykher.Rajan som<strong>on</strong> in the Central province issituated in the steppe z<strong>on</strong>e which is 90 km tothe south of Ulaanbaatar.The main st-ructure of seas<strong>on</strong>al thawing andCreeziny ground are deluvium break st<strong>on</strong>e andgravel, lacustrlne loam and sandy loam.The fluctuati<strong>on</strong> of suriace temperature is10.1-14.2°C and the mean annual ground temperatureis 0.8-1.9OC, and the ground'moisturec<strong>on</strong>tent is 3-152. Ground freezing is 2.7-4.5 min loam and 3.5-3.9 m in the sandy ground.The ground freezing near Ulaanbaatar occursin the proluvial and alluvial sands with gravels,and deluvial loamy sands with broken st<strong>on</strong>es. 'The fluctuati<strong>on</strong> of surface temperature is20-25'C, mean annual ground temperature is 0.5-2.5'C; ground moisture is 6-2OX, and the depthof seas<strong>on</strong>al freezing of ground in the gravelground with sand in the river and lake valleyis 2.6-3.3 m.The depth of ground freezing in the back sidesof the mountains 'in loamy sand with broken st<strong>on</strong>esis 4.2-4.8 m. The fluctuati<strong>on</strong> of surface temperaturenear Arvaikher town i s 15-18"C, meanannual &round temperature is 0.3-2.OeC, groundmoisture is 5-10? and the depth of freezing ofground is 2.2-3.2 m in sandy ground and 2.5-2.9min loamy ground. The freezing of ground is fromthe end of October until the beginning of April.The seas<strong>on</strong>al freezing of ground near Bajanh<strong>on</strong>ghortown is 2.9 m in loam and clay, and 3.4min sa,nd and loamy sand. The depth of seas<strong>on</strong>al.freezing of ground near Tsetserleg town is 2.9 min clay and loam, and 3.4 m in sand and loamysand. The seas<strong>on</strong>al freezing of ground in thecentral part of M<strong>on</strong>golia is from the end ofOctober until the beginning of April. The meanannual ground temperature is 0.3-1.O'C in theloamy sand with deluvial broken st<strong>on</strong>es in theback sides of mountains, and 2.0-2.5OC in thealluvial sand and lbamy sand with gravel. Thedepth of seas<strong>on</strong>al freezing of ground is 4.0-4.8111in the back sides and 3.5-4,O m in the fr<strong>on</strong>tsides of mountains, and 2.6-3.3 m in the riverand, lake valleys. It's possible to determinethe seas<strong>on</strong>al freezing of ground of the northernpart of M<strong>on</strong>golia or the regi<strong>on</strong> of Orh<strong>on</strong> andSelenga <strong>on</strong> the basis of the studied materialsobtained in the territories, of Selenga, Bulghanand Khubsugul provinces.The state farm of Zun Khara is situated 120km to the north of Ulaanbaatar. Here the seas<strong>on</strong>alfreezing of ground begins from the first tendays of November and finishes at the end ofApril. The mean annual ground temperature is1.5-2.1°C, depth of seas<strong>on</strong>al freezing is 3.2-3.4m in clay and loam and 3.6 m in sand and loamysand of Khara and Shara river valleys (Table I).The depth of sandy ground freezing in theeast-north facing slope of the mountain nearDarkhan city is 4.0-4.3 m, the smallest freezingwas 1.7 m in the,loamy ground with 16-25% moisturenear the high bottomland of Khara rivervalley.The depth of freezing ground in the valleynear Erdenet hill (12b0 m) is 2.3 m in lakesand with moisture of 254, and is 3.5-3.7 m inlight loamy sand <strong>on</strong> west facing slope of Erdenethill (1300 m a.s.1.). Ground freezing is 3.9 min the north facing slope of Erdenet hill(1450 m a.s.1,).The seas<strong>on</strong>al freezing of ground in theKhanghal river basin begins in the beginning ofNovember and finishes at the end of April.There is sand with loamy fill and with moistureof 15-202, mean annual ground temperature is1244
3.0-3.2'C, and depth of seas<strong>on</strong>al freezing is 2.4-2.7 m.The mean annual ground temperature of the loamand loamy sand with broken stems <strong>on</strong> the southfacing slopes of mountains is 2.5-3.OoC, moistureis 9-llX, and depth of seas<strong>on</strong>al freezing is 2.3-3.7 m. And <strong>on</strong> the facing slopes of the mountainsthe moisture i s 10-12% in the loam and loamy'sand, it is mean annual temperature is 0.5-1.OaC,and the ground freezing is 3.7-4.0 m deep.Near Bulghan town (1220 m a.s.1.) the groundfreezing begins from the beginning of Novemberand finishes at end of April. Mean annual groundtemperature is l.6"C and it is seas<strong>on</strong>al freezingis 3.2 m deep. In Murun town, which is situatedin the northeast point, the seas<strong>on</strong>al freezing ofground begins after October 20, and finishes atthe end of April. It's seas<strong>on</strong>al freezing is 3.9mdeep.The c<strong>on</strong>clusi<strong>on</strong>s taken from the above menti<strong>on</strong>edevidence shows that there is a fluctuati<strong>on</strong> of1.7-4.0 m in the seas<strong>on</strong>al freezing of ground inthe Orkh<strong>on</strong>-Selengha regi<strong>on</strong>.The depth of seas<strong>on</strong>al freezing in the groundincreases from the south to the north untilreaching the central regi<strong>on</strong> (Ulaanbaatar). Andit c<strong>on</strong>firms fully the c<strong>on</strong>clusi<strong>on</strong>s of Russianscientist S.I. Zabolotnik who discovered thataccording to the natural regularities there is areducti<strong>on</strong> in the Orkh<strong>on</strong>-Selengha regi<strong>on</strong>.The changes of the thickness of seas<strong>on</strong>alfreezing is tightly c<strong>on</strong>nected with the factorsof the rise in the winter durati<strong>on</strong> in the directi<strong>on</strong>of the north and the increase of absolutealtitude of the earth and also the influence ofsnow cover.Beside these factors it is also c<strong>on</strong>nected withother factors of freezing lake ground structure,moisture and temperature. Under the increasingabsolute altitude from 900-1030 m in Dalanzadghadto 1200-1703 m in Ulaanbaatar the mean annualground temperature reduces slowly from 6.7OC inDalanzadghad to 0°C in Ulaanbaatar. But thethickness of snow cover does not change.On this c<strong>on</strong>diti<strong>on</strong> the depth of ground freezingis increasing from south to north.The surface absolute altitude is reducingfrom Ulaanbaatar to the border from 850 m to 600m, and the thickness of snow cover increases.And snow cover reduces the depth of seas<strong>on</strong>alfreezing by 0.2-0.7 m . Therefore the thicknessof seas<strong>on</strong>al freezing in the northern part of theOrkh<strong>on</strong>-Selengha regi<strong>on</strong> is 0.8-1.4 m less than theregi<strong>on</strong> of Ulaanbaatar city (F'ig.2).- 81THE REGIONALIZATION OF THE SEASONAL FREEZINGAND THAWING GROUNDThe seas<strong>on</strong>al freezing and thawing ground ofM<strong>on</strong>golia is subdivided into three regi<strong>on</strong>s (Fig,3) :1. Regi<strong>on</strong> of seas<strong>on</strong>ally thawed ground. Thedistributi<strong>on</strong> of permafrost is c<strong>on</strong>tinuous. Groqndthaw in the loam i s 1.8-2.8 m and in the loamysand with gravel is 2.8-3.6 rn. That thaw beginsfrom beginning of May and finishes in October.2. Regi<strong>on</strong> of seas<strong>on</strong>ally thawed and frozenground. The distributi<strong>on</strong> of permafrost is dXsc<strong>on</strong>tinuous.The regi<strong>on</strong> of seas<strong>on</strong>al thawing andfreezing grounds are subdivided into subregi<strong>on</strong>s:a. Subregi<strong>on</strong>: Depth of seas<strong>on</strong>al.ly thawed andfrozen ground is 2.8-3.4 m in the loam and loamysand and 3.5-4.5 m in the sand with grsvel.b, Subregi<strong>on</strong>: Depth of seas<strong>on</strong>ally thawed andfrozen ground is 2.6-2.9 m in the loam and loamysand and 2.9-3.5 m in the sand with gravel.Ground frost begins from middle of October ar.dfinishes at the end of April.3, Regi<strong>on</strong> of seas<strong>on</strong>al frozen ground. <strong>Permafrost</strong>does not OCCUF here. The regi<strong>on</strong> of seas<strong>on</strong>alfreezing grounds are subdivided into two subregi<strong>on</strong>s:a. Subregi<strong>on</strong>: Depth of seas<strong>on</strong>ally frozenground is 2.5-2.7 m in the loam and loamy sandand 2.8-3.2 m in the sand with gravel.b. Subregi<strong>on</strong>: Depth of seas<strong>on</strong>ally frozenground is 1.7-2.1 m in the loam and loamy sandand 2.4-2.5 m in the sand with gravel.CONCLIJSIONSThe territory of Y<strong>on</strong>golia <strong>on</strong> the whole hasseas<strong>on</strong>al freezing and thaw.The depth of seas<strong>on</strong>al thawing in loam is 1.8-2.8 m and in gravel is 3.6-4.6 m. The depth ofseas<strong>on</strong>ally freezing in loam is 2.h-3.2 m and insand with gravel is 2.8-4.5 m.REFERENCESBrown R.J.E., <strong>Permafrost</strong> in Canada, Universityof Tor<strong>on</strong>to Press, 234p.Zabolotnick S.1. (1975) Seas<strong>on</strong>al freezing andthawing grounds. Geocryological c<strong>on</strong>diti<strong>on</strong>sof the M<strong>on</strong>golian People's Republic. The joint.Soviet-M<strong>on</strong>golian scientific-research geologicalexpediti<strong>on</strong>, transati<strong>on</strong>s, Vo3.10, pp.49-73, (Text in russian).Zhuu Youwu, Qiu Guoqing anrf Guo D<strong>on</strong>gxin (1991)QuatErnary permafrost. in China, QuaternaryScience Reviews, Vol.10, pp.511-517.L<strong>on</strong>gid H. (1969) <strong>Permafrost</strong> of M<strong>on</strong>golia. ('l'extin M<strong>on</strong>golian).Tumurbaatar D. f1975) Seas<strong>on</strong>al freezing andthawing grounds of the Fl<strong>on</strong>golian, Academy ofSciences pp.39-74. (Text in M<strong>on</strong>golian).Tumurbaatar D. (1933) Classificati<strong>on</strong> .of' seas<strong>on</strong>al-1.y freezing and thawing grounds, Geographicproblems of M<strong>on</strong>golia, Vol.23, pp.25-29.Fig.2 The changc of t-he depth of seas<strong>on</strong>al Ireezingin loam (x,) and sand (0) in central M<strong>on</strong>golia1245
Fig.3 Map of regio~l of seas<strong>on</strong>al freezing and thawing ground of M<strong>on</strong>golia1246
HIGHWALL STABILITY IN STRIP MINES IN PERMAFROSTJalal VakiliNinyo & Moore9272 Jer<strong>on</strong>imo Road, Suite 123AIrvine, California 92718 USAThe instability of highwall slopes, exposed to thawing,surface coal minesin permafrost regi<strong>on</strong>s is described. Remedial measures are proposed to preventshallow as well as deep slope failures in these regi<strong>on</strong>s. A practical designc<strong>on</strong>figurati<strong>on</strong>, which involves introducti<strong>on</strong> of a ber.ch wide at the bottom of thepermafrost layer, is proposed to mitigate highwall instabilities.INTRODUCTIONCoals, ranging in age from carb<strong>on</strong>iferous totertiary, are found in many areas of permafrostregi<strong>on</strong>s. Although predominantly lignite andsubbituminous in rank, the range is completefrom lignite to anthracite, Reserve6 ofstrippable coal in Alaska, for example, arec<strong>on</strong>sidered as 5 billi<strong>on</strong> t<strong>on</strong>s subbituminous and2 billi<strong>on</strong> t<strong>on</strong>s bituminous coals, Reserves forthis area include 120 billi<strong>on</strong> t<strong>on</strong>s of inferredresources and probably more than 1.5 trilli<strong>on</strong>t<strong>on</strong>s of estimated reserves (Hamm<strong>on</strong>d 1976). Thecoal is mined at present by the strip miningmethod. Draglines and scrapers are primarilyused to remove the overburden. Coal seams aremined using fr<strong>on</strong>t-end loaders, shovels, andtrucks, or easy miners.In designing large excavated slopes. in stripmines, the most important decisi<strong>on</strong> of theengineer is the selecti<strong>on</strong> of a slope angle.The purpose of the geotechnical study of theslope is to, ensure reas<strong>on</strong>able stability of theslope' in the most ecdnomical way. Because therock mass composing each highwall slope isunique, there are no standard soluti<strong>on</strong>s forslope stability analysis. A practical soluti<strong>on</strong>is formulated from the basic geology data,engineering properties of soil and rock,geometry of the slope, the ground water andenvir<strong>on</strong>mental observati<strong>on</strong>s.. , 'This paper.describes the factors affectingcut slope stability in permafrost regi<strong>on</strong>s and .the alternatives available for improving thestability of slopes.FACTORS AFFECTING STABILITY OF SLOPESen Characteri t?l%%erburden of czali?eds, in permafiastregi<strong>on</strong>s of Alaska, and particularly the stratabetween the'coal beds, c<strong>on</strong>sists largely ofpoorly c<strong>on</strong>solidated sandst<strong>on</strong>e and clayst<strong>on</strong>ewith pebbly layers (Wahrhaftig 1954). Theresp<strong>on</strong>se of cut slopes in fa:ozen ground isdirectly related to the nature.of the soil andthe distributi<strong>on</strong> of ground ice. It is difficultto determine the c<strong>on</strong>diti<strong>on</strong>s from a siteinvestigati<strong>on</strong> program al<strong>on</strong>e, and a clearpicture of the anticipated resp<strong>on</strong>se may notemerge until actual ground ice c<strong>on</strong>diti<strong>on</strong>s areexposed during mining operati<strong>on</strong>s.Minina MethodStrip mining usually is accomplished byremoving the overburden from a strip across-<strong>on</strong>edimensi<strong>on</strong> of the deposit. A parallel strip isthen excavated usually in the oppositedirecti<strong>on</strong> and the overburden is placed into thestrip previously mined. This cycle is repeatedas l<strong>on</strong>g a6 the deposit allows, The pitc<strong>on</strong>figurati<strong>on</strong> is determined essentially byc<strong>on</strong>sidering all the important factors: i,e.terrain, ratios, overburden, shape of deposit,thickness of seam, producti<strong>on</strong> requirement, andequipment available. Where the overburden iswell over average thickness, or is of such anature that is has a low angle of repose, thel<strong>on</strong>ger reach and other characteristics ofdragline may make it the cheapest strippingunit in the l<strong>on</strong>g run (Bhattacharyya, 1982).If the coal is pitching, is as in theanthracite regi<strong>on</strong>, the dragline makes itpossible to operate by casting, work deeperdown the pitch at a lower cost, and in someinstances, to recover the coal without thenecessity of men or equipment entering the pit.Method of mining determines the height andangle of highwall and spoil slopes, benchwidth, locati<strong>on</strong> and specificati<strong>on</strong>s afequipment. Dragline exerts extra load an thehighwall and c<strong>on</strong>tributes to the overallinstability of slopes, and can often generateshallow failures in the surface alluvium andthawed rocks.11247'.
mWANISI OF SLOPE FAILUREOnce the factors affecting slope stabilityare evaluated, it will be necessary to developa model that represents the particularc<strong>on</strong>diti<strong>on</strong>s found within the pit. For theselected model, the ehear resistance will becalculated al<strong>on</strong>g the potential failure surfacethat would be necessary to bring the materialenclosed by the slope profile and the failuresurface to the point where the movement isabout to occur, as shown <strong>on</strong> Figure 1. If thecalculated shear resistance at limitingequilibrium is less than the available shearstrength, the slope will be stable. Thecomparis<strong>on</strong> of the available and computed shearresistances is carried out by means of an indexknown as the factor of safety. In mathematicalterms :FLfr- c + o tan @ = shear strengthwhere: F = factor of safetyrtal<strong>on</strong>g some shear surface? = equilibrium shear stress al<strong>on</strong>gthe sane shear surfacec = cohesi<strong>on</strong>u = normal stress.$ = angle of internal fricti<strong>on</strong>To determine the effective normal stress aand the shear stress r al<strong>on</strong>g the failuresurface, various analysis methods are used,1.e. method of slices for circular arc analysis(Bishop 195s).The analysis of failure in permafrost groundrequires the specificati<strong>on</strong> of the in-situ shearstrength of frozen ground. The strength offrozen ground deVeelops from cohesi<strong>on</strong>,interparticle fricti<strong>on</strong>, and particleinterlocking, much as in unfrozen soils.Cohesive forces are attr.ibute8 to adhesi<strong>on</strong>between soil particles and the ice in the soilvoids and to surface forces between particles.The strength of .frozen soil decreases withdurati<strong>on</strong> of- load applicati<strong>on</strong> and exposure tothe atmosphere (Vyalov 1959). Therefore, l<strong>on</strong>gtermestimates of permafrost soils strength areneeded in order to be able to apply classicalmethods of analysis such as method of slices(McRoberts, 197413). When a frozen soil issubjected to a lpad, it will resp<strong>on</strong>d with aninstantaneous deformati<strong>on</strong> and a time- andtemperature-dependent deformati<strong>on</strong> called creep.At low solid c<strong>on</strong>centrati<strong>on</strong>s (ice-rich soil) thestrength may approximate that for ice and the'l<strong>on</strong>g-term strength will be very small since icecreeps under extremely small stresses. At highsolid c<strong>on</strong>centrati<strong>on</strong>s (ice-poor soils)interparticle fricti<strong>on</strong> and dilatancy play amajor part in determining the soil strength.The great difference in strength between frozenand unfrozen soil is derived from addedcohesi<strong>on</strong> due to t%e ice comp<strong>on</strong>ent and the creepeffects of ice. Ice-poor ground exposed tothawing will lose its cohesive b<strong>on</strong>ding andl<strong>on</strong>g-term fstrehgth of this kind of soil can bededuced from triaxial testing of unfrozensoils. In coal mines, when overburden isremoved, the highwall slope and the pit .bottomwill be exposed to thawing. <strong>Permafrost</strong> materialwill, therefore, lase their cohesive strengthwhich may result in highwall slope failures.Failures may be in the form of a shallow slopeface failure or a deep-seated overall slopefailure.Two kinds of shallow face failures are comm<strong>on</strong>in permafrost terrain:If permafrost soils are not sufficiently icerich,a thawed layer begins to form <strong>on</strong> thesteeply inclined cut slope. This thaws to somecritical depth, at which time the face failurestarts by development of a skin flow in thethawed layer which exhibits characteristics ofa viscous fluid in its downslope moti<strong>on</strong>, asshown <strong>on</strong> Figure 2. Skin flow has been reportedby many investigators (McRoberts 1973).FIGURE 1 - PROPOSED HIGHWALL MODEL FOR PERMAFROST REGION
, ,FloU~ 2 - SKIN FLOWFIGURE 4 - BLOC? SLIMRotati<strong>on</strong>al slides usually occur in completelythawed soil. These failures are similar to theclassical circular type of failure comm<strong>on</strong> inclays in more temperate regi<strong>on</strong>s as shown <strong>on</strong>Figure 5 (McRoberts 1973).AThe third type of slide of icy permafrostslopes is Creep movement al<strong>on</strong>g the beddings(McRoberts, 1975a). Creep movement might beinitiated by a warming up but not thawing offrozen ground (Figure 6) caused"by removing theinsulating vegetati<strong>on</strong> cover, or by changingstress levels from additi<strong>on</strong>al load applied fromequipment, or stress re'lief from cutting'theslope. If such a process occurs, <strong>on</strong>e result maybe l<strong>on</strong>g-term creep rupture of the frozen soil,which would Pesult in a failure like form blockslides. The creep stren'gth of firozen soils is ,defined as the stress level,,'after a finiteLess thaw-susceptible soils can be subject to time, at which rupture, instability leading torapid desiccati<strong>on</strong> and after undermining byrupture, or extremely large deformatibnsmelting ice, may fail as a fall failure. Itwithaut rupture occur, and eari be determined bysimply involves the downward movement oftests <strong>on</strong> undisturbed permafrost soil samples.detached blocks falling under the influence of8~gravity as shown <strong>on</strong> Figur.e 3 (McRoberts 1973;1974a).J"0 ' = SHEAR STRAIN~''5 SHEAR srwssFIGURE 6 - CREEP MOVEMEhNT-# =. A$ "kcff4 B.m,a PARAMETERS TOBE DETERMINEDEXPERiMMENTALLYREMEDIAL MEASURES TO PREVENT $T,OPE FAILUREFIGURE 3 -The feature complicating the design bf cutsFALL FAnuREin permafrost soils is the instakiility that mayoccur when"exposed frozen soils are allowed toThree types of deep-seated overall slopethaw, If the soil is fine-qrained and ice-rich,failure have been encountered in permafrost ablati<strong>on</strong> processes cah generate su'bstantialterrain.rates of surficial failures. The magnitude ofBlock slides involve the movement of a large the movements produced by actively retreatingblock that has moved out and down a with cuts is substantial and could be deliberatelyvarying degree of back tilting. These types of induced to speed stripping process,slide are comm<strong>on</strong> where glacio fluvial sands and The performance of actual cuts in permafrostgravels overlie glaciolacustrine silts and soils has been studied by several authorsclays. Slumps al<strong>on</strong>g bedding plane could involve (Pufahl 1975, McPhail i976). Experihce to datelarge areas, ashown <strong>on</strong> Figure 4. Detailedsuggests that the following dedign , , 'Iobservati<strong>on</strong>s of block slides are given by c<strong>on</strong>figurati<strong>on</strong>s are appy-opriate:.(McRoberts 1973, 197433, and Isaacs 1972).Cuts in frozen id-poor'doil, or bedrock- Cuts in soil and bedrock 'which -are-'stable up<strong>on</strong> thaw can be designed so,that the ^slope angle is compatiblewith khe,imfrozen properties. ,* Cuts in ice-wedge terrain . .- If a cut in terrain in which theground-ice c<strong>on</strong>diti<strong>on</strong> exists as amatrix of ice-wedrje' in ice-poor2FIGURE 5 - ROTATIONAL SLIDEmineral soil, the most ehitable designdebends <strong>on</strong> local c<strong>on</strong>diti<strong>on</strong>s. Steepcu$s are usually desirable becausefewer ice wedges are encountered.Cuts ih ice-rich pefmafrbst-. Various design c<strong>on</strong>figurati<strong>on</strong>s can bec<strong>on</strong>sidered for cuts in which the I 'ground-ice c<strong>on</strong>diti<strong>on</strong>s are horiz<strong>on</strong>tallyc<strong>on</strong>tinuous. Because it can bedifficult to preverk degradati<strong>on</strong>, thedesign of ice-rich cuts ih'warmpermafrost must necessarily allow forsome thaw in the ice-rich soil.Introducing highwall benches willprevent thiwed material from movlnginto the pit,as shdwn <strong>on</strong> Figure 1. Analternative method for,improvihg slopestability, in this case, is to operatestripp'ing operati<strong>on</strong>s during winter ,time when the ambient temperature,isbelow Ereezing'point and-there is nodanger of thawing.
TU reduce the danger of al<strong>on</strong>g-beddingslides, the strip mining operati<strong>on</strong> shouldbe planned so that all bedding planes <strong>on</strong>which sliding could take place would dipinto the highwall face as shown <strong>on</strong> Figure1.When the mining depth is more than thedepth of permafrost layer, it isrecommended to introduce a bench in thehighwall slope at the bottom of thepermafrost layer, as ahown <strong>on</strong> Figure 1.The lower slope of the highwall is notfrozen and will not thaw, so there is ascarce possibility of instability of thelower slope. Additi<strong>on</strong>al water fromthawing permafrost and ice wedges shouldbe collected at the toe of the upperslope by introducing a drainage ditch asshown <strong>on</strong> Figure 1. A wide bench will helpto improve the overall stability of theslope and prevent the thawed material ofthe permafrost layer from moving into thepit. To prevent face failure in the upperslope after thawing, the slope angleshould be designed <strong>on</strong> the basis offricti<strong>on</strong>al strength of the thawedpermafrost materials <strong>on</strong>ly.Finally, in no other area of slopestability design do c<strong>on</strong>structi<strong>on</strong>activities offer such an importantinfluence as in permafrost terrain.Inappropriate c<strong>on</strong>structi<strong>on</strong> activities,' such as premature removal of topsoil oroverburden, may disrupt slope stabilityand should be avoided by careful advanceplanning of mining methods and miningsequences.McRoberta, E. C. and N. R. Morgenstern, 197413,**The Stability of Slopes in Frozen Soil,IaMackenzie Valley, N.W.T., Can. Geotech.J., 11:554-573.McRoberts, E, C., 1975a, vvSome Aspects of aSimple Sec<strong>on</strong>dary Creep Model forDeformati<strong>on</strong>s in <strong>Permafrost</strong> Slopes, Can.Geotech., J.,. 12:98-105.Pufahl, 0. E., 1975, "The Stability of ThawingSlopes,*@ unpublished Ph.D. thesis,University of Alberta, Edm<strong>on</strong>t<strong>on</strong>.Vyalov, S. S., 1959, "The Strength and Creep ofFrozen Soils and Calculati<strong>on</strong>s €or Ice-SoilRetaining Structures,t* U.S. Army cold Reg.Res. Eng. Lab. Trans. 76, Hanover, N.H.Wahrhaftig, Clyde and J. H. Birman, 1954,"Stripping - Coal Deposits <strong>on</strong> LowerLignite Creek, Nenana Coal Field, Alaska,"Geological Survey Circular 310.REFERENCESBhattacharyya, K, K., J. Vakili, S. Y. Chi,1982, "Geotechnical C<strong>on</strong>siderati<strong>on</strong>s for theamsign of Highwall and Spoil Slopes inLignite Mines1" Proc. Mini Symposium,"Lignite Mining and Stability, Sept. 1982,H<strong>on</strong>olulu, Hawaii.Bishop, A. W., 1955, "The Use of Slip Circle inthe : tability Analysis of Slopes",Geotazhnique, 5, 1, pp. 7-17.Hamm<strong>on</strong>d, S., G. R. Martin, and R. G. Schaff,1976, "Biennial Report 1974-75," Divisi<strong>on</strong>of Geological and Geophysical Surveys,State of .Alaska.Isaacs, R. M. and J,. A. Code, 1372,, "Problemsin Engineering Geology Related to PipelineC<strong>on</strong>structi<strong>on</strong>". Nati<strong>on</strong>al Res. Counc. Tech.Nem. 104 pp, 147-179.McPhail, 5. F., W. B. McUullen, and A. W.Murfitt, 1976, "Yuk<strong>on</strong> River to PrudhoeBay:n Less<strong>on</strong>s in Arctic Design andC<strong>on</strong>structi<strong>on</strong>, Civ. Eng. (N.Y.), 46(2): 78-82.HcRoberts, E, C., 1973, "The Stability ofSlopes in <strong>Permafrost</strong>," unpublished Ph.D.thesis, University of Alberta, Edm<strong>on</strong>t<strong>on</strong>.McRoberts, E. e. and W. R. Moryenstern, 1974a,"The Stability of Thawing Slopes," Can.Geotech. J., 11:447-469.
DESTRUCTION AND REHABILITATION OFWang ChangshengSHAFT LINING USED IN FROZEN SHAFTandLiu RihuiBeijing <strong>Research</strong> Institute of Mine C<strong>on</strong>structi<strong>on</strong>,Central Coal Mining <strong>Research</strong> InstituteBeijing, 100013, ChinaIn recent years, the shaft linings of more than 10 shafts sunk with freezingmethod in China coal mine were destructed in varying degrees; the regi<strong>on</strong>s ofdestructi<strong>on</strong> occurrence are mainly in Huaibei, Xuzhou and Datun coal minedistricts,and the major expressi<strong>on</strong>s of shaft lining destructi<strong>on</strong>s are peeling andcoming off of shaft lining c<strong>on</strong>crete and crooked reinforcing bars.thus leading toshort-term stop producti<strong>on</strong> of mines and seriously menacing the security ofmines. In this paper .the process of shaft lining destructi<strong>on</strong> of these shafts isexpounded and a simple analysis is made of the reas<strong>on</strong> of shaft liningdestructi<strong>on</strong>s. In accordance with shaft lining destructi<strong>on</strong>s, rehabilitati<strong>on</strong>s ofthese shafts have been carried out many times by mine c<strong>on</strong>structi<strong>on</strong> departments.The'%tate of the rehabilitati<strong>on</strong>s is also given briefly in this paper.BRIEF ACCOUNT FOR DESTRUCTION QF SHAFT LINING IN Inspecti<strong>on</strong> after the sound stopped showedFROZEN SHAFT AND EMERGENCY TREATMENTthat there was severe circumferencial peelingoff around shaft at the depth of 241 m , theSince 1955 when freezing method for sinking destructi<strong>on</strong> surface wa6 smooth, and gravel wasshaft was adopted first in China, more than 320 cut off into a plane, with peeling-off depthshafts have been sunk, totalling to 50 km. In being 200-250 mm and height being 500-1500 mm.China freezing method has already become a major The reinforced bars was revealed and bent underspecial shaft sinking method in unstable water- force. There were several seepages in the shaft.bearing strata. After 1987, the accidents of Afterwards, it was also found that crackspeeling and coming aff of shaft lining c<strong>on</strong>crete appeared in hoist tower with the l<strong>on</strong>gitudinaloccurred , early or late, in 17 shafts sunk with cracks in the lead and some cracks -looked like,the freezing method in Huaibei & Datun the character /\ with a dip angle of 50-60. .coalfields, China. In some shafts, there were There were altogether 14 cracks(Fig.1).water flowing into shaft, carrying sand with it, The method for emergency treatment is thatthus menacing the security of mine producti<strong>on</strong>. three lines of 18# channel steel rings are usedThe mine had no alternative but to stop every <strong>on</strong>e meter. 58 channel steel lagging isproductian to make emergency treatment. This employed between the ring and shaft 1ining.Therepaper briefly describes the destructi<strong>on</strong> andis ir<strong>on</strong> wedge for tightening between the laggingrehabilitati<strong>on</strong>s of Linhuan Colliery auxiliary and shaft lining. 22 pieces of 180 N/m rail areshaft, Haizi Colliery auxiliary shaft and placed l<strong>on</strong>gitudinally around each circle forZhangshuanglou Colliery auxiliary shaft.reinforcing the rings.Rails are c<strong>on</strong>nected to therings with clips and then gunite is used forLinhuan Colliery Auxiliary ShaftThe coal annual output of the mine wasdesigned as 1.8 milli<strong>on</strong> t<strong>on</strong>s.The mine was handedreinforcement.Auxiliary Shaft of Haizi Collieryover and put into producti<strong>on</strong> in 1985. The The design annual output of Haizi Colliery isauxi1ial.y shaft of the mine is 508.7 m in net 1.5 mt. The mine was handed over and put intodepth and 7 .2 m in net diameter. Freezing method producti<strong>on</strong> in 1987. The Auxiliary shaft of thewas adopted in overburden and double-wallmine has a net diameter of 7.2 m.Freezing methodreinforced c<strong>on</strong>crete lining was used with the for sinking shaft was adopted in overburden andbuter wall and inner wall being 150 mm and 900 compound lining was used with its thicknessmm thick respectively.The outer wall was closely being 1100 to 1400 mm. Where the destructi<strong>on</strong> ofintegrated with the inner wall. The design shaft happened, triple-wall lining was used.,Thestrength grade of c<strong>on</strong>crete is 40MPa and the outer wall is 400 mm thick and is made of preactualcube strength is generally SOMPa or so caet c<strong>on</strong>crete blocks. The middle and inner wallswith the maximum- value being 59.5 MFa. so are 300 mm and 700 mm thick respectively and arec<strong>on</strong>crete is very good in quality and is an c<strong>on</strong>sisted of in-situ c<strong>on</strong>crete with a plasticexcellent product.plate placed in between. The c<strong>on</strong>crete grade ofIn April, 1987, there happened severe burst lining is designed as 40MPa and c<strong>on</strong>crete qualitysound from inside the shaft and then some scraps was rated as an product up to the mark.of c<strong>on</strong>crete dropped from the shaft, the whole An overall inspecti<strong>on</strong> of lining was made inprocess lasted for half an hour.September, 1987.1t was found from the inspecti<strong>on</strong>1251 8
I 233m1 249m *I 269mN E s241mFig.1 Strengthening scheme chart .of Linhuan Colliery auxiliary shaft' 1252
that ruptures of c<strong>on</strong>crete were observed in twoplaces of shaft-.The upper place of rupture,is232.8 m deep in the directi<strong>on</strong> of NE with acircumference of about 7.5 m and a maximumheight of 0. 5 m. The lower place of rupture islocated in 237.5~ depth in the directi<strong>on</strong> of NWwith a circumference of about 7 m and a maximumheight of 1 m. The strata in which the. shaftlining ruptures happened are clay , fine sandand water-bearing sediments of the QuarternaryPeriod, and are about 6 m from weathered z<strong>on</strong>e.Atdestructive part, 9 reinforced bars in thedirecti<strong>on</strong> of NW could be revealed.Als.0 there wasa seepage of water. The emergency treatment ofthis shaft was same as that of Linhuan Collieryauxiliary shaft.Zhangshuanglou Colliery Auxiliary ShaftThe mine was designed to have a annual outputof 1.2 mt and put into producti<strong>on</strong> in 1986. Thenet diameter of the mine's auxiliary shaft is6.5 m; depth, 565.7 m; overburden thickness, 242m;freezing depth, 315 m. Double-wall lining wasadopted with the outer and inner reinforcedc<strong>on</strong>crete walls being 600 mm thick each. A layerof compressible polystyrene plastic sheet 20-40mm thick was filled between the
l<strong>on</strong>gitudinal coordinate, Z'=O at theborder between overburden and base rock;lining height abov,e the border;-coefficient, p= j6,proporti<strong>on</strong>al coefficient between liningsurface shear stress and,liningdisplacement;linink thickness.calculati<strong>on</strong> values show that whv shaftlining destructi<strong>on</strong> happens mostly in Sl,lmmer ismainly because of additi<strong>on</strong>al :compressive forcearising from temperature increase in summer.BACK GROUTINGFor above-menti<strong>on</strong>ed destructed frozen shaft,we have, inside shaft, adopted such methods foremergency treatment as hanging channel rings <strong>on</strong>shaft with vertical rail reinforcing andgrouting inside shaft for c<strong>on</strong>trol of water etc.,but the problem has not been solvedfundamentally. The shafts still c<strong>on</strong>tinued tosubside, causing shaft installati<strong>on</strong>s twisted andmaking producti<strong>on</strong> unable to c<strong>on</strong>duct properly.Thechoices for solving it are placing a lay of insitulining inside shaft or c<strong>on</strong>solidatingformati<strong>on</strong>s behind shaft lining thus transformingtheir structure from loose state to halfc<strong>on</strong>solidatedor c<strong>on</strong>solidated state, the ultimateaim of which is making shaft itself bearingcapacity greater than external forces andkeeping shaft stable. The latter choice is usedto strengehen formati<strong>on</strong>s behind shaft lining atpresent.Surface Grouting PlanBoreholes are put down around the shaftlining destructi<strong>on</strong> from the ground surface awayfromtheshaft by means of the directi<strong>on</strong>aldrilling. This method, not having an effect <strong>on</strong>the producti<strong>on</strong> of mine, is an effective and goodmeasure. But owing to same reas<strong>on</strong>, this plan isstill in preparatory stage.Beck Grouting Inside ShaftThe purpose of back grouting inside shaft isstrbngthening the shaft lining in the vicinityof the border between base rock and overburden;forming a ring of grout diaphram wall of somethickness surrounding the shaft and shaping awater-absent and pressure-absent c<strong>on</strong>solidatedregi<strong>on</strong>, in order to share vertical pressure andhoriz<strong>on</strong>tal strata pressure which the shaft bear;blocking up and c<strong>on</strong>solidating original liningcracks and fissures,c<strong>on</strong>trolling water-make,water-drenching and water seepage, increasing theentirety and stability of shaft, and sopreventing deformative destructi<strong>on</strong> from furtherdeveloping and happening again (Zeng 1991).Take Haizi Colliery as an example. Groutingbegan with weatherig zo<strong>on</strong> in base rock. Everylayer of boreholes were put down from bottom totop. Grouting was mainly in the cracked regi<strong>on</strong>and in the formati<strong>on</strong> of grit gravel and mediumto fine sand of Quarternary Water-bearingstrata. For the sake of c<strong>on</strong>structi<strong>on</strong>, the firstrow of boreholes were arranged in weathered baserock.As grout is liable to diffuse upWaKdS,it ispossible not <strong>on</strong>ly to build a good basis at thebottom, to block the border surface between thebase rock and the overburden,and also to preventlater grout from diffusing downwards.Grouting EffectOver 1000 t c<strong>on</strong>crete was injected in the mainshaft and auxiliary shaft of Haizi Colliery. Thethickness of grout diaphram and water-absent andpressure-absent c<strong>on</strong>solidated regi<strong>on</strong> are allgreater than 2 m. Basicly there exists no waterin cracked regi<strong>on</strong> of lining after grouting.During <strong>on</strong>e year following grouting, measurementsmade through dlsplacement and strain indicatorsshowed that there was little changes indisplacement, especially in radial displacement.so that by means of back grouting , thedisplacement at ruptured part of shaft has beengot an effective c<strong>on</strong>trol.CONCLUSIONSAlthough lining cracking has got c<strong>on</strong>trolledeffectively after treatment, it is not able tobe eradicated. Various kinds of shaft liningstructure have been adopted in the c<strong>on</strong>structi<strong>on</strong>of frozen shafts in China (Yu & Wang 1988). Whenthe strata which the shafts pass c<strong>on</strong>tain gritgravel formati<strong>on</strong> in the lower part, it ispreferable to adopt flexible shaft liningstructure. Placing a layer of bitumen slidingsheet between the outer and inner wall,having anadvantage of being flexible and seepageresistent,helps to reduce the effect of stratasubsidence <strong>on</strong> interneal lining and to changeuneven loading c<strong>on</strong>diti<strong>on</strong> of internal lining.REFERENCESSu Lifan (1991) Damage of lining in frozen shaftand reas<strong>on</strong> analysis. Mine C<strong>on</strong>structi<strong>on</strong>Technology No.1,33-37.Yu Xiang and Wang Changsheng (1988)Structure andstress analysis of seepage resistant liningsinshaftssunk with thefreezingmethod.Nottingham: 5th Int. Symp.of Ground Freezing.Vo1.1,311-318.Zeng R<strong>on</strong>gxiu (1991) A new technique for backwallinjecti<strong>on</strong> for water-bearing sand shaft, WorldCoal Technology No.9, 3-6.1254
PRESSURE INFLUENCE ON PORE CHARACTERISTIC OF FROZEN SOILSWang Jiacheng: Xu Xiaozut Deng Yousheng' and Zhang Lixing'1U.P. Lebedenko'and E.M. Chuvilin''State Key Laboratory of Frozen Soil Engineering,LIGG; .AS*Faculty of Geology. Moscow State UniversityBy using a Poresizer we determined the pore characteristic of saturated frozenNeim<strong>on</strong>g clay under the c<strong>on</strong>diti<strong>on</strong>s of c<strong>on</strong>stant temperature and pressure and ofc<strong>on</strong>stant pressure and temperature gradient. Results show that when thetemperature is the same, the tatal pore volume and the amount of greater poresize of frozen soils are the minimum under the atmospheric envir<strong>on</strong>ment, and themaximum under the vacuum c<strong>on</strong>diti<strong>on</strong> and increases with increasing air pressureunder the envir<strong>on</strong>ment of air pressure higher than the atmospheric pressure. ,When the air pressure is the same, the total pore volume of frozen soilsincreases with decreasing temperature and the structures in frozen soils changefrom big ice strips to the small:INTRODUCTIONThe pore characteristic of soils before andafter freezing is of great significance forphysico-mechanical properties and cryogeneticstructure and for mass transfer in soils.Chuvilin, E.M. and Lebeden.ko, 1U.P. (1988)described the formati<strong>on</strong> and classificati<strong>on</strong> ofcryogenetic structures of frozen soils. Viyalov,S.S. and Chuitoviqi N.A. (1953) pointed out thatthere is higher pressibility €or the frozen soilwith higher temperature under overburden pressureso as to decrease porosity and to movetexture elements. Wang Jiacheng (1989),studiedthe physical process and crvogenetic structureduring soil freezing. All of the descripti<strong>on</strong>menti<strong>on</strong>ed above are of great significance €orthe understanding of pore characteristic changesduring soil freezing. So far, there is littleinformati<strong>on</strong> about the pore characteristic offrozen soils under overburden pressure oratmospheric pressures. By using the porometer,we determined the porosity of frozen soils underoverburden pressure and atmospheric pressures.The purpose of this paper is to present the testresults.TES? PRINCIPLE AND NETHODThe sample used in the test is Neim<strong>on</strong>goliaClay. Its grained size compositi<strong>on</strong> and physicalproperties are shown in Table 1.The test c<strong>on</strong>diti<strong>on</strong>s can be divided into twogroups: <strong>on</strong>e is pressure loaded <strong>on</strong> the sample,including atmosphere and vacuum. The sample isquickly frozen and the temperature kept c<strong>on</strong>stant.In other words, the influence of water migrati<strong>on</strong>during soil freezing is negligible. Another ispressure loaded <strong>on</strong> <strong>on</strong>e end of the sample and thetemperature is kept different at both ends ofthe soil column. i.e., the sample is frozenslightly and water migrati<strong>on</strong> and ice segregati<strong>on</strong>occurred,.. .Sample preparati<strong>on</strong> Ls as follows:For the first group, the saturated clay ballwith a diameter of 5 cm is put into a c<strong>on</strong>tainermade of stainless steel. Nitrogen is filled intothe c<strong>on</strong>tainer or air extracted from the c<strong>on</strong>tainer(vacuum) and then the pressure is kept c<strong>on</strong>stantfor about two hours. Afterwards the c<strong>on</strong>tainerwith the sample is put Into a lob temperaturecirculati<strong>on</strong> bath to let the sample quicklyfreeze for four hours. Finally, the sample isTable 1.Physical properties of claySample Grained size compositi<strong>on</strong>name >0.05 0.05-0.002 CO.002 limit, X limit, ZG;avitySpe. Surf.area m'/gClay 2.1 50.8 47.1- 32.8 20.4 2.73 28' 125s '
taken aut of the c<strong>on</strong>tainer and air dried at zerodegree centigrade and the porosity is determinedat the side and the center locati<strong>on</strong>s, respectively.The test c<strong>on</strong>diti<strong>on</strong>s are shown in Table 2.For the sec<strong>on</strong>d group, the saturated clay iscompacted into a soil box made of plexiglasswith a size of 15 cm in diameter and 5 cm in...height. The atmospheric c<strong>on</strong>diti<strong>on</strong> is kept at thetop of the sample with different values of 0,-600 mmHg and 0.2 MPa, respectively. The temperatureat both ends of the sample is kept at 0 and-4 degree centigrade, respectively and thesample is frozen from the bottom upward. After3 days of testing, the sample is taken out ofthe soil box and air dried and the porosity isdetermined.kESULTS AND ANALYSISPore Characteristic of Frozen Soil UnderC<strong>on</strong>stant Temperature and Pressure and QuickFreezinR C<strong>on</strong>diti<strong>on</strong>sFrom Table 2 it can be seen that there is agreat change in porous volume before and aftertesting under n<strong>on</strong>-pressure c<strong>on</strong>diti<strong>on</strong>. The factof the increasing of porous volume in thesample after freezing indicates swelling occursin the sample due to phase change of water. Thefact of porous volume in the center of thesample greater than that in the sides indicatesthat water migrates from the side to the centerduring sample freezing. If the temperaturekeeps at -30 degree centigrade, we can see thatthe total porous volume increases with theincrease of the atmospheric pressure no matterwhere the sample is located and is greater inthe side than in the center. But the totalporous volume is the maximum and greater in theside, too, under vacuum c<strong>on</strong>diti<strong>on</strong>. This meansthat the pressure gradient is the main mechanismfor the change of the porous Characteristic inTable 2. Porous characteristic oftemperature and pressuresoils. If the atmospheric pressure is kept at8 MPa, we can see that the total porous volumeof the sample'increases with the decrease oftemperature. 14 implies tha4 frost heave is theessential mechahisr for the change of porousvolume. The changing regularity of the porosityunder different temperature and. pressure c<strong>on</strong>diti<strong>on</strong>sis the same as that of the total porousvolume. The pressure not <strong>on</strong>ly changes the totalporous volume but also changes the compositi<strong>on</strong>of porous diameter. With the increase of pressureor in the vacuum c<strong>on</strong>diti<strong>on</strong>, the number oflarge porous diameter is increased, but smallporous diameter decreased.Figures 1 and 2 show the,'distributi<strong>on</strong> curvesof porous diameter of samples under differenttemperature and pressure c<strong>on</strong>diti<strong>on</strong>s, respectively.From Figures 1 and 2 it can be seen that thec<strong>on</strong>tent of porous diameter greater than 0.03 Dmof the sample before freezing occupies <strong>on</strong>ly 3X.But as a result of frTezing and pressure, thec<strong>on</strong>tent of porous diameter in the range from0.03 Um to 10 um is increased from 1X to 15X andthat of diameter greater than 10 pm increased toabout 20X. The changes of the pore characteristicunder the acti<strong>on</strong> of the pressure menti<strong>on</strong>ed aboveinduce the recombinati<strong>on</strong> and re-orientati<strong>on</strong> ofthe structural elements of soils and result inthe difference of micro-cryogenetic structuresof frozen soils.Photos 1 to 6 show the micro-cryogeneticstructures of frozen soils under differenttemperature and pressure c<strong>on</strong>diti<strong>on</strong>s. From thosephotos it can be seen that when temperature iskept at -3O'C and there is no pressure loaded <strong>on</strong>the sample, the quasi-layered and networkcryogenetic structure is formed under the c<strong>on</strong>diti<strong>on</strong>sof multi-directi<strong>on</strong> freezirg. With anincrease in pressure, the range of quasi-networkstructure is shrunk from the side to the centerof the sample and ,the branchy structure issoils frozen under c<strong>on</strong>stantc<strong>on</strong>diti<strong>on</strong>sNo. Total porous Specif. surf. Porosity of Cant. poro. Temp. Pressurevolume, mlfg area, m'fg x dia. (0.03, X "C MPa. . . ..... . . . .. ... .10-1 0.2091 I1 I 785 31.75 72 C10-2 0.2057 15.369 75 S5-1 0.1802 14.454 26.48 84 C5-2 0 I 2047 13.589 30.55 73 S6-1 0.2094 35.31 11.86170 C6-2 0.228212.426 36.27 65 S7-1 0.2058 d 12.330 34.91 71 C7-2 0.1947 /12.755 32.01 76 S8-1 0.1896 16 782 32.14 92 C8-2 0.2352 12.145 37.89 815-1 0.2320 14.638 36 06 66 C15-2 0.2385 14.418 37.65 62 S-30 0, .-30 4-30 a-10 /s-5 8-30 11.59-1 0.2393 14.677 38 a 93 69 C -30 -600mmHR9-2 0.3888 12.972 48.12 42s12-1 0.3297 21.211 43.51 63 C -5 -600mmHg0.1776 12.980 32.66 97 20 0. .- . . .- ...*wherec - ccnter; s - side.1256
100 10 1 0.1 0.01pore diameter,p mFig.1 Pore size distributi<strong>on</strong> curves underdifferent atmospheric pressure c<strong>on</strong>diti<strong>on</strong>sPhoto 4 X P=11.5MPs T--30BC" 1loo 10 1 0.1 0.01 'porediameter, rnFig.2 Pore size distributi<strong>on</strong> curves under 'diferent temperature c<strong>on</strong>diti<strong>on</strong>sformed instead of the quasi-network. When pressureis kept at 8 MPa, the cryogenetic structurechanges from the network structure to the branchgradually and the network changes from big tosmall and ice straps from thick to thin with theincrease of freezing speed.. ..."Photo 6 X P=8MP> T=-jQCPore Characteristic of Freezing Soil. UnderTemperature nradizt and C<strong>on</strong>stant PressureTable 3 shows che determined result of thepore characteristic of soils under unidirecti<strong>on</strong>alfreezing c<strong>on</strong>diti<strong>on</strong>s. It is shown that the porecharacteristic al<strong>on</strong>g the soil profile is changedafter testing due to water migrati<strong>on</strong> and icesegregati<strong>on</strong>. If there is an overburden pressure,the total parous volume and the amount of porousdiameter greater than 0.03 urn are increased inthe ice segregated z<strong>on</strong>e and decreased in thedehydrated z<strong>on</strong>e after testing.In the case of vacuum c<strong>on</strong>diti<strong>on</strong>, the porousprofile is still c<strong>on</strong>trolled by water migrati<strong>on</strong>and ice segregati<strong>on</strong>. The overburden pressurecan reduce the differences of total porousvolume and diameter distributi<strong>on</strong> of porousprofile, but the vacuum envir<strong>on</strong>ment can enlarRethe differences. The cryogenetic structure ismainly in the shape of horiz<strong>on</strong>tal layers. Whenthe overburden pressure exists, many vertical1257
Table 3, Porous characteristic of soils frozen underunidirecti<strong>on</strong>al pressure c<strong>on</strong>diti<strong>on</strong>s" . . . . . . .3-10.183814.28529.023-20.175616 * 54326.34,972-3 cm03-314-10.19850.172714.85113.77552 .QO27.3285953-4top-4014-20.175414.39729.9897middle0.214-31-11-20.17790.21210.207615,56616.29117.18132,1236.3136.95986481bottom0-1 cm1-2 cm-401-30.218716.86436.28732-3 cm-6OOmmHg1-4 0,1940 17.14133.70 86 3-4-4cm1-5 0.1940 15.282 35.28 90 4-5 cm0.1776 12,980 32.66 97 20 0900-1 cm0fissures occur in the profile and the networkstructure is formed.CONCLUSIONS1. Porous characteristic of soils frozenunder c<strong>on</strong>stant temperature and pressure c<strong>on</strong>diti<strong>on</strong>sis c<strong>on</strong>trolled by the temperature andpressure. When the temperature is the same, theatmospheric pressure gradient is the mainmechanism for the formati<strong>on</strong> of the porouscharacteristic. The total porous volumeincreases with the incr&asing of atmosphericpressure. When the atmospheric pressure is thesame, frost heave is the main mechanism for theformati<strong>on</strong> of the porous characteristic. Thetotal porous volume increases with the decreasingof temperature.2. Water migrati<strong>on</strong> and ice segregati<strong>on</strong> arethe main mechanism for the formati<strong>on</strong> of theporous characteristic of freezing soils. Whenthere exists overburden presaure, the differencesof the porous characteristic in freezingsoils become less because of densificati<strong>on</strong>.3. Under vacuum c<strong>on</strong>diti<strong>on</strong>, the total porousvolume and the amount of greater porous dianeterare greater than those in the c<strong>on</strong>diti<strong>on</strong>s withoverburden pressure.4. The cryogenetic structure of frozen soilis influenced by temperature and pressure. Inthe case of multidlrecti<strong>on</strong> freezing, the networkstructure gradually changes to' a branchystructure with the increasing of btmoapheric1 pressure. In the case of unidirecti<strong>on</strong> freezingwith overburden pressure. the vertical icestraps increase al<strong>on</strong>g the directi<strong>on</strong> of thetemperature gradient.REFERENCESChuitoviqi, H.A.. (1986) Mechanics of FrozenSoils, Translated by Zhu Yuanlin et al.Chuvilin. E.M. and O.M. Yazulin, (1988) FrozenSoil Macro- and Microtexture Fo mati<strong>on</strong>,Proceedings of 5th Internatl<strong>on</strong>a4 <str<strong>on</strong>g>C<strong>on</strong>ference</str<strong>on</strong>g><strong>on</strong> <strong>Permafrost</strong>, 320-323.Lebedenko, 1U.P. and L.V. Shevchenko, (1988)Cryogenic deformati<strong>on</strong> in fine grained soils.Proceedings of 5th <str<strong>on</strong>g>Internati<strong>on</strong>al</str<strong>on</strong>g> <str<strong>on</strong>g>C<strong>on</strong>ference</str<strong>on</strong>g><strong>on</strong> <strong>Permafrost</strong>. 396-400.Wan8 Jiachens and Liu Jimin. (1989) PhysicalProcess and Cryogenetic Structure of FreezingSoils, Proceedings of 3rd Nati<strong>on</strong>al <str<strong>on</strong>g>C<strong>on</strong>ference</str<strong>on</strong>g><strong>on</strong> Frozen Ground, Press of Sciences, 78-84.1258
PERMAFROST CHANGE FOR ASPHALT PAVEMENT ALONG QINGHAI-XIZANG HIGHWAYWang Shaoling and Mi HaizhenLanzhcu Institute of Glaciology and Geocryology,Chinese Academy of SciencesDue to the thermal. absorpti<strong>on</strong> of black asphalt road surface, 60% of the man-madetable of permafrost under roadbed has been decreasing. The formati<strong>on</strong> of the thawcore and uncoincidently frozen ground in the vertical profile acceleratesdifferential settlement of the roadbed and damage of road surfaces. Besides theabove menti<strong>on</strong>ed, either types of frozen ground tend to change, or perenniallyErozen ground disappears completely under some of the, roadbeds.Qinghai-Xizang highway with asphalt pavementhas been used for 7 to 15 years, differentalsettlement appears in most of the roadbeds withinthe permafrost regi<strong>on</strong> and damage of roadbedheavily inEluences transportati<strong>on</strong>. There aremany reas<strong>on</strong>s for the damage of roadbeds, inwhich the thaw settlement of permafrost is themost important. IThe authors worked in the study area fromJune to August of 1991. 380 holes at the roadbedand at natural sites were drilled tu c<strong>on</strong>trastthe permafrost changes ac sites between naturaland man-made c<strong>on</strong>diti<strong>on</strong>s.1. A CONTRACTED LENGTH OF HIGHWAY THROUGH THEPERMAFROST REGIONThe investigati<strong>on</strong> al<strong>on</strong>g the highway in the1970's showed that the northern boundary ofisland permafrost was at K 2877+600 of Xidatanand the southern boundary of c<strong>on</strong>tinuous permafrostwas at K 3424. north of Anduo. From Anduosouthwards to No.125 highway maintenance stati<strong>on</strong>,permafrost occupies 20 per cent of the length of90 km of the highway within the island permafrostregi<strong>on</strong>. Exploratory data for this time dem<strong>on</strong>stratedthat the southern and northern boundaryof permafrost have been changing indeed, especiallythe southern boundary uf c<strong>on</strong>tinuous permafrostwhich has moved northwards 16 km. Within theisland permafrost south of Anduo, permafrost was<strong>on</strong>ly found in the roadbed at an accumulated.length of 2 km. The length of highway throughthe permafrost regi<strong>on</strong> at present that has beenc<strong>on</strong>tracted is about 18 km.2. TYPE OF FROZEN GROUNU UNDER THE ROADBEDUnder natural c<strong>on</strong>diti<strong>on</strong>s, with the excepti<strong>on</strong>of a few secti<strong>on</strong>s, frozen ground is mostlycoincided in the vertical profile for bothla tera 1s of the highway wit :hin is land uerma frostand it all coincided within the c<strong>on</strong>tinuous permafrostregi<strong>on</strong>. The holes <strong>on</strong> the roadbed fromXidatan to Anduo (K 2880 to K 3424) indicatethat the type of frozen ground under roadbed isdifferent from that under natural c<strong>on</strong>diti<strong>on</strong>s.Frozen ground under the roadbed all discoincidedwithin the island permafrost regi<strong>on</strong>, and mostof them also discoincided.2.1 Coincided Frozen GroundThe aan-made table of coincided permafrostunder the roadbed is 2.8 to 4.2 m deep, thisdepth is close to or less than that undernatural c<strong>on</strong>diti<strong>on</strong>s. Ice layer with soil or icerichsoil occurs below the table of permafrost,it is distributed <strong>on</strong> the hills with high elevati<strong>on</strong>(Table 1). Where mean annual air temperatureis below -h.O"C, the depth of seas<strong>on</strong>al freezingunder the roadbed exceeds or equals the depth ofseris<strong>on</strong>al thawing each year. Frozen ground iscoincided in ,additi<strong>on</strong>. Coincided permafrost alsoappears in the low roadbed (height 150 cm). Thedestroyed asphalt pavement secti<strong>on</strong>, whereasphalt pavement zero fill cut secti<strong>on</strong>s, andsubgrades of part of culvert are coincided permafrostit is estimated that distributi<strong>on</strong> lengthof coincided permafrost approximates to 80 km,occupying 15 percent of
~~Table 1. Mileage and distributi<strong>on</strong> secti<strong>on</strong> ofcoincided frozen ground under roadbed al<strong>on</strong>gQinghai-Xizang highwaySecti<strong>on</strong> Road mileage Length (km)Kunlun Shan K 2893-2904 11Kekexili Shan 1 K 3009-3020 11Qusuihenan Shan K 3035-3037 2Fenghuo Shan K 3064-3080 16Kanxinlin K 3171-3176 5Tanggula Shan K 3316-3348 32Total length 77was formed between the seas<strong>on</strong>al frozen layer andthe man-made table of permafrost whose depthchanges from 4.5 m to 10.1 m. The thickness ofthaw core changes from 0.2 m to 6.6 m, most ofthem are 0.5 to 2.O'm. The development of thawcore is related to the c<strong>on</strong>stracti<strong>on</strong> durati<strong>on</strong> ofthe asphalt road, properties of filled soil,water c<strong>on</strong>tent and type of permafrost under road.The secti<strong>on</strong>, which spends shorter c<strong>on</strong>stracti<strong>on</strong>time, has more coarse grained soil and lesswater c<strong>on</strong>tent, has a thicher thaw core.3, CAUSES OF TAE THAW CORE FORMATION AND ITSHARMFULNESS"3.1 Causes of Formati<strong>on</strong>Since the asphalt pavement has been c<strong>on</strong>structed,the thermal c<strong>on</strong>diti<strong>on</strong> under the roadhed haschanged obviously due to the specific solarradiati<strong>on</strong> and thermal balance c<strong>on</strong>diti<strong>on</strong>s <strong>on</strong> theplateau and thermal absorpti<strong>on</strong> of the black roadsurface. C<strong>on</strong>trasting with the natural c<strong>on</strong>diti<strong>on</strong>s,the difference between mean annual surface temperature<strong>on</strong> the asphalt pavement and meanannual air temperature is hoc, which induces thefrozen ground in the roadbed to thaw 20-30 daysearlier and freezes 20 days l'ater. Annualthermal input <strong>on</strong> the road surface exceeds outputwithin the areas with a mean annual air temperatureof more than -hoc. Tn the above area, thedepths of the seas<strong>on</strong>al freezing and thawing are4.2-4.5 m and 4.5-6.0 m, respectively: and thelayer of seas<strong>on</strong>al freezing disappears completelyduring the period between early July to lateAugust. The heat during August to October entersinto the roadbed and is accumulated, whichinduces the man-made table of permafrost to godownwards, causes the frozen ground to discoincidein the vertical profile and finally makesthe thaw core form.In recent decades there has been a trend ofclimate warming <strong>on</strong> Qinghai-Xizang Plateau,which is advantageous to the formatj<strong>on</strong> of thaw 'core.3.2 HarmfulnessIn the forming process of thaw core differentialsettlemeit if- roadbeds developed graduallyand finally induces the damage of road surface,lhe harrnfulne-ss of thaw core to the highway isdifferent due to differences of the type offrozen ground and the lighologic distributi<strong>on</strong>.(1) In the road secti<strong>on</strong> of Xidatan. becausethe roadbed is filled with coarse grained soilwith little ice and water t<strong>on</strong>tent althoughthere is a thick thaw core, the total settlementand deformati<strong>on</strong> are still little.(2) Large total settlements and seriousdamage of toad surfaces emerge in the roadbedfilled with lacustrine sediment or fine grainedsoil with an ice layer with soil and ice-richsoil. Such as those in the basin of Kunlun Shan,in both banks of Qingshui River and <strong>on</strong> the northfacing slope of Kekexili. After the thaw corein the roadbed is c<strong>on</strong>densed repeatedly, thethickness of the thaw core increases slowly withthe development of the man-made table of permafrost.So it is difficult for the roadbed toattain stability.(3) The man-made table of permafrost underthe roadbed is like a pan in which water isaccumulated perennially. The water accumulati<strong>on</strong>makes the man-made table of permafrost godownwards and the heat balance system in theroadbed becdme sophisticated. On the other handthis also causes a hidden problem in that anexpansi<strong>on</strong> mound emerges in the road surface inwhich water flows c<strong>on</strong>tinually into the thawcore and pressure water forms in the thaw core.At present, most of thaw cores under road al<strong>on</strong>gQinghai-Xizang highway is forming and developing,and it would spend a l<strong>on</strong>g time for them to berelatively steady.4. PERMAFROST CHANGES UNDER THE ROADBEDIn recent decades, degradati<strong>on</strong> of permafrostwithin the Qinghai'-Xi&ng Plateau is under x-aywith world wide warming, esp. in the margin ofthe plateau with island permafrost. The regi<strong>on</strong>aldegradati<strong>on</strong>, the ec<strong>on</strong>omic activity and sometechnical factors aggravate permafrost degradati<strong>on</strong>under the roadbed. There are apparentindicati<strong>on</strong>s that permafrost degradates an,ichanges from quantity to quality in some siteswhere vegetati<strong>on</strong> has been removed and h ith X\IIIVwater pits. Such as in hoth sides of thc I - ~ ~ ~ I ~ ! ! ~ P ~4.1 <strong>Permafrost</strong> Disappears and Talik EX~~III?~There are various talik sal<strong>on</strong>R the hi
Exploratory data for railways in the 1970'sdem<strong>on</strong>strated that r,?rmafrost develops in terraceand high flood plains with the excepti<strong>on</strong> of theriver bed <strong>on</strong> the No.1 terrace of Beilu River.The permafrost was 12.8 m thick and c<strong>on</strong>tinuous(No.1 hydrogeological team of Qinghai Province),The changes are as follows:In Xushul River permafrost was not found attwo of the 18 m deep coreholes <strong>on</strong> the roadbedof both sides of bridge; but, permafrost of 8.lmthick <strong>on</strong>ly occurs <strong>on</strong> the high flood plain.<strong>Permafrost</strong> was also not found at two coreholeof 15 m and 18 m depths <strong>on</strong> the roadbed of bothsides of the bridge in Beilu River, it is 9.5 mthick in the high flood plain.The above facts show that thin permafrostunder the roadbed has thawed completely becauseof asphalt pavement influence <strong>on</strong> it. However,permafrost develops under natural c<strong>on</strong>diti<strong>on</strong>ssuch as in high flood plains.4.2 Types Change of Frozen Ground Under RoadbedUnder natural c<strong>on</strong>diti<strong>on</strong>s, ground ice isdistrihuted widely within depths of 1 to 2 mbelow the table of permafrost and decreasesgradually with the Increasing of depth. Atpresent, the depth of most of the man-madetable of permafrost under the roadbed al<strong>on</strong>g thehighway is 1-3 m lower than that of natural<strong>on</strong>es. The table of permafrost decreases graduallyto induce ground ice near the table to thawpartly or completely. By comparsi<strong>on</strong> of statistics(study group of Qinghai-Xizang highway, 1983).The proporti<strong>on</strong> of frozen ground with high icec<strong>on</strong>tent has decreased under the roadbed al<strong>on</strong>gthe highway (Table 2). The type of frozen groundbelow the man-made table of permafrost appearstu change in some secti<strong>on</strong>s of the roadbed, thereis a trend that ground ice c<strong>on</strong>tent is gettingsmaller, which is advantageous for roadbedstability.Many engineerings al<strong>on</strong>g the highway have ,dem<strong>on</strong>strated that the influences of human act:ivityand technical factors <strong>on</strong> the permafrostenvir<strong>on</strong>ment exceed the influence of climatewarming, esp. the degenerati<strong>on</strong> under the roadbedwithin warm permafrost areas which transformsfrom qualitative to quantitative. Many deformati<strong>on</strong>sare not reversible. Damage of permafrostenvir<strong>on</strong>ment in the both sides oE the highwaymay have serious c<strong>on</strong>sequences. After the asphaltpavement wa6 c<strong>on</strong>structed it is inevitable thatpermafrost under roadbeds thaws year by year byadding to the height of roadbed within mostareas where mean annual air temperature is above-6°C. In order to gain an ideal effect, generalmethods, such as to make alterati<strong>on</strong>s of thematerial and colour and the property of heatabsorpti<strong>on</strong> of the roadbed, to improve <strong>on</strong> theinsulati<strong>on</strong> in the roadbed and the drainage in.both sides of roadbed and to protect the permafrostenvir<strong>on</strong>ment, must be adopted for therenovati<strong>on</strong> projects al<strong>on</strong>g the highway.REFERENCESWang Jiachen, Wang Shaoling and Qiu Euoqing.(1979) <strong>Permafrost</strong> al<strong>on</strong>g the Qinghai-Xizan?highway. Journal of Geography, 34(1): p.18-22.Study Group of Qinghai-Xizang Highway, (1983)Distributi<strong>on</strong> laws of frozen ground with. highice c<strong>on</strong>tent al<strong>on</strong>g Qinghai-Xizang highway,Proceedings of.Sec<strong>on</strong>d Nati<strong>on</strong>al <str<strong>on</strong>g>C<strong>on</strong>ference</str<strong>on</strong>g> <strong>on</strong>Geocryology, Gansu People's Press: 43-51. -. ITable 2. Type change of frozen ground with high ice c<strong>on</strong>tent north of Tanggula PassSecti<strong>on</strong> of.amount 46.6 52.9 60.2 19.7 53.4in 1979"ercentaae -amount 39.7 50.8 43.7 32.3 16,5 41.8 21.5 36.7in 19911261
ASTUDY ON PREVENTING FROST HEAVE OF THESHAFT-TYPE ENERGY DISSIPATORWan?, Shir<strong>on</strong>gWater C<strong>on</strong>servancy Bureau of Panjin City,Liao Nin Province, ChinaIn the seas<strong>on</strong>al frost ground area the breakages of traditi<strong>on</strong>al open-type energydissipator by'frosr heave are very widespread and serious. The new shaft-typeenergy dissipator was adopted. The complex prohlem of frost damage was solvedsatisfactorily by means of its overall arrangement and c<strong>on</strong>structi<strong>on</strong> (no need ofspecial measures to prevent frost heave). 'The overall arrangement is quite anew type and made of shaft (including shaft dissipating force) and t.unnel. Theshaft and the tunnel adopt a thin-wall structure of a crosy-secti<strong>on</strong> of circular,arch, egg-shaped or U-shaped, these shapes are advantage to equalize and todecay the force of frost heave. This type is simple, c<strong>on</strong>venience, ec<strong>on</strong>omic andsafe in structure. It is a new-important way to prevent frost damage in.middleand small hydraulic engineering.INTRODIICTIONMany open-type fal.1-water structure (includingsteep gradient) of hydraulic cunstructure ofirrigati<strong>on</strong> channel were destroyed by frost.darnagc because its foundati<strong>on</strong> are not at samelevel, high or lpw, anti the amount and theforce of trost heave are n<strong>on</strong>-uniform. One sideof tha open-type rctainjrig wall was filled withsoil, so it was easily toppled down and brokenup by horiz<strong>on</strong>tal force of frost heave. The opent.ypeenergy d issipator, which was built out: oftraditi<strong>on</strong>al shaft-spillway, has same weakness ofno1 preventing frost heave. Tn recently tenyears, the engineers and techniciance of waterc<strong>on</strong>serv:irlcy project set up crcativ.ely the shafttypeenergy dissipator in cntrance (instead ofthe open-type energy dissipator out of thetrndili<strong>on</strong>al shall-spillway). For widely used inwater ~<strong>on</strong>servancy prc~ject, it gains goodresults (Wang Shir<strong>on</strong>g, 1990).THE BASICALLY ARRANGING TYPES OF TAF, SHAFT-TYPEENERGY DISSIPATORWe research the shaft-type energy dissipatorsirl over 200 places of Heil<strong>on</strong>gjiang, Jilin,Lia<strong>on</strong>in, Shuanxi Province and Inner M<strong>on</strong>goliaAut<strong>on</strong>omous Kegi,<strong>on</strong>. There are a lot of types,but hasic type was shown in Fig.1, t.he directi<strong>on</strong>nf water to be flow in entrance changes down tothe shaft dissipating energy to c<strong>on</strong>sune energy,the horiz<strong>on</strong>tal tunnel is lower to form as apool decaing force so that the bottom currentc<strong>on</strong>sume energy. In engineering practice, thedissipating energy.with shaft is main, sometimesB supplementary means is to set up barrier orhaffle rlecaing force for dissipating waterenergy. The shaft-type energy dissipator iswidely used in the sluice gate with fallingdifferentia, the culvert, the emissary of smallreservoir and the spillway besides.THE STUDY ON FROST HEAVE OF THE SHAFT-TYPEDISSIPATORENERGYWe made investigati<strong>on</strong>s <strong>on</strong> the shaft-typeenergy dissipator to prevent frost heave in overZOO places. From 1984 to now the experimentalstudy of the shaft-type energy dissipator wascarried OUL in Laboratory of Heil<strong>on</strong>gjiangHydraulic Training School (especial experiments<strong>on</strong> the ratio of dissipating energy and <strong>on</strong> frostheave) and the outdoor observati<strong>on</strong>s were went <strong>on</strong>in experimental field (the author took part inthe experiments and the outdoor investigati<strong>on</strong>s).A lot of scientific data was gained. The crosssecti<strong>on</strong>of shaft-type energy dissipator iscircular, and the cross-secti<strong>on</strong> of the horiz<strong>on</strong>taltunnal has complexly curvilineal shapes, such ascircular, arch, egg-shaped and "U"-shaped (WangShir<strong>on</strong>g, 1990). The horiz<strong>on</strong>tal stress, thetangential stress and the normal stress of frostwere influenced by shapes of structure, thereforethe c<strong>on</strong>crete calculati<strong>on</strong> of these stressesis complex. Because the geol.ogic c<strong>on</strong>diti<strong>on</strong> isnot the same in different regi<strong>on</strong>, so it greatlyinfluences <strong>on</strong> frost heave, therefore it isdifficult to calculate the stresses and theamount of frost heave with a united-c<strong>on</strong>stantformula. For this reas<strong>on</strong>, the calculating methodwas not detailed here. In engineering pratice,experiments of the *haft-type energy dissipatorshow that the characters of preventing frostheave are as follows:The Overall Arrannement to be Rinorous isC<strong>on</strong>venient to Prevent Frost HeaveIn comyarig<strong>on</strong> with traditi<strong>on</strong>al shaft-spillway,the open-type energy dissipator out of shaftwas superseded, the combinati<strong>on</strong> of energydissipati<strong>on</strong> of shaft with dissipating energy ofthe bottom current in tunnel was taken andl<strong>on</strong>gitudinal length was decreased. The shafttypefall-water structure has <strong>on</strong>ly a shaft withlittle cross-secti<strong>on</strong> to decay force (in Ftg.l),1262
einforcement of al<strong>on</strong>gitudinal sccti<strong>on</strong>/oriz<strong>on</strong>tal ribs of reinforcinnsteel A 1<strong>on</strong>gi;udinal ribs of \reinforcement of ahoriz<strong>on</strong>tal secti<strong>on</strong>"100Fig.1 Liuhe fall water structure of Mulan County in Heil<strong>on</strong>gjiang Provincethis shaft replaces open-type multi-pools decaingforce of multistage fall-water structure and thusthe l<strong>on</strong>gitudinal length of the fall-water structurewas reduced to half in comparis<strong>on</strong> with thetraditi<strong>on</strong>al multistage fall-water structure. Ithas many advantage, such as, the flat area islittle, the parts of structure is a few, the .frozen part and frozen area are little, theoverall arrangement is c<strong>on</strong>centrated and simple,so it is c<strong>on</strong>venient to prevent frost heave(Wang Shir<strong>on</strong>g, 1990).offset of symmetryhoriz<strong>on</strong>tal farceoffset frost force in circularlayer of frozen soilIt is AdvantaRes to Prevent Frost Heave thatthe Foundati<strong>on</strong>s are in One LevelIt is well stable and advantageorls'to preventfrost heave that the foundati<strong>on</strong> of the entranceand the outlet of the shaft-type energy dissipatorare in <strong>on</strong>e level. When the foundati<strong>on</strong>sare in <strong>on</strong>e level, the soil is uniform, the waterc<strong>on</strong>tent is the same and the amount and thestress of frost heave are uniform; It is c<strong>on</strong>venientto keep temperature with water to preventfrost heave for whole foundati<strong>on</strong> and to eliminatedamage of normal stress from the foundati<strong>on</strong>.Because the shaft and the horiz<strong>on</strong>tal tunnel areburried in soil, the frost depth is shallow andthe stress and the amount of frost heave arelittle.The Entrance of Water Adopts the Shaft toAntistress of Frost HeaveIn Fig.2, the wall of shaft is circularsymmetry to beat the force of frost heave,horiz<strong>on</strong>tal stress is equal in magnitude and isopposite in directi<strong>on</strong>, the forces' transmitedthrough the circle of shaft are equilibrated.The soil around the cylinder of shaft is instate of circular stress, the hard frozen soilwas compressed by himself and offsets the forceof frost heave. Actually the soil around thecylinder of shaft is not frozen immediately,but <strong>on</strong>e layer by <strong>on</strong>e, the first layer is frozento form frozen soil ring, it offsets the forceformed by next frozen layer.In other words, the cylindric frozen wall inevery layer offsets the force of frost heave ipnear layer, the c<strong>on</strong>crete shaft can not bedirectly damaged by frost heave.of frost force compressed by circularfrozen soil layerFip.2 Schematic drawing of the equilibrium orthe decay of frost force in shaft ci.rc2e ofshaft-type energy dissipatorThe Horiz<strong>on</strong>tal Tunnel adopts AdvantageousStructure for Offseting and DecainR Force ofFrost HeaveThe horiz<strong>on</strong>tal tunnel in the shaft-typeenergy dissipator adopts advalltagcous structurefor preventing frost heave, such as crosssecti<strong>on</strong>of circular, arch, egg-shaped and U-shaped. Fig.3 shows the arch-shaped horiz<strong>on</strong>taltunnel in the shaft-type enerRy dissipator. Inarch acti<strong>on</strong>, earth of arch way is in state tobear arch-shaped stress, the arch-shaped hardfrozen soil was compressed by each other and tooffset force formed by frozen soil. Thereforethe frost force does not directly acts the archway. Actually the frozen depth of soil aroundthe arch is not very thick, but arch soil isfrozen layer by layer, first frozen layer formedthe frozen arch wall to offset the frost forceformed by next layef. The bilateral surface ofarch is symmetry to bear horiz<strong>on</strong>tal force offrost heave, its magnitude is equal and thedirecti<strong>on</strong> is oppsite, these forces keep in1263
equilibrium through arch which has good characterof compressive resistance. The tangential forceof frost heave in a side of arch slips al<strong>on</strong>g theangularly curved surface and decays. It keepsthe temperature of foundati<strong>on</strong> with water toprevent frost and to dispel the damage of normalforce in the foundati<strong>on</strong>. A s the same, horiz<strong>on</strong>taltunnel in the shaft-type energy dissipator hasa cross-secti<strong>on</strong> circular shape, egg-shaped orU-shaped etc., all of shapes has above advantagesto keep in equilibrium of frost force or todecay frost force."-I-Fig.3 Schematic drawing of the equilibrium orthe decay of frost force in horiz<strong>on</strong>tal arch ofshaft-type energy dissipatorCONCLUSIONSIt makes known the advantages to preventfrost heave with the shaft-type energy dissipatorthrough the theoretical study and theengineering applicati<strong>on</strong> for ten years, Itsoverall arrangement is scientific rari<strong>on</strong>ality.The main part is a cylinder of shaft, and thehpriz<strong>on</strong>tal tunnel adopts thin-wall structure ofa cross-sec,ci<strong>on</strong> of circular, arch, egg-shapedor U-shaped shapes. These shapes have advantagesto bear force equilibrium. This structureec<strong>on</strong>omizes the engineering amount and itsapplicati<strong>on</strong> is safe reliability for l<strong>on</strong>g period.The style of dissipating water energy hascreative characters. The shaft to dissipateenergy is main and combines with dissipatingenergy of barrier, baffle and the bottom currentin tunnel. The vertical arrangement made upmultirepeated, synthetic c<strong>on</strong>sumed energy,although the space of dissipating energy islittle, but the effect of dissipating waterenergy is good. This type of the shaft-typeenergy dissipator has developmental future-REFERENCESWang Shir<strong>on</strong>g, .(1990) An applicati<strong>on</strong> of compositec<strong>on</strong>structi<strong>on</strong> energy dissipator to smallhydraulic engineering in seas<strong>on</strong>ally frost'4 "regi<strong>on</strong>s, (Journal of Glaciology andGsocryology.) Vo1.12, No.1.Mans Shir<strong>on</strong>g, (1990) Analysis of preventingfre'ezing property with shaft-type enerpy.dPssipator, (Journal' of Engineering apd<strong>Permafrost</strong>), 1990 No.2.Wang 'Shir<strong>on</strong>g, (1990) Developmental symmarizati<strong>on</strong>O9:th.e engineering of the fall-water, ' structuqe in China, (Society of Heil<strong>on</strong>gjiadg ',' .Hy,drdulic Training School), 1990 do.4., .,. ,1264
FIELD EXPERIMENT RESEARCH OF WATER AND HEAT TRANSFER WITHINFREEZTNG AND THAWING SILT LOAM UNDER FIXED GROUNDWATER LEVELSWang Yi, Gao Weiyue, Zhang LianghuiWater Resources, <strong>Research</strong> Institute of Inner M<strong>on</strong>golia, HuhhotJnner M<strong>on</strong>golia, 010020, ChinaIn order to research the accumulating and declining law of water c<strong>on</strong>tent within the active layer offrozen soil in the Hetao Irrigati<strong>on</strong> Area of Inner M<strong>on</strong>golia, the heat and water transfer experiments werecarried out in the site. The results show that the frozen depth is less than the depth where the groundtemperature is 'C. During freezing period, the water c<strong>on</strong>tent at the same depth changes in "S" form witha increasing time and insreases fast and slow in earlier and later periods respectively. Change Curve ofwater cantent has a obvious peak value. During thawing period, the thawing speed is from slow to fastwith decreasing groundwater levels. The dissipating curve of water c<strong>on</strong>tent is shown in opposite "S"form.INTRODUCTIONThe Hetao Irrigati<strong>on</strong> Area of Inner Mogolia is a seas<strong>on</strong>allyfrozen area. Before frqzen, the groundwater level is high and thewater c<strong>on</strong>tent is large. After the soil has thawed out, sowing cannot be d<strong>on</strong>e <strong>on</strong> time because of a large amount of water in the soil.Sa it is very important to research the water and heat transfer lawsof frozen-thawing soil under different groundwater levels for irrigati<strong>on</strong>area management and agriculture producti<strong>on</strong>.A lot of research work about water and heat transfer in freezingsoil has been made (Xu Xuezu, 199l),which mainly include theinfluences of soil texture, temperature gradient and freezing speed<strong>on</strong> water transfer, large part of the experiments were madc in laboratories.There was a little informati<strong>on</strong> <strong>on</strong> the field experiment.Pukuda (1985), Kuntss<strong>on</strong>(l985) respectively published field observati<strong>on</strong>results of frost heave under c<strong>on</strong>stant and unc<strong>on</strong>stantgroundwater levels,Gao Weiyue (1989) gave forth field observinginformati<strong>on</strong> about groundwater inflow during fretzing period.Unti1now we have not seen more detailed informati<strong>on</strong> about time andspace changes of groundwater accumulati<strong>on</strong> during thawing periodand especially about the process of water dissipating within frozensoil layer during thawing period.In order to investigate laws of water and heat transfer in theHetao Irrigati<strong>on</strong> Area during frozen-thawing period, the experimentsof water c<strong>on</strong>tent accumulati<strong>on</strong> and dissipating duringfrozen-thawing period were carried out from Nov. 1991 to Apr.1992.of 1 m2 in opening area are installed into the natural soil underthrce fixed groundwater level i.e. 1.5 m, 2.0 m and 2.5 m. The soil isput into the buckets. A layer of sand filter of 30 cm thick is put underthe bottom of the soil column. The top of the bucket is at thesame level as the natural ground surface.Table 1. Experiment soil physical propertiesDry unit Saturated Total saltGravity Grain Siz(mm)weight watcrcantent c<strong>on</strong>tent(E/ (%I (g/ IOOgsoil) >O.OOS
11 12 1 2m<strong>on</strong>thFig.1 Frozen depth O°C depth vs. elapsed timeFrom March 10, the frozen soil thaws downward from the groundsurface and upwards from the frozen soil bottom and the thawingsoil reaches together <strong>on</strong> the end of April.Soil freezingIn Fig.], the change curves of frozen depth with changing timeand the depth where the ground temperature is o "C are drawn. Atthe beginning of freezing from Nov.20 to Dec. 5, the soil surface isfrozen at night and thawed <strong>on</strong> day. So a thin frozen soil layer isformed within the surface temperature decreases steadily below 0°Cand the frozen soil layer thickens downward. This period is calledas the steady freezing period.During freezing period, the 0°C soil depth is larger than frozensoil depth. The deeper the depth is, the larger the distance betweenuem is. The reas<strong>on</strong>s are: first, the surface energy of soil grain acts<strong>on</strong> the water of' soil; sec<strong>on</strong>d with the increase of frozen depth, thegroundwater with salt flows c<strong>on</strong>tinuously towards frozen layersand the salt c<strong>on</strong>tent of unfrozen water will be c<strong>on</strong>centrated; so thebelt of more salt c<strong>on</strong>centrati<strong>on</strong> is formed in the moist belt of frozenfr<strong>on</strong>t. The salt in the c<strong>on</strong>centrated belt moves up with the unfrozenwater and at the same time moves down because of the c<strong>on</strong>centrati<strong>on</strong>gradient. The results are, with the freezing fr<strong>on</strong>t movingdownward, there are more and more salt C<strong>on</strong>centrati<strong>on</strong> at thefrozen fr<strong>on</strong>t and the frozen temperature becomes low and IowJhisis a reas<strong>on</strong> that frozen depth is gradually less than soil depth ato°C. The sec<strong>on</strong>d reas<strong>on</strong> is that the soil temperature is not the sameat different depth. The deeper the soil layer is, the higher the soiltemperature is and the smaller the temperature cbange is.Soil thawing, During thawing in spring, freezing and thawing of soil surfacetake place alternately <strong>on</strong> day and at night. Affected by NorthM<strong>on</strong>golia and Siberia cold current, there is also intermittence freesing-thawing. A unsteady thawing layer of 20-30 cm thick isformed in the soil surface. At this time, the temperature at the bottomof the frozen layer begins rising and the temperature of thewhole frozen layer is almost the same. This period is not steady.When the temperature is higher than 0°C. the frozcn soil layerthaws grasually and this period is steady. Seen in Fig.2, the thawingspeed is not the same at different water level. The thawing speed isslow at the high groundwater level. This shows that in high120 I3 4 5m<strong>on</strong>thFig.2 Thawing depth vs. elapsed time under differentgroundwater levelsgroundwater level, the water accumulati<strong>on</strong> quantity within frozenlayer is large and the ice crystal almost occupies whole soil pores; inlow groundwater level, water accumulati<strong>on</strong> quantity is less and icecrystal occupies part of soil pores. During thawing period, whengroundwater is high, the thawing water within the top of soil makesheat energy go down to frozen soil, this is called the infiltratingthaw. When the groundwater is low, thc thawing water affected bygravity seeps down al<strong>on</strong>g the pores. At the same time the thawingwater releases heat to heat the low frozcn soil and widen the waterroute.From the above experiment data, the thawing ways are not thesame at the different water levels. The way at high groundwaterlevel is that in energy transferring and the thawing speed is slow.The way at low groundwater levels is that in energy and mediumtransferring and the thawing speed is fast.Water Accumulati<strong>on</strong> within Frozen LayersAs the soil is freezing, the freezing fr<strong>on</strong>t moves downgradually. The curves of the water c<strong>on</strong>tent within different soil layersare in "S" form. At the beginning, the water c<strong>on</strong>tent increasesfast and later the water c<strong>on</strong>tent increases slowly and finally waterc<strong>on</strong>tent does not change (see Fig.3) .The water accumulati<strong>on</strong> within the soil layer has two sources.One is the water c<strong>on</strong>tent within frozcn layers moving upwards fromthe bottom with higher temperature to top of layer with lower temperature.The other is the groundwater moving from unfrozen milto frozen soil. At the bcginning of the freezing, the groundwatermoves from the unfrozen layer to the frozen layer. The water routeswithin tho soil are unblocked. With the freezing time increasing, thefreezing fr<strong>on</strong>t moves downward a ccrtain distance, at frozen layer,wafer routes are blocked gradually by ice crystal. The groundwatermoves to frozen layer less and less. Therefore, at thepeginning, thewater c<strong>on</strong>tent accumulati<strong>on</strong> mainly depends <strong>on</strong> the groundwatertransfer. The speed of water accumulati<strong>on</strong> is fast. Later, tht waterc<strong>on</strong>tent transfer mainly depends <strong>on</strong> unfrozen water within the soil.The water c<strong>on</strong>tent rises from the low layer with high temperature totop layer with low tempcraturc and the speed is slow. Thus the "s"shape of water arsumulati<strong>on</strong> within frozen soil is formed.Fig.4 is the secti<strong>on</strong>s of moisture c<strong>on</strong>tent at different time anddifferent water levels. In Fig.4, the water c<strong>on</strong>tent accumulati<strong>on</strong>within frozen layers has obviously peak value. With pushing down,1266
3630 -I "I 1.5m1 1 - 1 I 1c1 1 1 2 1 2 3 4 5m<strong>on</strong>thFig.3 Water c<strong>on</strong>tent given layen VI, elapsed time during freesing and thaftiiiu20 30O h . . .Water c<strong>on</strong>tent (%)20 30. . .Nov.20-20 30plained as follows: The thawing water within thawing layer (layera) transmib heat to low frozen (layer b).The result is that layer bthaws.lcc within layer b transform into wa~r.The.layer volume decreases nine perccnt and vacuum is formad (Wang Jiacheng, 1992).Because of the vacuum soak, surplus water c<strong>on</strong>tent within layer amoves downward to layer b. Later, tha frozen-thawing border surfaceshifts down.Thc water c<strong>on</strong>tent dissipating within layer + d&pcnds <strong>on</strong> yporizatioq and gravity mpaga.From a,bve.it can beStcn at the beginning of thaw, tha water shifting maydepends <strong>on</strong>vacuum soak and the aped io fast; Later* the thawing water shiftingmainly dewnds <strong>on</strong> vaporizati<strong>on</strong> and gravity -age and thesped is slow,,The moisture c<strong>on</strong>tent secti<strong>on</strong>s at different water levels anddate are drawn' in Eig.5, As can be seen,. the water c<strong>on</strong>tmt dissipatingam not the same at the different-water lqveb, When thegroundwater level is 1.5 m, the water c<strong>on</strong>tent within lower frozensoil layer does not change obviously and the groundwater leveldose not rim obviously. When the groundwater level is 2 .h and2.5m,from the thaw beginnin& the groundwater rises and water08 11020 30water c<strong>on</strong>tent (%)20 30 20 3040-80 * Y120 [ISrnIJm.102.0m2.5m1 20Fig5 Water c<strong>on</strong>tent profiles under dflerent groundwater levelsduring thawingFig.4 Water c<strong>on</strong>tent profiles under different grounwater levelsduring frwzingthe peak value increases and the peak value locati<strong>on</strong> shifts down.The peak value gets tht biggest valua when the frozen period ends.The locati<strong>on</strong> of the biggest moisture c<strong>on</strong>tent is not the same atdifferent water levels. When the groundwater level is low, the locati<strong>on</strong>of the biggest value moves down and the value becomes small.This is the result affected by seas<strong>on</strong>al frozen depth and originalmoisture c<strong>on</strong>tent.Water C<strong>on</strong>tent Dissipating whthin Thawing LayerWhen the daily average temperature rises above 0°C. theground surface and the bottom of the frozcn layer begin tothaw.The water c<strong>on</strong>tent within thawing layers dissipatinggradually.In Fig.3,the curve of thawing water disspating with thetime at different layer are ahawn in roveme 'S'. This can be ex-wntent within lower frozen soil 1aycr.dscmase. Thia shaws that thesurplus thawing water dissipating at high groundwater level mainlydepends <strong>on</strong> the vaporizati<strong>on</strong>. When the groundwater level is lowthe dissipating of the thawing water mainly depends <strong>on</strong> thevaporizati<strong>on</strong> and soak.That is ,when the groundwater level is high,the form of the thawing is in energy transmitting;whcn the level islow, the form of the thawing is in mcnrgy and medium transmitting.CONCLUSIONThe temperature decrease$ al<strong>on</strong>g the soil depth and the saltc<strong>on</strong>centrati<strong>on</strong> at the freezing fr<strong>on</strong>t make the frozen depth be smallerthan the depth where the soil temperature is 0"C.The deeper thelayer is ,the l<strong>on</strong>ger two distance is.The thawing speeds are not the same at different groundwater1267
levels. When the groundwater level is high, the form of the thawingis in energy transmitting and'the speed is dow. When the water levdIs deep, the' form of the thawing is in energy and medium transmitting'andthe speed is fast.Duriirg Freezing period, the curve of the water c<strong>on</strong>tent withineach frozen layers is in-%" shape. kt the early period, tne water ac-&mulati<strong>on</strong> mainly depends <strong>on</strong> outside water source and increasefast.Later it depends ori inside unfrozcn water and increase sbw.The cWe of w&er cbntent al<strong>on</strong>g'the different depths,has the obviouspeak 'Viluc The deupcr the water level is, the biaet the peak, .value is and the locati<strong>on</strong> of the peak value shift down.The dissipating curve of the water c<strong>on</strong>tent within thawing lay-'crs is in reverse %' shape. At the curly period. the dissipating mainlydepends <strong>on</strong> the vaduum soak and swd'is fast. Later, it depends<strong>on</strong> vaporizati<strong>on</strong> and gravity seepage and speed is slow.REFERENCESFukuda,M. and Nakagawa,S.(1985) Numerical Analysis of FrostHeaving Based <strong>on</strong> The Coupled Heat and Water Flow Model,hoc. of 4th Interdl. Sympo.<strong>on</strong> Ground Freczing.71-75Gao Weiyue and et al. (1989) The Observing of Groundwater Inflowduring Freczing Period, Journal of Glaciology andGeocryology,,Vol.l4, NO.^,^ 137.Knutss<strong>on</strong>,S., et al, (1985) Andy;& of Large Scale Laboratory andin,&itu, Frost Heave Testh, Proc.of 4th Internl Sympo. <strong>on</strong>Groud Freezipg, 65-70.Wang Jiacheng and et ai. (1992) Experimental Study <strong>on</strong> C<strong>on</strong>diti<strong>on</strong>sfor Ice Formati<strong>on</strong> of Saturated Sand in Freezing and ThawingCyclcs, Journal of Glaciology and Gcocryology, Vo1.14,N0.2..k01-106.Xu Xuezu and et al. (1991) Experiment Rekarch of Water TransferWithin Frozen Soil, Science Publicati<strong>on</strong> House, Beijng. '1268
THE EFFECTS OF GOLD MINING ON THE PERMAFROST ENVIRONMENT,WUMA MINING AREA, INNER MONGOLTA OF CHINAWang Yingxue R T<strong>on</strong>g BoliangLanzhou Institute of Glaciology & Geocryology,Chinese Academy of Sciences, Lanzhou, ChinaIt is found that mining is the main factor which caused the changes of the, permafrost envir<strong>on</strong>ment. After mining, the area of forest ,decreased, the soillayer was reversed and the fertility decreaded, the ground surface and groundtemperature and water c<strong>on</strong>tent in the soil layer decreased, all of which resultedin the increase of the seas<strong>on</strong>ally thaw depth, the deteriorati<strong>on</strong> of permafrost,the disappearance of swamp and a tendency of aridness and desertificati<strong>on</strong>, andfinally affected the ecosystem and caused the vegetati<strong>on</strong> to be in an inversi<strong>on</strong> ,successi<strong>on</strong>. We suggest that the mining and envir<strong>on</strong>menfal administrati<strong>on</strong> mustbe c<strong>on</strong>si'dered at the same time and propose some suggesti<strong>on</strong>s "abdut recovery andadministrati<strong>on</strong> of the envir<strong>on</strong>ment after mining.INTRODUCTIONWuma mining area is situated an the northwestslope of Da Hinggan Ling dominated bypermafrost. Topography of the regi<strong>on</strong> is mainlylow ridges wit.h an altitude of about 450,111 anda relative undulati<strong>on</strong> of 200-400 m. The miningarea is lorated between the Yilijiqi Rivervalley, which is <strong>on</strong>e branch of the Eerguna River,and Lajigan valley. The width of the valley is100 m to 800 m. In the lower terraces and lowlyingland there is seas<strong>on</strong>al running water andthe regi<strong>on</strong> is heavily swampy. The minlng sitehad been mined and the veRetati<strong>on</strong> has beendestroyed. Today, the site is prevalent withsuccessi<strong>on</strong>al forest which are scattered in thevirgin forest. The vegetati<strong>on</strong> is mainly Pumila,'Betula dehuricaea, Salix hypoda and Populus 'devidiana etc. Except for some sand dunes andbore-holes, the ground is covered by forest andherbace,ous whose canopy density is 60-909.Eriophorum vaRinatum and Carex are exuberant inmarsh-land. The depth of Carex layer is 0.1-0.3m.Because of its high latitude locati<strong>on</strong> and thehigh barometric influences of Siberia andM<strong>on</strong>golia, the mining regi<strong>on</strong> is the coldest in.China. From the correlati<strong>on</strong> analysis of 10years of informati<strong>on</strong> (1977-1988) of EerRunayouqimeteorological stati<strong>on</strong> and the observed informati<strong>on</strong>in Wuma mining area in warm seas<strong>on</strong>s, themean annual air temperature in Wuma mining areais -4,4'C, and the coldest temperature is -46.2-C.The frozen period is about seven m<strong>on</strong>ths and thethaw index is 1829.3 ('C.d). The total radiaiti<strong>on</strong> in warm,seas<strong>on</strong> (May-Sept.) ,is '<strong>on</strong>ly 59.7- \67.4 kcal/cm . The annual precipitati<strong>on</strong> is400-500 mm am<strong>on</strong>g which 70-907 of it is fromJune to September. The depth of snow cover isabout 20 cm.,The regi<strong>on</strong> bel<strong>on</strong>gs to a fault-block valley ofMesozoic age. Granite of the Haixi period formsthe bedrock and appears <strong>on</strong> the tops of the ridges(CUO D<strong>on</strong>gxin, 1981). Quaternary desposits arewidely distributed. The depth of the unc<strong>on</strong>solidatedlayer of Quaternary sediments is 4-9 m.The lithology of them is mainly humm'soil qndsandy clay. In the valley, the upper 0.9 m isblack and grey humus soil and peat,, the lowerpart is greyish-yellow sandy clay, gravel-sandand weathering layer (Figel).From the informati<strong>on</strong> of physical prospectingin this regi<strong>on</strong> and the informati<strong>on</strong> of theadjacent regi<strong>on</strong>s of Gulian (Guo D<strong>on</strong>gxin. 1981)and Eluosi which ha,ve the same latitude 0: the0.0-0.3 m: Humus layer including little-0.7-1.2 m: Sandy soil layer with 50-60%clay 30-40% sand. It appears yellowishdrey,1.0-2,5 m: Sand-gravel layer with 55-65%gravel, 30-40% sand and 7-10% clay. Itso appears yellowish grey. The diameter-isfrom 0.25-10 cm. Roundness ig good.\There is thick ice layer with thicknessof 0.5-1.8 m under the depth of 1.8 m.2.5-4 m: Weathering layer with 80-90%4 *Aboelastic rock, 10-15% sand and 5% clay+,!+ +at depth of 0.3-1.5 m. It is mass$. c<strong>on</strong>structure -with rich ice.-+++++Bedrock: Granite with rich crevas,se.+\It is frozen.Fig.1 The Bar-graph of Lithologic Characteristicsin Wuma mining Areastudy area, we estimated that the depth of permafrostin this regi<strong>on</strong> is 50-80 m. The maximum1269
L C L " 0llllY-l -lUyrr.c"u= IJ -&." I.> b. &,ICobserved temperature at a depth of 2.5 m is -3.0and 0.8"C in swamp and n<strong>on</strong>-swamp sites respectively.The seas<strong>on</strong>al thaw depth is 0.3-0.9 mand 0.5-1.0 m in the eastern footslope and swamprespectively, which is the minimum in the regi<strong>on</strong>,0.8-1.0 m in the fr<strong>on</strong>t of the diluvial fan, 1,2-2.0 m in the,eastern slope and 2.5-3.5 m in thewestern slope. Eastern and western slopes arerespectively 1.2-2.0 m and 2.5-3.5 m.123456I80.4 lunI.W ~ L ~ : I cullccliL, n~uuuu UIIU 81uunu sul~act. remperaturesin different geographical positi<strong>on</strong>sin stripped and un-stripped sites. The resultsare as following.(1) After trees, herbaceous and bryophtacovers are stripped, a lot of water appears <strong>on</strong>the ground surface. One year after the stripping,water c<strong>on</strong>tent in the frozsn layer reducedabruptly in comparis<strong>on</strong> with the un-stripped site(Fig.3). The water c<strong>on</strong>tents of humus and peatdecreased 50% and the c<strong>on</strong>tent of sand-loamdecreased 30-4OX. The main reas<strong>on</strong> is that thearound accepts a large amount of radiati<strong>on</strong>directly. In the stripped site, the radiati<strong>on</strong>intensity increased more than 100 times incomparis<strong>on</strong> with natural sites <strong>on</strong>ly in the mosscovered site and n<strong>on</strong>-moss covered site, thedifference of temperature at the depth of 20 cmis 11-15'C (The Branch of Siberia Institute of<strong>Permafrost</strong>, Russian Academy of Sciences, 1988).Relative wntcr coirtcnt (%)200Fig.2 The Distributi<strong>on</strong> of the Maximum Seas<strong>on</strong>alThaw Depth in Wuma Mining Area, ChineseM<strong>on</strong>golia1 - River talik; 2 - Swamp (0.5-1.0 m);3 - Alluvial flat (1.3-9.0 m);4 - Western'footslope (1.3-0.9 m);5 - Eastern footslope (0.3-0.9 m);h - Fr<strong>on</strong>t of diluvial fan (0.8-1.0 m);7 - Middle parr. of eastern slope (2.5-3.5rn);8 - Middle part eastern slope (1.2-2.0 rn).Thick layered ground ice is well-developed inWuma Mining area. In swamp, the thickness ofground ice is 0.3-0.5 m within the depth of 0.5-1.0 m. In 'same secti<strong>on</strong>. there is massive groundice whose thickness is between 0.5 and 0.8 m andthe length is more than 100 meters stretchedal<strong>on</strong>g the valley of the regi<strong>on</strong> at the depth of1.8 m under the first terrace of the westernbank of Yilijiqi River from a mining crosssecti<strong>on</strong> of the western side of Wuma mining area.In the Ice there are thin clay layers betweenpure ice lavers which form a layered structure.From the aband<strong>on</strong>ed pits ground ice is also foundwh.ich appears to be pingoes with diameters ofabout 2-4 m.THE EFFECTS OF MINING OR 'THE PERMAFROSTENVIRONMENTWuma mining area is about 300 m wide and20300 m l<strong>on</strong>g. Around the area there are nineother mining areas. All of them are stripmining.mechanized mining has destroyed largeamount of vegetati<strong>on</strong> and the layer of soil.The mining includes two periods of prestrippingand mine-choosing. The pre-strippingmeans to strip forest, the layer of herbaceousplants. bryophyta, humus and peat before thenext years' mining. In the process of layer-to-Fig.3 The comparis<strong>on</strong> of water' c<strong>on</strong>tent of frozenRround in pre-strippedFrom the observed informati<strong>on</strong> of stripped andun-stripped sites during July (<strong>on</strong>e year afterthe stripping) and un-stripped sites in Wumamining area. to August of 1990 (Table l), wefound that <strong>on</strong>e Year after the stripping, theair temperature, ground surface and groundtemperatures and daily ground surface temperatureranges in stripped sites have increasedobviously in c<strong>on</strong>trast with un-stripped sites.It is evident that the veRetati<strong>on</strong> and peathave a str<strong>on</strong>g protecti<strong>on</strong> effect <strong>on</strong> the permafrost.When they are removed, the layer of sand-gravelis exposed and has a higher temperature,simutaneously, the water <strong>on</strong> the ground surfaceand in soil and the water from the thawed groundice dischatge easily, which had made soil drierand swamp disappear.(2) Thar depth increased after the vegetati<strong>on</strong>cover was removed. The c<strong>on</strong>trast observati<strong>on</strong>between stripped and un-stripped sites indicatesthat the thaw-depth in stripped sites is 2-3times more than un-s'tripped sites <strong>on</strong>e yearafter the stripping (Fig.4). This is caused bythe decrease of water c<strong>on</strong>tent in soil and heatused for evaporati<strong>on</strong>, and the disappearance ofswamp.(3) Envir<strong>on</strong>mental changes after mining.Before mining,.tM forest in mining sites must1270
Table 1. The c<strong>on</strong>trast of temperature between strippedand un-Stripped sites in 1990 ('C)SiteMrrnthDaily air Daily ground Daily ranges of Ground temp.temp. surf. temp. ground surf. temp. depth of 2.5 mun- 7 16.4 15.9stripped 8 14.6 14.6Stripped 7 17.68 15.222.318.318.08.729.218.3-3-2.4-0.8-0.6may be never recovered or recvoered for a veryl<strong>on</strong>g time.Time (m<strong>on</strong>th) As permafrost and vegetati<strong>on</strong> each dependother in permafrost regi<strong>on</strong>s, the vegetati<strong>on</strong>4 5 6 7 8 9 10 1112recovery is very slow in permafrost regi<strong>on</strong>s,which affect the steady state of permafrost. But1 1 1 1the destructi<strong>on</strong> of vegetati<strong>on</strong> is <strong>on</strong>e of the mainfactors to cause the changes of envir<strong>on</strong>ment.Because of severe destructi<strong>on</strong> to the envir<strong>on</strong>mentin the'process of mining we must take somemeasures to decrease the degree of destructi<strong>on</strong>.We suggest that, first, we must do our best toreduce the destructi<strong>on</strong> of ground surface and150 -natural landscape: sec<strong>on</strong>d, rati<strong>on</strong>ally despositthe used ore body and reduce its cover in the200-natural surface; third, pre-store the organicsoil layer and replace the layer after mining;fourth, plant trees <strong>on</strong> the mining sites aftermining.Fig.4 The comparis<strong>on</strong> of thaw depth between, .stripped and un-stripped sites <strong>on</strong>e year afterREFERENCESthe stripping in Wuma mining areaGu D<strong>on</strong>Rxin and WanR Shaoling, (1961) Divisi<strong>on</strong> of,be cut or buried, but the forest around the<strong>Permafrost</strong> Regi<strong>on</strong>s in Da-Hinggan Lingmining sites was destroyed differently* In theNortheast of China (in Chinese). Journal ofmain mining sites forest was destroyed complete-Glaciology and Geocryology, 3(3), p.1-9.ly, all of this made of forest destroyed The Branch of Siberian Institute of <strong>Permafrost</strong>,Russian Academy of Sciences, (1988), Generalaround the river valley area.Geocryology, p.280-283, (in Russian).(4) VeRetati<strong>on</strong> succeedsslowlv. Owing to thedestructi<strong>on</strong> of vegetati<strong>on</strong> and sbil laye;, the.envir<strong>on</strong>ment has changed greatly. In some placesforest has been destroyed forever or has beenmade to be in a reversed successi<strong>on</strong>. No vegetati<strong>on</strong>is in the main mining sites two years aftermining. Only in both sides adjacent to the mainmining sites is there greeh moss and somepatches of grass growing there.The gold mining history in the regi<strong>on</strong> can bedivided into two periods. the first is from Mingand Qin Dynasty to the beginning of the 1940's.The sec<strong>on</strong>d is from 1988 to present. There is80 years between the two periods. From fieldinvestigati<strong>on</strong> the destroyed forest in the firstperiod has not recovered completely c<strong>on</strong>sideringthat mining in the first period was manual andore deposit came from boreholes, the destructi<strong>on</strong>of vegetati<strong>on</strong> is mainly man-made. Thus, thevegetati<strong>on</strong> is in the process of recovering. Thepine recovery is slow, but the birch is rapid.The difference between virgin forest andsuccessi<strong>on</strong>al forest is obvious. The diameterof virgin forest Is 40-60 cm, but the succeesi<strong>on</strong>alforest is 10-20 cm. The area of aband<strong>on</strong>edboreholes is now mostly occupied by flats andsand dunes, <strong>on</strong>ly very sparse vegetati<strong>on</strong> hasgrown there. It is evident that when the vegetati<strong>on</strong>is destroyed, the recovery is very slow.It needs more than 100 years for the successi<strong>on</strong>to reach its climax. But the modern miningtechnology destroyed veRetati<strong>on</strong> severely which' 1271
~ .RECENT DISCOVRRY OF PERIGLACIAL PHENOMENA ONTU WE1 BA SHAN (BROKEN TAIL WILL) IN ZWALAINOERJNNER MONGOLIAWang Zhenyi’ and Lin Yipu2‘Department of Geology and Surveying Zhalainoer Administrati<strong>on</strong>of the Ministry of Power Industry of P.R.C. in China21nstituti<strong>on</strong> of Pale<strong>on</strong>tology and Paleoanthropology of Academia Sinica, Beijing,ChinaSince 1957,two terms -“WAN0 SHAN Solifeucti<strong>on</strong>“ and “ZHALAINOER Soliflucti<strong>on</strong>” were coinedand their tentative age corresp<strong>on</strong>ding to “Riss“ and “Wurm” subglacial in Europe rcspectly by Prof. PeiWenchung, being discussed c<strong>on</strong>tinually by scholars who intercstcd in p~riplncial phcnbmena.This paperdeals with a new Kind of soliflucti<strong>on</strong> showing <strong>on</strong> broken tail hill which nwy be comparable to that of”WANG SHAN Soliflucti<strong>on</strong>”. Beside, damage caused by freeze are to be rcported.IIIINTRODUCTIONSoliflucti<strong>on</strong> (literlly “soil flow”), a term first proposed by J. G.Anderss<strong>on</strong>(l906) while studying pcriglacial phenomema <strong>on</strong> Bear Is-land, is definitely <strong>on</strong>e of the most significant processes of soilmovement in periglacial areas,Zhalainocr,(N.49’20’, E.117’35’) is <strong>on</strong>e of the famousperiglacial areas in China. Since 1957, two terms --WANG SHANSoliflucti<strong>on</strong> and ZHALAINOER Soliflucti<strong>on</strong> were coined and theirtentative age, the former corresp<strong>on</strong>ding to Riss the latter corre.’ sp<strong>on</strong>ding to Wurm by Prof. Pei Wenchung while studying thepxiglacial phenomena in Zhalfinoer, Manchouli, Inner M<strong>on</strong>golia.The agc of WANG SHAN Soliflucti<strong>on</strong> is <strong>on</strong>e of the debateingfocus am<strong>on</strong>g scholars who interest in studying the periglacialphenomena in Zhalainoer , The former author (Wang) discoveredrecently a soliflucti<strong>on</strong> <strong>on</strong> TU WET HA SHAN (Broken Tail Hill),itmay be comparable to that of WANG SHAN Soliflucti<strong>on</strong>. therefore,the authors wish to report the new find, and discuss its ape.Broken Tail Hill(Tu Wei Ba Shan in Chinese) is a littee solitaryprom<strong>on</strong>tory situating <strong>on</strong>to East-North of Zhalainoer stati<strong>on</strong>, beingnot far away from the open-pit of Ling Chuan coal mine inZhalainoer, a well-studicd locus studying WANG SHANSoliflucti<strong>on</strong> and ZhALATNOER Soliflucti<strong>on</strong>.A few years ago, a program of paving tube across throughtthat Hill was carried out, in the course of digging a series of outcropswere revcaled,and some fossil b<strong>on</strong>es were collected by theworkes.The former author Wang, as a senior engineer, went to thespot investigating after he heard without hesitate.GEOLOGICAL COLUMN OF-qROK~-N.T~IL-H~LI~The Visible Layers seen”-The visible layers from the outcrops of the secti<strong>on</strong>s <strong>on</strong> brokentail hill nre as fblliwlngs, fr<strong>on</strong>t !op to bottom:1) The layer of silt-sands thlckncssl-2 MThere were scveral f‘os~~l skulls of Ros primlpcntui .IndCoelod<strong>on</strong>ta . . antiqitatisuncarth~J from thc lowcr portlcns ,>I. ihlslayer.2) The Inycr of involuted struclliresthickness 2-3 MInvoluti<strong>on</strong>s (cryoturbatl<strong>on</strong>s, Ger. Tanchenboden) arc majorperiglacial features of periglacial phenomena, thcv are characterizedby lkdding distorti<strong>on</strong> and interpcnetrati<strong>on</strong> of different layers.It may be explaned as resulting from thc squee71ng ol moist, plasticlayers between rigid parts of soil. Refore 1957. both geologists andfreshmen saw the involuti<strong>on</strong>s already, but could say no morc than”I d<strong>on</strong>dt known”. Instead. Prof. pei came here and saw them. hewas excited by reminiscenting of the. involuti<strong>on</strong>s which he saw previouslywhen he was studing the periglacial phcnornena In French.“It seems to me that I meet an acqualntancc again, cerr:linly, hemust be called Solilluctl<strong>on</strong>.Fs:lid Prof. PCI.3)The Layer of Gravels [hicknew unknownThis gravels may be thc remains (01 wdtrnents 01 :Inctcnt river.4)The white sands-st<strong>on</strong>e layerIhickness unknownT)ISCUSSION OF THE SOI.,IFI.CCTTONAs visualized catographically by K.Kaiser, cryoturbati<strong>on</strong>s(involuti<strong>on</strong>) are widesprcad in the pcriglacial areas,particularly inSlberia. Zhalainoer situates in the pcrmd‘rost arca Of easternM<strong>on</strong>golian Plain being in the neighhourhood of East Stheria, it isnot strange that cryoturbati<strong>on</strong>s alwaks occur, the questi<strong>on</strong> arisethat what’s agc of WANG SHAN Soliflucti<strong>on</strong>? and what’s the ageof the new find of Soliflucti<strong>on</strong> <strong>on</strong> broken tail hill?are they bdth in1272
the same subglacial stage?"YES, They are both of Wurm subglacia! stage". After studing.The authors give such answer.The age of WANG SHAN Soliflucti<strong>on</strong> was to bepresumptively Riss subglacial stage, it is under the circumstancewithout any C-14 dating; However, up to present, there are twoC-14 daings particularly for.WANG SHAN Soliflucti<strong>on</strong>:1) 28,900 1,300 years before present(PV-I 72); and2) 33,760 1,700 years before present (PV-170).Hence, the authors answer that both WANG SHAN and TU WE1BA SHAN Soliflucti<strong>on</strong>s are of Wurm subglacial stagc.For years, the authors studied WANG SHAN Solifluati<strong>on</strong>thoroughly, in the Upper Pleistocene ~cological column, from topto boffom, there are 8 dating for it, they arc:1) 3,080* 80 (PV-201) ....... 540 M2) 5.2702 80 (PV-167) ....... > 540 M3) 6,710 4 200 (F'V-ZK-825) ..... 3 540 M4) 7,070k 200 (PV-166) ....... > 540 M5) 11,460 f 230(PV-15) ...... 535-536 M6) 11,600f130(PV-171) ,7) 28,900k 1,300 (PV-172)...... 538 M8) 33,760k 1,700 (PV-170) ...... 538 MThis is the standard secti<strong>on</strong> seen in the openpit of Ling Chuancoal mine. Both WANG SHAN and TU WE1 BA SHANSoliflucti<strong>on</strong> might be comparable to that of the Soliflucti<strong>on</strong> occurcsin the level above sea water 538 M , therefore , their ages arc of:28,900 k 1,300 years before present.REFERENSELTage Nilssov (1982) , The Pleistocene Geoligy and Life in theQuaternary Ice Age: PP:45-48.1273
UNIAXIAL STRESS RELAXATION OF FROZEN LOESSWu Ziwang, Ma Wei, Chang Xiaoxiao and Sheng Zh<strong>on</strong>gyanState-Key Lsboratory of Frozen Soil Engineering, Lanzhou Institute of Glaciology *":and Geocryology, Chinese Academy of Sciences, ChinaThis paper analyses and discusses the relaxati<strong>on</strong> law and affect factors of loessunder c<strong>on</strong>stant strain c<strong>on</strong>diti<strong>on</strong>s. It was found that the larger the inital stress, or higher temperature was, the str<strong>on</strong>ger the stress relaxati<strong>on</strong> was'. Its relaxati<strong>on</strong>equati<strong>on</strong> is:u(t) A(B)E:(t + l)-'Meanwhile, this paper intrdduces a new method of determining viscose coefficie,nttl of frozen soil: 0-Tr.G.INTRODUCTIONSince ice and unfrozen water are present infrozen soil the frozen soils have very obviousrheological behavior. under loading, in thistype of soil there will simultaneously takeplace deformati<strong>on</strong> (creep), stress weakness(relaxatiqn) and strength reducti<strong>on</strong> (Thritovize,1985). The strength red.ucti<strong>on</strong> is due to theproducti<strong>on</strong> of the rheological process of stressrelaxati<strong>on</strong> in frozen soil. So the importantfactors affecting the strength of frozen soilare re-directi<strong>on</strong> of mineral grains and ice andstress relaxati<strong>on</strong>. In view of this problem, alarge amount of tests were d<strong>on</strong>e. This paperdiscusses and analyzes the studied results ofstress relaxati<strong>on</strong> of frozen loess under anuniaxial stress state.SAMPLES AND THEIR PREPARATIONIn the Lanzhou loess sample the size was lOlx200 mm; the water c<strong>on</strong>tent was 14-15?; the dryunit weight was 1.72-1.78 g/cm'; the test temperatureswere -2, -5, and -1O"C, and its precisi<strong>on</strong>was 0.1'C. All of the tests were d<strong>on</strong>e <strong>on</strong> aMTS-810 Vibrati<strong>on</strong>al Tri-axial ExperimentalMechine. The basic physical parameters are shownTable 1:EXPERIMENTAL RSSULTS AND ANALYSES1. Relati<strong>on</strong> of Sttess-StrainThrough tests, the curves of instantaneousstress-strain were obtained under differenttemperatures (Fig.1). From Fig.1, we can knowinstantaneous strength and failure strain offrozen loess under dirferent temperatures(Table 2).Fig.1 Stress-strain curves of frozen loessTable 1. Physical parameters of samp,leSoilnameCompositi<strong>on</strong> of grain size ( X ) Liquid PlasticGravity limit limit>0.1 0.1-9.05 0.05-0.005
Table 2. 1nst.nntuncous comprPssivc strengt.hand failure strainTernperaturc("C)-2 -5 -7 - 106o Iof (Mpa) 2.914 5.770 7.727 8.003Ef ( X ) 6.32 9.18 11.5 8.63"Load rate was 12.5 MPaImin, Failurc time1 min.was2. Rclaxatinn LowThrough tes1.s. wc obtainerl thc relaxaliorrcurves shown in Fig.2. From the I.u'~ downwards,the c<strong>on</strong>stant strain of eac.h curve is rcspcctive-I y 7X, &X, and 3X. It is seen that relaxaI.ior1yruccss obviously hos two stsgrs: the str<strong>on</strong>grelaxrrti<strong>on</strong> stage anrl thc slow relaxati<strong>on</strong> stage.The first. stage is the main relaxati<strong>on</strong> stogc,it is about 30-407, of t.he initial value orhigher, and t.his process generally is comp1et.etiwithin 1-2 hr.50 r40 U60r30E, = 5%Fig.2 Relaxati<strong>on</strong> curves of frozen locss ( - 5 O C )From Fig.2. .it is seen that difftrcnt c<strong>on</strong>stantstrains are clqsely related to the c~~rresp<strong>on</strong>dihginiLial stress. The init.iaL stress increaseswith an increase of c<strong>on</strong>stant strain. With aninc.rease of c<strong>on</strong>stant. strain, the initinl stresswill be close to the instantaneous strength, andthe stress relaxati<strong>on</strong> will bet-orne str<strong>on</strong>g. Wedefine the relaxati<strong>on</strong> degree S as:'tWhere Uo is initial stress; Om is strrblc stress:Of is instantaneous strength. Fig.3 are t,hccurves of S VS. initial strain E,. This relati<strong>on</strong>can be described by eq.(2):1S A€: t B (7-1Where A~2.174, R=-0.6029.0.5 13. Effect of Temperature <strong>on</strong> Stress Relaxati<strong>on</strong> of- Frozen SoilWe know that the lower the temperature offrozen soil, the bigger its strength is. Our-e ("C)relaxati<strong>on</strong> tests also reflect this phenomen 011(shown in Fig.4 and Fi.g.5). Both initial stressand relaxati<strong>on</strong> stress increase gradually with adecrease of temperature. Fig.5 The relati<strong>on</strong> bctween t.emper:>tur'ristress and1275
- s100-80 -60 -m 40-20 -greater Tr value, the more materials approach asolid state.From eq.(5), we may obtain:So, through Fiy.7, we may determined Tr value ofour tests.1 , . . . . 10 2 4 6 8 1 0 1 2-0 ( OC )Fig.6 The relati<strong>on</strong> between relaxati<strong>on</strong> degreeand temperatureThrou'gh synthesizing the above-menti<strong>on</strong>edproblems, we. may obtain the following equati<strong>on</strong>of stress relaxati<strong>on</strong>:a(t) = A(O)E! (t+l)-c (3)Where O(t) is stress at an arbitrary time (MPa);c0 is c<strong>on</strong>stant strain: t is time (hr.): 0 istemperature; m and < are test paramctcrs, m=0.46,
CONCLUSIONS1) Under the same c<strong>on</strong>diti<strong>on</strong>, the bigger thec<strong>on</strong>stant strain or the higher the temperature,the str<strong>on</strong>ger the stress relaxati<strong>on</strong> of frozensail.. 2) The relaxati<strong>on</strong> law of frozen loess can bedosc,ri'bed by the following equati<strong>on</strong>:U(t) = A(e)E!(tt I.)-'3) Once we know the shearing modulus offrozen soil, it is easy to obtain its viscosityfactor from relaxati<strong>on</strong> tests..REFERENCESThritovize, H.A., (1985) Mechanics of frozensoil, Publishing House of Sciences, pp.127-135.Vyalov, C.C., (1987) The rheologic principle ofsoil mechanics, Publishing House of Sciences,pp.130-137.1277
APPLICATIONS OF DATA BASE TECHNOLOGY IN FROZEN SOIL RESEARCHXia ZhiyingLanzhou Institute of Glaciology and Geocryology,Chinese Academy of Sciences, Lanzhou 730000,China'The paper analyzes in .detail the features of the permafrost data, staRes themethodes of how to process them, and classifies the data into several types.Furthermore, the data was handled according to the theory of standardizati<strong>on</strong> andtheory of a relati<strong>on</strong>al data base, and developed a data base system suitable forthe characters of permafrost data and practical applicati<strong>on</strong>. The system ismainly composed of the following three parts. The first is informati<strong>on</strong> acquisiti<strong>on</strong>and systematic design of the data base system, the sec<strong>on</strong>d i s retrieval ofdata, the thitd is output of informati<strong>on</strong> and its technical utilities. Testsshow that the system is very effective for registering, management and technicalmanipulati<strong>on</strong>. Therefore it yosscsses important practical values.1. INTROD,UCTIONData base technology which c<strong>on</strong>cerns datasharing is an important branch of computersciences and is the core of informati<strong>on</strong> systems,its applicati<strong>on</strong> has expanded in geoscienceresearch in recent years in 1983, a c<strong>on</strong>ference<strong>on</strong> geographic informati<strong>on</strong> systems was held bythe geoscience department of the Chinese Academyof Sciences and the developing centre of geographicinformati<strong>on</strong> systems was established so<strong>on</strong>afterwards. In 1988, the glaciology and geocryologydata base centre (WDC-D) was set up inChina by the organizati<strong>on</strong> of World data BaseCentre (WDC) and the works of data standardlzati<strong>on</strong>and system development were graduallycarried out, Rased <strong>on</strong> the research d<strong>on</strong>e by theauthor in recent years <strong>on</strong> data arrangement,evaluati<strong>on</strong> and standardizing, especially for thedata or materials collected al<strong>on</strong>g the Qinghai-Xizang highway, the author provides a method forestablishing the data base applicati<strong>on</strong> system ofpermafrost envir<strong>on</strong>ment and forecast of Qinghai-Xizang Plateau. This paper discusses someproblems related to establishing a frozen soildata base, and it is possible for the data baseto cover gradually aXI the permafrost regi<strong>on</strong>sin China, The model development methods (PanJinping, 1985,) and principles are adopted in thesystem development according to different softwaredeveloping periods to establishan informa-Lioo system of permafrost envir<strong>on</strong>ments andforecast with completed functi<strong>on</strong>s and perfectproperties.2. THE RESEARCH,CONTENTS OF GEOCBYOLOGY AND ITSPRESENT DATA MANAGEMENTThe requirement analysis for any softwarebefore d.eveloped is of important meaning, so itis necessary to discuss the research c<strong>on</strong>tents,data types and the applicable management of dataand so <strong>on</strong>.Geocryology is both an independent disciplineand an inter-discipline science. It studies thecryosphere, its spacial and temporal development,its relati<strong>on</strong>ship with the lithosphere, hydrosphereand human ec<strong>on</strong>omic activities stc.Geocryology emphasizes the freeze-thawprocesscs of soil or rock, including (1) Thethermodynamic c<strong>on</strong>diti<strong>on</strong> in the freeze-thawprocesses; (2) The physical and physiochemiatryprocesses occurring in freezing and thawing soil;(3) The frozen soil and its comp<strong>on</strong>ents, itsstructure, its state and properties; (4) Thegeographical ph<strong>on</strong>emena and processes of frozensoil and their determining c<strong>on</strong>diti<strong>on</strong>s.From the development viewpoint, geocryologystresses several points. The first is thesynthesis research which is based <strong>on</strong> amounts ofreliable informati<strong>on</strong>. The sec<strong>on</strong>d is the transiti<strong>on</strong>from qualitative to quantitative analysis.The third is the transiti<strong>on</strong> from static descripti<strong>on</strong>to dynamic forecast, etc. All the abovefeatures ask for scientific data management andtreatment which in turn are needed to rule outthe data collecting regularity to detetmine thecollecting range, quantity, accuracy, timeperiods and means, to establish a unified datamanagement system-the data base system, toincrease the data utilizati<strong>on</strong> ratio and decreasethe unnecessary repetiti<strong>on</strong> in investigati<strong>on</strong>alwork and to find a suitable mathematical toolfor quantitating the qualitative informati<strong>on</strong> andfor transforming them into numerical, comparable,and measureable values (Cheng Guod<strong>on</strong>g, 1988).The data in permafrost research covers a widerange and is the foundati<strong>on</strong> for the establishmentof a data base system. But the dataadministrati<strong>on</strong> work has been in a manual periodfor a l<strong>on</strong>g time and the data is so dispersed,n<strong>on</strong> uniLiedly formulated and n<strong>on</strong>standardizingthat establishment of permafrost data base hasto be in 011r agenda. The more important thingis that no relati<strong>on</strong>ship has been founded am<strong>on</strong>gthe data. The data base system is designed to
solvc this prohlcm of hockw;lrdlv d:~t;l a;lnilyl*m(-lltIr!- ;ldopti~lg tllr d.1ti1 h;ls;l- ;I~III~II~SII-:I~it111 t
Password s~fexuardII 'I/+ Reset recordes items - IDelete records+"KT"-]-"- Synthetic outputDate base output7 Partial file output- Output by classificati<strong>on</strong>Synthetic statisticsTest data statisticseteorological data statisticsata statistics of ground temp."f Data safeSua+-"-kurehole informati<strong>on</strong> safeguardTest date safeguard,Yeteorological data safeguard- Ground temperature safeguard>Borehole informati<strong>on</strong> inputTest data input- MeLeorolvgical data inputGround temperature data inputFig.1 System appearanceI block) IInquiry blockFig.2 Partial program structure
GraphingIt is the functi<strong>on</strong> of choosing data based <strong>on</strong>different applicati<strong>on</strong> models to calculete, forexample, the numerical calculati<strong>on</strong> of naturaland man-made upper table of the permafrost andthc temperature gradient, etc. Simple figuresca,j be drawn.5.6. Providing Various Data ServicesThe system provides operating instructi<strong>on</strong>sand other services like inquiry, coping, dataunlpading, etc.5.7. The Measures of System Maintenancc andSecurityThe system has security characters of differentsecurity classificati<strong>on</strong>s to guarantee eachuser operates the data base system within thelimits of authority. When necessary, it crinreset recorded items so as 'to pr0tec.t thesecurity, independence, reliability andintegrity of the system.6. THE OUTI,TNE OF THE SYSTEM AND ITS PROGRAMSTRUCTUREunified formulati<strong>on</strong> and normalized principle.Applied in the frozen ground data base systemdomestically or from abroad, the authorci+n<strong>on</strong>ly carry out the basic system develvpment workbaser1 <strong>on</strong> the various materials gathered mainlyal<strong>on</strong>g Qinghai -Xizang highway. It needs grcrrtimprovement and recommendati<strong>on</strong>s and suggesti<strong>on</strong>sare welcome. We'll bcnefit from them by beingahle to est.ahlish a more perfected informaLi<strong>on</strong>system of permafrost envir<strong>on</strong>ment and forecasting.REFERENCESCheng Guod<strong>on</strong>g (1988) A review and prospect forthe regi<strong>on</strong>al permafrost researches in China.Journal of Glaciology and Geocryology,Vol.10, No.?.C..J. Data (1980) An introducti<strong>on</strong> to base systems,Vol.. I, 11.Pan Jinping (1085) Softwarc Development Technique,Shanghai Science Publisher.Sa Shixuan, Wang Shan (1983) C<strong>on</strong>cept <strong>on</strong> DAta13ase System, High Educati<strong>on</strong> Publisher.Yao Qingda (1987) Data Base and Applicati<strong>on</strong>,Science Publisher.The outline of the system is the operati<strong>on</strong>flow diagram appearing in the system design anddata exchanging (sec Fig.1). It is the foundati<strong>on</strong>of the program design and the guide ofoperati<strong>on</strong>. A part of the structure of thesystems program is presented jn Fig.2. Thcstructural progr,am deslgn method used inprogrammihg and program design can be scen fromit. It is unnecessary to divide the module indetail for this can make the system dispatchtoo frequently and decrease the operating speedof the system under foxbase. When the c<strong>on</strong>trollingflow logic is clear, less modules aredivided, when complex, more modules are divided.Tn that way, the maintenance and operatingspeed of the system arc both c<strong>on</strong>sidered at thesame time (Sa Shixuan, Wang Shan, 1983).7. CONCLUSIONSBased <strong>on</strong> detailed analysis of the vatiousdata of frozen gkound, this paper c<strong>on</strong>centrates<strong>on</strong> the establishment of the frozen ground database system, which is suitable for frozen groundresearch, engineering c<strong>on</strong>structi<strong>on</strong> in permafrostregi<strong>on</strong>s and the data exchange either internati<strong>on</strong>allyor internally. It also presents thebasic functi<strong>on</strong> and system c<strong>on</strong>sti,tuti<strong>on</strong> thesystem can realize. The following probL-s arcdiscussed or solved:1. The system design bas ',' <strong>on</strong> microcomputerhardware;2. Realized, normalized stot-age an3 managementof data: '3. Realized data-sharing add eliminating thephenomena of pers<strong>on</strong>al occupied materials:4. Avoiding the data loss caused by manualdata management:5. Providing reliable, integrated dat.a ormaterial about frozen ground for theWorld Data Centre (WDC):6. It is c<strong>on</strong>venient for the user because rhcdata statistic, analysis, calculati<strong>on</strong> andthe outputing of results and simplefigures are all realized <strong>on</strong> computer:7. The data compilati<strong>on</strong> and changing can becarried out at any time.It should be pointed out that this system isn<strong>on</strong> a perfected applicati<strong>on</strong> system especiallyin the normalized data research for there is no1281
'HOST NRAVF PROPERTIES OF NONSATIIHA'I'EI) CCIMPACTEII COHESTVR SOILAND ITS APPLICATTON Ihi WINT?R CONSTRUCTION OF CORE DAMS, Y.'Xie Y ingqi and Uang JianguoHeil<strong>on</strong>gjiang Hydraulic <strong>Research</strong> IustituteThe authors introduce the frust heave regularity of n<strong>on</strong>saturatcd compacted cohesivcsoil irnd evaluatc quantitatively the irlf.Iucnce oC the saturated' degree anddensity <strong>on</strong> thc frost. heave. Meanwhile, wc have an idea that. the compacted soilwit.I-I the low saturated degree and high density could be usc.d to pake ,th"cimpervious barricr-which would be safe in !.he winter ul-ithout insulati<strong>on</strong>'xn ,.scas<strong>on</strong>~l irozen regi<strong>on</strong>s. The practical engineeri.ng method 'IS givcn, and in:~dditi<strong>on</strong>, thc formula'.of estimating Lhe needed t.ime of melting the 'ffozen layert:hi1r.,ughly wi I1 be mentiolied, in thc nIet.hod of thermal qquilibrium.IN'IRODIJCT~OYIn or~ltfr. t'r> :;olive cnginecring problems in 1.11eseas<strong>on</strong>al froz?n rr!gi<strong>on</strong>s, wc' regard thc imperviousbarrier of r:,.ohesbve soil which is buill. tolast the winI.er under frcezin$; without irlsulati<strong>on</strong>,allrjw no cxternal water recharge, paps nlicezi.ng BIIII mrltirig cyclc and meeting thephysict~l nnd mechan.ica1 index that is thcpcnctratioll I.11efficient.. compressibi lity-coefficicntand she,nring coefficient, etc. So west.udir.d, the unrehI.r';iincd frost heave regulat'i t yof n<strong>on</strong>sa!.ur,rtcd compaL.tnrl cohesive soil under ac.<strong>on</strong>fined sysLerrl, with c<strong>on</strong>e di rccti<strong>on</strong>cll freezing,no additi<strong>on</strong>al Iootl, as we1 I os the changingsit-uati<strong>on</strong> of soil permeahiliby (Paggy, 1980) andshearing sI.tength after <strong>on</strong>e freeze-t-haw cycle.THE TEST CDNlITTlONS ANT)ME'I'H(IDSclearly show that the ilmount of 'Crost heaveincreases with the decrease of dry unit wcight.Fig.1, Fig.2 and Fig.? s,haw the curves of theCrost heave amounL (Ah), frozen depth (Hm) VS.elapsed time. Rased <strong>on</strong> these f igurcs, we callsee: When the degree 6f saturati<strong>on</strong> is cunstant,the amount of frost heave will redu,ce. with theenlatgcmcntf of dry unj t: weight. Frotu.Fig.4, theAh-W curve with parameter Pd, ve,c+rl see thatwh'rn the wqLer cnntena.lp) ig c<strong>on</strong>'ptant, theanlourlt of frast hqav.@ will i,ncrep?e with thecnlargemept of the dry unit weight. So thec<strong>on</strong>tradicti<strong>on</strong>s between the omounts of frostheave red,uiti<strong>on</strong> with thc enlargehent of dry unitweight and frost heave increasing w i t h th.cenlargemeot of the soil skelet<strong>on</strong> differelices ofdensity in some refereqccs "(Orouf, 1980)reflected the practical'c<strong>on</strong>diti<strong>on</strong>s respectively.'The urlidircctinllal frost heave instrument. wasopere\.erl in the l o w t.i.mpe:atur,t!. laboratory.The s;implc tube is 131) mlm in -inner liamrterat the top, 120 mm at. t.hc buttow ill 1,'23, internalwall taper 200 rnm in " ' ight.Thc sample's t.c!mpcratm II olpng the depth each70 mm was mehsurcd hy uric )i- two thermocou,nleswhich were nadc 'ftotn r.npp'cr..Tht~ ircczitlg Lnmpcratuit. at the t.op was -20'C.and at L!I~ bottom it was t2'IC. Thc melting. 4 'tcmperaturv at the t.op was t15'C - t20°C,, and. t;tthe hrrLt.um wn
SamplescollectingsiteTable 1. The analysing results of soil for the teatPercentage of followingsize (mm) by weight ( X )Specific'P 'L 'P gravi.ty Classificati<strong>on</strong>. ->0.05 0.05-0.005 (0.005 x xglcm'. .Wanjia, Harbin,Heil<strong>on</strong>gjiang Province 16.4 64.0 20.0 21.5 34.6 13.1 2.69CIGeibehe, Wuchang County, 16.0Heil<strong>on</strong>gjiang Province63.0 21 -0 23.0 35.0 12.0 2.66 CILinx<strong>on</strong>g CountyHeil<strong>on</strong>gjiang ProvinceCharseng ReserviorJilin Province11 .o 50.0 39 .O 23.5 43.4 19.9 2.71 CI27 .o 42.0 31 .O 21.7 38.8 17.1 2.71 CITable 2. The results of test dataTest ItemDry unitResults Satura- Water weightti<strong>on</strong> c<strong>on</strong>tent (glcm' )Number Sr(X) w (%)The maximumfrost heaveamount(mm)Frostheave Noteratio(X)F-IV-1F-I 11-12345623456707070707070ao80ao80808017.820.222.724.126.328.617.820.222.724.126.328.61.891.831.771.741.69.1.651.971.921.871.851.811.761.601.521.441.401.341.281.63I .601.521.491.431.37-0 e 270.711.201.553.5312.231.120.952.176.079.9814.28-0.2* 0.5' 0.01.02.48.90.70.61.44 .O6.79.5F -v-123456 '90909090909017.820.222.724.126.328.62.062.021.961.941.901.871.751.681.601.561.501.45* 0.58,1.203.448.409.0813.960.40.82.35.66.19.3pa = 1.37In equati<strong>on</strong> (l), the enlargement of Pd willresult in the reducti<strong>on</strong> of W when Sr is a c<strong>on</strong>stant.Under the circumstances that other c<strong>on</strong>di-10ci<strong>on</strong>s weren't changable, the absorbed water c<strong>on</strong>tentof soil was relative to the surface energy- 8 of particles.' 6The reducti<strong>on</strong> of water c<strong>on</strong>tent means thereducti<strong>on</strong> of migrated water c<strong>on</strong>tent whicha 4 provided for the phase change and ice gatheringQ 2and produced heave. From the macroscopic scale,the amount of frost heave, will decrease with theenlargement of pd' Generally speaking, the3 amount of frost heave would increase with therising of Pd and the frost heave property ofE 6soil was directly relative to the degree oEx 9saturati<strong>on</strong> in soil,12 On the other hand, property the of the compactedwarm soil can be known as: When the workof compacti<strong>on</strong> was :a c<strong>on</strong>stants, the dry unit weightwas the functi<strong>on</strong> of water c<strong>on</strong>tent (see Fig.5).Fig.2 The test result of Ah-H,-tOn the c<strong>on</strong>trary, when the work of compacti<strong>on</strong> waswhen Sr equals to 80%not c<strong>on</strong>stant, a different dry-unit weight could1283
IP* = 1.45/.75degrees of saturati<strong>on</strong> were shown in a mathematicalequati<strong>on</strong>, it would be:where, pdi - the density value which actedobviously <strong>on</strong> the frost heaveability, unit: g/cm:S, - the degree of saturati<strong>on</strong> which waslisted in decimals.Fig.6 was the curve of the frost heave ratiowith dry unit weight with a parameter Pd. Theyare a group of approximate logarithmic curveswhich met at the point of the horiz<strong>on</strong>tal axissr=70X. According to the suggesti<strong>on</strong> of somedata thatn<strong>on</strong>-frost heave soil was qSlZ, thecritical dry unit weight value of the frost andn<strong>on</strong>-heave soil was:Sr=70% Pd
Table 3. The permeability and shearing strength o f warm soilShearing strengthpdK(g/cm') (cm/sec) C(kg/cm')0,("1Notei, 75 i .86 32.5 n<strong>on</strong>-permeability *.1.70 5.9~10" D. 90 c16. 5 in test1.65 3.5~10" 0.89 13.01.60 2.8~10" 0.79 7.51.55 0.74 4.0Table 4. The permeability and shearing strength of frost boil soil1.75 8.7~10-~ 1.65 22 .o1.70 6. S X ~ O - ~ 1.31 Ilr.51.65 5.5~10-~ 1.07 13.51.60 5.4~10-~ 0.83 8.51.55 4 e 7~10-~ 0,60 5.5Fig.7 The ideograph of calculating the shawingtime in frozen layersimple evaluati<strong>on</strong> method is suggested.If the cold quantity inside the frozen layerheight H in <strong>on</strong>e unit area was Q, the quantityof heat inside the frozen layer transferredthrough the new filled warm layer in <strong>on</strong>e unittime and area was q, the quantity of undergroundthermal heat in <strong>on</strong>e unit time and area was q'and the time needed 'in melting all the frozenlayer was T, the thermal equilibrium equati<strong>on</strong> is:Q = (q + q'V (4)Because the melted layer depth produced byunderground thermal heat in the seas<strong>on</strong>al frozenground made up about <strong>on</strong>e-tenth, so we couldc<strong>on</strong>tinue to assume: q'=O.lQ. The equati<strong>on</strong> 4could be simplified as:0.9Q P qT (5)and Q=HH(Cvlt- ItL-pd*W.i) 0CP(6)where, Cv - the volume specific heat of frozen- ground;t - the coverage minus temperature ofcp frozen ground;L - the latent heat of water phase:Pd - dry unit weight of frozen layer;W - water c<strong>on</strong>tent of frozen layer:i - relative ice c<strong>on</strong>tent.q =X't,+pHt2where, h - heat transfer coefficient;t:*- average air temperature during' y melting.After Equati<strong>on</strong>s (6) and (7) were put intoEquati<strong>on</strong> (5) the time needed to melt the frozenlayer is as follows:0.45Ht.H~(c,lt,,l+L.Pd.W.i)T - + . (8)X'tcpUnder the c<strong>on</strong>diti<strong>on</strong> of natural air temperature,the cohesive soil was compacted in theoptimum water c<strong>on</strong>tent and its relative icec<strong>on</strong>tent must be less than 1. In order to c<strong>on</strong>sidersafety and simplify the calculati<strong>on</strong>, we .canassume that i=l.O, so Equati<strong>on</strong> 8 can be written:LcpEquati<strong>on</strong> '(9) was the functi<strong>on</strong> that we referredto evaluate melting time of the frozen layer.Using Equatiqn (9), we can also know that fromthe rebuilding to the beginning of the next coldseas<strong>on</strong>, the new filled warm layer maximum depthwithout residual frozen layers inside the imperviousbarrier should be:
The value in Equati<strong>on</strong> (10) was a known numberand its maximum value was the c<strong>on</strong>tinual time ofplus temperature <strong>on</strong> a daily average in theseas<strong>on</strong>ally fro+en ground regi<strong>on</strong>.CONCLUSIONThe regularity of frost heave in compactedsoil obviously showed that: when soil wassaturated in the special c<strong>on</strong>diti<strong>on</strong>s, the frostheave ratio would reduce with the enlargement ofdry unit weight. When the dry unit weight reacheda critical value, the compacted soil which frozewithout heave, i.e. frost heave ratio qrlX couldbe reached. In order to obtain the soil, atfirst, degree of saturati<strong>on</strong> Sr was solvedaccording to the designed dry weight andcorresp<strong>on</strong>ding optimum water c<strong>on</strong>tent and then thecritical dry unit weight pi needed for freezingwithout the heave could be arrived at inEquati<strong>on</strong> 3. If the compacted soil was made toreach pi and S, was kept at <strong>on</strong>e c<strong>on</strong>stant, thewater c<strong>on</strong>tent should be decreased, Equati<strong>on</strong> 9can be used to evaluate the melting time of thefrozen layer and determine a suitable time forrebuilding.REFERENCESC.A. Peggy and V.K. Horsler, (1980) The EngineeringProperty of Compacted Cohesive in theState of Saturated and Frost Boil Recycline,Beijing Water C<strong>on</strong>servancy Science andTechmoldgy, Complimentary Issue.B.O. Orouf, et al., (1980) The Frost Heave ofSoil and the Applicati<strong>on</strong> <strong>on</strong> BuildingStructure, Translated by Li Y<strong>on</strong>gsheng.
OBSERVATION AND RESEARCH OF SORTED CIRCLES IN EMPTY CIRQUEAT THE HEAD OF URUMQI RIVER, TIAN SHAN, CHINAXi<strong>on</strong>g Htigang' Liu Cmgnian2 and Cui Zhi ju2'Department of Geography, Xinjiang University, Xinjang, China'Departmint of Geography, Beijing University, Bei jng, CGnaThe features of the sorted circles have been analysised with the farm of the sorted circle, grain size, watercantent. frost heave st<strong>on</strong>e sirting, fabric and reference to wooden stakes inserted vertically into theground. The results show that the sorting degree becomes much better; the influence of frostheave decreasesgradually; and the center of sorted circles was covered by vegetati<strong>on</strong> increasingly from the upperto lower sorted circigs. Moreover, the general tendency of the frostheave is central frostheave > internalgutter frostheave > gutter frostheave in a sorted circle.THE STUDY AREAThe Urumqi river rises <strong>on</strong> the north slope of the Kalawchenridge, Tian Shan and is about 150 Km l<strong>on</strong>g. Precipitous mountainpcaks, 4.000"4,400 m in altitude, arc covered by snow and glaaers.Snow line is 3,950-4,200 m above sea Icvel. The emptycirque ip approximately 3,820-3,950m (ad) with an area of 1.5Km', located in the north of the river head, and is facingsouth-st (Fig 1). In the empty cirque many sorted circles, sortedstripes, sorted nets and sorted polyg<strong>on</strong>s developcd, almost includingall the classificati<strong>on</strong>s of sorted forms given by Washburn(1979) The sorted circles, with different diameters and forms, are atypical case am<strong>on</strong>g them. Since the place, altitude and developingtime arc different, developmental degrees of sorted circles have anobvious diversity. For recounting c<strong>on</strong>veniently, the sorted circlesdistributed in thrcc different elevati<strong>on</strong>s, 3,820, 3,880 and 3,950 m,were called lower; middle and upper sorted circles acparatly. Thec<strong>on</strong>diti<strong>on</strong>s of sorted circles am shown in Table 1.STONE STATISTICSSince sorted circles of different developmental stages undergodifferent sorting degree has diversity. Generally, of three principalcharacteristics of st<strong>on</strong>e can use to decided the sorting anddevelopmental degras. Fimt, ratio (P = Dr / Dc) of mean 'size of* gutter st<strong>on</strong>e (Dr) and central st<strong>on</strong>e PC) The bigger P is, the betterthe sorting and developmental degree are. Sec<strong>on</strong>d, variance (S) tomean (X) ratio (P = S / 100 X X) of st<strong>on</strong>e size in the centre of sortedcircle. The F is regarded as the parameter of the representedsorting degree. The bigger its value is, the worse the sorting degreesarc. Third, percentage (Q = A / 100 X 100) of numbers of gutterst<strong>on</strong>e (A) which ab face is tangent with sorted circles. The bigger Qis, the more mature and sorted the sorted circles are. All theparameters were counted from <strong>on</strong>e hundred st<strong>on</strong>es.Statistical data(Tab1e 2) shows that the ratio (P), increasedfrom 2.5 to 12.5, the percentage (Q) rose by 17 pcrccnt and the varianceto mean size ratio (F) of central st<strong>on</strong>e decreased nearly <strong>on</strong>etime, three results of the st<strong>on</strong>e statistics suggested that sorting anddevelopmental degree increase gradually from upper to lowcr sortedcircles.The developmentil degree of sorted circles is a sequence ofchanges gradually al<strong>on</strong>g the matrixal source regi<strong>on</strong> in the sameplaw. If th~ sorted circles arc near the source regi<strong>on</strong>, theirdevelopmental degree is worse. C<strong>on</strong>versely, if they arc far from thesourn regi<strong>on</strong> the degree is better. In middle sorted circles. Wemeasured the forms and st<strong>on</strong>e sizes of sorted circle from the edge ofthe talus to the centre of the cirque <strong>on</strong> a line (Table 3). The ratio (P)far from the talus, is more ten times than that of it near the talus.Moreover, the heigkt between the centre and gutter of sorted circlesdecrease and the microcircles, soil polyg<strong>on</strong>s appear <strong>on</strong> the centre ofsorted circles gradually with the distance increased. These alsoprove that the sorting and developmental degree of sorted circlesmuch better gradually. From a review of field evidence and physicallogistics it has been deduced thit the place, which is far from thetalus,has a comparatively smooth surface and fineness of high c<strong>on</strong>tent,so it can c<strong>on</strong>tain much water, and is influenced by frost- thawEasily, implying that the developing rate of sorted circles is fast.'OBSERVATION OF -STHEAVE-In the summer of 1990 wooden stakes were used to set upobservati<strong>on</strong>al posts in lower and middle sorted circles. Three differentmethods were used to measure frost heave. Firet, 15 woodenstakes 3.5 crn in diameter and 25 cm l<strong>on</strong>g were Completely driveninto different positi<strong>on</strong>s of a sorted circle (Fig 2). observing the frostheave of different positi<strong>on</strong>s with stakes of the same diameter andlength.Scc<strong>on</strong>d, 6 wooden stakes 25 cm l<strong>on</strong>g and 1 x I-- 5 x 6 cm in' diameter were placed in the centres of 6 sorted circles with a similar1287
E23legendOf cirqueuntil1 of Little IceEl ~ g Stage eLu until ofa Ncoglaciatian Stagesorted circlesa talusglacier. Fig.] Index map of sorted circles in empty cirqueTable 1 . C<strong>on</strong>diti<strong>on</strong>s of the different sorted circles in empty cirquealtitude till age diamctcr(m) in placc (m)formplacecentralc<strong>on</strong>diti<strong>on</strong>upper16th" like a back of nosorted 3,950 19th 1"s utcamcd vegetati<strong>on</strong>circles centuries bread $quemiddle Z.Oo0" slightly middk nosorted, 3,880 3,500 2-4 high of MnPtY vcgctatioecircles B .P centrc cirquelower l0,OOO" higher mouth covemd bysorted 3,820 20,000 1-3gutterofemptycircle B.P cirquevegetati<strong>on</strong>I after Cui Zhiju 1981. Wsng Qingtai 1981.scale, trying to find out the functi<strong>on</strong> of frost heave to the woodenstakes with the same length but different diameter.Third, 8 woodenstakes 3.5 cm in diameter and 5-40 cm l<strong>on</strong>g were separatelydriven to the centres of 8 sorted circles with the similar ales, inorder to understand the c<strong>on</strong>diti<strong>on</strong> and influence of frost heave tothe wooden stakes of different depths and the development of sort-ed circles. Generally, the layer 40 cm beneath the ground surface a Io .acts very str<strong>on</strong>gly, so the l<strong>on</strong>gest wooden stake selected was 40 cm.The accuracy of the survey was tg 1 rnm or better.For discussing the frost heave relati<strong>on</strong>ship between the centreCtUFig.2 Positi<strong>on</strong> and numbers of wooden stake in sorted circle1288 *
Table 2 . Statistical parameters of st<strong>on</strong>e of sorted circle in threedifferent placesF P Q Altitudeupper sortcd circles 5.57 2.5 49 3,950middle sorted circles 4.96 6.0 60 3,880lower sorted circles 2.82 12.5 66 3,820and gutter in a sorted circle.the observati<strong>on</strong>al data which was gatheredby the first method, were divided into 4 groups: (l).Centralstakes;(2).Internal gutter stakes; (3).0utside gutter stakes;(4).Gutterstakes (Tablc 4). -e data shows that acti<strong>on</strong> of the centralstakes was str<strong>on</strong>g and that of the gutter stakes was weak. The meanheave of the central stakes was 2.65 times than that of the gutterstakes in the first observati<strong>on</strong>al cycle(Ju1y 6,1990 -August 20,1990) and 1.3 times in the sec<strong>on</strong>d observati<strong>on</strong>al cycle (August 20,1990- - August 14, 1991). The general tcndency of mean heave ofthe stakes was central stakes > internal gutter stakes outsidegutter stakes > gutter stakes. This reflected fully that the frostheave decreased from the centre to the gutter of sorted circles.There was also great diversity am<strong>on</strong>g the acti<strong>on</strong> of every side of thesorted circle. The fastest rising stakes were <strong>on</strong> the west side and theslowest rising stakes were <strong>on</strong> the south sideflable 4). The meanheave of the former was 2.1 5 times and 1.83 times than that of lattcr,separately in two obserati<strong>on</strong>al cycles. This difference may be related to the water c<strong>on</strong>tent and grain size of different parts of thesorted circle.The heave of the wooden stakes for thc pcridd 1990-1991ranged from 33 rnm, for 5 X 5 cm in diameter, to 67 mm, for 1 X 1cm in diameter (Table 5). This suggested that wooden stakes withthe least diametcr rose quickly in the centre of the sorted circle. Itmincides with the c<strong>on</strong>diti<strong>on</strong> that the small st<strong>on</strong>es rise to thc groundsurface quickly in the process of freezethaw sorting.But the tendencyof frost heave is not clear, this may be related to the maturityand inacti<strong>on</strong> of lower sorted circles.The heave of the stake 20 crn l<strong>on</strong>g was 122 mm and stake 40cm l<strong>on</strong>g was 45 mm from August 20,1990 to August 14,1991. Theformer is more 2.7 times than the latter. The surface layer above 25cm acted str<strong>on</strong>gly. Three stakes, 5, 10 and 15 cm l<strong>on</strong>g rose outcompletely and lay down <strong>on</strong> the ground surface in the field observati<strong>on</strong>of August 14,1991. This is c<strong>on</strong>sistent with thc c<strong>on</strong>clusi<strong>on</strong>that the frost heave of the surface is str<strong>on</strong>gcr than that of depth,which was also achieved in research of other regi<strong>on</strong>s(WangXiyao,1982, Cuitoweiqi,l985).The ground surface was casily influenced by changes of theoutside envir<strong>on</strong>ment, In early summer the ground surface began tothaw, and the highest frequency of frost-thaw appeared in June.The stakes were pushed upward with ground surface freezing.When the ground thawed from the surfam downward, the stakesfailed to return fully to their pnfrcczing positi<strong>on</strong>, to produ& a netof upward heave of the stakm. Repetitive frceze-thaw cyclcs resultin a gradual upward movement of the stake. There was still freezingin the depths of the sorted circles at this time. In summer the thickactive layer was caused by high tcmpcrature, precipitati<strong>on</strong> and lowerfrequency of freethaw. If thc material in the depths moveupward, it must overcome the gravity and cohesive forces of mudin the upper layer, In September the frequcncy of freeze- thaw increased.There arc still very str<strong>on</strong>g influences of freeze-thaw in theground surfacc, the stakes in the surface layer rise quickly.The c<strong>on</strong>-Table 3. Changes of sorted circle with an inmasud distancenumbersdistanceFromtalus(m)5.0’9.514.518.021.524.526.5from talus in middle sorted circler5.25 0.324.5 0.65.6 0.193.2 ’ 1.413.6 1.142.8 1.57’ 2.5 3.44heightbetweenc<strong>on</strong>diti<strong>on</strong> ofcentrccentre andwttm (m)25201713 soil polyg<strong>on</strong>s10 microcircles and polyg<strong>on</strong>s0 microcircles and polyg<strong>on</strong>s0 microeircles and polyg<strong>on</strong>s1289
Table 4. Heave of wooden stakes in different positi<strong>on</strong>s and sides of lower sorted circleinternal outsideccntrid gutter gutter north cast south weststakcsstakes stakes stakcs stakesstakes stakesstakeq(4'5'6) (3,7,12,13) (l,9,10,15)(2AIlJ4) (7,8,9) (IOJlJ2) (1.2.3) (13,14,15)July6,1990 0 0 0 0 0 0 0 0'August 20,1990 5.3mm 4.0mm 4.8mm 2.Omm 4.3mm '3.7mm 2.0mm 4.3mmAugust 14,1991 39.2mm 37.0mm 29.5mm 30.0mm 37.8mm 23.5mm 43.0rnmTable 5. Heave of wooden stakes with different diameter inlower sorted cirdesDiameter of ataka1x1- 2x2 3x3 4x4 5x5 6x6July 6,1990 0 0 0 0 0 0Augurt 20,1990 2mm 5mm Smm lOmm 4mm 3mmAugust 14,1991 67mm 38mm 36mm 41mm 33mm 41mmTable 6. Heave of wooden stakm with different l<strong>on</strong>gth in middle sorted circleslengbt . Of #take8 (cm).July 6,1990 0 0 0 0 0 0 0 0August20,1990 20mm 47mm 26mm 13mm 8mm 7mm 4mm. ImmAugust 14,1991 * 122mm 8lmm 39mm 30mm 45mmstake rose out completely and lay down <strong>on</strong> thc~oundditi<strong>on</strong> is similar with that of June.In autumn temperature decreases,the active layer begins Odouble freezinglfrom both surface and bottom. C<strong>on</strong>diti<strong>on</strong>s of frost heave are very complicated and thefrost-pull theory and frost-push theory are used to explain thefrost heave of st<strong>on</strong>es by downward freezing which can not bedirectly applied to upward freezing by reversing signs, because thevertical directi<strong>on</strong> of ground surface easily influenced by the outsideenviranment is higher than that of depth.Comparing the data of lower sorted circles, the heave ofwooden stake in middle sorted corcles is a markedly larger. FromAugust 20, 1990 to August 14, 1991, the heave of stakes, with thesame lengths, diameters and at the same positi<strong>on</strong> in middle .sortedcircles, is 3 times than that of stake in lower sorted circles.CONCLUSIONFrom the upper to lower sorted circles (from infant stage toold stage) the sorting degree becomes much better; the intluencc offrostheave decreases gradually; the centre of sorted circles was cowcred by vegetati<strong>on</strong> increasingly; and forms of sorted circles changefrom the high to low centre. Preliminary c<strong>on</strong>clusi<strong>on</strong>s of their faturesand developmental backgr<strong>on</strong>d which have been drawn fromfield and laboratory analysis is in Table 7.Wooden stakes with small diameter heave higher than that of<strong>on</strong>es with a large diameter in the same pcriod. Furthmore, the frostheave of surface is str<strong>on</strong>ger than that of depth. The str<strong>on</strong>mt activelayer is above 25 cm from the surface. In the same plm the general1290
Table 7. Featurc of sorted circle in different developmental stages at empty cirquedcvelop- c<strong>on</strong>diti<strong>on</strong> c<strong>on</strong>diti<strong>on</strong> glacialsortingmentalof frost of circle stagc indegrcestage hcave ccnvc plaw:upper very Littlc smallsorted infant lower str<strong>on</strong>g sorted ICCcircles frosthavc circlcs Agemiddle str<strong>on</strong>g small sorted Ncosortcdmature mcdiurn frost circlcs and glacicirclcshcavc polyg<strong>on</strong>s an<strong>on</strong>lower weak no small wpcrsortcd old higher frost sorted- Wan8circlcs hcavc circles Fentendency of the frost heave is central frost heave > internal gutterfrost heave > gutter frost heave in a sorted circle. The maturityand sorting degree of sorted circles increase al<strong>on</strong>g with the increaseof distance of the material source regi<strong>on</strong>.Finally, additi<strong>on</strong>al data and research are necessary <strong>on</strong> thedcveloprncntal time, microclimate changes in different heightswhich c<strong>on</strong>trol the developmental degree of sorted circles.ACKNOWLEDGMENT”_Financial assistance for this study was provides by the Nati<strong>on</strong>alNatural Science Foundati<strong>on</strong> of China and Science Foudati<strong>on</strong> ofTian Shan Stati<strong>on</strong>, Prof. Liu Chaohai(LanZhou Institute ofGlaciology and Cryopcdology, Academia Sinica) supplied varioushclp with our work.REFERENCECui Zhiju,l981. On the glacial cirque at the head of Ururnqi River,Tian Shan, Journal of Glaciology and Cryopedology,Vol. 3,Special Issue.pp 57--63 (in Chinese). Cuitoweiqi,H.A, 1985,The mechanics of frozGn ground, Sciences Press, Beijng. pp80-99(in’Chinese).Mackay;J.R.1984, The frost heave of st<strong>on</strong>cs in the active layerabove permafrost with downward and upward freezin,Arcticand Alpine <strong>Research</strong>, Vol, 6,NO. 4, pp439-446.Wang Jingtai,l98IyAncicnt glaciers at the head of Urumqi River,Tian Shian, Journal of Glaciaology and Cryopedology, Vo1.3,Special Issue pp 24--35 (in Chinese).Wang Xiiao, 1982, Frost heave and its distributi<strong>on</strong> in different layersinfluenced by shallow ground waterJourna1 of Glaciologyand Cryopcdology, Val. 4, No.2, ppSS”WnWashbq,A.L, 1979,c3eocryolog~,Edwa~d Amold, ~ ~22- 277:1291
STUDY AND DEVILOPHENT OF THE TECHNIQUESAGAINST FROST DANAGB OP HYDRAULIC STRUCTURESBomeng Xu Anguo Li Lijun ShaoInformati<strong>on</strong> SysteH of Antifrost Techniques of HydraulicStructures of China,74 Beian Road. Changchun Citu.ChinaThe progress of the study <strong>on</strong> the techniques against frost damage of hydraulic struc--tures in China is introduced in the aspects of foundati<strong>on</strong> soil heaving,frost heavingforce and the design measures against frost damage. The remaining problems to besolved are simply discussed and the study directi<strong>on</strong> and tasks in the future arealso presented.key words: Hydraulic stucture, frost damage, frost heave preventi<strong>on</strong> and treatment.INTRODUCT-IONOur country has a vast territory. quite a larRepart-of which- is in the cold z<strong>on</strong>e of the NorthernHemisphere. The area of frozen so i I in our countryis 68.6% of the whole territory In which theseas<strong>on</strong>ally frozen soil vith frost depth more than0.5~--46.3% , the permafrost--22 3% . In theseregl<strong>on</strong>s, not <strong>on</strong>ly a few hydraulic st.ructures wereseverely damaged by the freezing a nd tharlne acti<strong>on</strong>.The investigati<strong>on</strong> data indicated that in Lishu andseven other irrigati<strong>on</strong> districts of the province ofJiling, 71.4% of the irrigati<strong>on</strong> canal structureswere damaged by the frost acti<strong>on</strong>: in the Chahayangirrigati<strong>on</strong> dostrict there, were 93 structures damp--ed in the 112 investigated structures; the canallining in the different regi<strong>on</strong>s were also damagedto a certwln extent (Xu Shaoxin, 1986). Therefore,it is necessary to study the various problemsc<strong>on</strong>cerned with soil frost and ice acti<strong>on</strong>.DEVELOPMENT OF THE RESEARCH WORKOn the whole, the research work in this fieMin China may be divided into three developmentstages as follows(Xu Bomeng.1988).The first stage approximately ran through the1950's. In this stage, the research work wasdeveloped mainly around the influence of soilfrost and the physical and nechanical propertiesand earth filling techniques in winter. In theearly 1950's. a number of laboratory and in-sitetests of the eart.h filling methods, earth fillqualities in winter were.carried out and thawingsubsidence characteristics of frozen soil cakesand their fillins bodies in water were studied.These test results had applicati<strong>on</strong> in the watertl--ght blankets of L<strong>on</strong>gfunshan and other reservoirsin the province,of Heilangjiang, which initiateda precedent of ut-ilizintz frozen soils imn hydraulicc<strong>on</strong>structi<strong>on</strong> in cold regi<strong>on</strong>s. At the same tias,theprevious Shengyana Hydraulic <strong>Research</strong> Institute ofMinistry of Water Resources had compiled and publi--shed "C<strong>on</strong>structi<strong>on</strong> of Roller Earth Dam in Winter"The sec<strong>on</strong>d stage was approximately from theearly 1960's to the mid-1970's. The research <strong>on</strong>frozen soil developed mainly vith the focus<strong>on</strong> thehydraulic structures destroyed by the heaveoffoundati<strong>on</strong> soil. Some efficious measures againstfrost damage vere sommarized. At the same time,theinvestiRati<strong>on</strong> of ice injury and observati<strong>on</strong> of icepressure were carried out, the law of ice pressureformati<strong>on</strong> and calculating method were studied,The third stage was fror the mid-1970's topvesent. It is the stage that the study of preven--ti<strong>on</strong> and treatment of freeze damage of hydraulicstuctures and canal lining and soil freezing werequickly developed. Since 1977, the "Cooperati<strong>on</strong>Group of <strong>Research</strong>,,<strong>on</strong> Antifrost Technigues of Hydr--aulic Structures and InforBatin System of Anti--frost Techniques of Hydraulic Structures wereestablished. They held eleven academic exchangeand more than thirty symposiums, <strong>on</strong> vhich over 500papers were presented about the investigati<strong>on</strong> andsummary of freeze damape and its -preventi<strong>on</strong> andthe treatment techniques of hydraulic stuctures,soil heaving and its acti<strong>on</strong> tothe stuctures were presented. Forty volumes of theJounal "Engineering and Frozen Soil",fifty volumtsof the Journal "Waterti'ght Techniques of Canalhave been published. The "Experimental Yethod offrozen soil", the "Design Standard of Anti-Frostheavingof Canal System Structures", the writings"Preventi<strong>on</strong> and Tteatment of Freeze Damage of Hydr--aulic Structures , Watertight of Canal and the"Callecting Drawings of Canal System Structuresin Seas<strong>on</strong>ally Frozen Soil Regi<strong>on</strong>s" have beenprinted. At present, the "Standard of HydrayljcStructures Design Against Ice and Frost Heave ISin compilati<strong>on</strong>. Besides, not quite a few foreignuseful references have also been translated intoChinese.RESEARCH ACHIEVEMENTThe primary achievements are as follows:- 1292
1. The Freezing and Thawing Properties of Soils,and Earth Dam Filling in Uinter,The test indicated that the stable freezingtemerature of clay is lower t.han 0% and its mini--mum supercooling temperature may reach -5C. atthis timesthe clay is still in a plastic c<strong>on</strong>diti<strong>on</strong>,c<strong>on</strong>sequently. can be filled and compacted withincreasing speed. The clay core of the earth darof Pinghe reeervoir was c<strong>on</strong>structed in winter. thecompacted density under an air temperature of -12Y:reached 1.68g/cm3 , satisfying the design require--nent.The tests of the effect of soil freezing andthaving <strong>on</strong> the filled soil properties indicatedthat c<strong>on</strong>trolling the moisture of filled soil to benear or lower than the plastic limit can assure thequality, and avoid the effect of freezing andtha.wing acti<strong>on</strong>. As a result of the soil being se--para:ted by the ice in the course of freezing, thecompressibility increases, whereas the shear stren--gth decreases(Wang Liang.1983). , These resultsaenti<strong>on</strong>ed above have been applied in the clay coresof Pinghe and Dahof<strong>on</strong>g reservoirs and the earth-,rock coffendam with weathering sand of BaishanHydroelectric Stati<strong>on</strong> and have a good efficiency.2. Characteristics of Crumbling. Sinking andC<strong>on</strong>s.olidati<strong>on</strong> of Frozen Soils and Their FilledBodies in Water add Applicati<strong>on</strong> in the UatertightBlanket of Earth DamsThe test results dem<strong>on</strong>strated that the frozensoil. vhen puts into water, thaws and crumbles intosmall Pieces" from la,yer to layer and drops down.The crumbled amount within several hours is over80% in weight. BY the acti<strong>on</strong> of the dead weight"and seepage pressu're, the density of soil piecesaccumulati<strong>on</strong> . gradually increases, appoaching thenatural density of the soil within a short time.This indicates th'at the properties of frozenclarer soils cruabling in water can be used toform a good watertight blanket. These results havebeen applied in several reservoirs of Heil<strong>on</strong>gjiangprovince and have had good results.3.Hoisture Migrati<strong>on</strong> and Frost HeaveObservati<strong>on</strong>s indicate that the distributi<strong>on</strong> ofthe.frost heaving amount al<strong>on</strong>g the depth is notunifor. with different foras. The limit of .thedepth of the water tab'le influencing <strong>on</strong> the 'dois--ture migrati<strong>on</strong> and frost heaving may be evaluatedby the capillary lift of soil, The hvdrau.lic struc--tures are usually located at the sites with highervater tables. Under the c<strong>on</strong>diti<strong>on</strong> of an open system,frost heaving of ground is great. According to theobservati<strong>on</strong>s,in Heil<strong>on</strong>gjiang and Jiling provinces,having greater frost depth of ground, the maximumheaving reached 55cm and 43cn,respectivel~. c<strong>on</strong>se--quentlu the hydraulic structures were damagedto a larger extent.With a number of laboratory test and in-situ'observati<strong>on</strong>s, the design values of frost depth andheaving and their calculati<strong>on</strong> methods are presented.4. Frost Heaving Force of SoilThe observati<strong>on</strong>s for years in sever1 field testsites indicate that the tangential frost heavingforce mainly occurs at a certain range of the upperfrost depth; the maximua value is brought about atthe time of the frost depth being about 70-80% ofits maximum, The main factors affecting tangentialfrost heaving force are the heave of soil and rou--8hness of Pile surface.The design values of tangential frost force forpile vith even surface are presented: 20-40kPa forthe soil vith weak heaving susceptibility, 40-80kPafor the soil with medium heaving susceptibility,80-150kPa for the str<strong>on</strong>gly heaving soil.The value of horiz<strong>on</strong>tal frost heaving forceacting <strong>on</strong> the retaining vall under bi-directi<strong>on</strong>freezing of the back-filling soil behind the wallsis associated with the frost susceptibility of thesoil and the allowable deformati<strong>on</strong> of the wall.Thehoriz<strong>on</strong>tal heaving, force follows an increase of thedepth fro. the ground surface and has the maxim,umin II certain height from the wall bottom,Based <strong>on</strong> the ip-situ observati<strong>on</strong> data: thedistributi<strong>on</strong> of horiz<strong>on</strong>tal heaving force al<strong>on</strong>g thedepth in triangle or trapezoid form has been deriv--ed, having the maxilum value of about 50-100kPafor weakly heaving soils, 100-150kPa for mid-heav--ing soils and 150-20QkPa for str<strong>on</strong>gly heavingsoils(Sui Tieling,l990).The vertical frost heaving force is dependantup<strong>on</strong> the heav.ing susceptibility of soil and heav--ing c<strong>on</strong>straint, and 'also associated vith thebottoa area eubedded depth and allowable deforma--ti<strong>on</strong> of the foundatio$(Xu Shaoxin,l989): The ,larger the bottom . area'; the lover the hearinaforce caused by the surrounding soil to thefoundati<strong>on</strong>; the deeper thd foundati<strong>on</strong>. the smallerthe freezing layer of soll'beneeth the foundati<strong>on</strong>and the heaving force,5.Hechanism of Frost Damage'of Canal Linings.The frost heave amount at each positi<strong>on</strong> of thecanal is Mainly dependant up<strong>on</strong>the moisturec<strong>on</strong>diti<strong>on</strong> of foundati<strong>on</strong> soil. The canals withdifferent runs have diff:eredt';frost depths andheaving amounts. The lower part an&bot$ba of thecanal the heave aaount is great. reversely. at thetop part of the canal slope the heaving is small.The frost depth, heaving amount. and alloiabledisp"1aceaent of the canal )inning are the goveringparameters for canal design to prevet frost damage(11 Anguo, 1987),.,.THE HEASURES AGAJNST FROST DAl(qG.8 ' , ", I I# '-.Based <strong>on</strong> th'e research ,results.qu'ite 'a few ef-.-fective'. methods against frost damage have beenProvided and havwcreated a c<strong>on</strong>siderable amoantof ec<strong>on</strong>omic and societal benefits in practice.1.Thermal insulati<strong>on</strong>The <strong>on</strong>e these methods is using a water layer,If possible, a certain depth of water above thebottom plate of the structure in winter can keepthe foundati<strong>on</strong> sot1 unfrozen. The depth of watermay be c<strong>on</strong>sidered to be equal to 0.6 tiaes that ofthe soil frost depth of the corresp<strong>on</strong>ding site,Another method is placing a layer of rigid foamedplastic plate with a certain thickneess beneaththe foundati<strong>on</strong>. lining slabs of canal or <strong>on</strong> theback of retaining vall. The third nethod ia*torake the c<strong>on</strong>crete foundati<strong>on</strong> plate hollow. usingthe air in the cavity pocket to insolate heat.2. Replacement of soilThe n<strong>on</strong>-frost-heaving material of. sand andgravel is used to :replace the frost susceptiblesoils. The particles smaller than 0.05 mm In thereplaceuent meterial do not excaed 10% in weight.The replacement thickness usually is 0.75-1.0 ofthe frost dept and dependent <strong>on</strong> the distributi<strong>on</strong>of the horiz<strong>on</strong>tal frost heavine force,, al<strong>on</strong>r thedepth for retaining walls, Also. the impermeable!meterial is used and emb,edded into the foundati<strong>on</strong>soil to interrupt moisture migrati<strong>on</strong> a d eliminatefrost heaving.3.Structurl measures'
Different structural types that are effectualin preventing frost damage are applied: such asthe sluice type called the vord "-":the sluice withfoundati<strong>on</strong> in the fore of reversed placing box orreversed arch self anchoring piles involving thepile with the expanded foundati<strong>on</strong> plate, the pilevith exploding-expanding ends, and the pile withbottom beam; the wall c<strong>on</strong>sisting of precasthollow boxes filled with n<strong>on</strong>-frost heaving materialof sand gravel. etc: the .buttress retaining vallwith the buttress spans not exceeding the maximumfrost depth and the retaining structure withanchored slabs, etc. For the canal linings, thestru,ctural measures involve flexible structures,such as the embedded membrane lining and asphaltc<strong>on</strong>crete lining: the rigid structures. such asc<strong>on</strong>crete slab, c<strong>on</strong>crete slab with beam, c<strong>on</strong>cretcslab in the form of "n", wide-shallov c<strong>on</strong>cretccha!nel, arc c<strong>on</strong>crete channel, small rater troughof U" trpe(Li Anguo,l987); reas<strong>on</strong>able arrangementof deformati<strong>on</strong> seams fllled with flexible sealmaterial such as polyvinyl chloride ointment ortar plastic daub.4,The 'other measuresThe other measures involve evasive methods, suchas making the channel alignment to evade thelocati<strong>on</strong> with sol1 susceptive to frost heaving;adopting the canal i.n fill or cut-and-fill a8possible; adopting the tube the or overhead watertrouhg to transfer water: compacti<strong>on</strong> of clay orclayey loam foundati<strong>on</strong> soil to increase its den--sitr; strengthening the waterproofing of canal andsurface drainage; limiting the date of the canalbeing out af operati<strong>on</strong> prior to 5-10 days of theinitial date of the cold seas<strong>on</strong>; the date of waterrunning through canal in spring not being priorto the end of cold seas<strong>on</strong>: strengthenfng the main--tenance of the structures, etc.FUTURE DIRECTIONS AND RESPONSIBILITIESOver the years, gratifying achieveuents of pro--tect'ing hydraullc structure and canal Iinlng fromfrost damage have been made. Very many questi<strong>on</strong>s,hovever. need to be resolved. The study directi<strong>on</strong>and resp<strong>on</strong>sibllitiey in the future are mainly:'1.IntensKve studies <strong>on</strong> the lav of Soil frostheav and technigues of preventing frost damage, thecharacteristics of frost and frost heaving ofcanals, the methods Tor predicti<strong>on</strong>, classificati<strong>on</strong>standards of frost heaving for the foundati<strong>on</strong> soils2.Studying the formati<strong>on</strong> and developing mecha--nisms of frost heaving forces to select reas<strong>on</strong>ablemeasures of preventing frost damage.1.Perfecting measuring instruments and methodsof temperature, stress etc, used in laboratory and'in site, drawing unitive test operati<strong>on</strong> rules toincrease the accuracy of test data.4.Studying new materials, nev structures andmechanized c<strong>on</strong>structi<strong>on</strong> techniques to reduce workcost and quarantee c<strong>on</strong>structi<strong>on</strong> quality.5.To sommarize further the experiences in pre--venting frost damage, spreading presented results,raking them real productive forces.REFERENCE1.Li Anguo and Han Shujian, 1987. Brie-ducti<strong>on</strong> of Antifrost Technique of CanaEngineering & Frozen Sei!: NO 4 .f Intro-1 Llnlng.2.Sui Tleling, Ma WenJle and ti Dazuo, 1990,Distributi<strong>on</strong> - .- . .. . of Horiz<strong>on</strong>tal Heaving Force <strong>on</strong> TestRetaining Wall. Proc.4th Hat. C<strong>on</strong>f <strong>on</strong> Glaciologyand Ceocrrology(se1ecti<strong>on</strong>).3.Wang Siyao. 1982, Frost Heave and It8 Distri--buti<strong>on</strong> in Different Layers Influenced by ShallowGroundwater,Journal of Glacioloey and Crropedology.Vol. NO 2.4.Vang Liang, Xu Bomeng and Vu Zhijin, 1983.Property .of Soil Freezing-Thawing and Earth DamC<strong>on</strong>structi<strong>on</strong> in Winter. Proc 4th Int. C<strong>on</strong>f, <strong>on</strong><strong>Permafrost</strong>.5.Xu Bomeng etc. 1990, Preventi<strong>on</strong> and C<strong>on</strong>trolof Frost Danage of Hydraulic Structures, JilingScience and Technology Publishing House, China.6.Xu Bameng,l98&. Study <strong>on</strong> Preventi<strong>on</strong> andC<strong>on</strong>trol Technique of Hydraulic EngineeringinNortheast Regi<strong>on</strong>, Engineering and Frozen Soi1,No.l.7.Xu Shaoxin,l987, Revier of the Study <strong>on</strong> FrozenSoil in Hydraulic Engineering of Our Courtrr,Engineering and'Frozen Soil, Ho.4.8.Xu Shaoxin, 1989, Frost Heaving Force <strong>on</strong>Foundati<strong>on</strong>s in Seas<strong>on</strong>al Frozen Ground Regi<strong>on</strong>, Proc.3rd Chinese C<strong>on</strong>f, <strong>Permafrost</strong> (selecti<strong>on</strong>).9.Zhu Dafu and Lin Suxlng,l986, A Frost HeaveClassificati<strong>on</strong> of Canal Base-Soil with C<strong>on</strong>creteLining and the Heasures Against Frost Damage,Journal of Glaciology and Geocryolosr. vo1.8, No.3.10.Zhu Piang,l990, Quantitative Study <strong>on</strong> BasicRelati<strong>on</strong> between Frost Heave of Canal Base-Soil,Eglneering and Frozen Soil, No.1.1294
UNFROZEN WATER CONTBNT IN MULTWRYSTAL ICEXu Xiaozu', Zhang Lixin', Dcng Youshcng', Wang Jiacheng'IU.P.Lebdenko2and E.M.ChuvilinZ'State Key Laboratory of From Soil Engineering, IGGAS,PRC'Geology Faculty of Moscow State University, RussiaAn artificially large crystal iw was smashed and divided into four groups with the grain sizes of 10,7-3, 3-1, and < Imm, respectively. Tbe unfrozen water c<strong>on</strong>tent of multi-crystal ice was determined bythe nuclear magnetic res<strong>on</strong>an= technique and by calorimeter. Four factors influencing the unfrozenwater c<strong>on</strong>tent in multi-crystal ice, including grain sizd of ice, interfaces between crystals, freezing speedand air c<strong>on</strong>tent in water, were investigated. Results show that the unfrozen water c<strong>on</strong>tent increases withdecreasing of grain size of ice. The unfrozen water c<strong>on</strong>tent between interfaces of ice-water-ice is greaterthan that of ice-water-air. By using deaerated water and a quick freezing, we can obtain greatermulti-crystal of icc than the undcaeratcd water and a lower unfrozen water c<strong>on</strong>tent if other c<strong>on</strong>diti<strong>on</strong>sare the same.INTRODUCTION ,The basic difference between froztn and unfrozen soils is thatice exists in frozen soils. The ice c<strong>on</strong>tent and ita property in frozenmils are of p at significance for physical and mechanical propertiesof frozen soils. And the ice c<strong>on</strong>tent and its property depend <strong>on</strong>the unfrozen water c<strong>on</strong>tent in ice to a large extent. A lot of previouswork has been d<strong>on</strong>e <strong>on</strong> unfrozcn water c<strong>on</strong>tent in frozen soils(h4.Anders<strong>on</strong> et. a1.,1974, A.R.Ticc et. a1.,1978, E.D.Ershov, 1979),but seldom dealt with unfrozen water c<strong>on</strong>tent in multi-crystal ice.Xu Xiaozu determined the unfrozen water c<strong>on</strong>tent in ice made bydistilled water (1987), but didn't describle the changing regularityof unfrozen water c<strong>on</strong>tent in multi-crystal ice.SAMPLE PREPARATIONTo obtain multiGcrysta1 ice with different grain sizes, it is ne&essary to prepare large crystal ice first. Therefore, we pour distilledwater into a plexiglass c<strong>on</strong>tainer with the size of 15 cm in diameterand 25 cm high. The temperature at the water surface is ,kept at zeM or slightly below zero degrees ccntigrade. The side of the c<strong>on</strong>taineris surrounded by insulali<strong>on</strong> material. Water is graduallyfrozen from the top downwards. Usually, after <strong>on</strong>e week of freezingthe ice thickness may reach to about 10 cm and the diameter of theice crystal is larger than 10 mm. Taking <strong>on</strong>e sample from this massiveice as the sample with a grain size of larger than 10 mm. Afterthat the massive ice is smashed and sieved and divided into threegroups with a grain size of less than 1 mm, 1 to 3 mm and 3 to 7mm, respectively. Each group of mqti-crystal ice is divided intotwo subgroups. One subgroup is emerged in distilled water of zerodegrees centigrade and quick frozen again to create ice-water-iceinterfaces between ice crystals, and the other subgroup is keptwithout distilled water to create ice-water-air interfaces.To investigate the influence of freezing speed and air c<strong>on</strong>tentin water <strong>on</strong> the unfrozen water c<strong>on</strong>tent in multi-crystal ice, twoother samples are prepared. One sample is made with Water fromthe previous determined sample with the grain size of the ice crystalbeing larger than 10 mm and another sample made from deaeratedwater and both of them art frozen with a high sped. All of thesamples menti<strong>on</strong>td above are frozen at minus 20 degrees centigradefor 5 hours and arc determined by the nuclear magnetic res<strong>on</strong>ancetechnique in a warming cycle and by a calorimeter.RESULTS AND ANALYSISAs a kind of grained material, ice crystals, like soil particles,can absorb a certain amount of unfrozen water under the c<strong>on</strong>diti<strong>on</strong>of the temperature being bclow zero degrees centigade because ofthe existence of free energy at the surface of particles. Figure 1shows the curves of unfrozen water c<strong>on</strong>tent 1s. temperaturc for theice crystals with the different grain sizes menti<strong>on</strong>ed above. It can beseen from figure 1 that the unfrozen water c<strong>on</strong>tent increascs withdecreasing of temperature in the power form. From figur 1-a it canbe seen that if the temperature is the same, the unfroztn water c<strong>on</strong>tentof multi-crystals of ice changes with the grain size of ice crystaland can be divided into three groups: the minimum a grain sizeis larger than 10 rnm, the middle grain size is from 1 to 7 mm andthe maiimum grain size is less than 1 mm. The difference of frozenwater c<strong>on</strong>tent curves for ice grain size less than 7 mm is not greatbecause of the difference of ice grain size being less after water is filledand being quickly frozen. From figure l-b it can be seen thatunder the c<strong>on</strong>diti<strong>on</strong>s of ,ice-water-air interface and quick freezingthe changing regplarity of unfrozen water c<strong>on</strong>tent with temperatureis the same as shown in figure I-a, but the maximum of unfrozenwater c<strong>on</strong>tent for the case of IWA is less.The curves in figure 1 can be expressed by the regressive equati<strong>on</strong>sshown in table l. From table 1 it can be seen that the relatedcoefficients are greater than 0.94.1295
3.5 1 a'1d= 7-3-II1I\ITemperatureOCATemperature "C31d-3-lmm2{ IWAIIIII.Temperature 'CTemperature "CBd< ImmI1IFig.1 Unfrozen water c<strong>on</strong>tent in multicrystd i a with differentgrain sizes VI. temperature (A-for the WI case. and B-for the IWAcase). Figure 2 shows the curvesof unfrozen water c<strong>on</strong>tent vs. temperaturefor multi-crystal ice with grain size leas than 7 mm and interfaceof ice-water-ice and ice-water-air respectively. Prom figure2 it can be seen that if temperature is the same, .the unfrozenwater c<strong>on</strong>tent of multi-crystalice with interface of ice-water-ice ishigher than that with interface of icewater-air. There is no muchdifference for different grain sizts.Figure 3 shows the curves of unfrozen water c<strong>on</strong>tent VS. temperaturefor samples of grain size larger than 10 mm and deaeratedand undeaerated distilled water being quickly frozen. Prom figure 3it can be seen that if the temperature is the same, the unfrozen waterc<strong>on</strong>tent of t$e sample made by undeaerated distilled water beingquickly frozcn is much greater than that of the sample with grainsizez greater than 10 mm. It indicates the freezing rate has a greatinfluence <strong>on</strong> the unfroztn water c<strong>on</strong>tent. Microscope observati<strong>on</strong><strong>on</strong> the thin secti<strong>on</strong> indicatm that the freezing rate influeces thegrain size of ice crystals. The higher the freezing rate, the less the icecrystals is and the less the ice cryatal, the higher the unfrozen waterc<strong>on</strong>tent. Compared with the unfrozen water c<strong>on</strong>tent of the deacratedsnmple, the unfrozen water c<strong>on</strong>tent of the undeaerated sample ishigher even if the freezing c<strong>on</strong>diti<strong>on</strong> is the same. Microscope observati<strong>on</strong>indicates that the grain size of the deaerated sample is gteaterthan that of the undeaerated sample.CONCLUSIONSThe unfrozen water c<strong>on</strong>tent of multi-crystal ice is c<strong>on</strong>trolledby the grain. size and the interface between ice crystals. If other-20 -15 -10 -5 0Temperature 'C~ig.2 Unfrozen water c<strong>on</strong>tent of multicrystal ice with different, interfacesTable 1 Regressive equati<strong>on</strong> of unfrozen water mntentof multi-crystal icefgrain regressive coefficient relatedsize,mm equati<strong>on</strong> A B cocffcient> 10-0.05498 1.08953-1-0.04259 1.07233-7 *-0.05224 1.30451-3-0.04568 1.08381-3 * Y -(AX+Br -0.05967 1.3170
,\D>lOmmI vacuum TT- unvacumm8 TtTemperature "CCFig.3 Unfrozen water c<strong>on</strong>tent in multicrystal ice with deaeratcdand undeaerated water quickly frozenc<strong>on</strong>diti<strong>on</strong>s are the same, the unfrozen water c<strong>on</strong>tent of multi-crystalice increases with decreasing grain size and with increasing icec<strong>on</strong>tent.The freezing rate and air c<strong>on</strong>tent in the sample are the importantfactos for the grain size of ice crystal formati<strong>on</strong>. If other c<strong>on</strong>diti<strong>on</strong>sare the same, grain size of ice crystals decreases with an increasein the freezing rate and air c<strong>on</strong>tent.The maximum of unfrozen water c<strong>on</strong>tent for IWI and IWA interfaceis less than 3.5 and 1.5 %, respectively.ACKNOWLEDGEMENTSThe authors wish to express their thanks to senior engineer,Tao Zhaoxiang and Mr. Gu T<strong>on</strong>gxin for their determinati<strong>on</strong> bycalorimeter. This work is very important for calibrati<strong>on</strong> ofunfrozen water c<strong>on</strong>tent taken from NMR.REFERENCESAnders<strong>on</strong>,D.M., TI=, A.R. and Banin A., 1974, The water-icecompositi<strong>on</strong> of Clay / water system, CRREL <strong>Research</strong> Report322, pp.10.Tim, A.R., Burrows,C.M. and Anders<strong>on</strong>, D.M., 1978, Phase compositi<strong>on</strong>measurements <strong>on</strong> soil at very high water c<strong>on</strong>tents bythe pulsed nuclear mapetic resodance technique, reprintedfrom Moisture and frost-related soil properties, Transportati<strong>on</strong><strong>Research</strong> Board, Nati<strong>on</strong>al Academy of Sciences, pl1-14.Xu Xiaozu, Oliphant. J.L. and Tice,A.R., 1987, Factors affectingwater migrati<strong>on</strong> in frozen soils, CRRBL Rport 87-9,pp16.Ersh0v.A.D.. 1979, Water phase compositi<strong>on</strong> of frozen soh,Moscow Univershy Publishing House, pp189.1297
THE THAW SETTLEMENT OF RAILWAY FOIJNDATIONSTN PERMAFROST SWAMP REGIONSYang Hair<strong>on</strong>g' Liu Tieliang' and Guan Zhifu2'Northwestern Institute, Railway Ministry Academia, China2Gingwu nepartment of Railway Bureau in Harbin, ChinaIn the permafrost swamp areas of northeast China, thaw settlement is <strong>on</strong>e of themain causes of damage to railway foundati<strong>on</strong>s, which are very difficult to repair.Since the establishment of the line, sucessive reparative measures have beentaken, but they have not been effective and the damages c<strong>on</strong>tinue to worsen.Through observati<strong>on</strong> and analysis of thaw settlement of railway foundati<strong>on</strong>s, inthe permafrost swamp regi<strong>on</strong>s in China, a summary of the theoretical and syntheticcountermeasures is given to prevent thaw settlement using industrial materialfor water insulati<strong>on</strong>.SURVEY OF NATURAL GEOGRAPHYThe permafrost regi<strong>on</strong> of Da Hinggan Ling isloc~t.etl in the eastern fringe uf Nei Meng Guand in the northwest of Heil<strong>on</strong>gjiang. Thewinter is frigid and l<strong>on</strong>g, with the period ofncgotivc temperatures c<strong>on</strong>tinuing for around7-8 m<strong>on</strong>ths, the summer is short. The highesttemperature is about 36"C, in the north, theextreme lowest temperature is -52.3"C. Theyearly,average temperature is -2 - -6.2OC, theyearly precipitati<strong>on</strong> is 450-550 mm, and theyearly evaporti<strong>on</strong> is about 820 mm (Deer Buer).The altit-ude is between 500-1300 m, and therelative difference in elevati<strong>on</strong> is generallyless than 300 m. This regi<strong>on</strong> is <strong>on</strong>e'of themain distributi<strong>on</strong> areas of permafros in Chinaand swamp land has an extensive disdibuti<strong>on</strong>.The railway length crossing the permafrostregi<strong>on</strong> is about 530 km. Geological phenomena,such as pingo, icing, massive ice, et.c.,-makerailway c<strong>on</strong>structi<strong>on</strong> and operati<strong>on</strong> verydifficult.According to observati<strong>on</strong> and analysis ofpreventing settlement in the railway foundati<strong>on</strong>in the past, new methods of keeping ground waterand surface water from penetrating into therailway foundatiun have been researched and theevoluti<strong>on</strong>al tendency of settlement deformati<strong>on</strong>in the railway foundati<strong>on</strong> can be forecasted(Yuan Haiyi, 1987).THE LOW EFFECTIVENESS OF RRPAIRMENTSThe problem of settlement in the railwayfoundati<strong>on</strong> in permafrost regi<strong>on</strong>s mainly occursjn swamp secti<strong>on</strong>s with poor drainage,. In thepast, other than the step of c<strong>on</strong>trolling theheight of the embankment, the synthetic methodsof c<strong>on</strong>structing a berm in <strong>on</strong>e or two sides ofthe foundati<strong>on</strong> and the installati<strong>on</strong> of a laddershaped drainage ditch 20 m from the slope bottomwere used (Fig.1).Pig.1 Diagram of Embankment Berm1. Roadbed BermBerms installed in the foot of the slope ofthe roadbed /re most often used to prevent thawsettlement of the roadbed in permafrost regi<strong>on</strong>s.According to statistics, new berms were c<strong>on</strong>structedto prevent thaw settlement in swampregi<strong>on</strong>s from 1974 to 1990, and the extendeddistance is as l<strong>on</strong>g as 126.7 km. Through observati<strong>on</strong>,it has been shown that berms installedin settlement secti<strong>on</strong>s are effective at Eifst,but with time, settlement damage c<strong>on</strong>tinuouslyappears in parts of the roadbed. The causes ofthe thaw settlement and the ineffectiveness ofberm are analyzed as follows:(1) Effect of surEace water: Because of poordrainage in the drainage ditch or in the areaaround the slope bottom of the roadbed, groundwater and surface water accumulates in the slopebottom of the berm which causes heat to successivelypenetrate into the base of the roadbed.This causes n<strong>on</strong>-uniform deformati<strong>on</strong> of theroadbed and parts of the permafrost thaw underthe base of the roadbed. Successive heavyrains are <strong>on</strong>e of the direct causes of fastsettlement in the roadbed.(2) Effect of ground water (suprapermafrostwater). In secti<strong>on</strong>s with ground water, when thedrainage ditch cannot prevent surface water fromsuccessively supplied ground water, surface waterpenetrates into the ground and flows into theroadbed from the drainage ditch causing the berm1298
to lose its effectivity.(3) Ef,fect of berm without enough length.Joints are set up at the heavy settlementsecti<strong>on</strong>s of the roadbed berm but are not setup at slight settlement secti<strong>on</strong>s in the bermof .the road bed so they are often not c<strong>on</strong>nectedproperly.(4) Effect of ballast puddle ditch. Theballast in the upper-layer of permafrost belowthe roadbed forms a deep potshaped ballastpuddle ditch which isadvantageous for theaccumulati<strong>on</strong> of ground water. Based <strong>on</strong> investigati<strong>on</strong>s,ballast puddle ditches can be as deepas 2 m, Tf the ballast puddle ditch is notdealt with, even if berm is c<strong>on</strong>structed <strong>on</strong> <strong>on</strong>eor two sides of the raodbed, seas<strong>on</strong>al precipitati<strong>on</strong>penetrates into the base of the roadbedthrough the ballast puddle ditch causing thepermafrost below the base to thaw and causingroadbed settlement.(5) Effect of the filling material used inberm. Tatou tussock that grows locally is oftenused as filling material for berm in the northeastof China. But due to a lack of water thetatou tussock dies and rots, thus causing abiochemical reacti<strong>on</strong> which causes the temperatureof the frozen soil to rise al<strong>on</strong>g with therotting process. Meanwhile, its effect <strong>on</strong> theheat preservati<strong>on</strong> and insulati<strong>on</strong> heat graduallydecreases with time (Table 1). With time, themigrati<strong>on</strong> becomes dense, its effect of protectingagainst heat gradually worsens, so afterthe berm is c<strong>on</strong>structed the effect of preventingroadbed settlement gradually decreases.Table 1. Change table'of the coefficient thermalc<strong>on</strong>ductivity of tatou tussocklimitCoefficientthertnal 0.1063c<strong>on</strong>ductivityw/ mkGrass of Grass of Grass oforiginal berm after berm afterplace 2 years 10 years0.2745 0.5358(6) Effect of berm with enough height. The~urpose OC c<strong>on</strong>structing berm is to decrease theamplitude of the upper boundary in the slopefoot of the roadhed to keep the surface andground water from penetrating into the roadbedbase. So the rule of providing the berm withthe proper height and filled with tatou tussockor peat cannot hp less than 1.0 m. Rut inpractice, some berm do not have the abovementi<strong>on</strong>ed stipulated height.2. TlrainaRe Ditch(1) The distance of the drainage ditch farfrom the slope foot of the roadbed. The mainreas<strong>on</strong> for this was to keep the natural surfacenear the slopefoot from being destroyed by thedigging of the drainage di,tch and to prevent ,water from flowing into the frozen soil aroundthe ditch which would cause thawing and affectthe stabilitv of the roadbed. Practice verifiesthat the distance of the drainage ditch fromthe slopefoot should be 10 m. Drainage ditchesshould c<strong>on</strong>duct preventi<strong>on</strong> treatment, if not,even if the drainage ditch is- far from theroadbed, a large amount of settlement occurs inthe roadbed.(2) Shape of the draindge ditch. Ac<strong>on</strong>venti<strong>on</strong>al ladder shaped secti<strong>on</strong> is c<strong>on</strong>tinuallyused in drainage ditches in frazen soilregi<strong>on</strong>s. There are many problene with thisform, such as it is difficult 'to rnpstruct, itdoesn't have effective slope preventi<strong>on</strong> and itis easily blocked. The Googwu Qe'part.ment ofRailways, based <strong>on</strong> many years of practicalresearch, used a new shape for drainage ditches,an inverse "T" shape used <strong>on</strong> the heave secti<strong>on</strong>.The self buried principle was used far thepurpose of protecting the slope of the ditch inareas where thaw and collapse occur in thefrozen soil regivn.INDUSTRIAL MATERIAL USED FOR INSULATION AND_.WATER PREVENTION IN ROADBED SETTLEMENTRENOVATIONSRenovati<strong>on</strong>s are a basic step for preventing .surface and ground water from penetrating intothe base of the roadbed and for preventingsettlement of roadbeds in permafrost regi<strong>on</strong>s.In recent years, railway departments have usedintricate methods of renovati<strong>on</strong>, by buryingindustrial material for preventing water penetrati<strong>on</strong>into <strong>on</strong>e side of the upper reaches of theroadbed and for preventing ground water fromflowing into the roadbed. Based <strong>on</strong> the depthof ground water, the embedded depth of thewater preventi<strong>on</strong> material is divided into shallowand deep embedded depth.1. ShAllow depth: in t.he area with moreplentiful surface water and shallower groundwater (less than 1 m), when it is difficult for<strong>on</strong>e side of the upper reaches of the roadbed tovertically drain water, a large amount ofsurface and ground water may cross the roadbedAnd flow downwards causing the roadbed toseriously subside. In that c<strong>on</strong>diti<strong>on</strong>, themeasure of dredging and burying industrialmaterial for insulating against ground andsurface water penetrating into the r0adbe.d istaken. For example, in some roadbeds in the .northeast, fhe height at the center of theembankment Is 1.5-1.7 m, the roadbed has alarge amount 6f subsidence every year fromsurface water and shallow ground water crossingthe embankment Erom the upper side of the line.Thus, other than the c<strong>on</strong>structed berm in thesecti<strong>on</strong>, a two layered polystyrene foam slab ispaved at the bottom of the berm, and- a <strong>on</strong>elayered chloroprene rubber slab is paved underthat. The two kinds of slabs are verticallyburied to a certain depth under the aroundwater table 2.0 m from the slopefoot of theother side of the berm and standard berm isc<strong>on</strong>structed (FZg.2).After the water insulati<strong>on</strong> industrialmaterial is set up in the secti<strong>on</strong>, ground andsurface wat.er could not flow and penetrate intothe roadbed, but a large amount of wateraccumulated in the berm slopefoot at the sideof the upper roadbed. In order to eliminateharmful accumulating water <strong>on</strong> the roadbed or toprevent damage in the nearby roadbed secti<strong>on</strong>without water insulati<strong>on</strong>, a new culvert isc<strong>on</strong>structed in the lowest area of the roadbedso that water accumulati<strong>on</strong> in the slopefoot ofthe berm quickly drains and makes the base ofthe nearby embankment in a l<strong>on</strong>g-term dry state.In the low embankment, when the depth of theballast puddle ditch is more than 1 m, <strong>on</strong>e layerof soil material to prevent water penetrati<strong>on</strong>should be paved under the roadbed to preventthe damage from roadbed subsidence and forprotecting against potholes that allow rain to
Fig.2 Diagram of a buried shallow shapedinsulating water slabpenetrate into the embankment and the basethrough the ballast puddle ditch.2. Deep depth: whed the depth of the groundwater is deeper or themokarst lakes exis-t nearthe roadbed, because the water penetrates intothe roadbed base and produces a large amount ofsubsidence, the treatment method of using deeplyburied water insulating industrial material isused. An example is that there exist severalthermokarst lakes which are 7 m from the slopefootof the roadbed which has a height of 3-4 m,in order to prevent damage from a large numberof subsidences caused by the lake water pentratinginto the roadbed, water insulating industrialmaterial is buried in <strong>on</strong>e side above the roadbed.The Rround .water bearing bed is dug awayand a chloroprene rubber slab is verticallyburied, with the larRest buried depth being 4 m,then soil is refilled to the surface to form a"water stoppage wall", meanwhile the surfacewater between the slopefoot. of the embankmentand the water stoppage wall is prevented from 'penetrating into the roadbed and this preventssubsidence of the roadbed. On the other hand,a drainage ditch is coastructed and the originaldrainage ditch is renovatbd in the upper side ofthe thermokarst lake so that the surface watersupplying the thermokarst lake is cut off.Before renobati<strong>on</strong>. there is a little water flowin the original drainage ditch and in the nearbyroadbed. After renovati<strong>on</strong> a large amount ofwater flow obviously accumulates in the ditchand drains awly through the bearing culvert.After the above menti<strong>on</strong>ed secti<strong>on</strong> is renevatedby dredging and water insulati<strong>on</strong>, the finalresults are being observed at present.which is suited to a permafrost envir<strong>on</strong>ment haveobviously decreased. Aagiorpermous forest,fallow and herbaceous vegetati<strong>on</strong> which aresuited to extensively distributed talik envir<strong>on</strong>mentare incte@sing. Meanwhile the animal lifewhich is found in permafrost regi<strong>on</strong>s has beensignificantly changed (Shi Yafeng, 1986).Because the global climate is rapidly becumingwarmer the southern boundary of permafrost willvahish frum the Da Hinggan Ling regi<strong>on</strong> in Chinaby the year 2030. The degenerative process ofpermafrost in this regi<strong>on</strong> will also be furtheraggravated by the increasing development andc<strong>on</strong>structi<strong>on</strong> taking place. This process willhappen very quickly so that in the next tenyears the original compositi<strong>on</strong> and cryogenictexture of the frozen soil layer will beseriously changed. The bearing capacity ofpermaf,rost and thawing soil will be obviouslydecreased after the temperature rises, thedeformati<strong>on</strong> capacity will quickly increase andthaw settlement acti<strong>on</strong> will also increase.Meanwhile a large number of engineering buildingswill be destroyed by many deformati<strong>on</strong>s. Inrailway roadbeds in permafrost swamp regi<strong>on</strong>sthere will be produced lasting, undepleated andlarge scale thaw settlement so the questi<strong>on</strong> ofthaw sertlement in roadbeds which is originallydifficult to renovate will become more intricate.How this situati<strong>on</strong> will be handled can not bedetermined at present.EXFERENCtSShi Yafeng,(l986) Big Changes in Climate andXnvir<strong>on</strong>ment will Appear in Whale Earth,Scientific Newspaper, 3.29.Yuan Haiyi, (1987) Definating <strong>Permafrost</strong> in DaHinggan Ling Regi<strong>on</strong>, Proceedings of the ThirdChinese <str<strong>on</strong>g>C<strong>on</strong>ference</str<strong>on</strong>g> <strong>on</strong> <strong>Permafrost</strong>, PublishingHouse of Science.DBVELOPMENT TREND OF SUBSIDENCE DAMAGE OFROADBEDS IN THE FUTURESince the last cencury, permafrost in undevelopedregi<strong>on</strong>s in Da Hinggan Ling of China is inthe stage of degenerati<strong>on</strong> due to the gradualwarming of the climate. In fact, not <strong>on</strong>ly theclimate has the trend of warming in Da HingganLing regi<strong>on</strong>, but the permafrost as well, whichhas produced regi<strong>on</strong>al degenerati<strong>on</strong> in the southand southwest regi<strong>on</strong>s, these regi<strong>on</strong>s have notbeen influenced by human activity in the lastten years according to observati<strong>on</strong>s. Theexisting animal and plant life have beengreatly changed by permafrost degenerati<strong>on</strong>, sothe plant coenosium and animal type thatoriginally existed in the reRi<strong>on</strong> have seriouslychanged.In the southern regi<strong>on</strong>s with permefrostdeRenerati<strong>on</strong> not effected by human activity(such as the upper reaches of the Nanwen riverand Hala river), latch, pinus sylvestris, etc.,
THAW-CONSOLIDATION OF UNSATURATEDFROZEN SOILY<strong>on</strong>g Lifeng, Xu Bomeng and Lu Xingliang<strong>Research</strong> Iistitute of Water C<strong>on</strong>servancy Committee of S<strong>on</strong>ghua-Liao Rive Basin, ChinaIn recent years, wc have c<strong>on</strong>ducted research <strong>on</strong> the thaw-c<strong>on</strong>solidati<strong>on</strong> of unsaturated frozen soils. Takingloam obtained from the right tank of Weil<strong>on</strong>g River as an example, the research results arc discussed.The results indicate that the saturati<strong>on</strong> of frozen soils has an important effect <strong>on</strong> theirthaw-c<strong>on</strong>sloidati<strong>on</strong> properties. C<strong>on</strong>sequently, the quantitative evaluati<strong>on</strong> of thaw-c<strong>on</strong>solidati<strong>on</strong> offrozen soil should be determinde in terms of its saturati<strong>on</strong>. For unsaturated frozen soils, thaw-c<strong>on</strong>solidati<strong>on</strong>properties will be affected not <strong>on</strong>ly by their moisture c<strong>on</strong>tent, but also by dry densities. Comprehensiveeffect of the both factors <strong>on</strong> thaw-c<strong>on</strong>solidati<strong>on</strong> properties would not be the same as that ofsaturated from soils. Based <strong>on</strong> the test data, the cquati<strong>on</strong>s of calculating thaw-c<strong>on</strong>solidati<strong>on</strong>coefficients of frozen soils are presented.- INTRODUCTIONThe c<strong>on</strong>structi<strong>on</strong> experiencein cold regi<strong>on</strong>s tells uq that infrozen ground, cxpecially in permafrost z<strong>on</strong>es. thaw-c<strong>on</strong>solidati<strong>on</strong>of frozen foundati<strong>on</strong> soil is the main causc of the engineering struoture settlement, even damage. Thus, in years of study, the principlesand features of thaw-c<strong>on</strong>silidati<strong>on</strong> of frozen soil is <strong>on</strong>e of the mostimportant research areas.The previous investigati<strong>on</strong>s(Wu Ziwang 1981,Chcng Xiaobo1981, Zhu Yuanlin 1982 and T<strong>on</strong>g Changjiang 1985 'et al.) showthat thaw-c<strong>on</strong>solidati<strong>on</strong> of froun soils were mostly evaluated bythe moisture c<strong>on</strong>tent. Strictly speaking, it is suitable <strong>on</strong>ly for thesaturated frozen soil but not for unsaturated frozen soil. Tocorrectly evaluate the thaw-c<strong>on</strong>solidati<strong>on</strong> properties of unsaturatedfrozen soils, taking loam as an example, we have c<strong>on</strong>ducted experimentalresearch and obtained the special law which dcscribesthe multiple influence of dry density and moisture c<strong>on</strong>tent <strong>on</strong> thethaw-c<strong>on</strong>solidati<strong>on</strong> of unsaturated frozen soils.TEST CONDITIONSExperiments were carried out <strong>on</strong> the frozen soil thaw"compressi<strong>on</strong>meter. The soil samples c<strong>on</strong>sisting of medium-loam andhcavy-loam were obtained from the right bank of Heil<strong>on</strong>g River.To bring to light the law of thaw-c<strong>on</strong>solidati<strong>on</strong> properties offrozen soils, besides a fcw experiments made undisturbed frozensoil samples, we mainly carried out simulated tests with the soilstaken from in-site. Firstly, roil samples were prepared to have differentdry densities and moisture c<strong>on</strong>tents, then frozcn in single directi<strong>on</strong>.The samples were 2.5cm high with diameter of 6.4cm. Thepreload <strong>on</strong> the samples was 0,OlMPa. The thaw-c<strong>on</strong>solidati<strong>on</strong>deformati<strong>on</strong> was directly measured with a micrometer.ANALYSIS OF TEST RESLJLTS- . . . . .. . . . . . . . -Thc magnitude of thaw-c<strong>on</strong>solidati<strong>on</strong> is directly govcrned h!,the decrease in porosity, which is related to the dry dcnsitv andmoisture c<strong>on</strong>tent.When I'rozen soil is in saturated c<strong>on</strong>diti<strong>on</strong>, the moiqturc anddry density or porosity have a quantitative telatyi<strong>on</strong> as Ibllows(YinZhijan,l980) *Gr, w"- I(1)rwG - rlorGw=e (2)where G is specific gravity of the soil grain: W, r,and e are the saturatedmoisture c<strong>on</strong>tent, dry density and porosity of frozen soil,rcspectively:r,is the density of pure water at 4OC.Thcrefore. the saturated moisture c<strong>on</strong>tent may be trtken tocharacterize the magnitude of the void ratio, the reverse is ture.Thus the general effect of saturated moisture c<strong>on</strong>tent and dry density(or porosity) <strong>on</strong> the frozen soil thaw-c<strong>on</strong>solidatipn may betermed as single effect of moisture c<strong>on</strong>tent or dry density. namely,thaw-c<strong>on</strong>solidati<strong>on</strong> coefficient A, (relative thaw-c<strong>on</strong>solidati<strong>on</strong>quantity expressed as a percentage) may be expressed as follows.orA, = f~ (W) (3)A, =f, (rd) (4)However, when frozen soil is in an unsaturated c<strong>on</strong>diti<strong>on</strong>,there is not a definite quantitative relati<strong>on</strong> between motsture c<strong>on</strong>.tent and dry density ( or void ratio). Thus, depending up<strong>on</strong> thec<strong>on</strong>diti<strong>on</strong>s of dry density and moir,:ure c<strong>on</strong>tent, the thaw-c<strong>on</strong>solidati<strong>on</strong>characteristics of unsaturated frozen soils will be not the
0,97("-same as that of saturated frozen soil. Based <strong>on</strong> the testdata, the cates that the initial thaw-c<strong>on</strong>solidati<strong>on</strong> moisture c<strong>on</strong>tent is closethaw-c<strong>on</strong>solidati<strong>on</strong> characteristics of unsaturated frozen soil are to the plastic limit w, of the soil. The data in fig.] show that therediscussed.is a similar c<strong>on</strong>clusi<strong>on</strong> obtained by the author of using unsaturatedsail. Thtkby, in ,pr&tice, when the initial thaw-c<strong>on</strong>solidati<strong>on</strong>The Relati<strong>on</strong> of Thaw-C<strong>on</strong>solidati<strong>on</strong> Coefficient to Dry Density moisture c<strong>on</strong>tent,is unknown, it may be replaceed with wI.and Moisture C<strong>on</strong>tent The objective of the initial existance thaw-c<strong>on</strong>solidati<strong>on</strong> moisturec<strong>on</strong>tent means that <strong>on</strong>ly the part of the natural moisture c<strong>on</strong>-The test results indicate that thaw-c<strong>on</strong>solidati<strong>on</strong> characteris- tent over the initial.thaw-c<strong>on</strong>solidati<strong>on</strong> moisture c<strong>on</strong>tent is the ef.tics of frozcn soils depends up<strong>on</strong> both dry density and moisture ficient moisture causing the thaw-c<strong>on</strong>solidati<strong>on</strong> process of frozenc<strong>on</strong>tent, the test data is ploted in Fig.1. The general tendency is that soil. Thus, in general, this part of moisture is called the efficientwith either of dry density or moisture c<strong>on</strong>tent changing, variati<strong>on</strong> thaw-c<strong>on</strong>solidati<strong>on</strong> moisture c<strong>on</strong>tent W, (Zhu Yuanlin 1982),of thaw-c<strong>on</strong>solidati<strong>on</strong> coefficient would take place, which is obvi- namelyw, = w-w, (5)The efficient thaw-c<strong>on</strong>solidati<strong>on</strong> moisture c<strong>on</strong>tent essentiallyreveals the effect of moisture c<strong>on</strong>tent <strong>on</strong> thaw-c<strong>on</strong>solidati<strong>on</strong> characteristics.The Law of Combined Effect of Dry Density and Moisture <strong>on</strong>fheThaw-C<strong>on</strong>solidati<strong>on</strong> Property of Frozen Soilw (%)Fig. I Relati<strong>on</strong>ship of A, with r,and w(heavy silty loam, W,= 17%)ously different from the thaw-c<strong>on</strong>solidati<strong>on</strong> characteristics of saturatedfrozen soils.Simultaneously, the thaw-c<strong>on</strong>solidati<strong>on</strong>cocficient decreases with dry density increasing and moisture c<strong>on</strong>tentdecreasing.It is not dimcult to understand the phenomena menti<strong>on</strong>edabove. It is well kmownthat in geotcchnique, dry density and voidratio are the two indexs describing thc density of soil. The highdensity of soil shows the intErvals of soil grains being small, andccrtainly,the relative displacement between soil grains in thethaw-c<strong>on</strong>solidati<strong>on</strong> process would be small, Thus, the thaw-c<strong>on</strong>solidati<strong>on</strong>cQefficient is in inverse proporti<strong>on</strong> to dry density. Besides,in the process of soil freezing, the compactive acti<strong>on</strong> <strong>on</strong> thesoil grains formed by the ice crystals strengthcns as moisture c<strong>on</strong>tentincreases. Such acti<strong>on</strong> to thaw-c<strong>on</strong>solidati<strong>on</strong> can not becaught up by the dcad weight. Thus, even if two samples have thesame dry density, while their moisture c<strong>on</strong>tents are different, thethaw-c<strong>on</strong>solidati<strong>on</strong> coefficient for the two samples will be not thesame. In this c<strong>on</strong>diti<strong>on</strong> the higher the moisture the greater thethaw-c<strong>on</strong>solidati<strong>on</strong> coemcient is. 'Besides, it can also, be seen from fig.1 that undcr unsaturatedc<strong>on</strong>diti<strong>on</strong>s, the initial moisture c<strong>on</strong>tent of frozen soil thaw-c<strong>on</strong>solidati<strong>on</strong>w, is not a definite value as it is under saturatedc<strong>on</strong>diti<strong>on</strong>s. At this time, it varies as dry density changes althoughthe range of such variati<strong>on</strong> is smaller. The research.c<strong>on</strong>cerned <strong>on</strong>the initial thaw-c<strong>on</strong>solidati<strong>on</strong> moisture c<strong>on</strong>tent of frozen soil indi-In summary, in order to reflect the combined effect dry of densityand moisture c<strong>on</strong>tent <strong>on</strong> the thaw-c<strong>on</strong>solidati<strong>on</strong> property offrozen soil, the test data were arranged, taking RW,/ r, as a vari- 'able and replacing the initial thaw-c<strong>on</strong>solidati<strong>on</strong> moisture c<strong>on</strong>tentby plastic limit. The results are shown in fig2 It is illustrated in thisfig. That there-exists a good linear relati<strong>on</strong> between the thaw-c<strong>on</strong>solidati<strong>on</strong>coefficient of heavy loam and variable. It is dem<strong>on</strong>stratedfrom this that taking R = W, / rd as a variable can reallyreflect the inherent law of the combined effect of dry density andmoisture c<strong>on</strong>tent <strong>on</strong> the thaw-c<strong>on</strong>solidati<strong>on</strong> coefficient. By analyzingwith the fkst square method, the optimum probable value ofthe thaw-c<strong>on</strong>solidati<strong>on</strong> coefficient A, of frozen heavy silty loamcan be obtained as followsw- wpA ~ - 0.02)(6)rd(Coefficient of correlati<strong>on</strong> r = 0.98)Similarly, using the above menti<strong>on</strong>ed method, the relati<strong>on</strong> ofthaw-c<strong>on</strong>solidati<strong>on</strong> coefficient of medium loam to its dry densityand moisture c<strong>on</strong>tent can also be obtained as followsw- wvpAD = ].I(- - 0.0039) (7)rd(Coefhient ofcorrelati<strong>on</strong> r=0.99)It can be seen frbm above two .formulas that while A,=O,(W-W,) / rd is a c<strong>on</strong>stant, namely(W-W,)/rd=B (8)In other words, under unsaturated c<strong>on</strong>diti<strong>on</strong>s, when the relati<strong>on</strong>between moisture- c<strong>on</strong>tent and dry density is satisfied, thethaw-c~nsolidati<strong>on</strong> phenomen<strong>on</strong> would not occur. In formula (81,B is the parameter c<strong>on</strong>cerned with soil properties.
3PPig.2 Variati<strong>on</strong> of A, vs. (w-w,) / r,Experimented Values (Ae, YO)Pig.3 Comparisi<strong>on</strong> of computed and tested values of A,Verifying and DiscussingWhile putting the computed values of formulas (6) and (7) tobe compared with corresp<strong>on</strong>ding test values(Fig.3). as will be readilyseen, both of them coincide well. Most of the relative errors bptween computed and test values do not exceeds 15%.Having formula (8) simply changed, we asn obtainWe= W,+Br, (9)which verities the above related analysis that under unsaturatedc<strong>on</strong>diti<strong>on</strong>s the initial thaw-c<strong>on</strong>solidati<strong>on</strong> moisture c<strong>on</strong>tent offrozen soil is in direct properti<strong>on</strong> to dry density,In existing informati<strong>on</strong>, the combined effect of dry density andmoisture c<strong>on</strong>tent <strong>on</strong> thaw-c<strong>on</strong>solidati<strong>on</strong> of frozen soils is not c<strong>on</strong>sidered,the belief being that either of then may be used to expressthaw-c<strong>on</strong>solidati<strong>on</strong> characteristics of frozen soils: As a c<strong>on</strong>gequance, two formulas c<strong>on</strong>sidered to be equivalent wire derivedfrom dry density and moisture c<strong>on</strong>tent, corresp<strong>on</strong>dingly. Both experimentsand computati<strong>on</strong>s indicate that <strong>on</strong>ly under saturatedc<strong>on</strong>diti<strong>on</strong>s can the two formulas be equivalent and unitive, that isto say, what is expressed by them is the thaw-c<strong>on</strong>solidati<strong>on</strong> properties in a given c<strong>on</strong>diti<strong>on</strong> of saturated soil. Therefore, they are notsuitable for unsaturated soils. Whereas, formulas (6) and (7) haveunitedly reflected the multiple effect of dry density and moisturec<strong>on</strong>tent <strong>on</strong> thaw-c<strong>on</strong>solidati<strong>on</strong> properties of Frozen soil, eliminatingcalculated deviati<strong>on</strong>s from using different formulas.CONCLUSION -. ."The following c<strong>on</strong>clusi<strong>on</strong>s are obtained from thisinvestigati<strong>on</strong>:1. Under unsaturated c<strong>on</strong>diti<strong>on</strong>s, the thaw-c<strong>on</strong>solidati<strong>on</strong>properties of frozen soils depend up<strong>on</strong> the combinative effect of drydensity and density and moisture c<strong>on</strong>tent, the law of which isA. =A( w- wr*where A and B are parameters c<strong>on</strong>cerned with soil properties.2.Under unsaturated c<strong>on</strong>diti<strong>on</strong>, the initial thaw-c<strong>on</strong>solidati<strong>on</strong>moisture c<strong>on</strong>tent, plastic limit and dry density satisfy following relati<strong>on</strong>shipW, = W,,+Br,3.The calculated values obtained by-the formulas in this papercoincide well with the experimental results, the relative deviati<strong>on</strong>betwcen them does not exceed 15% in general.4.Through the study of thaw-c<strong>on</strong>solidati<strong>on</strong> properties ofunsaturated frozen soils, it is indicated that the method used in thisstudy has generality without being limitted by soil properties. Itmay also give as a reference to the thaw-c<strong>on</strong>solidati<strong>on</strong> propertiesof seas<strong>on</strong>ally frozen soil.REFERENCES"Wu Ziwang etal, 15181, Preliminary studyof thawing-sinkingcharacte-ristics of frozen soils, Professi<strong>on</strong>al .Papers ofLanzhou Institute of Cryopedology, Chinese Academy of SciencesNo.2, Science Press, Bei jng.Chen Xiaobo, 1981, The thawing-sinking and compressi<strong>on</strong> Charaoteristics of frozen soils of Muii regi<strong>on</strong>, Qilian mountains, Professi<strong>on</strong>alPapers of .Lanzhou Institute of Cryopedoligy, Chinese' Academy of Sciences, No.2, Scienq Press, Bcijing.T<strong>on</strong>g Changjiang, 1985, Thaw-c<strong>on</strong>solidati<strong>on</strong> behavior ofseas<strong>on</strong>ally frozen ground, Fourth Int. Symp. <strong>on</strong> Ground Free2ing,pp.l59-163.Yin Zhijian et al, 1980, Geotechnics and Foundati<strong>on</strong>,Pub.C<strong>on</strong>structi<strong>on</strong>al Industry,Beijing,China.Zhu Yuanlin et al, 1982, The thawing-sinking of frozen soils, Proceedingsof Chinese Society of Glaciology and Geocryology<str<strong>on</strong>g>C<strong>on</strong>ference</str<strong>on</strong>g> (Selecti<strong>on</strong>, Geo-cryology), Science Press, Beijing,China.- 1303
NOTCHED CHARPY BAR IMPACT TEST ON FROZEN SOILIYu QihaoZhu YuanlinINTRODUCTIONIn permafrost regi<strong>on</strong>s many engineering were in progress, suchas making foundati<strong>on</strong>s of buildings, highway and bridges, water'c<strong>on</strong>servancy projects und exploring minerals and so <strong>on</strong>. N<strong>on</strong>e ofthem has no relati<strong>on</strong>ship with excavating of frozen soil. In this case,some problems about the excavating strength of frozen soil weeinvolved. For lacking of cxpermeatal data and theoritical guid. engineerscould not design the machines efftctively and ec<strong>on</strong>omicalyto process the frozen soil (Zhang S. X., 1992). So the study <strong>on</strong> suchproblem is of great significiancc for the designing of the excavatingmethod of frozen soil in various propcts.There are <strong>on</strong>ly a few materials about the cutting and Smpactingpenetrati<strong>on</strong> strength of frozen soil. The earliest studies started in1950s. The institute of exploring mineral in USSR applied a standardcut with a simple ecti<strong>on</strong> (flat wedge) to study <strong>on</strong> the cuttingstrength of fromn soil (a. A. Cuitocich, 1985). At the same time,the institute of road in USSR adopted a standard impacting headto study <strong>on</strong> the strength of frozen soil. In recent period, with theneeds of projects, Zhang Zhaokiang (zhang S.X.. 1992) from Beijing Agriculture Engineering University did a deep research <strong>on</strong> theprocess and speciality of the impacting penetrati<strong>on</strong> with sclf-designed quick triaxis experiment plate and auto-impactingpenetrator. Meanwhile he did some experiments <strong>on</strong> the cuttingstrength of frozen soil. In the same period, Wang Shuwen (WangS.W., 1989) studied oh the relati<strong>on</strong>s am<strong>on</strong>g the impacting pcnctrati<strong>on</strong>index, impacting penetrati<strong>on</strong> resistance and the various influencingfactors and hargot some good results. In additi<strong>on</strong>, Ladanyi(Ladanyi, 1976) has also d<strong>on</strong>e some experimcnts <strong>on</strong> impacting penetrati<strong>on</strong>of frozen soil at different impacting speed. 'The purpose of this study is to investigate the effect of temperature,water c<strong>on</strong>tent and drydensity <strong>on</strong> the fracture absorbed energyof remolded frozen Lanzhou sand, Lanzhou silt and Wuxi clay.The test progrom was as follows: 1) the samples with samc dry density(sand and silt arc 1.5g / cm3,clay is 1.4g / cm') and differentwater c<strong>on</strong>tent (sand and silt from 8.9 to 18%, clay from 23.3 to28.8%) were tested at three different temperature -5, -10, -1S0C,respectively. 2) with same water c<strong>on</strong>tent (sand and silt are IO%,clay is 27.7%) and different dry density (sand and silt are 1.4 toI.SSg/ an3, clay is 1.3 to 1.45g/ cm?, the samples were also testedat three diffcrert temperature -5, -10, -15°C.SAMPLES AND THERE PREPARATIONThe materials used in this study was rcmolded Lanzhou sand,Zmnzhou silt and Wuxi clay. There main physical propcrities ure asTable 1, Table 2, and Figure 1.E3 :] \20100 10 1Equivalent spherical diameter"4Fig. 1 Cumulative mass percent finer vs. diameter of Wuxi clay
Table 1. Physical Parameter of SiltWSoil5.4 58.6 34.3 1.7 24.6 11.7\hR.2 ' n e Princblc of imDact machine1Table 2. Physical parameter of Lanzhou sandGrainsizc(mm) r0.5 0.5-0.25 0.25-0.1
where CVN is the absorbed energy, A and B are parameters$is minus temperature (°C),B,is a reference temperature (-1°C)The Jnflucnce of Water C<strong>on</strong>tent" ".The influence of' water c<strong>on</strong>tcnt <strong>on</strong> impacting test is similar tothat of temperature. The cementing ice c<strong>on</strong>tent increases with increasingof water c<strong>on</strong>tent under the same c<strong>on</strong>diti<strong>on</strong>s. This makesthe pores become more and more smaller. The strength of the samplesincreases. In terms of the absorbed energy, it also increaseswith the increasing of water c<strong>on</strong>tent (Fig.6, Fig.7, Fig.8). But thetrends are different for different types of soils. The results can bedescribed respectively as follows:for sand:CVN = (C * W+D) (3)Ffor silt:for clay:CVN ='w / (E. W+E) (4)CVN = GLogW+H * (5)where, CVN is the absorbed energy, W is the water c<strong>on</strong>tent, C, D,E, F, G,and H are test parameters.% c2001rd= 1.4 g/cm'. 2 4200' -4 i8 -io -iz -14 -16Temperature ("C)Fig.5 The absorbed energy vs. temperature with different waterc<strong>on</strong>tentThe Influence of Dry Density~"~~~With increasing of dry density, the distance between soil grainsbecomes shorter. The c<strong>on</strong>necting surface and cementing ice c<strong>on</strong>tentincrease. This results in the increasing of the linking strengtham<strong>on</strong>g soil grains. So the absorbed energy increases with increasingor soil dry density. The data show that the fricti<strong>on</strong>al angle of sandstarts to influent <strong>on</strong> its strength at critical dry density. And itsstrength increases quickly when the dry density gets over this criticalvalue (Chamberlain, 1972).In the same general trcnd, there are different laws about theabsorbcd energy changing corresp<strong>on</strong>ding to sand, silt, and clayrespectively because of internal reas<strong>on</strong>s (Fig.9, Fig.10, Fig.11). Underthe c<strong>on</strong>diti<strong>on</strong>s of same water c<strong>on</strong>tent and dry density, thechanging scale of absorbed energy of sand is 12% higher than thatof silt. Inparticularly, the curveof the absorbed energy changingwith the dry density of silt is clearly different from that of sand andclay. It increases slowly in n<strong>on</strong>-liticar type when the dry density is1306
lower than 1.458 / crn’and increases tast in similar lincar type whenthe dry dcnsity is higher than 1.45g/ cm3, The grains of clay arevery small and their ratio surface is very big. It’s difticult for thegrains to c<strong>on</strong>ncct well each other. Its absorbed energy is mainlyfrom the amount of ccmcnting ice. The internal fricti<strong>on</strong>al force haslittle effect <strong>on</strong> the absorbed energy. Its changing law likcs that ofsand.We work out three equati<strong>on</strong>s as follows:for sand:CVN = (K - r,+L)”4 (6)for silt:for clay:C VN = (7)CVN = R - Sin(r,)+S (8)where, r,is dry density (g/cm’);K,L,M,N,R, andparameters.S arc tcstCNCLUSIONSWith thc traditi<strong>on</strong>al notched Charpy bar impact test in fracturemechanics, the value CVN of frozen soil were firstly investigated.It shows that the results are res<strong>on</strong>able and this method canbe uscd in the study of frozen soil, and the methods and theories infracture mechanics can be completely introduced into the field offrozen soil mechanics.Following with the dccrcasing in temperature, thc value CVNincreases c<strong>on</strong>tinuously. The CVN changing range of sand is notgreat. But the range of silt and clay is bigger than sand .With increasing of water c<strong>on</strong>tent, the absorbed energy also increasesin n<strong>on</strong>-linear for the three types of soils, The send is biggestin changing range and at the point of 15% it obviously has an in-Ilecti<strong>on</strong> point. The changing range of silt and clay is relativelysmooth and there are not inflecti<strong>on</strong> points.Following the increasing of dry density, the CVN value alsohas a similar case as the former. Under the same c<strong>on</strong>diti<strong>on</strong>s, thechanging range of CVN value of sand is usually greater than that ofsilt by 12%. Moreover, there is a inflecti<strong>on</strong> point <strong>on</strong> We curve ofCVN VS. dry density at thc dry density 1.45g/cm3. Before this.point thc value of CVN increases slowly, and after increases fast,- REFERENCE~; 4400 I1.4 1.44 1.48 1.52 1.56Dry density (g/ cm’)Fig.10 The absorbed energy vs. dry density (silt)Zhang Shaoxiang, 1992, The Mechanics Characteristics and thererelati<strong>on</strong>s of Instantaneous Strength of Impacting Penetrati<strong>on</strong>and Cutting, Ph. D paper, Beijing Agriculture EngineeringUniversity. P3-16.Cuitoviclr,H.A.. 1985, Frozen Soil Mechanics, Science Press, Bei)ing. P464.Ladanyi,B., 1976, Use of the Static Penetrati<strong>on</strong> Test in Soils, Cana.Geotech. J. Vo1.13, No.13. .Chambcrlain, 1972, The Mechanical Behavior of Frozen EarthMaperialsunder High Pressure Triaxial Test C<strong>on</strong>diti<strong>on</strong>s.P76-78.Wang Shuweng, 1989, Study <strong>on</strong> the Technology of Field Testing ofFrozen Soil Strength, M.D. paper, Beijing Agriculture EngineeringUniversity.P3-48.3 ‘4014 1.3 1.34 1.38 1.42 1.46Dry density(g/crn3)Fig.11 The absorbed energy vs. dry density (clay)
and presents H spccial rule <strong>on</strong> the low ridges,tlanji;r\u;tn area (125°.J~'OO"-1Z5051'13."E.Granite is distributed widel!'. High forests are52'o'(j"-5'"' II 12''N) is 1ocatt.d i n Huma c'ounty,exhuberant. In local areas, the bedrock is bare.Heil<strong>on</strong>gji,lnK Provtnce,. Thc area is qhout 32 km'. Because of the increase of global temperature,In ortif!r LI, select the optimum bchemes fur c<strong>on</strong>- pcrmafrost has detcrlorated <strong>on</strong> the footslopesstructing Hanjiayuan Furest Bureau, our institute and little remains (CUO D<strong>on</strong>gxin, 1981). In theundkrtook many hydrogeological and ehgineeringvalley areas around the drainage and branches of.geological investigati<strong>on</strong>s, physical prospecting tho Weileigeng, River, the topography is flat andand designs from 1985 tu 1992, and has d<strong>on</strong>ethere are n lot of tussock hummocks, In thisdetailed research <strong>on</strong> the permafrost characteri- area. permafrost is well developed and in thestics and the exploitati<strong>on</strong>' and utilizati<strong>on</strong> oflocal bare areas there are taliks (Fig.1).ground water. The research provided scientific, informati<strong>on</strong> for c<strong>on</strong>structing Hanjiayuan ForestHYDROLOGICAL CHARACTERISTICSBureau,. ftost damage preventinn and reas<strong>on</strong>ableexploitati<strong>on</strong> and utilizati<strong>on</strong> of ground waterThe hydrological c<strong>on</strong>diti<strong>on</strong>s in this are.a.atetesources.c<strong>on</strong>trolled b!' geology, geomorphology, hydrology,geological texture. and yermafros-t. The struc-DTSTR~SllTIO!4 OF TH.E CHARACTERJST,ICS OF PERMA: tural system bel<strong>on</strong>gs to i latitudinal structureFROST IN HANJIAyUkN AREA belt uf Yilihuli, the anticlinorium of Jiagedaqiand the southern edge of the weileigeng rise.Hatijiayuan area lies <strong>on</strong> the eastern slope ofFrom the results of physical prospecting, thereDa Hinggan Ling. The mean annual air temperature are two structure lines in this area. One is thein the area is -2.Cl'C. the maximum dir tempera- main structure line al<strong>on</strong>g Veileigeng River fromture is 38'C and the minimum Bit temperature is west to east, and the other is'al<strong>on</strong>g the out -- ----48'C. The atea includes the'weileigeng River flow tributary of Veileigeng and fingjiBg%uand ita branches. which include the inflow andRiver. The two lines bel<strong>on</strong>g to a compressi<strong>on</strong>outflow rivers, Changqingou River, Jinjiagoustructure belt (see Fig.2).River, taohuibaogou River and Xinhuibagou River.Quaternary deposits are simple. There is <strong>on</strong>lyWeileigeng River originates in the northern granite of the Variscan period from the Neopaslopedf Yili,hule mo'untain and crosses Fuxilileozoic era. The granite mainly c<strong>on</strong>sists offram the welt .o east, through Hanjiayuan, anddiorit granite, andesite granite, biotite' finally reaches the Huma River. The width ofgranite, e'tc., which is distributed in the lowthe river bed is 50-90.m, the river depth-isrolling ridges and forms the bedrock of Quater-0.5-2.0 m, and the maximum discharge is 229.42nary deposits. Quaternary deposits are mainlyt<strong>on</strong>/s. The rivers in this .area ate c<strong>on</strong>trolled distributed in the valley area. The lithologyhv different factors.is course sand, middle sand and gravel. The-I .The area is in the interm<strong>on</strong>tane valleys. The characteristics of hydrology are c<strong>on</strong>trolled byvegetati<strong>on</strong> <strong>on</strong> the muuntaine are Larixgedlinii, geolog)f, geomorphology, hydrology, geologicalBetula sylvestria, Populus davidiana. etc. Instructures and permafrost. The characteristicsthe valleys, shrubs and gtess are exuberant.are listed below:Some regi<strong>on</strong>s have been cultivated.The distributi<strong>on</strong> of 1. The Tvpes of Ground Waterperniafrost is c<strong>on</strong>trolledby climate, hydrology,There are two types of ground water: Water ingeology dnd geomorphology.1308
oundary in 1982<strong>Permafrost</strong>=boundary in 19920 I OOO mpermafrostFig.1 Thedistributi<strong>on</strong> of permafrostfaultRock a Quaternary drilling holehole0 IO00 mUFig.2 Geological texturerock fractures and in pores of the QuaternaryThe type of water In rock fractures 1s HCOSdeposits.The water in the rock fractures isCs-Na 'and HCO$-Ca-Mg, pH>i', the mineralizati<strong>on</strong>c<strong>on</strong>trolled by an expressi<strong>on</strong> structure, the degree is 0.4288/1, and the water hardness isquality is not rich. The water in pores (phreatic 5.42 H. The types of water in the Quaternarywater) i.s influenced by permafrost. It <strong>on</strong>ly pores is HC0.-Ca, HCOs-SO -CaMg, ph
The supply of water in rock fractures ismainly from precipitati<strong>on</strong>. It penetrates intothe weathering fractures and texture fractures.Because it is limited by the c<strong>on</strong>diti<strong>on</strong>s of topography(the lolling and slope degree). Phreaticwater in the pores of the Quaternary depositsoccurs <strong>on</strong>ly, like c<strong>on</strong>vexity, in some parts 3fthe drainage area of Weileigeng River. The supplyc<strong>on</strong>diti<strong>on</strong> is complex. The quality of the verticalsupply is less, because of the lesser area ofwater accumulati<strong>on</strong>. It is mainly the horiz<strong>on</strong>talsupply from the rock fractures.4. The State of Ground WaterFrom 1987-1992's observati<strong>on</strong> informati<strong>on</strong> inlow water periods, the phreatic water in thepores of the Quaternary depzsits reach themaxlmum in July, and minimum at the end of April.The time of the two extreme values is close.This is another characteristic of this area.EXPLOITATION AND UTILIZATION OF GROUND WATERAs described above, our institute has undertskenmany hydrogeological and engineeringgeological investigati<strong>on</strong>s and designs, and manyboreholes have been drilled for this purpose.In order to see the situati<strong>on</strong> clearly, representativeboreholes were chosen and renumbered. .Thedetails are presented in Table 1 and 2.ks menti<strong>on</strong>ed above, the hydrogeological c<strong>on</strong>diti<strong>on</strong>sin this area are c<strong>on</strong>trolled by geology,geomorphology, geological structure and permafrost.The authors of this paper c<strong>on</strong>sider thatthe factors of geology, geomorphology and geologicalstructure are comparatively c<strong>on</strong>stant andtheir drainages are not obvious. Rut the deteriorati<strong>on</strong>of permafrost is rapidly changing.In the regi<strong>on</strong>, permafrost was distributed inWcilcigcng Yiver and i.ts branch valley's before1782. Thus, in the regi<strong>on</strong>, there was no phreaticTable 1. Groundwater in rock fracturesHule Kelling Decreased PenetratingChemicalwater depth coefficientSo. tY Pes(t/d) (m) (m/d)Mineralizati<strong>on</strong>(g/l)PHTnickness ofaquifer(m)1 107.39 41.84 0.05782 120.53 47. 60 0.os13 68.6049.35 0.024 126.2318.10 0.10H-C-?.I11-C-N11-NH - C - N0.106 7.40.160 7.50.201 8.00.3188 7.8753975.7781.80Table 2. Phreatic water in pores U T Quaternary depositsHoleso.Welling Dccreased Penetratingxater depth coefficient Chemical Yineralizatiun Thickness ofPHaquifertypesft/dj(m)(m/d)(811) (m)3 777.1h O.Lj0 62245 H - c ,- s 0.101 6.0 - 3.30 737. If) 0.303 575.'13 H-U-C 0 .081 6.5 2.757681.7 0. 410 lr17.lr3 H-C-Y 0.073 6 . 3 4.03Y 3 2 . 9 7 1.200 726 .Rh 11-C-Y 0.128 f> . 3 3.158 555.79 0.3 1079 . Y 9 HS-CY 0.087 6.2 2-65cj 485.48 0.15 926.24 11-c-u 0*08H 6.4 2.59Shh . 44 0.8 457.6 H -c: 0.103 h . 4 2 .06588. 3 0.15 1473.42 H -c 0 . I 61 h .8 2.68I rlh2H. 9 1 .I .35 301.72 HS-C:l o . 2 95 R . 6 2.3711 7'37. I h 0 . -5 2 034. 72 H-C-M 0.089 7.1 2.5712Shb.4L 0 . 1 9 875.87 H-N-C 0 . 0 I I) 0 . 4 3 .OJ1054. OX 0 . h 4 h79. 52 11s-CY . 0.137 6.2 2.951310
cause new problems for exploiting and utilizingthe ground water in this regi<strong>on</strong>.1. Water in rock fractures is not rich. Theamount of water in boreholes is 100 t/d. It hasa good quality and is not polluted. It basicallybel<strong>on</strong>gs to calcium bicarb<strong>on</strong>ate water and can beused as drinking wat'er in small residential areasand should be supplied by pipes. The optimumdepth of the well is 120 m, but the well mouthneeds to be well covered.2. Phreatic water in the pores of the Quaternarydeposit;$ is rich. The welling water in asingle borehole is up to 1033 t /d. But thedrainage area is small, the thickness of theaquifer is thin and not suitable for the storageof large amounts of water. From this, it can beused as a k'ater resource for large or middlescale industry. A large mouthed well and penetratingchannels can be used to exploit theground water.3. The increased area of gold mining hasincreased the number of inhabitants, which hasdestroyed the original state of phreatic wateri n the pores of Lhe Quaternary deposits, andhas increased the degree of polluti<strong>on</strong>. Thesituati<strong>on</strong> appears to be worsening and due tothis, the k'ater in the pores-of the Quaternarydepusits is not suitable for drinking water inthe eastern uart of Jiniiaaou. but is suitablefor industrial use.4. Ground water i.n the western part of Jinjiagouis not polluted. The area has not beenexploited at present. The water in the Quaternarydeposits can. be used as drinking water , but aprotecti<strong>on</strong> he1.t must be established to preventpolluti<strong>on</strong>. It can be exploited with a largemouthed well and penetrating channel.1992,'s investigati<strong>on</strong> informati<strong>on</strong> illustratesthat the remaining permafrost in the valleys ofWeileigeng River and in some branch areas, hascompletely disappeared,The lowered permafrost base also representsthe permafrost in its deterioratiwg process.From 1982's survey, the permafrost base was morethan 5 rn (drilled into the weathering layer),1987's surveyed results indicated that the basehad risen to 3.8 m, aid <strong>on</strong>ly in local areas was5 rn (near Jingjiagou area). According to this,the permafrost in Hanjiayuan area in Da HingganLing is gradually disappearing at an acceleratingrate.REFERENCESGuan Wuanjun, (1983) Trees in China, ForestryPublishing, House of China, 929pp.Guo D<strong>on</strong>gxin, (1981) <strong>Permafrost</strong> z<strong>on</strong>ati<strong>on</strong> of theDaxing Anling Range, Northeast China,Journal of Glaciology and Geocryology, 3(3),1-9.Yuan Haiyi, (1989) Degrading permafrost inDaxing Anling Range. In: Proceedings of theThird Chinese <str<strong>on</strong>g>C<strong>on</strong>ference</str<strong>on</strong>g> <strong>on</strong> Frozen Ground,Science Press of China, Beijing, 54-58.Zhang Wuanru, (1986) Forestry and soils of ChinaScience Press of China, Beijing, 96pp.RAPID DETERIORATION OF PERMAFROSTThe authors of the paper "The Deteriorating<strong>Permafrost</strong> in Da Hinggan Ling" (Yuan Haiyi,1999), generally described the deteriorati<strong>on</strong>.Through field tests, we verified that when plantlife is destroyed, the deteriorati<strong>on</strong> speed ofpermafrost, increases. The main reas<strong>on</strong> is thatthe air tcmperature becomes increasingly warmer.From the informati<strong>on</strong> of Mehc meteorologicalstatl<strong>on</strong>, the air temperature was -5°C from 1957to 1Y70, and -4.4"C from 1971-1985. From theinformati<strong>on</strong> of Huma meteorological stati<strong>on</strong>, theair temperature was -2.h8"C in 1985, and -2.Ol0'cin 1987. The r.ising air temperature, in additi<strong>on</strong>to human activity, makes the permafrost deterioraterapidly.Hanjiayuan area, Veileigeng River and itsbranches.are the gold enrichment z<strong>on</strong>es. Themechanized mining and local mining arc growingrapidly. As gold mining is developing quickLy,it causes the prospering and development ofhighways, sideroads and farming. All of thesetactors cause the deteriorati<strong>on</strong> of permafrost.\de can say with certainty, that the permafrosti n the area of Hanjiayuan will deterioratefurther following the c<strong>on</strong>structi<strong>on</strong> of HanjiayuanBureau, and subsequent damage of vegetati<strong>on</strong>.From the informati<strong>on</strong> of 1982's investigati<strong>on</strong>,the drainage areas of Weileigeng River and itsbranches were almost all occpied by permafrostand there was local sporadic permafrost.1985 and 1987's investigati<strong>on</strong> informati<strong>on</strong>indicated that the psrmafrvst in the drainageof h'eileigeng River and its hranchos, haddeteriorated <strong>on</strong> a large scale. Only in localareas was there permafrost.
, SEASONALLY FROZEN GROUND AND ITS BEHAVIOR ON FROST HEAVEIN THE YUMENZHEN.RECIOM, GANSU PROVINCE, CHINA"Yue Hansen and Qiu'GuoqingLanzhou Institute of Glaciology and Geocryology,Academia Sinica, Lanzhou 730003, ChinaThe field observati<strong>on</strong>s in the Yumenzhen regi<strong>on</strong>, Gansu Province during 1985-1986 'showed that the behavior of the seas<strong>on</strong>ally freezing and frost heaving of groundwas c<strong>on</strong>trolled by the local climatic c<strong>on</strong>diti<strong>on</strong>s, geological and hydro-geologicalc<strong>on</strong>diti<strong>on</strong>s. Under similar climatic c<strong>on</strong>diti<strong>on</strong>s with a mean annual air temperatureof 6.9'C and a freezing period lasting about 125 to 135 days, the groundscomposed of well-drained bed rock and gravels didn't have any obvious frostheaving. The €ine-graded soils ha3 a str<strong>on</strong>g-heaved with a ratio of frost heavingq>6X as the buried depth of ground water Z(1.5 m whea Z equals to 1.5 to 2 m,rl-3-6X; and as 2>2.5 m, the q of fine-graded soils might be as low as
Table 1. Major parameters and characteristic indexeset various sitesYumenzhenObser- Meteorolo- Nantan Team 16 Team 17 Team 8 Team 4 Team 20 Bgishueivati<strong>on</strong>gical Huanghva Huanghua Huanghua Yenma Yenma Y enma duansiteStati<strong>on</strong>Clayeysoil138.48Clayeysoil29.031.081.29Clayey Clayey Clayey Clayey Clayey Clayey 'soil soil moil soil soil20.75 31.53 37.79 , 1i.62 26.88 27.422.52 1.62 0.4 >4 - 1.18 1 :721.50 1.09 1.07 1.55 1.28 1.401.58 0.85 3.70 0.65 0.55 6.78 0.2111301130637.155.613.31101.80.81010.79a3137018.5770.524.753.845;9199-0890695.268.88.157511.263.817.55JEnd of Mid. Mid.Mid.Mid, Mid.Mid,Mid.Oct. Oct. Oct. oct * Oct. ocr " O K t * oct.K Nov. 22 Nov. 25 Nov. 20 Nov .20 Nov. 20 Nov. 25 Nov.25 NQV. 20L Dec. 8 Nov. Dec 23 .13 Nov .23Dec .28 Nov. 20M Feb .18 Mar. 10 Mar. 20 Mar. 15 Mar. 1 Mar .5 Ma,r. 15 Mar. 10N Mar. 10 Nov.30 Mar,lS Mar. 10 ' Msr.10 Mar.150 Apr .h Apr .15 .25 Apr Apr.25 Apr.13 Apr..SO Apr -25A: Lithological character: F: Thiakness of frozen ground; I(: Beginning of stable freezingB: Water c<strong>on</strong>tent before freezing; G: Total amount of frost heaving; L: Beginning of etable frostC: Buried depth of ground water; H: Freezing penetrating depth; heaving:D: Dry unit weight: I: Frost heaving ratio; , M: Time when freesing fr<strong>on</strong>tE: Salt c<strong>on</strong>tent; J: Beginning of unstable freez$ng; reaches maxilava depth;Nr Time whpn mqvimurn froetheaving occurmi0: Time when ground 'thawedout thorouahly.Table 2. Tempeyature at Yumenzhen and Yanaa Farm (1974-1976) I), 2)M<strong>on</strong>thMeanSite ' Jan, Feb. Mar. Apr, May June July Auh. ' Stpt. Oct. Nov. Dee. . annualItemvalueYurnenzhen A -9.5 -8.0 0.3 8.9 15.4 19.3 21.3 20.2 J4,9 6.8 -2.7 -11.7 6.5B -8.8 -5.2 -1.1 6.3' 18.2 22.4 24.9 20.2 18.4 ,9.0 1.3 -9.2 -8.1Yenma A -11.5 -8.5 -1.7 7.3 14.8 19.3 20.9 19.6 13.7 5.2 -3.6 -13.9 5.2B -7.1 -5.0 -1.3 3.8 10.3 16.6 19.7 18.9 14.4 6:8 -0.7 -6.7 5.8At Mean m<strong>on</strong>thy value of air temperature:B: Mean m<strong>on</strong>thy value of ground temperqrure at the depth of 5 fm.1) Depth of ground water table 11.2,m st Yumenzhen. 1.4 at Yenma Farm:2) The Yumenzhen Meterologlcal Stati<strong>on</strong>, 1984, the analyrir end divisi<strong>on</strong> of the climatic data for 'agricuiture, Yulpen City, Gansu Province. Unpublished.1313
period lasts about 125 to 135 days. The groundbeings to freeze in the middle of October. Themaximum freezing depth of the ground occurred inlate- February,. The thorough tha'wing per.iodoccurred from the middle of April to early May.The frozen period of the ground is as l<strong>on</strong>g assix to seven m<strong>on</strong>ths. Generally, the freeAingprocess in the north begins earlier than in thesouth while the thawing process is to thec<strong>on</strong>trary.The-diff.erent combinati<strong>on</strong> of the geological,and geographical c<strong>on</strong>diti<strong>on</strong>s leads to a greatdifference in the development process of theseas<strong>on</strong>ally frozen layer in the time to reachthe maximum frozen depth and to be meltedthoroughly (Table 1). The thickness of theactive layer changed largely at various sites,113 cm in Yumenzhen, 101 to 60 cm in the FinegradedSoil Plain. The formati<strong>on</strong> and developmentof frost heaving of the soil was dramaticallydifferent in the regi<strong>on</strong>. On the pluvial fanthere was no obvious frost heaving. On the FinegradedSoil Plain at various secti<strong>on</strong>s, al<strong>on</strong>gwith different buried depths of ground water,frost heaving of the soil occurred in differentdegrees, weak frost heaving when the burieddepth of ground water was deeper; str<strong>on</strong>g frost,heaving when shallower. Table 2 also shows thatthe distributi<strong>on</strong> of the frost heaving al<strong>on</strong>g thedepth was greatly changeable at various secti<strong>on</strong>sin this regi<strong>on</strong>.THE GEOGRAPHICAL DIFFERENTIATION LAW OF'THE- DEVELOPMEYT OF SEASONALLY FROZEN GROUNDThere are many complex natural geological andgeographical factors influencing the formati.<strong>on</strong>,development and disappearance of the seas<strong>on</strong>allyfrozen ground. They can be grouped as follows:1) The compositi<strong>on</strong>' (grain size, mineral andchenical compositi<strong>on</strong>), texture, and buriedc<strong>on</strong>diti<strong>on</strong> of the rock and soil; 2) The initialwater c<strong>on</strong>tent before freezing in deposits andits distributi<strong>on</strong> al<strong>on</strong>g the depth, the burieddepth and their dynamics a's well as chemicalcompositi<strong>on</strong>.and salt c<strong>on</strong>tent of ground water;.3) The thermal regi<strong>on</strong> of soil layer (Cudlevcev V,A.1978), the geographical differentiati<strong>on</strong> of thedevelopment of seas<strong>on</strong>ally frozen ground isgoverned by the sombinati<strong>on</strong> of the rock (orsoil), water, and temperat,ure.-The Differentiati<strong>on</strong> R~sultant. f r ~ m GeomorphicUnitsThe landform is the most important factorresulting in geographical differentiati<strong>on</strong>. Tnregards to the above, the researched area canbe divided into 4 parts: Changma Pluvial Fan,Fine-graded Sotl.Plain, Mt. Yenmabeishan andMt. Hanxishan. These geomorphic units aredifferent in.water-heat c<strong>on</strong>ditjun,.lithologicalcharacters, supply and drainage of th4 groundsurface water, and burled depth and flow of theground water, governing the diffc'rence and combinati<strong>on</strong>of soil, water and temperature in timeand space, leading to the differences in developmentof the seas<strong>on</strong>ally frozen ground,As shown in Table 2, because the mean m<strong>on</strong>thlyair temperature at Yumenzhen was higher thanthat at Yenma Farm, the freezing of the groundsurface at Yumenzhen started later than at YenmaFarm: but thawing was earller. From south t<strong>on</strong>orth, al<strong>on</strong>g with the gradual change of thegeomorphic positi<strong>on</strong>, the air c<strong>on</strong>diti<strong>on</strong>, featuresof the soil, and buried depth of ground water,as well as, the developing c<strong>on</strong>dit-i<strong>on</strong>s of theseas<strong>on</strong>ally frozen ground, change corresp<strong>on</strong>dingly,<strong>on</strong> the Changma Pluvial Fan, the arid groundcomposed of gravels and sands with the deeperbur-ied depth of ground water didn't have anyobvious frost heaving under natural c<strong>on</strong>diti<strong>on</strong>sduring the observati<strong>on</strong> period, while <strong>on</strong> theFine-graded Soil Plain, under natural c<strong>on</strong>diti<strong>on</strong>sthe moist fine-graded soi-1s with a shallowerburied depth of ground water exhibited frostheaving to a certain degree. In Nantan, team 16,team 8, team 20 were examples (Table 1). In Mt.Yenmabeishan and Mt. Hanxiashan, the groundcomposed of well-drained bed rock with a poorwater supply didn't have any frost heaving.The Differentiati<strong>on</strong>s Resultant from the BuriedDepth of Ground WaterIn the Fine-graded Soil Plain with similarclimatic c<strong>on</strong>diti<strong>on</strong>s, the buried depth of groundwater is the difinitive factor: determining thestructure and chemical cnrtoositi<strong>on</strong> of soil,resp<strong>on</strong>sible for the magnitude and distributi<strong>on</strong>of moisture c<strong>on</strong>tent and thermal regime of thesoil profile, leading to geographical differentiati<strong>on</strong>of seas<strong>on</strong>ally frozen ground, As shownin Table 1, the soil tended to densify with theincreasing buried depth of ground water. Undersuch a natural c<strong>on</strong>diti<strong>on</strong>, the soil moisturemainly originated from the recharge of groundwater, So, water c<strong>on</strong>tent and its distributi<strong>on</strong>al<strong>on</strong>g the soil profile will be logically inrelati<strong>on</strong> to the buried de,pth of ground water.As shown in Table 1, the water c<strong>on</strong>tent and saltc-<strong>on</strong>tent in the ground tended to decrease withthe increasing buried depth of ground water.The buried depth of ground water was alsoinfluenced by the development situati<strong>on</strong> ofvegetati<strong>on</strong> directly. Therefore, it was theburied depth of ground water 'that determinedthe presence and change of the various factorsinfluencing, the freezing-thawing c<strong>on</strong>diti<strong>on</strong>s,and that governed the different developmentsituati<strong>on</strong> of seas<strong>on</strong>ally frozen ground.The influence of buried depth of Rround water<strong>on</strong> the around temperatureThe development of seas<strong>on</strong>ally frozen groundis closely related to the ground temperature.The ground water, as a natural heat source, isgreatly influences the soil temperature duringthe frozen per,iod. As shown in Table 2, duringthe period from November to February of 1974 to1976, the temperature at thh depth of 5 cm atYenma Farm was observed to be higher than thatin Yumenzhen, although the air temperature washigher in the latter. This might result fromthe fact that the t.ablc of ground water wasburied as deep as 11.2 m in the latter while1.4 m in the former. A lower ground cemperature,of course, would lead to a deeper penetrati<strong>on</strong>of the freezing process, as a result, the thicknessof the seas<strong>on</strong>ally frozen ground was observedto be 113 crn at the Yumenzhen and 99 cm at theYenma Farm.The effect of buried depth of ground water <strong>on</strong>the freezinR process and freezing penetrati<strong>on</strong>Due to the different buried deuths of eroundwater, there was great difference in the freezingprotoss and fr,eezing penetrati,oh depth ofsoil <strong>on</strong> the various secti<strong>on</strong>s, Generally, themaximum freezing depth of soil would occurearlier at those places wtth a shallower burieddepth of ground water, while the time for thesoil to completely thaw was opposite, Also, themaximum freezing depth of soil would decrease1314
'with the buried depth of ground water decreasing.*For example,-the soil at Team 8 of Yenma Farmwhere the table of ground water was bured at adepth of 0.4 m reached the maximum freezingdepth of 53.8 cm <strong>on</strong> Mar. 1, thawed thoroughlyafter Apr. 25; at Team 20 where the buried depthof ground-water.water was 1.18 m, it reached themaximum freezing depth of 63.8 cm <strong>on</strong> Mar. 15,thawed thoroughly <strong>on</strong> Apr.. 20; at Team 16 wherethe,buried depth of ground water was 2.52 m, itreached the maximum freezing depth of 101 cm<strong>on</strong> Mar. 20, thawed thoroughly <strong>on</strong> Apr. 15 (Fig.1).M<strong>on</strong>thNov. Dm, Jan. Feb. Mar. Avr. MayFig.1 Dependence of freezing depth (a) and frostheave (b) <strong>on</strong> buried depth of ground waterThe effect of the buried depth of ground water<strong>on</strong> the frost heavingThe process. magnitude and distribati<strong>on</strong> ofthe frost heaving al<strong>on</strong>g the soil profile variedwith the buried depth of ground water. Generally,as the buried depth of ground water graduallyincreased, the aaximum frost heaving of soiloccurred earlier; the total frost heav,ingmagnitude decreased (Table 1).In order to analyze the quantitative relati<strong>on</strong>shipbetween the frost heaving and'theburied depth of groitnd water, the statisticalquati<strong>on</strong>s were used, as shown below,h - 41.35 e"0.016z (1)rl - 94.05where: h, Frost heaving magnitude (cm):rl. Frost heaving ratio (X);z, Buried depth of ground water (cm).The correlati<strong>on</strong> coefficient is -0,995 forEqu.(l) and -0.997 for Equ,(2).The Effect of Human activityThe effects of human activity were in theareas of the irrigati<strong>on</strong> of farmland, the supplyand drainage of water by engineering, and inchanging the soil-water-temperature situati<strong>on</strong>of ground greatly. Generally, the irrigati<strong>on</strong> offarmland and the leakage from canals made the',water c<strong>on</strong>tent in tbe ground increase, impellingthe frost heave especially; In the areas ofTeam 17 and Beishueiduan, because of the effectof canals and irrigati<strong>on</strong>, the frost heavingratio of aoil increased by 14.24% and 13,97%respectively in comparis<strong>on</strong> with that of the soilunder natural c<strong>on</strong>diti<strong>on</strong>s. According to investigati<strong>on</strong><strong>on</strong> Changma Pluvial fan, the surface layerc<strong>on</strong>taining a large fine c<strong>on</strong>tent and a littlewater didn't have obvious frost heaving' undernatural c<strong>on</strong>diti<strong>on</strong>s; however, where affected bythe leakage of canals, the frost heaving ratiocan be as high as 20X or more.DIVISION AND CLASSIFICATION OF FROST HEAVING OFGROUNDTo reflect the engineering geological c<strong>on</strong>diti<strong>on</strong>sof seas<strong>on</strong>ally frozen ground overall inthis regi<strong>on</strong> for the general planning of civilengineering and canals to be.c<strong>on</strong>structed, andfor the preventi<strong>on</strong> and soluti<strong>on</strong> of the engineeringfrom frost.damage, it is necessary toclassify the seas<strong>on</strong>ally frozen ground inaccordance with the frost heaving behariour ofsoil.Divisi<strong>on</strong> PrincipleThe divisi<strong>on</strong> was based <strong>on</strong> the comprehensiveanalysis of the natural factors affecting thedevelopment bf seas<strong>on</strong>ally frozen ground and ofthe natural processes, mainly to reflect thefrost heaving of seas<strong>on</strong>ally frozen ground undernatural c<strong>on</strong>diti<strong>on</strong>s. C<strong>on</strong>sidering the naturalc<strong>on</strong>diti<strong>on</strong>s and researched degree, the divisi<strong>on</strong>may be divided int.0 two orders.(1) First order: Seas<strong>on</strong>ally frozen groundarea. According to geomorphic units, this regi<strong>on</strong>may be divided into: 1) Mt. Yenmabeishan seas<strong>on</strong>allyfrozen ground area, 2) Mt. Hanxishan seas<strong>on</strong>allyfrozen ground area, 3) Changma PluvialFan seas<strong>on</strong>ally frozen ground area, and 4) theFine-graded Soil Plain seas<strong>on</strong>ally frozen groundarea.(2) Sec<strong>on</strong>d order: Frost heaving secti<strong>on</strong>,Based <strong>on</strong> difference of rock (or soil) preperties,and hydro-geological c<strong>on</strong>diti<strong>on</strong>s and mainly the'buried depth of ground water, the seas<strong>on</strong>allyfrozen ground areas were subdivided into frostheaving secti<strong>on</strong>s in accordance with classificati<strong>on</strong>of ground foundati<strong>on</strong> by frost heavingsusceptibility. Due to the randomness of humanactivity, the frost heaving susceptibility ofthe ground near arterial canals was markedqualitatively.The divisi<strong>on</strong> of frost heaving of ground isshown in Fig.2.Frost Heave Classificati<strong>on</strong>The classificati<strong>on</strong> of frost heave in seas<strong>on</strong>allyfrozen ground is an important basic problemin Geocryology. So far, due to the complexityof the questi<strong>on</strong>, there is no overall reliablemethod to evaluate comprehensively the frostheaving susceptibility of soil foundati<strong>on</strong>.C<strong>on</strong>sidering the aim and task of this project,the authors put forward the frost heavingclassificati<strong>on</strong> for natural frozen ground inthis regi<strong>on</strong>.The principal guiding thought to classifythe frost heaving susceptibility of frozenground in this regi<strong>on</strong> is that the suggestedclassificati<strong>on</strong> should be able to reflect theactual situati<strong>on</strong> of seas<strong>on</strong>ally frozen groundunder the natural c<strong>on</strong>diti<strong>on</strong>s of this regi<strong>on</strong>and to harm<strong>on</strong>ize it with the existing related1315
ACKNOWLEDGEMENTSThe authors would like to express theirgratitude to Mr. Yin R<strong>on</strong>gfa, the manager of theGansu Provicial general Company <strong>on</strong> AgriculturalExploitati<strong>on</strong>, and his colleagues for their helpin field ,works and to Prof. Cheng Guod<strong>on</strong>g, ZhouYouwu and Chen Xiabai for their valuablesuggesti<strong>on</strong>s with this paper.REFERENCECudlevcev, V.A. et al. (1978) General Geocryology,End Press, Moscow University Press, p.185-230.Fig. 2 Divisi<strong>on</strong> of seas<strong>on</strong>ally frozen groundsurroundinn ~~~ ~ ~Yumenzhen1. Mt. Yenmabeishan seas<strong>on</strong>ally frozen groundarea;2. Changma Pluvial Fan seas<strong>on</strong>ally frozen groundarea:3. Boundary of seas<strong>on</strong>ally frozen ground area:4. Unfrost-heaving secti<strong>on</strong>;5. Frost-heaving secti<strong>on</strong>;6. Boundary of rock and soil:7. Gravelly soil;8. Clayey soil;9. Observati<strong>on</strong> site:10, River;11. Mt.Hanxiashan seas<strong>on</strong>ally frozen ground area;12. Fine-gradesoil Plain seas<strong>on</strong>ally frozenground area;13. Boundarq of frost heaving secti<strong>on</strong>:14. Weak-frost heaving secti<strong>on</strong>;15. Str<strong>on</strong>g-frost heaving secti<strong>on</strong>;16. Bedrock; 17. Sandy soil; 18. Arterial canal.classificati<strong>on</strong>. Based <strong>on</strong> the fact that the burieddepth of ground water and the soi 1 character arethe major factors determining the behavior ofsoils iifrost heaving, the class ificati<strong>on</strong> issuggested as shown in Table 3.Table 3. Classificati<strong>on</strong> of foundati<strong>on</strong> soils byfrost heaving susceptibilitySoilBuried depthof ground Frost heaving Classwater z(m) ratio (x)BedrockGravel Not c<strong>on</strong>sidedSandTJnfrost-heaving222.5 rlCl Unfrost-heavingClayey 2.55222 1Cr753 Weak-frost heavingsoil 2>2r1.5 3
CULVERT ENGTNEERING IN THE PERMAFROST REGIONON QINGHAI-YTZANC PLATEAUZhang Jinzhao and Yao CuiqinThe First iurvey and Design Institute of Highways,'The Minj.stry of Communicati<strong>on</strong>s, Xian, China'This paper mainly introduces the engineering envir<strong>on</strong>ment and characteristics ofculvert engineering in the permafrost regi<strong>on</strong> of Qingha-Xizang Plateau. Based <strong>on</strong>the investigati<strong>on</strong> of the effects and state of culverts and the l<strong>on</strong>g term observati<strong>on</strong>of representative culverts in the permafrost regi<strong>on</strong> of Qinghai-Xizang highway,and by analyzing the damage of culvert engineering and renovating theQinghai-Xiz,ang highway design by, taking into c<strong>on</strong>siderati<strong>on</strong> previous examples ofc<strong>on</strong>structi<strong>on</strong>, the principles of damage protecti<strong>on</strong> and engineering measures ofculverts are given with regard to the different aspects of design, c<strong>on</strong>structi<strong>on</strong>and maintenace. This payer can he used as reference in the areas of design,c<strong>on</strong>structi<strong>on</strong> and maint.enance of highways,THE SNVIRONMFNT AND CHARACTERISTlCS 0F CULVERTENGTNEEBINGA part of Qinghai-Xizang highway passesthrough a c<strong>on</strong>tinuous permafrost regi<strong>on</strong> of 520 km,the hcight above sea level is more than 4500 m.Heat thaw lakes and p<strong>on</strong>ds are spread throughoutthe regi<strong>on</strong>, ground ice is very developed, thesuperpcrrnafrost water is rich, thaw settlement,frost heave, frostchurning and other disadvan-Lageous gvologlc phenomena in engineering comm<strong>on</strong>lyexist.It is high and cold and the oxygen c<strong>on</strong>tcnt~inair is <strong>on</strong>ly 50X of that in the interior. Theannual mean air temperature is low (about -3.0to -6.OoC.), the freezing period is more than 7-8n1011ths of the year. Even in warm seas<strong>on</strong>, minusair temperatures often occur in evening. Theamoutri. uf annual precipitati<strong>on</strong> is 250-400 mm, itis c<strong>on</strong>centrated between June and September andoccurs in the solid forms of snow and hail.Hundreds of culverts have been created in thepermafrost regi<strong>on</strong> with a total length of 520 kmal<strong>on</strong>g Qinghai-Xizang highway. The operatingstates of the culverts were carefully investigatedin October, 1990. The results showed thatserious damage occurred in 15% of all culvert.3,middle level damage occurred in 21.17 and littleor no damage occurred in 63.5% of the culverts.The easily and very seriously damaged secti<strong>on</strong>sare the inlet buildings and culvert bottomlinnings. These two types of damage make up morethan 86X of all damaged culverts.CULVERT ENGINEERING UAMAGF, TYPEThe main types of culvert damage in the ycrmafrostregi<strong>on</strong> of Qinghai-Xizang highway are(1) cracking and scttlement of the culvertterrace, (2) cracking, breakage and settlementof the bott'om lining of thc culvert, (3) seepagethrough ,.he bottom lining of the culvert, (4)cratrking, slupc and settlement of the inlet andoutlet wal Is and flank walls of the culvert,(5) damage of the lining <strong>on</strong> the inlet and outletand the wa 11 to cut off water. . (6) the collapseof the inlet and outlet. of the culvert. The mainreas<strong>on</strong>s causing the damages arc the changes oftho permafrost table and the repeated freezingthawingeffects of the seas<strong>on</strong>al active layer.THE PRINCIPLES TO PREVENT AND TKEAT DAMAGE INCULVERT ENGINGERINGIn additi<strong>on</strong> to the fac~ors of general displacement,effective stress is closely rclatedto the temperature acting <strong>on</strong> the permafrost andthe culvert base stability affected by waterlatent heat must be c<strong>on</strong>sidercd for base designsin permafrost regi<strong>on</strong>s. Simultaneously, the corresp<strong>on</strong>dingengineering countermeasures to keepthe demanded thermal regime during culvertc<strong>on</strong>structi<strong>on</strong> and operati<strong>on</strong> must be taken. Thisis a basic principLe for preventing frost damagein culverts in permafrost regi<strong>on</strong>s.Geothermal CharacteristicsThe xeothermal reaimes of the base of t-hetypical-culvert al<strong>on</strong>g Qinghai-Xizang highwaywere investigated, as shown in Figures 1 and 2.The figures show that at 0.5 m depth the maximurpground temperature of the culvert mouth ishigher by 4-5°C than that of the culvert centre.But. the difference of the temperatures is <strong>on</strong>lyabout 1'C at 2.0 m depth between the body andmouth. Figures 3 and 4 also show the same reyulati<strong>on</strong>that the permafrost table beneath theculvert, mouth is 1.0 m deeper than beneath theculvert centre. This indicates that (1) the airtemperature effect <strong>on</strong> the culvert inlet andoutlet is greater than <strong>on</strong> the culvert body, (2)the air temperature effect <strong>on</strong> the upper layer isgreater than that <strong>on</strong> the deep layer, (3) in theculvert design,' the base depth at Lhe inlet andoutleL of the culvert should be 0.5-1.0 m morethan at t.hr culvert. centre, otherwise other
T "C6- 0.5 m depth-6 --8 - 'I9 6 7 8 9 10 11 12 I 11989 I 1990Fig.1 Ground temperature curves below the mouth and centre of culvertground temperature curves below culvert mouth;-.-. -. - ground temperature curves below culvert centre.IT c"C)8-6-4-2-0, "-2 * /. "-4--6I I 15 6 7 8 9 10 11 12 11.-1987 I 1988Fig.2 Ground temperature curves below the mouth a'nd centre of culvertGround temperature curves below culvert mouth;-.-.-e- ground temyerat.ure curves below culvert centre.Fig+3 Curves of zero.tempcrature belowthe mouth and centre of culvertbelow culvert mouth;-._.- below cplvert centre.Fig.& Curves of zero temperature belowthe mouth and centre uf culvertbelow.culvert mouth;-.-a- below culvert centre.1318
engineering ,countermeasures should be taken, (4)after understanding the base geothermal regimesduring the operati<strong>on</strong> of the culvert, reas<strong>on</strong>ableculvert engineering design can be determined.Culvert DesignDesign principleBased <strong>on</strong> the structural types and c<strong>on</strong>structi<strong>on</strong>characteristics of culvert engineering and engineeringgeological and hydrological c<strong>on</strong>diti<strong>on</strong>sin the area, two kinds of design principles canbe taken. a) One Is the principal of maintainingthe frozen c<strong>on</strong>diti<strong>on</strong>, i.e. the base of theculvert beneath a certain depth is kept in afrozen state during the operati<strong>on</strong> of the culvert.b) Another is the principal of allowing thaw,i,e. the base of the culvert between certaindepths is allowed to thaw during the operati<strong>on</strong> ofthe culvert, the principle is <strong>on</strong>ly adapted to theweak thaw settlement soil and n<strong>on</strong>-thaw settlementsoil.The depth of the refilled soil is closelyrelated to the engineering cost and the effectivepreventi<strong>on</strong> of frost damage. It is determined bythe means of the structural type, the degree ofallowed deformati<strong>on</strong>, soil type and ice c<strong>on</strong>tentof base soil, The two following design principlesshould be mainly c<strong>on</strong>sidered.(A) Frost heave deformati<strong>on</strong> of base soilshould be c<strong>on</strong>trolled in the range of alloweddeformati<strong>on</strong> of culvert engineering after beingreEilled.(B) During thawing the bearing capacity ofrefilled soil and active layer of permafrostmust satisfy the design requests, the thaw settlementamount must also satisfy the engineeringrequests.In order to reduce the vertical and horiz<strong>on</strong>talfrost heave force, sand-gravel qoil must befilled in the base bottom and around the base.Simultaneously, asphalt 1 cm in thickness shouldbe filled into the positi<strong>on</strong>s where base touchesthe embankment. The expansi<strong>on</strong> joint should bealso filled with rubber asphalt that has a largedeformati<strong>on</strong> at low temperatures.Because a large settlement amount in culvertengineering is’allowed, it is effective to set a-settlement joint to prevent and treat culvertengineering cracks caused by inhomogeneous settlement..Afterbuilding the culvert the naturalpermafrost’table beneath the culvert centre willagain rise beneath the inlet and outlet of theculvert and will again descend, as shown in Table1. In order to get a reas<strong>on</strong>able design forculverts in technique and cost, it is better tobuild the culvert base in secti<strong>on</strong>s, the secti<strong>on</strong>sbase depths are determined by different permafrosttables.Table 1. A comparis<strong>on</strong> between man-made tableand natural permafrost tableMan-made tableNaturalNo. Pile No. (m)permafrostLeft Centre Right table (m)1 K157c373 1.68 0.65 0.83 1.75-2.10 .2 K279t370 2.45 1.50 2.15 2.05-2.103 K287+166 2.23 1.41 1,73 1.604 K337t170 1.75 1.35 2.05 1.00-2.45Choosing the structural tvueIn a permafrost area, the culver! structuraltype is the technical key to assuring the engi-.neering quality and a lower engineering coat.Rased <strong>on</strong> design priciple I, rapid c<strong>on</strong>structi<strong>on</strong>is the main c<strong>on</strong>diti<strong>on</strong> to.select the culvertstructure. And for design priciple 11, thestrength and the ability of adapted deformati<strong>on</strong>can be taken as the main c<strong>on</strong>diti<strong>on</strong>s to selectthe culvert structure. From the investigati<strong>on</strong> ofthe state of the culverts and the l<strong>on</strong>g termobservati<strong>on</strong> of typical culverts al<strong>on</strong>g Qinghai-Xizang highway, the culverts with a cover slabmade with reinforced c<strong>on</strong>crete, the frameworkstructure culverts with a cover slab made with.reinforced c<strong>on</strong>crete, the culvert box of reinforcedc<strong>on</strong>crete and the culvert tube made withtin-plated alloy steel are good structural typesin permafrost areas. For the culvert with acover slab made of reinforced c<strong>on</strong>crete. based <strong>on</strong>the different base c<strong>on</strong>diti<strong>on</strong>s, different structuraltypes can be chosen, for example, thec<strong>on</strong>crete base of a strip type, c<strong>on</strong>crete base insecti<strong>on</strong>s, etc.Buried depth of baseThe following value can be used to determinedthe depth.A) For design priciple I, The base depthshould be 2/3-3/& times the depth of the naturalpermafrost table. The base depth at the transiti<strong>on</strong>secti<strong>on</strong> from the body to the inlet and outletmust be deeper by 0.4 m than the depth ofculvert body. The base depth at the inlet andoutlet must be 0.25 m beneath the natural permafrosttable.B) For design priciple If. The base depth atthe culvert body can be determined by the calculati<strong>on</strong>of thaw settlement. The base depths ofthe body and the inlet and outlet must begreater than 1.00 m and 1.25 m respectively.The above methods are <strong>on</strong>ly adopted to thebase of the culvert with a corner slab made ofreinforced c<strong>on</strong>crete.Culvert C<strong>on</strong>structi<strong>on</strong>Culvert c<strong>on</strong>structi<strong>on</strong> in permafrost areas havemany special demands besides the general demandof culvert c<strong>on</strong>structi<strong>on</strong>,C<strong>on</strong>structi<strong>on</strong> seas<strong>on</strong>The cold seas<strong>on</strong>8 after Oct. and before Mayare the better c<strong>on</strong>structi<strong>on</strong> seas<strong>on</strong>s for theculverts designed with the principle of permafrostprotecti<strong>on</strong>.For the culvert design based <strong>on</strong> the principalof allowing thaw, the warm seas<strong>on</strong> frob June toSept. is the better c<strong>on</strong>structi<strong>on</strong> seas<strong>on</strong>; otherwise,special designs and countermeasures mustbe taken.C<strong>on</strong>structi<strong>on</strong> methodBecause the base depth is shallower and thesecti<strong>on</strong> of c<strong>on</strong>structi<strong>on</strong> ,is scattered, the openexcavati<strong>on</strong> method should be taken in culvertc<strong>on</strong>structi<strong>on</strong>. But the method has the technicalproblems that the labour c<strong>on</strong>diti<strong>on</strong>s are difficult,the efficiency is low and the water-heatstate of the permafrost is disturbed greatly.For resolving the disadvantageous problems. themethod of demoliti<strong>on</strong> and rapid excavati<strong>on</strong> isadapted to the permafrost al<strong>on</strong>g Qinghai-Xizanghighway.Notes <strong>on</strong> c<strong>on</strong>structi<strong>on</strong>1319
(A) In warm seas<strong>on</strong> c<strong>on</strong>structi<strong>on</strong>, the hase pitcan not be allowed to be exposed for lung periods.The exposure time was not l<strong>on</strong>ger than 15days and the c<strong>on</strong>structi<strong>on</strong> time for whole culvertproject was not l<strong>on</strong>ger than 50 days.(E) After excavated, if the whole or part ofthe base is built <strong>on</strong> the ice and soil-c<strong>on</strong>tentice layer, the design must he changed and thebase depth must be adjusted.(C) Water, stlow and high-water-c<strong>on</strong>tent soilin the base pits must be cleared up due to itslarge latent heat.(D) The artificial dist.urbance of permafrostmust be reduced as much as possible.(e) Before excavati<strong>on</strong>, all material used inthe base c<strong>on</strong>structi<strong>on</strong> must. be prcpareri.Cul.vert MaintenanccPreventinx damaRes in culverts . .(A) The c<strong>on</strong>nected secti<strong>on</strong> between the culvertand the pavement must be checked frequent-ly. Ifdamages ore discovcred, relevant maintenance andrepair countermt:asures must be taken,(13) A culvert platform base bears the load ofthe culvert and vehicles. The deformati<strong>on</strong>, displacement,cracking and set-tlqement of the baseshould nut. he allowed but when occurring shouldbe treated quickly.(C) The effect of water <strong>on</strong> the permacrostbase and culvert is great, the unb.lncked culvert.must he maintained and cleared when bl.ockageoccurs.(0) Cr,acking and expansi<strong>on</strong> joint.3 must bechecked to prevent water permeati<strong>on</strong>.CONC1,IISTONS'Two kinds of desipn principles of culvert.cngineering can bc laken. One is the principleoC maintaining the rrozen c<strong>on</strong>tlit.i<strong>on</strong>. Another isthe principle of allowing r.haw. The t.wo pricipleso r ~ l y adapt tu the weak and nun rhaw scttlernenrsoil. Otherwise other countcrme8sure must hetakcn.In !.he psrmafrvs~ area, the selectcd struc-I.ura1 typc oC culvert is very important for thequallty and cost qf erlgineering. The culvcrtwith il cover slab made with rcjnforced c<strong>on</strong>crete,t.he framework structurt. culvert with a coverslab made with reinforced c<strong>on</strong>cre!.e, the culverthox made with reinfor-r:ed c<strong>on</strong>crete and theculvert tuhe made with tin-plated alloy steelare gout1 structural types in permafrost areas.The ohservati<strong>on</strong> and analysis for typicalsectiorls ,al<strong>on</strong>g Qinghai-Xizang highway show that.the air temperature cffect <strong>on</strong> thc shallow layeris greater than the dccp layer. In the culvert.design, the base huried depths at the inlct andoutlet of the culvert should be more than 0.5-1.0 m than thaL of the culvert ccntre.The cold seas<strong>on</strong>s after Oct. and before Moyare the better c<strong>on</strong>structi<strong>on</strong> SF.RSOIIS for theprinciple of malntaining the frozen c<strong>on</strong>diti<strong>on</strong>.For the ptinciplc of allowing thaw, thr? warmseas<strong>on</strong> from .June to Sept. is the betterc<strong>on</strong>struct-i<strong>on</strong> ScRs<strong>on</strong>.
..NUMERICAL ANALYiIS OF TEMPERATURE AND STRESS ON THE CANALSUBSOIL DURING FREEZINGZhang Zhao'*'and Wu Ziwang''State Key Laboratory of Frozen Soil Engineering, LIGG,AS,China'The First Survey Design Institute, Lanzhou, Ministry of Railway of ChinaThis paper presents the numkrical simulati<strong>on</strong> analysis of two-demcnsi<strong>on</strong>al n<strong>on</strong>linear mathematicalmodel for the heat transfer in the siturated canal subsoil using the finite differences mothed. Elementsdivided based <strong>on</strong> the different isothermers at different moment, are used to calculate the stress of thefreczing canal subsoil by thc finite elements method of plane strain problem. The following main c<strong>on</strong>clusi<strong>on</strong>are obtained: The maximum values of stresses and deformati<strong>on</strong>s <strong>on</strong> the surface of the canal linningoccur at bottom and down slop; The stresses decrease with the increase of depth under the canal bottomand down slop; And the stresses value cyclically decrease and increase with the increase of depth <strong>on</strong> twosides slop of the canal because of the binding force of boundary. Finally, if the surface deformati<strong>on</strong> ofcanal lining is restricted to zero, the restrictive stresses of lining must reach up to 0.5~ 105N/.m2. Thecalculated result corresp<strong>on</strong>d relatively well with the measured results of similar c<strong>on</strong>diti<strong>on</strong> in site.rNTRODUCTION"-When the subsoil water freez,es due to low air temperature inwinter, thc subsoil volume will expand. The increment of volumeexpansi<strong>on</strong> will be much more c<strong>on</strong>siderable expecially for saturatedsubsoil in open system. While subsoil freezes and thus induces volumeexpansi<strong>on</strong>, the total expansi<strong>on</strong> of subsoil will be c<strong>on</strong>fincd partiallyby the presence of canal lining, When the increment ofvalume expansi<strong>on</strong> is more than the allowable deformati<strong>on</strong> of canallining, the damage of canal lining will happen. Therefore, thcchanges of tempcrature and moisture field are the basic reas<strong>on</strong> ofemcrging frost heave and frost heavc force. In this paper, the distributi<strong>on</strong>of two-dimensi<strong>on</strong>al unstable temperature field <strong>on</strong> the canalsubsoil was obtained by the numerical analysis of the finite diffcrencemothed. Based <strong>on</strong> the analysis results, the analysis methodof linite elements about plane strain problem werc carried out tocaculate the frost heave force. The closc relati<strong>on</strong>ship betwccn elasticmodulus of f-rozen soil and minus temperaturc was taker intoc<strong>on</strong>sidcrati<strong>on</strong>.Tf1E " STRESS DISTRIRUTION OF CANAL SUBSOIL. "- ~."Thc Determinati<strong>on</strong> of Temperature Distributi<strong>on</strong>"" ~" ." .Thc mathematic model to determin the temperature distributi<strong>on</strong>was based <strong>on</strong> the bad engineering geologic c<strong>on</strong>diti<strong>on</strong>; i.e. thegroundwater table is about 1.73-2.0m; The canal water is suppliedto groundwater when canal operating in summer; The subsoil frezzingbegins when the canal operati<strong>on</strong> stop in Nov. So thesimulnti<strong>on</strong> calculati<strong>on</strong> of saturated subsoil in open system werec<strong>on</strong>sidered. Assuming the canal to be unlimited l<strong>on</strong>g, homogeneoussubsoil, no transport of water and heat by evaporati<strong>on</strong> and no otherpotential energy, taking a vertical secti<strong>on</strong>, therefore, this processan bc described as two-dimensi<strong>on</strong>al parabolicsl partial n<strong>on</strong>lineardifferential cquati<strong>on</strong>. For Ihe definite problem, finite dilTerenccs bycnculati<strong>on</strong> were made, the differential equati<strong>on</strong> were differenced byCrank-Nichols<strong>on</strong> method. Finally thc problem were solvcd bymeans ol-TRM-PC with self-compiled program..Mcchtln$sModel- . - .".and -. Calculati<strong>on</strong> . Method. . . . -In the certain c<strong>on</strong>diti<strong>on</strong> of temperature and moisture, whilefrost heave is partially by the canal lining, heave pressure will act<strong>on</strong> canal lining. When the frost heave pressure is greater than theallowable deformati<strong>on</strong> strength of canal lining, the damagedeformati<strong>on</strong> of canal lining will occur. The finite element methodanalysis to calculate the stress distributi<strong>on</strong> in freezing subsoil isshown below. .ITaking a vertical secti<strong>on</strong> as a XOY coordinate plane, canall<strong>on</strong>g directi<strong>on</strong> as 2 coordinate axis, it is obvious that the stress,strain and deformati<strong>on</strong> <strong>on</strong> the secti<strong>on</strong> are <strong>on</strong>ly the functi<strong>on</strong> of xand y, This.is a plane strain problem. Analysis will be performed, under the following c<strong>on</strong>diti<strong>on</strong>s.I). The boundary force <strong>on</strong> the upper boundary of canal is thewcight of canal lining and the freezing force between canal liningand subsoil in the vertical directi<strong>on</strong> of canal lining. The lowerboundary is back-up roll.2). The subsoil is homogenous and isotropic frozen andunfrozen soil.3). Frost heave occurs in the directi<strong>on</strong> of heat flow by 100%.4). The defromati<strong>on</strong> in the directi<strong>on</strong> of x <strong>on</strong> the right and leftboundary are zero.Elements.""As zhu Qiang (1988) pointed out, when the freezing depthreaches the <strong>on</strong>e-thirds to two-thirds of maximum freezing depth,frost heavc force rapidly increascs, in the last period, it will be leap
Iincreasing until the frozen depth reaches the maximum value. i.e.The appearance of maximum frost heave force is corresp<strong>on</strong>dingwith the stable stage of maximum freezing depth. Therefore, based<strong>on</strong> the c<strong>on</strong>figurati<strong>on</strong> of isotherm line at 1760 hour obtained by finitedifferences analysis, the caculating range can be decided triangleelement as showed in Pig.].Elastic Modulus and Poiss<strong>on</strong>'s RatioThe experimental research (Wu Ziwang, 1983) indicated thatthe relati<strong>on</strong>ship behwpn elastic modulus of frozen soil and minustemerature can be described as following empirical formula,E=a+blrl" (1)where, m is a c<strong>on</strong>stant with less than I, generally taking 0.6. a and bare experimental c<strong>on</strong>stants related with soil type , for loess gmerallytaking 100 and 500.In cah~lati<strong>on</strong>, the temperature of subsoil are from -10°C attop to O°C at lower positi<strong>on</strong>. Themfore, taking the average of triangleelement into formula (l), the different elastic modulus of triangleelement of frozen' soil can be obtained. Poiss<strong>on</strong>'s rati<strong>on</strong> offrozen and unfrozen soil is 0.3 and 0.4 respectively.Nodal External LoadIn the calculati<strong>on</strong> of finite elements method, external forcewere transmitted at element nodes. Therefore, all kinds of loadmust be c<strong>on</strong>sidered at element node. In this analysis, there are twokinds of load, One is c<strong>on</strong>centrated load. Another is distributedload.The equivalent node load of distributed boundary force , asshown Fig.1, induced by dead load of lining and freezing force acted<strong>on</strong> the boundary, 1-2,2-3, ..., 18-19, of the upper boundary clrments,2,4, ..., 18, 20,..23. based <strong>on</strong> the experimental result of therelati<strong>on</strong>ship between leap anti-stretch strength of lining material inc<strong>on</strong>tact with frozen soil and temperature (Wang Jianjuen, 1986)',\ and l<strong>on</strong>g period strength is about <strong>on</strong>e-thirds leap strength (WuZiwang, 1981), the freezing force will be taking 3 .4~ 104N/ m2 inthis calculati<strong>on</strong>. Taking 0.07 m thick of lining and 2.0 X 10⁴N/ m3density of lining, the dedd load of lining will be carried out. Therefore,using virtual displacement priciple, the equivalent node loadwill be:I(Pl)"(Xf up x; Y; x; Y',)=-p(O PI 10 1 OO)T (2)I ( l y e =(x; r:x; Y;x: Y:)P= 2 Ir(sin(x)cox(x)sin(x)c(ls(x)Oo)'(3)2(PI' =(PI)' + (P*f (4)where, PI is dead load of lining, taking 0.02Kg / cm'; P, is freesin& forcc, taking 0.34 Kg / cm'; 1 is the thick of element, taking <strong>on</strong>eunit.The node load of distributed volume force, for eachhomogenous element, can be written as:Qy= q,t A (5)where A is area of element, q is specific gravity of element.Based <strong>on</strong> dead from equivalent priciple and virtual work principle,the node load of distributed volume force can be expressed asload vector type. i.e.The node load caused by initial strain cxpreeses the loadcaused by frost heave ratio in the heat flow directi<strong>on</strong>. The researchshows (Zhu Qiang, et. al. 1988) that, in the c<strong>on</strong>diti<strong>on</strong> of highground water table, the frost heave will be occured in the wholefreezing layer and frost heave ratib increases with the increasing ofdepth. The expcrimental research (Chen Xiaobai, 1983) also showsthis requlati<strong>on</strong>, and in the load pressure c<strong>on</strong>diti<strong>on</strong>, the frost heavewill be c<strong>on</strong>fined especially in low freezing ratio c<strong>on</strong>diti<strong>on</strong>.The freezing ratio <strong>on</strong> the typical positi<strong>on</strong> of canal secti<strong>on</strong> obtaincd from temperature field analysis is shown in Tab.]. Based <strong>on</strong>the background c<strong>on</strong>diti<strong>on</strong> and distributed force, the frost heave ratiofor eaEh freezing layer can be obtained as shown in Fig.2.Therefore, taking this as initial strain, the node load can be determined.Assumpting initial strain of any<strong>on</strong>e element is (e,), the equati<strong>on</strong>for calculating stress is become,Taking equati<strong>on</strong> (7) into following equati<strong>on</strong>:(F)' = tA(B)T(u) (8)The node force of element will be written as :Based <strong>on</strong> the relati<strong>on</strong>ship between the node force and the node dia-placement,Fig. I The diagram of elements decided* Wang Jianjun, (1986). The finite element calculati<strong>on</strong> for thecanal lining structure in was<strong>on</strong>al frbst.1322
w a )L 0 20lo OFig.2 The frost heave ratio of canal secti<strong>on</strong>Table 1. The freezing ratio <strong>on</strong> the typical positi<strong>on</strong>layers bottomI 2.9832 1.1403 . 1.4624 1.1905 0.987(i 0.5837 0.335slop embankmen3.255 3.8272.418 3.6962.155 2.8491.795 2.4001.508 2.0300.843 1.1020.558 0;782where,Finally, based <strong>on</strong> the relati<strong>on</strong>ship between displacement and strain,and the equati<strong>on</strong> (15), the node laad caused by frost heave ratiocan be obtained.Therefore, according to accumulati<strong>on</strong> principle of force, thenode load can be expressed as following equati<strong>on</strong>.and chahging the sec<strong>on</strong>d item of equati<strong>on</strong> (9) into minus <strong>on</strong>e,which is the node fQrCC caused by initial strain, the node loadcaused by initial strain can be written as:(WL (BT)(D)(8,)tA (1 1)The node equlibrium equati<strong>on</strong> and general rigid matrix, the nodeforces and the node loads of each element must be in equilibriumstate. Based <strong>on</strong> the equilibrium~<strong>on</strong>diti<strong>on</strong> of each node in directi<strong>on</strong>of x and y, the equilibrium equati<strong>on</strong> for each node can be set up.where,z: summing for the all elements in circle of node, Using theImatrix pattern, it can be expressed as:Taking equati<strong>on</strong> (11) into above equati<strong>on</strong>, the node equilibriumequati<strong>on</strong> expressed by node displacement can bc obtained.when, w] is general rigid matrix, 6 is tow vector of displacement,F is row vector of load.'- 1323
For the n-th node, the equilibrium equati<strong>on</strong> (21) will be thelinear algebraic couplcd equati<strong>on</strong> of 2n-th rank. Resolving a~(1p'N/m2) this . uy(IO'N/mZ) ~ x ( I O ~ , m 2 ~coupled equati<strong>on</strong>, the node displacement can be obtained. There-Oa3 0.5 0.7 0.9 0.3 0.5 0.7. 0,9 0.2 0.4 Q,6 Q.8fclrc, the element stress can also bc obtained by equati<strong>on</strong> (7).TheResull~_ C@culating9Through different kinds of frost heave ratio and c<strong>on</strong>fined c<strong>on</strong>- 160160cliti<strong>on</strong>, the stress distributi<strong>on</strong> al<strong>on</strong>g the directi<strong>on</strong> of horiz<strong>on</strong>tal and(a)(b)dcpth, and the displacement distributi<strong>on</strong> <strong>on</strong> the canal surface havebeen carried out by means oi' computer with self-compiledprogram. Fig.S The frost heave vs. frozen forceDISCUSSION AND . ANALYSTS.. . . . . When freezing pcriod is 1760 hours, thc Fig.3 shows the calculatedresults. Its regulati<strong>on</strong> is similar with the obscrvatcd data (seeFig.4), that is the maximum deformati<strong>on</strong> occurs at the bottom andslop down of canal, and the deformati<strong>on</strong> of upper part is small andalmost same. But the calculated values of deformati<strong>on</strong> are mor\than the obcrvatcd values because thc most disadvantage backgroundc<strong>on</strong>diti<strong>on</strong> wcrc c<strong>on</strong>sidered and the resisting heat efi'cct oflinninp nlaterial wcrc not c<strong>on</strong>sidered in this calculati<strong>on</strong>. The maximumfrost heave l'orcc is also at the bottom and down slop ofcanal. It IS why the failure oftcn occurs in these parts. It is given byc:~lcul;lti<strong>on</strong> that thc maximum frost heave stresses arc 0.9xIO'S ' nl' :Ind 0.5 x 10⁵N / m' in the horiz<strong>on</strong>tal and vertical dirsc11011rcqxctivcly.Fic.5 is thc cnlculnted value< nf frost heavc strcsscs al<strong>on</strong>gdzpth :It the points of' A,R,C,D,E. Rcc;\usc of cl'l'cct of the surfhccrcsrl-;lininp ;Ind thc +ad wight of subsoil. thc lrost deformiti<strong>on</strong> issm;111 <strong>on</strong> thc upper of' subsoil. and the F[rcS
Zhu Qing,1988. The distributi<strong>on</strong> of seas<strong>on</strong>ally frozen soil al<strong>on</strong>g thedepth. Journal of Glaciology and Geocryology, lO(1).Wu Ziwang, 1981. The expcrimental study of frozen strength bctweenthe foundati<strong>on</strong> and frozen soil. Anthorogy ofGlaciology and Geocryology, No.2. Sciense Press, Beijing,~129-139.Wu Ziwang, 1983. The characteristics of the strength and failure offrozen soil. The proceeding of Sec<strong>on</strong>d Nati<strong>on</strong>al <str<strong>on</strong>g>C<strong>on</strong>ference</str<strong>on</strong>g> of<strong>Permafrost</strong>. Gansu People’s Press. Lanzhu. p275-280.
THE RELATIONSHIP BETWEEN THE RAILWAY PROJECT CONSTRUCTIONAND ENVIRONMENT PROTECTION IN PERMAFROST AREAZhengQipuThe 3rd Design Jnstitute of Survcying and Investigati<strong>on</strong>The Ministry df RailwayIt has been practically provcn that various hazards will occur if the protecti<strong>on</strong> to the surrounding cnvlr<strong>on</strong>nlentis ignored during the design, c<strong>on</strong>structi<strong>on</strong> and operati<strong>on</strong> of railways. Such as the uncven settlementof roadbed, the frost heaving, cleavage and collapsc of house walls, frozen fold of thewater-supply pipes, cleavage of bridge pier, cracking of bridge surfaces, cleavage of the side walls in theinlctr and outlets tuunels.THE SIGNIFICANCE- OF THE ENVIRONMENTAL.PRO-. .-."ECYION IN PERMAFROST AREASThe naxinanlin pcrnmafrost area in the Northeast of' China, isa high latitude z<strong>on</strong>e of permal'rost, the climate is severely cold. Thesoil is in froten and thawcd states with the change of seas<strong>on</strong>al ternperaturcs.The cold resistant and water-favouring plants areaboundant. The landscape in the permafrost area and the main basicc<strong>on</strong>diti<strong>on</strong>s formcd the ccological features.In the permafrost arca. the strength increases suddenly whenthe watcr i n thc soil changes into ice. The bearingcapacity is almostequnl to zero when the Ice melts into watcr. ThisJeature of water inthe l'ro7cn soil decide whether the frozen soil has a very high bearingcapacity 21s well as deciding if thc capacity decreases sharplywhen the icc mclts. The frost heaving and melting settlement of thissort of' soil-sand rcally forms the basic difference of the mechanicalproperties of frozen soil from other soils due to the water in soillicczing and melting. If there is no freezing and melting of the waterin soil, there is no frost hazard of buildings. However, the enginecringfoundati<strong>on</strong> ol'various buildings in permafrost areas arc hurledin the pcrcnnlal frown soil layer with diltcrcnt foundati<strong>on</strong>s. Toprotcc~ thc stahIiLy and prevcnt dclormatmn of the buildings, theq;lbility o f thz foundati<strong>on</strong> hearing stratum has to be c<strong>on</strong>sidcrcdtil-st. In [hilt wily, it is necessary 10 protect the stability of the envir<strong>on</strong>mentsurrounding the perennially froten soil..How to preventenvir<strong>on</strong>nlental dcstucti<strong>on</strong> from thc cc<strong>on</strong>ornical activities, not thech,lnges Jur: 10 thc natural c<strong>on</strong>diti<strong>on</strong>s and regi<strong>on</strong>al climate factors.of hrgc pcriods. will bc discussed.In pt-actlcc It was provcd th:lt the various hazards would occur11. tllc protzcti<strong>on</strong> ot'thc surrclttndlny cnvir<strong>on</strong>ment during the dcsipn,L'<strong>on</strong>structl<strong>on</strong> and uperall<strong>on</strong> was ignored. Such as the uncvcn sctrlcn:mt01 ro:ldhcds , the frost hcnvlng, cleavage and collapse ofhouse u.:IIIs. 1'1-07rn I'old 01 water-supply pipes, cleavage 01 brdgcpiers, cracking of bridge surfaces, cleavage of side walls in inlet andoutlet tunnels.In the design of various buildings of railway projects inpcrmafrost areas, the design principle of foundati<strong>on</strong>s 0f'"protectingfrozen soil" is often adopted. So we often stress the stability of thetenlpcraturc licld between the c<strong>on</strong>tact surfacc of thc bcaring stratumand various foundati<strong>on</strong>s and frozen soil to preveqt the frozensoil from melting within the bearing stratum due to the temperaturechanges, which leads to the deformati<strong>on</strong> and destructi<strong>on</strong> of buildihgs.This opcni<strong>on</strong> is <strong>on</strong>e-sided as provcd in practice. Many buildingdamage are not due to the bad c<strong>on</strong>tact positi<strong>on</strong> between thebcaring stratum and foundati<strong>on</strong> boundary, but due to the incorrectsurface positi<strong>on</strong> of the buildings locati<strong>on</strong> and the lack of protecti<strong>on</strong>of the surrounding envir<strong>on</strong>ment, which leads to envir<strong>on</strong>mentalchanges and building damages.For example, deforestati<strong>on</strong> of theforest and vegelati<strong>on</strong>m surrounding the buildings, grazing and cultivati<strong>on</strong>,over cxcavating and borrowing soil without a plan, nodewatering ditch arragement, unreas<strong>on</strong>able cultivati<strong>on</strong> and irrigati<strong>on</strong>.A11 the above factors will lead to the destructi<strong>on</strong> of theecological equilibrium. The destructi<strong>on</strong> of the heat equilibrium ofpermafrost due to the destructi<strong>on</strong> of the ecological equilibrium, willcause the frozen soil to melt, and building damage, etc.From thc above examples, it is pointed out that during c<strong>on</strong>structi<strong>on</strong>in permafrost areas, not <strong>on</strong>ly the envir<strong>on</strong>ment protecti<strong>on</strong>in surveying, dcsigning and c<strong>on</strong>structing, needs to be payed attenti<strong>on</strong>to, but more importantly is to enhance the measurements toprotect the envir<strong>on</strong>ment during c<strong>on</strong>structi<strong>on</strong> and operati<strong>on</strong>. Somebuildings sufl'ered damage in the lirst tcn years of operati<strong>on</strong>. Thereas<strong>on</strong> was ignoring the envir<strong>on</strong>mental protecti<strong>on</strong> duringopcrati<strong>on</strong>. So it is very important to protect the cnvir<strong>on</strong>meni surroundingsduring c<strong>on</strong>structi<strong>on</strong> in permafrost areas.1326
THE RELATIONSHIP BETWEEN ENVIRONMENTAL PRO-TECTION "AND THE RAILWAYPROJECT CONSTRUC~. .. " ~ ~TIONThe railway pro,mt c<strong>on</strong>structi<strong>on</strong> in pcrn~afrost area mainly inDa and Xiao Hinggan Ling Mts. includes the line, roadbcd, apcrtureof bridge, turlnuel, house buildings, water supply and waterdrainage, communicati<strong>on</strong> and electric power, etc. For forty or moreyears, sincc the 195O's, the 2000 km railway has operated in thepermafrost areas of Da and Xiao Hinggan Ling Mts., in thenorthcast which has led to various building damages, the most scriousis caused by breaking driving, the lesser is slow driving by ratclimiting. Rased <strong>on</strong> the incomplete statistics 01' the 'nine lines in thepermafrost area by the Railway Ministry of Harbin, there are 124hazards <strong>on</strong>ly for line roadbeds. So, numbers of people are need torenovate and keep the line open. The cost of renovating, curing andmaintenance ate several milli<strong>on</strong> yuan each year, 6460 working daysand 5010 working days are respectivcly used to do rushreopennings, there were <strong>on</strong>ly two working day segments of Taheand Genghe in 1985. From the investigati<strong>on</strong> informati<strong>on</strong> for the 33stati<strong>on</strong>s and 230 buildings <strong>on</strong>ly 85 buildings are completely stable,36.9% in total, 110 buildings suffered hazards to different degrees,47.8% in total, 35 buildings can not to be uscd or need rebuilding,15.3% in total. I'Thus it is obvious that during railway operati<strong>on</strong>. hazards tothe railway are vcry serious duc to :I lack of cnvir<strong>on</strong>mentprotecti<strong>on</strong>. Not <strong>on</strong>ly is there an extremc waste in labour power andmaterial resources, but the safety during operati<strong>on</strong> is also aflicted.Now the relati<strong>on</strong>ship between the railway and cnvir<strong>on</strong>mental pro.tecti<strong>on</strong> is respectively recounted with examples as follow^I) Soil excavati<strong>on</strong> surrounding the buildinEs C:IVCF the th:Iwinghnsin to lntcrally and vcrtic:tlly, the frozen toll foundati<strong>on</strong> melts.settles and causcs damage the buildlnps.The old train-chcck house :It the 4l<strong>on</strong>pul Sr;\tl<strong>on</strong>. Yahn line,is located <strong>on</strong> the 2nd platf'orm 01' nc11-11 trtcr, thc lound;ltl<strong>on</strong> type ishurlcd plle with carlh lill, and the huarlng stlaturn IS w,tthln thepermafrost Ia'ycr. Recausc FOII ercavatl<strong>on</strong> ilnd filiinp IS nwr thetrain-check house, forming a man-made p<strong>on</strong>d, hold~ng wiltcr andice-forming for many ycars. Two ycars later after its opcratl<strong>on</strong>, thcthawing b;rm hclow the bottom ol-the p<strong>on</strong>d I$ lormed i~nd euplndsycar by year, al?d causcs the Iroxn so11 In thc hcarlne
!i1llt1W\Til; llr~ll;~'l<strong>on</strong> ,)I I.,,cI ,,:!I~;%: h \ ~ r ~ ~ nS~~~~r,l,~~1~t~~~l~n ~ c ~ ~ t 'The k 1 ) ! , !In$\Mll!hlll 1 ' ~ ~ C I U L ,lrL':l ~ ~ 01 O IIL, ~ ~ : 1 ~ ~ , Xl,ltl 1 I I I ~ ~ C! 1V 11~' ~ ~ ~ ~\I!< 1!1 1hs \(>::I:\.,.;, 1hC I11,lIIl ~h~l~;l~tctl~~lL~.111 l!l, 1, !l(>l!l
REFERENCES."" ....Zheng Qipu, 1986, The Harms <strong>on</strong> the Railway Project of GlacialHill and Its Preventi<strong>on</strong>, The Papers of The 5th <str<strong>on</strong>g>Internati<strong>on</strong>al</str<strong>on</strong>g>Enginecring Geology <str<strong>on</strong>g>C<strong>on</strong>ference</str<strong>on</strong>g> (T.A.E.G.) pl S57-1567. RuenouAircs, Argentina.
REGIJIARTTY OF FROST HEAVE OF THE SEASONALLY FROZENSOIL IN HETAO IRRIGATION AREA, JNNER MONGO121AZhou DcyuanAdministrati<strong>on</strong> Rureau of Hetao Irrigati<strong>on</strong> AreaY<strong>on</strong>gji, Inner M<strong>on</strong>goliaIn Hctao irrigati<strong>on</strong> arca, in comparis<strong>on</strong> with thrcc other northcrn regi<strong>on</strong>s in China, the freezing index isnnt very hlgh, but thc lcvcl of undcrground watcr is higher, the frcczing speed is lower, the amount ofwater migrati<strong>on</strong> is largc and the acti<strong>on</strong> of frost hcavc is vcry str<strong>on</strong>g, comprellensive acti<strong>on</strong> of moistureilnd heat results from a str<strong>on</strong>g frost hcavc. With thc theorics of' gray system and similitude and theirrncthods, a random-dcterminati<strong>on</strong> model is set up. and thc rcgularity of frost heave ol'seas<strong>on</strong>ally frozenFoil is revcnlcd more nccuratcly.SUIMMA RY OF THE NATURAL CONDITIONS.. ""... ... . ., .-.." .".... . .Y0ng.p w k lield for frazcn soil is located at the center of Hetaoirrigali<strong>on</strong> ere:,. 2.5 km northeast from Linhe suburb. The geographicalposlti<strong>on</strong> is 40°43'N, 104"44' E, and 1039.55 meters ahovcsca level. The hld bel<strong>on</strong>gs to seas<strong>on</strong>ally frozen soil arca.The soil in the irrigati<strong>on</strong> area is sand loam. Size compositi<strong>on</strong>;In:llysis and physio-chemistry properties are shown in Table I.In the+ test field, the fbllowing observati<strong>on</strong>s were arranged:fro72n depth, rrost amount, amnunf of water migrati<strong>on</strong>, frost heaveforce (tangcntial, normal, horiz<strong>on</strong>ttrl), meteorology in a small regi<strong>on</strong>,ground tcinpcrature and dcvclopment of underground water,CtC.The observati<strong>on</strong> method and the arranged forms were all d<strong>on</strong>eusing gcncral mcthods. An open type steel hoop standarddynarnomcrer was used to rncasure force, thermalcouples were appliedto mcnsure temperatures. The sec<strong>on</strong>dary meter is a UJ-33aVolt meter. Other methods werc general,PROCESSES OF FREEZING AND FROST HEAVE OF. .. .SE,W)N..ZI.I,Y FRO~EN SOILThrough observati<strong>on</strong> and test in the Y<strong>on</strong>gji test ficld forl'ro7cn soil from 1987 to 1990, thc following processes werercvcaled, they arc frozcn depth. watcr migrati<strong>on</strong>, amount of' frosthcil\*c. ilnJ I'rost hcnvc forcc. In gcncrnl, thcy can be dividcd as follolvingstcps:I. Unstcndy frcczing, from carly Novcmbcr to thc middle ofNovember. The ground temperature fluctuated around O'C, andtllcrc wns nn nltcrnate changc of frcczing in the night and thawingduring thc day. When the temperature was c<strong>on</strong>tinuously belowzcro, steadv frcczing formed.2. Slow frcczing, from late November to thc late December.The atomosphere rcnlperature decreases, the increase of the freczinpindcv \vas not rhst, the rreezing advance was slow, frozen depthsreached to 45 percent ofthe maximum, and water migrati<strong>on</strong>, frosthcnvc amount and frost heave force produced gradually.3. Quick freezing, Irom thc early January to early February.Tncrc was n c<strong>on</strong>tinous decrease in the atmosphere temperature, theTable 1. Size compositkn and physiochemistry propertiessand loamof\particle annlysis 'h dry Spccilic Void liquid plaslic plastic Saltdcsity gravity ratio limit limit indcx c<strong>on</strong>tcnt..,>\,\.r0.1 0.1-0.05 0.054.005 1330
~ --increase of the freezing index was fast with the fast freezing peneuati<strong>on</strong> which reached to 98 percent of the maximum value. At thesame time, the amount of yater migrati<strong>on</strong>, frost heave and frostheave force also developed quickly, but the frost heave force declined in the late period due to relaxati<strong>on</strong>.4. Steady freezing, from middle February to late February.The freezing index increased slowly and the freezing entered into a.steady freezing state with the frozen depth slowly reaching its maximum.The amount of water migrati<strong>on</strong> and frost heave remainedcomparitively steady and the frost heave force c<strong>on</strong>tinued to relaxand decrease.5. Thawing, form the early part of March to late April. Theatmosphere temperature increases to zwo, the frozen layer beginsto thaw quickly. Water migrati<strong>on</strong> comes to an end. The amount offrost heave and frost heave force decrease gradually until they vanished,CHARACTERISTICS OF FREEZING AND FROST HEAVEI . .- .OF SEASONALyYFR%ZEN ._SOILchxcteristics of FreezingThe freezing index was not very high. The heat flow was greaterin the ground. The depth of the annual fluctuati<strong>on</strong> layer 13.5 wasrnetcr (I-uo Xuepo, 1983), and the average temperature was 10.8T.The gradient of temperature in the frozen layer was smaller. Theaverage temerature gradient of the frozen layer was 0.096"C / cm insand loam. Freezing speed was slower. The average freezing speedwas 0.96 cm / d in the freezing period of sand loam. Frost depth\vas not very deep. Its averge value was 103.3 cm in sand loam.Characteristics - . . - of water migrati<strong>on</strong>~.Variance of the underground water table. .- ...When the irrigati<strong>on</strong> area wag irrigated in autumn, the undergroundwater tablc rose to its maximum and the ground surfacefroze. Before freezing thc undcrground water table was high, thenin the frcczinp period, the ground water table was in the decreasingprocess, which developed at almost the same spped as the freezingfr<strong>on</strong>t. Thc length of the penetrati<strong>on</strong> was relatively steady from thebeginning to the end and was in the range of capillary acti<strong>on</strong>.Rcdistributj<strong>on</strong> .. of water c<strong>on</strong>fht.In the freezing process, the water in the soil was redistributed,showing that the accumulated area of water gradually moved downand the total tcnds to enlarge. The water c<strong>on</strong>tent increased to,7.4percent in sand loam when it was compared with that before freezing.Characteristics of Frost He?ve"""." .The characteristics of frost heave in the laycr of sand loam. Itwas shown that the amount of frost heave took up 21.2 percent inthe upper part, 54.4 percent in the middle part, 23.4 percent in thclowcr part. The thickncss of each part was <strong>on</strong>e-third of the thickncwof frozen Inycr. When the freezing spccd was smaller, the sup.ply of wntcr \vas sul'licient, and a str<strong>on</strong>gcr frost heave was formcd.Thc average ratio was 8.7 percent.Charac,terist@ of Frost Heave ForceThe development of general tangential frost heave force wasparallcl with unit tangential frost heave force, and both maximumforces appear at the same time.Frost heave force increases with the increase of the frost heave.The maximum tangential frost heave force appeared when theamount of frost heave reached to 83 percent of its maximum horiz<strong>on</strong>talfrost heave force reached to 98 percent of its maximum values,then they dccreascd <strong>on</strong>e after another.The distributi<strong>on</strong> of horiz<strong>on</strong>tal frost heave force was not thesame al<strong>on</strong>g with the hqight of the wall. The outline of maximumforce appeared approximately in a trapezium which used the side ofthe wall as the bottom. The force was zero at the top of the sample,and was similar in the height of 0.3 and 0.7 height of wall reachedto their maximum. The force at the base of wall was 40 percent ofthe maximum-.THE REGULARITY OF FROST HEAVE OF SEASONALLY~" . ,. . ""FROZEN SOILReeularitv of Frozen DeothA linear relati<strong>on</strong>ship between frozen depth and the square rootof the freezing index was found, as shown in Fig.1. The equati<strong>on</strong> ofthe relati<strong>on</strong>ship is:H,= a+bF0.'where, a and b are coefficients relating to the soil, and they are-5.3310 and 3.7849, respectively for sand loam.The frozen depth HPad a power functi<strong>on</strong> with the depth ofunderground water table before freezing, as shown in Fig.2, the followingis the equati<strong>on</strong>:H,= a * Zbwhere a and b are coefficients related to soil, 0.0276 and 0.213 forsand loam.The random-dcterminati<strong>on</strong> model of frozen depth"According to the theory of comprehensive transpositi<strong>on</strong> ofwater and heat (Ding Dewen, 1983) and the method of similitude(Gao Min,1983), through therical analysis and regressi<strong>on</strong>, the random-determinati<strong>on</strong>model was cstablished as followings:H 3.29(-JW, + 0.262 "*whcre, H(-- frozen depth (cm), W,--water c<strong>on</strong>tent before refeeting(YO), 2-avcrage value of underground water table in the freezingperiod (cm).The Regularity of- Watcr migrati<strong>on</strong>-. ." -~The amount ofwatcr migrati<strong>on</strong>.. ."It had a linear relati<strong>on</strong> with the freezing index F, which isshown in Fig.3, and the equati<strong>on</strong> is:Q = a+bfwhcrc a and b -- coefficients related to soil, -0.2531 and 0.01 11Ibr sand loam.Random-dctcrminati<strong>on</strong> modcl of the amount of water migratio.. ... -. .. .".- .- - . .""Thc thcory and method to build the model are similar to ihe1331
where, Q-amount(cm), 2--averageing period.HQ = 2.4 x 10⁻⁶(L)zof water migrati<strong>on</strong> (%), Hrfrozen depthdepth of the underground water table in a freez-0 5 10 15 20 25 30 35\iF Frozen index ("C d)'-'Fig.1 Relati<strong>on</strong>ship bctween frozen depth and frcezing indexfor sand loamE-5 a-3C8eu.1101000~50 100 150 200 250 300Z,, Depth of underground water tablebefore freezing (cm)Fig2 Relati<strong>on</strong>ship betwccn frozen depih and the depth of un-c5 c.d EtLEderground water table before freezinglorThe Regularity of Frost HeaveThe amount of frost heave had a power functi<strong>on</strong> with thefreezing index F, as shown in Pig.4, and the equati<strong>on</strong> is :h= a Fbwhere a and b are coefficients related to soil, 0.3347 and 0.850 forsand loam.The frost heave h had a power functi<strong>on</strong> with the depth Z of theunderground water table, as shown in Fig.5, and the equati<strong>on</strong> is:h = ae-bzowhere a and b are coefficients related to soil, 0.1445 and 0.0020 forsand loam.Random-determinati<strong>on</strong> model of the amount of frost heaveThe theory and the method for establishing the model are similarto the above. The random-determinati<strong>on</strong> model of the amountof frost heave is:6H7/I = - 264.25 + 58.551n[ - 784 -t 324.4( W, + 2.4 X 10 - T)]Zwhere h--amount of frost (cm),. The other symbols are the sameas in the previous equati<strong>on</strong>s.The Regularity of Frost Heave Force". . . .- .~The outline of the measurcd point of tangential frost heaveforce had a relati<strong>on</strong> with the amount of frost heave, as shown inFig.6, and the equati<strong>on</strong> is:T = a+bhwhcre a and b are coefficients related soil, 0.4858 and 0.0145 forsand loam.The outline of the measured points of the normal frost heavcforce showed a linear relati<strong>on</strong> with the amount of frost heave, BSshown in Fig.7 and the equati<strong>on</strong> is:u = 2hbL0100~0: F, Freezing index ("C d)Fig.3 Relati<strong>on</strong>ship between water migrati<strong>on</strong> and freezing indexfor sand loam (1989-1990)erzLLi0 200 400 600 800 1000F, Freezing index ("C d)Fig.4 Relati<strong>on</strong>ship between frost heave and freezing indexfrozen depth model. Random-determinancyofwarcr miirntl<strong>on</strong> is as t'ollows:model of the amount
g 201 .\m$ 151 1991-1992Lloo}a=-50Z,, Depth of underground water tablebefore freezing (cm)0 20 40 M) goAmount of frost heave (mm)Fig.5 Relati<strong>on</strong>ship between water migrati<strong>on</strong> and the depth ofunderground water table before treezingFig.8 Relati<strong>on</strong>ship between horiz<strong>on</strong>tal frost force and frostheave (1987-1990)Is0 15 30 45 60 75h, Amount of frost heave (mm)'Fig.6 Relati<strong>on</strong>ship between tangetial frost force and frostheave8ecY)0t4002001 987- 1990*.*0 15 30 45 60h, Amount of frost heave (mm)Fig.7 Relati<strong>on</strong>ship between normal frost force and frost heavewhere a and b are coefficients related to soil, 0.6706 and 0.0546 forsand loam. The outline of the measured points of the horiz<strong>on</strong>talfrost heave force had a power functi<strong>on</strong> with the frost heave amounth, as shown in Fig.8, and the equati<strong>on</strong> is:u,= a hbwhere a and b are coefficients related to soil, 0.6706 and 0.0546 forsand loam.CONCLUSIONThe regularity of frost heave in the area was affcctcd and limitedby the c<strong>on</strong>diti<strong>on</strong>s of the natural envir<strong>on</strong>ment and irrigati<strong>on</strong> activity in the Hetao irrigati<strong>on</strong> area, Inner M<strong>on</strong>golia. In the area, thefreezing index was not very high compared with the three othernorthern regi<strong>on</strong>s in China, but the underground water table wascomparitively higher. In the process of freezing, because of thecomprehensive acti<strong>on</strong> of water and hest transfer, the opcn type offrost heave was formed with the decrease of freezing speed, theamount of water migrati<strong>on</strong> was large, the frozen depth was notvery deep, but the frost heave was very str<strong>on</strong>g and the frost heaveforce was also large. So these cause the intense destructi<strong>on</strong> toditches and hydraulic engineering buildings.REFERENCE:-Ding Dewen, 1983, Calculati<strong>on</strong> of Frost Depth and Moisture C<strong>on</strong>diti<strong>on</strong>in An Open System.Proceedings of Sec<strong>on</strong>d Nati<strong>on</strong>al<str<strong>on</strong>g>C<strong>on</strong>ference</str<strong>on</strong>g> <strong>on</strong> <strong>Permafrost</strong>.Gao Min and Ding Dewen, 1983, <strong>Research</strong> <strong>on</strong> The Amount ofFree Frost-Heave Soils by Thermodynamic Method, Professi<strong>on</strong>al Papers <strong>on</strong> <strong>Permafrost</strong> Studies of Qinghai-Xizang Plateau.Luo Xuepo and Ding Dewen, 1983, Determinati<strong>on</strong> of Thermal REgime in Annual Fluctuati<strong>on</strong> Layer of Groud Temperature,Proceedings of Sec<strong>on</strong>d Nati<strong>on</strong>al <str<strong>on</strong>g>C<strong>on</strong>ference</str<strong>on</strong>g> <strong>on</strong> <strong>Permafrost</strong>.
FOSSIL PERIGLAC,IAL LANDFORMS IN THE SHENNONGJIA MOUNTAINS, CHINAZhou Zh<strong>on</strong>gminChangsha Normal Univers.ity of Mater Xe,sources & Electric PowerTWO fossil lines of block fields of the Late-Glacial time have been preserved atthe elevati<strong>on</strong>s of 2800 m and 2900 m in the regi<strong>on</strong> of the highest peak ofShenn<strong>on</strong>gjia Mounta*ns, and to the northeast at Laojunshan Mountain, The blockfields, nivati<strong>on</strong> hollows and cryo'planati<strong>on</strong> terraces differ both in distributi<strong>on</strong>height and in scope within the above menti<strong>on</strong>ed lines, therefore different namesare designated for them, i.e. the early Shenn<strong>on</strong>gjia periglacial stage and alater <strong>on</strong>e. This is probably related to the cold and dry prairie climate in EastChina that evolved southward to the riparian basin of the Yangtze River in thelate period of the Upper Pleistocene in the year of 18000 B.P. The fossil blockfield lines represent the geomorphic boundary of the palaeoclimate.DEFORMATION OF TYE FOSSIL PLANATION SURFACE ANDTHE PROCESS OF T!IE UPLIFTING STAGESThe area of the Shenn<strong>on</strong>gjia Mo,untains is 3250km', It is the effect of several processes, eg.land formati<strong>on</strong> after the Indo-China movement andsubsequent regressi<strong>on</strong>, tect<strong>on</strong>ic folding andfaultinfi ?+Iring the Yanshan movement, and upliftingof tht mountains in stages since the Himalayamovement. 'She l<strong>on</strong>g period of planatian acti<strong>on</strong>resulted'in an undulating quasi-plain, that is,the present summit planati<strong>on</strong> surface left overat the highest peak of 3000 m a.s.1. It isequivalent to the ground surface in the Beitaistage, which is also named the Huanghunlingstage.Below the above menti<strong>on</strong>ed fossil geomorphicsurface is another broad and flat denudati<strong>on</strong>bench, represented by the Dajiuhu erosi<strong>on</strong>corrosi<strong>on</strong>quasi-plain of 1800 m. This is theground surface in the Western Hubei stage. Therelevant depositi<strong>on</strong> is the red stratum coveringthat of the above Cretaceous period. It isequivalent to that of the Tangshian stage andhence bel<strong>on</strong>gs to the Miocene Epoch.Since the first act of the Himalaya movementat the end of the Miocene Epoch, the WesternHubei stage quasi-plain started uplifting tothe entirety of 500-600 m. Thereafter a denuda-ti<strong>on</strong> surface of about 1200 m a.s.1. was formedat the foot of the mountain and is ,called theMountain Initial stage. This is equivalent tothat of the Fenhe stage and bel<strong>on</strong>gs to the ageof Pliocene (Yang L.K., 1991) to the earlyPliestocene.The sec<strong>on</strong>d act of the tlimalaya movement wasfrom the end of the Pliocene to the beginning ofthe Quatern&y. The Shenn<strong>on</strong>gjia Mountains wereuplifted by faulting and differential processes,leading to the deformati<strong>on</strong> of the planati<strong>on</strong>surface, The planati<strong>on</strong> surface of the Huanghunlingstage was deformed into two benches of3000 m and 2600 m in elevati<strong>on</strong>; those of theWestern Hubei stage were 1800 m and 1500 m; andthose of the Mountain Initial stage were 1200 mand 1000 m. The adjacent Yangtze River and thelarge tributaries originated from the Shenn<strong>on</strong>gjiadeep undercut, which was around 600 m. Thetime of the crust uplifting and deep rivercutting was named the Three-Gorge stage. Based<strong>on</strong> the explorati<strong>on</strong> of Huyiatan and Gaojiadianin Yichang city, and to Gulaobei and Luyianch<strong>on</strong>gin Zhijiang county, we discovered that the LowerPleistocene stratum was mainly a set of fluvial-lacustrine depositi<strong>on</strong>s. This sug8esred that therivers sharp cutting acti<strong>on</strong> mainly occurredafter the Middle and Upper Pleistocene, whilethe terraces developed after the Upper Pleistocene.and <strong>on</strong>ly took place at the valley slopesbelow 150 m in altitude. The height of upliftingsince the Upper Pleistocene, therefore. accountsfor less than <strong>on</strong>e fourth of the total amount inthe Quaternary. The Physiographic stage revealedthat when compared with the adjacent YangtzeRiver valley bottom, the Shenn<strong>on</strong>gjia Mts.uplifted about 1200 m since the Neogene, and theuplifting height during the Quaternary was ashigh as 600 m. It is, therefore, c<strong>on</strong>cluded thatthe climatic changes in the highest peak ofShenn<strong>on</strong>gjia Mrs. since the late period of theUpper Pleistocene of the Quaternary wasindependent <strong>on</strong> the crust tect<strong>on</strong>ic uplifting,but dependent <strong>on</strong> the global clirr,rtic oscilla-ti<strong>on</strong>s. The up and down fluctuati<strong>on</strong>s of theperiglacial landforms and the vegetati<strong>on</strong> z<strong>on</strong>ewas mainly due to the influence of the East-,Asian m<strong>on</strong>so<strong>on</strong> circulati<strong>on</strong> changes since thelast glaciati<strong>on</strong> in the late period of the UpperPleistocene,OUTLINE OF THE PALAEO-CLIMATE ENVIRONMENTBEFORE THE HbLOCENEShenn<strong>on</strong>gjia has an ancient origin of floracomp<strong>on</strong>ents. It has many tertiary relic plantspecies. Some examples of such plant species1334 -
are given below.Ravidia involucucrata ball, deciduous wood,grows at moist lowlands ind valley bottomsbetween 1100-1600 m a.s.1.Ginkgo liloba L. grows <strong>on</strong> hilly land andplains that are below 1000 m in elevati<strong>on</strong>.Liriodendr<strong>on</strong> L. is the tertiary palaeotropicalrelic species.The tertiary re1i.c plant species in Shenn<strong>on</strong>gjiaMts. are more than ten according to preliminarystatistics.Up to the end of the Neogene and the heginningof the Quaternary, the highest peak mightreach 2500 m a.s.1. and two planati<strong>on</strong> bencheswere distributed at the elevati<strong>on</strong>s of 1200 mand 600 m.During our explorati<strong>on</strong> to the summit of thehighest peak from the northern slope, we foundneither Eossil glacial erosi<strong>on</strong> landforms orfossil moraine. We climbed to the summit fromthe eastern gully al<strong>on</strong>g a large block streamwith an elevati<strong>on</strong> of 2500 rn at the terminal,what we saw were all of fossil periglacialgeomorphogenetic scenery.2903 m a.8.. The vertical range of distributi<strong>on</strong>is more than 200 m. The basal volcanic brecciathat made up the block field had well developedjoints. The frost wedged blocks varied from0.5-2 m in diameter and were comm<strong>on</strong>ly angular in,shape. The depth was usually 5 m or so (Photol).The regi<strong>on</strong> of the highest peak and, about20 km to the northeast, at Laojunshan Mt. had afossil block field line at 2800 m a.s.1. Besidesthe volcanic breccia in the compositi<strong>on</strong> of theblock field, there were also dolomite limest<strong>on</strong>e,siliceous limest<strong>on</strong>e and even Silurian greensandst<strong>on</strong>e (Photo 2).CLIMATIC ENVIRONMENT DURING HOLOCENE AND THEPRESENTIn 1984, the author studied the drill coredata about the peat layer in, Dajiuhu regi<strong>on</strong>reported by Zhou Minmin. According to theanalyses of the pollen assemblage and I4C dating,Zhou proposed that the vegetati<strong>on</strong> and envir<strong>on</strong>mentdevelopment in Dajiuhu regi<strong>on</strong> underwentthree stages. (1) Between 12030-8033 years ago,pollens were mainly of Picea, Pinus, Tauga, Abies,etc. The accompanied broadleaf plants wereQuercus, Juglans, Fagus, Betula, Carpinus, Ulmus,etc. (2) Between 8033-3800 years ago, pollenswere mainly of Juglans, Fagus, Quercus, Ulmusand Carpinus. About 5000 years ago, Keteleeriadavidiana, Tsuga, Podocarpus and other c<strong>on</strong>iferwoods increased markedly. (3) From 3800 yearsago to the present, pollens were mainly ofQuercus, Fagus, Betula, Ulmus, Toxicodendr<strong>on</strong>and Carpinus.'From the first stage, we can see that therewere abundant c<strong>on</strong>ifers that resembled thepresent vegetati<strong>on</strong> type at over 2000 m a.s.1.The small amount of peat mingled with the siltclay in profile suggests a dry and humidalterati<strong>on</strong> of the climate. The sec<strong>on</strong>d stagereflected that the vegetati<strong>on</strong> was dominantlycomposed of warm and humid favoring plantspecies. The Tsuga genus is the inherentcomp<strong>on</strong>ent in the vertical z<strong>on</strong>ati<strong>on</strong> of subtropicalorographic vegetati<strong>on</strong> in China. Fagus,Juglanwand Quercus are the major comp<strong>on</strong>entsof the present subtropical orographic evergreenand deciduous broadleaf mixed forest. Thissuggested that the Keteleeria davidiana, Tsuga, ,Podocarpus and other broadleaf arbores hadtheir flourishing period around 5030 years ago,ie. the Hypsithermal Interval. Using the presentmeteorological data of Dajiuhu regi<strong>on</strong>, we coulddeuce that the mean annual air temperature about5000 years ago was at least 4-3'C higher thanat present. The third stage was similar to thepresent comp<strong>on</strong>ents of vegetati<strong>on</strong> type in Dajiuhuregi<strong>on</strong>.FOSSIL PERIGLACIAL LANDFORMSBlock field: It has a large c<strong>on</strong>tinuous distributi<strong>on</strong>in Huazh<strong>on</strong>gdin and its periphery area,down to the gentle slope of Feishaiyazhi atNivati<strong>on</strong> hollows: One is situated in thevicinity of the fossil block field line at 2900m a.s.1. in the western side of Huazh<strong>on</strong>gdinpeak. It developed in the volcanic breccia anddolomite limest<strong>on</strong>e, and was usually 10-20 m indiameter (Photo 4). The other is near the fossilblock field line at 2800 m a.s.1. in the northernslope of Dashenn<strong>on</strong>gjia, It developed in thedolomite limest<strong>on</strong>e and was characterized bylacking rock basin and ice threshold and alsolacking a complete ledge. In c<strong>on</strong>trast, it31335
ottom was rather flat and was nearly eight <strong>on</strong>the flat index. The bottom of the hollow waslarge and the largest could reach 150 indiameter. Some of the hollows c<strong>on</strong>nected withthe flat floor valley (Photo 5).Flat floor valley: It is a kind of periglacialwide valley. It mainly developed in dolomitelimest<strong>on</strong>e <strong>on</strong> the northern slope of Dashenn<strong>on</strong>gjia.There existed nivati<strong>on</strong> hollows in the sourcearea of the flat floor valley. There alsosurvived a fossil rock-bar of 20 m high andfossil frost heaving of about 5 m high <strong>on</strong> thetwo sides of the slopes of the flat floor valley.No moraine waa found in the valley floor (Photo 6).Photo 5. Ni~ati<strong>on</strong> hollow Photo 6. Flat floorin the early ~ ~ e n ~ v~lley o n ~ in j the ~ ~ earlyperiglacial stage. ~ h e perigla- ~ ~ ~ ~ ~ ~ ~ acia1 stage.Cryoplanati<strong>on</strong> terrace: There Is well developedsmall bedrock terrace at 2900 m a.s.1. betweenthe southern slope of Huazh<strong>on</strong>gdin and Feichaiyia.The terrace inclines slightly downward and is50 m in width. It has a veneer of angular debrisresulting from frost weathering. There can beseen apparent bedrock steep treads in the background.There can be seen another old cryoplanati<strong>on</strong>terrace, which is 120 m in width, at 2750 ma.s.1. under the above menti<strong>on</strong>ed terrace(Photo 7).Block slopes: Their distributi<strong>on</strong> is mostobvious in elevati<strong>on</strong>s of 2800-2600 m. They areaccumulati<strong>on</strong>s of angular and varying sizes ofblocks c<strong>on</strong>tinuously covering the 30' bedrockslope surfaces. The lithological property offragments <strong>on</strong> the block slope <strong>on</strong> the slopes at2600 m a.s.l., the block slope, c<strong>on</strong>sisting ofvolcanic breccia fragments, covers the oldblock slope c<strong>on</strong>sisting of dolomite limest<strong>on</strong>efragments. Different block slopes c<strong>on</strong>nectednear the toea and thus formed a periglacialdebris fan.St<strong>on</strong>e streams: Masses of basal volcanicbreccia boulders with poor anRul.arity streameddown the gully bed of the Eastern Gully from anelevati<strong>on</strong> of 2850 m to 2500 ,n. This is a wellpreserved st<strong>on</strong>e stream, which is 3-5 m in depthdnd 10 m in width. The boulders are usually0.5-2 m in diameter and their length axes areparallel to the gully bed, There are Sinarundinarianitida growing in the fissures of therocks. There are no protalus rampart developingin the end of the st<strong>on</strong>e stream (Photo 8 ).Frost weathering collapsed cliff: It wascreated under the complex situati<strong>on</strong> c<strong>on</strong>sistingof periglacial agents, glSavity and water flowacti<strong>on</strong>. In the source area of the Eastern Gullyat 2850 m a.s.l., the nearly erected collapsedcliff is as high as 30 m.Thin layered loess-like depositi<strong>on</strong>s: They canbe seen at the foot o f mountains, valley slopesor valley bottoms, and are characterized by0.5 m thick loess-like materials mingled withvolcanci breccia, limest<strong>on</strong>e and feldsparquartziferous sandst<strong>on</strong>e debris.In summary, the distributi<strong>on</strong> of the mainfossil periglacial landforms in Shenn<strong>on</strong>gjia areshown in Fig.1.THE SIGNIFICANCE OF FOSSIL PERIELACIAL LANDFORMSIN SHENNONGJIAHuazh<strong>on</strong>gdin peak, 3105 m a.s.l., is the sec<strong>on</strong>dhighest peak in the eastern Chinese mainland.It is <strong>on</strong>ly lower than Baxiantai (33"56.6'N,107"46'E, 3767.2 m a.s.1.). the highest peak inTaibaishan of the Qinling Ridge. Its latitudeis 2.5' southward of the Qinling Ridge and issituated in the subtropical z<strong>on</strong>e. It is thetransiti<strong>on</strong>al bridge of the mountain regi<strong>on</strong> irthe west to the hilly land and plain regi<strong>on</strong> inthe east. It is more than 1000 m higher than Mt.Huangshan (1841 m a.s.1.) and Mr. Lushan (1426 ma.s,l*).During the peak of the Last Glaciati<strong>on</strong> atabout 18000 B.P., there was a wide distributi<strong>on</strong>of grassland and sparse tree prairie, and loessdepositi<strong>on</strong>. It reached southward to Nanjin city,Wuhu Lake to Taihu Lake and the southern areawas al<strong>on</strong>g the Yangtze River bank, and to Jiujiangcity in the west. It bel<strong>on</strong>ged to an arid
REFERENCESMa Qiuhua and He .Yuanqin, (1988) Features ofmoraine and glacial period <strong>on</strong> Mr. Taibaishanduring Quaternary, (In Chinese), Journal ofGlaciology and Geocryology, Vol.10, No.1.Yang Liankang, (1991) Dlscovery of relic fluvialpebbles <strong>on</strong> planati<strong>on</strong> surface in the Three-Gorge secti<strong>on</strong> of Changjiang, (In Chinese),Acta Geographica Sinica, 46(3): 373-374,Zhou Minmin, (1985) Vegetati<strong>on</strong> and its envir<strong>on</strong>mentin Dajiuhu reRi<strong>on</strong> of Shenn<strong>on</strong>gjia duringHolocene, (in Chinese), Thesis of M.S.,Tnst. of Geography, Academia Sinica.Fiy.1 Distributi<strong>on</strong> of fossil periglacial landformsin the highest peak regi<strong>on</strong> of the Shenn<strong>on</strong>gjiaMts, (1:lOOOOO)1. peak: 2. block field: 3, st<strong>on</strong>e fortress;4. block slope: 5, nivati<strong>on</strong> hollow:6. fl.at floor valley: 7. Ice (soil) wedge;8. rock bar: 9. cryoplanati<strong>on</strong> terrace:10. frost weathering collapsed cliff;11. sc<strong>on</strong>e stream: 12. precipice:and cold climate envir<strong>on</strong>ment, with the meanannual air temperature being at least 6°C lowerthan present and even 10-12°C lower during thecoldest period, The annual precipitati<strong>on</strong> was300 mm. The climate didn't favour the rlevelopmentof glacial morphogenetic features butfavoured the growth of periglacial morphogeneticfeatures.In the highest peak of the Shenn<strong>on</strong>gjia Mts.and Laojunshan Mt., many kinds of periglaciallandforms developed in the early Shenn<strong>on</strong>gjiaperiglacial stage during the late period ofthe Upper Pleistocene. The fossil block fieldline (2800 m a.s.1.) was representative and thegrowth of the flat floor va-lley was the mostobvious feature. A clear fossil block field linewas preserved at the altitude of 2900 m in thehighest peak of the Shenn<strong>on</strong>gjia Mts. The sec<strong>on</strong>dperiglacial process retreated to the summit andthe extent shrunk greatly. This can be extrapolatedfrom each single periglacial landformthat was greatly less in scope than the former<strong>on</strong>e. The well preserved fossil block fieldacted as the striking feature of this sec<strong>on</strong>dperiglacial climate.The Qinling-Taibai Glaciati<strong>on</strong> during the lateperiod of the Upper Pleistocene c<strong>on</strong>sisted of twosubglaciati<strong>on</strong>s (Ma Q.H. and He U.Q., 1988).There were also two occurrence3 of periglacialprocesses during the Late Glacial time inShenn<strong>on</strong>gjia. Whether or not they coincided inchr<strong>on</strong>ology needs further precise explorati<strong>on</strong>with age dating. The Quaternary periglacialphenomena in Mt. Huangshan, wjth a southwardlatitude and c<strong>on</strong>stituted hy granite, are nottypical, while that in Mt. Lushan are unclear.Thus the fossil periglacial morphogenetic featuresin Shenn<strong>on</strong>gjia are of great value.Rased <strong>on</strong> the analyses of the physiographicstage, palaeobotany, present vegetati<strong>on</strong> andclimate situati<strong>on</strong>, it is evident that all ofthe Shenn<strong>on</strong>gjia Mountains were c<strong>on</strong>trolled in aperiglacial envir<strong>on</strong>ment <strong>on</strong>ly at the time of theLast Glaciati<strong>on</strong> during the Quaternary, and endedprobably before the start of the Holocene.1337 *
THE RESEARCH OF POROUS SLA3 STRUCTURES FOR PREVENTINGFROST DAMAGE OF ROADSZhu Yunbing' and Guo Zuxin''Yichun Management Department of Roads, Weil<strong>on</strong>gjiang*Harbin College of Building and EngineeringIThe active mechanisms uf porous slab struct~r~s are analyzed from two aspectsof definite quantity and quality in order that the frost damage of roads canbe solved in engineering.INTRODUCTIONFrost heave and potholes cause serious damageof roads in seas<strong>on</strong>ally frozen soil. Siliceousshale material has an extensive distributi<strong>on</strong> InHeil<strong>on</strong>gjiang. Some properties of siliceous shalematerial are tested, The soft and low strengthsiliceous st<strong>on</strong>e cannot be used as a material inthe road structure layer, but in order todevelop and fully use the resources, mingledmateria 1 is designed basehd <strong>on</strong> the principle ofsuspens i <strong>on</strong>, and the crush rate and the strengthare tes t ed. The results show that the compressedelastic modulus of the mixed material is 200-300MPa and forms a porous slab structure. Becauseof the 1 ow cost and high protecti<strong>on</strong> of lime, themingled material of siliceous st<strong>on</strong>e with a grainsize of 20-30 mm is mixed with a soil with alime co Nn tent of 1CI in the laboratory, andanalyzed. The mingled material is called sili-C ~ O U S st<strong>on</strong>e which is used not <strong>on</strong>ly in the baseof sec<strong>on</strong>dary highways but also in the subbase ofhighways.PHYSICAL PROPERTIES OF MINGLED MATERIAL1. Hydraulic PropertiesThe porosity of the siliceous st<strong>on</strong>e is ashigh as 35-40% and its pore size is tiny. Table1 lists the water distributi<strong>on</strong> situati<strong>on</strong> ofsiliceous st<strong>on</strong>e and lime soil under optimumwater c<strong>on</strong>tent of shaping for mlngled material,optimum water c<strong>on</strong>tent of shaping is about 19%in experiments.The pore structure of siliceous st<strong>on</strong>e has anexcellent water stability (see Fig.1).Siliceous st<strong>on</strong>e docs not expand under waterinfluence. The volume expands after the limesoil absorbs the water and then decreases andvanishes because of the pores of siliceous st<strong>on</strong>e.This can prevent the structures volume fromexpanding due to frost acti<strong>on</strong> pro,duced in theroad bed in poor drainage c<strong>on</strong>diti<strong>on</strong>s. This issignificant for road structures in cold regi<strong>on</strong>s.Tahle 1. Water c<strong>on</strong>tent of materials-Type ofFinalWater c<strong>on</strong>tentof materialmingled water before miximaterial , c<strong>on</strong>tentSiliceousLimest<strong>on</strong>esoil5:5 19% 23% 16.85:3:7 19.6% 23.6% 18.5%t 30 /"Fig.1 The curves of volume expansi<strong>on</strong> andabsorbing rate2. Freezing Stability(1) In order to simulate the upper stratumof the road subjec,t to load, samples are teatedunder the c<strong>on</strong>diti<strong>on</strong> of lateral c<strong>on</strong>straint.(2) After the sample was saturated with waterfor hours, the sample went through five freezethawcycles.1338
(3) Freezing temperature was -2O"C, for four ceous st<strong>on</strong>e mingled material of two gradinghours.proporti<strong>on</strong>s are taken for the base course ofThe thawing temperature is an ambient <strong>on</strong>eadvanced road surfaces and the trial road sec-(about 10-15'C), the time for saturati<strong>on</strong> is 2ti<strong>on</strong>s are c<strong>on</strong>structed.hours, After the samples are processed by theThe surface layer of the original road is 10above menti<strong>on</strong>ed methods, the volume expands and cm of asphalt c<strong>on</strong>crete. 'The base course has twothe strength loss is shown in Fig.2. After five kinds of 50 cm thick lime of semiaridity andfreeze-thaw cycleb, the mingled material.has an stability with steel dregs of fly ash and.lime.fairly good stability.In c<strong>on</strong>siderati<strong>on</strong> of the heat preservati<strong>on</strong>'property of mingled siliceous st<strong>on</strong>e, because itis the base course, its thickness is decreasedby 10 cm in the basis of the original design(Fig.3). The structure of the siliceous st<strong>on</strong>eizarO - Osecti<strong>on</strong> is calculated in a three-layer system.%wThe design requirement is met in the areas ofthe downbending value and pull stress.@* - 40/ 00 - 2- u-4: I t 25cm I 3ocm "t1loCmflyash Isilic<strong>on</strong> st<strong>on</strong>es I silic<strong>on</strong> st<strong>on</strong>es ' "r8 I mingle -&rial I mingle materid I- 55 1 I 3:7 I3:7 95 7:3 1silic<strong>on</strong> st<strong>on</strong>es : lime soilFig.2 The curves of volume expand andlossing strengthSiliceousst<strong>on</strong>es C 325.9 Kcal/rn'.O'C:mingledmaterial(5:5)0.65 Kcal/m.h."CSiliceousst<strong>on</strong>esmingledmaterial(3:7)" -. "_CV 352.2 ' Kcal/me."CA,1.20 Kcal/m.h.'C-Wet clay W 0.28 l0OXc OT 587.3 K~al/m~.~'C:COTY 511.2 Kcal/m.h.'CXTM 1.301.05Kcal/m.h.'CKcaL/m.h.'CATfoundati<strong>on</strong>4ocmI3. Thermal PropertiesThe coefficient of thermal c<strong>on</strong>ductivity forplus and negative temperatures are measured byFig.3 Secti<strong>on</strong> of the road surface structureinstalling instruments based <strong>on</strong> the line of heatsource principle in a transient state,FIELD TESTINGSome thermal parameters are given in Table 2.The measuring results show that the thermalFrost damage of road structures in the northc<strong>on</strong>ductivityand heat capacity of mingledern regi<strong>on</strong>s is mainly displayed by frost heavematerial are less than that of the base materials. and potholes.So the property of preventing freezing and heatBased <strong>on</strong> observati<strong>on</strong> of 05 point datum markspreservati<strong>on</strong> is very good and it can prevent the in a trial road secti<strong>on</strong> from the beginning offreezing thickness of the road surface.the winter until February, the datum markschanged by 1 cm. Y<strong>on</strong>-uniform frost heave basi-Table 2. Thermal parameterscally did not occur (Table 3). Subsidence deformati<strong>on</strong>and net fissures did not occur untilMaterial Parameters Value Unitthawing in the spring. The total downbendingvalue is small (see Fig.4, Table 4). It wasCV L73.0 obvious that the froit-damage preventj<strong>on</strong> ,.lethodKcal/m'.*CAsphaltx 0.75 Kcal/m.h."Cis effective,x' 1.03 Kcal/m.h."CCONSTRUCTION OF TRIAL ROAD SECTIONRased <strong>on</strong> thc analysis of the ambience, sili-8A-\.,- 8-3 40 -8 \7 - 120 'CI:,.v2 so-\ ,#I 112 4M<strong>on</strong>thFip.4 Downbending value vs. time- mingled material of siliceous st<strong>on</strong>es;steel dregs;_""-" . . f l y ash.
~ ~~ ~~~~~~Table 3. Observed frost heave of the porous slabFrost heave (cm)Structuretype 8612 87.1 81.2 87.3 87.4Max Min Max Min Max Min Max Hin Max Mi5:5 0,92 0.90 1.10 1.00 1.23 1.21 1.25 1.21 1.24 1.203:T 0.93 0.90 1.14 1.00 1.25 1.18 1.25 1.23 1,.25 1.23Steel dregs 0.89 0.89 1,15 1.13 1.30 1.25 8.40 8.01 8.41 8.40Fly ash 0.91 0.90 1.20 1.13 1.35 I .23 8.71 8.23 8.70 8.53Table 4. Calculated downbending valuesRoadsecti<strong>on</strong>typesCalculated downbending value (1/100) mmEnd of Autumnc<strong>on</strong>structi<strong>on</strong> end DecreaseEnd ofspring thawIncrease3:?5:5Fly ashSteel dregsao 42 46285 46 46%143 24 83%106 40 h2W66 43%66 43569 187271 7 89,DISCUSSIONSince the trial road was c<strong>on</strong>structed, drilling,sampling and analysis has been taken three times.The upper dTilllng profile is the thaw layer,the middle freezing layer and a thaw sublayer.This shows that the thermal property of the roadsurface structure is so different that thefoundati<strong>on</strong> below different road surface structureshas a different distributi<strong>on</strong> of tcmperatureand humidity.Fig.5 shows that humidity is basically identicalbelow a definite depth (e.g. below 220 cm).The identical extent of water migrati<strong>on</strong> fordifferent distributi<strong>on</strong>s of the temperature fieldresults in an indentical distributi<strong>on</strong> of humidityabove the depth. It follows that the humidityof the soil foundati<strong>on</strong> below the base of courseof siliceous st<strong>on</strong>e is at a minimum. The adjustedacti<strong>on</strong> of the water temperature of the basecourse of siliceous st<strong>on</strong>e occurs many times. Thedrilling informati<strong>on</strong> in 1988 and 1989 shows thatthe adjustment acti<strong>on</strong> is brought into acti<strong>on</strong>more than <strong>on</strong>e or two times.Siliceous st<strong>on</strong>e mingled material of differentgraded proporti<strong>on</strong>s have a different distributi<strong>on</strong>of the temperature field for different thermalc<strong>on</strong>ductivities..Fig.G shows the results oftheoretical calculati<strong>on</strong>s and observati<strong>on</strong>s, the0°C isotherm of the base course of siliceousst<strong>on</strong>e mingled material. using different gradingproporti<strong>on</strong>s (3:7, 5:5). Its O'C isotherm iseasily above 30% for heat preservati<strong>on</strong> acti<strong>on</strong>of the base course being 50% siliceous st<strong>on</strong>e inthe winter.It is obvious that the negative temperaturegradient of the road surface structure of thebase course with 50% siliceous st<strong>on</strong>e is lessthan 30%.The greater the negative temperature gradient,the smaller is the amount of water migrati<strong>on</strong>,and vice versa. The film water of soil frozen at-3 - -5'C is measured in the tests. The hear+==-0.4 -0.81.2 .1.62.0 ---2.4 LWater c<strong>on</strong>tent (%)Fig.5 Water c<strong>on</strong>tent VS. depthx-5 : 5mingled materialo"-3 17- .steel dregso-..fly ashquantity affects the process of the O'C isothermdeveloping downwards. So the O'C isotherm of theroad surface structure of the base course with50% siliceous st<strong>on</strong>e is below 307 in the latestage and the water c<strong>on</strong>tent of the upper soillayer in the road surface structure of the hasecourse with 30% siliceous st<strong>on</strong>e is Heater than50%.The total Erost heave of the road surface isdecreased in the base course of mingled materialwith the porous and tiny pore,siliceous st<strong>on</strong>esadjusting the water temperature of the soil -foundati<strong>on</strong>. the soil foundati<strong>on</strong> is kept dryerin the spring and makes the surface structurebe able to prevent freezing.
100 -150 -.200 -86 87Fig.6 Thc results of theoretical calculati<strong>on</strong>sand observati<strong>on</strong>s- X- observati<strong>on</strong> A-0- observati<strong>on</strong> 9"-x"- calculati<strong>on</strong> A"-0"- calculati<strong>on</strong> BCONCLUSION<strong>Research</strong> shows that mingled materi.al of siliceousst<strong>on</strong>e not <strong>on</strong>ly adjusts the water temperaturebut also has effective slab €uncti<strong>on</strong>. Itis feasible to design a structure layer of roadsurface, Resource investigati<strong>on</strong> shows thatsiliceous shale is not <strong>on</strong>ly easily dug butec<strong>on</strong>omical. Because of the excellent propertiesof siliceous st<strong>on</strong>e mingled material, the structurelayer of the road surface has the potential.to decrease the thickness of the embankment andcan reduce the engineering cost. Thus it is ofec<strong>on</strong>omic significance to use the technique andto develop the material.
~ .DRILLING CHARACTERISTICS OF ENGINEERING GEOLOGY OFPERMAFROST ON DA HINGGAN LING REGIONZou XinqingDa Hinggan Ling Investigati<strong>on</strong> and Design Instituteof Management Bureau, Forestry Ministry of ChinaEngineering drilling of freezing st<strong>on</strong>e soil was d<strong>on</strong>e in the. spring and autum seas<strong>on</strong>s, in the north slopeof Da Hinggan Ling. The pore sizes were 130-150rnm, the length of the jackbit was 150mm, theoutblades were 2.0-2.5mm, the main axis pressure was from 800-1200kg when using a low speed andshort time, and the circle footage was 0.1-0.2m. The main axis pressure was changed to 600-1000 kg inthe soft permafrost stratum and the circle foot age was 0.3-0.6m,through practical investigati<strong>on</strong>s it wasproven that the above menti<strong>on</strong>ed method met the technical demand and the improved drilling technologycan be used in drilling and sampling in engineering geologywith a favourable effect in permafrost regi<strong>on</strong>s.QUESTIONS ASKED ,.The stratum was of a freezing st<strong>on</strong>e soil in the permafrost regi<strong>on</strong><strong>on</strong> the north slope of Da Hinggan Ling. The working area ofthe shallow drilling and pit was large, the efficiency was low andthere were many difficulties. When drilling machinery was used, accordingto the normal technical demand of drilling in the past. thetemperature of the frozen ground rose, the ice layer in the freezingst<strong>on</strong>e thawed and even becamedry due to the fricti<strong>on</strong> between thedrilling rig and the st<strong>on</strong>e soil of the pore wall. Sample takingcouldn't present the real c<strong>on</strong>diti<strong>on</strong> of the freezing stratum, it wasdifficult to determine the depth of the permafrost table, measurethe water c<strong>on</strong>tent of the freezing stratum and judge the ice extentand cyogenic tcxture type. The geotechnical propertics of'the c<strong>on</strong>structi<strong>on</strong>field were misjudged which caused the destructi<strong>on</strong> ofbuildings in serious cases. The technical drilling demand which isapplicable in the permafrost regi<strong>on</strong> of Da Hinggan Ling is given inthis paper, resulting from extensive research in the last thirty years.It can meet the demand of engineering design and preserve the stabilityof buildings.DRILLING TECHNIQUES FOR ENGINEERING GEOLOGY.. ... .-." . "IN THE PERMAFROST REGION"". .. .. - -. . .Choice of Drilling Seas<strong>on</strong> in The <strong>Permafrost</strong> Regi<strong>on</strong> in The North. .,"" "~ . , ~, . ~~S'ope-?fDa Y!!?ggan,Ling.,In general, drilling can be d<strong>on</strong>e in any seas<strong>on</strong> due to theunique natural envir<strong>on</strong>ment and climate c<strong>on</strong>diti<strong>on</strong>s in thepermafrost regi<strong>on</strong>. A feasible seas<strong>on</strong> must be chosen to ensure thedrilling demand of engineering geology in the permafrost regi<strong>on</strong>.In the permafrost regi<strong>on</strong> of the north slope of Da HingganLing, the winter is l<strong>on</strong>g and the climate is frigid. The daily averagetemperature is lcss than O°C lor more than 200 days of the year.Daily low tcrnperature of -3OOC has thc c<strong>on</strong>tinuous time of100-130 days. Daily low temperatures of -4O'C occur for 20-30days. There are heavy rains in the summer and prccipitati<strong>on</strong> is c<strong>on</strong>centratedin July, August and Novemhcr. According IO the demandsand purposes otenpineerinp'it IS important to choose a suitabledrilling time. Drilling seas<strong>on</strong>s for engineering geology arefeasibly chosen in February, March, June and November. Thepermafrost table can be exactly determined by drilling from July toOctober. The maximum depth of seas<strong>on</strong>al freezing can be determinedby drilling from the middle of March to the last ten days ofApril.Choice of Drillign Pore Site. -" _x . .In order to decrease the thaw outside the undisturbed core ofpermafrost due to fricti<strong>on</strong> heat of the $ckbit, the drilling machinetype and pore size of the drilling must be suitably chosen. A largenumber bf comparative experiments in the last few years haveshown that the effectiveness of the DPP-100-1 type of drilling machineis the best, next is the Xy-100 type. Drilling machines with alarge horsepower are suitable for drilling in permafrost regi<strong>on</strong>s.According to experiments in drilling in permafrost regi<strong>on</strong>s, such asin Gulian, Xilingji, Tuqiang, etc, a 150mm pore size is feasible for afrozen st<strong>on</strong>e stratum, the drilling core is more complete, the soiltemperature doesn't change easily and a 130mm pore size can meetthe demand of the experiment.DRILLING FOOTAGE FOR ENGINEERING GEOLOGY"I- ..."Drilling footage of clear water or slurry is nat feasibly used inpermafrost regi<strong>on</strong>s, dry drilling is preferable. Because of the highst<strong>on</strong>e c<strong>on</strong>tent in the permafrost stratum of Da Hinggan Ling,1342 -
choosing a jackbit of a stiff alloy should meet the following technic:~]demands to gain the best effect.I. Length of jackbit is 7 Amm.2. A k534 type alloyjackbit is selected, with the outblade of the<strong>on</strong>sideand outside being not less than 2.0-2.5mm.3. Length of core barrel is 0.6-0.8m.TECHNIQUE OF DRILLING OPERATION"." . . ..- . . .. ..There is an extensivc distributi<strong>on</strong> of frozen st<strong>on</strong>e soil with differentice c<strong>on</strong>tents and which is more compacted and soft peat soilwith a high ice c<strong>on</strong>tent in the permafrost regi<strong>on</strong> <strong>on</strong> the north slopeof Da Hinggan Ling. The drilling demand is not identical.Freezing St<strong>on</strong>e Soil with A LOW Ice. C<strong>on</strong>tent And High~ ~ " "... - ~~Compacti<strong>on</strong>The volume of the ice c<strong>on</strong>tent in this soil is small, the generalc<strong>on</strong>diti<strong>on</strong> is less than 20% of the ice layer is filled in the pores ofthe stratum and st<strong>on</strong>es, and. it is difficult to take ice core in the processof drilling footage. So drilling footage uses a low speed and amiddle main axis pressure. If drilling footage uses a high speed anda large pressure, the time is l<strong>on</strong>ger and the heat of the drilling rigcauses the frozen ground core to thaw. According to experimentaldata, circle drilling footage is not feasible for more than 2-4 minutes,footage is feasible in the rangc of 0.1-0.2m. Center pressure ofthe drilling rig with a 150mm jnckbit is feasible in thc range of800-1 200kg.Frozen Soil with A High Ice C<strong>on</strong>tent and Soft Peat Stratum-- . "" . -"This soil is mainly distributed in the basin and sedimental stratumof the lake facies in Gulian coal mine. Most bel<strong>on</strong>gs to a stratifiedcryogenic texture and the st<strong>on</strong>e c<strong>on</strong>tent is less. Drilling footageof a middle speed should be chosen, the circle footage should bc0.3-0.6m, and the main axis pressurc of the drilling rig can be incrcascdin the drilling footage in the peat stratum. Because of thedeeper outblade of the alloy jackbit is pressed into the frozenground, a higher core ratio is gained when the core sample is drawnin the drilling footage. The main axis pressure should be increasedso that the jackbit and core are closely blocked so that,a drop in thecore can be prevented and the core drawing ratio is improved,In order to Iind the destructive causes of the fissures in thehospital of Tuqiang Forestry Bureau in Da Hinggan Ling, drillingwas d<strong>on</strong>e around the foundati<strong>on</strong>' of the building in November,1984. Using the method of dry drilling, large axis pressure and highspeed, the frozen ice core was completely thawed, the core producedheat and no permafrost was found. Using the same method,a sec<strong>on</strong>d drilling was d<strong>on</strong>e with a DPP-100-1 type drilling machinepermafrost and the ice layer were still not found in the core ofdrilling pore. Next, a low speed and middle pressure, with a circledrilling footage of 2-3 minutes was used, and the ice layer andpermafrost were found in the core. This shows the importance inchoosing the drilling footage parameter in engineering geology drillingin permafrost. Drilling footage with this type of drilling machineshould be chosen by the following parameters of drillinpfootage. 'Rotati<strong>on</strong>al speeds using the first gear, small-middle throttle,and 40-60 rotati<strong>on</strong>s per minute.Total pressure of the axis center of the drilling bit is800-1200kg.Circle drilling footage, in which a l5Omm jackbit is used, is 2minutes for a frozen st<strong>on</strong>e stratum and a quick drawing jackbit. Acircle drilling footage, in which a 130mm jackbit is used, is 2-3minutes for frozen loam, and a circle drilling footage,using a130mm jackbit, is 3-4 minutes for frozen cobble stratum, but theaxis pressure of drilling is more than that of frozeng loam andfrozen st<strong>on</strong>e soil.The length of the core barrel is 0.6-0.8m (being suitable fordepths of 0-10m) amd the length of the jackbit is ISOmm. Threeidentical size drillings are prepared, after the first circle end anddrawing drilling, and another drilling is ne'eded. Drilling of the firstcircle can not be c<strong>on</strong>tinually used until the drilling has cooled.The above menti<strong>on</strong>ed method of drilling and parameters ofdrilling footage are very effective in drilling and sampling processesof permafrost engineering geology.CONCLUSIONS". . "A large number of experiments in engineering geology drillingin tb permafrost regi<strong>on</strong>s of Gulian, Xilingji, Tuqiang, etc, showthat drilling in different stratums have different parameters for drillingfootage. A reas<strong>on</strong>able pore size, drilling and operati<strong>on</strong>al techniquesare not <strong>on</strong>ly the key factors for excellent cffectivencss in engineeringgeology in permafrost, but are also important factors <strong>on</strong>which the properties of permafrost can be determined. A satisfactoryeffect was recieved using a 130mm pore size, 150mm l<strong>on</strong>gjackbit, 9 not less than 2.0-2.5mm outblade of the inside and outside,800-1200k total pressure of the drilling axis center, circlefootage of 0.1-0.2m for frozen st<strong>on</strong>e soil and 0.3-0.6m for frozensoft soil, etc..ACKNOWLEDGEMENTS"The author wishes to thank Assistant Professor T<strong>on</strong>gChangjiang and the Lanzhou Institute of Glaciology for pcrmittingthis paper to be published.
QUATERNARY GEOLOGY AND GROCRkOLOGY IN NORTMERN QUEBEC, CANADAMichel Allardl and Jean A. Pil<strong>on</strong>2ICentre d'etudes nordiques, Universite csval Clement tremblay,Ministere des transports du Quebec'Geological Survey of CanadaIn Nunavik (Northern Quebec) theorical and practical knowledge of periglacial features and permafrostproperties has increased tremendously over the last five years. We owe this achievement toa joint task force (governments-universities) set up to carry out a comprehensive research programwithin the framework of airstrip c<strong>on</strong>structi<strong>on</strong> in 14 villages distributed over six degrees oflatitude, Erom the disc<strong>on</strong>tinuous to the c<strong>on</strong>tinuous permafrost z<strong>on</strong>e. Patterned ground types andgeocryological facies are closely related to the various types of surficial deposits laid by theWisc<strong>on</strong>sinan glaciati<strong>on</strong> and, subsequently, by the post-g'lacial marine inundati<strong>on</strong> and emergence <strong>on</strong> thecoastal fringe of the peninsula. Tundra polyg<strong>on</strong>s and low-center mudboils are the dominant periglacia1features <strong>on</strong> glacial landforms such as drumlins and moraines, <strong>on</strong> glaciofluvial landforms likeoutwash plains and eskers and <strong>on</strong> fluvial terraces and raised beaches. Blth soil wedges and icewedges can be found under polyg<strong>on</strong> sides. Soil stripes and gelifluxi<strong>on</strong> lobes occur <strong>on</strong> slopes.Interstitial ice dominates in these coarse, sandy and gravelly, sediments as revealed'in numeroussecti<strong>on</strong>s, quarries and drill-holes. The dominant periglacial features <strong>on</strong> the post-glacial marinesilty clays are cryogenic mounds and fields of high-center mudboils. In these fine-grained sediments,segregated ice (lenses and reticulated) dominates in warm permafrost (O'C to -2'C) in thesouthern part of the regi<strong>on</strong>. Volumetric ice c<strong>on</strong>tents, AS measured <strong>on</strong> cores, are usually 50-60% but'they may attain 809, in the upper layers of permafrost. Massive icy beds occur in cold permafrost(-5°C to -5°C) in the northern part of the regi<strong>on</strong> and were observed in retrogressive slumps. Groundprobing radar and electrical resistivity surveys indicate that such icy beds may be up to 11 mthick. Other features such as palsas ih bogs, frost blisters, icings and aggrading permafrost undertidal marshes are also significant in the regi<strong>on</strong>. Extensive knowledge of correlati<strong>on</strong>s betweenQuaternary geology, ground patterns and geocrynlogical facies (displayed in table form andillustrated with selected pictures) has made it possible to develop a photo-interpretati<strong>on</strong> key whichallows t'o plot high quality, large scale maps of permafrost c<strong>on</strong>diti<strong>on</strong>s prior to decisi<strong>on</strong> takingrelative to digging, cutting into or moving soil for c<strong>on</strong>structi<strong>on</strong> projects (buildings, service andtransportati<strong>on</strong> infrastructurs, etc.).RATIONAL UTILIZATION OF WATER RESOURCES IN PERMAFROSTREGIONS, ARTIFICIAL BECHARGS OF GROUNDWATER STORAGET.V. Burchak and L.M. DemidyukThe All-Uni<strong>on</strong> Oil & Gas <strong>Research</strong> Institute, Moscow 125422, RussiaCharacteristics of surface and groundwater in permafrost regi<strong>on</strong>s are given. It is shown that themost typical resources of ground water are those orig'inating from taliks of river valleys: subpermafrostwater of mountain artesian basins; water from structures of limited area or from creviceand creviskarst ground mass and z<strong>on</strong>es of tect<strong>on</strong>ic disturbances, The necessily of due regard forpeculiarities of the formati<strong>on</strong> of water resources is marked, and of the surface and subsurfacedrainage in planning the water resources utilisati<strong>on</strong> and protecti<strong>on</strong> from polluti<strong>on</strong> and depleti<strong>on</strong>,and also in designing water-supply systems.Comparative assessment of surface and groundwater as the source of water supply is given withregard for special requirements depending <strong>on</strong> severe climatic c<strong>on</strong>diti<strong>on</strong>s. Possibility and expediencyof wide utilizati<strong>on</strong> of grouridwater for supply purposes is shown. Possible water intake for variousgroundwater basins is characterized.The necessity of researches for n<strong>on</strong>-c<strong>on</strong>venti<strong>on</strong>al "Know-how" of waver supply is substantiated withregard for permafrost regi<strong>on</strong> peculiarities and special requirements of c<strong>on</strong>sumers. Particularattenti<strong>on</strong> is given to the selecti<strong>on</strong> of water supply sources for oil producti<strong>on</strong> regi<strong>on</strong>s.Expediency is shown of wide utilizati<strong>on</strong> of teli.ks of river valleys together with artificial rechargeof groundwater (ARGW) by:1) building water storages: 2) widening of river beds: 3) installati<strong>on</strong> of special infiltrati<strong>on</strong>facilities: 4) creati<strong>on</strong> of extra negative water pressure in the depressi<strong>on</strong> funnel under the riverbed: 5) joining a sub-bed-near-bed talik with that of a near-bed <strong>on</strong>e by means of melting thepermafrost pillar separating the taliks; 6) enlarging the talik capacity by creati<strong>on</strong> of optimumc<strong>on</strong>diti<strong>on</strong>s for melting permafrost ground:,'7) taking measures against freezing of the water intakearea of the talik.Principal technical soluti<strong>on</strong>s for realizati<strong>on</strong> of ARGW method are characterized as well as thedesign technique of infiltrati<strong>on</strong> and vacuum facilities, melting procedure of permafrost pillars,and also the water'intake <strong>on</strong> the whole.Results of the water supply network selecti<strong>on</strong> for an oil producti<strong>on</strong> site located in c<strong>on</strong>tinuouspermafrost regi<strong>on</strong> are c<strong>on</strong>sidered.
ICE WEDGE DEVELOPMYYT ON SLOPES, FOSHEIM PENINSULAELLESMERF, ISLANO, FASTYRN CANADIAN ARCTICAnt<strong>on</strong>i G. LewkowiczDepartment of Geography, Erindale College, University ofTor<strong>on</strong>to, Mississauga, Ontario, L5L 1'26, CanadaThis paper describes the cryostratigraphy of sites <strong>on</strong> the Fosheim Peninsula where either multipleice wedge systems or multiple growth stage ice wedges have been exposed and provides explanati<strong>on</strong>sfor wedge regrowth.Seven sites within a 50 km radius of Eureka were examined from 1987-1991. Current cracking activityof wedges was assesse4 by taking samples across the centres of wedges or in younger growth sta8e.s'and analysing the tritium c<strong>on</strong>tent. Rates of wedge growth inferr.ed from this method are between 1 and5 mm/year. Tn the headwalls of retrogressive thaw slumps wedge regrowth occurred within formermudflow deposits, but <strong>on</strong> <strong>on</strong>e low-angled slope, the headwall was in previously undisturbed materialand active wedges exhibited sec<strong>on</strong>dary and tertiary stages 29 cm and 10 cm high respectively (currentactive layer of 53 cm), In an exp3sure beside a recent active-layer detachment slide, four stagesof growth were present in an inactive wedge, together with several major layers of segregated ice.The most complex secti<strong>on</strong> was at the base of a l<strong>on</strong>g slope where colluvial deposits overlay peat.Wedges of at least two and possibly three different ages were present. Wedge 1 was the oldest andgrew syngenetically at least partly during the period of peat accumulati<strong>on</strong> which ended at 6460f70B.P. A sec<strong>on</strong>dary vein developed as the surface aggraded further but eventually this became inactive.Wedge 3 may have started epigenetically or syngenetically but existed prior to 540f50 B.P. Sincethen it has grown syngenetically and is still active. Wedge 4 is the youngest wedge: it wasinitiated epigenetically after 540f50 B.P. The rate of sedimentati<strong>on</strong> at this site derived from themean corrected radiocarb<strong>on</strong> dates is 7 mm/year, but given the standard errors could be between 4-25mm/year. This surface aggrada.ti<strong>on</strong> is attributed to a combinati<strong>on</strong> of slopewash, soliflucti<strong>on</strong> andactive-layer detachment processes. Although not observed to date, it is presumed that antisyngeneticwedges exist upslope of this and many of the other sites studied'.There is no evidence of recent cooling within climatic records from Eureka, but the coastal locati<strong>on</strong>of this weather atati<strong>on</strong> could .buffer it from changes that may have occurred further inland. Thus theuppermost growth stages at several of the sites could be the result of changes in rhe summerclimate. However, the degree of active layer change required means that this explanati<strong>on</strong> is veryunlikely to be correct for the lower growth stages. Instead, regnowth is attributed to active slopeprocesses which result in colluviati<strong>on</strong>.LAKES AND PERMAFROST IN TYE COLVTLLE RIVER DELTA, ALASKAH. Jesse WalkerDepartment of Geography, Louisians State University3 Bat<strong>on</strong> Rouge, Louisiana, 70803-4105, USALakes in arctic deltas, like lakes in the deltas of lower latitudes; vary greatly in area, depth,shape, seas<strong>on</strong>al character and formati<strong>on</strong> processes. Lakes in the Colville River Delta <strong>on</strong> the coastalplain of Northern Alaska provide examples of this variety and reflect the numerous factors,including permafrost, that are involved in arctic lake for ati<strong>on</strong> and maintenance.The delta, <strong>on</strong>ly 550 km in area, has innumerable p<strong>on</strong>ds andL41 lakes over 0.0125 km' in area: 5 ofthem over 2 km . Lake area (for those larger than 0.0125 km') is 96.5 km or 17.5% of the totalarea of the delta.The lakes and p<strong>on</strong>ds in the delta include remnants of the well-known oriented lakes that occur overmuch of the coastal plain, aband<strong>on</strong>ed rlver channel lakes, terrace flank depressi<strong>on</strong> lakes,thermokarst lakes, intra- and inter-dune lakes, intra- and inter-bar lakes, perched lakes, iceshove p<strong>on</strong>ds and ice-wedge pol-yg<strong>on</strong> p<strong>on</strong>ds. Although some of the delta's lakes are sufficiently deep(over 8 m) so that a thaw bulb exists beneath them, most are less than 2 m deep and freeze to thebottom during winter. These lakes have thin active layers in their bottoms similar to that of thetundra surface. Mowever, the importance o € permafrost in lake morphology evidences itself best inrelati<strong>on</strong> to shoreline erosi<strong>on</strong>, the eventual breakthrough (tapping) of river to lake and subsequentlake drainage.Lakes associated with ice-wedge polyg<strong>on</strong>s, some of which are perched several meters above normalriver level near river banks, frequently drain. Drainage usually occurs <strong>on</strong> top of an ice wedge thathas been cut into by the eroding river leaving the polyg<strong>on</strong> lake dry. A similar process occurs inother lakes (many of which have bottoms well below river level). Once the tundra separating thelake from the river is suEficiently narrowed, breakthrough can occur. After the lake becomesc<strong>on</strong>nected with the river its level fluctuates with river stage. During n<strong>on</strong>-flood stages (all but3-4 weeks per year) the erosi<strong>on</strong>al benches, formed al<strong>on</strong>g the margins of the lakes as they enlargeddue tQ lake-bank thaw and erosi<strong>on</strong>, are subaerial and thus subjected to the permafrost formingc<strong>on</strong>diti<strong>on</strong>s that are typical of the coastal plain. Further, <strong>on</strong>ce tapped, lakes become sediment trapsfor the river's flood water. Such lakes are eventually filled with sediment and the thaw bulb thatexisted beneath them freezes.1345
SORTER CIRCLE DYNAMICS: 10 YEARS OF FIELDOBSERVATIONS FROM CENTRAL ALASKAWalters, James C.Department of Earth Science, University of Northern Iowa,Cedar Falls, Iowa,50614, USAField studies of sorted circles occurring in the periglacial envir<strong>on</strong>ment of the Maclaren Summit andHigh Valley areas of central Alaska have been c<strong>on</strong>ducted over a period of 10 years. Repetitivephotography and surveys of wooden dowels, metal rods, and marked st<strong>on</strong>es provide informati<strong>on</strong> <strong>on</strong> thesurface dynamics of the circles. Excavati<strong>on</strong>s provide informati<strong>on</strong> <strong>on</strong> subsurface characteristics.Although much variability was noted in the dynamics of the circles over the study period, somegeneral c<strong>on</strong>c1usio.s can be drawn and inferences can be made within the c<strong>on</strong>text of existing modelsof sorted circle development.'The circles examined in this study are found in low spots in the silty till which blankets the area.These depressi<strong>on</strong>s become quite wet in the spring because of snowmelt, rain, and thawing ground ice.Sorted circles have been studied at six sites. three where temporary p<strong>on</strong>ding occurs and three whereseas<strong>on</strong>al wetting but no p<strong>on</strong>ding takes. place, Overall, movement of markers in circles was upward andradially outward from the fine-grained centers to the coarse borders. Circles at sites experiencingtemporary p<strong>on</strong>ding showed the most activity. Vertical displacements of markers were greatest incircle centers with an average uplift of approximately 1 to 4 cm/yr. Horiz<strong>on</strong>tal displacements ofmarkers generally increased from circle centers outward but then decreased as they approached withinseveral centimeters of the coarse borders. Average horiz<strong>on</strong>tal movements range from 0.5 to 2.2 cm/yr.Circle characteristics differ depending <strong>on</strong> positiun in the shallow depressi<strong>on</strong> in which they occur.Lsrger circles 1-2 m in diameter are found al<strong>on</strong>g the outer margins of a depressi<strong>on</strong>. These largercircles are slightly to str<strong>on</strong>gly domelike in their centers, closely spaced, and more oval or evenpolyg<strong>on</strong>al in plan view. Fine-grained sediment is abundant here and some vegetati<strong>on</strong> exists. Circlesin the central porti<strong>on</strong> of a depressi<strong>on</strong> are smaller, 0.5-0.1 m in diameter, str<strong>on</strong>gly c<strong>on</strong>vex upward,and widely spaced with a st<strong>on</strong>y surface surrounding them. Fines are pres'nt <strong>on</strong>ly in circle centers,and no vegetati<strong>on</strong> exists. Another comm<strong>on</strong> feature in the central area of a depressi<strong>on</strong> is a pattern ofsmall st<strong>on</strong>es.surrounded in a circular fashi<strong>on</strong> by larger st<strong>on</strong>es. No fines are present <strong>on</strong> the surfacein these features, but excavati<strong>on</strong>s reveal plug-like areas of fines beneath their centers.L<strong>on</strong>g-term m<strong>on</strong>itoring of these sorted circles indi'cates the diameters of most are becoming smeller.Repeat photography and measurement of circle diameters show the central aiea of fines decreasingwhile the border areas are expanding. The fine-grained centers are also becoming coarser. Observati<strong>on</strong>sshow that coarser material progressively moves up and out away from a circle center toc<strong>on</strong>centrate al<strong>on</strong>g the stable border. Fines also move up in a plug-like fashi<strong>on</strong> into the circlecenter where they dominate the center, but they are slowly removed by deflati<strong>on</strong>, rainwash, sheetwash,etc. Therefore', the diameter of a circle becomes smaller as more st<strong>on</strong>es fill in the circleand the fine-grained sediment becomes separated from its source. If c<strong>on</strong>diti<strong>on</strong>s allow for c<strong>on</strong>tinuedactivity, a circle will progress to an end point where no fines exist <strong>on</strong> the surface,. and whatremains is a pattern of small st<strong>on</strong>es surrounded by larger st<strong>on</strong>es.- 1346
AUTHOR INDEXAguirre Puente I., 368,611,1124Akagawa Satoshi, IO50Akerman J<strong>on</strong>as, 1022Akscnnov V.I., 1Alexeeva Olga I., 855Alifanova A. A., I2 1 9Allard Michel, 5,182,1344An Viktor, 843An Weid<strong>on</strong>g, 11Ant<strong>on</strong>ov-Druzhinin Vitaly P., 1054Are Felix E., 436.846Arts R., 286Aziz A., 17Barry R.G., 23 .Barsch Dietrich, 27Bartoszewski Stefan A., 32Baulin V.V., 1060Bell<strong>on</strong>i S., 36Biggar Kevin W., 42Bird Kenneth J., 94B<strong>on</strong>darenko G.I., 851Brennan A.M., 23Brewer M.C., 48Brown Jerry, 969,972.1 I32Brudie E.L., 244Bruskov A.V., 1Burchak T.V., 1344Burgess M.M., 54Burn C.R., 60Burns R.A., 66Butsenco A.N., 506Caine N., 1044Ca1deroai.G. ,72Caldwell J.B. ,244Carnes-Pintaux A.M ., 11 24Carter L.David, 48,78Cart<strong>on</strong> A., 36Cater Timothy C., 316Chamanova 1.1. ,1060 .Chang Rudolf V., 855Chang Xiaoxiao, 722,1274Chang Yen, 596Chehovalty A.L., 1060,1062Chen H<strong>on</strong>gzhe, 105Chen Qinghua, 383,1159Chen Ruijie, 1064,1067Chen Xiangsheng, 1070,1171Chen Xiaobai, 84,143,689,1037,1073Cheng Enyuan, 302, I 152Chew Guod<strong>on</strong>g, 675,965,971,1010Chernyakov Yurii A., 862Chuvilin E.M., 89,160,1255,1295Cohen Tenoudji F., 61 1Collett Timothy S., 94Collins Charles M., 1076,1128Corapcioglu M.Yavuz, 100Corte A.E., 1073Cui Guangxin, 1079Cui Jiqnheng, 105,1082Cui Y<strong>on</strong>gsheng, 407Cui Zhiju, 111,397,1086,1287Dai Baoguo, 116Dai Chtmtian, 1 I6Dai Huimin, 120Dai Pin, 116Dallimore S.R., 125Danilov Igor D., 858Dash J.G., I I 17Demidov V.V., 506Demidyuk L.M., 1344Dew Yousheng, 131,773,1255,1295Devjatkin V.N., 134Ding Jingkang, 138,1092Ding Y<strong>on</strong>gqin, 143Domaschuk L., 149Dramis F., 36Du Chengxian, 1 I6Dubina Mikhail M., 862Duhuil Marie-Andrec, 255Duchkov A.D., 134Dydyshko P.I., 155Ershov E.D., 89,160Esch David C., I64Everett Kaye R., 267Fang Tsung Ping, 586Fediukin Igor V., I70Fedoseeva Valentina I., 865Fei T., 500Fei Xueliang, 1096Feng KG, 768Feng Yanhui, 789Ferrell John E., 471Ferrians Jr.0.J. , 1132Forbes Bruce C., 176Fortier Richard, 182Fotiev S.M., 955 IFowler A.C., I100Frech Hugh M., 482,968Frolov Anatoly D. , 170Frydecki Janusz , 5Fukuda M., 488Gao Min , 1 I67Gao Weiyue , 1265Gao Xingwang , I88Garneau R.R., 286Gavrilov M.K., 987,1006Ge Huanyou , I I48Gerasimov A.S. ,955'Gcrshevich V.B., 506Giardino John R. ,1019Gilichinsky David A., 869Glenn R. ,48G<strong>on</strong>charov Ju.M., 875Gorbunov A.P. ,1105Gorelik Yakov ,879Goriainov N.N. ,66Gotovtsev Semy<strong>on</strong> P. ,891Gray James T. , 192Grechishchev Stanislav E., 54,198Greeley Nancy H. , I I28Gu Zh<strong>on</strong>gwei ,204,388,778,819Guan Zhifu , 1298Guevorkian S.G. ,660Guglielmin M., 72Guo Dianxiang ,1108Guo D<strong>on</strong>gxing ,210,282,809,1186Guo Xingming ,835Guo Xud<strong>on</strong>g , 1113Guo Zuxin ,1338Guryanov Igor E. ,885Guthrie Robert S. , 694Haeberli Wilfried, 214,272,1014Haiying FU , 1 I I7Hall Kevin J. ,220Hallet B. ,226,l I17HanUK,1119Hansueli Gubler ,332Haoulani H. , 1124Harris Charles, 232Harris Stuart A. ,238,1019Hartzrnann R<strong>on</strong>ald J. ,574Haugcn Richard K., 1076,1128Hazen Reez ,244,494He Ping, 250He Yixiang ,718Heginbottom J.Alan ,255,1132Heuer C.E., 244Hinkel Kenneth M. ,261Hinzman Larry D. ,267,326Hirakawa Kazuorni ,449Hiv<strong>on</strong> Elisabeth G. ,42Hoelzle Martin, 214,:72Horiguchi Kaoru II 1064,1047Horrigan Timothy 0. , 1076Hou Zh<strong>on</strong>gjie ,556,608Hu Qiheng ,967
Hu Ruji ,1144Hu Shicai ,4 1 6Huang Junheng , I148Huang MaoHuan ,278Huang Xiaoming ,1010Huang YiZhi ,210,282,758,809Huncault P.A. ,286Hunter J.A., 66Iordancscu M. ,286Jakob Matthias, 27Janoo Vincent, 292Jian G<strong>on</strong>g, 298Jiang H<strong>on</strong>gju ,302,1152Jiang Weiqiang ,592Jiao Tianbao , I 155Jin Huijun ,307,803Jin Naichui , 3 I2Jin Zhengmei ,278Jorgens<strong>on</strong> M.Torre ,316Joshi Ramesh C, ,706Joyce Michael R. ,316Jr Bayer John ,292Judge A.S. , 1 I ,66Jung Duhwoe ,648Jung H.C. , 11 I9Kagan A.A., 730Kamensky Rosteslav M. 322,923,969Kane Douglas L. ,267,326Kang Xingchcag ,10 IOKasse C., 643Kella Felix ,214,272,332Kcrshaw G.Petcr ,338King Lorenz ,344,625,1022King Lorenz, 1022Klirnovsky Igor V., 891Rlimowicz Zbigniaw ,350Kolunin Vladimir ,879K<strong>on</strong>dratyev V.G. , 155K<strong>on</strong>iakhin M.A., 937K<strong>on</strong>rad J.M., 550K<strong>on</strong>stantinov Innokentii P., 322Koster E.A., 987Krantz W.B. , 1044.1 100Kritsuk L.N., 897Kriv<strong>on</strong>ogova N.P. ,730Kunitsky Viktor V. ,903Kurfurst P.J. , 54,356Kurilchik A.F., 909Kutasov I.M., 362 'Kwok R., 149Lachenbruch A.H. ,987Lauriol Bernard , 192Lebedenko IU.P., 160,1255,1295Leclaire P. ,368,611Lehmann Rainer ,374Leibrnan M.O., 380Lewis G.C., 1044Lewkowicz Ant<strong>on</strong>i G. ,232,1345Li Bin, 1096Li Dazhou ,592I.' D<strong>on</strong>gqing ,835,1164Li Gang, 278Li Guangpan , 1147Li Hao ,383LiKun,1171Li Shijie , 1174Li Shude ,1174,1178Li Yi ,1079Li Zuofu ,1178Liang Fengxian ,204,388,744,819Liang Linheng ,204,393,778,819Lilly E.K. ,326Lin Chuanwei ,685Lin Ying ,312Lin Yipu ,1272Liu Fengjng ,738Liu Gengnian ,397,1086,1287Liu H<strong>on</strong>gxu ,403Liu Qingren , I 16,407Liu Rihui , 1251Liu Shifeng , 1183Liu Tieliang , 1298Liu Xuekui , 1308Liu Yifeng ,429Liu Y<strong>on</strong>gzhi ,122,764Liu Z<strong>on</strong>gchao ,429Lomborinchen R. ,411Lou Anjin , 138Love11 CWilliam , 968Lozcj A. ,7?.Lu Heiyen ,797Lu Xingliang ,416,1301Lunardini Virgil J., 17,420Luo Anjing ,1092Luo Guowei , I 186Luo Minru ,426,622Luo Weiquan , 1190Ma H<strong>on</strong>g ,429,1144Ma Wei ,432,556,122,1214Ma Yijun , 1108Magierski Jan, 32Mai Hcnrik , 1137Makarov Vladimir N., 91 1Makeev O.V. ,506Mamzelev Anatoly P. ,436Marsh Philip, 443Matsuoka Norikazu ,449Melke Jerzy ,350Melnikov E.S. , 54,356,1132Melnikov Vladimir ,455Meltzcr Liya I. ,914Men Zhaohe ,1193Mi Haizhen ,461,1259Mia0 Lina ,278Miao Tiandc , I197Michalczyk Zdzislaw , 32Michalowski Radoslaw L., 465Migala Krzysztof, 919Moblcy Keith F. ,471Molmann Truls ,477Moore J.P. ,517Moskalenko N.G., 54Murashko A.A. ,89Murray D.F., 48Murt<strong>on</strong> Julian B. ,482Na Wenjie ,592Na Yunl<strong>on</strong>g, 426Nakano Yoshisuke ,750Nakayama T. ,488Nels<strong>on</strong> Frederick E. , 261,987Nix<strong>on</strong> J.F.(Derick) ,244,494No<strong>on</strong> G.G., 1100Olovin Boris A ,923Osterkamp T.E. ,783,500,987,Ostroumov V.E., 506Outcalt Snmucl I. ,2610zouf'J.CI.. 523Pan Anding. 1202Panday Sor;lh M. . 100Pavlov A.V. , 51 IPerlshtein G.Z. ,909Pewe Troy L. ,966Pil<strong>on</strong> Jean A. , 5,1344Ping C.L., 517Pissart A. , 523,972Polyakov V.A., 897Popov Viktor A. , 322Poznanin V.L. ,660Prick A., 523Prigoda V.Ya., I55Pu Yibin , 1208Qiao Dianshi ,529Qiu Guoqing 307,533,803,1028,1312Qu Xiangming ,312Ramos M., 121 IRasmussen L.A. ,226Ren Zhizh<strong>on</strong>g , 1215Rivkin F.M., 380,869Roman L.T., 1219Ro<strong>on</strong>ey James W., 648Roujansky Vladislav E., 858Sadakova M .N., 155Salnikov P.I. ,927Samarkin Vladimir A., 869Samyshin V.K., 909Sarrelainen Seppo ,539Saveliv V.S. ,380Savitsky Victor A. , 846Schmid Willy , 2 14,654Schmitt Elisabelh , 544Schofield A.N., 1070- 1348 *
sodov BM., 1222Sego Dave C. ,42Seguin Maurice". ,182Senneset Kaarc ,477Shamanova I.I., 1062Shankov Vladimir V. ,198Shao Lijun ,1292Sharkhuu A. , 1223Shcn Mu, 550Sheng Yu ,556,1073Shag Zh<strong>on</strong>gyan ,250,1274Shmg Zh<strong>on</strong>gyan ,1274Shestarnyov D.M., 1227Shi Yafeng ,968,972Shields D.H. ,149Shoop SaUy A., 559Shpolyanskaya N.A. ,930Shur Y.L. ,564Sicgcrt Christine , 569Skaret Kevin D. ,338Skvorpov A.G., 66SlaugL Lr Charles W. ,574Slavin Borovskiy V.B. , 564Sletten R<strong>on</strong>ald S. , 580Smiraglia C. ,36Smith C.C., 1070Smorygin Gcnnadi ,455Snegirev A.M., 934Sokolova L.S. , 134-Solomatin V.I. ,937S<strong>on</strong>e Toshio ,488,1231S<strong>on</strong>g Changqing , 11 1,832So0 Sweanum ,586Stein Bernd , 1238Streltsova O.A. , 865Su Shengkui ,1235Sui Tieling , 592Sun Zhenkun ,407SVGC Otto 1. ,596Takahashi Nobuyuki , I23 1Tang Shuchun ,602Tang Xiaobo ,605Tang Zh<strong>on</strong>ghai ,832Tao Zhaoxiang ,608,773Tarasov A.M. ,356Taylor A.E., 125Tellini C. ,72Tenoudji f.Cohen ,368Thimus J.F. ,611Thomscn Thorkild , 1137Timofeev V.M. ,66Todd B.J. ,66Tomita Hsiao ,292T<strong>on</strong>g Boliang ,617,1269T<strong>on</strong>g Changjiang ,622Torgashov Y.Y. ,941Tremblay Clement, 5Trombotto Dario ,1238Tschcrvova E.I. ,356Tu Guangzhi ,967Tumurbaatar D., 1242Ulrich Roland, 625Urdca Pet, ,631Uziak Stanislaw ,350Vakili Jalal , 1247Valuyev A.S. , 155Van Everdingen Robert O., 638Vandenberghe J., 643Varhchilov Yu.Ya. , 1222 "Vasil'chuk Yurij K. , 945Vasilyev M.L., 155Vins<strong>on</strong> Ted S., 648,1031Vlasov Vladirnir P. ,951V<strong>on</strong>der Muhll Daniel S. ,214,654 ~Vtyurina E.A. ,660Vyalov S.S., 955Wagner S. ,214Walker HJesse ,1345Walsh Michael ,292Walters James C. , 1346Wang Baolai ,664Wang Binlin , 1186Wang Changshcng , 1171,1251Wang Chunhe ,670Wang Guangzhou ,832Wang Jiachcng 675,734,778,1255,1295Wang Jianguo ,1282Wang Jianping ,678Wang Qiang ,744Wang Shaoling ,461,1259Wang Shir<strong>on</strong>g ,1262Wang Shujuan ,307Wang Wenkai ,685Wang X.L., 120Wang Yaqing ,689,1073Wang Yi ,1265Wang Yingxus ,1178,1269Wang Yinmci ,768Wang Zengting ,678Wang Zcrcn ,730Wang Zhanchen ,755Wang Zhenyi , 1272Wayne William J. ,694Wei Xuexia , 1197Wci Zhengfcng , I108White T.L. ,700Wipweera Harsha ,706Wilen L. , I 117Williams P.J. , 700Woo Mingko 443,112,725,738,987Wu Jinrning , 138Wu Qi jan ,678Wu Qingbai ,718WU Ziwang I I ,432,722,1274, I32 1Xen Zhenyao ,797Xia Zhaojun ,725Xia Zhiying ,758,1278Xie Yinqi ,1282Xi<strong>on</strong>g Heigang ,397,1086,1287 ,Xu Bomeng ,416,730,1292,1301Xu D<strong>on</strong>gzhou ,105Xu Jingguang ,529Xu Xiaozu 131,734,773,1255,1295Xu Xueyan , 1092Xu Zhmghai , 1 148Yakushev V.S. , 160 ,Yang Daqing ,738Yang Hair<strong>on</strong>g , 1298Yang Lifeng , I 30 1Yang Zhenniang ,738,744Yang Zhihuai ,744Yao Cuiqin, 1082,1317Yen Yinchao ,750Yi Qun ,797Young Kathy L., 712Yu Qihao ,250,1304Yu Shengqing ,416,755Yuan Haiyi , 1308Yue Hanscn ,I3 12Zcng Zh<strong>on</strong>gg<strong>on</strong>g ,307,758Zhw Changqing 432,722,764,1197,1219Zhang Duo, 789Zhang Hengxuan ,969Zhang Huyuan ,768Zhang Jianming ,764Zhang Jiayi ,250Zhang Jinzhao, 138,1317Zhang Lianghui , 1265Zhang Lixin, 131,608,773,1255,1295Zhang Qibin ,204,778,819Zhang T., 783Zhang Tiehua , 1235Zhang Xiangg<strong>on</strong>g ,768Zhang Xikun ,529Zhang Xin ,789Zhang Yuanyou ,312Zhang &YOU ,793Zhang Zhao ,1321Zhang Zhaoxiang ,797Zhao Jun, 813Zhao Lin ,307,803Zhao Xiufeng ,210,282,809Zhao Yutain ,8 13Zheng Qipu ,1326Zhou Dcyuan ,1330Zhou Xinqing ,426Zhou Youwu ,204,393,778,819Zhou Zh<strong>on</strong>gmin , I334Zhu Chcng ,826Zhu Jinghu ,832Zhu Linnan , 764,835,1164
Zhu Qiang ,838Zhu Yuanlin , 1 1,250,970,1304Zhu Yunbing , 1338Zolotar A.J., 955Zou Xinqing ,1183,1342Zuo li ,11481350
GENBRAL SUBJECT-SENIORAUTHORINDEXCANALChang Rudolf V. ,855Jian G<strong>on</strong>g ,298Jiao Tianbao ,I I55Jin Naichui ,312Li Anguo ,383Qiao Dianshi ,529Rcn Zhizh<strong>on</strong>g ,I 215Wang Wenkai ,685Xu Bomeng ,730Zhang Changqing ,764 .Zhang Zhao ,1321Zhu Qiang ,838CHEMISTRY OF FROZEN SOILSDeng Yousheng ,I 31Ershov E.D. ,160Melnikov Vladimir ,455Osterkamp T.E. ,500Ostroumov V.E. ,506CIVIL ENGINEERMGAksenov V.K. ,IG<strong>on</strong>charov Ju.M. ,875Huneault P.A. ,286Jiang H<strong>on</strong>gju ,1152Kutasov I.M. ,362Men Zhaohe ,I 193Sui Tieling ,592Tang Shuchun ,602T<strong>on</strong>g Changjiang ,622Toxgashov Y.Y. ,941Ulrich Roland ,625Vlasov Vladimir P. ,951Vyalov S.S. ,955CLIMATE CHANGECarter L+David ,78Nakayama T. ,488Pan Anding ,1202Schmitt Elisabeth ,544Zhang T. ,783Zhao Xiufeng ,809DISASTER AND ENVIRONMENTPROTECTIONForbes Bruce C. ,176Huang Yizhi ,282Jorgcns<strong>on</strong> M.Torre ,316Kamensky R.M. ,322Makarov Vladimir N.,911Olovin Boris A. ,923Su Shengkui ,1235Wang Yingxue ,1269Zhang Qibin ,778Zheng Qipu ,I 326Zhou Youwu ,819ECOLOGYDai Chuntian ,I 16Gilichinsby David A., 869Liu Qingren ,407Mcltzer Liya I. ,914Zhao Yutian ,813EQUIPMENTCollins Charles M. ,1076Cui Guangxin ,1079Fortier Richard ,182Pu Yibin , I208Tao Zhaoxiang ,608Xia Zhiying ,1278FROST HEAVINGChen Ruijie ,1064Chen Xiangsheng ,1070Chen Xiaobai ,1073Dai Huimin ,120Ding Y<strong>on</strong>gqin ,143Fowler A.C. ,1100Grechishchev S. E. ,198Guo Dianxiang,] 108Jiang H<strong>on</strong>gju ,302Lewis G.C. ,1044Liu Shifang ,I 183Michalowski R.L. ,465Pissart A. ,523Shen Mu ,550Svec Otto J. ,596Wang Shir<strong>on</strong>g ,1262Xie Yingqi ,1282Xu Bomeng ,1292Yue Hanscn ,I 312Zhou Deyuan,] 330GENERALBarry R.G. ,23Chen Xiaobai ,1037Cheng Guod<strong>on</strong>g ,1010Gavrilova Maria K. ,1006Haeberli Wilfried ,1014Harris Stuart A. ,1019Heginbottom J.A. ,I 132King Lorenz ,1022Nels<strong>on</strong> F.E. ,987Qiu Guoqing , I028Van Everdingen R.0.,638Vins<strong>on</strong> Ted S. ,103 IGEOPHYSICAL PROSPECTINGSedov B.M. ,1222Snegirev A.M. ,934Zeng Zh<strong>on</strong>gg<strong>on</strong>g ,758Zou Xinqing ,I 342Lu Xingliang ,416HEAT-MASS TRANSFERGao*Xingwang ,188Hallet B. ,226Hoelzle Martin ,272Sheng Yu ,556Wang Yi ,1265Xia Zhao-Jun ,755Xu Xiaozu ,734Yen Yin-Chao ,750Zhang Lixin ,773HYDROLOGY ANDSOURCEBartoszewski S. A. ,32Brewer M.C. ,48Burchak T.V. ,1344Hinzman Larry D. ,267Kane D.L. ,326Marsh Philip ,443Woo Ming-Ko ,712Yang Daqing ,738WATER RE-1351
Yang Zhenniang ,744Yuan Haiyi ,1308MMINGDubina Mikhail M..,862Vakili Jalal ,1247Wang Changsheng ,I 251Wang Jianping ,678I’ERIGLACIAL PHENOMENALiu Gtnnian ,397Allard Michcl,l344Barsch Dietrich ,27B<strong>on</strong>darcnko G.I. ,851Burn C.R. ,60Caldcr<strong>on</strong>i G. ,72Cui Zhijiu ,1086Cui Zhi ju ,111Guo D<strong>on</strong>gxin ,210Guo Xud<strong>on</strong>g ,I 1 13Harris Charles ,232Harris Stuart A. ,238Kritsuk L.N. ,897Kunitsky Viktor V. ,903Leibman M.O. ,380Lewkowicz Ant<strong>on</strong>i G.,1345Li Shudc ,1174Luo Minru ,426Matsuoka Norikazu ,449Murt<strong>on</strong> Julian €3. ,482Shpolyanskaya N.A. ,930Slaughter Charles W.,574Solomatin V.I. ,937So0 Sweanum ,586T<strong>on</strong>g Boliang ,6 I7Trombotto Dario ,1238V<strong>on</strong>der Muhll D.S. ,654Vtyurina E.A. ,660Wang Baolai ,664Wang Chunhc ,670Wang Zhenyi ,1272Wayne William J. ,694Zhou Zh<strong>on</strong>gmin ,I 334Zhu Cheng ,826Zhu Jinghu ,832PHYSICS OF FROZEN soxsChcn Ruijie ,1067Chuvilin E.M. ,89Corapcioglu M.Y. ,100Ding Jingkang, 1092Fcdiukin Igor V. ,I 70Pedosccva V.I. ,865Fci Xueliang ,1096Gorelik Yakov ,879Guryanov Igor E. ,885Haoulani H. ,I 124He Ping ,250Huang Maohuan ,278Janoo Vincent ,292Leclaire P. ,368Li Anguo ,1159Li D<strong>on</strong>gqing ,I 164Li Kun ,1171Ma Wci ,432Miao Tiande ,I 197Roman L.T. ,1219Shesternyov D.M. ,1227Slcttcn R<strong>on</strong>ald S. ,580Thimus J.F. ,611Wang Jiacheng ,675Wang Jiacheng ,1255White T. L. ,700Wipweera Harsha ,706Wu Ziwang ,722Wu Ziwang ,1274Xu Xiaozu ,1295Yang Lifeng ,1301Yu Qihao ,1304Zhang Huyuan ,768Zhang Zhaoxiang ,797Zhu Linnan ,835Akagawa Satoshi ,1050Haiying FU ,1117PIPELINEAnt<strong>on</strong>ov-Druzhinin V.,1054Biggar Kevin W. ,42Burgess M.M. ,54Cui Jianheng ,1082Ding Jingkang ,138Domaschuk L. ,149Huang Junheng ,1148Liu H<strong>on</strong>gxu ,403Moblcy Keith F. ,471Molmann This, 477Nix<strong>on</strong> J. F. ,494Zhang Jinzhao,l317Zhang Xin ,789REGIONAL GEOCRYOLOGYAllard Michel , 5An Viktor ,843Arc Felix E. ,846Aziz A., 17Baulin V.V., 1060Bell<strong>on</strong>i S. ,36Chehovsky A.L., 1062Chcn XiaoBai ,84Collctt Timothy S., 94Dallimore S.R. , 125Danilov Igor D. ,858Devjatkin V.N. , 134Gorbunov A.P. ,1105Gray James T. ,192Gu Zh<strong>on</strong>gwci ,204Haeberli Wilfried , 214Hall Kevin J. ,220RanWk,1119Hazcn Beez ,244Weginbottom J.Alan ,255Hcnrik Mai ,I 137Hinkel K. M. ,261Hu Ruji, 1144Jin Huijun ,307Kellcr Felix , 332Kershaw G. Peter, 338King Lorenz ,344Klimovsky Igor V. ,891Klimowicz Zbigniew, 350Kurfurst P.J. , 356Lehmann Rainer ,374Li Guangpan , 1 I67Li Zuofu ,1178Liang Linheng ,393Lomborinchen R. ,411Lunardini Virgil J.,420Luo Guowci ,I 186Ma H<strong>on</strong>g ,429Mamzelev A.P. ,436Migala Krzysztof ,919Pavlov A.V. ,51 1Ping C. L. ,517Qiu Guoqing ,533Ramos M. ,1211Salnikov P.I. ,927Sharkhuu A. ,1223Shur Y.L. ,564Siegert Christine ,569S<strong>on</strong>e Toshio ,1231Tumurbaatar D. ,1242Urdea Petru ,631Vandenberghe J. ,643Vasil’chuk Yurij K.,945Walker H.Jesse ,1345Walters James C. ,1346Wang Shaoling ,1259Wang Yaqing ,689Wu Qingbai ,7 18Xi<strong>on</strong>g Heigang , I287Yu Shcngqing ,755Zhang Zcyou ,793Zhao Lin ,803REMOTE SENSING AND MAP-PINGBurns R.A., 66Haugen Richard K. , 1128Liang Pcngxian ,388
ROADSAn Weid<strong>on</strong>g , I1Cui Jianhtng , 105Dydyshko P.I. , 155Esch David C. ,164Kurilchik A.F. ,909Luo Weiquan , I 190Mi Haizhcn ,461Saarelainen Seppo , 539Shoop Sally A. ,559Tang Xiaobo ,605Vins<strong>on</strong> Ted S., 648Yang Hair<strong>on</strong>g ,1298Zhu Yunbing , 1338
LIST OF PARTICIPANTS IN VI ICOPAguirre-Puente, J.Akagawa SatoshiAkerman J<strong>on</strong>as H. &Ms. Akerman**Allard, Michel**An Weid<strong>on</strong>gAnisimova N.P.Ant<strong>on</strong>ov-Druzhinin V.Are Felix E.Aziz A.Balobayev V.T.Barry, Roger G.Saulin V.V.qigga,r K.Y. & NilBradley, P.G.Rrewer Y.C.**Brown Jerry RCella Brown"Cames-Pintaux,Anne-MarieCarls<strong>on</strong> Robert &Camille Q . Csrls<strong>on</strong>Carter, L. David*Chang R .V.'Chen FengfengChen Ruijie+Chen 'XiaobaiCheng Guod<strong>on</strong>g"Cheng YouchangClark, Michael G.Clarke Edwin S. RAlta ClarkeCollett, Timothy S.Corapcioglu M. Yavuz &Carol Y. W<strong>on</strong>gCui GuangxinCui JianhengCui ZhijiuDai RaoguoDai HuiminDallimore ScottFranceJapanSwedenCanadaCanadaRussiaRussiaRussiaUSARussiaUSARGssiaCanadaUSAUSAUSAFranceUSAUSARussiaChinaChinaChinaChinaChinaUSAUSAUSAUSAChinaChinaChinaChi,naChinaCanadaLaboratoire d'Aerothermique du C.N.R.S., Yeud<strong>on</strong>3-4-17 Ftchujima, 3-Chome Koto-Ku, Tokyo 135Department of Physical Geography IJniversity of Lund,Solvevgatan 13 S-23362 LundUniversity Laval, Ce'ntre D'Etudes Nordiques, Sainte-Foy,Quebec GlK 7P4Centre D'Etudes Nordiques, Universite Laval, Quebec G1K 7P4<strong>Permafrost</strong> Institute, Siberian Branch, Russia Academy ofSciences, 677010, Yakutus, 10INGEOTES, 626718, Nory Urengoy, 'fyrnen Reg.Petersburg Institute of Railway Engineers, Moskovskp av., 9.St. Petersburg 190331Department of Mechanical Engineerrng G<strong>on</strong>zaga University,Spokane, WA 99258<strong>Permafrost</strong> Institute, Siberian Branch, Russia Academy ofSciences, 677010, Yakutus. 10Ilniversity of Colorado, CLRES/NSIDC, Boulder Co. 80309-0449PNIIIS, Okruinol PR. 18. 105058 GSP. MOSCOWDepartment of Civil Fngineering, Royal Military College,Kingst<strong>on</strong>, K7K SLORox 194900, Dept. of Transportati<strong>on</strong> and Public Facilities,Pouch 6900, Anchorage, Ak 99510U.S. Geological Survey, 4200 University Drive. Anchorage,Alaska, 99508-466<str<strong>on</strong>g>Internati<strong>on</strong>al</str<strong>on</strong>g> permafrost Associati<strong>on</strong> Editorial Committee,P.O. Box 9200, Arlingt<strong>on</strong>, Virginia 22219-0200C.N.R.S., Lab. d'Aerothermique, 4 , Route Gardes, 92190Meud<strong>on</strong>Institute of Water Resources, Ilniversity of Alaska,Fairbanks, AK 99701U.S. Geological Survey, 4200 University Drive. Anchorage,Alaska 99508-4667<strong>Permafrost</strong> Institute, Russian Academy of Sciences,Yakutsk 677018State Key Laboratory of Frozen Soil Engineering, LIGG,CAS, 730000State Key Laboratory of Frozen Soil Engineering, LIGG,CAS, 730600Lanzhou Institute of Glaciology and Geocryology. ChineseAcademy of Sciences, Lanzhou 730000Lanzhou Institute of Glaciology and Geocryology, ChineseAcademy of Sciences, Lanzhou 730330Daqing Oil Field Design Academy. 555469306 Geology R Geography Ruilding, Knpxville, TENN 37995-1410Clarke Engineering Company, 1818 So. University Avenue,Suite 9-Fairbanks. Alaska 99709U.S. Geological Survey, Sox 2504-6, MS-940, Denver FederalCenter, Lakewood, Colorado 83225Department of Civil Engineering, Texas A&M University,Collage Stati<strong>on</strong>, TX 77843-3136Mining and Technology Ilniversity, Xuzhou 221008The First Survey and design Instituke of Highway, TheMinistry of Communicati<strong>on</strong>s, Xian 710068Repartrnent of Geography, Beijing Ilniversity, Reijing 100871Hei1<strong>on</strong>gj;ang Institute of Forestry, Yeil<strong>on</strong>gjiang Province,150040Heil<strong>on</strong>gjiang Institute of Highway and Transport, 40 qingbinRoad, Harbin 150080Geological Survey of Canada 601 Booth St, Ottawa, K1A DE8'Participants in the field trip to Lhasa (A-1)**Participints-in the fiield trip to Tianshan Mountain (A-2)
Deng NanDeng YoushengDevjatkin V.N.Ding JingkangDramis FrancescoDubikov G.1,Dubina M.M.Esch DavidFedorov A.N.Fedoseeva V.I.Fei XueliangFerrians, Osca~Flaate, Kaare &Astrid FlaateFortier R. &Brigitte Dufour"French Hugh M.*Gnmper Barbara"Gao 'deiyucCao XingwangGarty, Jacoh kGarty Rachel"Gavrilova M.K,Ge YuanyouGe QihuaEilichinsky D.A.G<strong>on</strong>g WangshengGorbunov A,P.Grechishchev S.E.Gryc GeorgeGu Zh<strong>on</strong>gweiGuglielmin MauroGuo DianxiangGuo TingbinGuo Xud<strong>on</strong>gGuryanov I.E.Haeberli W.*Hall Kevin RMrs. A.J. HallHallet, Sernard"Han UK**Harris Charles**Harris S.,4.*&P.R. HarrisHe PingHeginbottom J.A.ChinaChinaRussiaChinaItalyRussiaRussiaUSARussiaRussiaChinaUSANorwayCanadaCanadaSwitzerlandChinaChinaIsraelRussia 'ChinaChinaRussiaChinaRussiaRussiaUSAChinaItalyChinaChinaChinaRussiaSwitzerlandSouth AfricaIJSASouth KoreaIJ KCanadaChinaCanadaChinese Academy of Sciences, Beijing 100864State Key Laboratory of Frozen Soil Engineefing, LIGG.CAS, 730000Institute of Cryosphere of Earth of Russia Academy ofSciences p,b. 1230 Tyumen 625000, Russia Federati<strong>on</strong>Northwest Institute, Chinese Academy of Railway Sciences,LanzhouDepartment of Geology, Universita di Camerino, VialeReeti 1, 62032 CamerinoDepartment of Eeocryology, Faculty of Geology, MoscowState University, ,Moscow 119899<strong>Permafrost</strong> Institute, Russian Academy of Sciences,Yakutsk 677018Alaska Dept. of Transportati<strong>on</strong>, <strong>Research</strong> Engineer, Alaska2301 Peger Road,<strong>Permafrost</strong> Institute, Russian Academy of Sciences, Yakutsk677018<strong>Permafrost</strong> Institute, Russian Academy of Sciences,Yakutsk 677018Xian Highway and Transportati<strong>on</strong> University, XianU.S. Geological Survey, 4200 University drive, Anchorage,Alaska 99508Norwegian Road <strong>Research</strong> Laboratory, P.O. Box 6390 Ettertad0604 Oslo 6Centre d'etudes Nordiques, Pavill<strong>on</strong> F.A. Savard,Universite Lavel, Sainte-Foy, Quebec G1K 7P4Dept. of Geography, University of Ottawa, Ottawa,Ontario K1N 6N5Eawag, Ste. 8600 Dubendor!Water C<strong>on</strong>servancy qesearch Institute of Inner M<strong>on</strong>golia,010020Lanzhou Institute of Glaciology R Geocryology, ChineseAcademy of Sciences, Lanzhou 730000Tel-Aviv University, Department of Botany, Tel-Aviv 69978<strong>Permafrost</strong> Institute, Siberian Branch, Russian Academy ofSciences, 671010, Yakutus 10Water Resources Rureau of Bayan County, Yeil<strong>on</strong>gjiang 151800The First Survey and design Institute of Highways, TheMinistry of Communicati<strong>on</strong>, Xian 710068Institute of Soil Science and Photosynthesis of TheRussian Academy of Sciences,Pushchino 142292Chinese Academy of Sciences, Beijing 100864<strong>Permafrost</strong> Institute, Siberian Branch, Russian Academy ofSciences, 677010, Yakutus 10All-Uni<strong>on</strong> <strong>Research</strong> Inst. of Hydrogeology R Eng. Geology,142452 Zeleny-village, Noginsk District, Moscow Regi<strong>on</strong>U.S. Geological Survey, 345 Middlefield Road, Menlo Park,CA 94025Lanzhou Institute of Glaciology and Geocryology, ChineseAcademy of Sciences, Lanzhou 730000Istituto di Geologia, Universita degli Studi Di Parma43100, ParmaInstitute of Hydraulics, Shand<strong>on</strong>g Province, 250013The Nati<strong>on</strong>al Natural Science Foundati<strong>on</strong> of China,Academician, Beijing 100083Institute of Geologic, CAS, Beijing 634 Box, 100029<strong>Permafrost</strong> Institute, Siberian Branch, Russian Academy ofSciences, 677010, Yakutus 10Laboratory of Hydraulics, Hydrology and Glaciology,VA'd-ETH Zentrum CY-8092, ZurichDepartment of geography, University of Natal, P.O. Box 375,3200 PietermaritzburgUniversity of Washingt<strong>on</strong>, Q.uaternary <strong>Research</strong> Center AK-60Seattle, WA 98195nept. of 2nv. Sci., Korea Military Academy. Seoul,Korea 139-799Department of Geology, University of Wales, P.O. Box 914,Cardiff, CF1 3YEDepartment of Geoaraohv. . Universitv of Calgary, Calgary,I. 1Alberta, T2N 1NZState Key Laboratory of Frozen Soil Engineer ing, LIGG,CAS, 730000Geological Survey of Canada, 601 Booth Stree t, Ottawa KlA OE8
Hinkel K.M."Guo D<strong>on</strong>gxin'Huneau~, Paul A.Hinzrnan, Larry D.1Ioelzle M.'t*Horiguchi KaoruNuang HaohuanHuang Yizhi"Hu Qiheng1ordanesc.u MirceaIstomin Vladmir A.Jiao Tianhao RL<strong>on</strong>g Jiyun*Jia Jiarrhua.I i n Hui juri'$'(Jin NaichuiKurnensky Ros~eslav M.Kline, Jlouglas L."Keller F.*King Lorenz J."Klirnovsky I.V.Koster u,.A.ikqeKrantz William 5. RJune KrantzKunitskiy V.V.Yurfurst P..J. Rllana Yurfurst.Lachenhruch, Arthur REdith 5. J,achenhruchLangager, Hans ChristianLautridou Jean PLfhmann, Rainer"9FLewkowicz A.C.Li AngucLi D<strong>on</strong>gqingLi HaoLi Shijie**1.i ShurleLi Yi1.i YushengJ.i ZuofuLi WeiguoLiang FengxianLi nYipuUSAChinaCanadaUSASwitzerlandJapanChinaChinaChinaCanadaRussiaChinaChinaChinaChinaRussiaUSASwitzerlandGermanyRussiaNetherlandI1 s ARussiaCanadaUSADenmarkFranc.eGermanyCanadaChinaChinaChinaChinaChinaChinaChinaChinaChinaChfnaChinaDepartment of Geograph, Mail Locati<strong>on</strong> 131, UniversityCincinnati, Cincinnati, Ohio 45221-0131Lanzhou Instlzute of Glaciology & Geocr.yology, ChineseAcademy of Sciences, Lanzhou 730000500 Boul Bene-Lbvesque Ouest, Place Air Canada, Bareau 600M<strong>on</strong>treal (Qubbec) H2Z 1W7University of Alaska, Water <strong>Research</strong> Center, Fairbanks,Alaska 99775-1760Lahoratory of Hydraulics, Hydrology R Glaciology, VAW-ETHZentrum, CH-8092 ZurichThe Institute of Low Temperature Science, HokkaidoIlniversi ty, .Sapporo Oh0State Key Laboratory of Frozen Soil Engineering, LIGG,CAS, 730000Lanzhou Institute of Glaciology & Geocryology, ChineseAcademy of Sciences, Lanzhou 730000Chinese Academy of Sciences, Reijing 1008641800 Y<strong>on</strong>te Saiate-Julie, Varennes, P. Quebec J3X IS1Russia, 142717, Moscow Segi<strong>on</strong>, Leninskij Qaj<strong>on</strong>, Razvieka,VNIIGAZ !Yitulihe Branch of Harbin railway Bureau, Heil<strong>on</strong>gjiang 022168The First Survey Design Institute, Lanzhou Branch, Ministryof Railway of China, Lanzhou 730000Lanzhou Institute of Glaciology & Eeocryology, ChineseAcademy of Sciences, Lanzhou 730000Heil<strong>on</strong>gjiang Hydraulic <strong>Research</strong> Institute, Harbin 150080<strong>Permafrost</strong> Institute, Russian Academy of Sciences,Yakutsk 677018University of Alaska, Fairbanks, Water <strong>Research</strong> Center,Fairbanks, Alaska 99775-1760Laboratory of Hydraulics, Hydrology and Glaciology, ETHZentrum, CH-8092, ZurichGeographical Institute, Justus Liebig-Universitat, Dh300Giessmn<strong>Permafrost</strong> Institute, Siberian branch, Russian Academy ofSciences, 677010, Yakutus 10Geographical Institute, University of Utrecht P.O. Box 80.115, 3508TC UtrechtUniversity of Colorado, Dept. of Chenical Engineering,Campus Sox 424, Roulder, Colorado 80309-0424<strong>Permafrost</strong> Institute, Siberian Branch, Russian Academy ofSciences, 677010, Yakutus 10Geological Survey of Canada, 601 Booth St. Ottawa,Ontario YlA 088345 Middelfield Road, MS/Y23, Menlo Park, California 94025Greenland Field investigati<strong>on</strong>s, Greenland Home Rule Agency16 Rosenvrngets All6 DK-2100 Copenhagen (1,Centre ne Geomorphologie, Ruedes Tilleuls 14000 CaenGeographisches Institut, Universitat Heidelberg ImNeuenheimer Feld 348 n/W-6900 HeidelbergUniversity of Tor<strong>on</strong>to, Oept. of Geography, Erindale College,Mississauga, Ontario L5L 1C6Northwest Hydrotechnical Science <strong>Research</strong> Institute,Yangling Town 712100State Key Laboratory of Frozen Soil Engineering, LIGG,CAS, 730000Ningxia Hydrotechnical Science <strong>Research</strong> Institute, Yinchuan750001Lanzhou Institute of Glaciology & Geocryology, ChineseAcademy of Sciences, Lanzhou 730000Lanzhou Institute of Glaciology & Geocryology, ChineseAcademy of Sciences, Lanzhou 730000?lining and Technology University, Xuzhou 221008D<strong>on</strong>g nan San Tiao, No.14, Seijing 100005Lanzhou Institute of Glaciology R Geocryology, ChineseAcademy of Sciences, Lanzhou 730000Heil<strong>on</strong>gjiang Institute of Forestry, Seil<strong>on</strong>gjiang Province,150040Lanzhou Institute of Glaciology & Geocryology, ChineseAcademy of Sciences, Lanzhou 730000Bureau of Zhalainoer Coal Mine and Instituti<strong>on</strong> ofPale<strong>on</strong>tology and Paleanthropology of Academy Sinica,021412
Liu Gengnian .Liu H<strong>on</strong>gxuLiu XuekuiLovell, Charles W. &Marry TottenLu Guoweitu XingliangLunardini Virgil’Luo WeiquanMa ChunlinMa H<strong>on</strong>gMa WeiMa YijunMa Zhixue*Mackay. J. RossMakarov V. I.Matsuoka NorikazuMatthias Jakob**Melnikov E.S.Men ZhaoheMi HaizhengNa Yunl<strong>on</strong>gNakayama TomokoNazarenko Alexander A.& Nazarenko LydiaNels<strong>on</strong>, Frederick RMargaret WildeXNidowicz Sernard RMs. Carol TrahimOhata TetsuoOsterkamp T.R. RJ.M. OsterkampOutcalt Samuel I.*+Pang WeizhenPerlstein G.Z.Pkwb Troy L. &Mrs, Pew6Phukan Arvind P.E.Ping C .L.Pissar t, AlbertProkop ieva L.V.Pu Yib inQiao DianshiQiu Guoqing**Romanovskj N. N,Ro<strong>on</strong>ey, James W. &FlorenceSalnikov P.I.Schmitt EliaabethwChinaChinaChinaUSAChinaChinaUSAChinaChinaChinaChinaChinaChinaCanadaRussiaJapanCanadaRussiaChinaChinaChinaJapanRussiaUSAUSAJapanlJSAIJSAChinaqussiaIJSAUSAUSABelgiumRussiaChinaChinaChinaRussiaUSARussiaGermanyDepartment of Geography, Reijing University, Reijing 100871Heil<strong>on</strong>gjlang Province Low Temperature C<strong>on</strong>structi<strong>on</strong> Science<strong>Research</strong> Institute; Harbin 150080Institute of Forestry nesign, Heil<strong>on</strong>gjiang Province, 150080Purdue University, School of Civil Engineering, WestLafayette, IN 47907Da Hingganling Institute of Forestati<strong>on</strong>, Inner M<strong>on</strong>go 1 ia022150Bei An Road 74, Changchun 130061CRREL, 72 Lyme Road, Hanover NH 03755Design, House of Management Forest Bureau, Eer Guna 1, i ft,Inn,er M<strong>on</strong>golia 022363Heil<strong>on</strong>gjiang Institute of Forestry, Heil<strong>on</strong>gjiang Pro V ince150040Xinjiang Institute of Geography, Chinese Academy ofSciences. Ilrumai 830011State Key Laboratory of Frozen Soil Engineering, LIGG,CAS, 730000Institute of Hydraulics, Shand<strong>on</strong>g Province 250013Lanzhou Institute of Glaciology $i Geocryology, ChineseAcademy of Sciences, Lanzhou 730000University of aritish Columbia, 217-1984 Yest Mall,Vancouver, S,C. V6T 1W5<strong>Permafrost</strong> Stati<strong>on</strong>, <strong>Permafrost</strong> Institute, Rolishoi TeatrStreet, Build. 9, Krasnoyarckiy Krai, Iyarka, 663200Institute of Geoscience, University of Tsukuba, Ibaraki 305Department of geography, University of-.british Columbia.Vancouver, B.C., V6T 1‘45All-Uni<strong>on</strong> <strong>Research</strong> Tnst. of Hydrogeology & Eng. Geology.142452, Zeleny-village, Noginsk Distric-t, Moscow Regi<strong>on</strong>Amuer Design House Forestry Rureau, Management Rureau ofDa Hingganling, 165302, Yeil<strong>on</strong>gjiangLanzhou Institute of Glaciology & Geocryology, ChineseAcademy of Sciences, Lanzhou 730000Da Hingganlirrg.1nstitute of Prospecting and Design,Ministry of Forestry, 165000Institute of Low Temperature Science, Hokkaido Univ.,Sapporo2 Petrousky Streat Yakutsk 677891Rutgers University, Dept. of Geography, Box 5080/KilmerNew Brunswick, New Jersey 08903601 East 57th Place, Anchorage, Alaska;fairbnks, Alaska AK99517Institute for Hydrospheric-Atmospheric Sciences,Nagoya University, Chikusa-Ku. Nagoya 464-01Geophysical Institute University of Alaska 995172466 Trent<strong>on</strong> Ct Ann Arbor, M, 48105C<strong>on</strong>sultant (Formerly Central Coal Mining <strong>Research</strong> Institute),Beijing 103013<strong>Permafrost</strong> Institute, Siberian Branch, Russian Academy ofSciences, 677010, Yakutus 10Ariz<strong>on</strong>a State University, nepartment of Geology, Tempe,AZ 85287-14042281 Foxhall Dr Anchorage AK 99504AFES-SALRM 533E. Fireweed St. Palmer, Alaska 99645Universitb de LiAge, Geomorphologie et GPologie duQuaternaire, 7, Place du 20 Aout, 4000 l,i&ge<strong>Permafrost</strong> Institute, Siberian Sranch, Russian Academy ofSciences, 617010, Yakutus 10State Key Laboratory of Frozen Soil Engineering, LIGG,CAS, 730000Suihua Area Hydraulic Bureau, Heil<strong>on</strong>gjiang 152054Lanzhou Institute of Glaciology R Geocryology, ChineseAcademy of Sciences, Lanzhou 730000nepartment of Geocryology, Faculty of Geology, MoscowState University, Moscow 119899Rom C<strong>on</strong>soltants, Inc. 9101 Vorgvard, Anchorage AK 99507Chita Department of <strong>Permafrost</strong> Institute of SiberlanDivisi<strong>on</strong> of Russian Academy of SciencesGeographisches Institut Di Univ. Giessen Senckenbergstrasse1, 6300 Giessen
Senneset Kaare 8Inger SofieShao LijunSharkhuu N.Shatz M.M.Shen MuShen Y<strong>on</strong>gping**Sheng YuShi YafengShoop, Sally A. &Clayt<strong>on</strong> MorlockSiegert ChristineSlaughter Charles W.**Sletten, R<strong>on</strong>ald S.*Snegiryev A.M.Solomatin V.I.S<strong>on</strong>e Toshio**So0 SweanumSteensboe Jorgen S.Sun JinyueTang ShuchunTao ZhaoxiangThomsen ThorkiloTilley Philip**T<strong>on</strong>g BoliangT<strong>on</strong>g ChangjiangTremblay ClementTu GuangzhiUrdea Petru I.Uziak-t StanislawVan Everdingen Robert 0.Vandenberghe. Jef**Velikin S.A. ,Vins<strong>on</strong>, Ted. S. &Suzanne Vins<strong>on</strong>V<strong>on</strong>der Muhll D.S.**Vyalov Segrey S.Walker H. Jesse**Walters James C.Wang Baolai* &Jian QicenYang Changsheng"Wang GuoshangWang Huan*Wang JiashengWang JianpingNorwayChinaM<strong>on</strong>goliaRussiaCanadaChinaChinaChinaUSAGermanyUSAUSARussiaRussiaJapanUSADenmarkChinaChinaChinaDenmarkAustraliaChinaChinaCanadaChinaRomaniaPolandCanadaNetherlandRussiaUSASwitzerlandRussiaUSAUSACanadaChinaChinaChinaChinaChinaThe Norwegian Inst. of Technology, Geotechnical Divisi<strong>on</strong>,N-7034 Tr<strong>on</strong>dheimSi Dalin Road 140, Changchun 130012Institute of Geography & Geocryology, M<strong>on</strong>golian Academy ofSciences,Ulanbartu 21620<strong>Permafrost</strong> Institute, Siberian Branch, Russia Academy ofSciences, 677010, Yakutus 10Genie Civil, Universite Lavel. Ste-Foy (Quebec), QuebecG1K 7P4Lanzhou Institute of Glaciology 5 Geocryology, ChineseAcademy of Sciences, Lanzhou 730000State Key Laboratory of Frozen Soil Engineering, LIGG,CAS, 730000Lanzhou Institute of Glaciology i% Geocryology, ChineseAcademy of Sciences, Lanzhou 730000CRREL 73 Lyme RD Hanover, NH 03755-1290Am Wehr 7, 0-8801 BertsdorfLand/Water Interacti<strong>on</strong>s Pesearch Program Pacific Northwest<strong>Research</strong> Stati<strong>on</strong>, USDA Forest Service, 308 Tanana Drive,Fairbanks, Alaska 99775University of Washingt<strong>on</strong>, Civil Engineering. Mail StopFX-10, Seattle, WA 98195<strong>Permafrost</strong> Institute, Siberian Branch, Rusrpian Academy ofSciences, 677010, Yakutus 10Faculty of Geography, Moscow State University, Moscow 119899Hokkaido University, Institute of Low Temperature Science,Sapporo Oh0Department of Civil Engineering and C<strong>on</strong>structi<strong>on</strong>, BradleyUniversity, Peoria, IllinoisRosenvengets Alle 16-DK 2100 CopenhacenInstitute of Crop Germplasm Resources, Chinese Academy ofArgriculture Sciencea. Beijing 100081Da Qing Oil Field C<strong>on</strong>structi<strong>on</strong> Design <strong>Research</strong> Institute,163712State Key Laboratory of Frozen Soil Engineering, LIGG,CAS, 730000Pilestraede 52 P.O. 2128 OK 1015 Copenhagen KDeot. of Geography. University of Sydney, NSW 2006tor 10 QueGn ST-Mittag<strong>on</strong>g NSW Australia 2575)Lanzhou Institute of Glaciology & Geocryology. Ch ineseAcademy 'of Sciences, Lanzhou 730000Lanzhou Institute of Glaciology R Geocryology. Ch ineseAcademy of Sciences, Lanzhou 730000Ministere des Transports du 9.. 700, boul. St-cyr illeest, 30e etage, Quebec G1R SH1Chinese Academv of Sciences, Beiiina 100864"University of Timisoara, V. Parvan 4, 1903 Timisoara19 Akadomicka. 20-033 LublinThe Arctic Institute of North America, the University ofCalgary, Calsary, Alberta, T2N 1N4Inst. of Earth Sciences, De Boelelaan 1081 HV Amsterdam<strong>Permafrost</strong> Institute, Russian Academy of Sciences. Yakutsk677018Oreg<strong>on</strong> State University, Dept. of Civil Engineering.Corvallis, Oreg<strong>on</strong> 97331 'Versuchsanstalt fbr Wasserbau, Hydrologie und GlaziologieETH-Zentrum, CH-8092. ZurichScientific and Researth Bureau "Geotechnique" PodsosenskgPer., 25, LO3062 MoscowDept. of Geography, Louisians State University, Bat<strong>on</strong>Rouge, LA 70803Dept. of Earth Science, University of Northern Iowa,Cedar Falls, IA 50hlLCentre d'etudes nordiques, Universite Laval, St-Foy,Quebec G1K 7P4Central Coal Mining <strong>Research</strong> Institute, Reijing 100013Lanzhou Institute of Glaciology & Eeocryology, ChineseAcademy of Sciences, Lanzhou 730000Beijing <str<strong>on</strong>g>Internati<strong>on</strong>al</str<strong>on</strong>g> C<strong>on</strong>venti<strong>on</strong> Center, BeijingState Key Laboratory of Frozen Soil Engineering, LIGG,CAS, 730300Central Coal Mining <strong>Research</strong> Institute, Beijing 1060131358
Wang ShangliWang Shir<strong>on</strong>gWang Xingl<strong>on</strong>gWang YaqingWang Yi**Wang ZhanchenWang ZhengyiWei XuexiaWoo Ming KOWu JingminWu QingbaiWu ZiwangXia ZhaojunXia ZhiyingYXie YanXie YingqiXue ShiyingXu Zhi H<strong>on</strong>gXu ShaoxinXu XiaozuYang Hair<strong>on</strong>gYang JinghuiYang ZhenniangYen Y.C. 'Young K.L. &Mar8are.t M.Yu Qihaoyu Xiang and Wrs. YuZhang ChengqingZhang JiazhenZhang JieZhang Jin'zhaoZhang LixinZhang QibinZhang ZhaoZhang ZhaoxiangZhang HengxuanZhao Lin**Zhao XiufengXZhao YutianChinaChinaChinaChinaChinaChinaChinaChinaCanadaChinaChinaChinaCanadaChinaChinaChinaChinaChinaChinaChinaChinaChinaChinaUSACanadaChinaChinaChinaChinaChinaChinaChinaChinaChinaChinaChinaChinaChinaChina'Lsnzhou Institute of Glaciology & Geocryology, ChineseAcademy of Scieoces. Lanzhou 730000Water C<strong>on</strong>servancy. Bureau.of Panjin City, Liao Nin Province,124010Heil<strong>on</strong>gjiang Institute of Highway and Transport, 40 QingbinRoad, Harbin 150080Lanzhou Institute of Glaciology & Geocryology, ChineseAcademy of Sciences, Lanzhou 730000Water Resources <strong>Research</strong> Institute of Inner M<strong>on</strong>golia Huhhox,Inner M<strong>on</strong>golia 010021Bei An Road 74, Changchun 130061Bureau of 'Zhalainoer Coal Mine and Instituti<strong>on</strong> ofPele<strong>on</strong>tology and Paleanthropology of Academy Sinica,021412Department of Mechanics, Lanzhou University. 730000Geography Department, McMaster University, Hamilt<strong>on</strong>,Ontario L8S 4K1The First Survey and Design Institute of Highways, TheMinistry of Communicati<strong>on</strong>, Xian 710068Lanzhou Institute of Glaciology & Geocryology, ChineseAcademy of Sciences, Lanzhou 730000State Key Laboratory of Frozen Soil Engineering, LIGG,CAS, 730000Department of Geography, McMaster University, Hamilt<strong>on</strong>,Ontario L8S 4K1Lanzhou Institute of Glaciology & Geocryology, ChineseAcademy of Sciences, Lanzhou 730300Lanzhou Institute of Flacciology & Geocryology, ChineseAcademy of Sciences, Lanzhou 730000Hei L<strong>on</strong>gjiang Provincial <strong>Research</strong> Institute of WaterC<strong>on</strong>servancy, 150080Chinese Academy of Sciences, Beijing 100864Chinese Academy of Sciences, Beijing 100864Heil<strong>on</strong>gjiang Provincial <strong>Research</strong> Institute of WaterC<strong>on</strong>servancy, 150080State Key Laboratory of Frozen Soil Engineering, LIGG,CAS, 730000Northwestern Institute, Railway Ministry Academia,Lanzhou 730300Water C<strong>on</strong>servancy nesigning Party, Shuangliao County JilinProvince, 136400Lsnzhou Institute of Glaciology & Geocryology, Chinese -Academy of Sciences, Lanzhou 730000CRREL, Hanover, New Hampshire 03755Department of Geography, McMaster University, Hamilt<strong>on</strong>,Ontario, L8S 4K1State Key Laboratory of Frozen Soil Engineering, LIGG,CAS, 730300Central coal Mining <strong>Research</strong> Institute, He Pingli,Beijing 100013State Key Laboratory of Frozen Soil Engineering, LIGG,CAS, 730000Chinese Geography Associati<strong>on</strong>, An Ding Men Wai, Da TunRoad No.917, Beijing 100101<strong>Research</strong> Society for Chinese Development of Cold Regi<strong>on</strong>,150010The First Survey and design Institute of Highways. TheMinistry*of Communicati<strong>on</strong>s, Xian 710068State Key Laboratory of Frozen Soil Engineering, LIGG,CAS, 730000Lanzhou Institute of Glaciology & Geocryology, ChineseAcademy of Sciences, Lanzhou 7300C3The First Survey Design Institute, Ministry of Railwayof China, Lanzhou 730000Beijing Argricultural Engineering University, Reijing 100083Chinese Development of Cold Regi<strong>on</strong> <strong>Research</strong> Society, DaoliUistrict, Zh<strong>on</strong>gyi Street 34, Harbin 150010Lanzhou Institute of Glaciology & Geocryology, ChineseAcademy of Sciences, Lanzhou 730000' Lanzhou Institute of Glaciology & Geocryology, ChineseAcademy of Sciences, Lanzhou 730000Institute of Crop Germplasm Resources, Chinese Academy ofArgriculture Sciences, Beijing 100081'1359 -
Zheng DuoZheng DuoZhou DeyuanZhou YouwuZhou Zh<strong>on</strong>gminZhu JinghuZhu LinnanZhu Qiang2hu YuanlinChinaChinaChinaChinaChinaChinaChinaChinaChinaJilin Provincial Institute of 'Water C<strong>on</strong>servancy Sciences,Changchun 130022Beijing Institute of Geography, Chinese Academ Y ofSciences, Beijing 100101Administrati<strong>on</strong> Bureau of Hetao Irrigati<strong>on</strong> Area in Y<strong>on</strong>gji,Inner M<strong>on</strong>golia 015000Lanzhou Institute of Glaciology & Geocryology, ChineseAcademy of Sciences, .Lanzhou 730000Changsha Hydraulic Electric Power Teachers' CO 1 lege,Changsha 410077Department of Geography, Harbin Normal Univers i tY 9Harbin 150080State Key Laboratory of Frozen Soil Engineering, LIGG,CAS, 730000Gansu Provincial <strong>Research</strong> Institute of Water C<strong>on</strong>servancy,Lanzhou 730000State Key Laboratory of Frozen Soil Engineering, LIGG,CAS, 730000