- Page 2:
Using R for Introductory Statistics
- Page 5 and 6:
This edition published in the Taylo
- Page 8 and 9:
PrefaceWhat is R?R is a computer la
- Page 10 and 11:
Web accompanimentsThe home page for
- Page 12 and 13:
Chapter 1Data1.1 What is data?When
- Page 14 and 15:
Data 3Journal of Economics that leg
- Page 16 and 17:
Data 5When R starts, it searches fo
- Page 18 and 19:
Data 71.2.3 AssignmentIt is often c
- Page 20 and 21:
Data 9Giving data vectors named ent
- Page 22 and 23:
Data 11> x = c(2,3,5,7,11)> xbar =
- Page 24 and 25:
Data 13Simple sequences A sequence
- Page 26 and 27:
Data 153. Find the differences of t
- Page 28 and 29:
Data 17> ebay[−1] # all but the f
- Page 30 and 31:
Data 19empty vector if i=0x[c (2, 3
- Page 32 and 33:
Data 21Many R functions have an arg
- Page 34 and 35:
Data 231.4 Reading in other sources
- Page 36 and 37:
Data 25A convenient method, which r
- Page 38 and 39:
Data 27Using source () to read in R
- Page 40 and 41:
Data 291.4.4 Problems1.20 The built
- Page 42 and 43:
Chapter 2Univariate dataIn statisti
- Page 44 and 45:
Univariate data 33The table() funct
- Page 46 and 47:
Univariate data 35There are names o
- Page 48 and 49:
Univariate data 37Why are pie chart
- Page 50 and 51:
Univariate data 392.5 Web developer
- Page 52 and 53:
Univariate data 4121:Read 20 items>
- Page 54 and 55:
Univariate data 43compare different
- Page 56 and 57:
Univariate data 45Figure 2.8 The me
- Page 58 and 59:
Univariate data 47numbers first and
- Page 60 and 61:
Univariate data 49> var(test.scores
- Page 62 and 63:
Univariate data 51As with the quant
- Page 64 and 65:
Univariate data 532.13 Can you copy
- Page 66 and 67:
Univariate data 55Comment on any pa
- Page 68 and 69:
Univariate data 57> hist(waiting) #
- Page 70 and 71:
Univariate data 59Figure 2.13 Frequ
- Page 72 and 73:
Univariate data 61Figure 2.15 Galax
- Page 74 and 75:
Univariate data 63Figure 2.17 Amoun
- Page 76 and 77:
Univariate data 652.3.4 Problems2.3
- Page 78 and 79:
Chapter 3Bivariate dataThis chapter
- Page 80 and 81:
Bivariate data 69> colnames(x) = c(
- Page 82 and 83:
Bivariate data 71unbuckled 56 8 64b
- Page 84 and 85:
Bivariate data 73Figure 3.1 Segment
- Page 86 and 87:
Bivariate data 75interested in comp
- Page 88 and 89:
Bivariate data 77> stripchart(list(
- Page 90 and 91:
Bivariate data 79Figure 3.5 Six qqn
- Page 92 and 93:
Bivariate data 81Figure 3.6 Assesse
- Page 94 and 95:
Bivariate data 83> plot(height, wei
- Page 96 and 97:
Bivariate data 85correlation only i
- Page 98 and 99:
Bivariate data 873.17 The data set
- Page 100 and 101:
Bivariate data 89Figure 3.10 Predic
- Page 102 and 103:
Bivariate data 91That is, the y-val
- Page 104 and 105:
Bivariate data 93■ Example 3.6: K
- Page 106 and 107:
Bivariate data 95[1] 13 50> florida
- Page 108 and 109:
Bivariate data 97Just like the mean
- Page 110 and 111:
Bivariate data 99Figure 3.16 Temper
- Page 112 and 113:
Bivariate data 101produce a scatter
- Page 114 and 115:
Multivariate data 10310 Y N Y N Nan
- Page 116 and 117:
Multivariate data 105Figure 4.1 Tax
- Page 118 and 119:
Multivariate data 107> plot(gestati
- Page 120 and 121:
Multivariate data 109Make the above
- Page 122 and 123:
Multivariate data 111One difference
- Page 124 and 125:
Multivariate data 113Accessing a da
- Page 126 and 127:
Multivariate data 115Figure 4.4 Sca
- Page 128 and 129:
Multivariate data 117To illustrate,
- Page 130 and 131:
Multivariate data 119mtcars[[’mpg
- Page 132 and 133:
Multivariate data 121We can apply f
- Page 134 and 135:
Multivariate data 123appropriate. T
- Page 136 and 137:
Multivariate data 125pickup 70 71 5
- Page 138 and 139:
Multivariate data 1272 42 stomach
- Page 140 and 141:
Multivariate data 129make several p
- Page 142 and 143:
Multivariate data 131+ subset=(wt !
- Page 144 and 145:
Multivariate data 133When a factor
- Page 146 and 147:
Multivariate data 135Coercion is th
- Page 148 and 149:
Multivariate data 137[1,] 1 3 5 7[2
- Page 150 and 151:
Describing populations 1395.1.1 Dis
- Page 152 and 153:
Describing populations 141This is a
- Page 154 and 155:
Describing populations 1435.1.3 Sam
- Page 156 and 157:
Describing populations 1455.7 Toss
- Page 158 and 159:
Describing populations 147In R the
- Page 160 and 161:
Describing populations 149variance
- Page 162 and 163:
Describing populations 151> res = r
- Page 164 and 165:
Describing populations 153> hist(re
- Page 166 and 167:
Describing populations 155more woul
- Page 168 and 169:
Describing populations 157Figure 5.
- Page 170 and 171:
Describing populations 159use the n
- Page 172 and 173:
Chapter 6SimulationOne informal des
- Page 174 and 175:
Simulation 163Figure 6.2 Quantile-n
- Page 176 and 177:
Simulation 1656.4 Defining a functi
- Page 178 and 179:
Simulation 1676.4.3 The function bo
- Page 180 and 181:
Simulation 169> summary(res.25)Min.
- Page 182 and 183:
Simulation 1716.5.2 The geometric d
- Page 184 and 185:
Simulation 173> xbarstar = c()> for
- Page 186 and 187:
Simulation 1756.3 For what value of
- Page 188 and 189:
Simulation 177This function will do
- Page 190 and 191:
Confidence intervals 179Figure 7.1
- Page 192 and 193:
Confidence intervals 181which, when
- Page 194 and 195:
Confidence intervals 183In R this b
- Page 196 and 197:
Confidence intervals 185alternative
- Page 198 and 199:
Confidence intervals 1877.3 Confide
- Page 200 and 201:
Confidence intervals 189> zstar = q
- Page 202 and 203:
Confidence intervals 191correlates
- Page 204 and 205:
Confidence intervals 193In general,
- Page 206 and 207:
Confidence intervals 195contains th
- Page 208 and 209:
Confidence intervals 197distributed
- Page 210 and 211:
Confidence intervals 199mean of x m
- Page 212 and 213: Confidence intervals 201in Table 7.
- Page 214 and 215: Confidence intervals 203data is mor
- Page 216 and 217: Confidence intervals 205−18 282sa
- Page 218 and 219: Chapter 8Significance testsFinding
- Page 220 and 221: Significance tests 209against the a
- Page 222 and 223: Significance tests 2111. Identify H
- Page 224 and 225: Significance tests 213simple random
- Page 226 and 227: Significance tests 2158.5 On a numb
- Page 228 and 229: Significance tests 217> mpg =c(11.4
- Page 230 and 231: Significance tests 2198.16 We can p
- Page 232 and 233: Significance tests 221Sign test for
- Page 234 and 235: Significance tests 223parameters. A
- Page 236 and 237: Significance tests 225A natural tes
- Page 238 and 239: Significance tests 227audience at t
- Page 240 and 241: Significance tests 229If the two va
- Page 242 and 243: Significance tests 231Figure 8.5 De
- Page 244 and 245: Significance tests 233H 0 :µ x =µ
- Page 246 and 247: Significance tests 235Figure 8.6 Tw
- Page 248 and 249: Significance tests 237group n sechi
- Page 250 and 251: Chapter 9Goodness of fitIn this cha
- Page 252 and 253: Goodness of fit 241This gives the t
- Page 254 and 255: Goodness of fit 243The function ret
- Page 256 and 257: Goodness of fit 2459.3 A package of
- Page 258 and 259: Goodness of fit 247This is the squa
- Page 260 and 261: Goodness of fit 249We now have all
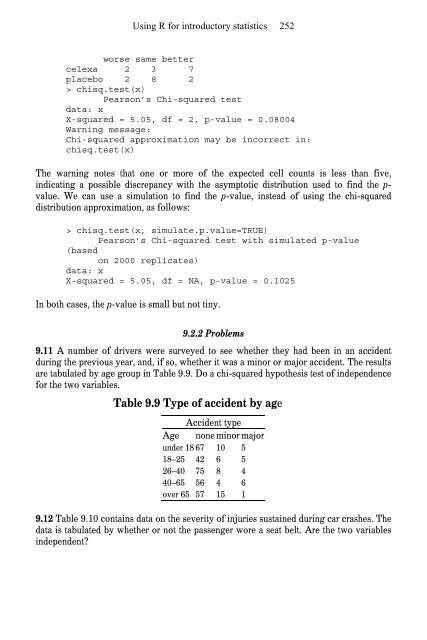
- Page 264 and 265: Goodness of fit 253Table 9.10 Accid
- Page 266 and 267: Goodness of fit 255theoretical dens
- Page 268 and 269: Goodness of fit 257D = 0.0745, p-va
- Page 270 and 271: Goodness of fit 259A consequence is
- Page 272 and 273: Goodness of fit 261( 78.69) ( 55.65
- Page 274 and 275: Goodness of fit 2639.20 The rivers
- Page 276 and 277: Linear regression 265response ~ pre
- Page 278 and 279: Linear regression 26710.1.4 Using l
- Page 280 and 281: Linear regression 269Extractor func
- Page 282 and 283: Linear regression 271should be appr
- Page 284 and 285: Linear regression 273The scale-loca
- Page 286 and 287: Linear regression 275Figure 10.5 Fo
- Page 288 and 289: Linear regression 277the simulation
- Page 290 and 291: Linear regression 279Confidence int
- Page 292 and 293: Linear regression 281Signif. codes:
- Page 294 and 295: Linear regression 283Figure 10.7 Re
- Page 296 and 297: Linear regression 285home in 1970.
- Page 298 and 299: Linear regression 287Let Y be a res
- Page 300 and 301: Linear regression 289Coefficients:(
- Page 302 and 303: Linear regression 291+ tot=a+ for(i
- Page 304 and 305: Linear regression 293Y i =β 0 +β
- Page 306 and 307: Linear regression 295Call:lm(formul
- Page 308 and 309: Linear regression 297Let y t be the
- Page 310 and 311: Analysis of variance 299Figure 11.1
- Page 312 and 313:
Analysis of variance 301> SSE=(5-1)
- Page 314 and 315:
Analysis of variance 303163.2 173.3
- Page 316 and 317:
Analysis of variance 305can be perf
- Page 318 and 319:
Analysis of variance 307Repeat with
- Page 320 and 321:
Analysis of variance 309> dvalues i
- Page 322 and 323:
Analysis of variance 311Figure 11.4
- Page 324 and 325:
Analysis of variance 313> ewr.out=s
- Page 326 and 327:
Analysis of variance 31511.11 The T
- Page 328 and 329:
Analysis of variance 317Figure 11.6
- Page 330 and 331:
Analysis of variance 31911.24 The d
- Page 332 and 333:
Analysis of variance 321Signif. cod
- Page 334 and 335:
Analysis of variance 323factors, al
- Page 336 and 337:
Analysis of variance 325(Intercept)
- Page 338 and 339:
Chapter 12Two extensions of the lin
- Page 340 and 341:
Two extensions of the linear model
- Page 342 and 343:
Two extensions of the linear model
- Page 344 and 345:
Two extensions of the linear model
- Page 346 and 347:
Two extensions of the linear model
- Page 348 and 349:
Two extensions of the linear model
- Page 350 and 351:
Two extensions of the linear model
- Page 352 and 353:
Two extensions of the linear model
- Page 354 and 355:
Appendix AGetting, installing, and
- Page 356 and 357:
Appendix A 345A.1.4 Installing from
- Page 359 and 360:
Appendix BGraphical user interfaces
- Page 361 and 362:
Appendix B 350Figure B.2 Multi-docu
- Page 363 and 364:
Appendix B 352If you forget to inst
- Page 365 and 366:
Appendix CTeaching with RUsing R in
- Page 367 and 368:
Appendix DMore on graphics with RTh
- Page 369 and 370:
Appendix D 358A device is set up wi
- Page 371 and 372:
Appendix D 360Adding a box around t
- Page 373 and 374:
Appendix D 362> x = seq(−2, 2, le
- Page 375 and 376:
Appendix D 364D.2 Creating new grap
- Page 377 and 378:
Appendix D 366Figure D.3 Per-capita
- Page 380 and 381:
Appendix EProgramming in ROne of R
- Page 382 and 383:
Appendix E 371arg1, arg2, arg3When
- Page 384 and 385:
Appendix E 373freedman-diaconis, sc
- Page 386 and 387:
Appendix E 375return(summary(x))sum
- Page 388 and 389:
Appendix E 377In this example varna
- Page 390 and 391:
Appendix E 379editor and ESS extend
- Page 392 and 393:
Appendix E 381[1] 26> size(data.fra
- Page 394 and 395:
Appendix E 383"[.String" = function
- Page 396 and 397:
Appendix E 385})We need to use the
- Page 398 and 399:
Appendix E 387For our String class
- Page 400 and 401:
Appendix E 389Now, instances of the
- Page 402 and 403:
Appendix E 391old.x=xx=x—(x^2—s
- Page 404 and 405:
Index 393heat.colors(), 378rainbow(
- Page 406 and 407:
Index 395pch=, 86, 378type=, 60, 86
- Page 408 and 409:
Index 397command line, 411>, 5confi
- Page 410 and 411:
Index 399extra sum of squares, 307f
- Page 412 and 413:
Index 401robust statistic, 193sampl