NCAE - DepEd Naga City
NCAE - DepEd Naga City NCAE - DepEd Naga City
from depednaga.com.ph
More from this publisher
10.07.2015
Views
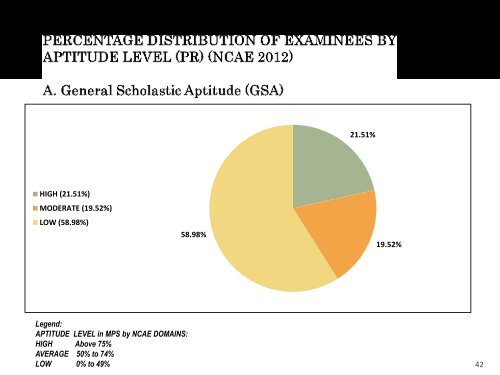
21.51%HIGH (21.51%)MODERATE (19.52%)LOW (58.98%)58.98%19.52%Legend:APTITUDE LEVEL in MPS by NCAE DOMAINS:HIGH Above 75%AVERAGE 50% to 74%LOW 0% to 49%42
30.73%HIGH (30.73%)MODERATE (21.02%)LOW (48.25%)48.25%21.02%Legend:APTITUDE LEVEL by NCAE DOMAINS:HIGH Above 75%AVERAGE 50% to 74%LOW 0% to 49%43
- Page 4 and 5: 1. What is the NCAE?• NCAE = Nati
- Page 6 and 7: 3. Why was NCAE developed?The NCAE
- Page 8 and 9: 5. How is NCAE different from NCEE?
- Page 10 and 11: 7. What are the domains measured in
- Page 12 and 13: Occupational Interest Inventory of
- Page 14 and 15: • Likewise, the TVA score is the
- Page 16 and 17: 9. How are the NCAE scores reported
- Page 18 and 19: 10. What is the legal basis of the
- Page 20 and 21: 2020
- Page 22 and 23: 13. How long does it take for an ex
- Page 24 and 25: 15. How has the general public resp
- Page 26 and 27: 16.Based on the results of the test
- Page 28 and 29: • Moreover, the Department is cur
- Page 30: 18. Can the results of the NCAE be
- Page 33 and 34: Areas # of Items MRS* SD MPSGeneral
- Page 35 and 36: Cluster 1 Regions:(Large: with 100,
- Page 37 and 38: What is the percentage distribution
- Page 40 and 41: What is the percentage distribution
- Page 44 and 45: 25.11%HIGH (25.11%)MODERATE (22.96%
- Page 46 and 47: 25.61%HIGH (25.61%)MODERATE (17.42%
- Page 48 and 49: PERSONAL VARIABLESMean Percentage S
- Page 50 and 51: 57.9159.9858.9359.3158.8858.1559.48
- Page 52: Policy RecommendationsDIVISION LEVE
21.51%HIGH (21.51%)MODERATE (19.52%)LOW (58.98%)58.98%19.52%Legend:APTITUDE LEVEL in MPS by <strong>NCAE</strong> DOMAINS:HIGH Above 75%AVERAGE 50% to 74%LOW 0% to 49%42


