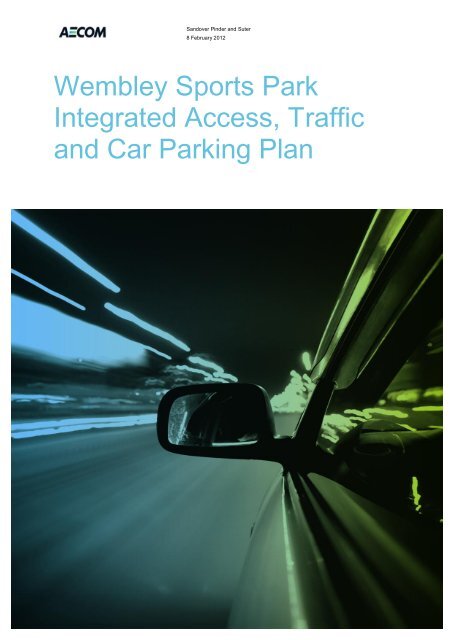
Wembley Sports Park Integrated Access, Traffic and Car Parking Plan
Wembley Sports Park Integrated Access, Traffic and Car Parking Plan
Wembley Sports Park Integrated Access, Traffic and Car Parking Plan

Create successful ePaper yourself
Turn your PDF publications into a flip-book with our unique Google optimized e-Paper software.
AECOM<strong>Wembley</strong> <strong>Sports</strong> <strong>Park</strong> <strong>Integrated</strong> <strong>Access</strong>, <strong>Traffic</strong> <strong>and</strong> <strong>Car</strong> <strong>Park</strong>ing <strong>Plan</strong><strong>Wembley</strong> <strong>Sports</strong> <strong>Park</strong> <strong>Integrated</strong> <strong>Access</strong>, <strong>Traffic</strong> <strong>and</strong> <strong>Car</strong> <strong>Park</strong>ing<strong>Plan</strong>Prepared forS<strong>and</strong>over Pinder <strong>and</strong> SuterPrepared byAECOM Australia Pty Ltd3 Forrest Place, Perth WA 6000, GPO Box B59, Perth WA 6849, AustraliaT +61 8 6208 0000 F +61 8 6208 0999 www.aecom.comABN 20 093 846 9258 February 201260218676AECOM in Australia <strong>and</strong> New Zeal<strong>and</strong> is certified to the latest version of ISO9001 <strong>and</strong> ISO14001.© AECOM Australia Pty Ltd (AECOM). All rights reserved.AECOM has prepared this document for the sole use of the Client <strong>and</strong> for a specific purpose, each as expressly stated in the document. No otherparty should rely on this document without the prior written consent of AECOM. AECOM undertakes no duty, nor accepts any responsibility, to anythird party who may rely upon or use this document. This document has been prepared based on the Client’s description of its requirements <strong>and</strong>AECOM’s experience, having regard to assumptions that AECOM can reasonably be expected to make in accordance with sound professionalprinciples. AECOM may also have relied upon information provided by the Client <strong>and</strong> other third parties to prepare this document, some of whichmay not have been verified. Subject to the above conditions, this document may be transmitted, reproduced or disseminated only in its entirety.T:\60218676 - <strong>Wembley</strong> PK TA\8 Issued Docs\8.1 Reports\Comprehensive <strong>Integrated</strong> <strong>Access</strong> RevF.docxRevision F - 8 February 2012
AECOM<strong>Wembley</strong> <strong>Sports</strong> <strong>Park</strong> <strong>Integrated</strong> <strong>Access</strong>, <strong>Traffic</strong> <strong>and</strong> <strong>Car</strong> <strong>Park</strong>ing <strong>Plan</strong>Quality InformationDocument<strong>Wembley</strong> <strong>Sports</strong> <strong>Park</strong> <strong>Integrated</strong> <strong>Access</strong>, <strong>Traffic</strong> <strong>and</strong> <strong>Car</strong> <strong>Park</strong>ing <strong>Plan</strong>Ref 60218676Date 8 February 2012Prepared byReviewed byAlan Raven <strong>and</strong> Ly Kheng GalanosNeil Rippon <strong>and</strong> Adam Marsl<strong>and</strong>Revision HistoryRevisionRevision Date DetailsName/PositionAuthorisedSignatureA 30-Jun-2011 Draft For Information Alan RavenPrincipal TransportEngineerB 14-Jul-2011 Draft for Approval Alan RavenPrincipal TransportEngineerC 5-Sept-2011 Final Draft Alan RavenPrincipal TransportEngineerD 7-Oct-2011 Final Report Chlodaugh SmithPrincipal EngineerE 31-Jan-2012 Final Report (Revised) James MarshallPrincipal EngineerF 8-Feb-2012 Final Report (Revised) James MarshallPrincipal EngineerT:\60218676 - <strong>Wembley</strong> PK TA\8 Issued Docs\8.1 Reports\Comprehensive <strong>Integrated</strong> <strong>Access</strong> RevF.docxRevision F - 8 February 2012
AECOM<strong>Wembley</strong> <strong>Sports</strong> <strong>Park</strong> <strong>Integrated</strong> <strong>Access</strong>, <strong>Traffic</strong> <strong>and</strong> <strong>Car</strong> <strong>Park</strong>ing <strong>Plan</strong>Table of ContentsExecutive Summaryi1.0 Introduction 51.1 Background 51.2 Policies 51.3 Management 51.4 Limitations on the Use of this Report 62.0 Existing Situation 72.1 L<strong>and</strong> Use, Event Type <strong>and</strong> Scheduling 82.2 Pedestrian <strong>and</strong> Cycle Network / <strong>Access</strong> 92.3 Public Transport Network <strong>and</strong> <strong>Access</strong> 102.4 Road Network 112.5 <strong>Access</strong> Arrangement 142.6 <strong>Park</strong>ing 162.7 Crash History 173.0 Changes to the Surrounding Transport Network 194.0 Development Proposal 204.1 Features of the Master <strong>Plan</strong> 204.2 Staging of Master <strong>Plan</strong> 214.3 L<strong>and</strong> Use, Event Type <strong>and</strong> Scheduling 244.4 Pedestrian <strong>and</strong> Cycle <strong>Access</strong> 244.5 Public Transport <strong>Access</strong> 254.6 Vehicle <strong>Access</strong> <strong>and</strong> Movement 254.7 <strong>Park</strong>ing 274.8 Servicing <strong>and</strong> Logistics 285.0 Transport Analysis 295.1 Assumptions 295.2 Development <strong>Park</strong>ing Dem<strong>and</strong> Trip Generation 335.3 <strong>Park</strong>ing Dem<strong>and</strong> 345.4 Drop Off 355.5 <strong>Traffic</strong> Distribution 355.6 Site <strong>Access</strong> Analysis 375.7 Alternative <strong>Access</strong> 395.8 Comparison of Intersection Types 405.9 Internal Road Junction 425.10 Internal Road 425.11 Impact on Surrounding Roads <strong>and</strong> Intersections 436.0 Mitigation <strong>and</strong> Action 446.1 Managing car parking dem<strong>and</strong> 446.2 Event People Movement Management <strong>Plan</strong>s 457.0 Conclusion <strong>and</strong> Recommendations 46Appendix AAppendix A - <strong>Traffic</strong> DataAppendix BAppendix B - <strong>Traffic</strong> Analysis ResultsAppendix CAppendix C – <strong>Traffic</strong> <strong>and</strong> People Movement <strong>Plan</strong>sABCT:\60218676 - <strong>Wembley</strong> PK TA\8 Issued Docs\8.1 Reports\Comprehensive <strong>Integrated</strong> <strong>Access</strong> RevF.docxRevision F - 8 February 2012
AECOM<strong>Wembley</strong> <strong>Sports</strong> <strong>Park</strong> <strong>Integrated</strong> <strong>Access</strong>, <strong>Traffic</strong> <strong>and</strong> <strong>Car</strong> <strong>Park</strong>ing <strong>Plan</strong>List of TablesTable 1 Severity of crashes within the surrounding area from 2005 – 2009. 17Table 2 Type of crashes within the surrounding area from 2005 – 2009 18Table 3 Summary of sporting activities at <strong>Wembley</strong> <strong>Sports</strong> <strong>Park</strong> 24Table 4 <strong>Wembley</strong> <strong>Sports</strong> <strong>Park</strong> Operational Assumptions 30Table 5 Forecast Trip Generation (Summary) 33Table 6 <strong>Traffic</strong> Distribution 35Table 7 Performance summary for Northern <strong>Access</strong> (Salvado Road) 37Table 8 Performance summary for Main <strong>Access</strong> 38Table 9 Performance summary for Selby Street Left-in / Left-out <strong>Access</strong> 39Table 10 Performance Summary for Main Intersection (Roundabout Option) 40Table 11 Overall Summary for Main Intersection Roundabout Vs Signals 41List of FiguresFigure 1 Location <strong>Plan</strong> 7Figure 2 Pat Goodridge Precinct current l<strong>and</strong> uses. 8Figure 3 Pedestrian <strong>and</strong> Cycle Network around the site of proposed development 9Figure 4 Public Transport Network around the site of proposed development. 11Figure 5 Road Network around the site of proposed development 12Figure 6 Existing Daily <strong>Traffic</strong> 13Figure 7 Existing <strong>Access</strong> to Site 14Figure 8 Existing <strong>Car</strong> <strong>Park</strong> Arrivals <strong>and</strong> Departures (in 5min intervals) 15Figure 9 Existing <strong>Car</strong> <strong>Park</strong>ing Usage 16Figure 10 Existing Drop Off <strong>and</strong> <strong>Park</strong>ing Arrivals along Salvado Road (in 5 minute intervals) 16Figure 11 Project Site Roads <strong>and</strong> Intersections of Interest 17Figure 12 Stage 1 Development <strong>Plan</strong> for <strong>Wembley</strong> <strong>Sports</strong> <strong>Park</strong> 22Figure 13 Stage 2 Development <strong>Plan</strong> for <strong>Wembley</strong> <strong>Sports</strong> <strong>Park</strong> 23Figure 14 Proposed layout for Northern <strong>Access</strong> 25Figure 15 Indicative layout for new signalised intersection at Selby Street <strong>and</strong> Alderbury Street. 26Figure 16 Observed Arrival <strong>and</strong> Departure Patterns 33Figure 17 Forecast <strong>Park</strong>ing Dem<strong>and</strong> 34Figure 18 Perth Netball Association Postcode Analysis 36Figure 19 Proposed Roundabout Layout 40T:\60218676 - <strong>Wembley</strong> PK TA\8 Issued Docs\8.1 Reports\Comprehensive <strong>Integrated</strong> <strong>Access</strong> RevF.docxRevision F - 8 February 2012
AECOM<strong>Wembley</strong> <strong>Sports</strong> <strong>Park</strong> <strong>Integrated</strong> <strong>Access</strong>, <strong>Traffic</strong> <strong>and</strong> <strong>Car</strong> <strong>Park</strong>ing <strong>Plan</strong>ii- Pedestrian <strong>and</strong> cycling paths connect the sporting facilities to the external pedestrian <strong>and</strong> cycle network(City to Sea Greenway). They have been designed for effective access <strong>and</strong> circulation of the site. Crossingpoints connecting the paths to the facilities are provided along the internal East-West Link <strong>and</strong> from SalvadoRoad.- In accordance with the Building Code of Australia, one (1) easy access bay is to be provided for each 50marked parking spaces. Although Australian St<strong>and</strong>ards do not specify a distance, in each car park thesespaces are to be located as close as possible to the nearby buildings / facilities. Ramp accesses to thesebays are not to exceed 1:14 slopes.- <strong>Access</strong> for garbage trucks is via the east-west link with a turnaround area in the service road / forecourt areawith <strong>and</strong> egress via a cross over on the East-West Link or utilisation of the roundabout at the intersection ofthe east-west <strong>and</strong> north-south links. Service deliveries can be completed in the drop-off area, as deliverieswill be managed during the weekday <strong>and</strong> will not impact on the peak time (Saturdays during winter).At the completion of stage 2 (see Figure 13) there will be modifications to the car-parking <strong>and</strong> supportingfootpaths including:- New hardst<strong>and</strong> car parking in the north-eastern corner of the site for 160 vehicles- New hardst<strong>and</strong> car parking at the eastern side of the site south of the internal roundabout for 260 vehicles.- Extension of the western car park from 240 bays to 380 bays- Removal of the original 700 bay parking area- New overflow soft-st<strong>and</strong> (grassed) parking of up to 500 vehicles if required is possible in the far southwesterncorner of the site. To prevent damage during the winter months the soft st<strong>and</strong> should be reinforcedwith a plastic cell. The soft st<strong>and</strong> will require irrigation.Event TypesThe clubs, associations <strong>and</strong> facilities assumed to use the <strong>Wembley</strong> <strong>Sports</strong> <strong>Park</strong> in the context of the Master <strong>Plan</strong><strong>and</strong> <strong>Traffic</strong> Study who will materially impact traffic <strong>and</strong> parking are:- Perth Netball Association (PNA);- Netball WA (incorporating West Coast Fever);- <strong>Wembley</strong> Athletic Club comprising -<strong>Wembley</strong> Amateur Football Club (Australian Rules football);<strong>Wembley</strong> Baseball Club;<strong>Wembley</strong> Districts Cricket Club; <strong>and</strong>- VenuesWest events.<strong>Wembley</strong> Junior Football Club is planning to remain at Henderson <strong>Park</strong>. However, its traffic or parkingrequirements can be accommodated at <strong>Wembley</strong> <strong>Sports</strong> <strong>Park</strong> for their scheduled Sunday morning competitions.Other users of <strong>Wembley</strong> <strong>Sports</strong> <strong>Park</strong> are:- Subiaco City Junior Soccer Club; <strong>and</strong>- Sunset Coast Archery Club.These users are ad hoc <strong>and</strong> their dem<strong>and</strong> for parking <strong>and</strong> access is such that they do not warrant specificanalysis when taken in overall context.T:\60218676 - <strong>Wembley</strong> PK TA\8 Issued Docs\8.1 Reports\Comprehensive <strong>Integrated</strong> <strong>Access</strong> RevF.docxRevision F - 8 February 2012
AECOM<strong>Wembley</strong> <strong>Sports</strong> <strong>Park</strong> <strong>Integrated</strong> <strong>Access</strong>, <strong>Traffic</strong> <strong>and</strong> <strong>Car</strong> <strong>Park</strong>ing <strong>Plan</strong>iii<strong>Park</strong>ing ProvisionThe layout provides a total of 1,010 formed parking spaces <strong>and</strong> approximately 200m of drop-off space in Stage 1.The parking supply will reduce to 870 formed parking spaces, with no reduction in drop off space, in Stage 2.The Master <strong>Plan</strong> identifies the potential for a grassed area on the southwest corner of <strong>Wembley</strong> <strong>Sports</strong> <strong>Park</strong>which could be used for further overflow parking.Overall in Stage 1 the maximum dem<strong>and</strong> for car parking was calculated to be 1,021 bays which exceeds thenumber of provided bays by a h<strong>and</strong>ful of vehicles, however, the 85 th percentile dem<strong>and</strong> of 869 vehicles can beeasily accommodated within the available hard st<strong>and</strong>ing parking. In the short periods where dem<strong>and</strong> exceeds thecapacity of the hard st<strong>and</strong>ing parking the additional dem<strong>and</strong> can be accommodated within the grass overspill areabetween the south-western <strong>and</strong> south-eastern car parks.In Stage 2 the peak dem<strong>and</strong> for parking was estimated at 1,070 bays. This exceeds the number of formed baysavailable by 200 but aligns well with the 85 th percentile dem<strong>and</strong>. On the occasion where dem<strong>and</strong> is higher thansupply grassed overflow parking, with management intervention, will provide adequate parking.For Stage 2 where it is estimated the proposed parking dem<strong>and</strong> will exceed supply during a few relatively shortperiods on 18 Saturdays per year, the introduction of Green Travel initiatives are recommended for the site, <strong>and</strong>should commence immediately to reduce the impact ahead of full development of the site.Buses accessing the site will utilise the drop-off facilities to park.<strong>Traffic</strong> AnalysisVehicles exiting <strong>Wembley</strong> <strong>Sports</strong> <strong>Park</strong> at the Northern <strong>Access</strong>, wishing to turn right into Salvado Road areforecast to be caused delays with the access operating at or over capacity during the peak Winter SaturdayEvents. This congestion may cause some traffic redistribution towards the Main <strong>Access</strong> at Selby Street. Thesecongested conditions are expected to dissipate relatively quickly. This full access is recommended in order todistribute the traffic evenly <strong>and</strong> to service the traffic during the peak Winter Saturday Events more effectively.The proposed Main <strong>Access</strong> (signalised intersection) at Selby Street / Alderbury Road is forecast to operate closeto or at capacity during these peak Winter Saturday Events. Right turn queues from Selby Street are expected toexceed the available queuing space of 120m for very short periods during the peak Winter Saturday Events. Thisis considered to be acceptable <strong>and</strong> is unlikely to affect the operation of Selby Street for through traffic.The analysis also showed the AM <strong>and</strong> PM traditional weekday peaks perform better than the Winter Saturdaypeaks for a signalised intersection at Selby Street / Alderbury Road.The existing left-in access on Selby Street is expected to operate well.The existing left-out egress on Selby Street is forecast to operate well most of the time, except during theoutbound peak on Winter Saturdays. However, the delays are not expected to occur over extended periods oftime <strong>and</strong> the queues forming during these periods are also expected to dissipate relatively quickly.For safety <strong>and</strong> operational reasons, right turns cannot be allowed at the access from the East-West Link to thesouthwestern car park. These right turns can be accommodated via u-turns at the roundabout located at theeastern end of the East-West Link.At the estimated drop-off rate <strong>and</strong> under normal conditions, the proposed drop-off facilities are not expected tocause flow breakdowns on the East-West Link. Even with the induced u-turn traffic, the link is expected tooperate within capacity.The North-South Link from Salvado Road to the roundabout will provide an important circulation facility;particularly during the peak Winter Saturday Events. Flow breakdowns are expected to occur if these vehicles arechanneled directly through the Stage 1 northeastern hard st<strong>and</strong> car park. Additionally, without the southernportion of the link, traffic entering the car park from the south would not be able to make u-turns <strong>and</strong> would beforced to exit at Salvado Road. For operational flexibility <strong>and</strong> efficiency, the entire North-South Link is thereforerequired in both Stages 1 <strong>and</strong> 2.T:\60218676 - <strong>Wembley</strong> PK TA\8 Issued Docs\8.1 Reports\Comprehensive <strong>Integrated</strong> <strong>Access</strong> RevF.docxRevision F - 8 February 2012
AECOM<strong>Wembley</strong> <strong>Sports</strong> <strong>Park</strong> <strong>Integrated</strong> <strong>Access</strong>, <strong>Traffic</strong> <strong>and</strong> <strong>Car</strong> <strong>Park</strong>ing <strong>Plan</strong>ivMitigation <strong>and</strong> ActionFor peak periods, where the parking dem<strong>and</strong> may exceed the supply, measures should be implemented to reducedem<strong>and</strong>. These measures include engineering, education, encouragement <strong>and</strong> enforcement. To achieve this, aGreen Travel <strong>Plan</strong> (TravelSmart) for the PNA’s activities should be developed. This report includes suggestionsof measures that could be included in the plan. A set of traffic <strong>and</strong> people movement plans were also developedto manage the use of facilities <strong>and</strong> the movement of people during the various events.ConclusionThis transport study generally supports the approved <strong>Wembley</strong> <strong>Sports</strong> <strong>Park</strong> Development Master <strong>Plan</strong>. While thestudy identified that traffic <strong>and</strong> parking dem<strong>and</strong> may exceed capacity during the peak Winter Saturday events,these events are anticipated to be relatively short <strong>and</strong> their impacts are considered to be acceptable. For the vastmajority of its operations, the Master <strong>Plan</strong> provides ample capacity <strong>and</strong> caters for the 85 th percentile of peakdem<strong>and</strong>. It is therefore considered to be unreasonable <strong>and</strong> unsustainable to provide more capacity. Rather thanproviding for all parking dem<strong>and</strong>s at all times, it is recognised that alternative measures are required to managethe short dem<strong>and</strong> peaks on Winter Saturdays (18 competition days annually).The transport facilities for the Master <strong>Plan</strong> are illustrated in Figures 12 <strong>and</strong> 13 <strong>and</strong> are listed in therecommendations in Section 7.0 of this report.Subject to the recommendations outlined in this report, it is expected that the following traffic solutions will provideadequate access, car parking <strong>and</strong> traffic management facilities for the assumed operations of the <strong>Wembley</strong><strong>Sports</strong> <strong>Park</strong>:- increased access points to the site;- new <strong>and</strong> improved internal circulation design;- increased car parking provision;- development <strong>and</strong> implementation of green travel initiatives in order to reduce vehicular parking dem<strong>and</strong>; <strong>and</strong>- implementation of site <strong>and</strong> event specific traffic <strong>and</strong> people movement plans.T:\60218676 - <strong>Wembley</strong> PK TA\8 Issued Docs\8.1 Reports\Comprehensive <strong>Integrated</strong> <strong>Access</strong> RevF.docxRevision F - 8 February 2012
AECOM<strong>Wembley</strong> <strong>Sports</strong> <strong>Park</strong> <strong>Integrated</strong> <strong>Access</strong>, <strong>Traffic</strong> <strong>and</strong> <strong>Car</strong> <strong>Park</strong>ing <strong>Plan</strong>51.0 IntroductionThe Town of Cambridge <strong>and</strong> the Department of Sport <strong>and</strong> Recreation are developing a design for the <strong>Wembley</strong><strong>Sports</strong> <strong>Park</strong>, which includes the State Netball Centre. AECOM was engaged to provide transport advice in thedevelopment of the Master <strong>Plan</strong> for the <strong>Wembley</strong> <strong>Sports</strong> <strong>Park</strong> <strong>and</strong> to prepare a Comprehensive <strong>Integrated</strong><strong>Access</strong>, <strong>Traffic</strong> <strong>and</strong> <strong>Car</strong> <strong>Park</strong>ing Assessment <strong>Plan</strong> for inclusion with the planning application submission.This report describes the transport provisions on site <strong>and</strong> how this was developed (including car parking, internalroads <strong>and</strong> access arrangements). It also assesses the impact of the site on the surrounding transport network,including any changes to this network. The report is segregated into the following sections:1) Introduction – outlines the project background, policies reviewed <strong>and</strong> proposed management of the site;2) Existing Situation – describes the existing situation with regards to l<strong>and</strong> use <strong>and</strong> transport infrastructure;3) Changes to the Surrounding Road Network – outlines proposed committed changes to the surroundingtransport network;4) Development Proposal – describes the proposed development;5) Transport Analysis – analyses the impact of the development on the surrounding transport network;6) Mitigation <strong>and</strong> Action – outlines the mitigation <strong>and</strong> action measures required; <strong>and</strong>7) Conclusion <strong>and</strong> Recommendations – summarises the findings <strong>and</strong> recommendations of this report.1.1 BackgroundThe Town of Cambridge adopted the <strong>Wembley</strong> <strong>Sports</strong> <strong>Park</strong> Development Master <strong>Plan</strong> on 28 June 2011. Councilresolved in part that, “the Master <strong>Plan</strong> be amended as necessary to incorporate changes required as a result ofthe traffic <strong>and</strong> parking study, including stakeholder consultation”.The precinct includes Matthews’ Netball <strong>and</strong> Pat Goodridge Centres. The development includes two stages. Thefirst, to be completed concurrently by the State <strong>and</strong> the Town of Cambridge, is to include the construction of theState Netball Centre, reconfiguration of the netball courts, construction of key transport works to support the site,<strong>and</strong> the construction of a new administration <strong>and</strong> change room building for the Perth Netball Association (PNA).The second stage is to be completed by the Town of Cambridge <strong>and</strong> is to include additional car parks, roadworks, paths, new ovals <strong>and</strong> Pat Goodridge Centre building works. Stage 2 is subject to Council endorsement<strong>and</strong> budgetary processes, however, this will require the removal of 700 hard st<strong>and</strong> parking bays that are currentlyprovided at the site <strong>and</strong> will be replaced with 260 hard st<strong>and</strong> parking bays to the east of the site.The Western Australian Government proposes the development of a State Netball Centre to house training forNetball WA’s elite (e.g. West Coast Fever) <strong>and</strong> state teams (e.g. WAIS, age-based squads, etc) as well as stateleague <strong>and</strong> association netball competitions. Outside of these times the venue could be used to host othersporting activities, exhibitions <strong>and</strong> events. <strong>Wembley</strong> <strong>Sports</strong> <strong>Park</strong> was endorsed by the State Government as thepreferred location for the State Netball Centre.<strong>Wembley</strong> <strong>Sports</strong> <strong>Park</strong> has been identified for redevelopment by the Town of Cambridge, who have developed aMaster <strong>Plan</strong> illustrating these works including new netball courts, ovals, parking, access points <strong>and</strong> club houses /changing rooms. The Department of Sport <strong>and</strong> Recreation worked with the Town to develop this plan further toaccommodate the State Netball Centre within the Matthews’ Netball Centre precinct.1.2 PoliciesThis report has been developed based on the Western Australian <strong>Plan</strong>ning Commission’s (WAPC) TransportAssessment Guidelines <strong>and</strong> Town of Cambridge parking <strong>and</strong> traffic policies have been reviewed.1.3 Management<strong>Wembley</strong> <strong>Sports</strong> <strong>Park</strong> is managed by the Town of Cambridge. VenuesWest will operate the State Netball Centre.PNA operates Matthews Netball Centre including the PNA building.T:\60218676 - <strong>Wembley</strong> PK TA\8 Issued Docs\8.1 Reports\Comprehensive <strong>Integrated</strong> <strong>Access</strong> RevF.docxRevision F - 8 February 2012
AECOM<strong>Wembley</strong> <strong>Sports</strong> <strong>Park</strong> <strong>Integrated</strong> <strong>Access</strong>, <strong>Traffic</strong> <strong>and</strong> <strong>Car</strong> <strong>Park</strong>ing <strong>Plan</strong>61.4 Limitations on the Use of this ReportVarious assumptions about future transport patterns <strong>and</strong> behaviours had to be made to complete this TransportAssessment. These assumptions were based on observed patterns <strong>and</strong> behaviours <strong>and</strong> the anticipated changesthat will occur as a result of delivering the Master <strong>Plan</strong> works. It should be recognised that traffic forecasting doeshave limitations <strong>and</strong> that forecast traffic volumes should be taken as only indicative of the likely traffic that aparticular site may generate or the volumes that a road may carry.T:\60218676 - <strong>Wembley</strong> PK TA\8 Issued Docs\8.1 Reports\Comprehensive <strong>Integrated</strong> <strong>Access</strong> RevF.docxRevision F - 8 February 2012
AECOM<strong>Wembley</strong> <strong>Sports</strong> <strong>Park</strong> <strong>Integrated</strong> <strong>Access</strong>, <strong>Traffic</strong> <strong>and</strong> <strong>Car</strong> <strong>Park</strong>ing <strong>Plan</strong>72.0 Existing SituationThe <strong>Wembley</strong> <strong>Sports</strong> <strong>Park</strong> is located on Selby Street between Hay Street <strong>and</strong> Salvado Road in the Town ofCambridge as shown in Figure 1.Figure 1Location <strong>Plan</strong>NSite of proposeddevelopment –<strong>Wembley</strong> <strong>Sports</strong><strong>Park</strong>Source: ©2010 Google – Map Data ©2010 Google, Whereis (R), Sensis Pty Ltd.T:\60218676 - <strong>Wembley</strong> PK TA\8 Issued Docs\8.1 Reports\Comprehensive <strong>Integrated</strong> <strong>Access</strong> RevF.docxRevision F - 8 February 2012
AECOM<strong>Wembley</strong> <strong>Sports</strong> <strong>Park</strong> <strong>Integrated</strong> <strong>Access</strong>, <strong>Traffic</strong> <strong>and</strong> <strong>Car</strong> <strong>Park</strong>ing <strong>Plan</strong>82.1 L<strong>and</strong> Use, Event Type <strong>and</strong> Scheduling<strong>Wembley</strong> <strong>Sports</strong> <strong>Park</strong> is currently used as a recreation park containing the Matthews’ Netball Centre <strong>and</strong> PatGoodridge <strong>Park</strong> (refer to Figure 2).The Matthews’ Netball Centre, located in the northern section of the <strong>Park</strong>, currently contains 38 hard surfacenetball courts, 12 grass netball courts, a club house <strong>and</strong> a toilet block. The Matthews’ Netball Centre is managedby the PNA under a lease arrangement. Competitions are held there on Saturday (from 8:15am to 5pm) fromMay to September (winter season) <strong>and</strong> on Wednesday nights from October to December (spring season).A hardst<strong>and</strong> car park of approximately 700 spaces is located in the middle of the site, with a grass overspill carpark of approximately 500 to its north. This area is also used by the Sunset Coast Archery Club on Sundaymornings from 9am to 12pm.The Pat Goodridge Centre is located in the southern section of the site <strong>and</strong> consists of a clubhouse <strong>and</strong> playingfields. These fields are currently used by <strong>Wembley</strong> Districts Cricket Club on Saturday afternoons from October toMarch, <strong>and</strong> by Subiaco City Junior Soccer Club on a casual basis on Sundays.These sports also use <strong>Wembley</strong> <strong>Sports</strong> <strong>Park</strong> for training purposes outside of competition days. There are alsoother ad hoc <strong>and</strong> casual users of <strong>Wembley</strong> <strong>Sports</strong> <strong>Park</strong> which are small in number <strong>and</strong> relatively low impact.Figure 2Pat Goodridge Precinct current l<strong>and</strong> uses.Salvado RoadMatthewsNetball CentreAlderbury StreetSelby StreetGrass area / <strong>Car</strong>park overspillJersey StreetHardst<strong>and</strong> car parkPat Goodridge:Playing fields<strong>and</strong> clubhouseHay StreetSource: ©2010 Google – Map Data ©2010 Google, Whereis (R), Sensis Pty Ltd.T:\60218676 - <strong>Wembley</strong> PK TA\8 Issued Docs\8.1 Reports\Comprehensive <strong>Integrated</strong> <strong>Access</strong> RevF.docxRevision F - 8 February 2012
AECOM<strong>Wembley</strong> <strong>Sports</strong> <strong>Park</strong> <strong>Integrated</strong> <strong>Access</strong>, <strong>Traffic</strong> <strong>and</strong> <strong>Car</strong> <strong>Park</strong>ing <strong>Plan</strong>92.2 Pedestrian <strong>and</strong> Cycle Network / <strong>Access</strong>The site is well serviced by the urban footpath <strong>and</strong> cycle path network, connecting the site to the surroundingcommunity <strong>and</strong> public transport facilities (refer to Figure 3). The network includes:- The City to Sea (C2C) Greenway Shared Path. This pathway passes along the northern <strong>and</strong> western sidesof the site. It has an average width of 2.4 metres, is a two way shared path <strong>and</strong> is part of the primary cyclenetwork. The C2C shared path connects the site to the Subiaco Railway Station <strong>and</strong> the Perth CentralBusiness District (CBD) to the east as well as the West Coast Highway <strong>and</strong> City Beach to the west. It ismaintained by the Town of Cambridge, <strong>and</strong> will need to be kept open or diverted during any works;- The NW9 cycle route, which runs along Jersey Street (to the east of the site), connects the site to DaglishRailway Station to the south <strong>and</strong> Herdsman Lake <strong>and</strong> Lake Monger (via the NW23 route) to the north. TheNW23 route also connects the NW9 route to the Principle Shared Path (PSP) along the Joondalup Railwaycorridor (connecting to the PSPs along the other rail corridors in central Perth). The NW9 route alsoconnects to the NW12 route at Ruislip Street, which runs east to Leederville Railway Station <strong>and</strong> west to thecoast;- A pedestrian footpath of approximately 2.0 metres wide runs along the southern boundary of the site parallelto Hay Street;- Signalised pedestrian crossing facilities are located to the southwest corner of the site at the intersection ofHay Street <strong>and</strong> Selby Street; <strong>and</strong>- Un-signalised crossing facilities at three locations: Approximately 70 metres north of Hay / Selby Streetintersection, at the Selby Street / Salvado Road intersection <strong>and</strong> at the Salvado Road / Veryard Terraceintersection.These paths connect to BikeWest classified good riding environment streets, such as Marlow Street <strong>and</strong> NewryStreet (north of the site). They also connect the site to the PSP along the Fremantle Railway Line <strong>and</strong> the NW12cycle path, connecting the site to the north <strong>and</strong> south western suburbs.Hay Street to the south of the site is classified by BikeWest as a medium riding environment; however it includesa steep incline between Selby Street <strong>and</strong> Brockway (to the west of the site).Figure 3Pedestrian <strong>and</strong> Cycle Network around the site of proposed developmentC2C Shared PathNW9 Cycle RoutePrincipal Shared PathSelby StreetGood Road RidingEnvironmentSalvado RoadMedium Road RidingEnvironmentSignalised PedestrianCrossingSite of ProposedDevelopmentAlderbury StreetJersey StreetHay StreetSource: ©2010 Google – Map Data ©2010 Google, Whereis (R), Sensis Pty Ltd.T:\60218676 - <strong>Wembley</strong> PK TA\8 Issued Docs\8.1 Reports\Comprehensive <strong>Integrated</strong> <strong>Access</strong> RevF.docxRevision F - 8 February 2012
AECOM<strong>Wembley</strong> <strong>Sports</strong> <strong>Park</strong> <strong>Integrated</strong> <strong>Access</strong>, <strong>Traffic</strong> <strong>and</strong> <strong>Car</strong> <strong>Park</strong>ing <strong>Plan</strong>102.3 Public Transport Network <strong>and</strong> <strong>Access</strong>Public transport is easily accessible from the proposed <strong>Wembley</strong> <strong>Sports</strong> <strong>Park</strong>. Bus stops for Routes 28, 98 <strong>and</strong> 99are located either adjacent to the site on Selby Street or a short 50m walk to the bus stop on Alderbury Street.However, access to the northbound Selby Street stop requires patrons to cross the road at the un-signalisedcrossing point north of Whitfeld Street or north of the Salvado Road junction. There are no crossing provisionsconnecting the site to the Alderbury Street stops or cars that currently park in this street. According to LiveableNeighbourhoods an acceptable walking distance to a bus stop is 400 metres.Route 28 provides services to <strong>and</strong> from Claremont Railway Station to East Perth, connecting the site to PerthCBD. It services the adjacent stop every half hour during the weekday peak (6:40am to 9:27am <strong>and</strong> 3.27pm to6pm) <strong>and</strong> every hour outside the peak as well as Saturdays from 8:30am to 6:30pm <strong>and</strong> every two hours on aSunday from 8:25am to 6:25pm. Bus stops for Route 28 are also on Hay St on the southern boundary of<strong>Wembley</strong> <strong>Sports</strong> <strong>Park</strong>. The Department of <strong>Plan</strong>ning is proposing to convert this route to a higher frequencyservice in the future.The Circle Route service (Routes 98 <strong>and</strong> 99) provides regular services during the weekdays, approximately every15 minutes from 6:20am to 7:00pm <strong>and</strong> every 30 minutes from 7.00pm to 10.00pm. On a Saturday <strong>and</strong> Sunday itruns approximately every 30 minutes from 7:30am to 7pm. It connects the site to Shenton <strong>Park</strong>, Claremont,Stirling <strong>and</strong> Cottesloe Railway Stations as well as Fremantle TAFE, Murdoch <strong>and</strong> Curtin Universities.The <strong>Wembley</strong> <strong>Sports</strong> <strong>Park</strong> site is within 200 metres of bus routes 81, 84 <strong>and</strong> 85 along Cambridge Street. Theseare accessed via the formal footpath along Selby Street <strong>and</strong> signalised crossing facilities at the Cambridge Streetjunction. However, this route requires pedestrians to cross an un-signalised intersection on Salvado Road.Routes 81 <strong>and</strong> 84 have a frequency of half an hour to an hour up to approximately 5pm, only on weekdays.Route 85 runs in the evening every half hour to approximately 11pm, on Saturday approximately every hour to6pm, <strong>and</strong> on Sunday approximately every two hours to approximately 7:30pm. They connect the Perth CBD tothe western suburbs of Floreat <strong>and</strong> City Beach.The closest train station is Daglish Railway Station (Fremantle – Midl<strong>and</strong> Line), which is about 1.4 kilometresaway. However, the circle route buses (Route 98 <strong>and</strong> 99) connect the site to Shenton <strong>Park</strong> Railway Station,approximately 1.5 kilometres away. Subiaco Railway Station is 2.2 kilometres away but can be accessed by busRoute 28 that services the site.T:\60218676 - <strong>Wembley</strong> PK TA\8 Issued Docs\8.1 Reports\Comprehensive <strong>Integrated</strong> <strong>Access</strong> RevF.docxRevision F - 8 February 2012
AECOM<strong>Wembley</strong> <strong>Sports</strong> <strong>Park</strong> <strong>Integrated</strong> <strong>Access</strong>, <strong>Traffic</strong> <strong>and</strong> <strong>Car</strong> <strong>Park</strong>ing <strong>Plan</strong>11The public transport network servicing the site is illustrated in Figure 4.Figure 4Public Transport Network around the site of proposed development.Cambridge StreetRoute 28 BusSalvado RoadRoute 98 <strong>and</strong> 99 BusRoute 81, 84 <strong>and</strong> 85 BusBus StopsAlderbury StreetSelby StreetSite of ProposedDevelopmentJersey StreetShenton <strong>Park</strong> StationDaglish StationSubiaco StationHay StreetSource: ©2010 Google – Map Data ©2010 Google, Whereis (R), Sensis Pty Ltd.2.4 Road NetworkThe roads servicing the site are controlled by the Town of Cambridge. They include Selby Street, Salvado Road,Hay Street <strong>and</strong> Jersey Street, <strong>and</strong> are illustrated on Figure 5. This section describes the existing characteristicsof the roads adjacent to the site including reference to existing traffic volumes. The existing traffic data wascompiled from three sources:SCATS data for the period 14 May 2011 to 18 June 2011 supplied by Main Roads;Tube counts for the period 27 July 2011 to 7 August 2011 supplied by the Town of Cambridge; <strong>and</strong>Video surveys conducted on Saturday, 6 August 2011 supplied by Austraffic.T:\60218676 - <strong>Wembley</strong> PK TA\8 Issued Docs\8.1 Reports\Comprehensive <strong>Integrated</strong> <strong>Access</strong> RevF.docxRevision F - 8 February 2012
AECOM<strong>Wembley</strong> <strong>Sports</strong> <strong>Park</strong> <strong>Integrated</strong> <strong>Access</strong>, <strong>Traffic</strong> <strong>and</strong> <strong>Car</strong> <strong>Park</strong>ing <strong>Plan</strong>12Figure 5Road Network around the site of proposed developmentCambridge StreetSalvado RoadSelby StreetSite of ProposedDevelopmentAlderbury StreetJersey StreetHay StreetSource: ©2010 Google – Map Data ©2010 Google, Whereis (R), Sensis Pty Ltd.Selby StreetSelby Street runs along the western boundary of the site. It is a 4-lane dual carriageway road with a wide median<strong>and</strong> a posted speed of 60 kilometres per hour. It is classed as a Distributor A Road in the Main Roads WesternAustralia (Main Roads) metropolitan road hierarchy, <strong>and</strong> as such is under the authority of the Town of Cambridge.Each carriageway has a sealed width of 7.4 metres.Selby Street is one of the main north-south connector roads in the region. From Main Roads SCATS traffic data,the road is estimated to have an average weekday traffic flow of around 23,500 (refer to Figure 6). The averageweekday peak hourly volumes derived from the SCATS data for the section of Selby Street north of Hay Streetare:AM peak (7:45-8:45am): 700vph northbound <strong>and</strong> 1,600vph southboundPM peak (4:30-5:30pm): 1,500vph northbound <strong>and</strong> 1,000vph southboundThe peak hourly traffic volumes counted (on Selby Street, south of Alderbury Street) on Saturday, 6 August 2011from the video surveys were approximately as follows:Sat peak (1:40-2:40pm): 900vph northbound <strong>and</strong> 1,200vph southboundT:\60218676 - <strong>Wembley</strong> PK TA\8 Issued Docs\8.1 Reports\Comprehensive <strong>Integrated</strong> <strong>Access</strong> RevF.docxRevision F - 8 February 2012
AECOM<strong>Wembley</strong> <strong>Sports</strong> <strong>Park</strong> <strong>Integrated</strong> <strong>Access</strong>, <strong>Traffic</strong> <strong>and</strong> <strong>Car</strong> <strong>Park</strong>ing <strong>Plan</strong>13Figure 6 Existing Daily <strong>Traffic</strong> 1Salvado RoadSalvado Road runs along the northern boundary of the site. It has one lane in each direction, with several parallelparking spaces along the north side <strong>and</strong> a few along the south side near the Jersey Street intersection. Thespeed limit along Salvado Road is currently posted at 50 kilometres per hour.Salvado Road is classified as an <strong>Access</strong> Road to the west of Jersey Street <strong>and</strong> a Distributor B Road to the east. Itis under the authority of the Town of Cambridge <strong>and</strong> has a sealed width of 10 metres.From count data supplied by the Town of Cambridge, the average weekday traffic on Salvado Road (east ofVeryard Crescent) is 5,560 (refer to Figure 6). The average weekday peak hourly volumes (on Salvado Road,east of Veryard Crescent) from the count data are:AM peak (8:00-9:00am): 560vph eastbound <strong>and</strong> 190vph westboundPM peak (3:00-4:00pm): 200vph eastbound <strong>and</strong> 340vph westboundThe peak hourly traffic volumes counted (on Salvado Road, east of Veryard Crescent) on Saturday 6 August 2011from the video surveys were approximately as follows:Sat peak (12:15-1:15pm): 245vph eastbound <strong>and</strong> 380vph westboundThe peak hourly flow on Salvado Road west of Selby Street (for the video surveys) was about 80vph; with 50vpheastbound <strong>and</strong> 30vph westbound.Hay StreetHay Street runs along the southern boundary of the site. It is designated as a Distributor A Road, <strong>and</strong> is underthe control of Town of Cambridge (adjacent to the site). It contains two lanes in each direction with a wide centralmedian. Each carriageway has a sealed width of approximately 10 metres. The posted speed limit is 60kilometres per hour at the south eastern end of the site <strong>and</strong> a school speed limit zone of 40km/h is present.Jersey StreetApproximately 500 metres to the east of the site is Jersey Street, a two lane bi-directional single carriageway roadwith a painted narrow median, classed as a Distributor B Road, under the authority of the Town of Cambridge.The section south of Jolimont Terrace/Hart Lane is under the authority of the City of Subiaco. The posted speedlimit is 50 kilometres per hour <strong>and</strong> the sealed width varies around 9.5 metres.1The traffic volumes for Selby Street were derived from Scats data for the period 14 May 2011 to 18 June 2011 supplied by Main Roads.<strong>Traffic</strong> volumes for Salvado Road were obtained from tube counts for the period 27 July 2011 to 7 August 2011 supplied by the Town ofCambridge.T:\60218676 - <strong>Wembley</strong> PK TA\8 Issued Docs\8.1 Reports\Comprehensive <strong>Integrated</strong> <strong>Access</strong> RevF.docxRevision F - 8 February 2012
AECOM<strong>Wembley</strong> <strong>Sports</strong> <strong>Park</strong> <strong>Integrated</strong> <strong>Access</strong>, <strong>Traffic</strong> <strong>and</strong> <strong>Car</strong> <strong>Park</strong>ing <strong>Plan</strong>142.5 <strong>Access</strong> ArrangementSite <strong>Access</strong>The existing access arrangements are illustrated in Figure 7.Figure 7Existing <strong>Access</strong> to SiteSalvado RoadAdministrationBuilding <strong>Access</strong>Selby StreetLeft InHardst<strong>and</strong> Public <strong>Car</strong> <strong>Park</strong>Left outSource: ©2010 Google – Map Data ©2010 Google, Whereis (R), Sensis Pty Ltd.<strong>Access</strong> to the administration building for the Matthews’ Netball Centre is off Salvado Street approximately 100metres east of Selby Street. This access has limited car movements <strong>and</strong> provides access to only 6 car parkingspaces. The access is unsignalised <strong>and</strong> all movements are permitted.<strong>Access</strong> to <strong>and</strong> from the main (hardst<strong>and</strong> public) car park are via two points. Entry is via a left turn slip lane offSelby Street (the southbound carriageway) at the northern end of the car park (south of Kirwan Street). Exit is viaa left out only junction (with two lanes) located at the southern end of the existing car park (north of WhitfieldStreet).Vehicles accessing the site from the south along Selby Street are currently undertaking u-turn movements at theAlderbury Street intersection. Vehicles exiting the site <strong>and</strong> wanting to head north along Selby Street are makingu-turns at the signalised intersection with Hay Street. Alternatively, some vehicles have been seen to make illegalright turns from the car park exit, across the median, to head north. The dem<strong>and</strong>s for both access from the south,<strong>and</strong> egress to the north, are believed to be suppressed because of the associated movement restrictions.Current <strong>Traffic</strong> Dem<strong>and</strong>The arrivals <strong>and</strong> departures to <strong>and</strong> from the hardst<strong>and</strong> public car park were surveyed on Saturday, 6 August 2011during a typical PNA event. Almost 3,400 vehicles entered <strong>and</strong> exited the car park between 7:00am <strong>and</strong> 7:00pm.The observed arrivals <strong>and</strong> departures are illustrated in Figure 8 in 5 minute intervals. The peak 15-minutearrivals were 250 vehicles (7:45-8:00am) <strong>and</strong> the peak 15-minute departures were 298 (5:15-5:30pm). From thisdata, the estimate average dwelling time (departure time minus arrival time) for vehicles using the car park is 90minutes.T:\60218676 - <strong>Wembley</strong> PK TA\8 Issued Docs\8.1 Reports\Comprehensive <strong>Integrated</strong> <strong>Access</strong> RevF.docxRevision F - 8 February 2012
AECOM<strong>Wembley</strong> <strong>Sports</strong> <strong>Park</strong> <strong>Integrated</strong> <strong>Access</strong>, <strong>Traffic</strong> <strong>and</strong> <strong>Car</strong> <strong>Park</strong>ing <strong>Plan</strong>15The data in Figure 8 shows that approximately 74% of the entries into the main car park are from the north onSelby Street <strong>and</strong> the remaining 26% from the south on Selby Street. A fraction of one percent is from AlderburyStreet. All exiting vehicle have to head south first to the Selby Street – Hay Street intersection after which theycan turn to their desired direction. Less than 3% of these vehicles were found to make u-turns (an illegalmovement) to head back north. These figures show that, due to movement restrictions, there is currently animbalance between the numbers of trip approaches <strong>and</strong> departures in the respective directions. For example,74% comes from the north but less than 3% returns to the north <strong>and</strong> 26% comes from the south while more than97% returns to the south.More direct <strong>and</strong> convenient access on Selby Street for traffic from the south <strong>and</strong> to the north will improve theaccessibility of the site <strong>and</strong> the legibility for road users as they access the site. These in turn will improve thetransport efficiency <strong>and</strong> sustainability.Figure 8Existing <strong>Car</strong> <strong>Park</strong> Arrivals <strong>and</strong> Departures (in 5min intervals)1201008060402007:057:257:458:058:258:459:059:259:4510:0510:2510:4511:0511:2511:4512:0512:2512:4513:0513:2513:4514:0514:2514:4515:0515:2515:4516:0516:25In From Selby South In From Alderbury In From Selby North16:4517:0517:2517:4518:0518:2518:451201008060402007:057:257:458:058:258:459:059:259:4510:0510:2510:4511:0511:2511:4512:0512:2512:4513:05Out13:2513:4514:0514:2514:4515:0515:2515:4516:0516:2516:4517:0517:2517:4518:0518:2518:45T:\60218676 - <strong>Wembley</strong> PK TA\8 Issued Docs\8.1 Reports\Comprehensive <strong>Integrated</strong> <strong>Access</strong> RevF.docxRevision F - 8 February 2012
AECOM<strong>Wembley</strong> <strong>Sports</strong> <strong>Park</strong> <strong>Integrated</strong> <strong>Access</strong>, <strong>Traffic</strong> <strong>and</strong> <strong>Car</strong> <strong>Park</strong>ing <strong>Plan</strong>162.6 <strong>Park</strong>ingThe existing car parking arrangement consists of a hardst<strong>and</strong> area located between the Matthews’ Netball Centre<strong>and</strong> Pat Goodridge <strong>Park</strong>. This car park can cater for approximately 700 vehicles with an overspill car park on thegrass area north of this site. The grassed area can accommodate in excess of 500 vehicles, however much lesshave been observed. From the video surveys on Saturday, 6 August 2011, the maximum parking dem<strong>and</strong> was943 vehicles at 10:05am as shown in Figure 9. The 85 th percentile dem<strong>and</strong> was 776 vehicles. An explanation ofthe use <strong>and</strong> significance of the 85 th percentile can be found in Section 5.2.Figure 9Existing <strong>Car</strong> <strong>Park</strong>ing Usage100090080070060050040030020010007:057:257:458:058:258:459:059:259:4510:0510:2510:4511:0511:2511:4512:0512:2512:4513:0513:2513:4514:0514:2514:4515:0515:2515:4516:0516:2516:4517:0517:2517:4518:0518:2518:45Total Dem<strong>and</strong>85% Percentile Dem<strong>and</strong><strong>Park</strong>ing <strong>and</strong> drop-off is prohibited within 40m of Selby Street <strong>and</strong> for an 80m strip eastward from the existingcrossover access to the netball courts.From the video surveys on Saturday, 6 August 2011, approximately 700 vehicles stopped along Salvado Roadbetween 7:00am <strong>and</strong> 7:00pm to drop-off or pick up. Refer to Figure 10. The maximum (peak) <strong>and</strong> 85 th percentiledem<strong>and</strong>s in 5 minutes were 27 (average 5.4 per minute) <strong>and</strong> 11 (average 2.2 per minute) respectively.The total number of vehicles that parked along Salvado Road in the 12-hour video survey period was around 665(i.e. 20% of the corresponding dem<strong>and</strong> in the main car park, refer to Section 2.5).Figure 10Existing Drop Off <strong>and</strong> <strong>Park</strong>ing Arrivals along Salvado Road (in 5 minute intervals)3025201510507:057:257:458:058:258:459:059:259:4510:0510:2510:4511:0511:2511:4512:0512:2512:4513:0513:2513:4514:0514:2514:4515:0515:2515:4516:0516:2516:4517:0517:2517:4518:0518:2518:45Drop Off<strong>Park</strong>ing DeparturesT:\60218676 - <strong>Wembley</strong> PK TA\8 Issued Docs\8.1 Reports\Comprehensive <strong>Integrated</strong> <strong>Access</strong> RevF.docxRevision F - 8 February 2012
AECOM<strong>Wembley</strong> <strong>Sports</strong> <strong>Park</strong> <strong>Integrated</strong> <strong>Access</strong>, <strong>Traffic</strong> <strong>and</strong> <strong>Car</strong> <strong>Park</strong>ing <strong>Plan</strong>172.7 Crash HistoryCrash data from 1 January 2005 to 31 December 2009 was obtained from Main Roads for Salvado Road <strong>and</strong>Selby Street surrounding the site (including the intersections <strong>and</strong> midblock sections between Hay Street <strong>and</strong>Salvado Street <strong>and</strong> Selby Street <strong>and</strong> Jersey Street). These roads <strong>and</strong> intersections are indicated in Figure 11.There were no reported crashes for the other intersections along Selby Street during the five-year period,however there was a pedestrian death in the 2000-2005 period.Figure 11Project Site Roads <strong>and</strong> Intersections of Interest3 4 5 621Source: ©2010 Google – Map Data ©2010 Google, Whereis (R), Sensis Pty Ltd.A summary of the crash data obtained for the roads <strong>and</strong> intersections of interest is provided in Table 1.Table 1 Severity of crashes within the surrounding area from 2005 – 2009.Road (midblock) orIntersectionFatal Hospital MedicalCrash SeverityPDOMajorPDOMinorOther /UnknownE-W Salvado Road 0 0 0 7 1 0 8N-S Selby Street 0 0 0 4 1 0 5Total123456Selby Street -Hay Street /Underwood AvenueSelby Street -Alderbury StreetSelby Street -Salvado RoadSalvado Road -Veryard TerraceSalvado Road -Marlow StreetSalvado Road -Jersey Street0 0 10 26 18 0 540 0 0 2 1 0 30 1 4 16 3 0 240 0 0 2 0 0 20 0 0 1 0 0 10 1 5 12 0 0 18Total 0 2 19 70 24 0 115T:\60218676 - <strong>Wembley</strong> PK TA\8 Issued Docs\8.1 Reports\Comprehensive <strong>Integrated</strong> <strong>Access</strong> RevF.docxRevision F - 8 February 2012
AECOM<strong>Wembley</strong> <strong>Sports</strong> <strong>Park</strong> <strong>Integrated</strong> <strong>Access</strong>, <strong>Traffic</strong> <strong>and</strong> <strong>Car</strong> <strong>Park</strong>ing <strong>Plan</strong>18Table 1 shows that there were 115 crashes in total over the area of interest during the five-year period, with 90percent of crashes occurring at or within 10 metres of the intersections. There were no fatal crashes within theanalysis period. However, 21 crashes resulted in injury requiring hospital or medical attention. Most crashesresulted in property damage only (PDO).The intersections were further analysed using the Intersection Query tool on the Main Roads website. Somecategories may overlap, for example some crashes may have occurred both at night <strong>and</strong> in the wet. This isoutlined in Table 2.Table 2 shows that more than half of the crashes were due to rear end collisions, indicating that vehicles may notbe maintaining adequate following distances. 50 of the 53 rear end crashes were located at two mainintersections, Selby Street - Hay Street <strong>and</strong> Selby Street - Salvado Road. From the crash data there is noconclusive evidence to suggest that there are any safety issues directly relating to the operation of the <strong>Wembley</strong><strong>Sports</strong> <strong>Park</strong>.Table 2 Type of crashes within the surrounding area from 2005 – 2009123456IntersectionSelby Street -Hay Street /UnderwoodAvenueSelby Street -AlderburyStreetSelby Street -SalvadoRoadSalvadoRoad -VeryardTerraceSalvadoRoad -Marlow StreetSalvadoRoad - JerseyStreetTotal for AllIntersections*Indicates a result higher than expected.Crash TypeRear End Side Swipe Right Angle Right Through Wet34* 2 4 11* 12*Night Pedestrian Cycle Truck Motorcycle13* 0 1 1 0Rear End Side Swipe Right Angle Right Through Wet1 0 1 1 0Night Pedestrian Cycle Truck Motorcycle0 0 1 0 0Rear End Side Swipe Right Angle Right Through Wet16* 0 4 4 3Night Pedestrian Cycle Truck Motorcycle2 0 0 0 1Rear End Side Swipe Right Angle Right Through Wet1 0 0 1 0Night Pedestrian Cycle Truck Motorcycle0 0 0 0 0Rear End Side Swipe Right Angle Right Through Wet1 0 0 0 0Night Pedestrian Cycle Truck Motorcycle0 0 0 0 0Rear End Side Swipe Right Angle Right Through Wet0 0 10* 8* 3Night Pedestrian Cycle Truck Motorcycle1 0 1 0 1Rear End Side Swipe Right Angle Right Through Wet53 2 19 25 18Night Pedestrian Cycle Truck Motorcycle16 0 3 1 2No. ofCasualties10*05006*21T:\60218676 - <strong>Wembley</strong> PK TA\8 Issued Docs\8.1 Reports\Comprehensive <strong>Integrated</strong> <strong>Access</strong> RevF.docxRevision F - 8 February 2012
AECOM<strong>Wembley</strong> <strong>Sports</strong> <strong>Park</strong> <strong>Integrated</strong> <strong>Access</strong>, <strong>Traffic</strong> <strong>and</strong> <strong>Car</strong> <strong>Park</strong>ing <strong>Plan</strong>193.0 Changes to the Surrounding Transport NetworkThe Town of Cambridge has allocated $353,000 in their 2011-2012 budget towards construction of the <strong>Wembley</strong>Sport <strong>Park</strong> - Stage 1. The budget also provides for improvements to crossings on Selby Street at Salvado Road,Ev<strong>and</strong>ale Street <strong>and</strong> Alderbury Street. It is recommended that these be reviewed by the Town of Cambridge inline with the outcomes of this report.According to the Town’s Bike <strong>Plan</strong> 2009 it is proposing to upgrade the shared path along Salvado Road <strong>and</strong> SelbyStreet adjacent to the site in the financial year 2012 – 2013. The Bike <strong>Plan</strong> 2009 also recommends the provisionof cycle crossing facilities at the intersection of Alderbury Street <strong>and</strong> Selby Street. It is recommended that thesebe reviewed by the Town of Cambridge in line with the outcomes of this report.There are no proposed improvements to public transport servicing the site identified in the Public TransportAuthority’s (PTA) projects for 2010 / 2011. Although, as mentioned previously, the Department of <strong>Plan</strong>ning isproposing to increase the frequency of a number of routes servicing this area.The proposed light rail network linking Mirrabooka, Perth <strong>and</strong> universities (including UWA <strong>and</strong> Curtin) will providea significant network of light rail. The proposed light rail network will enable growth to occur at three universities<strong>and</strong> at QEII hospital, without unacceptable levels of congestion due to road traffic congestion. It will alsoencourage <strong>and</strong> facilitate transit oriented development at various points along the route. The precise route,including that between Subiaco <strong>and</strong> Glendalough, requires further investigation with full involvement from localauthorities <strong>and</strong> key stakeholders. It would also require a detailed master plan <strong>and</strong> business case. 22Department of Transport, July 2011. Public Transport for Perth in 2031. State of Western Australia.T:\60218676 - <strong>Wembley</strong> PK TA\8 Issued Docs\8.1 Reports\Comprehensive <strong>Integrated</strong> <strong>Access</strong> RevF.docxRevision F - 8 February 2012
AECOM<strong>Wembley</strong> <strong>Sports</strong> <strong>Park</strong> <strong>Integrated</strong> <strong>Access</strong>, <strong>Traffic</strong> <strong>and</strong> <strong>Car</strong> <strong>Park</strong>ing <strong>Plan</strong>204.0 Development Proposal4.1 Features of the Master <strong>Plan</strong>This section describes the proposed development. A Master <strong>Plan</strong> for the site is shown in Figure 13. Theproposed Master <strong>Plan</strong> for the site at the completion of stage 1 (see Figure 12) includes:- An un-signalised three way access off Salvado Road (Northern <strong>Access</strong>). This access is to be used asdem<strong>and</strong> dictates.- A signalised four way access off Selby Street at its junction with Alderbury Street. This is considered as theMain <strong>Access</strong> to the site. This access is designed to restrict east-west through movements <strong>and</strong> to providesafe pedestrian crossings across Selby Street, Alderbury Street <strong>and</strong> the Main <strong>Access</strong>.- A left in access off Selby Road south of Kirwan Street (existing access).- A left out egress into Selby Road north of Whitfeld Street (existing access).- Two internal roads: one travelling east-west <strong>and</strong> one north-south. These roads connect the Salvado Road<strong>and</strong> the Main <strong>Access</strong> to each other via a roundabout. They also provide access to the drop off <strong>and</strong> carparking facilities.- Two drop off areas along the East-West Road, one on the north <strong>and</strong> one on the south. Both drop off areasare over 100m in length which includes allowance for bus parking / drop off.- A roundabout at the junction of the two internal roads to provide better flow, a u-turn facility for vehiclesdropping off, <strong>and</strong> for access to parking.- <strong>Access</strong> to <strong>and</strong> from the south-western car park via a give way treatment. For safety <strong>and</strong> operational reasonsa right turn into the car park is not provided at the access intersection. This movement can beaccommodated via the roundabout at the eastern end of the East-West Road.- A total of 1010 car parking bays spread throughout the site. The car parks closer to the venues (<strong>and</strong> thusmore frequently used) are to be hard st<strong>and</strong> <strong>and</strong> the more remote, less used car parks, are to be soft st<strong>and</strong>(grassed). To prevent damage during the winter months the soft st<strong>and</strong> should be reinforced with a plasticcell. The soft st<strong>and</strong> will require irrigation.- Pedestrian <strong>and</strong> cycling paths connect the sporting facilities to the external pedestrian <strong>and</strong> cycle network.They have been designed for effective access <strong>and</strong> circulation of the site. Crossing points connecting thepaths to the facilities are provided along the internal East-West Road.- In accordance with the Building Code of Australia one (1) easy access bay is to be provided for each 50parking spaces. Based on the st<strong>and</strong>ards, 21 easy access bays will be required in Stage 1, which could bereduced to 18 following the reduction in car parking resulting from the Stage 2 development. The easyaccess parking spaces are provided throughout the car parks. Although Australian St<strong>and</strong>ards do not specifya distance, in each car park these spaces are to be located as close as possible to the nearby buildings /facilities. Ramp accesses to these bays are not to exceed 1:14 slopes.- <strong>Access</strong> for garbage trucks via a cross over on the East-West Road with turnaround area. Service deliveriescan be completed in the drop off area, as deliveries will be undertaken during the weekday <strong>and</strong> will notimpact on the peak time (Saturdays during winter).At the completion of stage 2 there will be modifications to the car-parking with a reduction from 1010 car parkingbays to 870 bays. As mentioned previously, the 21 easy access bays provided in stage 1 can be reduced to 18based on a provision of 1 easy access bay for every 50 st<strong>and</strong>ard parking bays.T:\60218676 - <strong>Wembley</strong> PK TA\8 Issued Docs\8.1 Reports\Comprehensive <strong>Integrated</strong> <strong>Access</strong> RevF.docxRevision F - 8 February 2012
AECOM<strong>Wembley</strong> <strong>Sports</strong> <strong>Park</strong> <strong>Integrated</strong> <strong>Access</strong>, <strong>Traffic</strong> <strong>and</strong> <strong>Car</strong> <strong>Park</strong>ing <strong>Plan</strong>214.2 Staging of Master <strong>Plan</strong>As mentioned previously, <strong>Wembley</strong> <strong>Sports</strong> <strong>Park</strong> will be redeveloped in two stages.Stage 1 of the development will be undertaken by the Town of Cambridge <strong>and</strong> the State Government of WesternAustralia on behalf of the Department of Sport <strong>and</strong> Recreation. Stage 1 is to include the construction of the newState Netball Centre, reconfiguration of the netball courts, key transport works to support the site <strong>and</strong> theconstruction of a new administration building for the PNA.The Master <strong>Plan</strong> for Stage 1 is shown in Figure 12. This stage will provide approximately 1010 hard st<strong>and</strong>parking spaces.Stage 2 of the develop is to be completed by the Town of Cambridge, subject to Council endorsement <strong>and</strong>budgetary process, <strong>and</strong> is to include additional car parks, road works, paths, new ovals <strong>and</strong> the Pat Goodridgebuilding works.T:\60218676 - <strong>Wembley</strong> PK TA\8 Issued Docs\8.1 Reports\Comprehensive <strong>Integrated</strong> <strong>Access</strong> RevF.docxRevision F - 8 February 2012
WEMBLEY SPORTS PARK - MASTER PLANFIGURE 12 - STAGE 1 PLANNOTE:This plan highlights transportfeatures of the Master <strong>Plan</strong>. Thefinal design may differ in somedetails reflected on this plan.
WEMBLEY SPORTS PARK - MASTER PLANFIGURE 13 - STAGE 2 PLANNOTE:This plan highlights transportfeatures of the Master <strong>Plan</strong>. Thefinal design may differ in somedetails reflected on this plan.
AECOM<strong>Wembley</strong> <strong>Sports</strong> <strong>Park</strong> <strong>Integrated</strong> <strong>Access</strong>, <strong>Traffic</strong> <strong>and</strong> <strong>Car</strong> <strong>Park</strong>ing <strong>Plan</strong>244.3 L<strong>and</strong> Use, Event Type <strong>and</strong> SchedulingThe assumed clubs, associations <strong>and</strong> facilities using the <strong>Wembley</strong> <strong>Sports</strong> <strong>Park</strong> in the context of the Master <strong>Plan</strong><strong>and</strong> <strong>Traffic</strong> Study who will materially impact traffic <strong>and</strong> parking are:- Perth Netball Association;- Netball WA (incorporating West Coast Fever);- <strong>Wembley</strong> Athletic Club comprising -<strong>Wembley</strong> Amateur Football Club (Australian Rules football);<strong>Wembley</strong> Baseball Club;<strong>Wembley</strong> Districts Cricket Club; <strong>and</strong>- VenuesWest Events<strong>Wembley</strong> Junior Football Club is planning to remain at Henderson <strong>Park</strong>. However, its traffic <strong>and</strong> parkingrequirements can be accommodated at <strong>Wembley</strong> <strong>Sports</strong> <strong>Park</strong> for their scheduled Sunday morning competitions.Other users of <strong>Wembley</strong> <strong>Sports</strong> <strong>Park</strong> are:- Subiaco City Junior Soccer Club; <strong>and</strong>- Sunset Coast Archery Club.These users are ad hoc <strong>and</strong> their dem<strong>and</strong> for parking <strong>and</strong> access is such that they do not warrant specificanalysis when taken in the overall context.The schedule of sporting activities is broadly described as below in Table 3.Table 3Summary of sporting activities at <strong>Wembley</strong> <strong>Sports</strong> <strong>Park</strong>Season Sport Monday - Friday Saturday SundayWinter Netball Netball WA activities (Year Round)06:00 to 22:30 <strong>and</strong> ‘ad hoc’ hire ofcourts by schools,WinterAustralianRulesfootballTraining Tue & Thu16:30 to 20:00Summer Baseball Training Mon – Thu16:30 to 21:00Summer Cricket Training Mon – Fri16:30 to 19:00Netball WA (09:00 to16:00PNA competition08:00 to 17:30Competition10:00, 12:30 <strong>and</strong> 14:30Juniors08:00 to 18:00One ovalJuniors & SeniorsTwo ovalsNetball WA(09:00 to 19:30Potential forJunior gamesSeniors0800 to 16:00Two ovalsJuniorsOne ovalThe assumed scheduling of the proposed events was derived using information on current events obtained fromthe association websites <strong>and</strong> are outlined in Section 5.1.4.4 Pedestrian <strong>and</strong> Cycle <strong>Access</strong>Pedestrians <strong>and</strong> cyclists will be able to enter the site using paths outlined in Section 2.2 <strong>and</strong> connect to pathswithin the site as illustrated in Figure 13.The proposed signalised intersection at the Selby Street / Alderbury Street entrance will provide pedestrians <strong>and</strong>cyclists with an opportunity to cross Selby Street to access the site safely from the west. The East-West Link willalso have two crossing points for pedestrians, one located close to the south western car park <strong>and</strong> the secondlocated further east providing a crossing point for users of the existing 700 bays in stage 1 or those parking in thestage 2 south eastern car park.L<strong>and</strong>scaping <strong>and</strong> barriers are to be provided between the two pedestrian crossings to prevent pedestrians <strong>and</strong>cyclists from crossing the road in the drop-off zones.T:\60218676 - <strong>Wembley</strong> PK TA\8 Issued Docs\8.1 Reports\Comprehensive <strong>Integrated</strong> <strong>Access</strong> RevF.docxRevision F - 8 February 2012
AECOM<strong>Wembley</strong> <strong>Sports</strong> <strong>Park</strong> <strong>Integrated</strong> <strong>Access</strong>, <strong>Traffic</strong> <strong>and</strong> <strong>Car</strong> <strong>Park</strong>ing <strong>Plan</strong>25End of trip facilities including secure cycle parking <strong>and</strong> lockers are currently located adjacent to the cricket nets –south of the existing permanent car park <strong>and</strong> are well lit. Additional showering facilities are available in thechange rooms of the State Netball Centre <strong>and</strong> PNA building.4.5 Public Transport <strong>Access</strong>Pedestrian access to the surrounding public transport facilities will also be improved with the signalising of theSelby Street / Alderbury Street junction, as it will provide a safe crossing point for patrons.4.6 Vehicle <strong>Access</strong> <strong>and</strong> MovementThe Master <strong>Plan</strong> includes four vehicle access points:The primary Main Entrance via Selby Street (opposite Alderbury Street);The secondary Northern <strong>Access</strong> via Salvado Road;The existing left-in access via Selby Street (located just south of Kirwan Street); <strong>and</strong>The existing left-out access via Selby Street (located north of Whitfeld Street).Northern <strong>Access</strong> via Salvado RoadThe Northern <strong>Access</strong> to the site via Salvado Road is proposed to be an un-signalised T-intersection with a givewaytreatment as shown in Figure 14. In the proposed arrangement, vehicles on the access road exiting the sitewould yield to vehicles travelling along Salvado Road. Vehicles may enter the site through the Northern <strong>Access</strong>by turning left or right from Salvado Road. Similarly, vehicles exiting the site via the Northern <strong>Access</strong> may exitturning left or right on to Salvado Road. In the layout it is recommended that generous kerb radii be provided forthe southwest corner to allow left turners to pass right turners at the stop line.From the Northern <strong>Access</strong>, vehicles travel along the North-South Link <strong>and</strong> have access to approximately 70parking bays in Stage 1 <strong>and</strong> a further 160 parking bays in Stage 2 before connecting to the East-West Link (viathe roundabout) where they will have access to drop off facilities <strong>and</strong> a further 240 car bays in the stage 1 or 640car bays in stage 2 of the southern car park(s). Stage 1 also provides vehicles with the option to exit the eastwestaccess road onto Selby Street to access the southern car parks’ 700 car bays. (This 700 bay car park is lostin Stage 2, however there is a possibility of using an overflow parking area as shown in Figure 13.) More detailedinformation on parking is provided in Section 4.7.Figure 14Proposed layout for Northern <strong>Access</strong>Main <strong>Access</strong> via Selby Street (opposite Alderbury Street)The proposed access at the intersection of Selby Street <strong>and</strong> Alderbury Street is expected to be the primaryaccess point to the site <strong>and</strong> is intended to function as a four-way signalised intersection. The new access pointleading to the site will be located opposite Alderbury Street, thus creating a four-way intersection with SelbyStreet, Alderbury Street <strong>and</strong> the East-West Link.The main western entrance will improve the access for vehicles entering the site from Selby Street north <strong>and</strong>south. The Main <strong>Access</strong> will provide access to the <strong>Wembley</strong> <strong>Sports</strong> <strong>Park</strong> (including drop-off facilities) <strong>and</strong> theprimary car parking area <strong>and</strong> eradicating the existing undesirable u-turn movements.The proposed intersection configuration is shown in Figure 15 <strong>and</strong> has the following features:T:\60218676 - <strong>Wembley</strong> PK TA\8 Issued Docs\8.1 Reports\Comprehensive <strong>Integrated</strong> <strong>Access</strong> RevF.docxRevision F - 8 February 2012
AECOM<strong>Wembley</strong> <strong>Sports</strong> <strong>Park</strong> <strong>Integrated</strong> <strong>Access</strong>, <strong>Traffic</strong> <strong>and</strong> <strong>Car</strong> <strong>Park</strong>ing <strong>Plan</strong>26Figure 15The Alderbury Street approach remains largely unchanged with the exception of the addition of a newsignalised pedestrian crossing across Alderbury Street.A 120m long right turn pocket is proposed for the southern approach. The length has been optimised toprovide reasonable storage for traffic to the <strong>Wembley</strong> <strong>Sports</strong> <strong>Park</strong> whilst limiting its impact on existingservices <strong>and</strong> trees in the median.To enhance pedestrian <strong>and</strong> cycle safety along Selby Street, a signalised left turn short lane is proposedon the east approach (from the <strong>Wembley</strong> <strong>Sports</strong> <strong>Park</strong>). Additionally, the lane is proposed to be asignalised slip to enable pedestrians <strong>and</strong> cyclists to continue north or south along the Selby Street PSPwhile traffic from the <strong>Wembley</strong> <strong>Sports</strong> <strong>Park</strong> is being serviced. (Note that the graphic below does notshow the pedestrian crossing north-south across the slip lane due to limitations of the software. In realitythere will be a continuous path for pedestrian <strong>and</strong> cyclists).Two right turn lanes are proposed on the east approach to reduce the green time required to serviceright-out vehicles <strong>and</strong> to minimise the delays for through traffic on Selby Street.A 35m long left turn pocket is proposed on the northern approach. The pocket length has beenconstrained by existing power poles. The left turn pocket gives the ability to service left turners into thesite.Significantly, no east-west through movements are provided for in the design to preserve the currentresidential conditions along Alderbury Street. <strong>Traffic</strong> from the east <strong>and</strong> from the west will be serviced intwo separate phases in the operations of the traffic signal. This will also assist in accommodating thetimeliness of those bus services operating along Alderbury Street (delays were recorded at over 10minutes exiting Alderbury Street on Saturday, 6 August 2011).Due to dem<strong>and</strong> fluctuations, it is proposed that all vehicle <strong>and</strong> pedestrian phases, except that for thethrough vehicle phase on Selby Street, be operated on dem<strong>and</strong> only. This will maximise the green timefor traffic on Selby Street whilst minimising stoppages <strong>and</strong> delays.Indicative layout for new signalised intersection at Selby Street <strong>and</strong> Alderbury Street.T:\60218676 - <strong>Wembley</strong> PK TA\8 Issued Docs\8.1 Reports\Comprehensive <strong>Integrated</strong> <strong>Access</strong> RevF.docxRevision F - 8 February 2012
AECOM<strong>Wembley</strong> <strong>Sports</strong> <strong>Park</strong> <strong>Integrated</strong> <strong>Access</strong>, <strong>Traffic</strong> <strong>and</strong> <strong>Car</strong> <strong>Park</strong>ing <strong>Plan</strong>27Secondary <strong>Access</strong> via Selby StreetThe Master <strong>Plan</strong> retains the existing left-in <strong>and</strong> left-out accesses along Selby Street. These accesses willsupplement <strong>and</strong> relieve the Main <strong>Access</strong>. They also facilitate a more even traffic distribution <strong>and</strong> give directaccess / egress to <strong>and</strong> from the southern car park.Internal Road NetworkThe internal road layout requires two links: a North-South Link <strong>and</strong> an East-West Link. The North-South Linkconnects the Northern <strong>Access</strong> to the eastern car parks <strong>and</strong> service yard adjacent to the PNA administrationbuilding. A roundabout connects the two internal links to allow efficient flow, u-turn facilities <strong>and</strong> access to all thecar parks. The East-West Link connects the eastern car parks with the south-western <strong>and</strong> middle car park <strong>and</strong>the Main <strong>Access</strong>. The Northern <strong>Access</strong> will be closed unless dem<strong>and</strong> requires its use. Therefore the northernsection of the North-South Road will not be in use for the majority of the time.Drop off facilities are provided along the north <strong>and</strong> south of the East-West Link.For safety reasons full access into the south-western car park from the East-West Link will not be permitted.Right turn movements into the car park will be banned <strong>and</strong> this movement will be accommodated via theroundabout at the end of the East-West Road. The effectiveness of the right turn ban, together with theperformance of the right turn out of the south western car park into the East-West Road, needs to be monitoredduring the operations. Intervention may become necessary if the right turn ban is not properly adhered to.A diagram showing the internal road network <strong>and</strong> movements possible for Stage 1 <strong>and</strong> Stage 2 is shown inFigure 12 <strong>and</strong> Figure 13 respectively.4.7 <strong>Park</strong>ingThe layout provides a total of 1,000 formed parking spaces <strong>and</strong> approximately 200m of drop-off space in Stage 1as shown in Figure 12. The 1,000 bays will consist of:A new hard st<strong>and</strong> car park along Selby Street, consisting of 240 bays (south western car park);A new hard st<strong>and</strong> car park east of the new hard st<strong>and</strong> netball courts, consisting of 70 bays (middle carpark); <strong>and</strong>The 700 existing bays, approximately 10 of which will be lost with the integration with the 240-bay carpark (southern car park).The parking supply will reduce to approximately 870 formed parking spaces in Stage 2. The 870 bays will consistof the new hard st<strong>and</strong> car bays identified above as well as:A new soft st<strong>and</strong> car park in the northeast corner of the site, consisting of 160 bays (north east car park);A new soft st<strong>and</strong> car park next to Halesworth Road, 120 bays (south east car park); <strong>and</strong>The removal of 410 bays in the existing 700 car park (southern car park) to make way for a new oval.The Master <strong>Plan</strong> identifies the potential for a grassed area on the southwest corner of <strong>Wembley</strong> <strong>Sports</strong> <strong>Park</strong>which could be used, with management intervention, for further overflow parking. The number of vehicles thiscould accommodate will depend on how it is laid out or marshalled, but could be in the order of up to 500 vehicles.<strong>Park</strong>ing spaces are provided in separate car parking facilities to enable car parks to be closed during non peakperiods, thus allowing controlled management (refer to Section 6.0 for further details on the proposed <strong>Traffic</strong> <strong>and</strong>People Movement <strong>Plan</strong>s located in Appendix C). Buses accessing the site will utilise part of the drop-off facilitiesto park as shown in Figure 12 <strong>and</strong> Figure 13.In accordance with the Building Code of Australia, one (1) easy access bay should be provided for each 50 formalparking spaces. Based on the st<strong>and</strong>ards, 21 easy access bays will be required in Stage 1, which could bereduced to 18 following the reduction in car parking resulting from the Stage 2 development. Although AustralianSt<strong>and</strong>ards do not specify a distance, in each car park these spaces are located closest to the nearby buildings /facilities.T:\60218676 - <strong>Wembley</strong> PK TA\8 Issued Docs\8.1 Reports\Comprehensive <strong>Integrated</strong> <strong>Access</strong> RevF.docxRevision F - 8 February 2012
AECOM<strong>Wembley</strong> <strong>Sports</strong> <strong>Park</strong> <strong>Integrated</strong> <strong>Access</strong>, <strong>Traffic</strong> <strong>and</strong> <strong>Car</strong> <strong>Park</strong>ing <strong>Plan</strong>284.8 Servicing <strong>and</strong> Logistics<strong>Access</strong> for deliveries <strong>and</strong> garbage pickup will be via the Main <strong>Access</strong> on Selby Road between the State NetballCentre <strong>and</strong> the new netball courts. A service road which can be used as an emergency access, is also proposedoff the North-South Link to the PNA Administration building (refer to Figure 13). This will be closed for pedestrianaccess on competition Saturdays to accommodate safe pedestrian movements, however access for emergencyvehicles should be managed on an ad-hoc basis if required.Delivery trucks will be able to park in the drop-off zone to deliver goods to the State Netball Centre or the PNAadministration building if required to do so during peak events. Detail design of the area adjacent to the garbagebins will need to provide for the turn area of these trucks (minimum 25 metres).T:\60218676 - <strong>Wembley</strong> PK TA\8 Issued Docs\8.1 Reports\Comprehensive <strong>Integrated</strong> <strong>Access</strong> RevF.docxRevision F - 8 February 2012
AECOM<strong>Wembley</strong> <strong>Sports</strong> <strong>Park</strong> <strong>Integrated</strong> <strong>Access</strong>, <strong>Traffic</strong> <strong>and</strong> <strong>Car</strong> <strong>Park</strong>ing <strong>Plan</strong>295.0 Transport AnalysisThis section of the report analyses the predicted impact of the development on the transport infrastructure in theproposed Master <strong>Plan</strong>.5.1 AssumptionsA spreadsheet model was developed using Microsoft Excel to forecast the traffic generation <strong>and</strong> estimate the carparking dem<strong>and</strong>s for each day of the week. The model was developed based on information:- Collected through discussions with key stakeholders (such as PNA <strong>and</strong> VenuesWest);- Provided by the Town of Cambridge on the future use of the <strong>Park</strong> <strong>and</strong> event arrival times;- Available on the internet on the current club schedules <strong>and</strong> teams (this was used to derive the number <strong>and</strong>times of vehicles entering <strong>and</strong> exiting the site); <strong>and</strong>- Observed patterns from the video surveys conducted on Saturday, 6 August 2011.Event / Operational TimetableTable 5 shows the list of events compiled for the purposes of this transport assessment. The list is grouped byday of the week (<strong>and</strong> season, where relevant) <strong>and</strong> includes all events that are currently being planned for. Thistransport assessment assumed that all events will occur on their respective days <strong>and</strong> that they will attract as manypeople as indicated in Table 4. People include participants, substitutes, coaches <strong>and</strong> umpires as indicated.Allowance was made to utilise the facilities to their estimated capacity in order to estimate the worst trafficimpacts.Two scenarios were considered:Scenario 1 – refers to Stage 1 of the Master <strong>Plan</strong>, where PNA matches <strong>and</strong> Netball WA activity runconcurrently with one football match (Advice indicated that up to 41 netball games may be played at anyone time during various time slots in the netball season on Winter Saturdays, therefore the schedule isbased on this).Scenario 2 – refers to Stage 2 of the Master <strong>Plan</strong>, where PNA matches run concurrently with twofootball matches.Table 4 details the assumptions in the trip generation for scenarios 1 <strong>and</strong> 2, referred to as Stage 1 <strong>and</strong> Stage 2.The only difference between the two scenarios occurs on Saturday (winter) where two football matches occur at14:30 in Stage 2 compared to one match in Stage 1. If there is any expansion in sporting activity beyond theanticipated dem<strong>and</strong> from Scenario 2, a new traffic, access <strong>and</strong> parking study is necessary <strong>and</strong> should beundertaken before Town of Cambridge approves any further expansion in sporting activity.In the subsequent analysis Scenario 2 has only been analysed for the worst case winter Saturday time period.Additional Future ConsiderationsThere is potential to convert the existing 11 grass courts to hard courts in the future potentially allowing 52 gamesto be played concurrently on a Winter Saturday. This could potentially increase traffic <strong>and</strong> parking dem<strong>and</strong> by25% during peak periods. This potential dem<strong>and</strong> has not been analysed, however should such a significantincrease in activity be desired in the future, further transport analysis should be undertaken to indentify thepotential impact on the surrounding infrastructure <strong>and</strong> parking capacity.As well as an increase in courts, there is also the possibility that a major State Netball event could be scheduledduring a peak Winter Saturday. This would significantly increase parking dem<strong>and</strong> <strong>and</strong> traffic on the surroundingroads. At this time it is assumed that such events would not be scheduled concurrent with PNA events, however ifthis should be considered in the future further analysis <strong>and</strong> a new traffic assessment should be prepared toassess the impact <strong>and</strong> identify mitigation <strong>and</strong> management measures.T:\60218676 - <strong>Wembley</strong> PK TA\8 Issued Docs\8.1 Reports\Comprehensive <strong>Integrated</strong> <strong>Access</strong> RevF.docxRevision F - 8 February 2012
AECOM<strong>Wembley</strong> <strong>Sports</strong> <strong>Park</strong> <strong>Integrated</strong> <strong>Access</strong>, <strong>Traffic</strong> <strong>and</strong> <strong>Car</strong> <strong>Park</strong>ing <strong>Plan</strong>30Table 4<strong>Wembley</strong> <strong>Sports</strong> <strong>Park</strong> Operational AssumptionsDayMondayTuesdayWednesdayThursdayFridayEventStartTimeGameTime(mins)No.GamesPeopleper team(incl.coaches<strong>and</strong>subs)OtherPeople(incl.umpires)Peopleper eventNetball WA 6:00 180 4 12 4 112Netball WA 9:00 420 2 12 4 56Netball WA 16:00 120 4 12 4 112Netball WA 18:00 240 4 12 4 112Netball WA 6:00 180 2 12 4 56Netball WA 9:00 420 2 12 4 56Netball WA 16:00 120 4 12 4 112Baseball Seniors - training 16:30 180 4 10 2 88Netball WA 18:00 240 4 12 4 112Netball WA 6:00 180 4 12 4 112Netball WA 9:00 420 2 12 4 56Netball WA 16:00 120 4 12 4 112Baseball Juniors - training 16:30 120 2 10 2 44PNA Under 17s 17:45 69 7 12 4 196Netball WA 18:00 240 4 12 4 112PNA Open 19:00 69 9 12 4 252PNA Open 20:30 69 9 12 4 252Netball WA 6:00 180 2 12 4 56Netball WA 9:00 420 2 12 4 56Netball WA 16:00 120 2 12 4 56Baseball Seniors - training 16:30 300 4 10 2 88Netball WA 18:00 240 4 12 4 112Netball WA 16:00 120 4 12 4 112Netball WA 18:00 240 4 12 4 112T:\60218676 - <strong>Wembley</strong> PK TA\8 Issued Docs\8.1 Reports\Comprehensive <strong>Integrated</strong> <strong>Access</strong> RevF.docxRevision F - 8 February 2012
AECOM<strong>Wembley</strong> <strong>Sports</strong> <strong>Park</strong> <strong>Integrated</strong> <strong>Access</strong>, <strong>Traffic</strong> <strong>and</strong> <strong>Car</strong> <strong>Park</strong>ing <strong>Plan</strong>31Table 4<strong>Wembley</strong> <strong>Sports</strong> <strong>Park</strong> Event Assumptions (continued)Day Event Start TimeSaturday(Summer)Saturday(Winter)Stage 1Stage 2GameTime(mins)No.GamesPeopleper team(incl.coaches<strong>and</strong>subs)OtherPeople(incl.umpires)PeoplepereventNetball WA 9:00 420 4 12 4 112Baseball Little League 10:00 90 1 10 2 22Cricket 12:45 300 1 12 3 27Baseball 15s 13:00 120 1 10 2 22Cricket 13:00 300 1 12 3 27Cricket 13:15 300 1 12 3 27Cricket 13:30 300 1 12 3 27Baseball State League 15:30 120 1 10 2 22Baseball 17s 16:00 120 1 10 2 22PNA Netta Yr 3 8:15 49 17 12 4 476PNA Sub Junior Yr 5 8:15 57 24 12 4 672Netball WA 9:00 420 2 12 4 56PNA Netta Yr 4 9:15 49 13 12 4 364PNA Sub Junior Yr 6 9:15 57 26 12 4 728PNA Netta Yr 3&4 10:15 49 15 12 4 420PNA Sub Junior Yr 7 10:15 69 24 12 4 672Aust. Rules F/ball Colt 10:45 101 1 24 13 61PNA Under 17s 11:30 69 30 12 4 840Aust. Rules F/ball12:30 101 1 24 13 61Reserves PNA Under 17s 13:00 69 36 12 4 1008PNA Under 17s 14:30 69 12 12 4 336PNA Open 14:30 69 27 12 4 756Aust. Rules F/ball seniors 14:30 101 1 24 13 61PNA Under 17s 16:00 69 12 12 4 336PNA Open 16:00 69 27 12 4 756PNA Netta Yr 3 8:15 49 17 12 4 476PNA Sub Junior Yr 5 8:15 57 24 12 4 672Netball WA 9:00 420 2 12 4 56PNA Netta Yr 4 9:15 49 13 12 4 364PNA Sub Junior Yr 6 9:15 57 26 12 4 728PNA Netta Yr 3&4 10:15 49 15 12 4 420PNA Sub Junior Yr 7 10:15 69 24 12 4 672Aust. Rules F/ball Colt 10:45 101 1 24 13 61PNA Under 17s 11:30 69 30 12 4 840Aust. Rules F/ball12:30 101 1 24 13 61Reserves PNA Under 17s 13:00 69 36 12 4 1008PNA Under 17s 14:30 69 12 12 4 336PNA Open 14:30 69 27 12 4 756Aust. Rules F/ball seniors 14:30 101 2 24 13 122PNA Under 17s 16:00 69 12 12 4 336PNA Open 16:00 69 27 12 4 756T:\60218676 - <strong>Wembley</strong> PK TA\8 Issued Docs\8.1 Reports\Comprehensive <strong>Integrated</strong> <strong>Access</strong> RevF.docxRevision F - 8 February 2012
AECOM<strong>Wembley</strong> <strong>Sports</strong> <strong>Park</strong> <strong>Integrated</strong> <strong>Access</strong>, <strong>Traffic</strong> <strong>and</strong> <strong>Car</strong> <strong>Park</strong>ing <strong>Plan</strong>32Table 4<strong>Wembley</strong> <strong>Sports</strong> <strong>Park</strong> Event Assumptions (continued)DaySunday(Summer)Sunday (Winter)EventStartTimeGameTime(mins)No.GamesPeopleper team(incl.coaches<strong>and</strong>subs)OtherPeople(incl.umpires)Peopleper eventArchery 8:45 1 22 1 45Netball WA 9:00 420 4 12 4 112Baseball AAA 9:30 150 1 10 2 22Baseball Under 19 9:30 120 1 10 2 22Baseball AAA 12:00 150 1 10 2 22Baseball A Grade 12:00 120 1 10 2 22Baseball State League 15:15 120 1 10 2 22Netball WA 16:00 120 4 12 4 112Netball WA 18:00 240 4 12 4 112SOCCER 13s 8:30 67.5 1 15 4 34SOCCER 11s 8:30 67.5 1 13 4 30Aust. Rules F/ball 11s 8:45 60 1 24 13 61Aust. Rules F/ball Year 4s 8:45 60 1 24 13 61Archery 8:45 1 22 1 45Netball WA 9:00 420 4 12 4 112SOCCER Under 9s 9:00 55 1 11 4 26SOCCER Under 8s 9:00 45 1 11 4 26SOCCER 12s 9:40 67.5 1 15 4 34SOCCER 15s 9:40 67.5 1 15 4 34SOCCER 13s 9:45 67.5 1 15 4 34Aust. Rules F/ball Year 5s 10:00 60 1 24 13 61Aust. Rules F/ball 12s 10:00 60 1 24 13 61SOCCER Under 8s 10:00 45 2 11 4 52SOCCER Under 8s 11:00 45 1 11 4 26SOCCER Under 9s 11:00 55 1 11 4 26SOCCER 16s 11:10 67.5 1 15 4 34Aust. Rules F/ball 13s 11:30 60 1 24 13 61Netball WA 16:00 120 4 12 4 112Netball WA 18:00 240 4 12 4 112The assumptions outlined above tend to be conservative in order not to underestimate the traffic impacts of thevarious events. Practical measures could be employed to reduce the actual impacts.Hockey, archery <strong>and</strong> other ad hoc uses will not result in material changes to peak dem<strong>and</strong>s, due to limitations inplaying fields.The State Netball Centre will be used by Netball WA <strong>and</strong> VenuesWest as well as the PNA to host events. TheNetball WA events will be regular <strong>and</strong> thus have been included in the model.VenuesWest events will be irregular <strong>and</strong> thus have not been included in the model. However, a discussion of theimpact a VenuesWest event may have on parking has been included in Section 5.2.Should there be a significant increase in activities on-site (such as more than 41 games of netball at any one timeor any other change that will increase overall vehicle trips to site) then a new study may be required to assess thetraffic impact <strong>and</strong> parking dem<strong>and</strong> <strong>and</strong> identify management <strong>and</strong> mitigation measures.<strong>Car</strong> Usage <strong>and</strong> Linked TripsTo convert the forecast number of people to trips, assumptions were made in regard to car usage (cars perperson) <strong>and</strong> the proportions of linked trips. Linked trips are trips where different people travel in the same car orwhere the same people attend different events. The analysis was first run assuming 100% car usage <strong>and</strong> 0%linked trips. This assumption was tested <strong>and</strong> adjusted as required to reflect the observed number of cars. This isfurther discussed in Section 5.2.Arrival <strong>and</strong> Departure PatternsIn order to assess the impact of the forecast car trips a frequency distribution had to be assumed to forecast thearrival <strong>and</strong> departure patterns. From the video survey (Saturday, 6 August 2011) it seems as if the arrivals <strong>and</strong>T:\60218676 - <strong>Wembley</strong> PK TA\8 Issued Docs\8.1 Reports\Comprehensive <strong>Integrated</strong> <strong>Access</strong> RevF.docxRevision F - 8 February 2012
AECOM<strong>Wembley</strong> <strong>Sports</strong> <strong>Park</strong> <strong>Integrated</strong> <strong>Access</strong>, <strong>Traffic</strong> <strong>and</strong> <strong>Car</strong> <strong>Park</strong>ing <strong>Plan</strong>33departures (for the netball events) follow a normal distribution as illustrated in Figure 16. The results show thatarrivals occur over at least 40 minutes with a peak at about 25 minutes before events. The departures are moreintensified with a peak between 15 <strong>and</strong> 20 minutes after events. The frequency distribution shown in Figure 16was used for all events. This assumption was tested <strong>and</strong> found to produce reasonable results.Figure 16Observed Arrival <strong>and</strong> Departure Patterns20%18%16%14%12%10%8%6%4%2%0%-40min -35min -30min -25min -20min -15min -10min -5min 0min 5min 10min 15min 20min 25min 30minArrivalDeparture5.2 Development <strong>Park</strong>ing Dem<strong>and</strong> Trip GenerationThe trip generation analysis numbers are included in Appendix A. Table 6 shows a summary of the final results<strong>and</strong> the figure used for capacity analysis. Table 5 shows that the critical scenario is Winter Saturdays, during thenetball <strong>and</strong> Australian Rules football season. The forecast trip generation (between 7:00am <strong>and</strong> 7:00pm) isapproximately 3,600 round trips (7,200 one way trips) in Stage 1, increasing to approximately 3,700 round trips(7,400 one-way trips) in Stage 2. The forecast peak 15-minute flows are 305 in <strong>and</strong> 337 out in Stage 1, <strong>and</strong> 335 in<strong>and</strong> 337 out in Stage 2. The maximum car occupancy (parking dem<strong>and</strong>) during the day is 1,021 spaces with an85 th percentile dem<strong>and</strong> of 869 spaces in Stage 1. The respective numbers in Stage 2 are 1,070 <strong>and</strong> 890. Theseare substantially greater than the dem<strong>and</strong> for activities on any other day of the week or season.Table 5Forecast Trip Generation (Summary)DayDailyTripsto /fromWSPArrival Departure OccupancyMax 15min Max 15min Max85thPercentileFlow Time Flow Time Bays Time BaysMonday 392 54 05:30 05:45 65 09:10 09:25 229 17:55 125Tuesday 424 54 15:30 15:45 65 18:10 18:25 315 17:55 202Wednesday 1,136 132 17:20 17:35 159 21:55 22:10 560 18:50 372Thursday 368 54 17:30 17:45 65 22:10 22:25 258 17:55 203Friday 224 54 15:30 15:45 65 18:10 18:25 226 17:55 117Saturday (Summer) 308 54 08:30 08:45 65 16:10 16:25 271 15:55 248Saturday(Winter)Stage 1 3,604 305 14:00 14:15 337 15:50 16:05 1,021 10:05 869Stage 2 3,665 335 14:00 14:15 337 15:50 16:05 1,070 15:45 890Sunday (Summer) 491 70 08:25 08:40 65 16:10 16:25 252 15:55 203Sunday (Winter) 1,042 148 08:20 08:35 142 11:05 11:20 621 09:45 391The results in Table 5 conservatively assume 100% car usage <strong>and</strong> 0% linked trips for all events except for PNAevents during Winter Saturdays. For these netball events, 65 to 70 % car usage <strong>and</strong> 30 to 40 % linked trips wereassumed. These assumptions were tested against existing event schedules <strong>and</strong> observed traffic data <strong>and</strong> werefound to produce reasonable results. <strong>Car</strong> usage <strong>and</strong> linked trips are discussed further in Section 5.3.It is important to note that the above forecast traffic volumes <strong>and</strong> subsequent intersection analysis shown inproceeding sections are based on a forecast only <strong>and</strong> that the day to day variation of traffic can alter somewhatT:\60218676 - <strong>Wembley</strong> PK TA\8 Issued Docs\8.1 Reports\Comprehensive <strong>Integrated</strong> <strong>Access</strong> RevF.docxRevision F - 8 February 2012
AECOM<strong>Wembley</strong> <strong>Sports</strong> <strong>Park</strong> <strong>Integrated</strong> <strong>Access</strong>, <strong>Traffic</strong> <strong>and</strong> <strong>Car</strong> <strong>Park</strong>ing <strong>Plan</strong>34from that predicted. Various assumptions about future transport patterns <strong>and</strong> behaviours had to be made to carryout the traffic analysis. Assumptions are based on observed patterns <strong>and</strong> behaviours <strong>and</strong> the anticipatedchanges that will occur as a result of developing the site. <strong>Traffic</strong> forecasting does have limitations <strong>and</strong> forecasttraffic volumes should be taken as only indicative of the likely traffic that a particular site may generate or thevolumes that a road may carry.5.3 <strong>Park</strong>ing Dem<strong>and</strong>Figure 17 shows the forecast parking dem<strong>and</strong> against the parking dem<strong>and</strong> observed on 6 August 2011. As canbe seen the parking dem<strong>and</strong> profile, based on the assumptions outlined above, is a good representation of theobserved profile. The vertical differences are attributed to the additional activity forecast as a result of theupgrading <strong>and</strong> expansion of the sporting facilities. The forecast 85 th percentile dem<strong>and</strong> is 93 <strong>and</strong> 114 vehiclesmore than the existing dem<strong>and</strong> of 776 in Stage 1 <strong>and</strong> Stage 2 respectively.For netball events the level of car usage <strong>and</strong> linked trips was determined by comparing the observed dem<strong>and</strong>against the number <strong>and</strong> type of games known to be taking place during the times of the survey. The valuesdetermined for car usage <strong>and</strong> linked trips allow a model to be estimated that reflects the dem<strong>and</strong> for parking, butalso reflects the dwell time for cars in the car park, allowing the maximum dem<strong>and</strong> <strong>and</strong> peak dem<strong>and</strong> period to bedetermined. <strong>Car</strong> usage represents the number of car trips per competitor, for example if a car usage value of 80per cent is applied, for every 10 participants 8 car trips will be generated. Linked trips values represent thepercentage of these trips determined from the car usage estimate which are likely to remain on site beyond theend of any specific game. So for example based on a car usage estimate of 80 % <strong>and</strong> linked trips of 50 %, foreach 10 participants 8 vehicles will arrive prior to any given game time, 4 will depart after the game <strong>and</strong> a further 4will depart at some point later in the day.Comparison of observed parking dem<strong>and</strong> with the forecast parking dem<strong>and</strong> showed that levels of car usage <strong>and</strong>linked trips are not constant <strong>and</strong> vary between junior <strong>and</strong> senior games. Therefore values for car usage <strong>and</strong> linkedtrips were determined for each category of game <strong>and</strong> were found to be approximately 65% car usage <strong>and</strong> 40%linked trips for juniors, <strong>and</strong> 70% car usage <strong>and</strong> 30% linked trips for seniors.Figure 17Forecast <strong>Park</strong>ing Dem<strong>and</strong>1200100080060040020007:057:257:458:058:258:459:059:259:4510:0510:2510:4511:0511:2511:4512:0512:2512:4513:0513:2513:4514:0514:2514:4515:0515:2515:4516:0516:2516:4517:0517:2517:4518:0518:2518:45Surveyed (6 Aug 2011)Surveyed (85th Percentile)Forecast (Winter Sat) - Stage 1 Design (85th Percentile) - Stage 1Forecast (Winter Sat) - Stage 2 Design (85th Percentile) - Stage 2T:\60218676 - <strong>Wembley</strong> PK TA\8 Issued Docs\8.1 Reports\Comprehensive <strong>Integrated</strong> <strong>Access</strong> RevF.docxRevision F - 8 February 2012
AECOM<strong>Wembley</strong> <strong>Sports</strong> <strong>Park</strong> <strong>Integrated</strong> <strong>Access</strong>, <strong>Traffic</strong> <strong>and</strong> <strong>Car</strong> <strong>Park</strong>ing <strong>Plan</strong>35<strong>Car</strong> parking dem<strong>and</strong> at <strong>Wembley</strong> <strong>Sports</strong> <strong>Park</strong> varies significantly throughout the year. In accordance withAustRoads “Guide to <strong>Traffic</strong> Management, Part 11: <strong>Park</strong>ing”, it is uneconomical to supply parking to meet themaximum dem<strong>and</strong> on the busiest day of the year. Instead, car parking supply should be based on satisfyingparking dem<strong>and</strong> that will only be exceeded for a number of hours or days per year. This is commonly taken to bethe 85 th percentile utilisation (the number that will not be exceeded 85% of the time in peak periods). From Table5 it can be seen that the parking dem<strong>and</strong> is forecast to fluctuate significantly with 869 being by far the largest 85 thpercentile dem<strong>and</strong> in Stage 1 <strong>and</strong> 890 in Stage 2.The Master <strong>Plan</strong> proposes around 1,000 car parking spaces in Stage 1 <strong>and</strong> around 870 in Stage 2 excludingoverflow car parking. It is concluded that the parking supply is ample to provide for the forecast dem<strong>and</strong> of allevents; except possibly for short durations during Winter Saturdays. These events would form only a fraction (fiverelative short periods on 18 Saturdays in a year) of the total operational time during the year. It would beunreasonable <strong>and</strong> unsustainable to provide more parking to prevent overflows from ever occurring. Rather thanproviding more permanent parking, the dem<strong>and</strong> should be managed. This is further discussed in Section 6.0.The State Netball Centre may seat up to 1,000 people. Assuming car occupancies of two people per car for largeevents, this equates to 500 car spaces which is well within the proposed parking provision. An event at the StateNetball Centre could be held any day of the week, except for days when PNA events are scheduled. It is assumedthat any VenuesWest event on a Tuesday or Wednesday night would replace the Netball WA activities at theState Netball Centre. On Winter Saturdays (during the day), the State Netball Centre will only be able toaccommodate Netball WA training, it will not be able to accommodate events unless all spectators access the sitevia alternative means such as public transport <strong>and</strong> / or dedicated buses.5.4 Drop OffFrom this assessment, it is anticipated that the maximum total daily trips to / from the <strong>Wembley</strong> <strong>Sports</strong> <strong>Park</strong> willbe around 6% higher (increase from 3,400 to 3,600 trips on Winter Saturdays) than current trip generation levels.In Section 2.6 it was noted that the maximum current drop-off rate on Salvado Road (on Winter Saturdays) is 27vehicles in 5 minutes (average rate of 5.4 per minute). If it is assumed that the dem<strong>and</strong> for drop-off will alsoincrease by 6%, then the maximum drop-off rate in the peak 5 minutes will be 5.7 vehicles per minute. Theproposed drop-off zone (north <strong>and</strong> south zones) has capacity to accommodate around 20 cars <strong>and</strong> 3 buses at anygiven time. Assuming vehicles st<strong>and</strong> for no more than 2 minutes then this should be sufficient space to cater for12 vehicles at peak times with additional spaces available.For efficient use of the drop-off facilities, it is recommended that 1-minute time restrictions be applied. This willprevent motorists from using the drop-off zone as a parking area.5.5 <strong>Traffic</strong> DistributionThe postcode data from the PNA members list (refer to Figure 18) illustrates that patrons live in all directionssurrounding the site. Even if one direction is more dominant, factors such as route choice, access constraints <strong>and</strong>multiple trip purposes can affect traffic distribution to <strong>and</strong> from the site.An origin destination survey is required to develop a clear underst<strong>and</strong>ing of the actual traffic distribution. Table 6shows the estimated traffic distribution based on the data from the video surveys on Saturday, 6 August 2011.The traffic distribution will change <strong>and</strong> become more balanced with the proposed new access arrangement. Theanticipated traffic distribution for the new site layout is also shown in Table 6.Table 6<strong>Traffic</strong> DistributionScenarioSelby St North Selby St South Veryard Cr North Salvado Rd EastFrom To From To From To From ToExisting 68% 3% 23% 88% 1% 1% 8% 8%Anticipated 33% 33% 33% 33% 14% 14% 20% 20%It cannot be accurately determined what the likely distribution of traffic will be given the altered accessarrangements <strong>and</strong> there will be an inevitable increase on some roads following the changes.During normal operations, motorists can be expected to use the most direct access. However, during peakperiods traffic can be expected to redistribute to avoid congestion. For the critical events, it was thereforeassumed that the traffic will distribute reasonably evenly across the site’s access points. For the analysis (refer toSection 6.1) it was assumed traffic from Selby Street North <strong>and</strong> to Selby Street South will distribute equallyacross the Main <strong>and</strong> left-in / left-out accesses.T:\60218676 - <strong>Wembley</strong> PK TA\8 Issued Docs\8.1 Reports\Comprehensive <strong>Integrated</strong> <strong>Access</strong> RevF.docxRevision F - 8 February 2012
AECOM<strong>Wembley</strong> <strong>Sports</strong> <strong>Park</strong> <strong>Integrated</strong> <strong>Access</strong>, <strong>Traffic</strong> <strong>and</strong> <strong>Car</strong> <strong>Park</strong>ing <strong>Plan</strong>36Figure 18Perth Netball Association Postcode AnalysisT:\60218676 - <strong>Wembley</strong> PK TA\8 Issued Docs\8.1 Reports\Comprehensive <strong>Integrated</strong> <strong>Access</strong> RevF.docxRevision F - 8 February 2012
AECOM<strong>Wembley</strong> <strong>Sports</strong> <strong>Park</strong> <strong>Integrated</strong> <strong>Access</strong>, <strong>Traffic</strong> <strong>and</strong> <strong>Car</strong> <strong>Park</strong>ing <strong>Plan</strong>375.6 Site <strong>Access</strong> AnalysisThe Northern (Salvado Road), Main (Selby / Alderbury Street) <strong>and</strong> left-in / left-out accesses were analysed for thepeak hourly traffic on Winter Saturdays. The Main <strong>Access</strong> was also analysed for the peak hour (PM peak) duringweekdays. Refer to Section 4.6 for the intersection layouts. The intersection turning volumes were derived as acombination of:The development traffic based on the trip generation <strong>and</strong> distribution discussed in Section 5.2 <strong>and</strong>Section 5.5 respectively; <strong>and</strong> The background traffic discussed in Section 2.4.The intersections were analysed using SIDRA Intersection Software for the peak 15-minutes within the peakhourly flows. These flows were derived from the frequency distributions, established in 5-minute intervals, asillustrated in Figure 16. The detailed analysis results are included in Appendix B. The summary results <strong>and</strong> keyfindings are presented below.Northern <strong>Access</strong> (Salvado Road)The analysis indicated (refer to Table 8) that the Northern <strong>Access</strong> is likely to operate at, or over, capacity duringthe peak hours on Winter Saturdays. Since the <strong>Access</strong> is anticipated to be operational on dem<strong>and</strong> only (i.e. onWinter Saturdays), no analysis was done for normal weekdays.Table 7Performance summary for Northern <strong>Access</strong> (Salvado Road)TimeDayDem<strong>and</strong>Flow (vph)OverallDoSAverageDelay (s)LoSApproach /MovementWorst MovementDelay(s)Queue(m)9:30-10:30 Winter Sat 1,364 1.218 35.1 E South / RT 150.1 182.913:30-14:30 WinterSat13:30-14:30 b WinterSatStage 1 1,532 1.734 74.6 F South / RT 380.9 321.9Stage 2 1,574 1.861 83.4 F South / RT 439.7 345.8Stage 1 1,413 0.985 16.7 C South / RT 90.6 71.0Stage 2 1,455 1.057 19.3 C South / RT 114.0 86.315:00-16:00 Winter Sat 1,422 1.371 47.5 E South / RT 216.1 234.4PM Peak Weekday Free flow on Salvado Road, access to <strong>Wembley</strong> <strong>Sports</strong> <strong>Park</strong> closedNotes:b With additional traffic diverted from Salvado Road EntranceThe forecast overall Levels of Service (LoS) are E or F with a Degree of Saturation (DoS) of up to 1.734. Thecritical movement is the south approach right turn with anticipated average delays of up to 380.9 seconds. Theright turn dem<strong>and</strong>, based on the assumed traffic distribution (refer to Section 5.5), was 116, 88 <strong>and</strong> 88vphrespectively for the three peak hours analysed. It was found that, if controlled by capacity, these dem<strong>and</strong>s wouldreduce to 90, 50 <strong>and</strong> 60vph respectively; with the surplus dem<strong>and</strong>s redistributing to the Main <strong>Access</strong>. Even ifthese dem<strong>and</strong>s will not reduce as much as suggested, the oversaturated conditions are expected to be relativelyshort in duration <strong>and</strong> the associated queues are expected to dissipate relatively quickly.If the traffic would redistribute as suggested, the average delay will reduce, for example, from 380.9 seconds to90.6 seconds as shown in Table 7. The effect of traffic redistribution on the Main <strong>Access</strong> is discussed in the nextsection.Main <strong>Access</strong> (Selby Street / Alderbury Street intersection)The proposed signalised intersection at the Main <strong>Access</strong> was analysed for the peak hours during WinterSaturdays <strong>and</strong> the peak hour (PM peak) on normal weekdays. The base analysis assumed that all pedestrianphases will operate each cycle in the peak hour. Since this is unlikely to occur, analysis was also done assumingno pedestrian calls will be received during the peak hour. The likely scenario is that several calls may be receivedduring the peak hour <strong>and</strong> thus the actual results are therefore likely to be between the two sets of results.Additional analysis was also done to test the capacity of the intersection to service overflow traffic from theNorthern <strong>Access</strong>. The key results from the analysis are summarised in Table 8.T:\60218676 - <strong>Wembley</strong> PK TA\8 Issued Docs\8.1 Reports\Comprehensive <strong>Integrated</strong> <strong>Access</strong> RevF.docxRevision F - 8 February 2012
AECOM<strong>Wembley</strong> <strong>Sports</strong> <strong>Park</strong> <strong>Integrated</strong> <strong>Access</strong>, <strong>Traffic</strong> <strong>and</strong> <strong>Car</strong> <strong>Park</strong>ing <strong>Plan</strong>38Table 8Performance summary for Main <strong>Access</strong>TimeDayDem<strong>and</strong>Flow (vph)OverallDoSAverageDelay (s)LoSApproach /MovementWorst MovementDelay(s)Queue(m)9:00-10:00 Winter Sat 2,966 1.000 55.8 E North / T 68.6 205.811:00-12:00 Winter Sat 3,087 0.914 50.5 D South / RT 68.0 118.711:00-12:00 a Winter Sat 3,087 0.816 31.7 C East / RT 49.8 58.014:00-15:00 WinterSat14:00-15:00 b WinterSat14:00-15:00 b a WinterSatStage 1 3,205 1.000 62.2 E South / RT 75.5 186.7Stage 2 3,264 1.000 65.1 E South / LT 78.8 221.4Stage 1 3,300 1.000 65.3 E South / RT 87.1 200.1Stage 2 3,359 1.016 69.0 E South / RT 93.5 232.5Stage 1 3,300 0.970 47.5 D South / RT 59.3 148.0Stage 2 3,359 0.970 47.5 D South / RT 57.3 159.6AM Peak Weekday 3,027 0.894 41.3 D South / RT 90.7 103.8AM Peak a Weekday 3,027 0.806 23.8 C West / L 66.8 34.1PM Peak Weekday 3,064 0.916 48.8 D South / RT 85.4 148.2PM Peak a Weekday 3,064 0.798 28.0 C East / RT 64.5 7.3Notes:a No pedestrian callbWith additional traffic diverted from Salvado Road EntranceThe results suggest that the intersection will operate at LoS D or E with DoS of up to 1.000 <strong>and</strong> overall averagedelays of up to 62.2 seconds if all pedestrian phases run each cycle. The critical movements differ between thepeak hours. The south approach right turn is expected to be the worst with delays of up to 75.5 seconds whenpedestrian calls are received each time. In these cases the 95 th percentile back of queue may exceed theavailable storage in the proposed 120m long right turn pocket.If traffic redistributes from the Northern <strong>Access</strong> to the Selby – Alderbury intersection the overall average delay isforecast to increase during the critical peak hour (14:00 - 15:00) by 3.1 seconds without exceeding the capacity ofthe intersection; assuming all pedestrian phases are required each cycle. If no pedestrian phases are requiredduring that particular peak, the overall average delay will improve by 17.8 seconds <strong>and</strong> the overall LoS willimprove from E to D.Further analysis was done to test the capacity of the intersection to cater for additional traffic as a result ofbackground traffic growth or in the event of the development traffic being underestimated. From this analysis itwas found the intersection should be able to cope with 12% <strong>and</strong> 14% growth in traffic on Winter Saturdays <strong>and</strong>normal weekdays respectively.From the analysis it is concluded that the proposed intersection layout should be adequate to service the forecasttraffic dem<strong>and</strong> at acceptable LoS. It is also shown that the AM <strong>and</strong> PM traditional weekday peaks perform betterthat the Saturday netball peaks.T:\60218676 - <strong>Wembley</strong> PK TA\8 Issued Docs\8.1 Reports\Comprehensive <strong>Integrated</strong> <strong>Access</strong> RevF.docxRevision F - 8 February 2012
AECOM<strong>Wembley</strong> <strong>Sports</strong> <strong>Park</strong> <strong>Integrated</strong> <strong>Access</strong>, <strong>Traffic</strong> <strong>and</strong> <strong>Car</strong> <strong>Park</strong>ing <strong>Plan</strong>39Selby Street Left-in / Left-out <strong>Access</strong>The key results of the analysis for the left-in / left-out <strong>Access</strong> on Selby Street are shown in Table 9. The resultssuggest that the access will operate well during most of the day, except during the outbound peak when averagedelays of up to 51.6 seconds may be experienced by the left-out movement. Once again, since the peak periodsare relatively short in duration, these delays are not expected to occur over extended periods of time. And thequeues forming during these periods are also expected to dissipate relatively quickly.Table 9Performance summary for Selby Street Left-in / Left-out <strong>Access</strong>TimeDayDem<strong>and</strong>Flow (vph)OverallDoSAverageDelay (s)LoSApproach /MovementWorst MovementDelay(s)Queue(m)9:00-10:00 Winter Sat 2,026 0.543 6.1 A East / LT 33.5 19.111:00-12:00 Winter Sat 1,796 0.348 4.1 A East / LT 27.7 10.914:00-15:00 WinterSatStage 1 2,190 0.718 7.5 A East / LT 51.6 27.7Stage 2 2,210 0.731 7.7 A East / LT 53.5 28.05.7 Alternative <strong>Access</strong>Northern <strong>Access</strong> (Salvado Road) – Restricted <strong>Access</strong>For effective traffic distribution <strong>and</strong> for the most flexible transport solution, it is desirable to provide all movementsat the Northern <strong>Access</strong>. However, this intersection has limited capacity as demonstrated in Section 5.6. This isdue to its single approach lanes <strong>and</strong> the number of conflicting movements. In particular, the right out movementlimits the ability of the intersection to service high volumes of exiting traffic. This is not necessarily a problem ifthe purpose of the intersection is to provide the most direct access from, <strong>and</strong> egress to, the east along SalvadoRoad while not giving too much capacity to encourage undesirable use of Veryard Crescent (“rat-runs”).The Northern <strong>Access</strong> may operate more efficiently if one or two of the right turns are banned. If the right turn intothe <strong>Wembley</strong> <strong>Sports</strong> <strong>Park</strong> is banned, the right turn out will have more capacity <strong>and</strong> the traffic on Veryard Crescentmay not increase as much. However, this ban may not be easy to enforce if the right-out movement is provided.If the right-out movement is banned, the left-out will have considerable more capacity with an increased likelihoodthat Veryard Crescent will be used as a “rat run”. In this scenario, the reciprocal movements for the left-in will notbe provided <strong>and</strong> more vehicles may attempt to do u-turns after turning left out of the <strong>Wembley</strong> <strong>Sports</strong> <strong>Park</strong> toreturn to Salvado Road East.Based on the above, it is recommended that the intersection be operated as a full access in the first instance. Ifthis proves to be operationally inefficient or causes undesirable impacts, then further consideration could be givento restricting access. However, this needs to be done with due consideration of the ability of the Main <strong>Access</strong> tocater to the additional trips that will no longer be serviced by the Northern <strong>Access</strong>.Main <strong>Access</strong> (Selby Street / Alderbury Street intersection) – Give-way OptionA give-way treatment was not explored further as initial analysis showed that delays of up to 20 minutes areforecast for vehicles exiting the facility on Winter Saturdays. Significant delays of nearly 3 minutes may also occurduring weekday afternoons when the State Netball Centre is used.Main <strong>Access</strong> (Selby Street / Alderbury Street Intersection) – Roundabout OptionA roundabout option was dismissed earlier in the masterplanning process because of its inability to preventthrough movements between the <strong>Wembley</strong> <strong>Sports</strong> <strong>Park</strong> <strong>and</strong> Alderbury Road, <strong>and</strong> its less desirable ability toaccommodate pedestrians <strong>and</strong> cyclists crossing Selby Street <strong>and</strong> the <strong>Wembley</strong> <strong>Sports</strong> <strong>Park</strong> access.Nevertheless, the analysis results for a dual-lane roundabout have been included in this report to demonstrate itsability to cater for all traffic movements at minimal delays. The proposed layout is shown in Figure 19 <strong>and</strong> the keyanalysis results are shown in Table 10. Detailed results are included in the Appendix B.T:\60218676 - <strong>Wembley</strong> PK TA\8 Issued Docs\8.1 Reports\Comprehensive <strong>Integrated</strong> <strong>Access</strong> RevF.docxRevision F - 8 February 2012
AECOM<strong>Wembley</strong> <strong>Sports</strong> <strong>Park</strong> <strong>Integrated</strong> <strong>Access</strong>, <strong>Traffic</strong> <strong>and</strong> <strong>Car</strong> <strong>Park</strong>ing <strong>Plan</strong>40Figure 19Proposed Roundabout LayoutTable 10Performance Summary for Main Intersection (Roundabout Option)TimeDayDem<strong>and</strong> Flow(vph)OverallDoSAverageDelay (s)LoSApproach /MovementWorst MovementDelay(s)11:00-12:00 Winter Sat 3,087 0.614 8.5 A West / RT 16.4 6.014:00-15:00 a Winter Sat 3,300 0.739 11.6 B South / RT 18.1 8.2PM Peak Weekday 3,126 0.649 6.2 A West / RT 17.2 2.2Queue(m)Notes:a With additional traffic diverted from Salvado Road EntranceFrom Table 10 it can be seen that a roundabout will offer higher performance to that of a signalised intersection<strong>and</strong> is expected to have a smaller likelihood of serious injury or fatal traffic crashes. It also provides a solution foru-turns to the north to access properties <strong>and</strong> to the south to access the <strong>Wembley</strong> <strong>Sports</strong> <strong>Park</strong> (over <strong>and</strong> above theright turns into the <strong>Wembley</strong> <strong>Sports</strong> <strong>Park</strong>). However, it may not achieve other objectives such an accessrestriction <strong>and</strong> enhanced pedestrian crossings. Additionally, it may also be more difficult to develop its designconsidering the property constraints especially on the west side of Selby Street.5.8 Comparison of Intersection Types<strong>Traffic</strong> analysis has been carried out for both a signalised intersection <strong>and</strong> a roundabout at the main access.Whilst the roundabout demonstrates slightly better operational performance than a signalised intersection, thereare a number of advantages of providing traffic signals at this location.A roundabout provides the most efficient solution for traffic <strong>and</strong> once installed has much lower maintenancerequirements <strong>and</strong> costs than a signalised intersection, but this is often offset by increased construction costs. Inaddition, roundabouts offer very poor facilities for pedestrians <strong>and</strong> cyclists, with minimum protection at crossingpoints <strong>and</strong> in general, greater crossing distances. It is also difficult to provide a design that can ban movementsfrom certain arms of the intersection without also removing the opportunity to make those turns from otherapproaches. This is critical when considering the potential for ‘rat running’ through Alderbury Street.Roundabouts also require a much larger footprint than an equivalent signal controlled intersection. The currentlayout at Selby Street / Alderbury Street is quite constrained <strong>and</strong> in order to accommodate a roundabout withsufficient lanes on each approach, a significant amount of l<strong>and</strong> take would be required. This may impact uponprivate properties or if that is to be avoided, result in significant l<strong>and</strong> take <strong>and</strong> realignment of Selby Street on itswestern side, significantly increasing costs.T:\60218676 - <strong>Wembley</strong> PK TA\8 Issued Docs\8.1 Reports\Comprehensive <strong>Integrated</strong> <strong>Access</strong> RevF.docxRevision F - 8 February 2012
AECOM<strong>Wembley</strong> <strong>Sports</strong> <strong>Park</strong> <strong>Integrated</strong> <strong>Access</strong>, <strong>Traffic</strong> <strong>and</strong> <strong>Car</strong> <strong>Park</strong>ing <strong>Plan</strong>41<strong>Traffic</strong> signals allow for the introduction of protection for pedestrians <strong>and</strong> cyclists through controlled crossings.This provides a benefit for pedestrians <strong>and</strong> cyclists in terms of safety, but also increases accessibility to publictransport <strong>and</strong> cycling facilities. In order to reduce traffic <strong>and</strong> parking dem<strong>and</strong> for the site, it is critical to providegood access to non-car modes in order to promote sustainable transport choices but also healthier lifestyles.Signals can also be used to ban movements, i.e. between Alderbury Street <strong>and</strong> the main access road, removingmuch of the incentive for rat running through Alderbury Street.In general, the additional benefits of providing signals outweigh the advantages offered to vehicles of aroundabout. If traffic dem<strong>and</strong> for the site is to be reduced, it is extremely important to provide solutions thatfacilitate the change to sustainable alternatives <strong>and</strong> improve safety for non-car users, especially in areas wherethere are particularly high numbers of vulnerable users such as children. Table 11 gives a summary of theseadvantages <strong>and</strong> disadvantages of signals <strong>and</strong> roundabout with respect to each other.Table 11Overall Summary for Main Intersection Roundabout Vs SignalsIntersectionTypeRoundabout<strong>Traffic</strong> SignalsAdvantagesSlightly improved performance for vehiclesLow maintenance costsBest solution for reducing vehicle crashesNo additional l<strong>and</strong> take requiredPotentially lower initial construction costsImproved pedestrian <strong>and</strong> cycling safetyImproved access <strong>and</strong> integration with publictransportMitigates against rat running through AlderburyStreetDisadvantagesPoor Pedestrian <strong>and</strong> cyclist safetyRequirement for l<strong>and</strong> takePotential impact upon private propertyHigh initial construction costsRat running cannot be eliminated withoutlimiting access to Alderbury Street from SelbyStreetOn-going maintenance <strong>and</strong> operating costsSlightly poorer performance for vehicles than aroundaboutSlightly higher risk of vehicle crashesMain <strong>Access</strong> (Selby Street / Alderbury Street Intersection) – U-Turns OptionDedicated u-turn facilities in the Selby Street median were considered as an alternative mechanism to provide forright turns in <strong>and</strong> out of the <strong>Wembley</strong> <strong>Sports</strong> <strong>Park</strong>; albeit indirectly. Two right turn facilities were considered – asouth-to-south u-turn about 35m south of Alderbury Road <strong>and</strong> a north-to-north u-turn about 120m north of HayStreet. Refer to Appendix B for a sketch of the scheme tested <strong>and</strong> the detailed analysis results 3 .From the analysis, the u-turns from the south are forecast to experience average delays of 23 to 250 seconds(during each hour between 08:30 <strong>and</strong> 16:00), with queues up to 42 vehicles (300m). The u-turns from the northare forecast to experience average delays of 54 to 673 seconds (during each hour between 08:30 <strong>and</strong> 16:00),with queues up to 83 vehicles (580m). The corresponding LoS are D to F for the south-south u-turns <strong>and</strong> F for thenorth-north u-turns.The analysis predicts that the u-turn concept will not operate adequately during the Winter Saturday events withunacceptable queuing back to downstream intersections. A separate investigation is required to assess if themovements will be able to operate safely. Additionally, the concept does not provide a solution for a pedestriancrossing.3The analysis was run assuming of 2.5 seconds follow-up headways <strong>and</strong> 6.0 seconds critical gaps for the u-turns.T:\60218676 - <strong>Wembley</strong> PK TA\8 Issued Docs\8.1 Reports\Comprehensive <strong>Integrated</strong> <strong>Access</strong> RevF.docxRevision F - 8 February 2012
AECOM<strong>Wembley</strong> <strong>Sports</strong> <strong>Park</strong> <strong>Integrated</strong> <strong>Access</strong>, <strong>Traffic</strong> <strong>and</strong> <strong>Car</strong> <strong>Park</strong>ing <strong>Plan</strong>425.9 Internal Road JunctionAn assessment was also undertaken for the internal junction on the East-West Link with the south western carpark. A review of the junction highlighted several possible intersection treatments for this junction including:1. Unsignalised junction allowing all movements;2. Unsignalised junction with banned movements; <strong>and</strong>3. A roundabout.Due to the high volume of traffic entering <strong>and</strong> exiting this junction, particularly to <strong>and</strong> from the south western carpark, it is important to determine the most suitable junction layout that is safe <strong>and</strong> provides good access.Unsignalised Full <strong>Access</strong> OptionA SIDRA assessment of an un-signalised full access junction showed that it would perform well during both thearrival <strong>and</strong> departure peaks. However, these results do not include any impacts that the signalised intersection atSelby Street / Alderbury Street would have on this junction. From the SIDRA assessments of the main entrance,the results show that queuing of over 200m could exist on the East-West Link particularly during the departurepeak. This queue length would extend across this car park access; therefore SIDRA results for the un-signalisedfull access junction were not accurate.VISSIM micro simulation highlighted an issue with the right turn pocket on the East-West Link. To provideadequate separation between the signalised junction <strong>and</strong> the right turn into the car park, 3 seconds of travel timeshould be provided before the turn pocket develops. At 30km/h, this equates to 25m. Due to the limited distancebetween the two junctions, the provision of a separation distance of 25m is not possible.Unsignalised with Right Turn BansAlternatively the right turn into the car park could be banned. This option forces all vehicles to continue along theEast-West Link <strong>and</strong> undertake a u-turn at the roundabout. Micro-simulation shows that the right turn ban wouldimprove the operations between the main access <strong>and</strong> the junction to the car park. From the VISSIM microsimulationresults it is further expected that the introduction of the u-turn operations could be accommodatedwithout causing flow break downs on the East-West Link.RoundaboutThe third option for this junction is to install a roundabout. Roundabouts require a larger footprint than an unsignalisedjunction however it caters for all movements <strong>and</strong> does not require a right turn pocket. VISSIM microsimulationshows that the roundabout would cause similar queuing problems to that experienced in the full accessoption.5.10 Internal RoadVISSIM micro-simulation was used to assess the traffic operations on the East-West <strong>and</strong> North-South Links. Thiswas done to test the interaction between the various components along these roads. Key findings from theassessment include:- For safety <strong>and</strong> operational reasons, right turns cannot be allowed at the access from the East-West Link tothe southwestern car park. Vehicles queuing to turn right into the southwestern car park on the east-westlink road could block traffic entering from Selby Street, potentially impacting upon the operation of SelbyStreet, but also restricting access to drop-off facilities. As mentioned earlier, these right turns can beaccommodated via u-turns at the roundabout located at the eastern end of the East-West Link without anyadverse impact on the internal or external road network.- At the estimated drop-off rate <strong>and</strong> under normal conditions, the drop-off facilities are not expected to causeflow breakdowns on the East-West Link. The induced u-turn traffic flow, even though fairly congested duringthe peak Winter Saturday events, is expected to be below capacity.- The North-South Link from Salvado Road to the roundabout will perform an important circulation function,particularly during the peak Winter Saturday events. Flow breakdowns are expected to occur if thesevehicles are channeled directly through the Stage 1 northeastern car park. Additionally, without the southernportion of the link, traffic entering the car park from the south would not be able to make u-turns <strong>and</strong> wouldbe forced to exit at Salvado Road. For operational flexibility <strong>and</strong> efficiency the entire North-South Link istherefore required in both Stage 1 <strong>and</strong> 2.T:\60218676 - <strong>Wembley</strong> PK TA\8 Issued Docs\8.1 Reports\Comprehensive <strong>Integrated</strong> <strong>Access</strong> RevF.docxRevision F - 8 February 2012
AECOM<strong>Wembley</strong> <strong>Sports</strong> <strong>Park</strong> <strong>Integrated</strong> <strong>Access</strong>, <strong>Traffic</strong> <strong>and</strong> <strong>Car</strong> <strong>Park</strong>ing <strong>Plan</strong>43- The exits from the southwestern car park into the East-West Link <strong>and</strong> out of the site into Selby Street areexpected to be heavily congested during the peak Winter Saturday events. However, this dissipatesrelatively quickly.- If movements are banned at the Northern (Salvado Road) <strong>Access</strong> they would have to be accommodated atthe Main (Selby Street – Alderbury Road) <strong>Access</strong>; aggravating its queues <strong>and</strong> delays during peak WinterSaturday events. Full access at the Salvado Road <strong>Access</strong> is recommended in order to distribute the trafficevenly <strong>and</strong> to service the traffic more effectively.5.11 Impact on Surrounding Roads <strong>and</strong> IntersectionsThe predicted traffic generation calculation illustrates that the peak traffic flow produced by the site <strong>and</strong> carparking requirements are due to the PNA’s Saturday Competition. This is an existing site event. Therefore theinclusion of the State Netball Centre <strong>and</strong> other new events on the site are not expected to significantly impact thesurrounding network any greater than the existing use. However, the internalisation of traffic including dedicateddrop-off areas <strong>and</strong> car parking will improve traffic arrangements <strong>and</strong> is likely to relieve parking congestion on thesurrounding streets. The Master <strong>Plan</strong> should reduce the impact of the existing use through the provision of twomore access points <strong>and</strong> the spreading of the car parking facilities throughout the site by way of an internal roadnetwork. Both of which will help distribute the traffic, <strong>and</strong> thus reduce congestion on the surrounding road network.However, the provision of additional access points will inevitably lead to a redistribution of traffic <strong>and</strong> may increasetraffic volumes on some roads, while reducing traffic on others.The inclusion of the signalised intersection on Selby Street will interrupt the through traffic. The most significantinterruption is considered to be within acceptable limits as it will only be required for 18 Saturdays a year duringthe netball season. To optimise operations, the traffic signals are to be operated with vehicle actuation for sidestreet traffic. The signals will however improve access for Route 28 buses as well as access to the <strong>Wembley</strong><strong>Sports</strong> <strong>Park</strong> for public transport, cyclists <strong>and</strong> pedestrians.T:\60218676 - <strong>Wembley</strong> PK TA\8 Issued Docs\8.1 Reports\Comprehensive <strong>Integrated</strong> <strong>Access</strong> RevF.docxRevision F - 8 February 2012
AECOM<strong>Wembley</strong> <strong>Sports</strong> <strong>Park</strong> <strong>Integrated</strong> <strong>Access</strong>, <strong>Traffic</strong> <strong>and</strong> <strong>Car</strong> <strong>Park</strong>ing <strong>Plan</strong>446.0 Mitigation <strong>and</strong> Action6.1 Managing car parking dem<strong>and</strong>In accordance with AustRoads St<strong>and</strong>ards, it is not accepted practice to design car parks to meet the maximumcar parking dem<strong>and</strong>s. <strong>Car</strong> parking design is ideally based on the 85 th percentile dem<strong>and</strong> (the dem<strong>and</strong>recommended by AustRoads). For peak periods above the 85 th percentile alternative measures should beimplemented to reduce parking dem<strong>and</strong>. For alternative measures to be successful they require engineering,education, encouragement <strong>and</strong> enforcement. It is also important that the measures are relevant for the site’s use<strong>and</strong> those impacts monitored. To achieve this, a Green Travel <strong>Plan</strong> (TravelSmart) for the PNA’s activities shouldbe developed. This will include undertaking travel behaviour surveys of the patrons to underst<strong>and</strong> their travelpatterns <strong>and</strong> reason for this. Based on the results of the survey, a Green Travel <strong>Plan</strong> should be developed whichwill outline what measures should be implemented <strong>and</strong> how these will be managed. These measures will bemonitored for success <strong>and</strong> altered as required.Consultation with the Department of <strong>Plan</strong>ning on 29 June 2011 advised that car parking designed for the 85 thpercentile would suffice at this site to encourage sustainable transport.Alternative measures that could be implemented in the Green Travel <strong>Plan</strong> include:Spreading finish <strong>and</strong> start times for the eventsReason: The PNA back to back games mean that the next team arrives while the last team is finishing its game.This results in 15 minute peak parking dem<strong>and</strong>. If there was an interval between games, or staggering of fixturesacross the Saturday, then there would be opportunity for the last team (or at least some of the last team) to departbefore the next team arrives. Alternatively, competitions could be considered on Saturday <strong>and</strong> Sunday tomaximise use of the developed infrastructure.Engineering: Redesign netball schedule, in consultation with a traffic engineer to spread traffic arrivals <strong>and</strong>departures.Education: Publishing of the games fixtures will educate the patrons.Encouragement: The fixtures will provide encouragement.Enforcement: Prompt game start <strong>and</strong> finish time will enforce the measure.Issuing permits for parking <strong>and</strong> / or charge for parkingReason: To reduce the number of vehicles accessing the site <strong>and</strong> thus encourage car pooling <strong>and</strong> alternativetransport.Engineering: The PNA’s competition includes school teams. These teams should be actively encouraged totravel to the site together (perhaps in a school bus). This could be achieved through issuing a set number ofparking permits for each team. This will require permits to be produced.Education: Information should be provided on the PNA’s website <strong>and</strong> with team registration to explain how thesystem works <strong>and</strong> why it is in place.Encouragement: Information on the website <strong>and</strong> with the team registration should provide people with alternativetransportation options <strong>and</strong> how schools can organise car pooling. Rewards could be given to those teams /schools that show initiative.Enforcement: To be successful the parking permits will require enforcement (resourcing).Encouraging the use of alternative transportReason: To reduce the number of vehicles accessing the site <strong>and</strong> thus the level of congestion <strong>and</strong> parkingrequirements.Engineering: End of trip facilities including lockers <strong>and</strong> secure cycle parking should be provided. Public transportaccess to the site should be improved.Education: Information on public transport <strong>and</strong> safe cycle routes should be provided on the PNA’s website.Members could be offered personal journey planners. Schools could provide safe cycling courses.Encouragement: Discounts at local cycle shops could be provided with registration. Cycle doctors could set up atsite on some Saturday’s to provide free or cheap cycle servicing.Enforcement: Reduced parking provision will help with enforcement / encouragement.T:\60218676 - <strong>Wembley</strong> PK TA\8 Issued Docs\8.1 Reports\Comprehensive <strong>Integrated</strong> <strong>Access</strong> RevF.docxRevision F - 8 February 2012
AECOM<strong>Wembley</strong> <strong>Sports</strong> <strong>Park</strong> <strong>Integrated</strong> <strong>Access</strong>, <strong>Traffic</strong> <strong>and</strong> <strong>Car</strong> <strong>Park</strong>ing <strong>Plan</strong>456.2 Event People Movement Management <strong>Plan</strong>sA set of traffic <strong>and</strong> people movement plans were developed to manage the use of facilities <strong>and</strong> the movement ofpeople. These plans are show in Appendix C. <strong>Plan</strong>s were developed for the typical events on:1) Monday, Thursday <strong>and</strong> Friday;2) Tuesday <strong>and</strong> Wednesday;3) Saturday <strong>and</strong> Sunday (summer);4) Saturday (winter); <strong>and</strong>5) Sunday (winter).The plans show the flow of vehicles, pedestrians <strong>and</strong> cyclists <strong>and</strong> the use of car parks. They also show thesuggested interventions such as road closures, traffic management of pedestrian crossings <strong>and</strong> real timeinformation signs. These plans are to be:- presented to the various users of the site;- refined if required; <strong>and</strong>- to be agreed upon with the users to control their activities <strong>and</strong> impacts.It is noted that these plans are suggestions only, <strong>and</strong> it should be recognised that the Town of Cambridge wouldhave more in depth underst<strong>and</strong>ing of the situation <strong>and</strong> can plan events accordingly.T:\60218676 - <strong>Wembley</strong> PK TA\8 Issued Docs\8.1 Reports\Comprehensive <strong>Integrated</strong> <strong>Access</strong> RevF.docxRevision F - 8 February 2012
AECOM<strong>Wembley</strong> <strong>Sports</strong> <strong>Park</strong> <strong>Integrated</strong> <strong>Access</strong>, <strong>Traffic</strong> <strong>and</strong> <strong>Car</strong> <strong>Park</strong>ing <strong>Plan</strong>467.0 Conclusion <strong>and</strong> RecommendationsThis transport study generally supports the approved <strong>Wembley</strong> <strong>Sports</strong> <strong>Park</strong> Development Master <strong>Plan</strong>. While thestudy identified that traffic <strong>and</strong> parking dem<strong>and</strong> may exceed capacity during the peak Winter Saturday events,these events are anticipated to be relatively short <strong>and</strong> their impacts are considered to be acceptable. For the vastmajority of its operations, the Master <strong>Plan</strong> provides ample capacity. It is therefore considered to be unreasonable<strong>and</strong> unsustainable to provide more car parking capacity than currently planned. Rather than providing for allparking dem<strong>and</strong>s at all times, it is recognised that alternative measures are required to manage the short dem<strong>and</strong>peaks on Winter Saturdays.Subject to the recommendations outlined below, it is expected that the following traffic solutions will provideadequate access, car parking <strong>and</strong> traffic management facilities for the assumed operations of the <strong>Wembley</strong><strong>Sports</strong> <strong>Park</strong>:- The following access points should be provided: one on Salvado Road (Northern <strong>Access</strong>), one on SelbyStreet opposite Alderbury Street (Main <strong>Access</strong>) <strong>and</strong> the existing left-in / left-out accesses on Selby Street;- The Northern <strong>Access</strong> should be an un-signalised three way intersection with a short left turn lane at the endof the North-South Road;- The Main <strong>Access</strong> at Selby Street / Alderbury Street is proposed to be a four way signalised intersection witha 120m right turn pocket on the southern approach <strong>and</strong> a 35m left turn pocket on the northern approach.Pedestrian <strong>and</strong> cycle crossing facilities are to be provided at this crossing. It is recognised that support fromMain Roads will need to be sought for a traffic signal;- The entire East-West <strong>and</strong> North-South Links are to be provided in Stage 1 to ensure effective internalcirculation during the peak Winter Saturday events. This internal road is to be connected via a roundaboutwhich will give access to car parks <strong>and</strong> accommodate u-turns;- The North-South Road may require speed humps for traffic calming;- Two raised pedestrian crossings are to be provided on the East-West Link on either side of the drop-offfacilities. A barrier is required on the median between the two crossings to prevent pedestrians fromcrossing in the drop-off zone;- A new junction should be provided on the East-West Link into the south western car park. For safetyreasons the right turn movement into the car park should be banned. The kerb line design should indicatethis restriction to drivers. The design should include appropriate pavement markings <strong>and</strong> signs forregulatory <strong>and</strong> enforcement purposes;- One easy access bay (within reasonable distance) should be provided for every 50 regular car parkingspaces;- To reduce the parking dem<strong>and</strong> during the peak Winter Saturday events, Green Travel initiatives should beimplemented for the site, including a development of a TravelSmart plan for the PNA <strong>and</strong> other users of thesite;- Review of the PNA game schedule in consultation with a traffic engineer to spread out the arrival <strong>and</strong>departure traffic or alternatively competitions could be considered spread out on Saturday <strong>and</strong> Sunday;- The traffic <strong>and</strong> people movement plans in this report are to be presented to the various users, they are to berefined if required, <strong>and</strong> they are to be agreed upon with the users of the facilities to control their operations;- Proposed end of trip facilities (including secure cycle parking <strong>and</strong> lockers) should be provided in the StateNetball Centre <strong>and</strong> PNA buildings; <strong>and</strong>- The geometric design of all accesses to the site should include safe <strong>and</strong> efficient connections to the cycle<strong>and</strong> pedestrian paths.T:\60218676 - <strong>Wembley</strong> PK TA\8 Issued Docs\8.1 Reports\Comprehensive <strong>Integrated</strong> <strong>Access</strong> RevF.docxRevision F - 8 February 2012
AECOM<strong>Wembley</strong> <strong>Sports</strong> <strong>Park</strong> <strong>Integrated</strong> <strong>Access</strong>, <strong>Traffic</strong> <strong>and</strong> <strong>Car</strong> <strong>Park</strong>ing <strong>Plan</strong>Appendix AAppendix A - <strong>Traffic</strong> DataT:\60218676 - <strong>Wembley</strong> PK TA\8 Issued Docs\8.1 Reports\Comprehensive <strong>Integrated</strong> <strong>Access</strong> RevD.docxRevision D - 7 October 2011
Event Schedule - Stage 1Day When Event Start TimeGame Time(mins)People per team Other PeopleArrivalDepartureOccupancyPeople perLinkedEnd Time No. Games (incl. coaches <strong>and</strong> (incl. umpires <strong>and</strong>% By <strong>Car</strong>No. <strong>Car</strong>s Max 5minMax 15min Max 5min Max 15minMax 85th PercentileeventTripssubs) spectators)Flow Time Flow Time Flow Time Flow Time Bays Time BaysMonday All Year Netball WA 6:00 180 9:00 4 12 4 112 100% 0% 112Monday All Year Netball WA 9:00 420 16:00 2 12 4 56 100% 0% 56Monday All Year Netball WA 16:00 120 18:00 4 12 4 112 100% 0% 112Monday All Year Netball WA 18:00 240 22:00 4 12 4 112 100% 0% 112Tuesday All Year Netball WA 6:00 180 9:00 2 12 4 56 100% 0% 56Tuesday All Year Netball WA 9:00 420 16:00 2 12 4 56 100% 0% 56Tuesday All Year Netball WA 16:00 120 18:00 4 12 4 112 100% 0% 112Tuesday Oct to March Baseball Seniors - training 16:30 180 19:30 4 10 2 88 100% 0% 88Tuesday All Year Netball WA 18:00 240 22:00 4 12 4 112 100% 0% 112Wednesday All Year Netball WA 6:00 180 9:00 4 12 4 112 100% 0% 112Wednesday All Year Netball WA 9:00 420 16:00 2 12 4 56 100% 0% 56Wednesday All Year Netball WA 16:00 120 18:00 4 12 4 112 100% 0% 112Wednesday Oct to March Baseball Juniors - training 16:30 120 18:30 2 10 2 44 100% 0% 44Wednesday Oct to Dec PNA Under 17s 17:45 69 18:55 7 12 4 196 100% 0% 196Wednesday All Year Netball WA 18:00 240 22:00 4 12 4 112 100% 0% 112Wednesday Oct to Dec PNA Open 19:00 69 20:10 9 12 4 252 100% 0% 252Wednesday Oct to Dec PNA Open 20:30 69 21:40 9 12 4 252 100% 0% 252Thursday All Year Netball WA 6:00 180 9:00 2 12 4 56 100% 0% 56Thursday All Year Netball WA 9:00 420 16:00 2 12 4 56 100% 0% 56Thursday All Year Netball WA 16:00 120 18:00 2 12 4 56 100% 0% 56Thursday Oct to March Baseball Seniors - training 16:30 300 21:30 4 10 2 88 100% 0% 88Thursday All Year Netball WA 18:00 240 22:00 4 12 4 112 100% 0% 112Friday All Year Netball WA 16:00 120 18:00 4 12 4 112 100% 0% 112Friday All Year Netball WA 18:00 240 22:00 4 12 4 112 100% 0% 112Saturday All Year Netball WA 9:00 420 16:00 4 12 4 112 100% 0% 112Saturday Oct to March Baseball Little League 10:00 90 11:30 1 10 2 22 100% 0% 22Saturday Oct to March Cricket 12:45 300 17:45 1 12 3 27 100% 0% 27Saturday Oct to March Baseball 15s 13:00 120 15:00 1 10 2 22 100% 0% 22Saturday Oct to March Cricket 13:00 300 18:00 1 12 3 27 100% 0% 27Saturday Oct to March Cricket 13:15 300 18:15 1 12 3 27 100% 0% 27Saturday Oct to March Cricket 13:30 300 18:30 1 12 3 27 100% 0% 27Saturday Oct to March Baseball State League 15:30 120 17:30 1 10 2 22 100% 0% 22Saturday Oct to March Baseball 17s 16:00 120 18:00 1 10 2 22 100% 0% 22Saturday May to Sep PNA Netta Yr 3 8:15 49 9:05 17 12 4 476 65% 40% 214Saturday May to Sep PNA Sub Junior Yr 5 8:15 57 9:10 24 12 4 672 65% 40% 302Saturday May to Sep PNA Netta Yr 4 9:15 49 10:05 15 12 4 420 65% 40% 189Saturday May to Sep PNA Sub Junior Yr 6 9:15 57 10:10 26 12 4 728 65% 40% 328Saturday May to Sep PNA Netta Yr 3&4 10:15 49 11:05 17 12 4 476 65% 35% 226Saturday May to Sep PNA Sub Junior Yr 7 10:15 69 11:25 24 12 4 672 65% 35% 319Saturday April to August Australian Rules Football Colt 10:45 101 12:25 1 24 13 61 100% 0% 61Saturday May to Sep PNA Under 17s 11:30 69 12:40 30 12 4 840 50% 30% 294Saturday April to August Australian Rules Football Reserves 12:30 101 14:10 1 24 13 61 100% 0% 61Saturday May to Sep PNA Under 17s 13:00 69 14:10 36 12 4 1008 60% 40% 403Saturday May to Sep PNA Under 17s 14:30 69 15:40 14 12 4 392 60% 40% 157Saturday May to Sep PNA Open 14:30 69 15:40 27 12 4 756 70% 30% 416Saturday April to August Australian Rules Football seniors 14:30 101 16:10 1 24 13 61 100% 0% 61Saturday May to Sep PNA Under 17s 16:00 69 17:10 14 12 4 392 60% 40% 157Saturday May to Sep PNA Open 16:00 69 17:10 27 12 4 756 70% 30% 416Sunday All Year Archery 8:45 12:00 1 22 1 45 100% 0% 45Sunday All Year Netball WA 9:00 420 16:00 4 12 4 112 100% 0% 112Sunday Oct to March Baseball AAA 9:30 150 12:00 1 10 2 22 100% 0% 22Sunday Oct to March Baseball Under 19 9:30 120 11:30 1 10 2 22 100% 0% 22Sunday Oct to March Baseball AAA 12:00 150 14:30 1 10 2 22 100% 0% 22Sunday Oct to March Baseball A Grade 12:00 120 14:00 1 10 2 22 100% 0% 22Sunday Oct to March Baseball State League 15:15 120 17:15 1 10 2 22 100% 0% 22Sunday All Year Netball WA 16:00 120 18:00 4 12 4 112 100% 0% 112Sunday All Year Netball WA 18:00 240 19:00 4 12 4 112 100% 0% 112Sunday April to Sep SOCCER 13s 8:30 67.5 9:40 1 15 4 34 100% 0% 34Sunday April to Sep SOCCER 11s 8:30 67.5 9:40 1 13 4 30 100% 0% 30Sunday May to August Australian Rules Football 11s 8:45 60 9:45 1 24 13 61 100% 0% 61Sunday May to August Australian Rules Football Year 4s 8:45 60 9:45 1 24 13 61 100% 0% 61Sunday All Year Archery 8:45 12:00 1 22 1 45 100% 0% 45Sunday All Year Netball WA 9:00 420 16:00 4 12 4 112 100% 0% 112Sunday April to Sep SOCCER Under 9s 9:00 55 9:55 1 11 4 26 100% 0% 26Sunday April to Sep SOCCER Under 8s 9:00 45 9:45 1 11 4 26 100% 0% 26Sunday April to Sep SOCCER 12s 9:40 67.5 10:50 1 15 4 34 100% 0% 34Sunday April to Sep SOCCER 15s 9:40 67.5 10:50 1 15 4 34 100% 0% 34Sunday April to Sep SOCCER 13s 9:45 67.5 10:55 1 15 4 34 100% 0% 34Sunday May to August Australian Rules Football Year 5s 10:00 60 11:00 1 24 13 61 100% 0% 61Sunday May to August Australian Rules Football 12s 10:00 60 11:00 1 24 13 61 100% 0% 61Sunday April to Sep SOCCER Under 8s 10:00 45 10:45 2 11 4 52 100% 0% 52Sunday April to Sep SOCCER Under 8s 11:00 45 11:45 1 11 4 26 100% 0% 26Sunday April to Sep SOCCER Under 9s 11:00 55 11:55 1 11 4 26 100% 0% 26Sunday April to Sep SOCCER 16s 11:10 67.5 12:20 1 15 4 34 100% 0% 34Sunday May to August Australian Rules Football 13s 11:30 60 12:30 1 24 13 61 100% 0% 61Sunday All Year Netball WA 16:00 120 18:00 4 12 4 112 100% 0% 112Sunday All Year Netball WA 18:00 240 19:00 4 12 4 112 100% 0% 11219 05:35 05:40 54 05:3019 15:35 15:40 54 15:30 15:45 22 18:15 18:204519 15:35 15:40 54 15:30 15:45 221908:3508:4005:45 22 09:15 09:20 65 09:10 09:25 229 17:55 12517:30 17:35 132 17:20 17:35 57 22:00 22:05 159 21:55 22:10 560 18:50 37219 17:35 17:40 54 17:30 17:45 221082414:0514:1022:1518:1522:2018:2022:1022:2517:5554 08:30 08:45 22 16:15 16:20 65 16:10 16:25 271 15:55 24830514:0014:1511415:5508:30 08:35 70 08:25 08:40 22 16:15 16:20 65 16:10 16:25 252 15:55 20350 08:25 08:30 148 08:20 08:35 53 11:10 11:15 142 11:05 11:20 621 09:45 39116:0065656533718:1018:1015:5018:2518:2516:053152582261,02117:5517:5510:05202203117869T:\60218676 - <strong>Wembley</strong> PK TA\4 Tech work area\4.3 Engineering\Revised Calcs Jan 12\60218676_Trip Generation (design) 2012-01-30_AK_forecast.xlsx
Event Schedule - Stage 2Day When Event Start TimeGame Time(mins)People per team Other PeopleArrivalDepartureOccupancyPeople perLinkedEnd Time No. Games (incl. coaches <strong>and</strong> (incl. umpires <strong>and</strong>% By <strong>Car</strong>No. <strong>Car</strong>s Max 5minMax 15min Max 5min Max 15minMax 85th PercentileeventTripssubs) spectators)Flow Time Flow Time Flow Time Flow Time Bays Time BaysMonday All Year Netball WA 6:00 180 9:00 4 12 4 112 100% 0% 112Monday All Year Netball WA 9:00 420 16:00 2 12 4 56 100% 0% 56Monday All Year Netball WA 16:00 120 18:00 4 12 4 112 100% 0% 112Monday All Year Netball WA 18:00 240 22:00 4 12 4 112 100% 0% 112Tuesday All Year Netball WA 6:00 180 9:00 2 12 4 56 100% 0% 56Tuesday All Year Netball WA 9:00 420 16:00 2 12 4 56 100% 0% 56Tuesday All Year Netball WA 16:00 120 18:00 4 12 4 112 100% 0% 112Tuesday Oct to March Baseball Seniors - training 16:30 180 19:30 4 10 2 88 100% 0% 88Tuesday All Year Netball WA 18:00 240 22:00 4 12 4 112 100% 0% 112Wednesday All Year Netball WA 6:00 180 9:00 4 12 4 112 100% 0% 112Wednesday All Year Netball WA 9:00 420 16:00 2 12 4 56 100% 0% 56Wednesday All Year Netball WA 16:00 120 18:00 4 12 4 112 100% 0% 112Wednesday Oct to March Baseball Juniors - training 16:30 120 18:30 2 10 2 44 100% 0% 44Wednesday Oct to Dec PNA Under 17s 17:45 69 18:55 7 12 4 196 100% 0% 196Wednesday All Year Netball WA 18:00 240 22:00 4 12 4 112 100% 0% 112Wednesday Oct to Dec PNA Open 19:00 69 20:10 9 12 4 252 100% 0% 252Wednesday Oct to Dec PNA Open 20:30 69 21:40 9 12 4 252 100% 0% 252Thursday All Year Netball WA 6:00 180 9:00 2 12 4 56 100% 0% 56Thursday All Year Netball WA 9:00 420 16:00 2 12 4 56 100% 0% 56Thursday All Year Netball WA 16:00 120 18:00 2 12 4 56 100% 0% 56Thursday Oct to March Baseball Seniors - training 16:30 300 21:30 4 10 2 88 100% 0% 88Thursday All Year Netball WA 18:00 240 22:00 4 12 4 112 100% 0% 112Friday All Year Netball WA 16:00 120 18:00 4 12 4 112 100% 0% 112Friday All Year Netball WA 18:00 240 22:00 4 12 4 112 100% 0% 112Saturday All Year Netball WA 9:00 420 16:00 4 12 4 112 100% 0% 112Saturday Oct to March Baseball Little League 10:00 90 11:30 1 10 2 22 100% 0% 22Saturday Oct to March Cricket 12:45 300 17:45 1 12 3 27 100% 0% 27Saturday Oct to March Baseball 15s 13:00 120 15:00 1 10 2 22 100% 0% 22Saturday Oct to March Cricket 13:00 300 18:00 1 12 3 27 100% 0% 27Saturday Oct to March Cricket 13:15 300 18:15 1 12 3 27 100% 0% 27Saturday Oct to March Cricket 13:30 300 18:30 1 12 3 27 100% 0% 27Saturday Oct to March Baseball State League 15:30 120 17:30 1 10 2 22 100% 0% 22Saturday Oct to March Baseball 17s 16:00 120 18:00 1 10 2 22 100% 0% 22Saturday May to Sep PNA Netta Yr 3 8:15 49 9:05 17 12 4 476 65% 40% 214Saturday May to Sep PNA Sub Junior Yr 5 8:15 57 9:10 24 12 4 672 65% 40% 302Saturday May to Sep PNA Netta Yr 4 9:15 49 10:05 15 12 4 420 65% 40% 189Saturday May to Sep PNA Sub Junior Yr 6 9:15 57 10:10 26 12 4 728 65% 40% 328Saturday May to Sep PNA Netta Yr 3&4 10:15 49 11:05 17 12 4 476 65% 35% 226Saturday May to Sep PNA Sub Junior Yr 7 10:15 69 11:25 24 12 4 672 65% 35% 319Saturday April to August Australian Rules Football Colt 10:45 101 12:25 1 24 13 61 100% 0% 61Saturday May to Sep PNA Under 17s 11:30 69 12:40 30 12 4 840 50% 30% 294Saturday April to August Australian Rules Football Reserves 12:30 101 14:10 1 24 13 61 100% 0% 61Saturday May to Sep PNA Under 17s 13:00 69 14:10 36 12 4 1008 60% 40% 403Saturday May to Sep PNA Under 17s 14:30 69 15:40 14 12 4 392 60% 40% 157Saturday May to Sep PNA Open 14:30 69 15:40 27 12 4 756 70% 30% 416Saturday April to August Australian Rules Football seniors 14:30 101 16:10 2 24 13 122 100% 0% 122Saturday May to Sep PNA Under 17s 16:00 69 17:10 14 12 4 392 60% 40% 157Saturday May to Sep PNA Open 16:00 69 17:10 27 12 4 756 70% 30% 416Sunday All Year Archery 8:45 12:00 1 22 1 45 100% 0% 45Sunday All Year Netball WA 9:00 420 16:00 4 12 4 112 100% 0% 112Sunday Oct to March Baseball AAA 9:30 150 12:00 1 10 2 22 100% 0% 22Sunday Oct to March Baseball Under 19 9:30 120 11:30 1 10 2 22 100% 0% 22Sunday Oct to March Baseball AAA 12:00 150 14:30 1 10 2 22 100% 0% 22Sunday Oct to March Baseball A Grade 12:00 120 14:00 1 10 2 22 100% 0% 22Sunday Oct to March Baseball State League 15:15 120 17:15 1 10 2 22 100% 0% 22Sunday All Year Netball WA 16:00 120 18:00 4 12 4 112 100% 0% 112Sunday All Year Netball WA 18:00 240 19:00 4 12 4 112 100% 0% 112Sunday April to Sep SOCCER 13s 8:30 67.5 9:40 1 15 4 34 100% 0% 34Sunday April to Sep SOCCER 11s 8:30 67.5 9:40 1 13 4 30 100% 0% 30Sunday May to August Australian Rules Football 11s 8:45 60 9:45 1 24 13 61 100% 0% 61Sunday May to August Australian Rules Football Year 4s 8:45 60 9:45 1 24 13 61 100% 0% 61Sunday All Year Archery 8:45 12:00 1 22 1 45 100% 0% 45Sunday All Year Netball WA 9:00 420 16:00 4 12 4 112 100% 0% 112Sunday April to Sep SOCCER Under 9s 9:00 55 9:55 1 11 4 26 100% 0% 26Sunday April to Sep SOCCER Under 8s 9:00 45 9:45 1 11 4 26 100% 0% 26Sunday April to Sep SOCCER 12s 9:40 67.5 10:50 1 15 4 34 100% 0% 34Sunday April to Sep SOCCER 15s 9:40 67.5 10:50 1 15 4 34 100% 0% 34Sunday April to Sep SOCCER 13s 9:45 67.5 10:55 1 15 4 34 100% 0% 34Sunday May to August Australian Rules Football Year 5s 10:00 60 11:00 1 24 13 61 100% 0% 61Sunday May to August Australian Rules Football 12s 10:00 60 11:00 1 24 13 61 100% 0% 61Sunday April to Sep SOCCER Under 8s 10:00 45 10:45 2 11 4 52 100% 0% 52Sunday April to Sep SOCCER Under 8s 11:00 45 11:45 1 11 4 26 100% 0% 26Sunday April to Sep SOCCER Under 9s 11:00 55 11:55 1 11 4 26 100% 0% 26Sunday April to Sep SOCCER 16s 11:10 67.5 12:20 1 15 4 34 100% 0% 34Sunday May to August Australian Rules Football 13s 11:30 60 12:30 1 24 13 61 100% 0% 61Sunday All Year Netball WA 16:00 120 18:00 4 12 4 112 100% 0% 112Sunday All Year Netball WA 18:00 240 19:00 4 12 4 112 100% 0% 11219 05:35 05:40 54 05:3019 15:35 15:40 54 15:30 15:45 22 18:15 18:204519 15:35 15:40 54 15:30 15:45 221908:3508:4005:45 22 09:15 09:20 65 09:10 09:25 229 17:55 12517:30 17:35 132 17:20 17:35 57 22:00 22:05 159 21:55 22:10 560 18:50 37219 17:35 17:40 54 17:30 17:45 221192414:0514:1022:1518:1522:2018:2022:1022:2517:5554 08:30 08:45 22 16:15 16:20 65 16:10 16:25 271 15:55 24833514:0014:1511415:5508:30 08:35 70 08:25 08:40 22 16:15 16:20 65 16:10 16:25 252 15:55 20350 08:25 08:30 148 08:20 08:35 53 11:10 11:15 142 11:05 11:20 621 09:45 39116:0065656533718:1018:1015:5018:2518:2516:053152582261,07017:5517:5515:45202203117890T:\60218676 - <strong>Wembley</strong> PK TA\4 Tech work area\4.3 Engineering\Revised Calcs Jan 12\60218676_Trip Generation (design) 2012-01-30_AK_forecast_Stage2.xlsx
AECOM<strong>Wembley</strong> <strong>Sports</strong> <strong>Park</strong> <strong>Integrated</strong> <strong>Access</strong>, <strong>Traffic</strong> <strong>and</strong> <strong>Car</strong> <strong>Park</strong>ing <strong>Plan</strong>Appendix BAppendix B - <strong>Traffic</strong>Analysis ResultsT:\60218676 - <strong>Wembley</strong> PK TA\8 Issued Docs\8.1 Reports\Comprehensive <strong>Integrated</strong> <strong>Access</strong> RevD.docxRevision D - 7 October 2011
Main Entrance Opening <strong>Traffic</strong> Peak Hour – Winter Sat [9:00-10:00]Layout<strong>Traffic</strong>AECOMOptimum Cycle Time, 110s CycleA 31, B 31, C 21, D 27Movement SummaryMovement Performance - VehiclesMov ID Turn Dem<strong>and</strong>FlowHV Deg. SatnAverageDelayLevel ofService95% Back of Queue Prop. EffectiveVehicles Distance Queued Stop RateAverageSpeedveh/h % v/c sec veh m per veh km/hSouth: Selby St (South)1 L 48 3.0 0.863 59.9 LOS E 22.4 160.9 1.00 0.99 22.82 T 699 3.0 0.862 52.3 LOS D 22.5 161.7 1.00 0.99 23.63 R 371 0.0 0.879 61.3 LOS E 22.9 160.0 1.00 0.96 21.0Approach 1118 2.0 0.879 55.6 LOS E 22.9 161.7 1.00 0.98 22.7East: WSP <strong>Access</strong>4 L 188 0.0 1.000 3 34.0 LOS C 7.5 52.3 1.00 0.81 25.56 R 494 0.0 0.844 58.6 LOS E 18.3 128.4 0.98 0.97 19.8Approach 681 0.0 1.000 51.9 LOS D 18.3 128.4 0.99 0.93 21.1North: Selby St (North)7 L 187 0.0 0.518 18.8 LOS B 5.2 36.3 0.68 0.76 37.98 T 836 3.0 0.961 68.6 LOS E 28.7 205.8 1.00 1.12 20.19 R 84 2.0 0.282 45.5 LOS D 5.1 36.0 0.85 0.77 26.0Approach 1107 2.4 0.961 58.4 LOS E 28.7 205.8 0.94 1.03 22.1West: Alderbury St10 L 48 3.0 0.242 54.1 LOS D 4.2 29.9 0.93 0.76 22.612 R 12 3.0 0.242 53.9 LOS D 4.2 29.9 0.93 0.75 22.6Approach 60 3.0 0.242 54.0 LOS D 4.2 29.9 0.93 0.75 22.6All Vehicles 2966 1.7 1.000 55.8 LOS E 28.7 205.8 0.97 0.98 22.1t:\60218676 - wembley pk ta\4 tech work area\4.3 engineering\sidra\60218676_sidra results 2012-01-27.doc 1 / 19
AECOMMain Entrance Opening <strong>Traffic</strong> Peak Hour – Winter Sat [11:00-12:00]Layout<strong>Traffic</strong>Optimum Cycle Time, 110s CycleA 23, B 39, C 21, D 27Movement SummaryMovement Performance - VehiclesMov ID Turn Dem<strong>and</strong>FlowHV Deg. SatnAverageDelayLevel ofService95% Back of Queue Prop. EffectiveVehicles Distance Queued Stop RateAverageSpeedveh/h % v/c sec veh m per veh km/hSouth: Selby St (South)1 L 16 3.0 0.871 54.9 LOS D 28.8 206.7 1.00 1.00 24.32 T 977 3.0 0.866 47.4 LOS D 28.8 206.9 1.00 1.00 25.03 R 257 0.0 0.895 68.0 LOS E 17.0 118.7 1.00 0.97 19.6Approach 1250 2.4 0.895 51.7 LOS D 28.8 206.9 1.00 0.99 23.7East: WSP <strong>Access</strong>4 L 152 0.0 0.911 41.2 LOS D 7.5 52.3 0.90 0.83 23.66 R 303 0.0 0.517 48.5 LOS D 10.7 74.8 0.93 0.79 21.7Approach 455 0.0 0.910 46.1 LOS D 10.7 74.8 0.92 0.81 22.3North: Selby St (North)7 L 130 0.0 0.294 15.5 LOS B 2.9 20.2 0.58 0.73 40.48 T 1049 3.0 0.914 54.4 LOS D 32.7 235.0 1.00 1.07 23.29 R 144 2.2 0.509 55.3 LOS E 9.0 64.1 0.97 0.80 23.2Approach 1322 2.6 0.914 50.6 LOS D 32.7 235.0 0.95 1.00 24.1West: Alderbury St10 L 48 3.0 0.243 54.1 LOS D 4.2 29.9 0.93 0.76 22.612 R 12 3.0 0.243 53.9 LOS D 4.2 29.9 0.93 0.75 22.6Approach 60 3.0 0.242 54.0 LOS D 4.2 29.9 0.93 0.76 22.6All Vehicles 3087 2.1 0.914 50.5 LOS D 32.7 235.0 0.97 0.97 23.6t:\60218676 - wembley pk ta\4 tech work area\4.3 engineering\sidra\60218676_sidra results 2012-01-27.doc 2 / 19
AECOMMain Entrance (no ped call) Opening <strong>Traffic</strong> Peak Hour – Winter Sat [11:00-12:00]Layout<strong>Traffic</strong>Optimum Cycle Time, 70s CycleA 14, B 30, C 12, D 14Movement SummaryMovement Performance - VehiclesMov ID Turn Dem<strong>and</strong>FlowHV Deg. SatnAverageDelayLevel ofService95% Back of Queue Prop. EffectiveVehicles Distance Queued Stop RateAverageSpeedveh/h % v/c sec veh m per veh km/hSouth: Selby St (South)1 L 16 3.0 0.747 33.7 LOS C 18.9 135.4 0.94 0.93 32.22 T 977 3.0 0.742 26.2 LOS C 18.9 135.6 0.94 0.86 33.13 R 257 0.0 0.790 45.6 LOS D 12.3 85.9 1.00 0.92 25.1Approach 1250 2.4 0.790 30.2 LOS C 18.9 135.6 0.95 0.87 31.2East: WSP <strong>Access</strong>4 L 152 0.0 0.745 30.9 LOS C 6.5 45.2 0.75 0.87 26.56 R 303 0.0 0.816 49.8 LOS D 8.3 58.0 1.00 0.98 21.5Approach 455 0.0 0.816 43.5 LOS D 8.3 58.0 0.92 0.94 22.9North: Selby St (North)7 L 130 0.0 0.272 14.6 LOS B 2.6 18.4 0.62 0.73 41.28 T 1049 3.0 0.783 28.1 LOS C 20.7 148.6 0.96 0.90 32.29 R 144 2.2 0.450 41.1 LOS D 6.8 48.6 0.94 0.80 27.4Approach 1322 2.6 0.783 28.2 LOS C 20.7 148.6 0.92 0.88 32.2West: Alderbury St10 L 48 3.0 0.441 48.4 LOS D 3.5 25.1 0.99 0.75 24.012 R 12 3.0 0.441 48.3 LOS D 3.5 25.1 0.99 0.75 24.0Approach 60 3.0 0.441 48.4 LOS D 3.5 25.1 0.99 0.75 24.0All Vehicles 3087 2.1 0.816 31.7 LOS C 20.7 148.6 0.94 0.88 29.8t:\60218676 - wembley pk ta\4 tech work area\4.3 engineering\sidra\60218676_sidra results 2012-01-27.doc 3 / 19
AECOMMain Entrance Opening <strong>Traffic</strong> Peak Hour – Winter Sat [14:00-15:00]Layout<strong>Traffic</strong>Optimum Cycle Time, 110s CycleA 30, B 32, C 21, D 27Movement SummaryMovement Performance - VehiclesMov ID Turn Dem<strong>and</strong>FlowHV Deg. SatnAverageDelayLevel ofService95% Back of Queue Prop. EffectiveVehicles Distance Queued Stop RateAverageSpeedveh/h % v/c sec veh m per veh km/hSouth: Selby St (South)1 L 20 3.0 0.962 75.0 LOS E 29.5 211.6 1.00 1.12 19.72 T 846 3.0 0.958 67.4 LOS E 29.5 212.0 1.00 1.12 20.33 R 388 0.0 0.958 75.5 LOS E 26.7 186.7 1.00 1.03 18.3Approach 1254 2.1 0.958 70.1 LOS E 29.5 212.0 1.00 1.09 19.7East: WSP <strong>Access</strong>4 L 185 0.0 0.999 34.5 LOS C 7.5 52.3 1.00 0.81 25.46 R 491 0.0 0.840 58.3 LOS E 18.2 127.5 0.98 0.97 19.8Approach 676 0.0 1.000 51.8 LOS D 18.2 127.5 0.99 0.93 21.1North: Selby St (North)7 L 194 0.0 0.526 18.4 LOS B 5.3 36.8 0.68 0.76 38.28 T 882 3.0 0.975 71.6 LOS E 30.9 221.9 1.00 1.15 19.69 R 132 2.3 0.448 47.5 LOS D 7.7 54.9 0.89 0.79 25.3Approach 1208 2.4 0.975 60.4 LOS E 30.9 221.9 0.94 1.05 21.7West: Alderbury St10 L 56 3.0 0.273 54.3 LOS D 4.6 33.3 0.94 0.76 22.512 R 12 3.0 0.272 54.2 LOS D 4.6 33.3 0.94 0.76 22.5Approach 68 3.0 0.272 54.3 LOS D 4.6 33.3 0.94 0.76 22.5All Vehicles 3205 1.8 1.000 62.2 LOS E 30.9 221.9 0.97 1.03 20.7t:\60218676 - wembley pk ta\4 tech work area\4.3 engineering\sidra\60218676_sidra results 2012-01-27.doc 4 / 19
AECOMMain Entrance [with Salvado Overflow] Opening <strong>Traffic</strong> Peak Hour – Winter Sat [14:00-15:00]Layout<strong>Traffic</strong>Optimum Cycle Time, 110s CycleA 29, B 32, C 21, D 28Movement SummaryMovement Performance - VehiclesMov ID Turn Dem<strong>and</strong>FlowHV Deg. SatnAverageDelayLevel ofService95% Back of Queue Prop. EffectiveVehicles Distance Queued Stop RateAverageSpeedveh/h % v/c sec veh m per veh km/hSouth: Selby St (South)1 L 20 3.0 0.962 75.0 LOS E 29.5 211.6 1.00 1.12 19.72 T 846 3.0 0.958 67.4 LOS E 29.5 212.0 1.00 1.12 20.33 R 388 0.0 1.000 3 87.1 LOS F 28.6 200.1 1.00 1.08 16.5Approach 1254 2.1 1.000 73.6 LOS E 29.5 212.0 1.00 1.11 19.0East: WSP <strong>Access</strong>4 L 185 0.0 0.999 34.5 LOS C 7.5 52.3 1.00 0.81 25.46 R 587 0.0 0.970 68.1 LOS E 25.3 177.4 0.99 1.02 18.2Approach 771 0.0 1.000 60.1 LOS E 25.3 177.4 0.99 0.97 19.5North: Selby St (North)7 L 194 0.0 0.515 18.0 LOS B 5.1 35.9 0.67 0.76 38.58 T 882 3.0 0.975 71.6 LOS E 30.9 221.9 1.00 1.15 19.69 R 132 2.3 0.453 48.5 LOS D 7.8 55.5 0.90 0.79 25.0Approach 1208 2.4 0.975 60.5 LOS E 30.9 221.9 0.94 1.05 21.7West: Alderbury St10 L 56 3.0 0.273 54.3 LOS D 4.6 33.3 0.94 0.76 22.512 R 12 3.0 0.272 54.2 LOS D 4.6 33.3 0.94 0.76 22.5Approach 68 3.0 0.272 54.3 LOS D 4.6 33.3 0.94 0.76 22.5All Vehicles 3300 1.7 1.000 65.3 LOS E 30.9 221.9 0.97 1.05 20.1t:\60218676 - wembley pk ta\4 tech work area\4.3 engineering\sidra\60218676_sidra results 2012-01-27.doc 5 / 19
AECOMMain Entrance [with Salvado Overflow] [No Ped Call] Opening <strong>Traffic</strong> Peak Hour – Winter Sat [14:00-15:00]Layout<strong>Traffic</strong>Optimum Cycle Time, 85s CycleA 25, B 27, C 12, D 21Movement SummaryMovement Performance - VehiclesMov ID Turn Dem<strong>and</strong>FlowHV Deg. SatnAverageDelayLevel ofService95% Back of Queue Prop. EffectiveVehicles Distance Queued Stop RateAverageSpeedveh/h % v/c sec veh m per veh km/hSouth: Selby St (South)1 L 20 3.0 0.920 55.6 LOS E 22.5 161.8 1.00 1.09 24.12 T 846 3.0 0.917 48.1 LOS D 22.6 162.2 1.00 1.09 24.83 R 388 0.0 0.935 59.3 LOS E 21.1 148.0 1.00 1.04 21.4Approach 1254 2.1 0.935 51.7 LOS D 22.6 162.2 1.00 1.07 23.7East: WSP <strong>Access</strong>4 L 226 0.0 0.969 28.4 LOS C 7.5 52.3 0.96 0.82 27.36 R 545 0.0 0.898 52.9 LOS D 15.8 110.4 1.00 1.05 20.8Approach 771 0.0 0.970 45.7 LOS D 15.8 110.4 0.99 0.98 22.4North: Selby St (North)7 L 194 0.0 0.471 16.5 LOS B 4.6 32.5 0.68 0.76 39.68 T 882 3.0 0.933 50.8 LOS D 23.6 169.2 1.00 1.11 24.19 R 132 2.3 0.364 38.4 LOS D 6.2 44.3 0.88 0.79 28.4Approach 1208 2.4 0.933 43.9 LOS D 23.6 169.2 0.94 1.02 26.0West: Alderbury St10 L 56 3.0 0.526 51.8 LOS D 4.1 29.8 1.00 0.76 23.112 R 12 3.0 0.526 51.6 LOS D 4.1 29.8 1.00 0.76 23.1Approach 68 3.0 0.526 51.7 LOS D 4.1 29.8 1.00 0.76 23.1All Vehicles 3300 1.7 0.970 47.5 LOS D 23.6 169.2 0.97 1.03 24.1t:\60218676 - wembley pk ta\4 tech work area\4.3 engineering\sidra\60218676_sidra results 2012-01-27.doc 6 / 19
AECOMMain EntranceLayoutOpening <strong>Traffic</strong> Weekday AM Peak<strong>Traffic</strong>Optimum Cycle Time, 140s CycleA 19, B 61, C 15, D 21Movement Summaryt:\60218676 - wembley pk ta\4 tech work area\4.3 engineering\sidra\60218676_sidra results 2012-01-27.doc 7 / 19
AECOMMain Entrance (no ped call)LayoutOpening <strong>Traffic</strong> Weekday AM Peak<strong>Traffic</strong>Optimum Cycle Time, 90s CycleA 13, B 41, C 6, D 6Movement Summaryt:\60218676 - wembley pk ta\4 tech work area\4.3 engineering\sidra\60218676_sidra results 2012-01-27.doc 8 / 19
Main EntranceLayoutOpening <strong>Traffic</strong> Weekday PM Peak<strong>Traffic</strong>AECOMOptimum Cycle Time, 150s CycleA 20, B 70, C 15, D 21Movement Summaryt:\60218676 - wembley pk ta\4 tech work area\4.3 engineering\sidra\60218676_sidra results 2012-01-27.doc 9 / 19
AECOMMain Entrance (no ped call)LayoutOpening <strong>Traffic</strong> Weekday PM Peak<strong>Traffic</strong>Optimum Cycle Time, 90s CycleA 12, B 42, C 6, D 6Movement Summaryt:\60218676 - wembley pk ta\4 tech work area\4.3 engineering\sidra\60218676_sidra results 2012-01-27.doc 10 / 19
AECOMMain Entrance Opening <strong>Traffic</strong> Peak Hour – Winter Sat [11:00-12:00]Layout<strong>Traffic</strong>Movement SummaryMovement Performance - VehiclesMov ID Turn Dem<strong>and</strong>FlowHV Deg. SatnAverageDelayLevel ofService95% Back of Queue Prop. EffectiveVehicles Distance Queued Stop RateAverageSpeedveh/h % v/c sec veh m per veh km/hSouth: Selby St (South)1 L 16 3.0 0.613 8.2 LOS A 6.6 47.3 0.75 0.82 47.82 T 977 3.0 0.614 8.1 LOS A 6.6 47.3 0.76 0.78 47.53 R 257 0.0 0.614 12.8 LOS B 6.5 45.9 0.77 0.94 43.6Approach 1250 2.4 0.614 9.1 LOS B 6.6 47.3 0.76 0.81 46.7East: WSP <strong>Access</strong>4 L 152 0.0 0.360 6.6 LOS A 2.6 18.0 0.81 0.78 36.36 R 303 0.0 0.360 13.5 LOS B 2.6 18.0 0.80 0.96 34.6Approach 455 0.0 0.360 11.2 LOS B 2.6 18.0 0.80 0.90 35.1North: Selby St (North)7 L 130 0.0 0.564 6.1 LOS A 6.0 42.5 0.66 0.59 48.48 T 1049 3.0 0.565 6.3 LOS A 6.0 42.5 0.67 0.57 48.29 R 144 2.2 0.564 12.8 LOS B 5.8 41.3 0.68 0.81 45.3Approach 1322 2.6 0.565 7.0 LOS B 6.0 42.5 0.67 0.60 47.8West: Alderbury St10 L 48 3.0 0.136 10.4 LOS B 0.8 6.0 0.81 0.88 41.112 R 12 3.0 0.135 16.4 LOS B 0.8 6.0 0.81 0.97 38.8Approach 60 3.0 0.136 11.6 LOS B 0.8 6.0 0.81 0.90 40.6All Vehicles 3087 2.1 0.614 8.5 LOS A 6.6 47.3 0.73 0.74 44.7Practical Capacity occurs at 124% flow scalet:\60218676 - wembley pk ta\4 tech work area\4.3 engineering\sidra\60218676_sidra results 2012-01-27.doc 11 / 19
AECOMMain Entrance [with Salvado Overflow] Opening <strong>Traffic</strong> Peak Hour – Winter Sat [14:00-15:00]Layout<strong>Traffic</strong>Movement SummaryMovement Performance - VehiclesMov ID Turn Dem<strong>and</strong>FlowHV Deg. SatnAverageDelayLevel ofService95% Back of Queue Prop. EffectiveVehicles Distance Queued Stop RateAverageSpeedveh/h % v/c sec veh m per veh km/hSouth: Selby St (South)1 L 20 3.0 0.741 11.6 LOS B 9.5 68.4 0.91 1.08 45.42 T 846 3.0 0.739 11.6 LOS B 9.5 68.4 0.91 1.07 45.33 R 388 0.0 0.739 16.9 LOS B 9.0 63.7 0.92 1.13 39.9Approach 1254 2.1 0.739 13.2 LOS B 9.5 68.4 0.91 1.09 43.5East: WSP <strong>Access</strong>4 L 226 0.0 0.577 8.2 LOS A 5.3 36.9 0.87 1.01 35.96 R 545 0.0 0.577 15.2 LOS B 5.3 36.9 0.87 1.07 33.8Approach 771 0.0 0.577 13.1 LOS B 5.3 36.9 0.87 1.05 34.3North: Selby St (North)7 L 194 0.0 0.599 7.8 LOS A 7.1 50.7 0.81 0.78 47.48 T 882 3.0 0.600 8.1 LOS A 7.1 50.7 0.81 0.77 47.19 R 132 2.3 0.599 14.8 LOS B 7.0 49.9 0.82 0.91 43.8Approach 1208 2.4 0.600 8.8 LOS B 7.1 50.7 0.81 0.79 46.7West: Alderbury St10 L 56 3.0 0.180 12.1 LOS B 1.1 8.2 0.85 0.91 39.812 R 12 3.0 0.179 18.1 LOS B 1.1 8.2 0.85 0.97 37.7Approach 68 3.0 0.180 13.2 LOS B 1.1 8.2 0.85 0.92 39.4All Vehicles 3300 1.7 0.739 11.6 LOS B 9.5 68.4 0.86 0.97 41.7t:\60218676 - wembley pk ta\4 tech work area\4.3 engineering\sidra\60218676_sidra results 2012-01-27.doc 12 / 19
AECOMSelby Street Lin/Lout Opening <strong>Traffic</strong> Peak Hour – Winter Sat [9:00-10:00]Layout<strong>Traffic</strong>Movement SummaryMovement Performance - VehiclesMov ID Turn Dem<strong>and</strong>FlowHV Deg. SatnAverageDelayLevel ofService95% Back of Queue Prop. EffectiveVehicles Distance Queued Stop RateAverageSpeedveh/h % v/c sec veh m per veh km/hSouth East: Dummy (<strong>Car</strong>p <strong>Park</strong> Road)23 R 324 0.0 0.174 9.2 LOS A 0.0 0.0 0.00 0.72 47.9Approach 324 0.0 0.174 9.2 LOS A 0.0 0.0 0.00 0.72 47.9East: <strong>Car</strong> <strong>Park</strong>4 L 226 0.0 0.544 33.5 LOS D 2.7 19.1 0.91 1.08 31.2Approach 226 0.0 0.543 33.5 LOS D 2.7 19.1 0.91 1.08 31.2North: Selby (North)7 L 188 0.0 0.193 9.2 LOS A 1.0 6.7 0.43 0.68 47.58 T 1288 0.0 0.330 0.0 LOS A 0.0 0.0 0.00 0.00 60.0Approach 1477 0.0 0.330 1.2 LOS A 1.0 6.7 0.06 0.09 58.0All Vehicles 2026 0.0 0.543 6.1 NA 2.7 19.1 0.14 0.30 51.4t:\60218676 - wembley pk ta\4 tech work area\4.3 engineering\sidra\60218676_sidra results 2012-01-27.doc 13 / 19
AECOMSelby Street Lin/Lout Opening <strong>Traffic</strong> Peak Hour – Winter Sat [11:00-12:00]Layout<strong>Traffic</strong>Movement SummaryMovement Performance - VehiclesMov ID Turn Dem<strong>and</strong>FlowHV Deg. SatnAverageDelayLevel ofService95% Back of Queue Prop. EffectiveVehicles Distance Queued Stop RateAverageSpeedveh/h % v/c sec veh m per veh km/hSouth East: Dummy (<strong>Car</strong>p <strong>Park</strong> Road)23 R 226 0.0 0.122 9.2 LOS A 0.0 0.0 0.00 0.72 47.9Approach 226 0.0 0.122 9.2 LOS A 0.0 0.0 0.00 0.72 47.9East: <strong>Car</strong> <strong>Park</strong>4 L 152 0.0 0.348 27.7 LOS D 1.6 10.9 0.87 1.01 34.0Approach 152 0.0 0.348 27.7 LOS D 1.6 10.9 0.87 1.01 34.0North: Selby (North)7 L 130 0.0 0.129 8.6 LOS A 0.6 4.0 0.34 0.61 48.08 T 1288 0.0 0.330 0.0 LOS A 0.0 0.0 0.00 0.00 60.0Approach 1418 0.0 0.330 0.8 LOS A 0.6 4.0 0.03 0.06 58.6All Vehicles 1796 0.0 0.348 4.1 NA 1.6 10.9 0.10 0.22 53.8t:\60218676 - wembley pk ta\4 tech work area\4.3 engineering\sidra\60218676_sidra results 2012-01-27.doc 14 / 19
AECOMSelby Street Lin/Lout Opening <strong>Traffic</strong> Peak Hour – Winter Sat [14:00-15:00]Layout<strong>Traffic</strong>Movement SummaryMovement Performance - VehiclesMov ID Turn Dem<strong>and</strong>FlowHV Deg. SatnAverageDelayLevel ofService95% Back of Queue Prop. EffectiveVehicles Distance Queued Stop RateAverageSpeedveh/h % v/c sec veh m per veh km/hSouth East: Dummy (<strong>Car</strong>p <strong>Park</strong> Road)23 R 316 0.0 0.170 9.2 LOS A 0.0 0.0 0.00 0.72 47.9Approach 316 0.0 0.170 9.2 LOS A 0.0 0.0 0.00 0.72 47.9East: <strong>Car</strong> <strong>Park</strong>4 L 226 0.0 0.718 51.6 LOS F 3.9 27.2 0.96 1.17 24.8Approach 226 0.0 0.718 51.6 LOS F 3.9 27.2 0.96 1.17 24.8North: Selby (North)7 L 194 0.0 0.199 9.2 LOS A 1.0 6.9 0.43 0.67 47.58 T 1453 0.0 0.373 0.0 LOS A 0.0 0.0 0.00 0.00 60.0Approach 1647 0.0 0.373 1.1 LOS A 1.0 6.9 0.05 0.08 58.2All Vehicles 2190 0.0 0.718 7.5 NA 3.9 27.2 0.14 0.28 49.7t:\60218676 - wembley pk ta\4 tech work area\4.3 engineering\sidra\60218676_sidra results 2012-01-27.doc 15 / 19
AECOMSalvado Road <strong>Access</strong> Opening <strong>Traffic</strong> Peak Hour – Winter Sat [9:30-10:30]Layout<strong>Traffic</strong>Movement SummaryMovement Performance - VehiclesMov ID Turn Dem<strong>and</strong> HV Deg. Satn Average Level of 95% Back of Queue Prop. Effective AverageFlowDelay Service Vehicles Distance Queued Stop Rate Speedveh/h % v/c sec veh m per veh km/hSouth: <strong>Access</strong>1 L 186 0.0 0.606 13.8 LOS B 1.8 12.6 0.52 0.89 43.43 R 270 0.0 1.221 150.1 LOS F 26.1 182.9 1.00 2.27 11.6Approach 456 0.0 1.218 94.5 LOS F 26.1 182.9 0.81 1.71 16.6East: Salvado (East)4 L 225 0.0 0.261 8.2 LOS A 0.0 0.0 0.00 0.84 49.05 T 273 0.0 0.261 0.0 LOS A 0.0 0.0 0.00 0.00 60.0Approach 498 0.0 0.261 3.7 LOS A 0.0 0.0 0.00 0.38 54.5West: Salvado (West)11 T 254 0.0 0.319 4.1 LOS A 3.4 23.9 0.65 0.00 48.112 R 155 0.0 0.319 12.4 LOS B 3.4 23.9 0.65 0.99 46.4Approach 410 0.0 0.319 7.2 LOS B 3.4 23.9 0.65 0.37 47.4All Vehicles 1364 0.0 1.218 35.1 NA 26.1 182.9 0.46 0.82 30.2South Approach RT Capacity = 90 vph.t:\60218676 - wembley pk ta\4 tech work area\4.3 engineering\sidra\60218676_sidra results 2012-01-27.doc 16 / 19
AECOMSalvado Road <strong>Access</strong> Opening <strong>Traffic</strong> Peak Hour – Winter Sat [13:30-14:30]Layout<strong>Traffic</strong>Movement SummaryMovement Performance - VehiclesMov ID Turn Dem<strong>and</strong> HV Deg. Satn Average Level of 95% Back of Queue Prop. Effective AverageFlowDelay Service Vehicles Distance Queued Stop Rate Speedveh/h % v/c sec veh m per veh km/hSouth: <strong>Access</strong>1 L 191 0.0 0.703 16.5 LOS C 2.2 15.4 0.58 1.00 41.23 R 275 0.0 1.730 380.9 LOS F 46.0 321.9 1.00 2.81 5.2Approach 466 0.0 1.734 231.7 LOS F 46.0 321.9 0.83 2.07 8.1East: Salvado (East)4 L 250 0.0 0.332 8.2 LOS A 0.0 0.0 0.00 0.87 49.05 T 386 0.0 0.333 0.0 LOS A 0.0 0.0 0.00 0.00 60.0Approach 636 0.0 0.332 3.2 LOS A 0.0 0.0 0.00 0.34 55.1West: Salvado (West)11 T 263 0.0 0.385 6.7 LOS A 4.8 33.3 0.82 0.00 45.512 R 168 0.0 0.384 15.0 LOS B 4.8 33.3 0.82 1.06 44.3Approach 431 0.0 0.385 9.9 LOS B 4.8 33.3 0.82 0.42 45.1All Vehicles 1532 0.0 1.734 74.6 NA 46.0 321.9 0.48 0.89 19.5South Approach RT Capacity = 50 vph.t:\60218676 - wembley pk ta\4 tech work area\4.3 engineering\sidra\60218676_sidra results 2012-01-27.doc 17 / 19
AECOMSalvado Road <strong>Access</strong> [with restrained RT] Opening <strong>Traffic</strong> Peak Hour – Winter Sat [13:30-14:30]Layout<strong>Traffic</strong>Movement SummaryMovement Performance - VehiclesMov ID Turn Dem<strong>and</strong> HV Deg. Satn Average Level of 95% Back of Queue Prop. Effective AverageFlowDelay Service Vehicles Distance Queued Stop Rate Speedveh/h % v/c sec veh m per veh km/hSouth: <strong>Access</strong>1 L 191 0.0 0.703 16.5 LOS C 2.2 15.4 0.58 1.00 41.23 R 156 0.0 0.983 90.6 LOS F 10.1 71.0 1.00 1.54 17.1Approach 347 0.0 0.985 49.9 LOS F 10.1 71.0 0.77 1.24 25.2East: Salvado (East)4 L 250 0.0 0.332 8.2 LOS A 0.0 0.0 0.00 0.87 49.05 T 386 0.0 0.333 0.0 LOS A 0.0 0.0 0.00 0.00 60.0Approach 636 0.0 0.332 3.2 LOS A 0.0 0.0 0.00 0.34 55.1West: Salvado (West)11 T 263 0.0 0.385 6.7 LOS A 4.8 33.3 0.82 0.00 45.512 R 168 0.0 0.384 15.0 LOS B 4.8 33.3 0.82 1.06 44.3Approach 431 0.0 0.385 9.9 LOS B 4.8 33.3 0.82 0.42 45.1All Vehicles 1413 0.0 0.985 16.7 NA 10.1 71.0 0.44 0.59 40.6South Approach RT Capacity = 50 vph.t:\60218676 - wembley pk ta\4 tech work area\4.3 engineering\sidra\60218676_sidra results 2012-01-27.doc 18 / 19
AECOMSalvado Road <strong>Access</strong> Opening <strong>Traffic</strong> Peak Hour – Winter Sat [15:00-16:00]Layout<strong>Traffic</strong>Movement SummaryMovement Performance - VehiclesMov ID Turn Dem<strong>and</strong> HV Deg. Satn Average Level of 95% Back of Queue Prop. Effective AverageFlowDelay Service Vehicles Distance Queued Stop Rate Speedveh/h % v/c sec veh m per veh km/hSouth: <strong>Access</strong>1 L 194 0.0 0.675 15.9 LOS C 2.2 15.4 0.56 0.99 41.73 R 275 0.0 1.368 216.1 LOS F 33.5 234.4 1.00 2.53 8.6Approach 469 0.0 1.371 133.4 LOS F 33.5 234.4 0.82 1.90 12.8East: Salvado (East)4 L 227 0.0 0.298 8.2 LOS A 0.0 0.0 0.00 0.86 49.05 T 342 0.0 0.298 0.0 LOS A 0.0 0.0 0.00 0.00 60.0Approach 569 0.0 0.298 3.3 LOS A 0.0 0.0 0.00 0.34 55.1West: Salvado (West)11 T 228 0.0 0.326 5.0 LOS A 3.5 24.7 0.69 0.00 47.312 R 156 0.0 0.327 13.3 LOS B 3.5 24.7 0.69 1.02 45.5Approach 384 0.0 0.326 8.4 LOS B 3.5 24.7 0.69 0.41 46.5All Vehicles 1422 0.0 1.371 47.5 NA 33.5 234.4 0.46 0.87 25.8South Approach RT Capacity = 60 vph.t:\60218676 - wembley pk ta\4 tech work area\4.3 engineering\sidra\60218676_sidra results 2012-01-27.doc 19 / 19
U-Turn Concept (South to South U-Turn)Opening <strong>Traffic</strong> Peak Hour – Winter SatAECOMU-Turn Concept (North to North U-Turn)Opening <strong>Traffic</strong> Peak Hour – Winter SatMovement Summary [critical gap = 6s, follow up headway = 2.5s)Movement Performance - VehiclesMov ID Turn Dem<strong>and</strong> HV Deg. Satn Average Level of 95% Back of Queue Prop. Effective AverageFlowDelay Service Vehicles Distance Queued Stop Rate Speedveh/h % v/c sec veh m per veh km/h8:30- U 355 0.0 1.173 136.2 LOS F 30.7 215.2 1.00 2.43 12.79:30T 935 0.0 0.240 0.0 LOS A 0.0 0.0 0.00 0.00 60.09:30- U 330 0.0 1.433 251.7 LOS F 42.7 299.1 1.00 2.79 7.610:30T 1063 0.0 0.272 0.0 LOS A 0.0 0.0 0.00 0.00 60.010:30- U 228 0.0 1.084 122.6 LOS F 18.0 126.1 1.00 1.88 13.811:30T 1101 0.0 0.282 0.0 LOS A 0.0 0.0 0.00 0.00 60.012:00- U 247 0.0 0.904 65.9 LOS F 11.6 81.5 0.98 1.56 21.413:00T 983 0.0 0.252 0.0 LOS A 0.0 0.0 0.00 0.00 60.014:00- U 159 0.0 0.515 32.1 LOS D 3.8 26.9 0.88 1.11 31.915:00T 927 0.0 0.238 0.0 LOS A 0.0 0.0 0.00 0.00 60.015:00- U 247 0.0 0.729 39.5 LOS E 7.5 52.7 0.92 1.31 28.816:00T 882 0.0 0.226 0.0 LOS A 0.0 0.0 0.00 0.00 60.0Movement Summary [critical gap = 6s, follow up headway = 2.5s)Movement Performance - VehiclesMov ID Turn Dem<strong>and</strong> HV Deg. Satn Average Level of 95% Back of Queue Prop. Effective AverageFlowDelay Service Vehicles Distance Queued Stop Rate Speedveh/h % v/c sec veh m per veh km/h8:30- U 378 0.0 0.924 54.3 LOS F 16.6 116.5 0.97 1.76 24.19:30T 785 0.0 0.201 0.0 LOS A 0.0 0.0 0.00 0.00 60.09:30- U 409 0.0 1.299 182.7 LOS F 42.8 299.7 1.00 2.87 10.010:30T 915 0.0 0.235 0.0 LOS A 0.0 0.0 0.00 0.00 60.010:30- U 387 0.0 1.768 397.3 LOS F 64.0 447.7 1.00 3.29 5.111:30T 1084 0.0 0.278 0.0 LOS A 0.0 0.0 0.00 0.00 60.012:00- U 409 0.0 2.014 506.9 LOS F 75.8 530.5 1.00 3.45 4.013:00T 1117 0.0 0.286 0.0 LOS A 0.0 0.0 0.00 0.00 60.014:00- U 369 0.0 1.309 191.5 LOS F 40.0 280.1 1.00 2.76 9.615:00T 969 0.0 0.248 0.0 LOS A 0.0 0.0 0.00 0.00 60.015:00- U 394 0.0 2.374 673.0 LOS F 83.0 581.2 1.00 3.35 3.116:00T 1201 0.0 0.308 0.0 LOS A 0.0 0.0 0.00 0.00 60.0t:\60218676 - wembley pk ta\4 tech work area\4.3 engineering\sidra\60218676_u-turn sidra results 2011-08-25.doc 1 / 1
AECOM<strong>Wembley</strong> <strong>Sports</strong> <strong>Park</strong> <strong>Integrated</strong> <strong>Access</strong>, <strong>Traffic</strong> <strong>and</strong> <strong>Car</strong> <strong>Park</strong>ing <strong>Plan</strong>Appendix CAppendix C – <strong>Traffic</strong> <strong>and</strong>People Movement <strong>Plan</strong>sT:\60218676 - <strong>Wembley</strong> PK TA\6 Draft Docs\6.1 Reports\Final Report\Comprehensive <strong>Integrated</strong> <strong>Access</strong> RevE.docxRevision E - 31 January 2012
WEMBLEY SPORTS PARK - MASTER PLANTRAFFIC AND PEOPLE MOVEMENT PLANMondays, Thursdays <strong>and</strong> FridaysNOTE:This event management plan is tobe presented to the users, it is tobe refined if required, <strong>and</strong> it is to beagreed upon with the users of thefacilities to control their operations.
WEMBLEY SPORTS PARK - MASTER PLANTRAFFIC AND PEOPLE MOVEMENT PLANTuesdays <strong>and</strong> WednesdaysNOTE:This event management plan is tobe presented to the users, it is tobe refined if required, <strong>and</strong> it is to beagreed upon with the users of thefacilities to control their operations.
WEMBLEY SPORTS PARK - MASTER PLANTRAFFIC AND PEOPLE MOVEMENT PLANSaturdays <strong>and</strong> Sundays (Summer)NOTE:This event management plan is tobe presented to the users, it is tobe refined if required, <strong>and</strong> it is to beagreed upon with the users of thefacilities to control their operations.
WEMBLEY SPORTS PARK - MASTER PLANTRAFFIC AND PEOPLE MOVEMENT PLANSaturdays (Winter)NOTE:This event management plan is tobe presented to the users, it is tobe refined if required, <strong>and</strong> it is to beagreed upon with the users of thefacilities to control their operations.
WEMBLEY SPORTS PARK - MASTER PLANTRAFFIC AND PEOPLE MOVEMENT PLANSundays (Winter)NOTE:This event management plan is tobe presented to the users, it is tobe refined if required, <strong>and</strong> it is to beagreed upon with the users of thefacilities to control their operations.