

Download the Time to Take Stock Brochure - Franklin Templeton ...
Download the Time to Take Stock Brochure - Franklin Templeton ...
Download the Time to Take Stock Brochure - Franklin Templeton ...
- No tags were found...

Create successful ePaper yourself
Turn your PDF publications into a flip-book with our unique Google optimized e-Paper software.
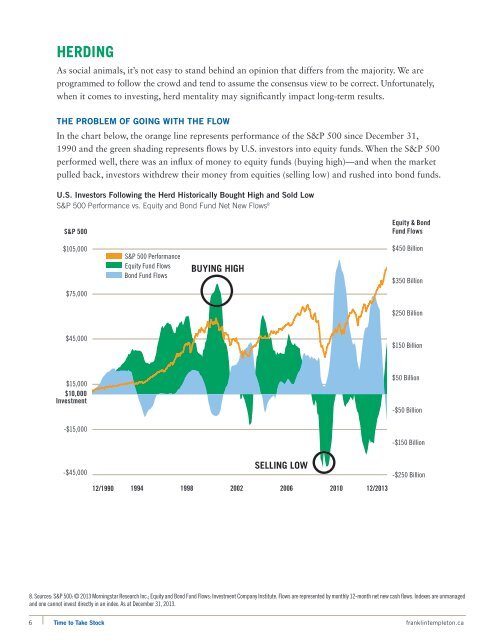
HerdingAs social animals, it’s not easy <strong>to</strong> stand behind an opinion that differs from <strong>the</strong> majority. We areprogrammed <strong>to</strong> follow <strong>the</strong> crowd and tend <strong>to</strong> assume <strong>the</strong> consensus view <strong>to</strong> be correct. Unfortunately,when it comes <strong>to</strong> investing, herd mentality may significantly impact long-term results.The Problem of Going with <strong>the</strong> FlowIn <strong>the</strong> chart below, <strong>the</strong> orange line represents performance of <strong>the</strong> S&P 500 since December 31,1990 and <strong>the</strong> green shading represents flows by U.S. inves<strong>to</strong>rs in<strong>to</strong> equity funds. When <strong>the</strong> S&P 500performed well, <strong>the</strong>re was an influx of money <strong>to</strong> equity funds (buying high)—and when <strong>the</strong> marketpulled back, inves<strong>to</strong>rs withdrew <strong>the</strong>ir money from equities (selling low) and rushed in<strong>to</strong> bond funds.U.S. Inves<strong>to</strong>rs Following <strong>the</strong> Herd His<strong>to</strong>rically Bought High and Sold LowS&P 500 Performance vs. Equity and Bond Fund Net New Flows 8S&P 500Equity & BondFund Flows$105,000S&P 500 PerformanceEquity Fund FlowsBond Fund FlowsBUYING HIGH$450 Billion$350 Billion$75,000$250 Billion$45,000$150 Billion$15,000$10,000Investment$50 Billion-$50 Billion-$15,000-$150 Billion-$45,000SELLING LOW12/1990 1994 1998 2002 2006 2010 12/2013-$250 Billion8. Sources: S&P 500: © 2013 Morningstar Research Inc.; Equity and Bond Fund Flows: Investment Company Institute. Flows are represented by monthly 12-month net new cash flows. Indexes are unmanagedand one cannot invest directly in an index. As at December 31, 2013.6 <strong>Time</strong> <strong>to</strong> <strong>Take</strong> S<strong>to</strong>ck franklintemple<strong>to</strong>n.ca


