Testing species distribution models across space and time: high ...
Testing species distribution models across space and time: high ...
Testing species distribution models across space and time: high ...

Create successful ePaper yourself
Turn your PDF publications into a flip-book with our unique Google optimized e-Paper software.
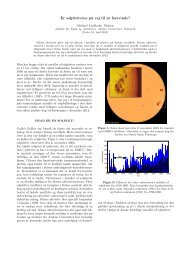
A. Eskildsen et al.plot (AUC; Fielding & Bell, 1997) <strong>and</strong> the true skill statistic(TSS; Allouche et al., 2006). A non-parametric Wilcoxon’smatched pairs test was used to test whether the explanatorypower <strong>and</strong> predictive accuracy differed significantly between thebaseline climate-only <strong>models</strong> <strong>and</strong> each of the three sets of morecomplex <strong>models</strong>. Furthermore, the relationship between <strong>species</strong>characteristics <strong>and</strong> modelling accuracy was investigated usingSpearman rank correlation tests.For evaluation of AUC values we used the approach recommendedby Swets (1988): excellent AUC > 0.90; good 0.80 0.75; good 0.40 < TSS < 0.75; <strong>and</strong> poorTSS < 0.40.The relative importance of predictor variables was assessedfrom <strong>models</strong> calibrated on all data from t 1. In GAM <strong>models</strong>,variable importance was calculated as each variable’s drop contribution(i.e. change in deviance associated with exclusion of agiven variable from a model containing all the other variables).In the BRT <strong>models</strong>, the relative importance of predictors basedon the frequency of variable selection during model building<strong>and</strong> the reduction in deviance associated with each variable’sinclusion in <strong>models</strong> was calculated. For both methods variables’contributions were scaled to sum to 100, with <strong>high</strong>er numbersindicating stronger influence on the response variable.Range margin shifts during climatic warmingTo compare observed <strong>and</strong> modelled shifts at northern rangemargins, we used the mean latitude of the five northernmostrecords in t 1 <strong>and</strong> t 2 to estimate <strong>species</strong>’ northern range limits.Modelled <strong>distribution</strong>s were obtained from our simple climatemodel <strong>and</strong> the full climate-soil-l<strong>and</strong>-cover <strong>models</strong>, which werecalibrated with 100% of data from <strong>time</strong> t 1. Due to missing informationabout <strong>species</strong> whose range margins in <strong>time</strong> t 2 may haveexceeded the northernmost border of Finl<strong>and</strong>, only <strong>species</strong> witha poleward range limit more than 100 km south of Finl<strong>and</strong>’snorthern border in t 1 were used in the analysis. Furthermore,four migratory <strong>species</strong> (Pieris brassicae, Pieris rapae, Colias hyale<strong>and</strong> Vanessa atalanta) were excluded. Thus, the analysis included56 <strong>species</strong>. We used Spearman’s rank correlations betweenobserved <strong>and</strong> predicted range margins to quantify the ability ofSDMs to predict <strong>distribution</strong>al changes at exp<strong>and</strong>ing rangemargins.RESULTSEvidence of observed climate changeThe two periods, 1991–99 <strong>and</strong> 2001–09, differed significantly ingrowing degree-days (mean GDD5 SE: t 1 = 910.9 24.3,t 2 = 1032.1 25.6; Wilcoxon’s signed rank test, W < 0.1,P < 0.001) <strong>and</strong> mean temperature of the coldest month (meanTEMP C SE: t 1 =-8.80 0.31 °C; t 2 = -8.69 0.28 °C;W = 2423, P = 0.002). No significant change was observed formean annual precipitation between the two periods (meanPRE SE: t 1 = 594.9 3.0 mm; t 2 = 588.3 4.7 mm; W =4050, P = 0.071).Validation of SDM performance using independent<strong>and</strong> non-independent dataOn average, <strong>models</strong> validated using t 1 occurrence data (i.e. nonindependentvalidation) showed fair to good AUC values(0.77 AUC 0.80) <strong>and</strong> good TSS values (0.46 TSS 0.51). Mean AUC values derived from <strong>models</strong> validated using t 2occurrence data (i.e. independent validation) also showed fair togood results (i.e. 0.72 AUC 0.76), while average TSS valuessome<strong>time</strong>s showed poor results (0.37 TSS 0.43) (Table 1).Overall, <strong>models</strong> with non-independent validation yielded significantly<strong>high</strong>er predictive accuracies than model validationswith independent t 2 data (Table 1; Wilcoxon’s signed rank test,P < 0.001 for all).Adding l<strong>and</strong> cover <strong>and</strong> soil informationFor <strong>models</strong> validated with non-independent t 1 data, the inclusionof soil type variables did not lead to model improvementwhen evaluated by AUC <strong>and</strong> performed significantly poorerwhen evaluated by TSS. The inclusion of l<strong>and</strong> cover variablesonly resulted in significantly <strong>high</strong>er AUC values for GAM <strong>and</strong>BRT <strong>models</strong> (Table 1). For <strong>models</strong> validated with independent t 2data, model performance was significantly improved comparedwith the simple climate-only <strong>models</strong> for all <strong>models</strong> except forthe GAM <strong>models</strong> including soil type <strong>and</strong> l<strong>and</strong> cover, as evaluatedby TSS (Table 1). In the latter case, the <strong>models</strong> performed significantlypoorer than the climate-only model. In nonindependentmodel tests, the inclusion of l<strong>and</strong> cover yieldedconsistently <strong>high</strong>er predictive accuracies than the inclusion ofsoil (Table 1). However, in independent model tests with t 2 data,there was no clear difference in model accuracy for either soiltype or l<strong>and</strong> cover independently. For non-independent modeltests, the joint inclusion of l<strong>and</strong> cover <strong>and</strong> soil type variables ledto significant improvement of GAM <strong>and</strong> BRT <strong>models</strong> evaluatedby AUC, compared with the climate-only model, while GAM<strong>models</strong> evaluated by TSS performed significantly poorer(Table 1). In contrast, for independent model tests, significantimprovement of performance was observed for all model types,except for GAM <strong>models</strong> evaluated by TSS (Table 1).When considering the average effect of environmental variableson <strong>species</strong> <strong>distribution</strong>s <strong>across</strong> all <strong>species</strong>, growing degreedays contributed most strongly, followed by mean temperatureof the coldest month, cover of built-up areas <strong>and</strong> cover of pastures(Fig. 1). Soil types <strong>and</strong> other l<strong>and</strong> cover classes generallymade rather small contributions to explain <strong>species</strong> <strong>distribution</strong>s(Fig. 1), but their integration considerably improved model predictions(Table 1).Overall, the predictive accuracies of climate-only <strong>and</strong>climate-soil-l<strong>and</strong>-cover SDMs were fairly strongly correlated(0.54 r 0.78, P < 0.001 for all) (see Figure S1). Interestingly,there was a drop in correlation coefficients between the4Global Ecology <strong>and</strong> Biogeography, ••, ••–••, © 2013 John Wiley & Sons Ltd
<strong>Testing</strong> SDMs <strong>across</strong> <strong>space</strong> <strong>and</strong> <strong>time</strong>Table 1 The predictive accuracy of generalized additive <strong>models</strong> (GAM) <strong>and</strong> boosted regression trees (BRT) <strong>models</strong> validated using non-independent observations from 1992 to 1999 <strong>and</strong>independent observations from 2002 to 2009.Climate only Climate <strong>and</strong> soil Climate <strong>and</strong> l<strong>and</strong> cover Climate, soil <strong>and</strong> l<strong>and</strong> coverNon-independent Independent Non-independent Independent Non-independent Independent Non-independent IndependentAUCGAM 0.78 0.10 0.73 0.12 0.77 0.10 0.75 0.11*** 0.80 0.10** 0.75 0.11*** 0.78 0.09* 0.75 0.11***BRT 0.79 0.10 0.72 0.11 0.78 0.09 0.75 0.11*** 0.80 0.09** 0.76 0.11*** 0.80 0.09** 0.76 0.10***TSSGAM 0.51 0.20 0.40 0.22 0.46 0.20*** 0.41 0.20 0.50 0.20 0.40 0.21* 0.46 0.19* 0.40 0.20BRT 0.50 0.20 0.37 0.21 0.47 0.17* 0.40 0.20*** 0.50 0.18 0.42 0.20*** 0.48 0.17 0.43 0.19***The table shows mean values <strong>and</strong> st<strong>and</strong>ard deviations for area under the curve of a receiver operating characteristic plot (AUC) <strong>and</strong> true skill statistic (TSS) for GAM <strong>and</strong> BRT <strong>models</strong> including climate, soil type<strong>and</strong> l<strong>and</strong> cover variables. Asterisks indicate significant differences between <strong>models</strong> <strong>and</strong> the simple climate-only model, with bold numbers indicating significant improvement (P-values for Wilcoxon signed ranktests. *P < 0.05, **P < 0.01, ***P < 0.001).climate-only GAM model <strong>and</strong> the combined climate, soil <strong>and</strong>l<strong>and</strong> cover GAM model, indicating that some <strong>species</strong> <strong>distribution</strong>sare better predicted when using independent validation incombination with more complex <strong>models</strong> (see Appendix S1).Species characteristics <strong>and</strong> modelling accuracySpecies characteristics showed low (r < 0.20) to <strong>high</strong> (r > 0.60)correlations with SDM accuracy for the independent data usingthe full BRT model, including climate, soil <strong>and</strong> l<strong>and</strong> cover variables(Fig. 2). Because <strong>species</strong> characteristics were only weakpredictors of model accuracy in combined climate-soil-l<strong>and</strong>cover GAMs, only BRT <strong>models</strong> were considered for this analysis.Of the four <strong>species</strong> characteristic variables, <strong>high</strong>ly significantnegative effects on modelling accuracy were found for mobility,length of flight period <strong>and</strong> prevalence (Spearman’s rank correlation<strong>and</strong> P-values given in Fig. 2). Removal of the five outlying<strong>species</strong> with the longest flight periods (Fig. 2c) resulted inslightly stronger correlations (r=-0.50 for AUC <strong>and</strong> r=-0.53for TSS).Changes at northern range marginsObserved range margin shifts tended to be greater for <strong>species</strong>occurring at <strong>high</strong>er latitudes (Fig 3a). On average, the observednorthwards range margin shift <strong>across</strong> all <strong>species</strong> between t 1 <strong>and</strong>t 2 was 54.5 km ( 15.0), with a maximum observed range shiftof 454 km (silver-washed fritillary, Argynnis paphia Linnaeus,1758). Predicted shifts in range margins varied more widely thanobserved range shifts, with a tendency for over-prediction for<strong>species</strong> occurring at lower latitudes (Fig 3b). Predicted rangemargin shifts tended to be larger than the observed shifts,with GAMs predicting values closer to observed shifts(59.8 13.9 km for the simple climate-only model, <strong>and</strong>73.3 10.5 km for the combined climate-soil-l<strong>and</strong>-covermodel) while BRTs considerably over-predicted range marginshifts (106.5 17.8 km for the simple climate-only model, <strong>and</strong>165.5 25.4 km for the combined climate-soil-l<strong>and</strong>-covermodel). Correlations between observed <strong>and</strong> predicted rangeshifts were generally weak (Fig. 3c <strong>and</strong> d), indicating that rangedynamics at leading edges were not well predicted. The onlysignificant positive correlation was found for the combinedclimate-soil-l<strong>and</strong>-cover GAM model (Spearman’s rank correlationgiven in Fig. 3d, P < 0.05). Predictions of northern rangemargins for three example <strong>species</strong>, the <strong>high</strong>ly mobile blackveinedwhite (Aporia crataegi Linnaeus, 1758) <strong>and</strong> peacock(Nymphalis io Linnaeus, 1758) <strong>and</strong> the less mobile Chestnutheath (Coenonympha glycerion Borkhausen, 1788), showed <strong>high</strong>accuracy in <strong>time</strong> t 1 (Fig. 4a,c,e) . However, when <strong>models</strong> wereused to predict the <strong>species</strong>’ <strong>distribution</strong>s <strong>and</strong> range shifts in <strong>time</strong>t 2, satisfactory results were only obtained for the Chestnut heath,which showed no range shift, <strong>and</strong> peacock, which showed anobvious range shift (Fig. 4d,f). In contrast, the large observedrange shift of the black-veined white butterfly at the exp<strong>and</strong>ingnorthern range edge was not adequately captured by the SDM(Fig. 4b).Global Ecology <strong>and</strong> Biogeography, ••, ••–••, © 2013 John Wiley & Sons Ltd 5
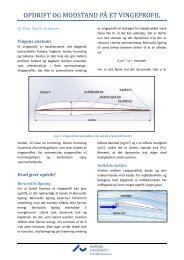
A. Eskildsen et al.Figure 1 Box plot of the variable importance of environmental variables in the generalized additive <strong>models</strong> (GAM) (white boxes) <strong>and</strong>boosted regression tree (BRT) <strong>models</strong> (grey boxes) for 77 butterfly <strong>species</strong>. Boxes span the 25th–75th percentiles, black dots indicate meanvalues, solid lines the median <strong>and</strong> whiskers indicate the extreme values. The average combined importance of climatic variables, i.e. annualgrowing degree-days above 5 °C (GDD), mean temperature of the coldest month (TEMP C), <strong>and</strong> precipitation (PRE) was 39.6% for GAM<strong>and</strong> 45.9% for BRT. The average combined importance of soil type variables, i.e. rock, s<strong>and</strong> <strong>and</strong> gravel, clay, <strong>and</strong> peat was 21.1% for GAM<strong>and</strong> 19.7% for BRT. The average combined importance of all l<strong>and</strong> cover variables, i.e. built up-areas (built), arable l<strong>and</strong> (arable), pasture,sparse vegetation <strong>and</strong> wetl<strong>and</strong> was 39.3% for GAM <strong>and</strong> 34.4% for BRT.Figure 2 Relationships between <strong>species</strong>characteristics <strong>and</strong> modelling accuracyfor boosted regression tree (BRT) <strong>models</strong>based on climate, soil type <strong>and</strong> l<strong>and</strong>cover variables. Both area under thecurve of a receiver operatingcharacteristic plot (AUC) <strong>and</strong> true skillstatistic (TSS) values derived fromindependent model validation areshown. Rho values <strong>and</strong> P-values forSpearman’s rank correlation are given.6Global Ecology <strong>and</strong> Biogeography, ••, ••–••, © 2013 John Wiley & Sons Ltd
<strong>Testing</strong> SDMs <strong>across</strong> <strong>space</strong> <strong>and</strong> <strong>time</strong>Figure 3 Observed <strong>and</strong> modelled northern range margins based on the mean latitude of the five northern-most grid cells for 56 <strong>species</strong> ofFinnish butterflies. (a) The observed northern range margin at <strong>time</strong> t 1 (1992–99) <strong>and</strong> <strong>time</strong> t 2 (2002–09); (b) the observed range margin at<strong>time</strong> t 2 <strong>and</strong> the modelled range margin at <strong>time</strong> t 2 (using the mean latitude of the five northern-most predicted occurrences from generalizedadditive <strong>models</strong> (GAM) <strong>and</strong> boosted regression tree (BRT) <strong>models</strong> including climate, soil type <strong>and</strong> l<strong>and</strong> cover variables); (c) therelationship between observed <strong>and</strong> predicted range margin shifts using <strong>models</strong> including climate only; (d) the relationship betweenobserved <strong>and</strong> predicted range margin shifts using <strong>models</strong> including climate, soil type <strong>and</strong> l<strong>and</strong> cover variables. Dotted lines indicate the 1:1relationship. For (c) <strong>and</strong> (d) Pearson’s r is shown. A significant correlation was found for the full GAM model, but not for the other <strong>models</strong>(*P < 0.05).DISCUSSIONOur study provides a real-world test of the capacity of SDMs toforecast range shifts of <strong>high</strong> latitude <strong>species</strong> under globalchange. Our results offer new insights into the predictive performanceof SDMs, especially their limited performance in predictingrange dynamics at the exp<strong>and</strong>ing edge. Our findingsfurther support earlier suggestions (Araújo et al., 2005) thatmodel validation with non-independent data from the same<strong>time</strong> period (t 1) provides overly optimistic assessments of predictiveaccuracy compared with validation based on independentdata from another <strong>time</strong> period (t 2). However, our resultsbroaden the previous knowledge because data stem from twoperiods characterized by a significant increase in summer <strong>and</strong>winter temperatures, allowing us to directly test the performanceof SDMs under observed climate warming (cf. Kharoubaet al., 2009). SDMs obtained strong model fits when using nonindependentvalidations, but model fits became weaker whentested with independent datasets.The importance of climatic <strong>and</strong> other abiotic variables islikely to be scale dependent (Wiens, 1989; Pearson et al., 2004;Luoto, 2007), with climate thought to play the most importantrole at broad spatial scales <strong>and</strong> other factors becoming increasinglyrelevant at finer spatial scales (Pearson & Dawson, 2003).For <strong>species</strong> <strong>distribution</strong> data recorded at a resolution of 10 or20 km, previous work has shown that the integration of soil type<strong>and</strong> l<strong>and</strong> cover variables may significantly improve spatial prediction(Pearson et al., 2004; Coudun et al., 2006; Luoto et al.,2006; Heikkinen et al., 2007; Titeux et al., 2009). Our resultssupport this idea, showing that significant improvements ofmodel performance can be obtained when soil type <strong>and</strong> l<strong>and</strong>cover variables are included into SDMs. As a consequence, correlationsbetween the accuracy of <strong>models</strong> (for both GAMs <strong>and</strong>BRTs) validated with independent versus non-independent datawere <strong>high</strong> for simple climate-only <strong>models</strong>, but the discrepancybetween independent <strong>and</strong> non-independent validation becamelarger when using the full climate-soil-l<strong>and</strong>-cover <strong>models</strong>. Thisshows that, at least for some <strong>species</strong>, the predictive potential ofSDMs may be considerably improved when adding l<strong>and</strong> cover<strong>and</strong> soil, <strong>and</strong> that non-independent validation might underestimatethis potential increase compared with independent validations.The main drivers of Finnish butterfly <strong>distribution</strong>s at10-km resolution are growing degree-days, average temperatureof the coldest month, cover of built-up areas <strong>and</strong> cover of pastures– l<strong>and</strong> cover thus appear to have a larger effect on <strong>species</strong><strong>distribution</strong>s than soil type. In ecological terms, growing degreedaysis related to the developmental threshold for larvae <strong>and</strong> themean temperature of the coldest month to over-wintering survival(Hill et al., 2003), while l<strong>and</strong> cover variables can be seen asa surrogate for the occurrence of potential breeding habitatsGlobal Ecology <strong>and</strong> Biogeography, ••, ••–••, © 2013 John Wiley & Sons Ltd 7
A. Eskildsen et al.Figure 4 Observed <strong>and</strong> predicted <strong>distribution</strong>s of the <strong>high</strong>lymobile black-veined white (Aporia crataegi) (a, b) <strong>and</strong> peacock(Nymphalis io) (c, d) <strong>and</strong> the less mobile Chestnut heath(Coenonympha glycerion) (e, f). Observed occurrences of the three<strong>species</strong> are indicated by black dots, while predicted occurrencesbased on full-boosted regression tree (BRT) <strong>models</strong> calibrated on100% of t 1 data using climate, soil type <strong>and</strong> l<strong>and</strong> cover areindicated by grey grid cells. Model performance (area under thecurve of a receiver operating characteristic plot (AUC) <strong>and</strong> trueskill statistic (TSS) for the three <strong>species</strong> was found to be <strong>high</strong>lysimilar in <strong>time</strong> t 1 (left column), while model performance in <strong>time</strong>t 2 (right column) was markedly better for the low-mobilityChestnut heath <strong>and</strong> peacock. RSO = range shift observed (km)<strong>and</strong> RSP = range shift predicted (km). Range shift estimates arebased on the mean of the five northernmost cells in t 1 <strong>and</strong> t 2.Projection: Finnish National Coordinate System (Gauss–Krügerwith central longitude 27°).(Luoto et al., 2006). Overall, these results underline that broadscaledata recorded at a coarse spatial resolution are able tocapture the effects of climate, l<strong>and</strong> cover <strong>and</strong> soil type on <strong>species</strong><strong>distribution</strong>s, all of which contribute to improving model fit <strong>and</strong>predictive power.Ecological traits can be important in determining the <strong>distribution</strong>alresponses of <strong>species</strong> to climate change (Pöyry et al.,2009; Angert et al., 2011). In our study, the modelling accuracyof butterfly <strong>distribution</strong>s was negatively correlated with three<strong>species</strong> characteristics, namely mobility, flight period <strong>and</strong> prevalence.This is consistent with previous findings (Luoto et al.,2005; Pöyry et al., 2008) <strong>and</strong> indicates that <strong>species</strong> with large<strong>distribution</strong>s <strong>and</strong> the ability to fly long distances over a shortperiod of <strong>time</strong> are inherently difficult to model. The mobilityindex used in our study was significantly correlated with bothprevalence (Pearson’s correlation, r = 0.638, P < 0.001) <strong>and</strong>flight period (Pearson’s correlation, r = 0.591, P < 0.001), suggestingthat the effects of these three parameters on modellingaccuracy may be to some extent confounded (Pöyry et al., 2009).Overall, these results draw attention to the importance of <strong>species</strong>characteristics for influencing the capacity of different <strong>species</strong> totrack rapid climate change, <strong>and</strong> to the need of identifying keytraits that could confound model predictions.We documented an average northbound range shift of54.5 km for 56 <strong>species</strong> of Finnish butterflies between the periods1992–99 <strong>and</strong> 2002–09, indicating a strong <strong>and</strong> rapid overallresponse to climatic warming among <strong>high</strong>-latitude butterfly<strong>species</strong> (see also Pöyry et al., 2009). However, some <strong>species</strong>(19%) were observed to show slight range contractions. A smallnumber of <strong>species</strong> had very large range shifts, whereas other<strong>species</strong> only showed minimal responses, with the observed rangemargin shifts tending to be stronger for <strong>species</strong> occurring at<strong>high</strong>er latitudes. With respect to modelling success, our resultssuggest that while SDMs may provide credible predictions of thechanges in the overall <strong>distribution</strong> of some <strong>species</strong> over short<strong>time</strong> periods (e.g. 10 years), they may fail to provide accuratepredictions for other <strong>species</strong>, especially at their exp<strong>and</strong>ingnorthern range margins. These findings have important implicationsfor SDM modelling under climate change <strong>and</strong> suggestthat SDMs ability to predict the exact locations of new populationsat exp<strong>and</strong>ing range margins is at best weak, possiblybecause of the exclusion of important parameters, such asdemographic rates <strong>and</strong>/or dispersal (Schurr et al., 2012). Ourillustrative examples of the observed <strong>and</strong> predicted range shiftsof three <strong>species</strong> of Finnish butterflies, the <strong>high</strong>ly mobile blackveinedwhite <strong>and</strong> peacock <strong>and</strong> the more sedentary Chestnutheath, show that mobility <strong>and</strong> dispersal behaviour play animportant role in determining <strong>species</strong> responses to changing8Global Ecology <strong>and</strong> Biogeography, ••, ••–••, © 2013 John Wiley & Sons Ltd
<strong>Testing</strong> SDMs <strong>across</strong> <strong>space</strong> <strong>and</strong> <strong>time</strong>environmental conditions. Mismatches between observed <strong>and</strong>predicted range shifts may thus be related to <strong>species</strong>-specifictraits <strong>and</strong> among-<strong>species</strong> variation in demographic (birth <strong>and</strong>death) rates.Novel implementations, such as dynamic range <strong>models</strong>(DRMs), could potentially overcome such problems for specific<strong>species</strong> (Schurr et al., 2012). Another option to reduce mismatchesbetween observed <strong>and</strong> predicted range margins in<strong>high</strong>ly mobile <strong>species</strong> could be to separate the extreme outlying<strong>and</strong> temporally sporadic local occurrences with no permanentpopulations (established for 1 or 2 years under exceptionallyfavourable weather conditions as in the case of A. crataegi innorthern Finl<strong>and</strong> in 2004) from those occurrences at the rangemargins with more permanent populations. However, thiswould require the availability of spatially comprehensive butterflyatlas survey data recorded on an annual basis, which are bothexpensive <strong>and</strong> difficult to collect.In conclusion, SDMs assessed with non-independent splitsamplevalidations show good model fits, but their potential forpredicting range dynamics in non-equilibrium conditions, suchas climate change, might be limited. The inclusion of l<strong>and</strong> cover<strong>and</strong> soil types can improve SDM predictions as suggested by ourindependently validated <strong>models</strong>, <strong>and</strong> <strong>species</strong> characteristics mayaccount for why predictions are more reliable for some <strong>species</strong>than for others. However, even after the inclusion of these additionalfactors, poor predictions of changes at <strong>species</strong> rangemargins are typical, suggesting that range dynamics cannot befully captured even in more complex SDMs. Thus, our resultssuggest that SDMs have limitations in their ability to predict<strong>species</strong> <strong>distribution</strong>al responses to climate change at exp<strong>and</strong>ingrange margins, <strong>and</strong> we propose that incorporation of dynamicprocesses, such as demographic rates <strong>and</strong> dispersal, mightstrengthen the predictive power of the <strong>models</strong>. There is a clearneed for more studies testing the potential of SDMs to predict<strong>distribution</strong>al changes between two or more <strong>time</strong> periods <strong>and</strong>underst<strong>and</strong>ing what determines the discrepancy in accuracybetween non-independently <strong>and</strong> independently validated<strong>models</strong>. Future work should also include collecting <strong>and</strong> compilingspatially <strong>and</strong> temporally comprehensive datasets on thechanges in <strong>species</strong> <strong>distribution</strong>s <strong>and</strong> making them available forsuch model testing.ACKNOWLEDGEMENTSWe thank editor-in-chief David Currie, editor Jeremy Kerr <strong>and</strong>two anonymous referees for comments. This work acknowledgessupport from the Nordforsk TFI Network ‘Effect Studies<strong>and</strong> Adaptation to Climate Change’ (2011–2014) <strong>and</strong> 15. JuniFonden. WDK acknowledges a starting independent researchergrant (11-106163) from the Danish Council for IndependentResearch | Natural Sciences. MSW received support from theGreenl<strong>and</strong> Climate Research Centre project number 6505. PR<strong>and</strong> ML acknowledge funding from the Academy of Finl<strong>and</strong>(Project Number 1140873). We are grateful to Kimmo Saarinenfor kindly providing the NAFI Butterfly Atlas for the purposes ofthis study.REFERENCESAlgar, A.C., Kharouba, H.M., Young, E.R. & Kerr, J.T. (2009)Predicting the future of <strong>species</strong> diversity: macroecologicaltheory, climate change, <strong>and</strong> direct tests of alternative forecastingmethods. Ecography, 32, 22–33.Allouche, O., Tsoar, A. & Kadmon, R. (2006) Assessing the accuracyof <strong>species</strong> <strong>distribution</strong> <strong>models</strong>: prevalence, kappa <strong>and</strong> thetrue skill statistic (TSS). Journal of Applied Ecology, 43, 1223–1232.Angert, A.L., Crozier, L.G., Rissler, L.J., Gilman, S.E., Tewksbury,J.J. & Chunco, A.J. (2011) Do <strong>species</strong>’ traits predictrecent shifts at exp<strong>and</strong>ing range edges? Ecology Letters, 14,677–689.Araújo, M.B. & Rahbek, C. (2006) How does climate changeaffect biodiversity? Science, 313, 1396–1397.Araújo, M.B., Pearson, R.G., Thuiller, W. & Erhard, M. (2005)Validation of <strong>species</strong>–climate impact <strong>models</strong> under climatechange. Global Change Biology, 11, 1504–1513.Atlas of Finl<strong>and</strong> (1988) Climate, Folio 131. National Board ofSurvey <strong>and</strong> Geographical Society of Finl<strong>and</strong>, Helsinki.Coudun, C., Gegout, J.-C., Piedallu, C. & Rameau, J.-C. (2006)Soil nutritional factors improve <strong>models</strong> of plant <strong>species</strong> <strong>distribution</strong>:an illustration with Acer campestre (L.) in France.Journal of Biogeography, 33, 1750–1763.Devictor, V., van Swaay, C., Brereton, T. et al. (2012) Differencesin the climatic debts of birds <strong>and</strong> butterflies at a continentalscale. Nature Climate Change, 2, 121–124.Elith, J., Graham, C.H., Anderson, R.P. et al. (2006) Novelmethods improve prediction of <strong>species</strong>’ <strong>distribution</strong>s fromoccurrence data. Ecography, 29, 129–151.Elith, J., Leathwick, J.R. & Hastie, T. (2008) A working guide toboosted regression trees. Journal of Animal Ecology, 77, 802–813.Elith, J., Kearney, M. & Phillips, S. (2010) The art of modellingrange-shifting <strong>species</strong>. Methods in Ecology <strong>and</strong> Evolution, 1,330–342.European Environment Agency (1994) CORINE l<strong>and</strong> covertechnical guide. Report No. EUR 12585 EN edition. Luxemburg:Commission of the European Communities.Fielding, A.H. & Bell, J.F. (1997) A review of methods for theassessment of prediction errors in conservation presence/absence <strong>models</strong>. Environmental Conservation, 24, 38–49.Fitzpatrick, M.C. & Hargrove, W.W. (2009) The projection of<strong>species</strong> <strong>distribution</strong> <strong>models</strong> <strong>and</strong> the problem of non-analogclimate. Biodiversity <strong>and</strong> Conservation, 18, 2255–2261.Gaston, K.J. (2003) The structure <strong>and</strong> dynamics of geographicranges, 1st edn. Oxford University Press, Oxford.Heikkinen, R.K., Luoto, M., Araújo, M.B., Virkkala, R., Thuiller,W. & Sykes, M.T. (2006) Methods <strong>and</strong> uncertainties in bioclimaticenvelope modelling under climate change. Progress inPhysical Geography, 30, 751–777.Heikkinen, R.K., Luoto, M., Virkkala, R., Pearson, R.G. &Korber, J.-H. (2007) Biotic interactions improve prediction ofboreal bird <strong>distribution</strong>s at macro-scales. Global Ecology <strong>and</strong>Biogeography, 16, 754–763.Global Ecology <strong>and</strong> Biogeography, ••, ••–••, © 2013 John Wiley & Sons Ltd 9
A. Eskildsen et al.Heikkinen, R.K., Marmion, M. & Luoto, M. (2012) Does theinterpolation accuracy of <strong>species</strong> <strong>distribution</strong> <strong>models</strong> come atthe expense of transferability? Ecography, 35, 276–288.Hewitt, G. (2000) The genetic legacy of the Quaternary ice ages.Nature, 405, 907–913.Hijmans, R.J. & Graham, C.H. (2006) The ability of climateenvelope <strong>models</strong> to predict the effect of climate change on<strong>species</strong> <strong>distribution</strong>s. Global Change Biology, 12, 2272–2281.Hill, J.K., Thomas, C.D. & Huntley, B. (2003) Modelling present<strong>and</strong> potential future ranges of European butterflies usingclimate response surfaces. Butterflies: ecology <strong>and</strong> evolutiontaking flight (ed. by C.L. Boggs, W.B. Watt <strong>and</strong> P.R. Ehrlich),pp. 149–167. University of Chicago Press, Chicago, IL.Kattsov, V.M., Källén, E., Cattle, H.P., Christensen, J., Drange,H., Hanssen-Bauer, I., Jóhannesen, T., Karol, I., Räisänen, J.,Svensson, G. & Vavulin, S. (2005) Future climate change:modeling <strong>and</strong> scenarios for the Arctic. Arctic climate impactassessment, pp. 99–150. Cambridge University Press,Cambridge.Kharouba, H.M., Algar, A.C. & Kerr, J.T. (2009) Historicallycalibrated predictions of butterfly <strong>species</strong>’ range shift usingglobal change as a pseudo-experiment. Ecology, 90, 2213–2222.Komonen, A., Grapputo, A., Kaitala, V., Kotiaho, J.S. & Päivinen,J. (2004) The role of niche breadth, resource availability <strong>and</strong>range position on the life history of butterflies. Oikos, 105,41–54.L<strong>and</strong>is, J.R. & Koch, G.G. (1977) The measurement of observeragreement for categorical data. Biometrics, 33, 159–174.Luoto, M. (2007) The role of l<strong>and</strong> cover in bioclimatic <strong>models</strong>depends on spatial resolution. Global Ecology <strong>and</strong> Biogeography,16, 34–42.Luoto, M., Pöyry, J., Heikkinen, R.K. & Saarinen, K. (2005)Uncertainty of bioclimate envelope <strong>models</strong> based on the geographical<strong>distribution</strong> of <strong>species</strong>. Global Ecology <strong>and</strong> Biogeography,14, 575–584.Luoto, M., Heikkinen, R.K., Pöyry, J. & Saarinen, K. (2006)Determinants of the biogeographical <strong>distribution</strong> ofbutterflies in boreal regions. Journal of Biogeography, 33,1764–1778.Menéndez, R., Megías, A.G., Hill, J.K., Braschler, B., Willis, S.G.,Collingham, Y., Fox, R., Roy, D.B. & Thomas, C.D. (2006)Species richness changes lag behind climate change. Proceedingsof the Royal Society B: Biological Sciences, 273, 1465–1470.Mitikka, V., Heikkinen, R.K., Luoto, M., Araujo, M.B., Saarinen,K., Poyry, J. & Fronzek, S. (2008) Predicting range expansionof the map butterfly in Northern Europe using bioclimatic<strong>models</strong>. Biodiversity <strong>and</strong> Conservation, 17, 623–641.Parmesan, C., Ryrholm, N., Stefanescu, C., Hill, J.K., Thomas,C.D., Descimon, H., Huntley, B., Kaila, L., Kullberg, J.,Tammaru, T., Tennent, W.J., Thomas, J.A. & Warren, M.(1999) Poleward shifts in geographical ranges of butterfly<strong>species</strong> associated with regional warming. Nature, 399, 579–583.Pearson, R.G. & Dawson, T.P. (2003) Predicting the impacts ofclimate change on the <strong>distribution</strong> of <strong>species</strong>: are bioclimateenvelope <strong>models</strong> useful? Global Ecology <strong>and</strong> Biogeography, 12,361–371.Pearson, R.G., Dawson, T.P. & Liu, C. (2004) Modelling <strong>species</strong><strong>distribution</strong>s in Britain: a hierarchical integration of climate<strong>and</strong> l<strong>and</strong>-cover data. Ecography, 27, 285–298.Pöyry, J., Luoto, M., Heikkinen, R.K. & Saarinen, K. (2008)Species traits are associated with the quality of bioclimatic<strong>models</strong>. Global Ecology <strong>and</strong> Biogeography, 17, 403–414.Pöyry, J., Luoto, M., Heikkinen, R.K., Kuussaari, M. & Saarinen,K. (2009) Species traits explain recent range shifts of Finnishbutterflies. Global Change Biology, 15, 732–743.Prentice, I.C., Bartlein, P.J. & Thompson, W., III (1991) Vegetation<strong>and</strong> climate change in Eastern North America since thelast glacial maximum. Ecology, 72, 2038–2056.Raynaud, X. (2004) Soil characteristics play a key role in modelingnutrient competition in plant communities. Ecology, 85,2200–2214.Ridgeway, G. (2006) gbm: generalized boosted regression <strong>models</strong>.R package version 1.6-3. Available at: http://www.ipensieri.com/gregr/gbm.shtml(accessed 16 March 2012).Roberts, D.R. & Hamann, A. (2012) Method selection for <strong>species</strong><strong>distribution</strong> modelling: are temporally or spatially independentevaluations necessary? Ecography, 35, 792–802.Saarinen, K., Lahti, T. & Marttila, O. (2003) Population trends ofFinnish butterflies (Lepidoptera: Hesperioidea, Papilionoidea)in 1991–2000. Biodiversity <strong>and</strong> Conservation, 12, 2147–2159.Schurr, F.M., Pagel, J., Cabral, J.S., Groeneveld, J., Bykova, O.,O’Hara, R.B., Hartig, F., Kissling, W.D., Linder, H.P., Midgely,G.F., Schröder, B., Singer, A. & Zimmermann, N. (2012) Howto underst<strong>and</strong> <strong>species</strong>’ niches <strong>and</strong> range dynamics: a demographicresearch agenda for biogeography. Journal of Biogeography,12, 2146–2162.Sinclair, S.J., White, M.D. & Newell, G.R. (2010) How useful are<strong>species</strong> <strong>distribution</strong> <strong>models</strong> for managing biodiversity underfuture climates? Ecology <strong>and</strong> Society, 15, 8.Swets, J. (1988) Measuring the accuracy of diagnostic systems.Science, 240, 1285–1293.Tietäväinen, H. (2010) Annual <strong>and</strong> seasonal mean temperaturesin Finl<strong>and</strong> during the last 160 years based on gridded temperaturedata. International Journal of Climatology, 30, 2247–2256.Titeux, N., Maes, D., Marmion, M., Luoto, M. & Heikkinen, R.K.(2009) Inclusion of soil data improves the performance ofbioclimatic envelope <strong>models</strong> for insect <strong>species</strong> <strong>distribution</strong>s intemperate Europe. Journal of Biogeography, 36, 1459–1473.Venäläinen, A. & Heikinheimo, M. (2002) Meteorological datafor agricultural applications. Physics <strong>and</strong> Chemistry of theEarth, Parts A/B/C, 27, 1045–1050.White, P. & Kerr, J.T. (2006) Contrasting spatial <strong>and</strong> temporalglobal change impacts on butterfly <strong>species</strong> richness during the20th century. Ecography, 29, 908–918.White, P.J.T. & Kerr, J.T. (2007) Human impacts onenvironment–diversity relationships: evidence for biotichomogenization from butterfly <strong>species</strong> richness patterns.Global Ecology <strong>and</strong> Biogeography, 16, 290–299.10Global Ecology <strong>and</strong> Biogeography, ••, ••–••, © 2013 John Wiley & Sons Ltd
<strong>Testing</strong> SDMs <strong>across</strong> <strong>space</strong> <strong>and</strong> <strong>time</strong>Wiens, J.A. (1989) Spatial scaling in ecology. Functional Ecology,3, 385–397.Wood, S.N. (2006) Generalized additive <strong>models</strong>: an introductionwith R. Chapman & Hall/CRC, Boca Raton, FL.Yates, C.J., Elith, J., La<strong>time</strong>r, A.M., Le Maitre, D., Midgley, G.F.,Schurr, F.M. & West, A.G. (2010) Projecting climate changeimpacts on <strong>species</strong> <strong>distribution</strong>s in megadiverse South AfricanCape <strong>and</strong> Southwest Australian Floristic Regions: opportunities<strong>and</strong> challenges. Austral Ecology, 35, 374–391.Yee, T.W. & Mitchell, N.D. (1991) Generalized additive <strong>models</strong>in plant ecology. Journal of Vegetation Science, 2, 587–602.SUPPORTING INFORMATIONAdditional supporting information may be found in the onlineversion of this article at the publisher’s web-site.Figure S1 Relationships between the accuracy of generalizedadditive <strong>models</strong> (GAM) <strong>and</strong> boosted regression tree (BRT)<strong>models</strong> validated with independent <strong>and</strong> non-independentobservations, evaluated with area under the curve of a receiveroperating characteristic plot (AUC) <strong>and</strong> true skill statistic (TSS).Figures in the left column are based on climate-only <strong>models</strong>,while figures in the right column are based on combinedclimate-soil-l<strong>and</strong>-cover <strong>models</strong>. Rho (r) values for Spearman’srank correlations (P < 0.001 for all), as well as linear regressionfits are shown. Dotted lines indicate the 1:1 relationship. A dropin r values between climate-only <strong>models</strong> (left) <strong>and</strong> combinedclimate-soil-l<strong>and</strong>-cover <strong>models</strong> (right) indicates that some<strong>species</strong> <strong>distribution</strong>s are better predicted when using independentvalidation in combination with more complex <strong>models</strong>.BIOSKETCHAnne Eskildsen is a PhD student at AarhusUniversity’s Department of Bioscience under thesupervision of Toke T. Høye <strong>and</strong> W. Daniel Kissling.Her main areas of research are the effects of l<strong>and</strong> use<strong>and</strong> climate change on the persistence of butterflypopulations in Western Europe. The team of co-authorsis interested in macroecology, biogeography, <strong>species</strong><strong>distribution</strong>s, population ecology <strong>and</strong> global change.Editor: Jeremy KerrGlobal Ecology <strong>and</strong> Biogeography, ••, ••–••, © 2013 John Wiley & Sons Ltd 11