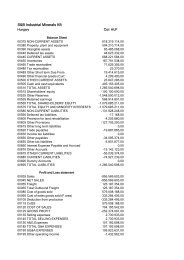
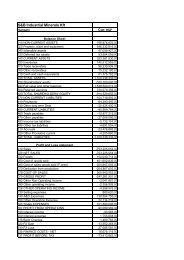
Financial HighlightsContinuing operationsEvolution of Key FiguresSalesEBITDAEarnings Per ShareNet Debt355423456336420616765600.470.56154191203390.351221130.260.05in € million‘06 ‘07 ‘08 ‘09 ‘10in € million‘06 ‘07 ‘08 ‘09 ‘10in €‘06 ‘07 ‘08 ‘09 ‘10in € million‘06 ‘07 ‘08 ‘09 ‘10Net Debt / EBITDANet Debt / EquityTrade Working Capital / SalesNet Capex / Sales2.52.83.1 3.11.90.901.031.0527.2% 27.0%26.0%23.4%20.0%5.8%6.1%6.6%9.0%5.8%0.530.46‘06 ‘07 ‘08 ‘09 ‘10‘06 ‘07 ‘08 ‘09 ‘10‘06 ‘07 ‘08 ‘09 ‘10‘06 ‘07 ‘08 ‘09 ‘108 S&B Industrial Minerals S.A.
<strong>2010</strong> 2009 2008 2007SUMMARY P&L (€ ’000s)Sales 420,134 335,835 456,393 423,298EBITDA 1 59,817 38,958 65,290 67,036Operating Profit 27,611 14,365 37,878 39,838Profit before Taxes 21,758 7,325 19,846 31,400Net Profit 12,875 1,900 14,258 22,374Net Profit (after Tax & Minorities) 13,133 2,085 13,988 22,505EBITDA margin 14.2% 11.6% 14.3% 15.8%Operating profit margin 6.6% 4.3% 8.3% 9.4%Outstanding No of Shares 51,782,200 41,425,760 31,010,717 30,876,660Basic Weighted Average No of Shares 2 51,233,839 43,543,176 40,541,119 40,262,012DATA PER SHARE (€)Basic Earnings per Share 2 0.26 0.05 0.35 0.56Cash Earnings per Share (CEPS) 2,3 0.87 0.61 0.98 1.19Dividend per Share - nominal 0.25 * 0.12 0.16 0.31Dividend per Share - adjusted 2 0.25 * 0.10 0.10 0.19* proposed capital return instead of a dividendSUMMARY FINANCIAL POSITION (€ ’000s)AssetsNon-current assets 333,000 335,923 330,280 322,935Current assets 190,671 174,933 180,625 175,105Total assets 523,671 510,856 510,905 498,040LiabilitiesNon-current liabilities 172,641 207,147 172,048 223,714Current liabilities 108,072 72,682 145,078 88,875Total liabilities 280,713 279,829 317,126 312,589EquityOwners of the Company 242,397 229,932 192,445 183,829Non-controlling interests 561 1,095 1,334 1,622Total equity 242,958 231,027 193,779 185,451ROE 4 5.3% 0.8% 7.4% 12.1%Net Debt 112,913 121,920 203,149 190,900Free Cash Flow from Operations 43,540 87,033 34,606 35,481Notes:1. EBITDA: Profit before income tax, depreciation, financial and investment results2. In line with IFRS requirements, the weighted average number of shares in all years prior to 2009 has been adjusted to reflect the rights issue completedon September 21, 2009 using a 1.049 factor on the average number of shares prior to that date. In addition, for all years prior to <strong>2010</strong> it hasbeen adjusted to reflect the 1-for-4 bonus share issue completed on August 9, <strong>2010</strong> using a 1.25 factor on the average number of shares prior tothat date. As a result, all per share indicators in all years prior to <strong>2010</strong> (except for nominal dividends ) are equally adjusted for both of these corporateactions.3. Cash Earnings per Share (CEPS) = [Net Group Profit (after Tax & Minorities) + Depreciation&Amortisation] / Basic Weighted Average No of Shares4. Return on Equity (ROE) = Net Profit / Total Equity<strong>Annual</strong> <strong>Report</strong> <strong>2010</strong>9