C l l ti BIR th d Calculations - BIR method and NCRP 147
C l l ti BIR th d Calculations - BIR method and NCRP 147
C l l ti BIR th d Calculations - BIR method and NCRP 147
You also want an ePaper? Increase the reach of your titles
YUMPU automatically turns print PDFs into web optimized ePapers that Google loves.
Calcula<strong>ti</strong>ons l - <strong>BIR</strong> me<strong>th</strong>od<strong>and</strong> <strong>NCRP</strong> <strong>147</strong>David Sutton PhD
1. Ca<strong>th</strong> Lab• Indica<strong>ti</strong>ve of all C-arm applica<strong>ti</strong>ons• Only secondary radia<strong>ti</strong>on– Primary Beam is stopped by <strong>th</strong>e imageintensifier
Geometry <strong>BIR</strong>9.5 mPrepara<strong>ti</strong>on2.6 mMonitorsComputer room6 mRecovery63m 6.3
Geometry <strong>NCRP</strong> <strong>147</strong>14.6 mPrepara<strong>ti</strong>on4 mMonitorsComputer room9.2 mRecovery97m 9.7
Workload <strong>BIR</strong> calcula<strong>ti</strong>on• Sources:– ‘Doses to pa<strong>ti</strong>ents from radiographic <strong>and</strong>fluoroscopic x-ray imaging procedures in<strong>th</strong>e UK - 2005 Review’ : HPA– Poten<strong>ti</strong>al Irish dose reference levels forcardiac interven<strong>ti</strong>onal procedures’ : BJR2009– <strong>BIR</strong> report (2000)
Workload <strong>BIR</strong> calcula<strong>ti</strong>on• Basis for calcula<strong>ti</strong>ons– Chose 75<strong>th</strong> percen<strong>ti</strong>le of dose distribu<strong>ti</strong>onin bo<strong>th</strong> surveys– Conserva<strong>ti</strong>ve– Basis for na<strong>ti</strong>onal dose reference levels.
UK DataExam N Sites DAP/kVexam (mean)CA 34236 38 29 79PTCA (1 6111 9 50 71stent)PPI 2682 17 11 75Ca<strong>th</strong>lab - - 26 80<strong>BIR</strong> 1Ca<strong>th</strong>lab - - 50 80<strong>BIR</strong> 2(100)
Irish DataExam N Sites DAP/kVexam (mean)CA 967 14 42 -PCI 463 14 84 -CA-PCI 134 14 107 -PPI 240 14 21 -
Varia<strong>ti</strong>on wi<strong>th</strong> complexity(PCTA)Exam N Room DAP/ kVs exam (mean)PCTA 1 6111 28 50 71PCTA 2 779 9 74 -PCTA 3 289 6 130 --
<strong>BIR</strong> Calcula<strong>ti</strong>on• Evaluate barrier <strong>th</strong>ickness required– 25 pa<strong>ti</strong>ents per week– Assume exams performed at 100 kV forconserva<strong>ti</strong>sm– Use 2.6m <strong>and</strong> 4.0 m as cri<strong>ti</strong>cal distance– Dose constraint• 0.3 mSv / y• 1.0 mSv / y
Results (300 uGy)Code 3Exam KAP Smax (100) mm @2.6m mm @4mUKCA 29 162 1.02 0.72Ca<strong>th</strong> (<strong>BIR</strong>) 50 280 1.22 0.90PPI 11 62 068 0.68 042 0.42PTCA 50 280 1.22 0.90IRELAND BJR 2009CA 42 235 1.16 0.84PCI 84 470 1.42 1.09CAPCI 107 599 1.51 1.18PPI 21 118 0.90 0.61
Results (1000 uGy)Code 3Exam KAP Smax (100) mm @2.6m mm @4mUKCA 29 162 0.61 0.36Ca<strong>th</strong> (<strong>BIR</strong>) 50 280 0.78 0.51PPI 11 62 0.34 0.16PTCA 50 280 0.78 0.51IRELAND BJR 2009CA 42 235 0.73 0.46PCI 84 470 0.97 0.67CAPCI 107 599 1.06 0.75PPI 21 118 0.51 0.29
Effect of increasing workload• In reality use a mixed workload.• Here just use PCTA• Increase <strong>th</strong>e number of procedures perweek
Effect of increasing workloadCode 42.001.501.002.6m4m0.500.000 20 40 60 80 100Pa<strong>ti</strong>ents/wk
Effect of changing doseconstraint PTCA 25/wk2.00mm Pb150 1.501.00050 0.502.6 m4 m0.000 1000 2000Dose Constraint
<strong>NCRP</strong> Me<strong>th</strong>odology• Secondary dose of 3800 uGy at 1 metrefrom each pa<strong>ti</strong>ent in a ca<strong>th</strong> lab.• No breakdown by procedure• 176 pa<strong>ti</strong>ents surveyed in 4 ins<strong>ti</strong>tu<strong>ti</strong>ons in1996• Slightly different fit<strong>ti</strong>ng coefficients
<strong>NCRP</strong> <strong>147</strong>2.6m 4mDC300 2.17 1.821000 1.68 1.33
<strong>NCRP</strong> <strong>147</strong>2.6m 4mDC300 2.17 (code5) 1.82 (code 4)1000 1.68 1.33<strong>BIR</strong>300 122 1.22 09 0.91000 0.78 0.51
Different Outcomes3.002.502.002.6m4m2.6 m <strong>NCRP</strong>4m <strong>NCRP</strong>1.501.000.500.000 20 40 60 80 100Pa<strong>ti</strong>ents/wk
Differences• Scatter model• Field area assump<strong>ti</strong>on• Pa<strong>ti</strong>ent workload data• Dose constraintst• Transmission data
Differences - Scatter125 kVp100 kVp85 kVp70 kVp50 kVp
Differences - ScatterPCTA KAP 80 100 1201 stent 50 247 280 3112 stent 74 366 414 4603 stent 130 643 728 809CAPCI 107 530 599 666
Differences - ScatterPCTA KAP 80 100 1201 stent 50 247 280 3112 stent 74 366 414 4603 stent 130 643 728 809CAPCI 107 530 599 666CLAB 680 3365 3808 4230
<strong>NCRP</strong> scatter determina<strong>ti</strong>on• Symmetrical, not S shaped• Expressed as frac<strong>ti</strong>onal scatter per cm 2• Assume 12” (38cm) II• At 140 degrees= 7x10 -6• At 117 degrees = 5.75 x 10 -6• 3800 uGy at 1 m predicts KAP of 439 - 535Gy cm 2
Scatter frac<strong>ti</strong>on<strong>NCRP</strong> <strong>147</strong><strong>BIR</strong>ESR 100 8.64x10 -6 56x10 5.6x10 -6
Coefficients for transmissionequa<strong>ti</strong>on200 2.001.501.00<strong>BIR</strong><strong>NCRP</strong>0.500.000 50 100 150Pa<strong>ti</strong>ents / wk
Which only leaves workload• Weekly workload of 25 pa<strong>ti</strong>ents ataverage of 160mA min per pa<strong>ti</strong>ent.• Equates to a KAP per pa<strong>ti</strong>ent ofbetween 440 <strong>and</strong> 680 Gy cm2• Much higher <strong>th</strong>an UK & Irish (Europeannumbers)•Why?
Ques<strong>ti</strong>ons• ? Age of data <strong>and</strong> / or case mix• American prac<strong>ti</strong>ce ??• ? Effect of copper filtra<strong>ti</strong>on– mA min will increase drama<strong>ti</strong>cally wi<strong>th</strong>copper, but air kerma will decrease.H d <strong>th</strong> l <strong>th</strong> d• How do you use <strong>th</strong>e general me<strong>th</strong>odhere (cf copper filtra<strong>ti</strong>on)?
WARNING!• UK workload data apply only in UK• UK workload drivers– Legisla<strong>ti</strong>on• Jus<strong>ti</strong>fica<strong>ti</strong>on/ Op<strong>ti</strong>misa<strong>ti</strong>on– Public Heal<strong>th</strong>care provisionDerive your own workload data
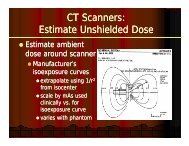
2. CT• 2 different me<strong>th</strong>odologies.• <strong>NCRP</strong> analagous to <strong>th</strong>e KAP versusscatter approach.• <strong>BIR</strong> me<strong>th</strong>od reliant on manufacturersupplied isodose data.
120 kVp; 250 mAs
CT Calcula<strong>ti</strong>on la<strong>ti</strong>on (G)Distance:(4.0/cos 36) = 4.9 mWeekly workload:3340 x 250 mAs slicesDistance to 2 µGy isodose:1.7 mDose per week:2 x 3340 x (1.7/4.9) 2= 800 µGyTransmission:7.2 x 10 -3Concrete <strong>th</strong>ickness:100 mmThickness at 36°:100 x (1 + cos36)/2= 90 mm
JRP December 2008• Three manufacturer’s scanners.• Scattered radia<strong>ti</strong>on measured wi<strong>th</strong> tldmaterial.• Measurements compared wi<strong>th</strong> kermapredicted ei<strong>th</strong>er from CTDI / DLP /Cri<strong>ti</strong>cal direc<strong>ti</strong>on from isodose plots.• JRP 28 (2008) 511-523
Geometry
Scanner 1 (German)d mSv <strong>BIR</strong> DLP CTDI1 45 4.5 14 1.4 10.9 44 4.4 30 3.02 2.65 7.0 35.3 12.6 8.6Gantry 2.15 0.5 1.9 19.1 13.14 24 2.4 87 8.7 23.4 15.3 10.55 2.25 4.8 40.2 17.4 12.0
Scanner 2 (Bri<strong>ti</strong>sh)d mSv <strong>BIR</strong> DLP CTDI1 42 4.2 14 1.4 34 3.4 33 3.3 18 1.82 4.0 4.2 6.6 3.6 2.0Gantry 2.15 1.5 0 12.6 7.04 262 2.62 63 6.3 13.11 84 8.4 47 4.75 2.75 11.5 17.4 7.7 4.3
Scanner 2 (Bri<strong>ti</strong>sh)d mSv <strong>BIR</strong> DLP CTDI1 42 4.2 14 1.4 34 3.4 33 3.3 18 1.82 4.0 4.2 6.6 3.6 2.0Gantry 2.15 1.5 0 12.6 7.04 262 2.62 63 6.3 13.11 84 8.4 47 4.75 2.75 11.5 17.4 7.7 4.3
Scanner 3 (Dutch)d mSv <strong>BIR</strong> DLP CTDI1 412 4.12 05 0.5 22 2.2 16 1.6 06 0.62 2.58 3.3 5.8 4.0 1.4Gantry 1.74 0.2 0.6 8.7 3.14 288 2.88 20 2.0 14 1.4 32 3.2 11 1.15 2.25 2.25 9.3 5.2 1.9
IPEM Annual Scien<strong>ti</strong>fic Mee<strong>ti</strong>ngBarrier 32006AHBarrier 2Barrier 4AHIsocentre-wallBarrier 1
Results 1<strong>NCRP</strong> Me<strong>th</strong>od<strong>BIR</strong> Me<strong>th</strong>odDirec<strong>ti</strong>on Distance (m) Annual Dose Distance (m) Annual DosemGymGyBarrier 1 2.26 334 2.76 341Barrier 2 2.32 317 2.34 491Barrier 3 262 2.62 248 283 2.83 320Barrier 4 4.14 99 4.3 138Ceiling 226 2.26 334 29 2.9 366
Results 2<strong>NCRP</strong> Me<strong>th</strong>od<strong>BIR</strong> Me<strong>th</strong>odDirec<strong>ti</strong>on Dose per Slice uGy Dose per Slice uGyHead Body Head BodyBarrier 1 1.06 4.46 3.25 2.85Barrier 2 1 4.24 4.8 4Barrier 3 079 0.79 332 3.32 29 2.9 28 2.8Barrier 4 0.32 1.33 1.28 1.18Ceiling 106 1.06 446 4.46 327 3.27 325 3.25
Observa<strong>ti</strong>ons• <strong>NCRP</strong> me<strong>th</strong>ods get it wrong at <strong>th</strong>e gantry (does it matter)• The <strong>BIR</strong> me<strong>th</strong>od is complicated, requiring i a number ofmeasurements from scale drawings, interpola<strong>ti</strong>ons<strong>and</strong> conversion of workload into st<strong>and</strong>ard slices.• The <strong>NCRP</strong> me<strong>th</strong>od is much simpler <strong>and</strong> quicker requiring onlylimited measurements from scale drawings.• The <strong>BIR</strong> produces most overes<strong>ti</strong>mates of actual dose <strong>and</strong> hencemost ‘conserav<strong>ti</strong>ve’ shielding.• CTDI based technique produces underes<strong>ti</strong>mates <strong>and</strong> should beapproached wi<strong>th</strong> cau<strong>ti</strong>on• Manufacturer’s isodose plots should be approached wi<strong>th</strong> cau<strong>ti</strong>on• Apart from gantry, DLP me<strong>th</strong>od produces closest match, but s<strong>ti</strong>lloveres<strong>ti</strong>mates in general.
Mammography• <strong>NCRP</strong> <strong>147</strong> : 36 uGy per pa<strong>ti</strong>ent.• <strong>BIR</strong> : 7.6 uGy per film, 3 films perpa<strong>ti</strong>ent = 23 uGy per pa<strong>ti</strong>ent• No difference in overall conclusion.
Dental• <strong>NCRP</strong> <strong>147</strong> doesn’t consider dentalradiography.• <strong>BIR</strong> : Max kerma at 1 m = 1uGy/film forintra oral radiography.• Table showing number of films perweek versus barrier <strong>th</strong>ickness <strong>and</strong>distance from <strong>th</strong>e x-ray set.
Dental Intra-oralBarrier distance (m)Films/ week 1 1.5 2 2.5 310 0.58 - - - -20 0.29 0.65 - - -50 0.12 0.26 0.46 0.72 -100 0.06 0.13 0.23 0.36 0.71200 003 0.03 006 0.06 012 0.12 018 0.18 035 0.35
DEXA• H<strong>and</strong>waving on all sides.• Usually, no need to shield.
THAT’S IT –THANK YOU


