Nutrient Distribution of Islands in Terengganu Waters of East Coast ...
Nutrient Distribution of Islands in Terengganu Waters of East Coast ...
Nutrient Distribution of Islands in Terengganu Waters of East Coast ...

Create successful ePaper yourself
Turn your PDF publications into a flip-book with our unique Google optimized e-Paper software.
PULAU PERHENTIAN-15 – 17 May 2012 (2 days)-10 stations
PULAU REDANG-18 – 20 May 2012 (3 days)-13stations
PULAU LANG TENGAH-21 May 2012 (1 days)-4 stations
PULAU BIDONG-25 – 26 May 2012 (2 days)-12 stations
PULAU YU-23 – 24 May 2012 (2 days)-4 stations
PULAU KAPAS-28 – 29 May 2012 (2 days)-11 stations
PULAU TENGOL-5 – 6 May 2012 (2 days)-12 stations
Instruments:1. Rossette Water Sampler2. CTD3. pH sensor4. ADCP5. UV-Spectrophotometer
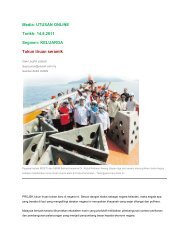
Research Vessel – Discovery II
Method <strong>of</strong> Analysis• Nitrogen:NO 2- -N (APHA, 2005)NO 3- -N (APHA, 2005)NH 3 -N (APHA, 2005)• Phosphorous:(PO 4-3-P) (APHA, 2005)• Dissolved Organic Carbon(TOC analyzer, Shimadzu)
ResultsandDiscussion
Station Depth(m) PO 4(µg/L) NH 3(µg/L) NO 2(µg/L) NO 3(µg/L)2 1.061 31.048 0.183 100.624LT01 10 3.712 13.443 0.203 71.48425 2.651 5.441 0.183 70.4842 3.182 5.441 0.061 39.979LT03 10 1.591 4.801 0.102 88.82824 3.182 8.322 0.203 64.0002 1.061 5.121 0.224 76.484LT05 10 3.712 9.282 0.061 84.97929 3.182 12.483 0.244 58.1292 1.591 6.402 0.163 47.732LT07 10 1.591 7.682 0.102 76.29128 2.121 7.362 0.366 39.473Lang Tengah Island• The nutrient level re relatively low.• Water depth were generally below 30 meters depth.
Station Depth(m) PO 4(µg/L) NH 3(µg/L) NO 2(µg/L) NO 3(µg/L) TOC (µmol/L )2 1.591 4.801 0.187 104.484 82.63PB0110 2.651 21.445 0.061 85.979 103.216 2.386 14.084 0.081 69.140 42.372 1.591 6.082 0.041 97.635 68.69PB0410 3.182 8.322 0.163 102.140 80.0220 1.591 6.082 0.203 113.807 76.42 n.d. 7.042 0.102 104.108 75.88PB0710 2.121 5.761 0.061 109.484 64.4330 3.182 4.801 0.509 113.129 40.93PB082 1.591 5.121 0.122 102.807 47.9110 n.d. 4.801 0.183 92.624 n.a.2 2.121 4.801 0.122 120.312 49.9PB1010 3.182 10.563 0.020 112.645 83.720 1.591 6.402 0.285 98.968 49PB132 4.242 8.642 0.081 72.463 53.7210 1.591 9.602 0.163 68.066 98.32 n.d. 6.402 0.061 112.785 82.67PB1410 n.d. 4.481 0.305 53.119 23.5218 1.591 14.724 0.671 111.947 10.67PB162 2.651 25.927 0.142 43.108 615.110 1.591 4.801 0.183 122.140 45.24PB192 2.121 6.722 0.183 46.796 51.167 1.591 7.042 0.285 108.807 48.812 3.182 6.082 0.041 96.463 52.65PB2010 3.182 23.686 0.020 102.291 72.9214 3.712 16.644 0.061 99.291 50.672 1.591 5.761 0.061 64.635 175.4PB2210 2.651 8.642 0.102 75.624 57.0223 1.591 8.322 0.061 100.441 49.182 n.d. 8.962 0.061 68.161 20.75PB2310 1.591 6.082 0.061 87.989 n.a.14 1.591 8.002 0.081 80.473 41.8Bidong Island
Station Depth(m) PO (µg/L) NH (µg/L) NO (µg/L) NO (µg/L) TOC (µmol C/l )24n.d.328.80720.895333.828 29.830PR0110 n.d. 28.487 0.610 n.a. n.a.16 n.d. n.d. 0.305 58.473 33.13023 2.651 23.686 3.215 87.645 76.3402 1.591 24.326 0.549 60.817 24.770PR03 10 n.d. 21.445 0.529 58.140 28.24042 1.591 22.726 3.642 67.463 24.6302 0.530 22.406 0.529 50.441 50.150PR04 10 3.182 21.766 1.221 70.592 57.61026 1.591 23.686 3.744 80.785 57.1202 1.061 47.372 0.631 44.667 52.460PR07 10 n.d. 25.927 0.488 77.129 61.98032 1.591 29.127 4.436 70.979 23.590PR082 1.061 25.607 0.712 78.119 37.60010 1.591 24.966 0.814 70.968 39.240PR112 1.591 23.366 0.773 74.280 119.00010 n.d. 24.646 2.116 21.904 262.2002 1.591 20.165 0.936 69.645 0.000PR13 10 n.d. 21.125 0.814 77.301 64.03023 1.591 23.046 0.977 39.129 49.360PR142 1.591 6.722 0.570 86.119 134.00010 0.530 33.289 0.468 38.915 58.6902 1.061 7.042 0.549 67.936 75.430PR16 10 2.121 7.042 0.509 82.947 n.d.25 5.303 12.163 2.136 114.151 n.aPR182 n.d. 16.964 0.488 79.796 43.8608 1.591 20.485 0.509 53.441 66.4102 4.773 8.962 0.346 87.645 71.950PR20 10 4.242 28.167 0.326 73.076 n.a.30 2.121 11.523 0.346 42.656 55.4002 n.d. 29.127 0.733 74.785 65.030PR21 10 1.591 31.048 0.468 69.624 60.70027 4.242 34.569 2.482 80.775 94.6502 2.121 24.966 0.570 32.796 35.870PR23 10 4.773 24.006 0.427 80.452 64.73032 1.591 28.167 3.663 48.431 54.660RedangIslandThere is no significantlychanges with the studyconducted by Law et.al.(2001) from year 1995 –2000.
Yu Island• <strong>Nutrient</strong> distribution show no significantchanges with<strong>in</strong> layer and station.• However, the Nitrite generally show higherlevel at the bottom layer.Station Depth(m) PO 4(µg/L) NH 3(µg/L) NO 2(µg/L) NO 3(µg/L)2 5.303 8.322 0.081 84.979PY01 10 1.061 5.761 0.000 77.03540 4.773 6.082 5.514 96.9682 4.773 11.843 0.102 65.452PY02 10 n.d. 4.161 0.102 108.96834 4.242 4.801 5.880 114.9892 0.000 6.402 0.000 92.473PY03 10 2.121 7.682 0.142 104.29138 2.651 6.082 2.910 62.4952 0.530 8.002 0.183 106.129PY04 4 3.712 6.722 4.700 76.47310 n.d. 7.362 0.203 81.140
Station Depth(m) PO 4(µg/L) NH 3(µg/L) NO 2(µg/L) NO 3(µg/L)PK01 2 2.651 4.801 0.387 88.603PK022 1.061 3.841 0.041 75.73210 2.651 3.521 0.203 80.915PK032 2.651 4.481 0.102 85.7537 3.182 4.481 0.163 106.108PK042 1.591 7.042 0.203 90.6136 3.182 7.362 0.081 100.9572 n.d. 5.441 0.041 106.463PK05 10 4.773 7.682 1.933 95.75316 6.363 8.642 4.761 111.6352 3.182 4.481 0.061 84.269PK06 10 3.712 8.322 0.610 97.76418 4.242 6.082 5.697 94.775PK072 2.651 5.761 0.122 56.6248 3.182 6.082 0.122 97.2802 4.242 7.042 0.305 91.463PK08 10 5.303 5.121 3.072 97.61321 3.712 3.841 5.250 87.0872 3.712 7.682 0.305 89.796PK09 10 5.303 5.761 2.686 114.80716 4.773 5.441 3.561 86.613PK102 2.121 5.441 0.102 104.2699 3.182 4.481 1.994 96.1512 1.591 5.441 0.488 93.119PK14 10 3.182 6.082 0.102 93.26923 7.424 6.402 14.691 108.463PK162 1.591 4.161 0.163 85.60311 4.773 8.002 0.122 103.119Kapas Island• Receive <strong>in</strong>fluence from land.• Slightly higher compare to theothers.
StationPT01PT02PT03PT04PT05PT06PT07PT08PT11PT13PT14PT16Depth(m) PO (µg/L) NH (µg/L) NO (µg/L) NO (µg/L)249.545316.32420.061373.26910 2.121 2.881 0.427 80.78538 4.773 8.002 6.633 95.3012 3.182 26.887 1.078 83.95710 3.712 21.125 0.875 96.30148 5.833 23.686 12.331 67.0972 2.651 22.726 0.163 70.76410 15.378 61.136 0.285 60.07641 2.121 16.324 0.163 80.9792 1.591 6.082 0.285 102.31210 1.591 4.481 0.183 72.92548 7.954 34.889 7.061 49.2162 1.591 26.247 0.265 78.45210 1.591 19.845 0.122 75.95745 3.182 5.121 2.238 84.4412 7.954 22.406 0.122 75.77510 3.182 22.086 0.427 87.11950 5.303 24.006 6.816 87.1192 3.182 16.324 0.346 77.45210 10.606 23.686 0.020 91.11930 11.666 29.127 6.409 65.2382 3.182 38.090 0.041 81.94710 1.591 19.845 0.020 89.62445 16.969 23.686 6.816 88.8072 9.545 20.485 0.203 80.96810 9.015 21.125 0.081 66.43136 10.606 27.527 0.081 60.7432 1.591 4.801 0.203 87.29110 8.484 24.326 0.102 94.12951 7.954 18.885 6.959 45.5392 0.530 22.406 0.224 67.46310 2.651 27.847 0.387 66.96858 3.182 20.485 5.128 92.6132 4.242 17.605 0.122 79.61310 2.651 22.726 0.142 58.62450 6.363 22.086 6.918 55.925Tenggol Island• Most <strong>of</strong> the bottom layer havehigher nutrient level. It could due:- current movement- Bottom m<strong>in</strong>eralization• Current measurement wouldattribute to understand thevariation and carry<strong>in</strong>g capacity fornutrient <strong>in</strong> these station.
StationPP01PP04PP08PP10PP11PP13PP16PP19PP22PP23Depth(m) PO 4(µg/L) NH 3(µg/L) NO 2(µg/L) NO 3(µg/L)2 3.712 8.962 0.041 89.32310 1.591 4.801 0.570 93.94723 1.591 23.046 0.224 51.2482 1.591 8.002 0.041 99.65610 1.591 6.082 0.061 93.29117 1.591 7.682 0.061 91.2912 3.182 14.724 0.061 58.64510 1.591 7.682 0.102 39.5922 1.061 6.082 0.631 45.2804 1.591 5.121 0.651 74.9682 2.651 14.084 1.607 87.10810 1.591 12.163 0.610 57.97919 2.651 9.923 0.041 74.4732 4.242 7.362 0.203 58.10810 2.121 12.483 0.814 135.12917 2.121 9.282 0.102 91.8172 7.424 10.243 2.411 58.64510 7.424 39.050 0.580 66.44117 10.606 25.607 0.641 106.1082 13.257 10.243 2.655 59.49510 5.303 9.282 0.305 33.47316 10.075 8.962 0.519 29.6352 7.954 6.402 0.671 36.79610 12.196 15.684 1.007 43.96812 8.484 6.402 0.855 48.3012 9.015 4.161 0.671 55.12910 10.606 22.406 0.610 73.48424 9.015 36.169 0.305 n.a.Perhentian Island• For station near tourbanized coast, thenutrient tend to behigher. (22,23).
• In general, water quality for the parametersdeterm<strong>in</strong>e are dom<strong>in</strong>antly lay with<strong>in</strong> good condition.• The study can extend to study the limitation toassess the nutrient utilization/<strong>in</strong>put by the localcommunity.• Water is dynamic, frequent and more samplecollection could provide better understand<strong>in</strong>g on themar<strong>in</strong>e environment.• The <strong>in</strong>formation could use to monitor theenvironment changes to as precaution / predict thethreats and response accord<strong>in</strong>gly.
Acknowledgement• The authors would like to thanks Department <strong>of</strong> Mar<strong>in</strong>e Parks, Malaysia forfund<strong>in</strong>g most the research activity, support and grant permission to carryout the survey <strong>in</strong> mar<strong>in</strong>e parks (<strong>East</strong> Zone)• Special thanks to Institute <strong>of</strong> Oceanography and Environment (INOS) andMar<strong>in</strong>e Science Department for giv<strong>in</strong>g support and provid<strong>in</strong>g the laboratory<strong>in</strong>strument and sampl<strong>in</strong>g gear throughout sampl<strong>in</strong>g period.Thank You