epidemiology exam 1 review
epidemiology exam 1 review
epidemiology exam 1 review
- No tags were found...

You also want an ePaper? Increase the reach of your titles
YUMPU automatically turns print PDFs into web optimized ePapers that Google loves.
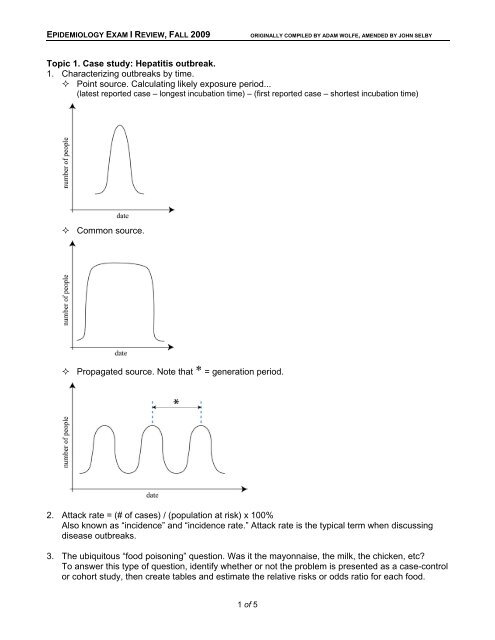
EPIDEMIOLOGY EXAM I REVIEW, FALL 2009ORIGINALLY COMPILED BY ADAM WOLFE, AMENDED BY JOHN SELBYTopic 1. Case study: Hepatitis outbreak.1. Characterizing outbreaks by time. Point source. Calculating likely exposure period...(latest reported case – longest incubation time) – (first reported case – shortest incubation time) Common source. Propagated source. Note that * = generation period.2. Attack rate = (# of cases) / (population at risk) x 100%Also known as “incidence” and “incidence rate.” Attack rate is the typical term when discussingdisease outbreaks.3. The ubiquitous “food poisoning” question. Was it the mayonnaise, the milk, the chicken, etc?To answer this type of question, identify whether or not the problem is presented as a case-controlor cohort study, then create tables and estimate the relative risks or odds ratio for each food.1 of 5
EPIDEMIOLOGY EXAM I REVIEW, FALL 2009ORIGINALLY COMPILED BY ADAM WOLFE, AMENDED BY JOHN SELBYTopic 2. Comparing groups fairly.1. Prevalence vs. incidence. Prevalence is simply a count of people with a given disease out of thetotal population at a given time. Incidence is a rate, reflecting how many new cases occur per unitof experience (e.g. person-years). Start keeping track of things called “rates” because trickquestions can be written about them.2. Mortality rate. How many people have died out of a total population during a specified time period.3. Case-fatality rate. Number of people who died of a disease divided by the total number of peoplewith the disease.4. Prevalence = Incidence x Mean Duration.5. Relative Risk. RR = I e /I oI e = Incidence of a disease among exposed populationI o = Incidence of a disease among unexposed populationI t = Incidence of a disease among the total population6. Types of bias. Memorize the names and definitions. Our shorthand definitions here may not beenough, and this may not be a complete list, so study your notes from class as well!These will show up on every Epidemiology <strong>exam</strong> this semester.Selection biases. Berkson bias. Hospital admissions are generally sicker than the general population.Generalizing these patients to the rest of the population, or using general population ascontrols, is not always appropriate. Survivor treatment bias. People who die very early from the disease don’t get the treatment somaking them “controls” for treated patients may exaggerate the benefit of the treatment. Competing medical issues bias. Hospitalized patients have multiple comorbidities that maycomplicate their participation in a controlled study. Bias by indication. Non-randomized patients may have more than one reason to be given thestudy drug by their doctor. Bias by contraindication. Non-randomized patients may have reasons not to be given studydrugs by their doctor. Unmasking bias. Innocent exposure may yield signs or symptoms that make us search morerigorously for a disease in one arm of the study and not in the other. Prevalence-incidence bias. A late look at exposed/affected patients may miss the fatal, shortlived,mild or silent cases of a disease. Volunteer bias. Generally, people who volunteer for a study perform better in study outcomesthan the rest of the population.Measurement biases. Recall bias. People might get questioned more rigorously if they are in the “exposed” or“affected” arm of a study, and may remember more health details. Tends to falsely increasethe strength of association of the exposure to the disease. Family information bias. A new case of a disease in a family makes patients more likely toremember other cases in their families. Exposure-suspicion bias. Knowledge of the disease state of a patient makes us suspect priorexposure. A problem in case-control studies. Diagnostic-suspicion bias. Knowledge of the exposure status leads to a more rigorous attemptto diagnose disease. A problem in cohort studies.2 of 5
EPIDEMIOLOGY EXAM I REVIEW, FALL 2009ORIGINALLY COMPILED BY ADAM WOLFE, AMENDED BY JOHN SELBY7. Confounding. A variable associated with the exposure and the disease may lead to a falseimpression about the association between them.8. Mortality. Direct age adjustment. Uses death rates from the observed population and the age distributionfrom a standardized population.More: You are given a standard distribution (e.g. standard age distribution), which you apply toyour population’s age-specific rates to find the total number of “expected” deaths given thestandard stratification. This way, age will no longer be a discrepant factor between the twogroups, and you can compare communities as though their cases had identical distributions.In other words, you will have removed the effect of disparate age distributions to allow a validcomparison between groups. The total number of deaths you calculate for each communitywill now be divided by the total number of cases to give you a rate that allows a validcomparison between groups. Standardized mortality ratio (SMR), also known as “Indirect rate adjustment.”= observed deaths / “expected” deathsUses death rates from a standardized population and the age distribution from the observedpopulation.More: You are given standard rates, which you apply to your own stratified characteristic(e.g. to your community’s person-time stratification) to find the total number of “expected”deaths given the standard rates. You then compare your observed total number of deaths tothis expected total number of deaths. One hundred times the ratio of your total number to theirnumber multiplied gives the “SMR.” An SMR of 135%, for <strong>exam</strong>ple, indicates that yourcommunity suffers 35% greater mortality than would be expected based on the mortality in thereference population.Examples: “Asbestos workers have a risk of cancer mortality approximately 35% higher thanmen in the general population.” “After taking gender and age into account, the mortality ratefor Champaign County residents is 112% that of Illinois state as a whole.” Proportional mortality = deaths due to disease X / all deaths in that time period Proportional mortality ratio (PMR) = PM in study group / PM in comparison population.This value, while cheap and easy to calculate, may give false impressions.Example: “The proportion of deaths attributable to cancer is almost twice as great amongnuclear shipyard workers as among a comparable US population.”Topic 3. Cohort and case-control studies.1. The formulas. These will show up on every Epi <strong>exam</strong> this semester. Relative risk ............. RR = I e /I o Attributable risk ........ AR = I e -I oAlso called “individual AR”Examples: “20 out of every 10,000 drivers die each year because of driving under theinfluence.” “Out of every 10,000 drivers, 20 die each year who would not have, had they notbeen driving under the influence.” AR %........................ AR% = (I e -I o )/I e = (RR-1)/RR% of cases attributable to the risk factorExamples: “Nearly 38% of myocardial infarctions among young women who use oralcontraceptives could be attributed to that exposure.” “As a young woman, you could reduceyour rate of death from MI by 38% just by not taking oral contraceptives.” Population AR.......... PAR = I t -I o = P e (AR)# of cases in population attributable to exposure. P e is the prevalence of the exposure. I t is theincidence of the disease in the total population.3 of 5
EPIDEMIOLOGY EXAM I REVIEW, FALL 2009ORIGINALLY COMPILED BY ADAM WOLFE, AMENDED BY JOHN SELBYExample: “For every million men in the population this year, 425 men will get lung cancer whowould not have if they did not smoke.” PAR % ..................... PAR% = (I t -I o )/I t =P e (RR-1)P e (RR-1)+1% of population at risk due to the exposureExample: “5% of myocardial infarctions among premenopausal women is due to their use oforal contraceptives.” I t = I e (P e ) + I o (1-P e )2. Cohort studies. Identify people with and without the exposure of interest, follow them to find incidences ofdisease. Allows calculation of incidence, risks and rates. Prospective v. retrospective cohort studies. Birth cohort effect.3. Case-control studies. Identify people who do and don’t have the disease of interest, then <strong>exam</strong>ine their pasts to seeif they had a particular exposure. Limitations: Cannot calculate incidence! A common subject for trick questions on <strong>exam</strong>s.You also cannot calculate anything else with a “rate” in it, such as AR or PAR. However, youcan calculate AR% and PAR%. Can calculate odds ratio to estimate RR. Create a table, use AD/BC formula. Remember, ORapproximates RR when a disease is rare. As prevalence of the disease increases in yourpopulation, OR becomes a less accurate measurement. Do not use OR in a disease outbreak (the disease is not rare in that population). How to select your controls: They must be different from the cases in that they do not havethe disease; they should be similar to the cases in every other way possible; you don’t knowwhether the cases or the controls have had your exposure of interest until you survey them. Case-cohort study: From a larger cohort, select cases and controls come randomly from thebaseline cohort. Nested case-control study: From a larger cohort, select cases and controls come randomlyfrom members of the cohort when the new cases occur.Once you have read through this <strong>review</strong> sheet, try and work out the following “Practice Set” problemsgiven on the course website. Solving problems is the BEST way to study for the <strong>exam</strong>!• Hepatitis• Comparing Disease Frequencies• Cohort and Case-Control Studies4 of 5
EPIDEMIOLOGY EXAM I REVIEW, FALL 2009ORIGINALLY COMPILED BY ADAM WOLFE, AMENDED BY JOHN SELBYA few other practice questions to consider...1. The UICOM recently held a retirement reception but due to budget cuts had to go with thecheaper caterer. After the event, 90 of the 120 attendees reported having severe gastroenteritisfor the weekend. The epidemiologist in you wanted to figure out which food(s) at the event mightbe responsible, so you interviewed all of the attendees: Of 60 people who recalled eating minibeef Wellingtons, 50 of them reported getting sick. Of 100 people who recalled eating spicychicken satay, 85 reported getting sick. Of 40 people who recalled having vegetables with ranchdressing dip, 35 reported getting sick. Based on these interviews, which food is most likelyresponsible for the gastroenteritis outbreak?2. As a lonely med student last Saturday night you decided to cruise a very crowded campus afterhoursparty. On Wednesday you read in the paper that 6% of students who attended after-hoursparties that weekend were later diagnosed with viral meningitis, whereas 0.1% of students whodid not attend these parties contracted the disease. Across campus, the attack rate of viralmeningitis is 1%. Calculate the relative risk and all attributable risks to describe the associationbetween viral meningitis and participation in campus after-hours parties last weekend.3. As a beer connoisseur, you predict that among beer drinkers, drinking Budweiser products mightbe associated with earlier mortality from cirrhosis than drinking other brands of beer. To test thishypothesis you conduct a case-control study in which beer-drinking patients who recently died ofalcohol-related cirrhosis were compared to control cirrhotic patients who are surviving. Your studyfinds that 60% of the recent deaths due to alcohol-related cirrhosis were long-time Bud drinkers,versus 15% of the control patients were Bud drinkers.a. Before we do any math, can you think of some biases that might come into play in the designof this study?b. According to these data, how many times does Bud drinking increase the risk of death due tocirrhosis? Are you calculating an OR or an RR? Why is that important?c. You have a close friend who is a social drinker on weekends, who happens to enjoy BudLight. Your friend asks you, “If I’m at risk of having cirrhosis, then what fraction of my risk ofdying from it is due to my choice of beer?” How will you answer?d. If 65% of American beer drinkers at risk for cirrhosis report selecting Budweiser products,what fraction of cirrhotic deaths among beer drinkers would you attribute to beer brandchoice?5 of 5