Device Evaluation for Current-Mode Class-D RF Power Amplifiers
Device Evaluation for Current-Mode Class-D RF Power Amplifiers
Device Evaluation for Current-Mode Class-D RF Power Amplifiers

Create successful ePaper yourself
Turn your PDF publications into a flip-book with our unique Google optimized e-Paper software.
<strong>Device</strong> <strong>Evaluation</strong> <strong>for</strong> <strong>Current</strong>-<strong>Mode</strong> <strong>Class</strong>-D <strong>RF</strong><strong>Power</strong> <strong>Amplifiers</strong>Diploma Thesis byThomas DellspergerDiploma thesis written at the University of Cali<strong>for</strong>nia, Santa BarbaraTutored by Prof. S. Long (UCSB)and R. Negra (ETHZ)Submitted to Prof. W. BächtoldInstitute <strong>for</strong> Electromagnetic Fields and Microwave ElectronicsDepartment of In<strong>for</strong>mation Technology and Electrical EngineeringETH Zürich08/08/2003
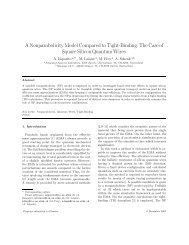
AbstractRadio-frequency power amplifiers (<strong>RF</strong> PAs) are among the key building blocks<strong>for</strong> wireless communication systems. They are used to amplify the <strong>RF</strong> signalat the output of the transmitter be<strong>for</strong>e the <strong>RF</strong> signal is fed into the antenna.This study evaluates the Si MOSFET, the Si LDMOS FET, the SiGe HBT,and the AlGaAs/InGaAs pHEMT as switches <strong>for</strong> use in a current-mode class-D(CMCD) <strong>RF</strong> switching-mode PA. The goal of this study was to determine whichof the above devices delivers the highest efficiency at 0.8-1.0 GHz and 1.8-2.2GHz <strong>for</strong> 10-20 W of output power, and at 5.8 GHz <strong>for</strong> 3 W of output power. Thestudy presents a detailed analysis of a CMCD PA based upon spectrum-limitedwave<strong>for</strong>ms <strong>for</strong> the device voltage and current. An analytical expression <strong>for</strong> thepower added efficiency (PAE) of a CMCD PA employing FET devices is derivedas a function of the mobility µ n , oxide cap. C ox , overlap cap. C ov , gate sheetres. R g,sheet , gate contact res. R g,contact , source res. R s , number of fingers F ,gate width W , gate length L, the supply voltage V dd , the shunt-tank res. R,and the input voltage amplitude ˆV in . A sensitivity analysis revealed that C ox ,F , W , L, R, and ˆV in must be optimized, that V dd must be maximized, andthat C ov , R g,sheet , and R s must be minimized <strong>for</strong> a reference LDMOS FET inorder to maximize the PAE. To identify the differences in device parametersbetween the devices of interest, commercially available packaged devices areinvestigated followed by a theoretical analysis of the breakdown phenomena,the switching per<strong>for</strong>mance, and the on-resistance <strong>for</strong> the devices of interest.An expression <strong>for</strong> the maximum achievable drain-efficiency as a function ofV dd , R s , and the output power was derived, which shows that a low breakdownvoltage fundamentally limits the achievable PAE. Harmonic-balance simulations<strong>for</strong> CMCD PAs with ideal passive circuitry are per<strong>for</strong>med <strong>for</strong> packaged LDMOSFETs (Motorola M<strong>RF</strong>281SR1), packaged pHEMTs (Filtronic LP3000P100), andpackaged SiGe HBTs (Infineon BFP690) at 900 MHz, 1.8 GHz, and 5.8 GHzfollowing well-defined optimization guidelines <strong>for</strong> V g,bias , R tank , C ds,comp , andˆV in . The same is done <strong>for</strong> CMCD PAs employing pHEMTs and InGaP HBTs ofTriquint’s TQPHT and TQHBT2 process, respectively. Based upon the resultsfrom the analytical analysis and the simulations, the study recommends usingLDMOS FETs <strong>for</strong> hybrid solutions (simulated P AE ≈ 70 %) and pHEMTs <strong>for</strong>integrated solutions (simulated P AE ≈ 90 %) when the target output poweris 10-20 W and the target frequency is below 2 GHz. Above 2 GHz, pHEMTsare recommended <strong>for</strong> hybrid (simulated P AE ≈ 35 % <strong>for</strong> 1 W of output power)and integrated solutions (simulated P AE ≈ 90 % <strong>for</strong> 3 W of output power).
Contents1 Introduction 11.1 Motivation and Objectives . . . . . . . . . . . . . . . . . . . . . . 11.2 Document Organization . . . . . . . . . . . . . . . . . . . . . . . 42 Literature Review 52.1 Research on <strong>Class</strong>-E and <strong>Class</strong>-D PAs . . . . . . . . . . . . . . . 52.2 Research on <strong>Device</strong>s <strong>for</strong> Switching-<strong>Mode</strong> PAs . . . . . . . . . . . 62.3 Commercial PAs . . . . . . . . . . . . . . . . . . . . . . . . . . . 103 <strong>Device</strong> <strong>Evaluation</strong> by Analysis 123.1 Generic <strong>Power</strong> Amplifier Circuit and <strong>Class</strong> of Operation . . . . . 123.2 Analysis of <strong>Class</strong>-D PAs . . . . . . . . . . . . . . . . . . . . . . . 143.2.1 Trans<strong>for</strong>mer-Coupled <strong>Class</strong>-D PAs . . . . . . . . . . . . . 143.2.2 Shunt-Tank <strong>Current</strong>-<strong>Mode</strong> <strong>Class</strong>-D PA . . . . . . . . . . . 183.2.2.1 Ideal Wave<strong>for</strong>m Operation . . . . . . . . . . . . 183.2.2.2 Spectrum-Limited Wave<strong>for</strong>m Operation . . . . . 223.2.2.3 Tank Design Equations . . . . . . . . . . . . . . 233.3 Analytical Derivation of the PAE <strong>for</strong> a FET <strong>Device</strong> . . . . . . . . 263.3.1 Analytical Derivation of the Input, Output, and DC <strong>Power</strong><strong>for</strong> a MOSFET <strong>Device</strong> . . . . . . . . . . . . . . . . . . . . 263.3.1.1 Equivalent Circuit and Non-ideal Wave<strong>for</strong>ms . . 263.3.1.2 Input <strong>Power</strong> . . . . . . . . . . . . . . . . . . . . 283.3.1.3 Output and DC <strong>Power</strong> . . . . . . . . . . . . . . 313.3.2 Analytical Expressions <strong>for</strong> η and P AE . . . . . . . . . . . 323.3.3 Comparison to Harmonic-Balance Simulations . . . . . . . 343.3.4 Discussion and Conclusions from Analytical Expressions . 343.3.4.1 Sensitivity Analysis . . . . . . . . . . . . . . . . 343.3.4.2 Resulting Design Guidelines . . . . . . . . . . . 383.3.5 Adaption to HEMT <strong>Device</strong>s . . . . . . . . . . . . . . . . . 423.4 Comparison of MOSFET-, HBT-, and HEMT-Parameters . . . . 433.4.1 Comparison of Selected Commercial <strong>Device</strong>s . . . . . . . . 443.4.2 Breakdown Phenomena . . . . . . . . . . . . . . . . . . . 453.4.2.1 MOSFET/LDMOS FET . . . . . . . . . . . . . 483.4.2.2 HBT . . . . . . . . . . . . . . . . . . . . . . . . 49i
iiCONTENTS3.4.2.3 pHEMT . . . . . . . . . . . . . . . . . . . . . . . 503.4.3 Switching Per<strong>for</strong>mance . . . . . . . . . . . . . . . . . . . . 523.4.3.1 MOSFET/LDMOS FET . . . . . . . . . . . . . 533.4.3.2 HBT . . . . . . . . . . . . . . . . . . . . . . . . 543.4.3.3 HEMT/pHEMT . . . . . . . . . . . . . . . . . . 553.4.3.4 Numerical Examples and Comparison . . . . . . 563.4.4 On-Resistance . . . . . . . . . . . . . . . . . . . . . . . . 573.4.5 Discussion and Conclusions from Comparison . . . . . . . 573.4.5.1 Discussion of Striking Properties . . . . . . . . . 573.4.5.2 Conclusions <strong>for</strong> <strong>Device</strong> Selection . . . . . . . . . 584 <strong>Device</strong> <strong>Evaluation</strong> by Simulation 624.1 Simulation Circuit . . . . . . . . . . . . . . . . . . . . . . . . . . 624.2 Switch Simulations . . . . . . . . . . . . . . . . . . . . . . . . . . 644.3 Packaged <strong>Device</strong> Simulations . . . . . . . . . . . . . . . . . . . . 694.4 Non-Packaged <strong>Device</strong> Simulations . . . . . . . . . . . . . . . . . . 714.5 Discussion and Conclusions from Simulations . . . . . . . . . . . 855 Conclusions 875.1 Recommendations <strong>for</strong> <strong>Device</strong> Selection . . . . . . . . . . . . . . . 875.2 Achievements . . . . . . . . . . . . . . . . . . . . . . . . . . . . . 885.3 Outlook . . . . . . . . . . . . . . . . . . . . . . . . . . . . . . . . 89A Task Description by Prof. S. I. Long 92B CDROM 94Bibliography 95
AcknowledgmentsFirst of all, I would like to thank Prof. Stephen I. Long who kindly made itpossible <strong>for</strong> me to write my diploma thesis in his research group at UCSB. I amvery grateful to him <strong>for</strong> giving me such a warm welcome, <strong>for</strong> his guidance, and<strong>for</strong> his willingness always to take time to answer my questions.I would also like to thank Prof. W. Bächtold <strong>for</strong> helping me establishinginitial contacts with Prof. Long and <strong>for</strong> supporting my plans of writing mydiploma thesis in the USA.I am grateful to Renato Negra <strong>for</strong> being my tutor at the ETH Zürich, <strong>for</strong> hisfeedback and valuable advice in email conversations and occasional phone calls.Of course, the whole research group of Prof. Long deserves my gratitude.It was just fun spending time with all of you, James, Jingshi, Tom, Vikas, andYan. Special thanks go to Tom <strong>for</strong> teaching me surfing!Finally, I would like to thank the ’exchange program between UCSB andETH Zürich’ <strong>for</strong> the generous sponsorship enabling my stay at UCSB.August 8, 2003Santa Barbara, Cali<strong>for</strong>niaThomas Dellspergerthomasd@ieee.orgiii
Chapter 1Introduction1.1 Motivation and Objectives<strong>RF</strong> power amplifiers field of application Radio-frequency power amplifiers(<strong>RF</strong> PAs) are among the key building blocks <strong>for</strong> wireless communicationsystems. As shown in Fig. 1.1 depicting a simplified <strong>RF</strong> section of a heterodynetransceiver, a PA is employed in the transmitting path of a transceiver. Thepurpose of a PA is to amplify the power of the <strong>RF</strong> signal be<strong>for</strong>e it is fed intothe antenna. Besides achieving the required amplification, a PA must convertas much DC power into <strong>RF</strong> power as possible to work efficiently. The ratioof the <strong>RF</strong> power delivered to the antenna, to the DC power consumed fromthe power supply, is the efficiency of the PA and its primary per<strong>for</strong>mance figure.A comparison between switching-mode PAs that employ the transistorsas switches, and traditional linear-mode PAs that employ the transistors ascurrent-sources, shows that the efficiencies of switching-mode PAs are substantiallyhigher. There<strong>for</strong>e, switching-mode PAs may rival traditional linear-modePAs in applications where non-linearities are acceptable. Besides having a higherefficiency, switching-mode PAs are also less susceptible to parameter variationsand impose a lower thermal stress on the transistors than linear-mode PAs.Figure 1.1: Simplified <strong>RF</strong> section of a heterodyne transceiver.1
2 CHAPTER 1. INTRODUCTIONTable 1.1: Abbreviations of devices investigated.AbbreviationFull nameSi MOSFET Silicon Metal-Oxide-SemiconductorField-Effect-TransistorSi LDMOS Silicon Lateral Double-Diffused Field-Effect-TransistorSiGe HBT Silicon-Germanium Hetero-Bipolar-TransistorAlGaAs/InGaAs pHEMT Aluminum-Gallium-Arsenic/Indium-Gallium-Arsenic pseudomorphic High-Electron-Mobility-TransistorObjectives of this study Due to the higher efficiency of switching-modePAs, their use <strong>for</strong> lower power portable applications (3 W output power at5.8 GHz) and higher power fixed applications (base-stations, 10-20 W outputpower at 0.8-1.0 GHz and 1.8-2.2 GHz) are of interest. Especially current-modeclass-D switching-mode PAs are expected to deliver a high efficiency in theseapplications. There are various types of devices that may serve as switchesin current-mode class-D PAs. Linear-mode PAs <strong>for</strong> cellular handsets and basestations have generally employed either GaAs HBT or Si LDMOS FET devices.This study evaluates the devices Si MOSFET, Si LDMOS FET, SiGe HBT,and AlGaAs/InGaAs pHEMT as switches <strong>for</strong> use in a current-mode class-D <strong>RF</strong>switching-mode PA (refer to Tab. 1.1 <strong>for</strong> the full names of the abbreviations).The goal of this study was to determine which of the above devices delivers thehighest efficiency at 0.8-1.0 GHz and 1.8-2.2 GHz <strong>for</strong> 10-20 W of output power,and at 5.8 GHz <strong>for</strong> 3 W of output power.PA per<strong>for</strong>mance figures PAs may be characterized by their efficiency, <strong>RF</strong>output power, linearity, mid-band frequency, relative bandwidth, supply voltageand package size. Several figures to assess the efficiency of a PA are in use. Thedrain efficiency 1 η is defined as the ratio of the <strong>RF</strong> output power P out,1 deliveredto the antenna, to the DC power P dc consumed from the power supply:η = P out,1P dcThe power added efficiency P AE also takes into account the <strong>RF</strong> input powerP in,1 and is defined asP AE = P (out,1 − P in,1= η 1 − 1 )P dcG1 In this report, FET designations are used <strong>for</strong> general expressions. The drain efficiencycorresponds to the collector efficiency in case of a BJT.
6 CHAPTER 2. LITERATURE REVIEWPotential of current-mode class-D PAs Both class-E and current-modeclass-D (CMCD) PAs are capable of zero-voltage-switching, which means thatthe voltage across the switch is zero when it closes. Otherwise, the energy of12 C dsV 2 ds,off gets dissipated at each switch closure, if C ds is the parasitic outputcapacitance of the transistor and V ds,off is the voltage across the switch at thattime [18]. Zero-voltage-switching however, can not be achieved by the voltagemodeclass-D (VMCD) topology that has been nearly exclusively employed inpractical class-D PAs up to date. The major advantage of the CMCD PAover both the class-E and VMCD PA is that it allows to accommodate theparasitic output capacitance C ds into the shunt LC-tank at its output simplyby subtracting C ds from the tank capacitance. Moreover, CMCD PAs ideallyfeature a power output capability that is three times higher than <strong>for</strong> class-E PAwhich greatly reduces the thermal stress on the devices.Because of these benefits, CMCD PAs have recently gained in research interestand spawned quite a few research publications [19, 18, 20, 21, 22, 23] 1 .However, earlier works like [16, 24] have already dealt with CMCD PAs on aless practical basis. In 2001, H. Kobayashi et al. have reported the first CMCDPA <strong>for</strong> personal wireless communications in [18]: it features 71.3% PAE and870mW output power at 900 MHz, uses GaAs MESFETs, and has been successfullyapplied to a GSM GMSK signal. In 2002, a high-power CMCD PA hasbeen reported by A. Long et al.: it features 58% PAE and 13 W output powerat 1 GHz, and uses LDMOS FETs.To compare the per<strong>for</strong>mance of reported CMCD PAs with that of class-E PAs <strong>for</strong> personal wireless communications published since 1995, their PAEis plotted versus their maximum <strong>RF</strong> output power in Fig. 2.1. CMCD PAsseem to per<strong>for</strong>m at least as well or slightly better than class-E PAs both interms of the PAE and the maximum attainable <strong>RF</strong> output power. For furtherimplementation details of the investigated PAs, refer to Tab. 2.1.2.2 Research on <strong>Device</strong>s <strong>for</strong> Switching-<strong>Mode</strong> PAs<strong>Device</strong> technologies <strong>for</strong> switching-mode PAs In switching-mode PAs,the transistors are employed as switches. There<strong>for</strong>e, one may state that a deviceper<strong>for</strong>ms the better in a switching-mode PA the more it behaves like anideal switch. Relevant parameters <strong>for</strong> transistors in switching-mode PAs arethe on-resistance R on , the off-resistance R off , the rise time t r , the fall timet f , the breakdown voltage BV ds, , the maximum allowable current I ds,mr , andthe parasitic output capacitance C ds . Traditionally, transistors are employedas switches in digital applications. There<strong>for</strong>e, well-established transistors intended<strong>for</strong> use as switches are available <strong>for</strong> these applications. However, thebreakdown voltages of these devices are very low which makes them unsuitable<strong>for</strong> switching-mode PA applications demanding breakdown voltages way1 In some publications the current-mode class-D (CMCD) is also termed inverse class-F. Inthis report, current-mode class-D refers to a push-pull inverse class-F PA.
2.2. RESEARCH ON DEVICES FOR SWITCHING-MODE PAS 7Figure 2.1: PAE versus the maximum <strong>RF</strong> output power <strong>for</strong> 15 switching-modePAs [19, 18, 20, 21, 22, 5, 6, 7, 8, 9, 10, 11, 12, 13] (in this order) published since1995. CMCD and inverse-F type PAs are designated by non-opaque markers.<strong>Class</strong>-E type PAs are designated by opaque markers. Blue markers designateMOSFET type, red makers MESFET type, green markers pHEMT type, andpink markers BJT type devices. For further implementation details, refer toTab. 2.1.
8 CHAPTER 2. LITERATURE REVIEWTable 2.1: Per<strong>for</strong>mance figures and implementation details <strong>for</strong> 15 switchingmodePAs [19, 18, 20, 21, 22, 5, 6, 7, 8, 9, 10, 11, 12, 13] (in this order) publishedsince 1995. For an illustration of the per<strong>for</strong>mance figures, refer to Fig. 2.1.
2.2. RESEARCH ON DEVICES FOR SWITCHING-MODE PAS 9in excess of the supply voltage. For example the CMCD PA requires a breakdownvoltage BV ds > πV dd with V dd the supply voltage. As there are no highbreakdownswitching-optimized devices, switching-mode PA designers often usehigh-breakdown <strong>RF</strong> transistors with transition frequencies at least an order ofmagnitude higher than the operation frequency [24] <strong>for</strong> short switching times.P. Mudge evaluates in chapter 4 of his UCSB MS thesis [25] five sampledevices in different technologies <strong>for</strong> class-E PAs. Subsequently, he recommendsthe GaN HEMT and the AlGaAs/GaAs HBT <strong>for</strong> switching-mode PAs. However,he does not give a reference <strong>for</strong> the values he bases his conclusions on. R. Magoondraws more or less the same conclusions about device selection as P. Mudge inhis UCSB MS thesis [26]. G. Wong investigates bipolar class-E PAs in his UCSBMS thesis [26] and recommends using HBT devices because of their high transitfrequency f T . D. Choi [2] on the other hand argues that topology issues mattermore than technology issues and uses a Si LDMOS device throughout his UCSBPh.D. thesis.S.L. Delage et al. compare the GaAs HBT, GaAs HEMT, InP HEMT,AlGaN/GaN HEMT, and SiC MESFET with respect to PAE and output power<strong>for</strong> high-efficiency PAs in [27]. They conclude that the narrow-bandgap III-Vdevices like the GaAs HBT, GaAs HEMT, and InP HEMT are best suitable <strong>for</strong>high-PAE medium output power requirements whereas the wide-bandgap III-Vdevices like the AlGaN/GaN HEMT and SiC MESFET are best suitable <strong>for</strong>medium-PAE high output power requirements. They attribute the higher PAEof the GaAs and InP devices to the higher mobility (µ GaAs = 8.5µ GaN, SiC ,µ GaAs = 4.5µ GaN, SiC ) and thus to the higher transit frequency f T of thesedevices compared to GaN and SiC. On the other hand, the higher <strong>RF</strong> outputpower of GaN and SiC may be attributed to the 4-10 times higher breakdownfield compared to GaAs and InP. Further factors <strong>for</strong> the various technologies toconsider are the wafer robustness, defect density (low <strong>for</strong> Si, medium <strong>for</strong> GaAsand InP, and very high <strong>for</strong> GaN), wafer cost, substrate resistivity, and thermalconductivity.In [28] C.E. Weitzel investigates the Si LDMOS FET, GaAs MESFET, GaAsHBT and SiGe HBT <strong>for</strong> <strong>RF</strong> PAs and concludes that among those, the Si LDMOSFET has the lowest costs, the GaAs MESFET the highest PAE, the GaAs HBTthe smallest die size and the SiGe HBT a somewhat lower PAE than the GaAsbaseddevices. Thus, no single technology dominates <strong>for</strong> <strong>RF</strong> PAs.Y. Tkachenko et al. further show in [29] that pHEMT devices are moresusceptible to hot electron degradation than MESFET devices. This of coursefavors a CMCD implementation with pHEMT devices over a class-E one as the<strong>for</strong>mer imposes less device stress.Returning to Fig. 2.1, one may recognize the following technology trends:How-• P AE pHEMT > P AE BJT > P AE MESFET > P AE MOSFET .ever, note that no particular technology dominates clearly.• While pHEMTs and MESFETs are comparable with respect to their outputpower, MOSFETs seem to deliver more output power though at a
10 CHAPTER 2. LITERATURE REVIEWgenerally lower PAE.Relation of device parameters to PA per<strong>for</strong>mance figures Expressions<strong>for</strong> the PAE have been analytically derived <strong>for</strong> the class-E PA employing a SiLDMOS FET by D. Choi in [30], and <strong>for</strong> the VMCD PA employing complementaryMOSFETs by J.S. Chang et al. in [31]. A. Inoue et al. conclude in [23]to move from the VMCD to the CMCD topology with an increasing gain compression(> 2 dB) and load resistance (> 10 Ω), and a decreasing on-resistance(< 0.3 Ω). However, no publication has so far analytically derived expressions<strong>for</strong> the PAE of a CMCD PA. Chapter 3 presents such an analysis <strong>for</strong> a CMCDPA employing MOSFET/LDMOS FET or HEMT/pHEMT devices.2.3 Commercial PAs<strong>Current</strong> status of commercial <strong>RF</strong> PAs Key players in the PA market <strong>for</strong>cellular telephony are <strong>RF</strong> Microdevices, Hitachi, Motorola, and Skyworks. Inthe cellular telephony handset PA market, one may recognize two trends:• The share of PAs with GaAs HBTs is increasing whereas the share of PAswith Si LDMOS FET and especially GaAs MESFET devices is decreasing.• Multi-chip modules (MCMs) that provide matching circuitry and antennaswitches are rapidly gaining in share.Skyworks employs InGaP/GaAs HBTs <strong>for</strong> their latest tri- and quad-band PAs.HBTs are also in use <strong>for</strong> PAs from <strong>RF</strong> Microdevices, Analog <strong>Device</strong>s, andAnadigics whereas Hitachi and Motorola favor the Si LDMOS devices <strong>for</strong> theirPAs. Agilent on the other hand promotes its GaAs E-pHEMT technology becauseof its low current leakage, low on-resistance, and low threshold-voltage. E-pHEMTs employ a buried gate to allow the operation as enhancement-mode devices.Tab. 2.2 compares two state-of-the-art tri-band handset PAs by Skyworksand Agilent. Judging from these per<strong>for</strong>mance figures, the GaAs E-pHEMT ofAgilent per<strong>for</strong>ms significantly better than the GaAs/InGaAs HBT of Skyworks.However, today’s commercial PAs are linear-mode PAs in class-AB operation inall cases.A commercial cellular telephony handset PA nowadays consists of up to 3dies in a MCM. E. g. the Skyworks SKY77500 quad-band handset PA MCMcontains the following dies besides the passive matching circuitry:• A GaAs/InGaAs die incorporating a GSM850/ GSM900 block and aDCS1800/ PCS1900 block with the HBT devices.• A Si CMOS die incorporating a PA control block and the interface circuitry.• A GaAs pHEMT die with pHEMT switches to disable the PA in receivemodes.
2.3. COMMERCIAL PAS 11Table 2.2: Comparison of two state-of-the-art tri-band (GSM900, DCS1800, andPCS1900) handset PAs by Skyworks and Agilent.<strong>Mode</strong>l Skyworks CX77304-17 Agilent ACPM-7891Technology GaAs/InGaAs HBT GaAs E-pHEMTFigure P AE P out,1 P AE P out,1GSM900 55% 35 dBm 60% 35 dBmDCS1800 50% 32.5 dBm 56% 32.5 dBmPCS1900 50% 32.5 dBm 56% 32.5 dBm
Chapter 3<strong>Device</strong> <strong>Evaluation</strong> by Analysis3.1 Generic <strong>Power</strong> Amplifier Circuit and <strong>Class</strong> ofOperationFig. 3.1 displays a generic power amplifier circuit. The analysis of this circuitpresented in this section closely follows the one given by F. Raab in [32] andshows that the current-mode class-D PA is a special case of this generic poweramplifier circuit. The results gained from the analysis of this generic poweramplifier circuit <strong>for</strong>m the basis <strong>for</strong> the derivation of an analytical model <strong>for</strong> theCMCD PA in the subsequent sections.Generic power amplifier circuit In Fig. 3.1, the <strong>RF</strong> input signal V in is fedthrough a DC block capacitor to the transistor gate (or base in case of a BJT).Both, the transistor gate and the transistor drain are biased through <strong>RF</strong> chokeinductors. These <strong>RF</strong> choke inductors supply the DC currents I g,bias and I dd .Because of the DC block capacitor at the output, the DC components of I dsand V ds are I dd and V dd , respectively. The current I tot flows through a bandpassfilter at the fundamental frequency. The fundamental Fourier component of I totis the output current I out flowing into the load resistor R L . The impedanceZ 1 seen into the bandpass filter is made up by the impedance of the bandpassfilter itself and potentially by the impedances of additional stages <strong>for</strong> outputmatching. For the subsequent analysis, Z is assumed to include the reactance ofthe <strong>RF</strong> choke inductor, the DC block capacitor, and the output capacitance C dsof M1. Z is further assumed to be linear and to be lossy only at the fundamentalfrequency and may, with these restrictions, be written as1 In this report, complex quantities like impedances (e. g. Z) and complex amplitudes(e. g. V or I) are written in bold letters. Real-valued amplitudes (e. g. ˆVds,ka or Îds,ka)are denoted with a hat to distinguish them from time-dependent quantities. Peak values oftime-dependent quantities are denoted with the subscript pk (e. g. V ds,pk or I ds,pk ). DCvalues are clear from their pertaining subscript (e. g. V dc or V dd ).12
3.1. GENERIC POWER AMPLIFIER CIRCUIT AND CLASS OF OPERATION13Z 1 = R 1 + jX 1Z k = jX k , k > 1at the fundamental frequency, andat the harmonics.(3.1)The drain-source current I ds is determined by V g,bias and V in in conjunctionwith the transfer characteristic of M1 to the first order. The drain-source voltageV ds then follows I tot = I dd − I ds and the impedances Z 1 and Z k presented toI tot at the fundamental frequency and at the harmonics, respectively. V ds andI ds may be written as general Fourier seriesV ds (θ) = V dd +I ds (θ) = I dd +∞∑ (ˆVds,ka cos (kθ) + ˆV ds,kb sin (kθ))k=1∞∑ (Îds,ka cos (kθ) + Îds,kb sin (kθ))k=1with θ = ωt and ˆV ds,ka , Îds,ka and ˆV ds,kb , Îds,kb the in-phase and quadraturephaseFourier coefficients, respectively. In complex notation, the above relationsmay be written equivalently asV ds (θ) = V dd + ∑ ∞k=1 Re ( V k e jkθ) , V k = ˆV ds,ka − j ˆV ds,kbI ds (θ) = I dd + ∑ ∞k=1 Re ( I k e jkθ) , I k = ˆV ds,ka − j ˆV ds,kbwith V k and I k the complex voltage and current amplitudes at the k’thfrequency. V k and I k are related by the impedances given in (3.1):V k = Z k I kThere<strong>for</strong>e, if the wave<strong>for</strong>m of I ds is given, the wave<strong>for</strong>m of V ds follows fromthe above equation.<strong>Class</strong> of operation The class of operation of a power amplifier, denoted bythe letters A, B, AB, C, D, E, F, etc, may be determined from the generalshape of the drain-source voltage and current wave<strong>for</strong>ms. As evident from theprevious paragraph, the general shape of the drain-source voltage and currentwave<strong>for</strong>ms depends on• V g,bias and V in in conjunction with the transfer characteristic of the transistor,as well as on• the harmonic termination Z k at the transistor drain.As F. Raab points out in [32], <strong>for</strong> inverse class-F operation, the even-harmonicreactances X k , k > 1 even, must be high and the odd-harmonic reactances X k ,k > 1 odd, must be low. For this harmonic termination in conjunction with theassumption of an ideal switch <strong>for</strong> M1 in Fig. 3.1, the drain-source voltage is
14 CHAPTER 3. DEVICE EVALUATION BY ANALYSISFigure 3.1: Generic power amplifier circuit with a FET as active device.shaped towards a half-sine wave and the drain-source current towards a squarewave as depicted in Fig. 3.2. Not surprisingly, a Fourier-analysis of a halfsinewave reveals that it only contains even harmonics besides the fundamentaland a DC component. Doing the same <strong>for</strong> a square wave shows that it onlycontains odd harmonics besides the fundamental and a DC component. Fig. 3.3(reproduced from [32]) provides a broader perspective on the proper harmonictermination <strong>for</strong> various PA classes. The figure suggests that e. g. <strong>for</strong> a class-FPA the proper harmonic termination is short at even harmonics and open atodd harmonics which results in a square wave <strong>for</strong> V ds and a half-sine wave <strong>for</strong>I ds .The current-mode class-D PA is the push-pull version of an inverse class-F PA and is analyzed on grounds of the results <strong>for</strong> an inverse class-F PA inthe subsequent sections. As will be shown, the proper harmonic termination isthe same as <strong>for</strong> the inverse class-F PA (open at even harmonics, short at oddharmonics) and is provided inherently in the ideal CMCD PA. However, properharmonic termination is a major issue in the implementation of a CMCD PA.3.2 Analysis of <strong>Class</strong>-D PAs3.2.1 Trans<strong>for</strong>mer-Coupled <strong>Class</strong>-D PAsTraditionally, the class-D PA circuits found in literature [16] are the trans<strong>for</strong>mercoupledcurrent-mode class-D (CMCD) PA and the trans<strong>for</strong>mer-coupled voltagemodeclass-D (VMCD) PA as shown in Fig. 3.4 and 3.5, respectively. Thesecircuits consist of two switching devices, of a RLC tank resonant at the fundamentalfrequency, and of an output balun trans<strong>for</strong>mer. The output balun trans<strong>for</strong>merconverts the differential (balanced) voltages across the switching devices
3.2. ANALYSIS OF CLASS-D PAS 1532.5[A] / [V]21.50.5102 4 6 8 10 12thetaIds [A] normalized to IddVds [V] normalized to VddFigure 3.2: Ideal wave<strong>for</strong>ms <strong>for</strong> the drain-source voltage V ds and current I ds ofan inverse class-F PA.Figure 3.3: Proper harmonic termination <strong>for</strong> class-F, inverse class-F, class-C,inverse class-C, and class-E PAs as a function of the even harmonics |X e | andodd harmonics |X o | (reproduced from [32]).
16 CHAPTER 3. DEVICE EVALUATION BY ANALYSISto a single-ended (unbalanced) voltage across the RLC tank. Fig. 3.6 shows thevoltages and currents in a general balun trans<strong>for</strong>mer. The two switching devicesare driven by inverse signals. This inversion is per<strong>for</strong>med by the input baluntrans<strong>for</strong>mer. The difference between the CMCD PA and the VMCD PA is thebiasing of the output-trans<strong>for</strong>mer center tap and the RLC tank configuration.The CMCD PA shows a constant center tap current I dd and employs a parallelRLC tank, whereas the VMCD PA shows a constant center tap voltage V dd andemploys a series RLC tank.The CMCD PA is in fact a push-pull version of the inverse class-F PA,and the VMCD PA a push-pull version of the class-F PA. The proper harmonictermination (open at even harmonics and short at odd harmonics <strong>for</strong> the CMCDPA, short at even harmonics and open at odd harmonics <strong>for</strong> the VMCD PA)is provided by the push-pull operation in conjunction with the RLC tanks.In case of the CMCD PA, the <strong>RF</strong> choke inductor supplies a constant currentI dd . Because of the push-pull operation, the drain-source currents through theswitching devices are square waves with peak values of 0 and I dd . The currentthrough the parallel RLC tank then is I tot = m n (I ds2 − I ds1 ), a square wave withpeak values of −I dd and I dd . The parallel RLC tank shorts all harmonics of I totand ideally just leaves the fundamental frequency of I tot . There<strong>for</strong>e, V R is a sinewave. This sine wave is then trans<strong>for</strong>med back to the left of the output baluntrans<strong>for</strong>mer and makes V ds1 and V ds2 look like half sine waves. The resultingdrain-source wave<strong>for</strong>ms <strong>for</strong> a CMCD PA are shown in Fig. 3.9. The wave<strong>for</strong>msof a VMCD PA may be derived in a similar fashion; the drain-source voltage isa square wave and the current a half sine.Generally, the parasitic parallel capacitance C ds across the drain-source terminalsis much more pronounced than the parasitic series inductance L d atthe drain terminal [18]. This leads to an energy dissipation of 1 2 C dsV 2 ds,offwhenever the switch closes, if V ds,off is the drain-source voltage at that time.To minimize this energy dissipation, ideally V ds,off must be 0 which is calledzero voltage switching (ZVS). The above discussion of the CMCD and VMCDwave<strong>for</strong>ms reveals that the CMCD topology achieves ZVS whereas the VMCDtopology does not achieve ZVS. This greatly favors the use of the CMCD circuitover the VMCD circuit. Moreover, the CMCD circuit allows to accommodateC ds into the RLC tank as part of the tank capacitance.A major drawback of the trans<strong>for</strong>mer-coupled CMCD PA as shown in Fig.3.5 is its linearity requirements <strong>for</strong> the output balun trans<strong>for</strong>mer which makeit unsuitable <strong>for</strong> high-frequency applications. The output balun trans<strong>for</strong>merin the trans<strong>for</strong>mer-coupled CMCD PA is required to be linear at least fromDC to three times the fundamental frequency if I tot should look like a squarewave. Realizing balun trans<strong>for</strong>mers <strong>for</strong> high-frequency applications satisfyingthis requirement is next to impossible. There<strong>for</strong>e, the output balun trans<strong>for</strong>meris moved to the right of the parallel RLC tank which confines the linearityrequirement to a narrow band at the fundamental frequency. This CMCD PA,subsequently termed shunt-tank CMCD PA, is investigated in the next section.
3.2. ANALYSIS OF CLASS-D PAS 17Figure 3.4: Circuit of a trans<strong>for</strong>mer-coupled CMCD (current-mode class-D) PA.Figure 3.5: Circuit of a trans<strong>for</strong>mer-coupled VMCD (voltage-mode class-D) PA.Figure 3.6: Voltages and currents in a general balun trans<strong>for</strong>mer.
18 CHAPTER 3. DEVICE EVALUATION BY ANALYSIS3.2.2 Shunt-Tank <strong>Current</strong>-<strong>Mode</strong> <strong>Class</strong>-D PA3.2.2.1 Ideal Wave<strong>for</strong>m OperationThe shunt-tank CMCD PA is shown in Fig. 3.7. The output balun trans<strong>for</strong>merthat trans<strong>for</strong>ms the differential (balanced) voltage across the parallel LC tankto the single-ended (unbalanced) voltage across the load resistor R L is omittedin Fig. 3.7 <strong>for</strong> simplicity. The output balun trans<strong>for</strong>mer is shown separatelyin Fig. 3.8. There<strong>for</strong>e, R in Fig. 3.7 represents the trans<strong>for</strong>med resistance ofthe load resistor R L . The two switching devices M1 and M2 are driven by twoinverse signals Vin − = −V in and V in + = V in, respectively.Derivation of wave<strong>for</strong>ms For this analysis of the shunt-tank CMCD PA, theswitching devices are assumed to be ideal switches. M1 turns on when V −in > 0and turns off when V −+in < 0, whereas M2 turns on when V in > 0 and turns offwhen V +in < 0. If V in is a sine, M1 conducts during the negative half cycle ofV in , whereas M2 conducts during the positive half cycle of V in . There<strong>for</strong>e, thecurrent I tot through the parallel RLC tank is a square wave with peak values of−I dc and I dc .sq(θ) =I tot (θ) = I dc sq(θ) (3.2){ 1 sin(θ) > 0−1 sin(θ) < 0 = 4 (sin(θ) + 1 π 3 sin(3θ) + 1 )5 sin(5θ) + . . .If one assumes that the parallel RLC tank shorts all harmonics of I tot , thevoltage V R across the tank resistor becomes:V R (θ) = ˆV R sin(θ)ˆV R = RI dc4π(3.3)The wave<strong>for</strong>ms of I tot (θ) and V R (θ) are shown in Fig. 3.10. It remains to deriveI dc . Due to the DC feed inductors, the average drain voltages of M1 and M2must be V dd :∫1 πˆV R sin(θ)dθ = 1 2π 0π ˆV R = V dd ⇒ ˆV R = πV dd (3.4)Solving (3.3)=(3.4) <strong>for</strong> I dc yields:I dc = π24V ddR(3.5)The drain-source currents I ds1 and I ds2 are square waves with peak valuesof 0 and 2I dc as depicted in Fig. 3.9. For the drain-source voltages V ds1 andV ds2 , the on-state must be distinguished from the off-state. For the on-state,the drain-source voltage of the pertaining switch is 0. For the off-state, the
3.2. ANALYSIS OF CLASS-D PAS 19drain-source voltage is a sine with a peak value of ˆV R as the full tank voltagedrops between the drain and source. There<strong>for</strong>e, the drain-source voltages V ds1and V ds2 are half sine waves as shown in Fig. 3.9. With (3.2) and the Fourierseries of a half sine wave, the drain-source voltages and currents may be writtenas follows:V ds1 (θ) = V dd + π 2 V dd sin (θ)− 22 2 − 1 V dd cos (2θ)− 24 2 − 1 V dd cos (4θ)− 26 2 − 1 V dd cos (6θ)−. . .I ds1 (θ) = I dc − I tot (θ) = I dc − 4 π I dc sin (θ) − 43π I dc sin (3θ) − 45π I dc sin (5θ) − . . .V ds2 (θ) = V dd − π 2 V dd sin (θ)− 22 2 − 1 V dd cos (2θ)− 24 2 − 1 V dd cos (4θ)− 26 2 − 1 V dd cos (6θ)−. . .I ds2 (θ) = I dc + I tot (θ) = I dc + 4 π I dc sin (θ) + 43π I dc sin (3θ) + 45π I dc sin (5θ) + . . .Note that corresponding harmonics of V ds1 and V ds2 are the same in amplitudeand phase which provides an open-circuit at all even harmonics. Furthernote that corresponding harmonics of I ds1 and I ds2 are the same in amplitudebut shifted by 180 ◦ in phase which provides a short-circuit at all odd harmonics.There<strong>for</strong>e, the push-pull operation of a CMCD PA provides exactly the correctharmonic termination <strong>for</strong> inverse class-F operation. However, the output baluntrans<strong>for</strong>mer is assumed to be ideal here. Real output balun trans<strong>for</strong>mer do notusually provide perfect isolation to ground at the even harmonics.Efficiency Having established the above relations it is straight-<strong>for</strong>ward tocalculate the drain-efficiency:P out,1 = 1 2ˆV 2 RR= π22V 2 ddR(3.6)P dc = V dd 2I dc = π22V 2 ddRη = P out,1P dc= 1Note that the drain-efficiency is 100% <strong>for</strong> a CMCD PA when the ideal wave<strong>for</strong>msof Fig. 3.9 are assumed. The output power capability P max <strong>for</strong> the CMCDPA is:P max =P out,1=P out,1= 1 V ds,pk I ds,pk πV dd 2I dc π = 0.318
20 CHAPTER 3. DEVICE EVALUATION BY ANALYSISFigure 3.7: Basic circuit of a shunt-tank CMCD PA.Figure 3.8: Tank circuit of the shunt-tank CMCD PA of Fig. √ 3.7 with outputbalun trans<strong>for</strong>mer. The trans<strong>for</strong>mation ratio must be m =RR L.
3.2. ANALYSIS OF CLASS-D PAS 2132.5[A] / [V]21.50.5102 4 6 8 10 12thetaIds1 [A] normalized to IdcVds1 [V] normalized to Vdd32.5[A] / [V]21.50.5102 4 6 8 10 12thetaIds2 [A] normalized to IdcVds2 [V] normalized to VddFigure 3.9: Ideal wave<strong>for</strong>ms <strong>for</strong> the drain-source voltages V ds1 , V ds2 , and currentsI ds1 , I ds2 of a CMCD PA.3[A] / [V]210–12 4 6 8 10 12theta–2–3Itot [A] normalized to IdcVR [V] normalized to VddFigure 3.10: Ideal wave<strong>for</strong>ms <strong>for</strong> the tank current I tot and the load resistorvoltage V R of a CMCD PA.
22 CHAPTER 3. DEVICE EVALUATION BY ANALYSIS3.2.2.2 Spectrum-Limited Wave<strong>for</strong>m OperationDerivation of wave<strong>for</strong>ms The ideal wave<strong>for</strong>ms of Fig. 3.9 suggest that nopower is dissipated in the switching devices. At all times, either V ds or I ds iszero, which results in a drain efficiency of 100%. For real switching deviceshowever, one may assume that V ds and I ds are spectrum-limited because ofparasitic elements acting as low-pass filters. There<strong>for</strong>e, limiting the harmonicsof V ds and I ds to the third order better reflects the real wave<strong>for</strong>ms than assumingan infinite spectrum and eases the analysis. A Fourier-analysis of the I ds1 squarewave reveals that it only contains odd harmonics. Doing the same <strong>for</strong> the V ds1half sine shows that this wave<strong>for</strong>m only contains even harmonics. There<strong>for</strong>e,the spectrum-limited wave<strong>for</strong>ms <strong>for</strong> V ds1 and I ds1 may be written as follows:V ds1 (θ) = V dd + ˆV ds1,1 sin(θ) − ˆV ds1,2 cos(2θ)I ds1 (θ) = I dc − Îds1,1 sin(θ) − Îds1,3 sin(3θ)The coefficients ˆV ds1,1 , ˆV ds1,2 and Îds1,1, Îds1,3 may be determined by assumingmaximally flat wave<strong>for</strong>ms [33]. For a maximally flat wave<strong>for</strong>m, all derivativesare zero at the wave<strong>for</strong>m minimum. The minimum <strong>for</strong> V ds1 (θ) occurs at θ = 3π 2 .Note that the odd-order derivatives of V ds1 (θ) are inherently zero at this point.There<strong>for</strong>e, it is sufficient to require that V ds1 ( 3π 2 ) = 0 and ∂2 V ds1∂t( 3π 2 2 ) = 0 (asalso done in [33] and [18]). The first condition yields ˆV ds1,1 = 4 3 V dd whereasthe second one results in ˆV ds1,2 = 1 ˆV 4 ds1,1 = 1 3 V dd. The minimum <strong>for</strong> I ds1 (θ)occurs at θ = π 2and the odd-order derivatives of I ds1(θ) are again inherentlyzero at this point. There<strong>for</strong>e, it is sufficient to require that I ds1 ( π 2 ) = 0 and∂ 2 I ds1∂t( π 2 2 ) = 0. Here, the first condition results in Îds1,3 = 1 8 I dc whereas the secondone yields Îds1,1 = 9Îds1,3 = 9 8 I dc. The full expressions <strong>for</strong> the drain-sourcevoltages and currents there<strong>for</strong>e are:V ds1 (θ) = V dd + 4 3 V dd sin(θ) − 1 3 V dd cos(2θ)I ds1 (θ) = I dc − 9 8 I dc sin(θ) − 1 8 I dc sin(3θ) (3.7)V ds2 (θ) = V dd − 4 3 V dd sin(θ) − 1 3 V dd cos(2θ)I ds2 (θ) = I dc + 9 8 I dc sin(θ) + 1 8 I dc sin(3θ) (3.8)Fig. 3.11 plots the above wave<strong>for</strong>ms. I dc remains as an unknown in theabove equations. If one again assumes that the parallel RLC tank shorts all
3.2. ANALYSIS OF CLASS-D PAS 23harmonics of I tot (θ) = I ds2 (θ) − I dc , then V R (θ) = R 9 8 I dc sin(θ). Equating thisresult to V R (θ) = V ds1 (θ) − V ds2 (θ) yields <strong>for</strong> I dc :I dc = 64 V dd27 R⇒ ˆV R = 8 3 V dd ≈ 2.67V dd (3.9)Efficiency Having established the above relations it is straight-<strong>for</strong>ward tocalculate the drain-efficiency:P out,1 = 1 2ˆV 2 RR = 32 9V 2 ddR(3.10)P dc = V dd 2I dc = 128 V 2 dd27 Rη = P out,1P dc= 0.75The drain-efficiency drops from 100% <strong>for</strong> the ideal wave<strong>for</strong>ms to 75% <strong>for</strong>the spectrum-limited wave<strong>for</strong>ms. Evidently, the drain-efficiency must be lowerthan 100% <strong>for</strong> the spectrum-limited wave<strong>for</strong>ms as the drain-source voltages andcurrents overlap when the devices are switching on and off. This causes a powerdissipation in the switching devices. The output power capability P max <strong>for</strong> thespectrum-limited wave<strong>for</strong>ms is:P max =P out,1V ds,pk I ds,pk=P out,183 V = 9dd2I dc 32 = 0.2813.2.2.3 Tank Design EquationsRelevant design variables to determine the capacitance, inductance, and resistanceof the parallel RLC tank are:• the off-state drain-source breakdown voltage of the switching devices BV ds,off• the design output power P out,1,design ,• the mid-band frequency f 0 ,• the relative bandwidth B r = B f 0with B the absolute bandwidth,• the maximum current rating of the used inductor I L,mr and of the capacitorI C,mr , and• the quality factor of the used inductor Q L and of the used capacitor Q C .
24 CHAPTER 3. DEVICE EVALUATION BY ANALYSIS2.52[A] / [V]1.510.502 4 6 8 10 12thetaIds1 [A] normalized to IdcVds1 [V] normalized to Vdd2.52[A] / [V]1.510.502 4 6 8 10 12thetaIds2 [A] normalized to IdcVds2 [V] normalized to VddFigure 3.11: Spectrum-limited wave<strong>for</strong>ms <strong>for</strong> the drain-source voltages V ds1 ,V ds2 , and currents I ds1 , I ds2 of a CMCD PA.
3.2. ANALYSIS OF CLASS-D PAS 25According to (3.9) the peak drain-source voltage of the switching device is2.67V dd . There<strong>for</strong>e, the designer has to make sure that BV ds,off > 2.67V dd .Having set the supply voltage V dd satisfying the <strong>for</strong>mer inequality, the totaltank resistance R may be determined from the design output power P out,1,designaccording to (3.10):R = 329V 2ddP out,1,design(3.11)It is important to note that the tank resistance R consists of the parallelcombination of the equivalent inductor parallel resistance R pL , the equivalentcapacitor parallel resistance R pC , and the resistance R load seen by the parallelLC tank looking into the output balun trans<strong>for</strong>mer.The loaded quality factor of the parallel RLC tank Q loaded is determinedby the relative bandwidth B r and the maximum current rating of the inductorand capacitor. According to [17], Q loaded = 1B rif B r ≪ 1. There<strong>for</strong>e, one mayrequire that Q loaded < 1B r, an inequality that is often readily satisfied. However,again according to [17], the absolute current through the inductor at resonanceis |I L | = |VR|ω = R|Itot|0L ω = Q 0L loaded |I tot |, and the one through the capacitor atresonance is |I C | = ω 0 C |V R | = ω 0 CR |I tot | = Q loaded |I tot |. There<strong>for</strong>e, with apeak I tot of I dc and a maximum current rating of I L,mr <strong>for</strong> the inductor and ofI C,mr <strong>for</strong> the capacitor, one has to require that(IL,mrQ loaded < min , I )C,mrI dc I dcA( reasonable ) strategy <strong>for</strong> choosing a Q loaded is to use a value close toIL,mrminI dc, IC,mrI dcbecause a higher Q loaded makes a better short-circuit <strong>for</strong>the harmonics in I tot . Moreover, the minimum realizable tank inductance L minmay limit Q loaded as well.RQ loaded
26 CHAPTER 3. DEVICE EVALUATION BY ANALYSIS(valid if Q L ≫ 1 and Q C ≫ 1) with R sL , R sC the equivalent series resistances,and R pL , R pC the equivalent parallel resistances, yields <strong>for</strong> the conductanceG load seen by the parallel LC tank looking into the output baluntrans<strong>for</strong>mer:G load = 1 ( 1R − ω 0C + 1 )Q L Q CWith R load = 1G load, all elements of the parallel RLC tank are specified.3.3 Analytical Derivation of the PAE <strong>for</strong> a FET<strong>Device</strong>In order to identify the device parameters with a large impact on the PAE,analytical expressions <strong>for</strong> the input, output, and DC power as well as <strong>for</strong> thedrain-efficiency and PAE are derived. As a first step, the PAE is derived <strong>for</strong>a MOSFET device and later adapted to a HEMT device. The analytical expressionsallow a fast and straight-<strong>for</strong>ward sensitivity analysis that identifiesthe most relevant device parameters <strong>for</strong> a CMCD PA. The MOSFET equivalentcircuit, the input power expression, and the derivation of the drain-sourcevoltage during the positive half cycle are strongly based on the analysis by D.Choi done <strong>for</strong> a class-E PA in [30].3.3.1 Analytical Derivation of the Input, Output, and DC<strong>Power</strong> <strong>for</strong> a MOSFET <strong>Device</strong>3.3.1.1 Equivalent Circuit and Non-ideal Wave<strong>for</strong>msThe equivalent large-signal model <strong>for</strong> a shunt-tank CMCD circuit of Fig. 3.7 isdepicted in Fig. 3.12 <strong>for</strong> MOSFETs as switching devices. The MOSFET largesignalmodel includes a voltage-dependent current source as well as parasiticresistors and parasitic capacitors. R g and R s model the intrinsic gate andintrinsic source resistance, respectively, C gs the gate-source capacitance, C gdthe gate-drain capacitance, and C ds the output capacitance. Note that C gsand C ds bypass R s and directly connect to the ground potential to simplify thesubsequent analysis.The voltage-dependent current sources I ds1 and I ds2 model the DC outputcharacteristic of the transistors. Fig. 3.13 shows the simulated DC outputcharacteristic of a Motorola M<strong>RF</strong>21010S LDMOS FET. We anticipate that theFET operates in its triode region during the on-state and in its cut-off regionduring the off-state. For the on-state, V ds does not drop to 0 but remainsat a voltage V dsmin that depends on the imposed I ds = 2I dc and the definedgate-drive V gs .V dsmin must there<strong>for</strong>e be accounted <strong>for</strong> in the spectrum-limited wave<strong>for</strong>msderived in section 3.2.2.2. Moreover, the drain-source current flows through R sin the model of Fig. 3.12 thereby provoking a voltage drop that adds to V dsmin in
3.3. ANALYTICAL DERIVATION OF THE PAE FOR A FET DEVICE 27Figure 3.12: Equivalent large-signal model <strong>for</strong> the shunt-tank CMCD circuit ofFig. 3.7 <strong>for</strong> MOSFETs as switching devices.Figure 3.13: Simulated DC output characteristic of a Motorola M<strong>RF</strong>21010SLDMOS FET with the anticipated on- and off-states <strong>for</strong> an imposed I ds of 1 Aand <strong>for</strong> a defined gate-drive V gs of 5.5 V. The breakdown voltage <strong>for</strong> this deviceis 65 V.
28 CHAPTER 3. DEVICE EVALUATION BY ANALYSISthe drain-ground voltage. To derive the spectrum-limited drain-ground currentand voltage wave<strong>for</strong>ms accounting <strong>for</strong> these two effects, the current wave<strong>for</strong>msare assumed to remain the same as in (3.7) and (3.8) as a first order approximation:I d1 (θ) = I ds1 (θ) and I d2 (θ) = I ds2 (θ). The drain-ground voltage wave<strong>for</strong>m<strong>for</strong> transistor M1 is derived as follows:V d1 (θ) = ˆV d1,0 + ˆV d1,1 sin(θ) − ˆV d1,2 cos(2θ) − R s I d1 (θ)Because the drain voltage must be V dd on the average, ˆV d1,0 = V dd + R s I dc .To determine the remaining coefficients <strong>for</strong> maximally flat wave<strong>for</strong>ms it is reasonableto require that V d1 ( 3π 2 ) = V dsmin + R s I d1 ( 3π 2 ) and ∂2 V ds1∂t( 3π 2 2) = 0. Thefirst condition yields ˆV d1,2 = 1 3 (V dd − V dsmin − R s I dc ), whereas the second oneresults in ˆV d1,1 = 4 ˆV d1,2 = 4 3 (V dd − V dsmin − R s I dc ). The full expressions <strong>for</strong>the drain-ground voltages there<strong>for</strong>e are:V d1 (θ) = V dd + 4 3 (V dd − V dsmin − R s I dc ) sin(θ) − 1 3 (V dd − V dsmin − R s I dc ) cos(2θ)− 9 8 R sI dc sin(θ) − 1 8 R sI dc sin(3θ)(3.12)V d2 (θ) = V dd − 4 3 (V dd − V dsmin − R s I dc ) sin(θ) − 1 3 (V dd − V dsmin − R s I dc ) cos(2θ)+ 9 8 R sI dc sin(θ) + 1 8 R sI dc sin(3θ)(3.13)Fig. 3.14 plots the voltage and current wave<strong>for</strong>ms according to these equations.I dc may again be derived by equating V R (θ) = R 9 8 I dc sin(θ) to V R (θ) =V ds1 (θ) − V ds2 (θ). A first order approximation of I dc is:I dc = 64 (V dd − V dsmin )27R + 118R s(3.14)3.3.1.2 Input <strong>Power</strong>The input power <strong>for</strong> the circuit of Fig. 3.12 may be derived in the same way asdone by D. Choi in [30]. The following shortly presents the basic ideas of theinput power derivation; <strong>for</strong> the full derivation, refer to [30]. The input wave<strong>for</strong>mis assumed to be a sine: V in = ˆV in sin(θ). The equivalent complex amplitude isV in = ˆV in e j0 . The input power <strong>for</strong> the positive half cycle and the negative halfcycle of the sine has to be derived separately:Positive half cycle 0 ≤ θ < π The input power <strong>for</strong> the positive half cyclemay be calculated as P in,pos = 1 4 Re [V inI ∗ in ] with I∗ in the complex-conjugateof I in . If one assumes that the drain-voltage remains constant as a first orderapproximation during the positive half cycle, then the input impedance my bewritten as1Z in = R g +(3.15)jω (C gs,pos + C gd,pos )
3.3. ANALYTICAL DERIVATION OF THE PAE FOR A FET DEVICE 29654[A] / [V]32102 4 6 8 10 12thetaIds1 [A]Vds1 [V]654[A] / [V]32102 4 6 8 10 12thetaIds2 [A]Vds2 [V]Figure 3.14: Non-ideal wave<strong>for</strong>ms <strong>for</strong> the drain-ground voltages V d1 , V d2 , andcurrents I d1 , I d2 of a CMCD PA according to (3.12) and (3.13) <strong>for</strong> V dd = 2.5 V,V dsmin = 0.1 V, R s = 1 Ω, and R = 50 Ω.
30 CHAPTER 3. DEVICE EVALUATION BY ANALYSISAs I in = VinZ in, the input power <strong>for</strong> the positive half cycle may now be derivedas:P in,pos = ˆV in2 ω 2 R g (C gs,pos + C gd,pos ) 24 1 + [ωR g (C gs,pos + C gd,pos )] 2 (3.16)Since the MOSFET is assumed to operate in its triode region <strong>for</strong> the positivehalf cycle, one may approximate C gs,pos and C gd,pos asC gs,pos = C gd,pos = 1 2 F W LC ox + F W C ovF , W , and L are the number of fingers, the finger-width, and the channel-length,respectively.Negative half cycle π ≤ θ < 2π The input power <strong>for</strong> the negative half cycleis P in,neg = 1 4 Re [V inI ∗ in ] with I∗ in the ( complex-conjugate ) of I in. If V Cgs is thevoltage across C gs , then I in = 1R Vin g− V Cgs . It remains to derive VCgs .The impedance Z at the gate, looking into the drain, isZ = V C gsV Cgs= ( ) (3.17)I gd jωC gd,neg VCgs − V dwith V d the drain-ground voltage. During the negative half cycle, the draingroundvoltage V d2 (θ) given by (3.13) may be approximated by a sine of amplitude−V d2 ( 3π 2 ): V d2,approx(θ) = −V d2 ( 3π 2) sin(θ). It follows thatV d = −V d2 ( 3π ( 82 ) = − 3 V dd − 5 3 V dsmin − 8 )3 R sI dcUsing the voltage-divider <strong>for</strong>mula yields <strong>for</strong> V Cgs :V Cgs = V in1jωC gs,neg‖ZR g +1jωC gs,neg‖Z = V in1 + RgZ1+ jωR gC gs,negSubstituting Z in the above equation by (3.17) and solving <strong>for</strong> V Cgs resultsin the desired <strong>for</strong>mula <strong>for</strong> V Cgs . The input power <strong>for</strong> the negative half cyclemay now be derived as:P in,neg = ˆV in4[ ]ω 2 R g (C gs,neg + C gd,neg ) ˆVin (C gs,neg + C gd,neg ) − V d C gd,neg1 + [ωR g (C gs,neg + C gd,neg )] 2 (3.18)Since the MOSFET is assumed to operate in cut-off <strong>for</strong> the negative halfcycle, one may approximate C gs,neg and C gd,neg asC gs,neg = F W C ov + F W LC oxC gd,neg = F W C ov
3.3. ANALYTICAL DERIVATION OF THE PAE FOR A FET DEVICE 31The F W LC ox -part in C gs,neg represents the gate-bulk capacitance during cutoff.The gate-bulk capacitance shows up as part of the gate-source capacitance asthe bulk is tied to the source - either internally <strong>for</strong> a LDMOS FET or externally<strong>for</strong> a MOSFET.Full cycle and gate resistanceThe input power <strong>for</strong> the full cycle is:P in,1 = 2 (P in,pos + P in,neg )The factor 2 accounts <strong>for</strong> the fact that there are two transistors.resistance may be modeled as:The gateR g = 1 F (R g,poly + R g,contact )R g,poly and R g,contact are the polysilicon gate resistance and the metal-polysiliconcontact resistance, respectively [30]. R g,poly = W 3L R g,sheet with R g,sheet the gatesheet resistance.3.3.1.3 Output and DC <strong>Power</strong>Derivation of output and DC power Recall from section 3.3.1.1 that ˆV R =R 9 8 I dc. Together with (3.14) it is straight-<strong>for</strong>ward to calculate the output andDC power:P out,1 = 1 2ˆV 2 RR = 2592R (V dd − V dsmin ) 2(27R + 118R s ) 2 (3.19)P dc = V dd 2I dc = 128V dd (V dd − V dsmin )27R + 118R sDerivation of V dsmin V dsmin remains as an unknown in the above equations.The well-known drain-source current equation <strong>for</strong> a MOSFET in the trioderegion may be used to estimate V dsmin .I ds (0 ≤ θ < π) = 2I dc = µ n C oxWL[(V gs (0 ≤ θ < π) − V th ) V dsmin − 1 ]2 V 2 dsmin(3.20)A difficulty is to estimate V gs (0 ≤ θ < π) in the above equation. D. Choisuggests in [30] to estimate it as V gs (θ) = abs(V gs ′ ) sin ( θ + arg(V gs ′ )) + V th <strong>for</strong>a gate bias voltage of V th and to use the voltage-divider <strong>for</strong>mula <strong>for</strong> V ′V ′gs = ˆV in11 + jω (C gs,pos + C gd,pos ) (R g + R s )In this <strong>for</strong>mula, C gs means the capacitance between the points G and S in Fig.3.12. V gs (θ) may now be averaged over 0 ≤ θ < π. However, this ef<strong>for</strong>t doesgs:
32 CHAPTER 3. DEVICE EVALUATION BY ANALYSISnot pay off, as the model comparison in Fig. 3.15 shows. Assuming that theinput voltage fully drops across C gs and using the average value of a half-sineof amplitude ˆV in <strong>for</strong> V gs (0 ≤ θ < π), i. e. V gs (0 ≤ θ < π) = 2 ˆV π in + V th ,yields about the same PAE but greatly simplifies the equations. There<strong>for</strong>e,2 ˆV π in + V th is subsequently used <strong>for</strong> V gs (0 ≤ θ < π) (denoted as the No InputVoltage-Divider model in Fig. 3.15) instead of the Input Voltage-Divider model.Moreover, the term 1 2 V 2 dsmin in (3.20) causes V dsmin to become imaginary<strong>for</strong> low input voltages when solving (3.20) <strong>for</strong> V dsmin . In Fig. 3.15 this happens<strong>for</strong> input voltages lower than about 5.5 V. There<strong>for</strong>e, the drain-source currentequation <strong>for</strong> the deep triode region neglecting the quadratic V dsmin -term in theI ds -equation is subsequently used:I ds (0 ≤ θ < π) = 2I dc = µ n C oxWL[ 2π ˆV in V dsmin](3.21)The comparison in Fig. 3.15 between the model employing the triode currentequation and the model employing the deep triode current equation suggeststhat the PAE <strong>for</strong> the deep triode model is about the same as <strong>for</strong> the triodemodel <strong>for</strong> large input voltages. However, Fig. 3.15 further suggests that thedeep triode model grossly overestimates the PAE <strong>for</strong> input voltages that yielda lower-than-peak PAE. For input voltages that yield about the peak PAE, thepredicted PAE-values <strong>for</strong> the deep triode model and <strong>for</strong> the triode model areabout the same.The drain-source current equation <strong>for</strong> the deep triode region, (3.21), maynow be solved <strong>for</strong> V dsmin :V dsmin =V dd1 + 164π µC oxF W L ˆV in (27R + 118R s )(3.22)3.3.2 Analytical Expressions <strong>for</strong> η and P AEWith the results <strong>for</strong> P in , P out , and P dc of section 3.3.1, deriving the drainefficiencyη and the P AE just takes some algebraic manipulations.( )η = P 81R 1 − V dsminout,1V dd=P dc 4 (27R + 118R s )(3.23)(P AE = Pout,1−Pin,1P dc= η − η G = 81R)1− V dsminV dd4(27R+118R s)− ˆV inR gω 2 F 2 W 2 (27R+118R s)(LC ox+2C ov)[2 ˆV in(LC ox+2C ov)−C ovV d]256V 2 dd(1+[ωF W R g(LC ox+2C ov)] 2 ) ( 1− V dsminV dd)(3.24)V d =( )V dd Vdsmin[135R + 78R s ] − 216R − 432R s3 (27R + 118R s ) V dd
3.3. ANALYTICAL DERIVATION OF THE PAE FOR A FET DEVICE 33Figure 3.15: Calculated drain-efficiency η and PAE as a function of the inputvoltage ˆV in <strong>for</strong> three different models of deriving V dsmin . The deep triodemodel uses (3.21) <strong>for</strong> I ds . The triode model uses (3.20) <strong>for</strong> I ds . Theargument IVD stands <strong>for</strong> Input Voltage-Divider and means that V gs (θ) =abs(V gs) ′ sin ( θ + arg(V gs) ) ′ + V th is averaged over 0 ≤ θ < π. NIVD (No InputVoltage-Divider) curves just use V gs (0 ≤ θ < π) = 2 ˆV π in + V th . (The curves arebased on a sample CMCD PA employing Ericsson PTF10135 LDMOS devices.)
34 CHAPTER 3. DEVICE EVALUATION BY ANALYSISThe derivation of the PAE outlined in the last two sections has been implementedas a Maple 2 worksheet. This worksheet allows to plot the drain-efficiencyη, the P AE, the input, output, and DC power versus various parameters. Theworksheet e. g. makes it possible to determine the device dimensions <strong>for</strong> a MOS-FET that maximize the PAE <strong>for</strong> a given PA specification and a given MOSFETmanufacturing process.3.3.3 Comparison to Harmonic-Balance SimulationsTo verify the adequacy of the derived equations <strong>for</strong> the drain-efficiency andthe PAE, harmonic-balance simulations in ADS 3 were per<strong>for</strong>med. The ADSschematics of Fig. 3.16 and Fig. 3.17 correspond to the shunt-tank CMCDPA of Fig. 3.12 (on page 27). For the switching devices, a SPICE LEVEL 3model of the Ericsson PTF10135 LDMOS FET was used. The SPICE LEVEL3 model and the package parasitics <strong>for</strong> this device have been extracted by D.Choi in [2]. To directly compare the simulated and calculated efficiencies, inputmatching and output matching circuitry is omitted. The calculated efficienciesand powers are based upon the parameters of the Ericsson PTF10135 LDMOSFET given in Tab. 3.1a and upon the parameters of a CMCD PA referencedesign given by Tab. 3.1b. The data given in Tab. 3.1a was extracted from theSPICE LEVEL 3 model.Fig. 3.18 plots the calculated and simulated drain-efficiency η and PAEversus the input voltage amplitude ˆV in . As predicted in section 3.3.1.3, thecalculated efficiencies grossly overestimate the simulated efficiencies <strong>for</strong> verylow input voltage amplitudes (<strong>for</strong> ˆV in < 2.5 V in Fig. 3.18). However, thecalculated peak-PAE <strong>for</strong> R g,sheet = 0.56 Ω □deviates by merely 0.5 V from thesimulated peak-PAE. Doubling e. g. the value of the poorly measurable gatesheet resistance from R g,sheet = 0.56 Ω □ (as given in [2]) to R g,sheet = 1.12 Ω □shifts the peak-PAE by more than 1 V. From the data given in Fig. 3.18, wemay conclude that the PAE-<strong>for</strong>mula given by (3.24) is adequate to assess theimpact of the parameters shown in the equivalent CMCD PA circuit of Fig. 3.12.However, the PAE-<strong>for</strong>mula is not adequate <strong>for</strong> accurately predicting the PAE.Fig. 3.19 provides some indications where the errors <strong>for</strong> accurately predictingthe PAE are made. While the input power is predicted fairly accurate, largeerrors are made in estimating the output and DC power.3.3.4 Discussion and Conclusions from Analytical Expressions3.3.4.1 Sensitivity AnalysisLooking at the PAE-<strong>for</strong>mula (3.24), no parameter that obviously optimizes thePAE can be identified. There<strong>for</strong>e, the sensitivity of the PAE towards the differentparameters has been investigated. Fig. 3.20, Fig. 3.21, and Fig. 3.22 plot2 Maple 8 by Waterloo Maple Inc.3 Advanced Design System 2002C by Agilent Technologies
3.3. ANALYTICAL DERIVATION OF THE PAE FOR A FET DEVICE 35Figure 3.16: ADS schematic <strong>for</strong> the harmonic-balance simulations. Refer to Fig.3.17 <strong>for</strong> the CMCD_PA_LDMOS_PTF10135 block.
36 CHAPTER 3. DEVICE EVALUATION BY ANALYSISTable 3.1: Parameters of the Ericsson PTF10135 LDMOS FET (a) and parametersof a CMCD PA reference design (b).V dd = BVπ(a)R s = 0.565 Ω R g,sheet = 0.55836 Ω □R g,contact = 0C ox = 40 · 10 −6 m F 2 C ov = 0.2037 · 10 −9 m F µ n = 0.045VsmF = 180 W = 250 · 10 −6 m L = 0.5 · 10 −6 m(b)f = 900 MHz V dd = 20.69 V R = 152 Ω ˆV in = 4.4 Vwith BV = 65 V the breakdown voltage of the PTF10135 LDMOSFET. R was calculated from (3.11). ˆVin corresponds to the calculatedmaximum P AE.Figure 3.17: ADS schematic <strong>for</strong> the CMCD_PA_LDMOS_PTF10135 block ofFig. 3.16.
3.3. ANALYTICAL DERIVATION OF THE PAE FOR A FET DEVICE 37Figure 3.18: Drain-efficiency η and PAE versus the input voltage amplitude ˆV inas calculated by the analytical model and as simulated by harmonic-balancesimulations with a SPICE LEVEL 3 model of the PTF10135 LDMOS FET <strong>for</strong>the CMCD PA reference design of Tab. 3.1b.Figure 3.19: DC power, output power, and input power versus the input voltageamplitude ˆV in as calculated by the analytical model and as simulated byharmonic-balance simulations with a SPICE LEVEL 3 model of the PTF10135LDMOS FET <strong>for</strong> the CMCD PA reference design of Tab. 3.1b.
38 CHAPTER 3. DEVICE EVALUATION BY ANALYSISthe normalized PAE value versus the normalized parameter values <strong>for</strong> differentranges. For these sensitivity plots, the PAE was normalized to the PAE of theCMCD PA reference design given in Tab. 3.1 employing PTF10135 LDMOSFETs. By looking at the sensitivity plots, we may classify the parameters intothree categories:• Parameters that show a nearby maximum: ˆVin , R, C ox , and the dimensionparameters F , W , and L.• Parameters that maximize the PAE when increasing (positive sensitivity):V dd and µ n . To maximize the PAE, it is there<strong>for</strong>e advisable to pick thehighest V dd that still fulfills BV ds,off > πV dd . µ n however, is often notsubject to optimization as it is a fixed manufacturing process parameter.• Parameters that maximize the PAE when decreasing (negative sensitivity):R s , R g,sheet , and C ov . The normalized sensitivity of the PAE increasesin this order. Note that HEMT/pHEMT devices may gain an edge overMOSFET devices from this point of view as HEMTs/pHEMTs do not sufferfrom an overlap capacitance. Moreover, the gate sheet resistance <strong>for</strong>HEMTs/pHEMTs is substantially lower than the gate sheet resistance <strong>for</strong>MOSFETs as HEMTs/pHEMTs employ a metal gate instead of a polysilicongate.To maximize the PAE, it there<strong>for</strong>e pays most besides findingan optimum <strong>for</strong> ˆV in , R, C ox , F , W , and L to minimize C ov(normalized sensitivity of S N = −0.17), to maximize V dd (S N =0.11), to minimize R g,sheet (S N = −0.09), and to minimize R s(S N = −0.02) in this order.However, the normalized sensitivities given here are only valid <strong>for</strong> this particularreference PAE. They may change significantly if a different CMCD PAreference design with other parameters than those given in Tab. 3.1 is selected.Note that the normalized sensitivity of the parameter x was computed as follows:S N (x) =x ∂P AEP AE ∂x3.3.4.2 Resulting Design GuidelinesThe above sensitivity analysis suggests the following design guidelines <strong>for</strong> thedesign parameters V dd , ˆV in , and R:• V dd = BV ds,offπ• Find ˆV in and R that maximize the P AE.
3.3. ANALYTICAL DERIVATION OF THE PAE FOR A FET DEVICE 39Figure 3.20: Calculated normalized PAE values versus normalized parametervalues between 0.4 and 1.6 <strong>for</strong> the CMCD PA reference design given in Tab. 3.1employing Ericsson PTF10135 LDMOS FETs.
3.3. ANALYTICAL DERIVATION OF THE PAE FOR A FET DEVICE 41Figure 3.22: Calculated normalized PAE values versus normalized parametervalues between 1 and 100. The parameters of the reference design are given inTab. 3.1.
42 CHAPTER 3. DEVICE EVALUATION BY ANALYSISIncreasing V dd maximizes the P AE and the output power P out,1 at the sametime as the above sensitivity analysis and (3.19) (on page 31) <strong>for</strong> P out,1 show.However, a ˆV in or a R that maximizes the P AE does not necessarily maximizethe output power P out,1 at the same time.Fig. 3.23 plots among other quantities the calculated P AE and outputpower P out,1 as a function of ˆV in <strong>for</strong> the CMCD reference design. As may beseen from the expression <strong>for</strong> P out,1 (3.19) in conjunction with the expression <strong>for</strong>V dsmin (3.22), ˆVin must be maximized in order to maximize P out,1 . Lookingat Fig. 3.23, a reasonable strategy <strong>for</strong> selecting ˆV in is to choose the one thatmaximizes the P AE.Fig. 3.24 plots the calculated P AE and output power P out,1 as a functionof R. In contrast to selecting ˆV in , picking the R that maximizes the P AE mayresult in a very low output power P out,1 . In Fig. 3.24 the maximum P AE occurs<strong>for</strong> R = 191 Ω, whereas the maximum P out,1 occurs <strong>for</strong> R = 13 Ω. There<strong>for</strong>e,sacrificing e. g. 1 % of P AE by selecting a lower-than-optimum R in return ofa greatly improved output power seems justifiable. This results in the followingdesign guidelines <strong>for</strong> V dd , ˆV in , and R:• V dd = BV ds,offπ• Select ˆV in that maximizes the P AE.• Find R that maximizes the P AE and lower R to a value that yields aP AE 1 % lower than be<strong>for</strong>e. Select the R that gives the best trade-offbetween the P AE and P out,1 over this range.Note that the output power cannot be increased indefinitely as (3.11) (on page25) suggests. (3.11) is an approximation that is only valid if R is large comparedto R s , and ˆV in is very large. Even if ˆV in is infinite, the output power expression(3.19) converges to zero if R is small compared to R s . There<strong>for</strong>e, P out,1 alwaysshows a maximum as a function of R.3.3.5 Adaption to HEMT <strong>Device</strong>sThe analysis of section 3.3.1 is easily adapted to HEMT devices as the trioderegion I ds -equation <strong>for</strong> the HEMT is of the same <strong>for</strong>m as <strong>for</strong> the MOSFET. Thetriode region I ds -equation <strong>for</strong> the HEMT may be written as [34]:I ds = µ n C iWL[(V gs − V th ) V ds − 1 ]2 V ds2C i = εsd 2DEGis the gate-to-channel capacitance, ε s the permittivity andd 2DEG the distance of the two-dimensional electron gas (2DEG) from the gate.The <strong>for</strong>m of the above equation is exactly the same as of (3.20) <strong>for</strong> a MOSFET.V dsmin may there<strong>for</strong>e be calculated with (3.22) by replacing C ox with C i . Whatremains is to <strong>for</strong>mulate the HEMT C gs and HEMT C gd <strong>for</strong> the positive and
3.4. COMPARISON OF MOSFET-, HBT-, AND HEMT-PARAMETERS 4310080[%] / [W]60402002 4 6 8 10 12 14 16 18 20Vin [V]etaPAEPdcPoutPinFigure 3.23: Calculated drain-efficiency η , P AE, DC power, output power, andinput power as a function of the input voltage amplitude ˆV in <strong>for</strong> the CMCD PAreference design given in Tab. 3.1.negative half cycle to calculate the input power with (3.16) and (3.18). Duringthe positive half cycle, when the HEMT operates in the triode region, thegate-to-channel capacitance may be assumed to be evenly distributed betweenthe source and the drain: C gs,pos = C gd,pos = 1 2 C i. During the negative halfcycle, when the HEMT operates in cut-off, the capacitances reduce to zero:C gs,neg = C gd,neg = 0. Note that the HEMT does not suffer from an overlapcapacitance as the MOSFET does. However, there are fringing capacitancesC gs,fringe and C gd,fringe . These capacitances are neglected above <strong>for</strong> simplicity.3.4 Comparison of MOSFET-, HBT-, and HEMT-ParametersThe most relevant device parameters <strong>for</strong> a CMCD PA have been identifiedby the sensitivity analysis. They include the drain-source breakdown voltage(because the breakdown voltage imposes an upper limit on V dd ), the mobilityµ n , the source resistance R s , the gate sheet resistance R g,sheet , and the overlapcapacitance C ov . Further important device parameters are the transit frequencyf T , the maximum oscillation frequency f max , and the maximum drain-sourcecurrent rating I ds,mr . To identify the differences in device parameters betweenthe devices of interest, commercially available packaged devices are investigated
44 CHAPTER 3. DEVICE EVALUATION BY ANALYSIS10080[%] / [W]604020050 100 150 200 250 300R [Ohm]etaPAEPdcPoutPinFigure 3.24: Calculated drain-efficiency η , P AE, DC power, output power,and input power as a function of the total tank resistance R <strong>for</strong> the CMCD PAreference design given in Tab. 3.1.in this section followed by a theoretical analysis of the breakdown phenomena,the switching per<strong>for</strong>mance, and the on-resistance <strong>for</strong> the devices of interest.3.4.1 Comparison of Selected Commercial <strong>Device</strong>sFor a first impression of how the device parameters <strong>for</strong> different technologiescompare to each other, the device parameters of 16 commercial packaged <strong>RF</strong>transistors are summarized in Tab. 3.2. The selection includes LDMOS FET,HBT, HEMT, pHEMT, E-pHEMT, and MESFET devices. Evidently, this selectionis not necessarily fully representative <strong>for</strong> the specific device families.However, it is possible to identify some of the striking properties. Fig. 3.25provides a good means to do so: it illustrates the fraction of the table maximuma certain device achieves <strong>for</strong> four different parameters. The device with the bestoverall per<strong>for</strong>mance is the one with the largest area obtained from connectingthe corresponding points on the four axes. With this figure of merit, we mayconclude:• The LDMOS FET devices are unrivaled in their high breakdown voltage.A high breakdown voltage benefits the PAE very much. There<strong>for</strong>e, LD-MOS FET devices may be the best choice <strong>for</strong> a CMCD PA but only if thefrequency is low as they have a low f max .
3.4. COMPARISON OF MOSFET-, HBT-, AND HEMT-PARAMETERS 45Figure 3.25: Relative fractions of table maxima in Tab. 3.2 <strong>for</strong> V ds,mr , I ds,mr ,and f max . Additionally, it is indicated whether it is possible to bias the devicewith a positive voltage (100% mark on the V th > 0 axis) or not (50% mark onthe V th > 0 axis). (f max <strong>for</strong> the LDMOS FET is an estimate.)• The HBT devices generally suffer from both a low breakdown voltage anda low maximum current rating. The area of the connected points is low,the overall per<strong>for</strong>mance there<strong>for</strong>e probably poor <strong>for</strong> a CMCD PA.• The HEMT and the MESFET devices seem to per<strong>for</strong>m similarly average.• The pHEMT devices show a very large f max and a fairly large maximumcurrent rating but suffer from a low breakdown voltage. There<strong>for</strong>e,pHEMT devices may be the best choice <strong>for</strong> a CMCD PA but only if thefrequency is high.• The advantage of a positive threshold voltage <strong>for</strong> the E-pHEMT is offsetby its very low breakdown voltage.3.4.2 Breakdown PhenomenaThe off-state breakdown voltage of a switching device is a very important deviceparameter as the supply voltage V dd must be maximized to maximize the PAE.There<strong>for</strong>e, the breakdown phenomena <strong>for</strong> the MOSFET, LDMOS FET, HBTand HEMT/pHEMT are compared to each other in the following. For theMOSFET, LDMOS FET, and HBT, the dominant breakdown phenomena are• the avalanche breakdown of a reverse-biased pn-junction and• the punch-through of a PN depletion region.
46 CHAPTER 3. DEVICE EVALUATION BY ANALYSISTable 3.2: Selected commercial LDMOS FET, HBT, HEMT, pHEMT, E-pHEMT, and MESFET devices (all data are from the corresponding datasheets).
3.4. COMPARISON OF MOSFET-, HBT-, AND HEMT-PARAMETERS 47Avalanche breakdown occurs when the reverse-bias voltage of a pn-junction ishigh enough to start an avalanche impact ionization by free electrons. Thebreakdown voltage mainly depends on the critical electric field E c and on thebackground doping concentration. The background doping concentration is theminimum of the p- and n-doping concentration. Solving the one-dimensionalPoisson equation <strong>for</strong> a pn-junction yields [35]andx p = E(0)ε sqN A, x n = − E(0)ε sqN D(3.25)V bi + V r = x pE(0)2− x nE(0)2(3.26)where x p and x n are the depletion region borders <strong>for</strong> the p- and n-region,respectively. E(0) is the electric field at the pn-interface, N A and N D theacceptor and donator doping concentration, respectively, V bi the built-in voltage,and V r the reverse-bias voltage. Using (3.25) and (3.26), it is straight-<strong>for</strong>wardto derive the avalanche breakdown voltage BV av <strong>for</strong> E(0) = E c by ignoring V bias V r ≫ V bi :BV av = E2 c ε s2qN A + N DN A N D(3.27)For the above derivation, planar pn-junctions have been assumed. However,<strong>for</strong> cylindrical junctions and even more <strong>for</strong> spherical junctions, the breakdownvoltage may be considerably lower. The field lines converge at these structureswhich causes devices to breakdown at diffusion-edges first. Moreover, E c is afunction of the doping concentration, increasing with an increasing backgrounddoping concentration. Generally, the critical field <strong>for</strong> GaAs is about 10% higherthan the critical field <strong>for</strong> Si.Punch-through occurs when the depletion region of a reverse-biased pnjunctiongets wide enough to hit the contacts of the p- or n-region. Againusing (3.25) and (3.26), the punch-through voltage BV pt may be derived byignoring V bi as be<strong>for</strong>eBV pt,towards p contact = x2 p,max q2ε sN A (N A + N D )N D(3.28)BV pt,towards n contact = x2 n,max q2ε sN D (N D + N A )N A(3.29)where x p,max and x n,max mark the diffusion-ends in the p-region and n-region, respectively.
48 CHAPTER 3. DEVICE EVALUATION BY ANALYSIS3.4.2.1 MOSFET/LDMOS FETFig. 3.26 shows the simplified cross-sections of a conventional Si MOSFETdevice and of a Si LDMOS FET. The LDMOS FET employs a p-base and an-well diffusion in addition to the source- and drain-contacts of the conventionalMOSFET which allows <strong>for</strong> a higher breakdown voltage. The inversion channel is<strong>for</strong>med beneath the gate in the p-base region. The n-well region serves as a driftregion <strong>for</strong> the electrons traveling from the source to the drain. The fundamentaladvantage of this structure over the conventional MOSFET of Fig. 3.26a isthat it minimizes the electric field immediately under the gate and there<strong>for</strong>eincreases the breakdown voltage. The bulk contact is internally shorted tothe source-contact to disable the parasitic n-well/p-base/n+ structure. Thisn-p-n structure may still trigger a bipolar common-emitter breakdown: Thehorizontal current flowing in the p-base from the n-well to the p+ contact maycause a voltage drop along the p-base that <strong>for</strong>ward-biases the p-base/n+ diode.If this happens, the bipolar common-base breakdown voltage BV CB reducesto the bipolar common-emitter breakdown voltage BV CE , a value only about0.6BV CB [36].Generally, the MOSFET and the LDMOS FET suffer from the followingbreakdown phenomena:• Avalanche breakdown of the drain-bulk diode in the MOSFET case and ofthe n-well/p-base diode in the LDMOS FET case.• Punch-through of the drain-bulk depletion region towards the source <strong>for</strong>the MOSFET and of the n-well/p-base depletion region towards the sourcein the LDMOS FET case. Moreover, the depletion region may also punchthroughtowards the n+ drain contact <strong>for</strong> the LDMOS FET. However, thiskind of punch-through may be tolerated since it does not mean a loss ofcurrent control as in a punch-through towards the source.• Time-dependent dielectric breakdown (TDDB): TDDB refers to charge carriersbeing permanently trapped in the gate oxide due to exposure to highfields. The trapped charge carriers modify the threshold voltage.• Oxide rupture: If the gate is at a very low and the drain at a very highpotential an irreversible gate-to-channel short may result. Oxide ruptureis particularly a problem with ever-thinner gate oxides.The avalanche breakdown voltages may be calculated by (3.27), whereas (3.28)and (3.29) serve to calculate the punch-through voltages. In the case of theLDMOS FET, several measures may be taken to increase the breakdown voltage.Some of these are a staggered (dual-)gate to minimize the field towards the drain,a metal plate above the gate acting as a Faraday shield to minimize the field atthe edges of the gate [36], or lightly doped drain extensions [37].
3.4. COMPARISON OF MOSFET-, HBT-, AND HEMT-PARAMETERS 49(a)(b)Figure 3.26: Simplified cross-sections of a conventional Si MOSFET device (a)and of a Si LDMOS FET (b, according to [38]).3.4.2.2 HBTFig. 3.27a shows the simplified cross-section of a SiGe HBT. When using ahetero-contact base-emitter junction it is possible to reduce the base resistanceR bb ′ by increasing the base doping without sacrificing the current gain. ReducingR bb ′ greatly improves the maximum oscillation frequency f max .The breakdown phenomena of a HBT are similar to a homo-junction bipolartransistor:• Avalanche breakdown in the common-base configuration: The commonbaseconfiguration corresponds to the off-state of a switching device in aCMCD PA. The collector-emitter voltage drops across the collector-basejunction. The common-base avalanche breakdown voltage BV ce,CB is thatof the base-collector pn-junction.• Avalanche breakdown in the common-emitter configuration. The avalanchebreakdown voltage BV ce,CE <strong>for</strong> the common-emitter configuration is considerablylower than BV ce,CB [39]:BV ce,CE = BV ce,CB β −1/n0 , 3 < n < 6The common-emitter configuration is not encountered by a switching devicein a CMCD PA theoretically. However, it may be entered practicallyat turn-on and turn-off <strong>for</strong> a short time.• Punch-through of the collector-base depletion region towards the emittercontactand towards the subcollector (see Fig. 3.27a). However, this kindof punch-through may be tolerated since it does not mean a loss of currentcontrol.• Generally, HBTs suffer from thermal runaway, i. e. the current increasesif the temperature increases which may <strong>for</strong>m a positive feedback loop. ForHBT switching devices in a CMCD PA, thermal runaway is not expected
50 CHAPTER 3. DEVICE EVALUATION BY ANALYSISto be a problem as the HBT switching devices do not enter the <strong>for</strong>wardactiveregion theoretically.(3.27), (3.28), and (3.29) may be employed to calculate the sketched breakdownvoltages <strong>for</strong> HBT devices. Tab. 3.3 compares the breakdown voltages of a SiBJT, GaAs HBT, SiGe HBT, Si MOSFET, and Si LDMOS FET. From this data,we conclude that the LDMOS FET exhibits a breakdown voltage about 2 timeshigher than <strong>for</strong> BJTs/HBTs and about 10 times higher than <strong>for</strong> a conventionalMOSFET. The data is in fairly good agreement with the data given in section3.4.1 <strong>for</strong> selected commercial devices. Especially the LDMOS FET breakdownvoltages agree very well, whereas the breakdown voltages <strong>for</strong> the BJTs/HBTsappear rather high in Tab. 3.3.3.4.2.3 pHEMTThe HEMT is in fact a MESFET (metal-semiconductor or Schottky junctionFET) that employs an additional hetero-junction in its channel area. The simplifiedcross-section of an AlGaAs/InGaAs pHEMT is shown in Fig. 3.27b. Thehetero-junction allows to separate the donors from the electron-channel, whichincreases the electron-mobility in the channel and in turn reduces the channelresistance. As <strong>for</strong> the HBT, this greatly improves the maximum transition frequencyf T . The energy band diagram shows that the energy band-gap differenceconfines the electrons to a narrow channel, referred to as the two-dimensionalelectron gas (2DEG). The sheet charge n s of the 2DEG is controlled by the gatevoltage according to n s = C i (V gs − V th ) with C i =Besides the well-known AlGaAs/GaAs HEMT, there is the AlGaAs/InGaAspHEMT and the AlInAs/GaInAs HEMT (referred to as the InP HEMT). TheAlGaAs/InGaAs HEMT is referred to as pHEMT - p <strong>for</strong> pseudomorphic - asthe InGaAs channel-layer avoids lattice dislocations and thus allows a pseudomorphictransition to the AlGaAs barrier material. As the maximum realizablefraction of Al in GaAs or InAs is limited, a further increase in the energy bandgapdifference is possible by using a lower band-gap material <strong>for</strong> the channellayer. The energy band-gap difference is increased from 0.22eV <strong>for</strong> the conventionalAlGaAs/GaAs HEMT to 0.42eV <strong>for</strong> the pHEMT and to 0.51eV <strong>for</strong> theInP HEMT. Moreover, the InP HEMT shows a mobility that is twice as highas <strong>for</strong> the pHEMT [41] and there<strong>for</strong>e features excellent high-frequency per<strong>for</strong>mance.However, the Schottky barrier height of the InP HEMT is only 0.45eV- less than half of the Schottky barrier height of the pHEMT which is 1 eV.This greatly degrades the already-low breakdown voltage of the InP HEMT.pHEMTs feature breakdown voltages of typically 10-15V. The data presentedin [42] clearly shows the superiority of the pHEMT over the InP HEMT whenit comes to the breakdown voltage. For these reasons, pHEMTs are preferredto InP HEMTs <strong>for</strong> power amplifiers in the low-GHz range.To achieve a high output power, the pHEMT of Fig. 3.27b employs a doublehetero-junctionstructure. The InGaAs layer is bordered by a sheet charge Sidoping layer (δ-Si) from above and from below which increases the channel sheetεsd 2DEG[34].
3.4. COMPARISON OF MOSFET-, HBT-, AND HEMT-PARAMETERS 51Table 3.3: Breakdown voltages calculated using (3.27), (3.28), and (3.29) <strong>for</strong> aSi BJT, GaAs HBT, SiGe HBT, Si MOSFET, and Si LDMOS FET. The dopingprofile and dimensions were taken from [40] <strong>for</strong> the BJT/HBTs, and from [38]<strong>for</strong> the MOSFET/LDMOS FET (however, N Ab = 10 −17 cm −3 is assumed). Thecritical field values are from [34].
52 CHAPTER 3. DEVICE EVALUATION BY ANALYSIS(a)(b)Figure 3.27: Simplified cross-sections of a SiGe HBT (a, according to [44]) andan AlGaAs/InGaAs pHEMT (b, according to [45]).charge n s . A higher n s leads to an increased channel current density and in turnto an increased output power density.The breakdown phenomena <strong>for</strong> HEMT devices are a combination of twoeffects [42]:• Electron tunneling from the gate (also referred to as thermionic-field emission):High-energy electrons may jump over the Schottky barrier andbeing injected the barrier layer. For the pHEMT, the off-state breakdownis dominated by this effect. Besides constituting a leakage current,the injected electrons may trigger multiplicative impact ionization in thehigh-field region of the channel towards the drain.• Impact ionization in the channel: For the pHEMT, this is the dominanteffect in the on-state. High-energy channel-electrons may cause multiplicativeimpact ionization in the channel-region towards the drain.For the pHEMT, it is not possible to easily estimate the off-state breakdownvoltage as <strong>for</strong> the MOSFET/LDMOS FET or HBT. Even fairly simple breakdownvoltage models are very cumbersome <strong>for</strong> hand-calculations [43].3.4.3 Switching Per<strong>for</strong>manceIn order to maximize the PAE of a CMCD PA, the power dissipation in theswitching devices must be minimized. The spectrum-limited non-ideal wave<strong>for</strong>msof Fig. 3.14 (on page 29) allow to identify four different regions <strong>for</strong> thepower dissipation in the switching devices:• Turn-on crossbar dissipation at switch turn-on due to the overlap of V dsand I ds .
3.4. COMPARISON OF MOSFET-, HBT-, AND HEMT-PARAMETERS 53Figure 3.28: Switching transients <strong>for</strong> a general switching device.• On-resistance power dissipation during the positive half cycle due to anon-zero V dsmin .• Turn-off crossbar dissipation at switch turn-off due to the overlap of V dsand I ds .• Off-resistance power dissipation during the negative half cycle due to offstateleakage current. This type of power dissipation is generally negligible.Low turn-on and -off crossbar power dissipation asks <strong>for</strong> fast switching devices:the rise and fall times must be as small as possible. Fig. 3.28 defines three timedelays <strong>for</strong> a general switching device: the rise time t r , the fall time t f , and thestorage delay t sd at turn-off. The following three sections compare these threetime delays <strong>for</strong> the MOSFET, HBT, and pHEMT.3.4.3.1 MOSFET/LDMOS FETTo estimate the rise time and fall time <strong>for</strong> a MOSFET/LDMOS FET we assumethat they are dominated by the input RC-delay [36].Rise time Recalling the MOSFET equivalent circuit of a CMCD PA of Fig.3.12 (page 27), the input impedance may be approximated as the series combinationof R g with the parallel combination of C gs and C gd as given by (3.15)(page 28). The current flowing into the gate resistor may then be written asV in−V gsR g= (C gs + C gd ) ∂Vgs∂t. When assuming a unit step of V in,pk <strong>for</strong> the inputvoltage V in , this equation may be trans<strong>for</strong>med into the Laplace-domain, solved
54 CHAPTER 3. DEVICE EVALUATION BY ANALYSIS<strong>for</strong> L {V gs (t)}, and trans<strong>for</strong>med back into the time-domain to get V gs (t) =(V in,pk 1 − e − t )Rg(Cgs+C gd). Solving V gs (t) <strong>for</strong> t then yields <strong>for</strong> the rise time(t r = −R g (C gs + C gd ) ln 1 − V )gs,0.9I ds,pkV in,pkIt remains to determine V gs,0.9Ids,pk , the gate-source voltage corresponding to adrain-source current of 0.9I ds,pk . Assuming that the MOSFET operates in thetriode region, the corresponding gate-source voltage V gs,0.9Ids,pk may be determinedfrom 0.9I ds,pk = µ n C ox L Vgs,0.9Ids,pk − V th Vdsmin − 1 2 V dsmin] 2 with[( )WV dsmin given by (3.22) (on page 32). The capacitances may be approximated asC gs = C gd = 1 2 F W LC ox + F W C ov .Storage delayzero.For MOSFET/LDMOS FET devices, the storage delay t sd isFall timeThe fall time is derived in a similar way as the rise time as( )Vgs,0.1Ids,pkt f = −R g (C gs + C gd ) lnV in,pk3.4.3.2 HBTAs opposed to the MOSFET/LDMOS FET, minority charge carriers are involvedin the current transport <strong>for</strong> a BJT/HBT. According to [46, 47] theswitching transients of a BJT/HBT are dominated by storage processes of theseminority charge carriers in the base.Rise time The rise time <strong>for</strong> a NPN BJT/HBT may be derived from thecontinuity equation I b (t) = Q b(t)τ n+ ∂Q b(t)∂t[47]. I b (t) is the base current, Q b (t)the stored charge in the base, and τ n the minority charge carrier lifetime inthe base. When assuming a unit step of I b,pk <strong>for</strong> the input current I b (t), thisequation may be trans<strong>for</strong>med into the Laplace-domain, solved <strong>for</strong> ( L {Q b (t)}, )and trans<strong>for</strong>med back into the time-domain to get Q b (t) = I b,pk τ n 1 − e − tτn .With an increasing Q b (t), the collector current increases with I c (t) = Q b(t)τ t,where τ t is the transit time [47]. Substituting Q b (t) and solving <strong>for</strong> t then yields<strong>for</strong> the rise time(t r = −τ n ln 1 − I )c,pkβI b,pkI c,pk corresponds to I ds,pk in Fig. 3.28 and β = τnτ t. When driving theBJT/HBT with a voltage source as in the CMCD PA circuit of Fig. 3.7 (on page20), a difficulty is to estimate I b,pk . Using the Ebers-Moll equations with V be ≈
3.4. COMPARISON OF MOSFET-, HBT-, AND HEMT-PARAMETERS 55V bc (remember the zero-voltage-switching of a CMCD PA) gives an estimate <strong>for</strong>I b,pk asI b,pk =( )V be,pkVe T − 1 [I es (1 − α F ) + I cs (1 − α R )]In addition to the above rise time t r , we must also consider the time <strong>for</strong> chargingthe base-emitter capacitor to the turn-on voltage V bi . An approximation <strong>for</strong>this time may be derived analogously to the rise time <strong>for</strong> the MOSFET/LDMOSFET to t ′ r = R bb ′C b′ e ′ ln (1 − V biV be,pk). However, t r ≫ t ′ r is assumed and t ′ r neglected.Storage delay If the BJT/HBT is driven into its saturation region, there isa storage delay t sd as indicated in Fig. 3.28. Be<strong>for</strong>e switching I b (t) from I b,pkto zero, the stored charge in the base is Q b (0) = I b,pk τ n . After switching, thestored charge decays from this value with Q b (t) = I b,pk τ n e − tτn [47]. However,the collector current I c (t) remains at its value of I c,pk until the stored chargehas fallen to its minimum value <strong>for</strong> saturation Q b (t sd ) = I c,sat τ t [47]. Solving<strong>for</strong> t sd yields( )βIb,pkt sd = τ n lnI c,satWe use the Ebers-Moll equations <strong>for</strong> I c with V be = V be,pk and V bc = 0 toestimate I c,sat to)V be,pkVI c,sat = α F I es(e T − 1As evident from the derived equations, to minimize the rise time and thestorage delay <strong>for</strong> BJT/HBT devices the minority charge carrier lifetime τ n mustbe as small as possible. However, to maintain the β of the device, the basewidth must be decreased accordingly.Fall time After the storage delay t sd the collector current decays with I c (t) =I c,sat e − tτn [47]. Requiring that I c (t f ) = 0.1I c,pk and solving <strong>for</strong> t f yields( )0.1Ic,pkt f = −τ n lnI c,sat3.4.3.3 HEMT/pHEMTThe rise and fall times <strong>for</strong> a HEMT/pHEMT may be estimated in the same wayas <strong>for</strong> a MOSFET/LDMOS FET.
56 CHAPTER 3. DEVICE EVALUATION BY ANALYSISRise time(t r = −R g (C gs + C gd ) ln 1 − V )gs,0.9I ds,pkV in,pkV gs,0.9Ids,pkmay be determined by solving0.9I ds,pk = µ n C iWL[(Vgs,0.9Ids,pk )− V th Vdsmin − 1 ]2 V dsmin2V dsmin is derived from (3.22) (on page 32) by substituting C ox with C i =The capacitances may be approximated as C gs = C gd = 1 2 W LC i.εsd 2DEG.Storage delay As <strong>for</strong> the MOSFET/LDMOS FET there is no storage delay<strong>for</strong> the HEMT/pHEMT.Fall timeThe fall time is derived analogously to the rise time as( )Vgs,0.1Ids,pkt f = −R g (C gs + C gd ) lnV in,pk3.4.3.4 Numerical Examples and ComparisonTab. 3.4 shows numerical examples of the rise, storage, and fall times <strong>for</strong> theEricsson PTF10135 LDMOS FET and the Infineon BFP690 SiGe HBT. Althoughthe numbers base on the first order approximations derived be<strong>for</strong>e andalthough somewhat arbitrary assumptions were made, they may give valuableindications. The most striking difference between the LDMOS FET and theHBT is the storage delay present <strong>for</strong> the HBT. Moreover, the fall time of theHBT seems to be somewhat larger than that of the LDMOS FET while the risetimes of the two devices appear to be of the same order. From the data givenin Tab. 3.4, FETs like the LDMOS FET and the HEMT/pHEMT are likely toper<strong>for</strong>m better than BJTs when it comes to switching off as the <strong>for</strong>mer do notsuffer from minority charge carrier transport delays and recombination effects.Moreover, FETs show a larger transconductance at turn-on than BJTs. Fora short time after turn-on, the FETs still operate in their saturation regionand the BJTs in their <strong>for</strong>ward-active region - this is true even if V dsmin = 0as V ds > V gs − V th in the FET case and V be < V bi in the BJT case if thegate/base voltage is close to 0. At this time, the transconductance of the FETs2I dsV gs−V this g m =the I ds and I c and equating I ds = I c results in:and the transconductance of the BJTs g m = IcV T. Solving <strong>for</strong>g m,BJTg m,F ET= V gs − V th2V TIt follows that g m,F ET > g m,BJT as long as V gs − V th < 2V T ≈ 52mV.
3.4. COMPARISON OF MOSFET-, HBT-, AND HEMT-PARAMETERS 57Table 3.4: Numerical examples of the rise, storage, and fall times <strong>for</strong> the EricssonPTF10135 LDMOS FET and the Infineon BFP690 SiGe HBT. The parameters<strong>for</strong> the LDMOS FET have been taken from the SPICE LEVEL 3 model in [2]and those <strong>for</strong> the HBT from the Gummel-Poon model given in the data sheetof the BFP690 HBT.PTF10135 LDMOS FETBFP690 HBTRise time t r 5 ps 10 psStorage delay t sd 0 4 nsFall time t f 11 ps 2 nsI ds,pk = I c,pk 100 mA 100 mAParameters V in,pk = 10 V I b,pk = I b,mr = 20 mAV dd = 20 V, R = 152 Ω3.4.4 On-ResistanceThe on-resistance of a switching device must be as low as possible to minimizethe power dissipation in the switches during the positive half cycle. Theon-resistance <strong>for</strong> MOSFET/LDMOS FET and HEMT/pHEMT devices can1be determined from their deep triode I ds -equations to R on,F ET =g m,F ET,sat.g m,F ET,sat is the FET transconductance in the saturation region. The onresistance<strong>for</strong> BJT/HBT devices can be derived from the Ebers-Moll equations:( ) ()I c = α F I es e V beV T − 1 − I cs e V be −VceV T − 1Using the approximation e − VceV T≈ 1 − VceV TyieldsR on,BJT =( ∂Ic∂V ce) −1=V TI cs e V beV TInterpreting the denominator as I c results in R on,BJT = VT1I c=g m,BJT,act.Hence, the on-resistance in the saturation region is the inverse of the transconductancein the <strong>for</strong>ward-active region g m,BJT,act .As the transconductance in the <strong>for</strong>ward-active region <strong>for</strong> a BJT is normallylarger than the transconductance in the saturation region <strong>for</strong> a MOS-FET/LDMOS FET, the on-resistance of a BJT can be expected to be lowerthan the on-resistance of a MOSFET/LDMOS FET.3.4.5 Discussion and Conclusions from Comparison3.4.5.1 Discussion of Striking PropertiesTab. 3.2 and Tab. 3.3 indicate that LDMOS FETs remain unrivaled in their highbreakdown voltages. As increasing the supply voltage V dd greatly increases the
58 CHAPTER 3. DEVICE EVALUATION BY ANALYSISTable 3.5: Striking properties of the LDMOS FET, HBT, and pHEMT as discussedin this section and in section 3.4.1.<strong>Device</strong> BV t sd g m at turn-on R on f max I ds,mrLDMOS FET very high none high high low highHBT very low possible low low high lowpHEMT low none high low high highPAE, a high breakdown voltage is very desirable if the requirement BV ds,off >πV dd is a restriction. LDMOS FETs may achieve breakdown voltages up to65 V. pHEMT devices and HBT devices have a significantly lower breakdownvoltage. However, pHEMTs still have an edge over HBTs as they do away withthe common-emitter breakdown and the thermal runaway - two effects onlyHBTs suffer from.While the rise times of MOSFETs, HBTs, and pHEMTs are expected to becomparable, HBTs potentially have considerably larger turn-off times. Theysuffer from minority charge carrier transport effects in their base causing astorage delay at turn-off - a delay not present <strong>for</strong> MOSFETs and pHEMTs.Moreover, the transconductance at turn-on is larger by definition <strong>for</strong> MOSFETsand pHEMTs than <strong>for</strong> HBTs.When it comes to the on-resistance, the HBT devices are expected to show alower on-resistance than MOSFET/LDMOS FET devices. This advantage mayvanish when competing with pHEMTs as they show a considerably higher g mthan MOSFETs/LDMOS FETs. A white paper by Agilent Technologies [48]e.g. says that their E-pHEMTs exhibit a lower on-resistance than HBTs. Thesensitivity analysis of section 3.3.4 shows, that it pays more to increase V dd thanto decrease R s in order to maximize the PAE. There<strong>for</strong>e, LDMOS FETs maystill per<strong>for</strong>m better than HBTs as the larger breakdown voltage may offset thegains in the PAE from a lower on-resistance <strong>for</strong> HBTs. Tab. 3.5 shows the moststriking properties of each device as discussed above and in section 3.4.1.3.4.5.2 Conclusions <strong>for</strong> <strong>Device</strong> SelectionThe following shows that the breakdown voltage in conjunction with R s imposesa fundamental upper limit <strong>for</strong> the drain-efficiency η and thus <strong>for</strong> the P AE of aCMCD PA. The maximum achievable η may be derived from (3.23) (on page32) by assuming ˆV in to be infinite. V dsmin in (3.23) then becomes zero and themaximum achievable η becomesη max = 81 41, r s = R s27 + 118r s R(3.30)Substituting R with (3.11) (on page 25) results in the following intuitiveexpression <strong>for</strong> r s :
3.4. COMPARISON OF MOSFET-, HBT-, AND HEMT-PARAMETERS 59r s = 9 R s P out,132 Vdd2However, substituting R with the value given by solving (3.19) (on page 31)<strong>for</strong> R, results in an even lower maximum achievable η. Using this bulkier expression<strong>for</strong> R, the maximum achievable drain-efficiencies as a function of P out,1<strong>for</strong> three sample devices (with different breakdown voltages) taken from Tab.3.2 (on page 46) were plotted in Fig. 3.29. Note that if P out,1 is increased, themaximum achievable drain-efficiencies deteriorate very fast from the maximumvalue of 0.75 <strong>for</strong> the low-supply-voltage devices.An expression <strong>for</strong> the minimum required supply voltage V dd,min to achievea certain η max may be derived from (3.30) and (3.19) by setting V dsmin = 0again:√177Pout,1 R sV dd,min =8 √ η max (3 − 4η max )Fig. 3.30 plots the above V dd,min as a function of P out,1 <strong>for</strong> η max = 0.70and R s = 1 Ω. This plot shows that CMCD PAs greatly favor devices with highsupply voltages and thus with high breakdown voltages. Tab. 3.6 lists selected(P out,1 , V dd,min )-pairs from this plot. From the data presented in this sectionand from the discussion on striking properties of the LDMOS FET, HBT, andpHEMT we may conclude:• A low breakdown voltage severely limits the P AE <strong>for</strong>CMCD PAs.• For a CMCD PA at a moderate frequency with a targetoutput power of above 1 W, only LDMOS FETs are an optionbecause of their very high breakdown voltage. However,their per<strong>for</strong>mance may degrade if the frequency is high. Atarget output power of 20 W is the upper limit <strong>for</strong> the LD-MOS FETs of Tab. 3.2. There<strong>for</strong>e, <strong>for</strong> base station CMCDPAs requiring a target output power of 10-20 W, only LD-MOS FETs are an option.• For a CMCD PA at a very high frequency with a target outputpower of below 1 W, pHEMTs may per<strong>for</strong>m better thanLDMOS FETs if the advantage of a very high breakdownvoltage <strong>for</strong> the LDMOS FET is offset by the higher f T <strong>for</strong>the pHEMT.
60 CHAPTER 3. DEVICE EVALUATION BY ANALYSIS0.750.70.65Max. eta0.60.550.50.450.40 2 4 6 8 10Pout [W]Vdd=BV/Pi=20.69 (M<strong>RF</strong>281SR1)Vdd=BV/Pi=3.82 (LP3000P100)Vdd=BV/Pi=2.23 (ATF–511P8)Figure 3.29: Maximum achievable drain-efficiencies η max as a function of P out,1<strong>for</strong> three sample devices (with different breakdown voltages) taken from Tab.3.2. R s is assumed to be 1 Ω <strong>for</strong> all three devices.141210Vdd [V]864202 4 6 8 10Pout [W]Figure 3.30: Minimum required supply voltage V dd,min as a function of P out,1(η max = 0.70 and R s = 1 Ω).
3.4. COMPARISON OF MOSFET-, HBT-, AND HEMT-PARAMETERS 61P out,1 V dd,min1 W 4.4 V3 W 7.7 V10 W 14.1 V20 W 19.9 VTable 3.6: Minimum required supply voltage V dd,min <strong>for</strong> selected values of P out,1(η max = 0.70 and R s = 1 Ω).
Chapter 4<strong>Device</strong> <strong>Evaluation</strong> bySimulation4.1 Simulation CircuitTo assess the per<strong>for</strong>mance of commercially available devices in a CMCD PA,harmonic-balance simulations at 900 MHz, 1.8 GHz, and 5.8 GHz <strong>for</strong> an idealswitch model, <strong>for</strong> three packaged devices, and <strong>for</strong> two non-packaged devices wereper<strong>for</strong>med. The packaged devices include the Motorola M<strong>RF</strong>281SR1 LDMOSFET, the Filtronic LP3000P100 pHEMT, and the Infineon BFP690 SiGe HBTof Tab. 3.2 (on page 46). The non-packaged devices include a pHEMT inTriquint’s TQPHT process and a InGaP HBT in Triquint’s TQHBT2 process.Fig. 4.1 and Fig. 4.2 depict the ADS schematics used <strong>for</strong> all harmonicbalancesimulations (here depicted <strong>for</strong> the M<strong>RF</strong>281SR1 LDMOS FET). Notethat the devices are driven by an ideal voltage source in order to eliminate theimpact of the input matching circuitry that would have to be used if the deviceswere driven by a non-ideal voltage source. The tank capacitor and inductor,the DC feed inductors as well as the input and output balun trans<strong>for</strong>mers arefurther assumed to be ideal (or almost ideal <strong>for</strong> the DC feed inductors).Choosing the tank capacitor and inductor The tank capacitor and inductorare determined by the equations given in section 3.2.2.3. Q loaded is determinedby the assumed realizable range of the tank capacitor (C = 1pF . . . 10nF),by the assumed realizable range of the tank inductor (L = 0.5nH . . . 100nH), andby the assumed maximum current rating of the tank inductor (I L,mr = 5 A).Note that I L,mr = 5 A is a rather large value <strong>for</strong> commercially available packagedchip-inductors. The actually employed tank capacitor is C − C ds,comp .C ds,comp is the transistor drain-source capacitance that contributes to the tankcapacitance. C ds,comp is a tuning value.62
4.1. SIMULATION CIRCUIT 63Stabilizing the PA with R b Instability may result from drain-to-gate couplingthrough the drain-gate capacitor C gd . With drain-to-gate coupling, theinput resistance of the PA may become negative. To prevent this instability,a ballast resistor R b is added at the PA input as depicted in Fig. 4.2. Thevalue of the ballast resistor R b was determined <strong>for</strong> each CMCD PA to lift theinput resistance to at least R in = 100mΩ over the interesting range of the inputvoltage amplitudes.Optimization Guidelines Whenever the device or the frequency is changedthe following variables may be optimized to yield the maximum PAE:• V g,bias , the gate bias voltage• R tank , the total tank resistance (previously denoted as R)• C ds,comp , the transistor drain-source capacitance that contributes to thetank capacitance• ˆV in , the input voltage amplitudeFor all simulations, the following procedure was followed:1. Set the supply voltage to V dd = BV ds,offπ.2. Determine initial values <strong>for</strong> V g,bias , R tank , and C ds,comp(a) Set V g,bias to the V gs in the transistor transfer characteristic thatyields a drain-source current of I ds ≈ 1 mA <strong>for</strong> V ds = 0.05BV ds,off .(b) Set R tank to R tank,nom given in Fig. 4.1.(c) Set C ds,comp to the output capacitance of the transistor <strong>for</strong> V d,bias =2V dd and V g,bias ≪ V th determined by an AC simulation. Note thatthe output capacitance of the transistor is heavily dependent on thedrain and gate voltages.3. Sweep V g,bias , R tank , C ds,comp , and ˆV in over reasonable ranges includingthe be<strong>for</strong>e established values thereby optimizing the P AE. Set V g,bias ,R tank , C ds,comp , and ˆV in to values that yield a P AE deviating by nomore than 1 % from the maximum P AE. This allows to trade 1 % ofthe P AE <strong>for</strong> a possibly substantial increase in the output power P out,1or the gain G as suggested in section 3.3.4.2. Note that the optimumˆV in changes substantially when sweeping V g,bias . There<strong>for</strong>e sweeping ˆV inwith V g,bias as parameter better allows to select the optimum V g,bias . Fig.4.3, Fig. 4.4, and Fig. 4.5 show sweeps of V g,bias , R tank , and C ds,comp aswell as corresponding sweeps of ˆV in with V g,bias , R tank , and C ds,comp asparameter <strong>for</strong> M<strong>RF</strong>281SR LDMOS FETs at 900 MHz to illustrate this.Note that a V g,bias (in this case of 5 V) slightly higher than V th (in thiscase determined to be 3.75 V) results not only in a higher PAE but alsoin a higher output power. This behavior is generally encountered <strong>for</strong> alldevices simulated.
64 CHAPTER 4. DEVICE EVALUATION BY SIMULATIONFigure 4.1: ADS schematic <strong>for</strong> the harmonic-balance simulations. See Fig. 4.2<strong>for</strong> the CMCD_PA_LDMOS_M<strong>RF</strong>281SR1 block.4. If the input resistance becomes negative in the interesting range of inputvoltage amplitudes ˆV in , lower the ballast resistor R b to lift the input resistanceto at least R in = 100 mΩ. Adjusting R b often means a change inthe optimum V g,bias , R tank , C ds,comp , and ˆV in values, which necessitatesgoing back to point 3.4.2 Switch SimulationsInitially, simulations using switches instead of transistors were per<strong>for</strong>med. Theon-resistance of the switches was set to R on = 1 Ω and the off-resistance toR off = 1 TΩ. The switches feature a continuous transition from their on-stateto their off-state over a input voltage range of V tran = 0.05 V. Fig. 4.6 shows
4.2. SWITCH SIMULATIONS 65Figure 4.2: ADS schematic <strong>for</strong> the CMCD_PA_LDMOS_M<strong>RF</strong>281SR1 blockof Fig. 4.1.
66 CHAPTER 4. DEVICE EVALUATION BY SIMULATION(a)(b)Figure 4.3: Sweep of ˆVin with V g,bias as parameter (a) and sweep of V g,bias(b) <strong>for</strong> M<strong>RF</strong>281SR LDMOS FETs at 900 MHz. The numbers in (a) refer toV g,bias [V]. Note that all sweeps were made at the otherwise optimum values ofV g,bias , R tank , C ds,comp , and ˆV in .
4.2. SWITCH SIMULATIONS 67(a)(b)Figure 4.4: Sweep of ˆV in with R tank as parameter (a) and sweep of R tank (b) <strong>for</strong>M<strong>RF</strong>281SR LDMOS FETs at 900 MHz. The numbers in (a) refer to R tank [Ω].Note that all sweeps were made at the otherwise optimum values of V g,bias ,R tank , C ds,comp , and ˆV in .
68 CHAPTER 4. DEVICE EVALUATION BY SIMULATION(a)(b)Figure 4.5: Sweep of ˆV in with C ds,comp as parameter (a) and sweep of C ds,comp(b) <strong>for</strong> M<strong>RF</strong>281SR LDMOS FETs at 900 MHz. The numbers in (a) refer toC ds,comp [F]. Note that all sweeps were made at the otherwise optimum valuesof V g,bias , R tank , C ds,comp , and ˆV in .
4.3. PACKAGED DEVICE SIMULATIONS 69the results of HB simulations <strong>for</strong> this set-up. Reducing the on-resistance fromR on = 1 Ω to R on = 100 mΩ raises the maximum PAE from P AE = 97.6% toP AE = 99.7%. Reducing R on below 100 mΩ and V tran below 0.05 V preventsHB simulations from converging. Q loaded only starts degrading the efficiencysignificantly if it drops below 2. For Q loaded = 2 (and R on = 1 Ω), the efficiencyis still 96.8 %.Note that the voltage wave<strong>for</strong>m at marker m2 exhibits spikes at turn-on and-off which are not present in the voltage wave<strong>for</strong>m at marker m1. These spikesresult from the lower slope of the input voltage at turn-on and -off <strong>for</strong> lowerinput voltage amplitudes as V tran is held constant at 0.05 V. A lower slope ofthe input voltage amplitude at turn-on and -off means that at these times thecurrent 2I dc is imposed on a high-resistance switch, which causes the observedvoltage spikes. This behavior will also be observed more or less pronounced insimulations with packaged transistors.4.3 Packaged <strong>Device</strong> SimulationsThe circuit of Fig. 4.2 was simulated employing• Motorola M<strong>RF</strong>281SR1 LDMOS FETs,• Filtronic LP3000P100 pHEMTs, and• Infineon BFP690 SiGe HBTsat 900 MHz, 1.8 GHz, and 5.8 GHz. Refer to Tab. 3.2 (on page 46) <strong>for</strong> theproperties of these packaged devices. Each circuit was optimized accordingto the procedure outlined in section 4.1. The results of this optimization arepresented in Tab. 4.1.Motorola M<strong>RF</strong>281SR1 LDMOS FET Fig. 4.7 and Fig. 4.8 show theresults of the HB simulations <strong>for</strong> this device at 900 MHz and 1.8 GHz, respectively.The output power of the M<strong>RF</strong>281SR1 is the highest one attained byany of the packaged devices investigated. At the same time, the PAE at 900MHz and at 1.8 GHz is high. However, at 5.8 GHz, the P AE drops to zero andthe M<strong>RF</strong>281SR1 becomes useless. Note that very similar results were achievedfrom simulations with the Ericsson PTF10135 SPICE LEVEL 3 model (at 900MHz: P AE = 74.1 %, P out,1 = 10.6 W, G = 11.2 dB; at 1.8 GHz: P AE = 69.3%, P out,1 = 17.6 W, G = 11.3 dB; useless at 5.8 GHz).Filtronic LP3000P100 pHEMT Fig. 4.9 and Fig. 4.10 show the resultsof the HB simulations <strong>for</strong> this device at 900 MHz and 5.8 GHz, respectively.While the PAE of the LP3000P100 is significantly lower than the PAE of theM<strong>RF</strong>281SR1 at 900 MHz and 1.8 GHz, the LP3000P100 still attains a PAEof 34.1 % at 5.8 GHz. However, the general per<strong>for</strong>mance measured as theattainable PAE and attainable output power is disappointing. Three reasonsare identified <strong>for</strong> this in the following:
70 CHAPTER 4. DEVICE EVALUATION BY SIMULATIONFigure 4.6: Results of HB simulations <strong>for</strong> switches with an on-resistance of 1 Ωat 900 MHz (see Fig. 4.2 <strong>for</strong> circuit).
4.4. NON-PACKAGED DEVICE SIMULATIONS 71• Low breakdown voltage: Recall from Fig. 3.29 (on page 60) that themaximum achievable drain-efficiency degrades very quickly as a functionof the output power <strong>for</strong> the LP3000P100. E.g. <strong>for</strong> P out,1 = 1.3 W, η max =65.6 % if R s is assumed to be 1 Ω, which severely limits the PAE. TheDC output characteristic of the LP3000P100 in Fig. 4.11 shows that theassumption of R s = 1 Ω is a reasonable assumption <strong>for</strong> the LP3000P100.• Drain-induced barrier lowering (DIBL): Note from the instantaneous powerdissipation wave<strong>for</strong>m V d I d of Fig. 4.9 (green curve) that there is a substantialamount of DC power dissipation during cut-off. This may be explainedwhen looking at the DC output characteristic of the LP3000P100 in Fig.4.11. If the gate-source voltage is only slightly below the threshold voltagethe device may start conducting again <strong>for</strong> high drain-source voltages. Thisbehavior is called drain-induced barrier lowering (DIBL) and is responsible<strong>for</strong> the DC power dissipation during cut-off in the CMCD PA.• High on-resistance <strong>for</strong> V gs ≈ V th at very low V ds : Comparing the DCoutput characteristic of the LP3000P100 in Fig. 4.11 with the DC outputcharacteristic of the M<strong>RF</strong>281SR1 in Fig. 4.12 <strong>for</strong> a very low V ds (lowerplots), we note that the on-resistance of the LP3000P100 is potentiallysubstantially higher than the on-resistance of the M<strong>RF</strong>281SR1 <strong>for</strong> a verylow V ds . There<strong>for</strong>e, as shown by the instantaneous power dissipation wave<strong>for</strong>mV d I d of Fig. 4.9 (green curve), a substantial amount of DC power isdissipated at turn-on and -off.Infineon BFP690 SiGe HBT Fig. 4.13 shows the results of the HB simulations<strong>for</strong> this device at 1.8 GHz. HB simulations at 900 MHz were impossible asthe HB engine of ADS was reporting an overflow in the KCL check <strong>for</strong> reasonablehigh values of ˆV in . The discontinuity in the efficiency-plot of Fig. 4.13 rendersthe attained results very questionable. The HB engine of ADS appears to haveserious difficulties in simulating a CMCD PA with a Gummel-Poon model.4.4 Non-Packaged <strong>Device</strong> SimulationsThe circuit of Fig. 4.2 was simulated employing• pHEMTs of Triquint’s TQPHT process, and• InGaP HBTs of Triquint’s TQHBT2 processat 900 MHz, 1.8 GHz, and 5.8 GHz. Refer to Tab. 4.2 <strong>for</strong> an overview of somerelevant parameters of these processes. Each circuit was optimized accordingto the procedure outlined in section 4.1. The results of this optimization arepresented in Tab. 4.3.
72 CHAPTER 4. DEVICE EVALUATION BY SIMULATIONFigure 4.7: Results of HB simulations <strong>for</strong> M<strong>RF</strong>281SR LDMOS FETs at 900MHz (see Fig. 4.2 <strong>for</strong> circuit).
4.4. NON-PACKAGED DEVICE SIMULATIONS 73Figure 4.8: Results of HB simulations <strong>for</strong> M<strong>RF</strong>281SR LDMOS FETs at 1.8GHz (see Fig. 4.2 <strong>for</strong> circuit).
74 CHAPTER 4. DEVICE EVALUATION BY SIMULATIONFigure 4.9: Results of HB simulations <strong>for</strong> LP3000P100 pHEMTs at 900 MHz(see Fig. 4.2 <strong>for</strong> circuit).
4.4. NON-PACKAGED DEVICE SIMULATIONS 75Figure 4.10: Results of HB simulations <strong>for</strong> LP3000P100 pHEMTs at 5.8 GHz(see Fig. 4.2 <strong>for</strong> circuit).
76 CHAPTER 4. DEVICE EVALUATION BY SIMULATIONFigure 4.11: DC output characteristics of the LP3000P100 pHEMT <strong>for</strong> twodifferent ranges of V ds . Note that the upper limit of V ds in the lower plotcorresponds to about 0.015BV ds,off .
4.4. NON-PACKAGED DEVICE SIMULATIONS 77Figure 4.12: DC output characteristics of the M<strong>RF</strong>281SR1 LDMOS FET <strong>for</strong>two different ranges of V ds . Note that the upper limit of V ds in the lower plotcorresponds to about 0.015BV ds,off .
78 CHAPTER 4. DEVICE EVALUATION BY SIMULATIONFigure 4.13: Results of HB simulations <strong>for</strong> BFP690 SiGe HBTs at 1.8 GHz (seeFig. 4.2 <strong>for</strong> circuit).
4.4. NON-PACKAGED DEVICE SIMULATIONS 79Freq. [GHz] P AE [%] P out,1 [W] G [dB]Motorola M<strong>RF</strong>281SR1LDMOS FET, V dd = 20.69 V, Root model0.9 75.4 9.3 15.51.8 67.3 14.0 11.85.8 0Filtronic LP3000P100AlGaAs/InGaAs pHEMT, V dd = 3.82 V, Curtice3 model0.9 46.7 1.3 13.21.8 41.6 1.2 17.75.8 34.1 0.8 9.0Infineon BFP690SiGe HBT, V dd = 4.14 V, Gummel-Poon model0.9 no simulation possible1.8 71.0 1.75 16.65.8 0Table 4.1: Maximum P AE, output power P out,1 , and gain G of the investigatedpackaged devices.TQPHT pHEMT As the transistor size is variable now, a reasonable transistorsize has to be chosen. The applications of interest are 10 W of outputpower at 900 MHz and 1.8 GHz, and 3 W of output power at 5.8 GHz. (3.5)(on page 18) together with (3.6) gives I dc <strong>for</strong> these output powers. Rememberthat each device is required to sink 2I dc . The number of fingers is nowincreased until the DC output characteristic allows to sink a current of 2I dc <strong>for</strong>V ds = 0.01BV ds,off and V gs ≈ 0.8 V. V gs ≈ 0.8 V is about the Schottky diodeturn-on voltage. This procedure results in 250 fingers <strong>for</strong> a 10 W output powerdevice, and in 75 fingers <strong>for</strong> a 3 W output power device. Fig. 4.14 and Fig. 4.15show the results of the HB simulations <strong>for</strong> the 10 W-device at 900 MHz andand <strong>for</strong> the 3 W-device at 5.8 GHz, respectively. Even at 5.8 GHz, the TQPHTpHEMTs achieve a PAE of around 90 %. The reason why the TQPHT pHEMTsper<strong>for</strong>m much better than the LP3000P100 pHEMTs primarily is a 10-20 timeslower on-resistance <strong>for</strong> V gs ≈ V th at very low V ds . Note that by increasing thenumber of fingers further, the PAE increases up to 99 %. However, it remainsquestionable whether the TOM3 model scales correctly. Moreover, the TOM3model often aborts with the error message ’SYM error: attempted logarithm ofzero’.TQHBT2 InGaP HBT The current 2I dc that has to be sinked is determinedas outlined <strong>for</strong> the TQPHT pHEMT. However, it is not the DC outputcharacteristic that limits the sinkable current <strong>for</strong> the TQHBT2 HBT but themaximum allowable current density as given by the design manual. This limitationresults in a HBT-multiplicity of 19 <strong>for</strong> the 10 W output power device, and
80 CHAPTER 4. DEVICE EVALUATION BY SIMULATIONTriquint TQPHTAlGaAs/InGaAs pHEMTGate Length 0.5 µmPinch-Off Volt. conf.f T conf.BV ds,off conf.conf.I dssTriquint TQHBT2InGaP HBTEmitter Size 3 x 3 µm x 45 µmTurn-On Volt. conf.f Tconf.BV ds,offconf.conf.I ds,mrTable 4.2: Some relevant parameters of Triquint’s TQPHT and TQHBT2 processes.Freq. [GHz] P AE [%] P out,1 [W] G [dB] Transistor Size Active AreaTriquint TQPHTAlGaAs/InGaAs pHEMT, V dd = 5.41 V, TOM3 model0.9 90.8 10.3 20.2 250 x 50 µm 0.026 mm 21.8 89.9 10.0 16.5 250 x 50 µm 0.026 mm 25.8 90.7 3.0 11.9 75 x 50 µm 0.008 mm 2Triquint TQHBT2InGaP HBT, V dd = 6.68 V, Gummel-Poon model0.9 94.8 10.4 21.5 Multiplicity = 19 0.049 mm 21.8 93.2 10.8 19.3 Multiplicity = 19 0.049 mm 25.8 87.6 3.7 12.5 Multiplicity = 6 0.016 mm 2Table 4.3: Maximum P AE, output power P out,1 , and gain G of the investigatednon-packaged devices.in a HBT-multiplicity of 6 <strong>for</strong> the 3 W output power device. In the case of theTQPHT PHEMT, the maximum allowable current density is high enough notbe a restriction. Fig. 4.14 and Fig. 4.17 show the results of the HB simulations<strong>for</strong> the 10 W-device at 900 MHz and the 3 W-device at 5.8 GHz, respectively.Even at 5.8 GHz, the TQHBT2 HBTs achieve a PAE of around 90 %. Thestorage delay t sd , that was shown in section 3.4.3 to have a potentially verydetrimental impact on the efficiency of a CMCD PA, is not pronounced neither<strong>for</strong> the BFP690 HBT CMCD PA circuits investigated nor <strong>for</strong> the TQHBT2HBT CMCD PA circuits investigated as the corresponding I ds -wave<strong>for</strong>ms show.That the storage delay t sd is modeled by the Gummel-Poon model was verifiedby different HB simulations, though. As <strong>for</strong> the BFP690 HBT, the HBengine of ADS kept reporting an overflow in the KCL check, which made thesesimulations very time-consuming.
4.4. NON-PACKAGED DEVICE SIMULATIONS 81Figure 4.14: Results of HB simulations <strong>for</strong> TQPHT pHEMTs (250 fingers) at900 MHz (see Fig. 4.2 <strong>for</strong> circuit).
82 CHAPTER 4. DEVICE EVALUATION BY SIMULATIONFigure 4.15: Results of HB simulations <strong>for</strong> TQPHT pHEMTs (75 fingers) at 5.8GHz (see Fig. 4.2 <strong>for</strong> circuit).
4.4. NON-PACKAGED DEVICE SIMULATIONS 83Figure 4.16: Results of HB simulations <strong>for</strong> TQHBT2 InGaP HBTs (Multiplicity= 19) at 900 MHz (see Fig. 4.2 <strong>for</strong> circuit).
84 CHAPTER 4. DEVICE EVALUATION BY SIMULATIONFigure 4.17: Results of HB simulations <strong>for</strong> TQHBT2 InGaP HBTs (Multiplicity= 6) at 5.8 GHz (see Fig. 4.2 <strong>for</strong> circuit).
4.5. DISCUSSION AND CONCLUSIONS FROM SIMULATIONS 854.5 Discussion and Conclusions from SimulationsWhen targeting an implementation of a CMCD PA with packaged devices and anoutput power of above 1.5 W, only LDMOS FETs are an option. However, theyonly are an option below 2 GHz where the achieved PAE is around 70 % if thepassive circuitry is ideal. Above 2 GHz, the PAE of a LDMOS FET CMCD PAstarts deteriorating substantially. At 5.8 GHz, the devices are useless. Availablepackaged pHEMTs achieve an output power of only about 1.5 W. The PAE ofa CMCD PA employing available packaged pHEMTs is around 45 % below 2GHz. However, the available packaged pHEMTs are the only devices among theinvestigated ones delivering a non-zero PAE at 5.8 GHz, where the LP3000P100pHEMTs achieve a P AE of 35 %. An implementation of a CMCD PA employingLP3000P100 pHEMTs would show whether the on-resistance <strong>for</strong> V gs = V th andvery low V ds is in fact as high as predicted by the DC output characteristicor whether it is merely inadequately modeled by the Curtice 3 model. HBsimulations of CMCD PAs employing HBTs have proven awkward because ofoverflows in the KCL check. There<strong>for</strong>e, the achieved P AE of 71 % at 1.8 GHz<strong>for</strong> the BFP690 HBTs seems arguable.When targeting an integrated implementation of a CMCD PA, a high PAEand a high output power may be achieved at the same time by making thedevices very wide. Both, TQPHT pHEMTs and TQHBT2 HBTs achieve aP AE of around 90 % <strong>for</strong> 10 W of output power below 2 GHz and <strong>for</strong> 3 W ofoutput power at 5.8 GHz if the passive circuitry is ideal. However, TQHBT2HBTs occupy two times the area of TQPHT pHEMTs <strong>for</strong> the same output poweras shown in Tab. 4.3. A better area-efficiency means a better cost-efficiency<strong>for</strong> an implementation with the pHEMTs than <strong>for</strong> an implementation with theHBTs. However, it remains questionable whether a pHEMT with 250 fingersand a HBT with a multiplicity of 19 are still modeled correctly.Regardless whether a discrete or an integrated implementation of a CMCDPA is envisioned, the input impedance of the CMCD PA must be matched to thesource impedance <strong>for</strong> maximum power transfer. However, 1 Ω of input resistancemarks the lower limit <strong>for</strong> a input resistance that is still matchable to a 50 Ωsource impedance by an Ell-network (series-shunt/shunt-series combination ofan inductor and capacitor, or of two inductors, or of two capacitors). Thesimulations <strong>for</strong> the BFP690 SiGe HBT and <strong>for</strong> the TQHBT2 InGaP HBT showthat the input resistance of HBTs tends to be smaller than the input resistanceof LDMOS FETs or pHEMTs. There<strong>for</strong>e, the input matching <strong>for</strong> HBTs may beexpected to be more difficult. Moreover, the input impedance of bipolar devicesis very non-linear because of their base-emitter diode.The above discussions allows the following conclusions:
86 CHAPTER 4. DEVICE EVALUATION BY SIMULATION• For a CMCD PA implementation with packaged devices,LDMOS FETs are the best choice. A PAE of around 70 %may be achieved below 2 GHz. At 5.8 GHz, pHEMTs shouldbe chosen. However, a PAE of only around 35 % may beachieved.• For a CMCD PA implementation with integrated devices,pHEMTs provide the better area-efficiency than HBTs. Bymaking the devices very wide, a high PAE and a high outputpower may be achieved at the same time.• HB simulations <strong>for</strong> CMCD PAs employing HBTs are verytime-consuming because of a divergence in the KCL checks.Moreover, input matching is expected to be more difficult<strong>for</strong> HBTs.
Chapter 5Conclusions5.1 Recommendations <strong>for</strong> <strong>Device</strong> SelectionCombining the conclusions from the sensitivity analysis in section 3.3.4, thedevice comparison in section 3.4.5, and the simulation results in section 4.5,results in the following recommendations <strong>for</strong> device selection <strong>for</strong> the intendedapplications stated in section 1.1:• For higher power fixed applications (base-stations) with atarget output power of 10-20 W below 2 GHz– LDMOS FETs are the best choice <strong>for</strong> a discrete implementation.Their high breakdown voltage enablesthem to deliver 10-20 W of output power with a PAEof around 70 % ideally.– pHEMTs are the best choice <strong>for</strong> an integrated implementation.Wide pHEMTs are capable to deliver 10-20W of output power with a PAE of around 90 % ideally.HBTs are less area-efficient and more time-consumingto simulate but capable to deliver 10-20 W of outputpower with a PAE of around 90 % as well.87
88 CHAPTER 5. CONCLUSIONS• For lower power portable applications with a target outputpower of 3 W at 5.8 GHz– pHEMTs are the best choice <strong>for</strong> a discrete implementation.However they are only capable to deliver about1.5 W of output power with a PAE of around 35%.The investigated packaged LDMOS FETs and HBTsare useless at 5.8 GHz.– pHEMTs are the best choice <strong>for</strong> an integrated implementation.They are capable to deliver the full targetoutput power of 3 W with a PAE of around 90 %.• For an integrated solution– C ox , the number of fingers F , W , and L, must be optimized,– C ov , R g,sheet , and R s must be minimized, and– the breakdown voltage must be maximized, in order tomaximize the PAE.5.2 AchievementsThis study evaluated the Si MOSFET, the Si LDMOS FET, the SiGe HBT,and the AlGaAs/InGaAs pHEMT as switches <strong>for</strong> use in a CMCD <strong>RF</strong> switchingmodePA. The goal of this study was to determine which of the above devicesdelivers the highest efficiency at 0.8-1.0 GHz and 1.8-2.2 GHz <strong>for</strong> 10-20 W ofoutput power, and at 5.8 GHz <strong>for</strong> 3 W of output power. The recommendations<strong>for</strong> device selection have been presented in the previous section. The followingachievements eventually led to these recommendations:• A thorough literature review revealed that no study was published so farevaluating different devices <strong>for</strong> switching-mode PAs.• A detailed analysis of a CMCD PA based upon spectrum-limited wave<strong>for</strong>ms<strong>for</strong> the device voltage and current was per<strong>for</strong>med.• An analytical expression <strong>for</strong> the power added efficiency (PAE) of a CMCDPA employing FET devices was derived as a function of the mobility µ n ,oxide cap. C ox , overlap cap. C ov , gate sheet res. R g,sheet , gate contactres. R g,contact , source res. R s , number of fingers F , gate width W , gatelength L, the supply voltage V dd , the shunt-tank res. R, and the input
5.3. OUTLOOK 89voltage amplitude ˆV in . The analytical CMCD PA model was proven to beadequate by harmonic-balance simulations <strong>for</strong> a sensitivity analysis of thePAE towards the various device parameters.• To identify the differences in device parameters between the devices of interest,commercially available packaged devices were investigated followedby a theoretical analysis of the breakdown phenomena, the switching per<strong>for</strong>mance,and the on-resistance <strong>for</strong> the devices of interest. The resultsfrom these investigations are summed up in Tab. 3.5 (on page 58).• Based upon the analytical CMCD PA model an upper limit <strong>for</strong> the achievabledrain-efficiency and thus an upper limit <strong>for</strong> the achievable PAE wasderived. The derived maximum achievable drain-efficiency revealed thata low breakdown voltage fundamentally limits the maximum achievablePAE of a CMCD PA.• Harmonic-balance simulations <strong>for</strong> CMCD PAs with ideal passive circuitrywere per<strong>for</strong>med <strong>for</strong> packaged LDMOS FETs (Motorola M<strong>RF</strong>281SR1), packagedpHEMTs (Filtronic LP3000P100), and packaged SiGe HBTs (InfineonBFP690) at 900 MHz, 1.8 GHz, and 5.8 GHz following well-definedoptimization guidelines <strong>for</strong> V g,bias , R tank , C ds,comp , and ˆV in . The same wasdone <strong>for</strong> CMCD PAs employing pHEMTs and InGaP HBTs of Triquint’sTQPHT and TQHBT2 process, respectively. The simulation results aresummed up in Tab. 4.1 (<strong>for</strong> the packaged devices, on page 79) and Tab.4.3 (<strong>for</strong> the non-packaged devices, on page 80).• Combining the results from analyses and simulations made it possibleto deduct the concise recommendations <strong>for</strong> device selection given in theprevious section.5.3 OutlookThe analyses and simulations in this study have shown that selecting the switchingdevices is a major issue when designing a CMCD PA. However, choosing theright output balun trans<strong>for</strong>mer is as important as choosing the right switchingdevice as is shown in this section. Up to now, the output balun trans<strong>for</strong>mer wasassumed to be ideal and to present an open-circuit at the drain <strong>for</strong> even harmonics.However, real output balun trans<strong>for</strong>mers may present finite impedancesat the drain at even harmonics thereby degrading the PAE. A possible outputbalun structure is a microstrip rat race [20]. A less bulky output balun structureis the microstrip Marchand balun depicted in Fig. 5.1 which was designed accordingto [49] <strong>for</strong> a FR4 substrate. However, the Marchand balun presents lowimpedances at the even harmonics and high impedances at the odd harmonicsas shown in Tab. 5.1a, which is exactly the wrong harmonic termination <strong>for</strong> aCMCD PA. Introducing λ/8-trans<strong>for</strong>mers as shown in Fig. 5.1b allows to invertthe low impedance to a high impedance at the second harmonic. Tab. 5.1bshows the resulting harmonic termination after adding the λ/8-trans<strong>for</strong>mers.
90 CHAPTER 5. CONCLUSIONSFigure 5.1: Microstrip Marchand balun with preceding λ/8-trans<strong>for</strong>mers andDC block capacitors <strong>for</strong> a FR4 substrate. Refer to [49] <strong>for</strong> design equations.Note that the Marchand balun allows impedance trans<strong>for</strong>mation, whereas therat race just figures as a balun and requires an additional impedance trans<strong>for</strong>merto trans<strong>for</strong>m the 50 Ω load to the required tank resistor value [49]. Replacingthe ideal output balun trans<strong>for</strong>mer of Fig. 4.2 with the Marchand balun of Fig.5.1 and simulating the CMCD PA with the M<strong>RF</strong>281SR1 LDMOS FETs resultsin P AE = 62.0 %, P out,1 = 4.7 W, and G = 11.9 dB. The P AE drops by morethan 10 % and the output power is halved compared to the simulation with theideal output balun trans<strong>for</strong>mer.Avoiding the need <strong>for</strong> an output balun trans<strong>for</strong>mer by implementing a singleendedinverse-F PA may be a possible way to present a better harmonic termination.Simulating the inverse-F PA of Fig. 5.2 at 900 MHz with optimizedvalues <strong>for</strong> L res,1 and L res,2 results in P AE = 94.9 % and P out,1 = 9.6 W.However, substituting the 1 Ω on-resistance switch by a Motorola M<strong>RF</strong>281SR1LDMOS FET results in P AE = 41.3 %, P out,1 = 4.0 W, and G = 13.4 dB. Apossible reason <strong>for</strong> the very disappointing PAE of the inverse-F PA employing aM<strong>RF</strong>281SR1 LDMOS FET is that C ds may detune the resonators considerably.The above investigations show that a future focus <strong>for</strong> research on CMCDPAs may lie in output balun trans<strong>for</strong>mers.
5.3. OUTLOOK 91Table 5.1: Presented drain impedances of the microstrip Marchand balun ofFig. 5.1 without preceding λ/8-trans<strong>for</strong>mers and DC block capacitors (a) andwith preceding λ/8-trans<strong>for</strong>mers and DC block capacitors (b).(a)(b)Figure 5.2: ADS schematic of an inverse-F PA.
Appendix ATask Description by Prof. S.I. LongThe <strong>RF</strong> power amplifier is a very critical component in portable communicationssystems. Linear power amplifiers are needed <strong>for</strong> modulation standards such asNorth American Digital Cellular (π/4 DQPSK) and CDMA. These generallyinclude <strong>Class</strong> A or AB amplifiers which are linear or can be linearized andprovide low to moderate efficiencies. Constant envelope modulations such asFM or GMSK (GSM) can employ nonlinear amplifiers without generation ofsevere distortion. A review of tuned power amplifiers reveals that switchingmodeamplifiers are capable of providing higher efficiencies than their linearmodecounterparts. They also exhibit lower power dissipation, low active devicethermal stress, and lower sensitivity to component value variations. There<strong>for</strong>e,the use of switching-mode power amplifier circuits <strong>for</strong> low power (up to 3Wpeak) <strong>for</strong> portable applications (5.8 GHz ISM band) and higher power (10 20Wpeak at 0.8 1.0 GHz and 1.8 2.2 GHz) <strong>for</strong> fixed applications are of interest.There are many devices which are potential candidates <strong>for</strong> PA applications.Most cellular applications have utilized either Si LDMOS or GaAs HBT transistors.Switching mode amplifiers such as the current-mode <strong>Class</strong> D (Inverse F)amplifiers are very promising <strong>for</strong> high efficiency. A comparative study is neededthat will evaluate the distinctive properties of Si MOSFET, GaAs MESFET orHBT, SiGe HBT, and GaN HEMT devices as switches with particular emphasison switching mode PA applications. In particular, properties such as the relationshipbetween maximum current, drive impedance, and output capacitancewill affect power added efficiency and impedance levels required. The projectwill determine which device provides the best per<strong>for</strong>mance at frequencies of 1,2, and 5.8 GHz.92
93Project TimelineMonth 1: Review the operation principles and study device characteristicsand models <strong>for</strong> the MOSFET, SiGe HBT, and one other device of choice. Reviewprevious literature and work at UCSB on current-mode <strong>Class</strong> D/Inverse F poweramplifiers.Month 2: Determine limitations of each device <strong>for</strong> power, frequency, efficiencyand relate these limitations to device parameters. Write a report on the first 2months work that will be included in the diploma thesis.Month 3:Design (through simulation) amplifiers at 1, 2 and 5.8 GHz.Month 4: Write the complete report including amplifier designs. Draw conclusionsand make recommendations <strong>for</strong> further study.
Appendix BCDROM/ADS/cmcd_pa_prj contains all ADS schematics, data sets, and data displays/ADS/<strong>Mode</strong>ls contains the device models and design kits used/Bibliography contains nearly all referenced papers classified in correspondingcategories/Bibliography/Datasheets contains all data sheets of the investigated packageddevices/Excel/Maple/Reportcontains Microsoft Excel spreadsheets that have been incorporatedinto the reportcontains all Maple worksheets developedcontains this report as PDF file and PS file/Report/Latex contains the latex sources of this report94
Bibliography[1] S. Ohr. (2003, June) New ways to deal with portable power. [Online].Available: http://www.planetanalog.com/features/OEG20030502S0033[2] D. Choi, “High efficiency switched-mode power amplifiers <strong>for</strong> wireless communications,”Ph.D. dissertation, University of Cali<strong>for</strong>nia, Santa Barbara,Mar. 2001.[3] P. Baxandall, “Transistor sinewave oscillators,” Proc. IEE, vol. 106, PartB, Suppl. 16, pp. 748–758, May 1959.[4] N. Sokal and A. Sokal, “<strong>Class</strong> E - a new class of high-efficiency tuned singleendedswitching power amplifiers,” IEEE J. Solid-State Circuits, vol. SC-10,no. 3, pp. 168–176, June 1975.[5] D. Choi and S. Long, “Finite DC feed inductor in class E power amplifiers- a simplified approach,” in 2002 IEEE MTT-S Intl., Microwave Symp.Digest, 2002, pp. 1643–1646.[6] K. Mertens and M. Steyaert, “A 700-MHz 1-W fully differential CMOSclass-E power amplifier,” IEEE J. Solid-State Circuits, vol. 37, no. 2, pp.137–141, Feb. 2002.[7] T. Sowlati et al., “Low voltage, high efficiency GaAs class E power amplifiers<strong>for</strong> wireless transmitters,” IEEE J. Solid-State Circuits, vol. 30, no. 10, pp.1074–1080, Oct. 1995.[8] C. Yoo and Q. Huang, “A common-gate switched 0.9-W class-E poweramplifier with 41% PAE in 0.25-µ CMOS,” IEEE J. Solid-State Circuits,vol. 36, no. 5, pp. 823–830, May 2001.[9] Y. Tan et al., “A 900-MHz fully integrated SOI power amplifier <strong>for</strong>single-chip wireless transceiver applications,” IEEE J. Solid-State Circuits,vol. 35, no. 10, pp. 1481–1486, Oct. 2000.[10] F. Ortega-Gonzalez et al., “High-efficiency load-pull harmonic controlledclass-E power amplifier,” IEEE Microwave and Guided Wave Letters, vol. 8,no. 10, pp. 348–350, Oct. 1998.95
96 BIBLIOGRAPHY[11] T. Sowlati et al., “1.8GHz class E power amplifier <strong>for</strong> wireless communications,”Electronics Letters, vol. 32, no. 20, pp. 1846–1848, Sept. 1996.[12] K.-C. Tsai and P. Gray, “A 1.9-GHz, 1-W CMOS class-E power amplifier<strong>for</strong> wireless communications,” IEEE J. Solid-State Circuits, vol. 34, no. 7,pp. 962–970, July 1999.[13] R. Tayrani, “A broadband monolithic S-band class-E power amplifier,” in2002 IEEE Radio Frequency IC Symp., Proc., 2002, pp. 53–56.[14] S. Cripps, <strong>RF</strong> <strong>Power</strong> <strong>Amplifiers</strong> <strong>for</strong> Wireless Communications. Norwood,MA, USA: Artech House Publishers, 1999.[15] P. Kenington, High-Linearity <strong>RF</strong> Amplifier Design. Norwood, MA, USA:Artech House Publishers, 2000.[16] H. Krauss, C. Bostian, and F. Raab, Solid State Radio Engineering. NewYork, NY, USA: John Wiley & Sons, 1980.[17] T. Lee, The Design of CMOS Radio-Frequency Integrated Circuits. Cambridge,UK: Cambridge University Press, 1998.[18] H. Kobayashi, J. Hinrichs, and P. Asbeck, “<strong>Current</strong> mode class-D poweramplifiers <strong>for</strong> high efficiency <strong>RF</strong> applications,” IEEE Trans. on MicrowaveTheory and Techniques, vol. 49, no. 12, pp. 2480–2485, Dec. 2001.[19] S. Kee, I. Aoki, and D. Rutledge, “7-MHz, 1.1-kW demonstration of the newE/F 2,odd switching amplifier class,” in 2001 IEEE MTT-S Intl., MicrowaveSymp. Digest, 2001, pp. 1505–1508.[20] A. Long, J. Yao, and S. Long, “A 13W current mode class D high efficiency1 GHz power amplifier,” in 45th Midwest Symp. on Circuits and Systems,Proc., 2002, pp. 33–36.[21] C. Wei et al., “Analysis and experimental wave<strong>for</strong>m study on inverse classclass-F mode of microwave power FETs,” in 2000 IEEE MTT-S Intl., MicrowaveSymp. Digest, 2000, pp. 525–528.[22] T. Heima et al., “A new practical harmonics tune <strong>for</strong> high efficiency poweramplifier,” in 29th European Microwave Conf., Proc., 1999, pp. 271–274.[23] A. Inoue et al., “Analysis of class-F and inverse class-F amplifiers,” in 2000IEEE MTT-S Intl., Microwave Symp. Digest, 2000, pp. 775–778.[24] W. Chudobiak and D. Page, “Frequency and power limitations of class-Dtransistor amplifiers,” IEEE J. Solid-State Circuits, vol. SC-4, no. 1, pp.25–37, Feb. 1969.[25] P. Mudge, “High frequency and high power class E amplifiers,” Master’sthesis, University of Cali<strong>for</strong>nia, Santa Barbara, 1999.
BIBLIOGRAPHY 97[26] G. Wong, “High efficiency bipolar power amplifiers <strong>for</strong> portable wirelesstransmission,” Master’s thesis, University of Cali<strong>for</strong>nia, Santa Barbara,1999.[27] B. Delage, D. Floriot, and C. Brylinski, “Solid-state <strong>RF</strong> power amplifiers:Status and perspective,” in 10th IEEE Intl. Symp. on Electron <strong>Device</strong>s <strong>for</strong>Microwave and Optoelectronic Applications, Proc., 2002, pp. 136–142.[28] C. Weitzel, “<strong>RF</strong> power amplifiers <strong>for</strong> wireless communications,” in 2002IEEE GaAs IC Symp., 24th Annual Technical Digest, 2002, pp. 127–130.[29] Y. Tkachenko et al., “Comparative study of hot-electron reliability of phemtvs. mesfet <strong>for</strong> high efficiency power amplifiers,” in 1999 IEEE MTT-S Intl.,Microwave Symp. Digest, 1999, pp. 799–802.[30] D. Choi and S. Long, “A physically based analytic model of FET class-E power amplifiers - designing <strong>for</strong> maximum PAE,” IEEE Trans. on MicrowaveTheory and Techniques, vol. 47, no. 9, pp. 1712–1720, Sept. 1999.[31] S. Chang et al., “Analysis and design of power efficient class-D amplifieroutput stages,” IEEE Trans. Circuits and Systems, vol. 47, no. 6, pp. 897–902, June 2000.[32] F. Raab, “<strong>Class</strong>-E, class-C, and class-F power amplifiers based upon a finitenumber of harmonics,” IEEE Trans. on Microwave Theory and Techniques,vol. 49, no. 8, pp. 1462–1468, Aug. 2001.[33] ——, “<strong>Class</strong>-F power amplifiers with maximally flat wave<strong>for</strong>ms,” IEEETrans. on Microwave Theory and Techniques, vol. 45, no. 11, pp. 2007–2012, Nov. 1997.[34] S. Sze, Semiconductor <strong>Device</strong>s, Physics and Technology, 2nd Edition. NewYork, NY, USA: John Wiley & Sons, 2002.[35] W. Bächtold, Mikrowellentechnik. Braunschweig/Wiesbaden, Germany:Vieweg, 1999.[36] B. Baliga, <strong>Power</strong> Semiconductor <strong>Device</strong>s. Boston, MA, USA: PWS PublishingCo., 1996.[37] R. Rotella et al., “<strong>Mode</strong>ling, analysis, and design of <strong>RF</strong> LDMOS devices usingharmonic-balance device simulation,” IEEE Trans. on Microwave Theoryand Techniques, vol. 48, no. 6, pp. 991–999, June 2000.[38] L. Vestling, J. Ankarcrona, and J. Olsson, “Analysis and design of a lowvoltagehigh-frequency LDMOS transistor,” IEEE Trans. on Electron <strong>Device</strong>s,vol. 49, no. 6, pp. 976–980, June 2002.[39] K. Brennan and A. Brown, Theory of <strong>Mode</strong>rn Electronic Semiconductor<strong>Device</strong>s. New York, NY, USA: John Wiley & Sons, 2002.
98 BIBLIOGRAPHY[40] W. Bächtold. (2003, June) Lecture notes <strong>for</strong> highfrequencyand microwave electronics II. [Online]. Available:http://www.ifh.ee.ethz.ch/Microwave/teaching.html[41] M. Golio, The <strong>RF</strong> and Microwave Handbook. Boca Raton, FL, USA: CRCPress LLC, 2000.[42] J. del Alamo and M. Somerville, “Breakdown in millimeter-wave powerInP HEMT’s: A comparison with GaAs PHEMT’s,” IEEE J. Solid-StateCircuits, vol. 34, no. 9, pp. 1204–1211, Sept. 1999.[43] M. Somerville and J. del Alamo, “A model <strong>for</strong> tunneling-limited breakdownin high-power HEMTs,” in Intl. Electron <strong>Device</strong>s Meeting, Proc., 1996, pp.35–38.[44] J. Cressler, “SiGe HBT technology: A new contender <strong>for</strong> Si-based <strong>RF</strong> andmicrowave circuit applications,” IEEE Trans. on Microwave Theory andTechniques, vol. 46, no. 5, pp. 572–589, May 1998.[45] M. Somerville, J. del Alamo, and P. Saunier, “Off-state breakdown in powerpHEMT’s: The impact of the source,” IEEE Trans. on Electron <strong>Device</strong>s,vol. 45, no. 9, pp. 1883–1889, Sept. 1998.[46] S. Sze, Physics of Semiconductor <strong>Device</strong>s, 2nd Edition. New York, NY,USA: John Wiley & Sons, 1981.[47] B. Streetman, Solid State Electronic <strong>Device</strong>s. Englewood Cliffs, NJ, USA:Prentice Hall, 1990.[48] Agilent Technologies. (2003, June) White paper: Characteristicsof E-pHEMT vs HBTs <strong>for</strong> PA applications. [Online]. Available:http://literature.agilent.com/litweb/pdf/5988-8574EN.pdf[49] K. Ang and I. Robertson, “Analysis and deisgn of impedance-trans<strong>for</strong>mingplanar marchand baluns,” IEEE Trans. on Microwave Theory and Techniques,vol. 49, no. 2, pp. 402–406, Feb. 2001.