
Create successful ePaper yourself
Turn your PDF publications into a flip-book with our unique Google optimized e-Paper software.
Section 5: Technical Sessions<br />
/<br />
+-3bbl<br />
Frontal Crash Protection<br />
and Pedestrian Protection<br />
-r-'11,'<br />
D<br />
^+.!r tr\f<br />
,lcrt-t!<br />
Technical Session No. 1<br />
Mr. Philip W. Davis, Chairman, United States<br />
Gompatibility and Passive Safety Terminology and Problematics<br />
Dr. ULRICH BEZ and<br />
Dr. WALTER SCHMID<br />
Bayerisch Motoren Werke AG Germany<br />
ABSTHACT<br />
The different, semantic use of problem-relevant terms<br />
is proving an increasing obstacle to understanding among<br />
different experts and authors of technical literature. When<br />
is a vehicle safe, when is it compatible, what is risk of<br />
injury?<br />
These are only a few of the fundamental terms whose<br />
meaning differs from author to author, from automobile<br />
manufacturer to automobile manufacturer, from country<br />
tO COUntry.<br />
As a result of their work in various national and <strong>int</strong>ernational<br />
bodies, the authors ofthis paper are constantly<br />
<strong>conf</strong>ronted with the problems resulting from different<br />
<strong>int</strong>erpretation of such terms. Drawing on their own understanding<br />
of the problems involved and the effects of<br />
stipulations, the authors in their paper attempt to explain<br />
such terms on an application-oriented basis, to define<br />
them and to supplement, or at least round off, the 'nstructure"<br />
by means of new terms. This paper is <strong>int</strong>ended not<br />
only to be an aid to experts in informing others of their<br />
results but is also aimed at enabling the reader to understand<br />
what has become rather complex material.<br />
INTHODUCTION<br />
The subject of SAFETY IN ROAD TRAFFIC is as<br />
old as the invention of the wheel. In recent times-since<br />
1970
ing between experts in industry and administration and<br />
to offer the experts a sound basis for a common goaloriented<br />
approach.<br />
Although the authors of this paper are aware of how<br />
diffrcult it is to change opinions once they have become<br />
ingrained and the problems which might <strong>conf</strong>ront common<br />
terminology, they nevertheless attempt to clarify the<br />
meaning of the terms PASSM SAFETY and COM-<br />
PATIBILITY by means of a comprehensive consideration<br />
and then to define them relative to each other. For this<br />
consideration, it is necessary to somewhat delineate the<br />
meaning of terms in general usage such as DANGER,<br />
RISK or SAFETY.<br />
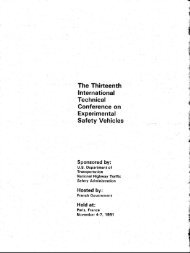
SAFETY-DANGER-RISK<br />
Life in itself is dangerous. The definition in DIN 31004<br />
"SAFETY<br />
is the absence of DANGER" does admittedly<br />
imply a state of absolute safety. If, however, the focus of<br />
this consideration regarding SAFETY is humans with<br />
their health and wellbeing, an absolute level of safety is<br />
absolutely impossible for humansiue to the very nature<br />
of the matter.<br />
As shown in Figure l, there are only conditions described<br />
by a particular DEGREE OF SAFETY as well<br />
as by a DEGREE OF DANGER. It is not possible to<br />
transfer DEGREE OF SAFETY <strong>int</strong>o AN OBJECT IS<br />
SAFE. Such statements are arbitrary.<br />
This description of $tate doe$ however enable a comparison<br />
to be made, e.g., of different means of transportation-whether<br />
expressed positively as DEGREE OF<br />
SAFETY or negatively as DEGREE OF DANGER. We<br />
can say, for instance, that means of transport A is safer<br />
than means of transport B. This necessitates laying down<br />
an absolute DEGREE OF SAFETY although it is sufficient<br />
to relate the objects under comparison to the same<br />
basis.<br />
The term RISK is closely related to the DEGREE OF<br />
DANGER and thus to DEGREE OF SAFETY. A small<br />
RISK means a greater DEGREE OF SAFETY and<br />
smaller DEGREE OF DANGER.<br />
. SAFETY is the probability of non-impairment of<br />
health and wellbeing of humans or non-damage to<br />
property.<br />
. DANGER is the probability of impairment to health<br />
and wellbeing of humans or damage to property.<br />
r The expressions SAFETY and DANGER are colloquial<br />
simplifications of DEGREE OF SAFETY<br />
and DEGREE OF DANGER. The term RISK is<br />
closely related to DANGER and SAFETY.<br />
. Comparative considerations with the adjectives<br />
SAFE and DANGEROUS are possible, the prerequisite<br />
being: The same basis.<br />
. The adjectives SAFE and DANGEROUS do not<br />
determine the actual state or behaviour of an object.<br />
EXPERIMENTAL<br />
SAFETY VEHICLES<br />
140<br />
SAFHW IN ROAD TRAFFIC<br />
Following the preceding <strong>section</strong> which was devoted to<br />
higher-order aspects dealing with terms, we now provide<br />
an overview of the complex known as road safety. A<br />
particular aim is to classify the terms PASSIVE SAFETY<br />
and COMPATIBILITY.<br />
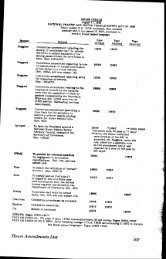
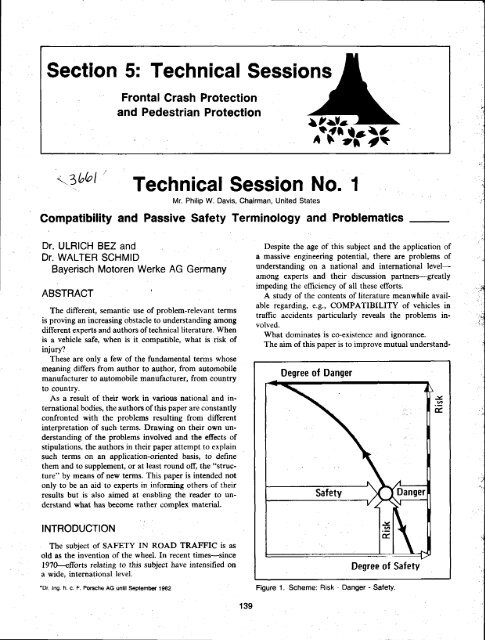
The four principal sectors determining safety in road<br />
traffic are:<br />
The HUMAN<br />
The VEHICLE<br />
The ENVIRONMENT<br />
The RESCUE SYSTEM<br />
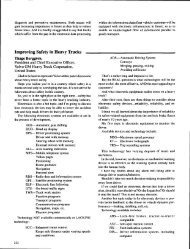
The human is a signiflrcant risk factor on the <strong>one</strong> hand<br />
as an active participant in traffrc-being able to both avoid<br />
as well a$ to cau$e an accident as the result of his capabilities-and<br />
on the other hand in his capacity as a<br />
passive participant in an accident is the victim of the<br />
danger which he himself has frequently influenced. (Fig.<br />
2.\<br />
Depending on his constitution, his physical and psychic<br />
state, he represents a greater or smaller accident risk and<br />
consequently also an injury risk for himself and other<br />
humans, whether as driver of a vehicle or pedestrian by<br />
reacting, acting, judging in different ways.<br />
The impairment of human health is influenced by the<br />
mechanical loads which can be sustained by head, thorax,<br />
pelvis and extremities. [t can today be stated as a reliable<br />
Car ro Crr<br />
Crr to frucl<br />
Crr tn Ped,<br />
Single<br />
Viribilfty<br />
Rod<br />
Obrboles<br />
Figure 2. Structure of safety in road traffic.
fact that this load factor varies from human to human<br />
and is greatly dependent on age,<br />
The behaviour of the vehicle is usually split up <strong>int</strong>o an<br />
active and a passive sector.<br />
In the active sector, a vehicle which is as quiet running<br />
as possible, dampens vibrations to the maximum extent<br />
possible and in which the air is properly conditi<strong>one</strong>d<br />
provides the ideal requirements for ma<strong>int</strong>aining the driver's<br />
concentration at a high level. Good road behaviour<br />
also comes under this $ector. The terms PASSM<br />
SAFETY and COMPATIBILITY can be found under<br />
the heading of passive behaviour.<br />
The environment affects vehicle safety <strong>int</strong>er alia by the<br />
visibility conditions existing, the condition of roads and<br />
any obstacles pre$ent. An essential factor is also the nature<br />
of other road users, e.g., other vehicles or pedestrians.<br />
Rescue is significantly influenced by the human as res'<br />
cuer and helper, by medicine (e.g., shock prophylaxis) by<br />
means of technical aids such as salvage tools or medical<br />
apparatus, as well as the organizatiotr $et up to ensure<br />
that the right helpers are on the scene as rapidly as possible<br />
with the right equipment.<br />
An attempt to change the degree of PASSIVE SAFETY<br />
results in fundamental <strong>conf</strong>licting objectives from the mutual<br />
influencing of the aforementi<strong>one</strong>d principal sectors<br />
of passive safety, it being <strong>one</strong> of the principal tasks of the<br />
engineer to solve or reduce these <strong>conf</strong>licts.<br />
Passive Safety<br />
The definitions specified here are closely related to the<br />
terms elucidated.<br />
r PASSIVE SAFETY dcals with the effect of vehicle<br />
technology on the risk of injury to the human and<br />
property in defined accidents and with the biomechanical<br />
capacity of the human, which is assumed<br />
to be known.<br />
The remarkable bandspread characterizing all known<br />
analyses of real traffrc accidents is attributable primarily<br />
to the large bandspread of the biomechanical capacity of<br />
the human and the different accident conditions.<br />
Mea$ures to change PASSM SAFETY therefore rcquire<br />
to be oriented on statistical characteristic values.<br />
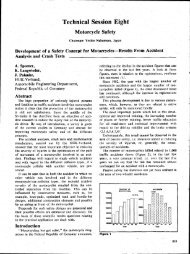
Improvements to PASSIVE SAFETY result in a reduction<br />
in the ACCIDENT RISK by reducing INJURY<br />
SEVERITY and MATERIAL DAMAGE (Fig. 3.).<br />
Using the designation, common in safety science, the<br />
severity of an accident becomes DEGREE OF DAMAGE<br />
S and the frequency of accident becomes PROBABILITY<br />
OF OCCURRENCE OF DAMAGE W and thus AC-<br />
CIDENT RISK R.<br />
R<br />
I<br />
PASSM SAFETY influences the degree of AC-<br />
CIDENT SEVERITY primarily and independently<br />
SECTION 5: TECHNICAL SESSIONS<br />
Figure 3. Structure of accident risk. Rescue as a filter function<br />
determines final rehabilitation.<br />
of whom is involved in the damage or of how it is<br />
distributed.<br />
Conflicts<br />
Changing individual elements of the four principal sectors<br />
of PASSM SAFETY (Fig. 2) is still the method<br />
most widely used today to improve the degree of safety.<br />
Development engineers in the automobile industry recognized<br />
early on, however, that a consequent reduction<br />
of the risk of injury, e.g., when impacting against a solid<br />
wall, can increase the risk of injury in other types of<br />
accidents, such as a head-on and side collision involving<br />
different vehicles.<br />
It is therefore questionable in respect ofa large number<br />
of legislative efforts based on individual elements-e,g.,<br />
impact against wall, pssl laterally, etc.-whether they in<br />
fact increase PASSIVE SAFETY.<br />
Solving such <strong>conf</strong>licts first of all demands researching<br />
the causes and mechanisms contributing to the occurrence<br />
of damage. It is then necessary to balance the attainable<br />
improvements on the <strong>one</strong> hand with any impairments<br />
which may have to be accepted on the other hand.<br />
. Problems of the DISTRIBUTION OF ACCIDENT<br />
RISKS thus exist in the cases of <strong>conf</strong>licts.<br />
Compatibility<br />
Based on the knowledge of this problem of distribution'<br />
the following terminology is therefore proposed.<br />
r COMPATIBILITY is concerned with the mutual<br />
influencing of elements of the four principal groups<br />
of PASSIVE SAFETY:<br />
Nature of collision<br />
Nature of vehicle<br />
Nature of risk<br />
Nature of considcration<br />
',"i<br />
! J
Nature of collision is, e.9., single-vehicle collision,<br />
front-end, side or rear-end collision with other vehicles<br />
or rollover. Nature of risk of accident relates, e.g., to<br />
material damage or slight or severe injury to different<br />
parts of the body.<br />
Apart from different types of private cars, we must<br />
reckon with collisions concerning trucks, buses and twowheeled<br />
vehicles.<br />
r COMPATIBILITY PROBLEMS are problems in<br />
which defined vehicle changes on the <strong>one</strong> hand increase<br />
PASSIVE SAFETY. reduce the risk of accident<br />
at that po<strong>int</strong> while on the other hand<br />
increasing another ACCIDENT RISK.<br />
. Compatibility influences the statistical accident risk<br />
of the entire number of all accidents via the distribution<br />
of the accident risk in the individual case and<br />
thus the DEGREE OF PASSIVE SAFETY.<br />
In the same way as with the term SAFETY, a state of<br />
complete COMPATIBILITY is not possible $ince defined<br />
distributions are in themselves only variants which can<br />
only be assessed and arranged by employing further criteria.<br />
For this reason, the DEGREE OF COMPATI-<br />
BILITY is decisively influenced by the criteria employed.<br />
When dealing with compatibility problems, the viewpo<strong>int</strong><br />
of the observer is of elementary significance. The<br />
primary consideration may be self protection, protection<br />
of other traff,tc users, losses to the economy or insurance<br />
economic aspects.<br />
P q)<br />
llI<br />
at',<br />
OJ<br />
.H<br />
(tI<br />
CL<br />
Degree of Compatibility<br />
Confl icting Objectives<br />
Figure 4. Scheme: Passive safety - Compatibility - <strong>conf</strong>licting<br />
objective.<br />
EXPERIMENTAL SAFETY VEHICLES<br />
142<br />
The conclusion to be drawn from this is that the strat'<br />
egy of the observer is of signiflrcant influence.<br />
COMPATIBILITY STRATEGIES<br />
If Chapters I to 3 are used in assessing technical literature-referred<br />
to in the Appendix-it can be stated<br />
that all the principal work can be arranged in the terminology<br />
stated. On the other hand, the statement and<br />
results differ due to the application ofdifferent strategies.<br />
The strategy determines the results like a filter of spectral<br />
analysis, employed for input data with the same origin.<br />
To aid understanding, it is urgently necessary in future<br />
for all authors, speakers, organizations, industry and authorities<br />
to clearly set out what is the strategy basis of<br />
their knowledge or requirements.<br />
Figures 2 and 5 are an essential aid in this respect.<br />
Figure 5 presents the principal strategie$ and possibilities<br />
for mixing in a systematical form. Mixing takes place not<br />
only via the three circles MOTIVATION, FILTER,<br />
SPACE but also within each circle. It is seldom a matter<br />
of the PURE FORM of a strategy.<br />
For in$tance, if the economic aspect dominateswhether<br />
national or private economic aspects-political<br />
(company or state) factors or humanitarian (moral or<br />
ethical) factors always play a role.<br />
The middle circle, the FILTER CIRCLE, shows that<br />
the motivation aspects are filtered in a purely arbitrary<br />
manner or with focal po<strong>int</strong>s-e.9., dealing exclusively<br />
Figure 5. Presentation ol important compatibility strategies<br />
and their correlation (motivation circle, selection<br />
circle, space limitation circle).
with car-to-car frontal accidents-{r ideally with exclusive<br />
orientation to minimizing overall risk or objectivitywith<br />
as uniform possible distribution of risks.<br />
The inner circle or SPACE LIMITATION CIRCLE<br />
finally provides information regarding regional, national<br />
or <strong>int</strong>ernational applicability or <strong>int</strong>erpretation of the criteria<br />
menti<strong>one</strong>d.<br />
In the authors' view, the project suppor-ted by the German<br />
Ministry for Research and Technology, the abbreviated<br />
title of project Phase I being COMPATIBLE<br />
VEHICLES, pursues on the basis of this arrangement<br />
principle an<br />
economically focused/optimum national strategy.<br />
This eliminates any further RIGHT or WRONG in<br />
the discussion of compatibility, leaving only a co-existence<br />
ofdifferent approaches, which the individual author then<br />
must also explain.<br />
Po<strong>int</strong>s of controversy are then no longer COMPATI-<br />
BILITY PROBLEMS but the decision in favour of the<br />
criteria of the three STRATEGY CIRCLES to be employed.<br />
SUMMARY<br />
As a result of their work in various national and <strong>int</strong>ernational<br />
bodies, the authors ofthis paper are constantly<br />
<strong>conf</strong>ronted with the problems involved from the different<br />
<strong>int</strong>erpretation of terms. From their own knowledge of<br />
these problems and a study of the comprehensive technical<br />
literature meanwhile available, they explain the terms<br />
PASSIVE SAFETY and COMPATIBILITY on an application-oriented<br />
basis and define them relative to each<br />
other so as to cover all known terms. Only by <strong>int</strong>roducing<br />
the term COMPATIBILITY STRATEGY and the variations<br />
which it offers is it possible to achieye a breakdown<br />
ensuring extraordinary transparency.<br />
r PASSIVE SAFETY thus means effort to reduce the<br />
OVERALL ACCIDENT RISK.<br />
r COMPATIBILITY means a proper distribution of<br />
unavoidable risks based on a specified strategy.<br />
A Collection of Relevant Papers to the Term<br />
Compatibility<br />
L Appel, H.: Optimum deformation characteristics for<br />
front, rear and side structures of motor vehicles in<br />
mixed traffrc; 2. ESV-Conference, Sindelfingen l97l<br />
2. Appel, H.: Aggressivitfrt von Fahrzeugen als Teilprrrblem<br />
der passiven Sicherheit; LTZ 15 (1973) 12<br />
3. Appel, H.: Ergebnisse und SchluBfolgerungen aus<br />
dem ESV-RSV-Programm und der BMFT-Studie<br />
"Technologie<br />
flrir die Sicherheit im StraBenverkehr";<br />
SECTION 5: TECHNICAL SESSIONS<br />
143<br />
4. Statussemin. Kfz- u. $tV-Tech. BMFT, 2. Jtag.<br />
VDI-Gesell. Fz.Tech. 1976<br />
4. Appel, H.: Hofmann, J.; Rau, H.: Entwicklung kompatibler<br />
Fahrzeuge-Analytische Abschiitzung der<br />
Unfallmechanik der Unfallgruppen. 5. Statussemin.<br />
d. BMFT 1977<br />
5. Scott, Basil Y.: Large and Small Car Accident Per'<br />
formance: A Large Scale Accident Data Base Analysis;<br />
SAE 750ll3<br />
6. Beermann, H.J.: Verformungsverhalten von Pergr<br />
nenkraftwagen an Unterfahrschutzeinrichtungen. Dt.<br />
Kraftfahrforsch. u. StraBenverkehrstech. H. 259<br />
Diisseldorf<br />
7. Bez, U.: SicherheitsmaBnahmen imStrapenverkehr-Ergebnisse<br />
einer Nutzen,/Kosten-Analyse<br />
von ausgewiihlten Mapnahmen. VDl-Berichte<br />
Nr. 418<br />
8. Boehly, William A., Lombardo, Lois V.: Safety Consequences<br />
of the Shift to small cars in the 1980's;<br />
NHTSA, HS-805 506<br />
9. BLMC: A house paper which describes a computer<br />
simulation of a car-to-car head-on impact to investigate<br />
vehicle aggressiveness.<br />
10. Biihler, O.P.: Neue Chancen gegen Verkehrstod? Hydrauliksystem<br />
verbessert Unterfahrschutz an Lkw<br />
und Anhiingern. Kfz-Anz.32 (1979) 15<br />
11. Carlson, W.L.; Crash injury and vehicle siee mix.<br />
Conf. Amer. Assoc. for Automot, Med. and 7. Conf.<br />
Int. Assoc. for Accident and Traffrc Med. Vol. 2<br />
12. Carter, R.L.: Passive protection at 50 miles per hour.<br />
DOT HS 810 197<br />
13. Chandler, E.: Car-to-car compatibility, a brief survey<br />
4. ESV-Conference, Kyoto 1973<br />
14. Chillon: The importance of vehicle aggressiveness in<br />
the case of a transversal impact; l. ESV-Conference,<br />
Paris 71<br />
15. Coquandr Vergleich der Sicherheit gewisser Klassen<br />
franzcisischer Tourenfahrzeuge mit groper Verbreitung.<br />
Anhang IV zum Bericht vom 30. Juni 1972<br />
(VDA Kommission fiir die Sicherheit von Fahrzeugen)<br />
16. O'Day, Jamcs and Kaplan, Richardr How Much<br />
Safer Are You in a Large Car; SAE (Feb. 75) 7501l6<br />
17. Davis, S.; Pierce, S.; Van Crashworthiness and Aggressivity<br />
Study; SAE 810090<br />
18. S. Davis, R, Yee; Development of a Test Methodology<br />
for Evaluating Crash Compatibility and Aggressiveness<br />
DOT HS-805 063<br />
19. Danner, M.: Entwicklung kompatibler Fahrzeuge-<br />
Bildung einer Rangreihe von Unfallgruppen anhand<br />
einer Untersuchung realer Unftille; 5. Statussemin. d.<br />
BMFT 1977<br />
20. Danner, M.; Langwieder, K.: Schwerpunkte des realen<br />
Unfallgeschehens und Auswirkungen auf Kompatibilitiitsrelevante<br />
EinfluBgr
2t. Langwieder, K.: Aspekte der Fahrzeugsicherheit anhand<br />
einer Untersuchung von realen Unfldllen; HUK-<br />
Verband<br />
Langwieder, K.: LKW-Kollisi<strong>one</strong>n mit Pers<strong>one</strong>nwagen<br />
und Ansatzpunkte zur Verbesserung des Partnerschutzes<br />
Tuv-Rheinland<br />
23. Fiat: Analysis of statistical data on road accidents in<br />
Italy (1969-1970); A Magara 2nd ESV-Conference<br />
l97l<br />
24. Fiat: Technical presentation; 6. ESV-Conference in<br />
Wash.<br />
75. Fischer, J.: Analyse der passiven Sicherheit: Partnerschaft<br />
auf italienisch. Der hdufigste Unfall simuliert;<br />
Wagen mit ll00 kg gegen 800 kg mit je 40<br />
km,/h frontal und versetzt; Automob.-Rev. 74 (1979)<br />
26, Fischer, R.G.: Occupant protection in car-to-car impacts<br />
4. ESV-Conference, Kyoto 1973, SAE 740316<br />
27. Fischer, J.; Frontal-Crash zwischen zwei extrem unterschiedlich<br />
groBen Wagen. Analyse der passiven<br />
Sicherheit Automob.-Rev. 73 (1978)<br />
28 Hutchinson, T.P.: On the relative frequencies of collisions<br />
between vehicles of different masses; Z. f . Yetkehrssicherh.<br />
25 (1979)<br />
29. Maclaughlin, T.F.; Saul, R.A.; Daniels, S.: Causes<br />
and Measurement of Vehicle Aggressiveness in Frontal<br />
Collisions; SAE 801316<br />
30. Maclaughlin, T.F.: Derivation and Application of<br />
Restra<strong>int</strong> Survival Distance in Motor Vehicle Collisions;<br />
SAE 81009?<br />
31 Makay, Murray; Ashton, Steve: Injuries in Collisions<br />
Involving Small Cars in Europe; SAE 730284<br />
32. Middelhauve, V.; Breitbach, P.; Panzer der StraBe?<br />
LKW-Unfallsimulation an der TU Berlin; Lastauto<br />
Omnibus 56 (1979) 6<br />
33. Ragland, C.: Vehicle Aggressivity Measurement and<br />
Evaluation: SAE 790297<br />
34. Randall, R.B.; Hee, J.; Cepstrum analysis; Bruel and<br />
Kjaer tech. Rev. (1981) 3<br />
35. Renault: Po<strong>int</strong> du probleme compatibilit6 (note<br />
RNUR)<br />
36. Renaultr A Method to Approach the Problems of<br />
Vehicle Compatibility; 3. Intern. Congress on Automotive<br />
Safety, San Francisco 1974<br />
37. Renaultr Compatibility between Vehicles in Frontal<br />
and Semifrontal Collisions: 5. ESV-Conference in<br />
London 1974<br />
38. Renaultr Classification des chocs. Compatibilit6 (note<br />
RNUR)<br />
39. Ventre, P.: Homogeneous safety amid heterogeneous<br />
car population? 3rd Internat. Conference on ESV,<br />
Wash. 1972<br />
40. Ventre, P.; Rullier, J.C.: Proposals for test evaluation<br />
of compatibility between very different passenger<br />
cars. 4. ESV-Conference, Kyoto 1973<br />
41.<br />
Reidelbach, W.; Schmid, W: An Attempt to Define<br />
EXPERIMENTAL SAFEW VEHICLES<br />
144<br />
and Evaluate Vehicle Compatibility; 3. International<br />
Congress of A.utomotive Safety, San Francisco, 1974<br />
42. Schmid. W.; Utrcr Massenverhdltnisse bei Fahrzeugunfdllen<br />
im gemischten $traBenverkehr; Automobiltechnische<br />
Zeitschrift 77 (1975) 5<br />
43. Reidelbach, W.; Schmid, W: Compatibility of Passenger<br />
Cars in Road Accidents; 6. ESV-Conference,<br />
Washington Oct. 76<br />
44. Schmid, W.: Mathematical Modeling of Occupant<br />
Biomechanical Stress Occurring During a Side Impact;<br />
SAE 780670<br />
45. Reidelbach, W.; Schmid, W.: Realistic Test Conditions<br />
for Evaluation of Passenger Car Occupant Protection<br />
7th ESV-Conference, Paris, June 1979<br />
46. Schmid, W.; Vermindertes Verletzungsrisiko bei Verkehrsunf?illen<br />
durch Fahrzeug-Kompatibilitdt; FISr<br />
ITA-Congress, Hamburg, Mai 1980<br />
47. Schmid, W.: Minimum Risk of Injury on the Road,<br />
a Paradox; 8th ESV-Conference, Wolfsburg, Oct.<br />
1980<br />
48. Schmid, W.: The increase in the risk of injury in<br />
traffrc accidents as a result of higher test impact<br />
speeds; 9. ESV Conference, Kyoto 1982<br />
49. Panik, F.; Schmid, W.: Die 7. ESV-Konferenz-<br />
Uberblick Automobiltechnische Zeitschrift 82<br />
(1e80) l<br />
50. Saul, R.A.; Maclaughlin, T.F.; Ragland, C.L.;<br />
Cohen, D.: Experimental Investigation of Crash Barriers<br />
for Measuring Vehicle Aggressiveness-Fixed<br />
Rigid Barrier Initial Results; SAE 810093<br />
51. Searle, J.A.r The estimation of an aggressiveness coefficient<br />
from barrier impact test results. Working<br />
paper<br />
52. Solomon, D.: Highway research and vehicle design<br />
for the 80s: SAE 77ffi39<br />
53. Stuhler, T.; Stankovic, P.: Vermeidbare Unfallfolgen?<br />
Z. f. Verkehrssicherh. 24 (1978) 4<br />
54. Stcherbatchef, G.; Provensal, J. (F): Identification des<br />
facteurs de compatibilit6 des vehicules en choc lateral;<br />
VDl-Berichte Nr. 268, 1980<br />
55. Stewart, J.R.; Stutt$, J.C.: A Categorial Analysis of<br />
the Relationship between Vehicle Weight and Driver<br />
Injury in Automobile Accidents; HSRC/DOT HS-<br />
803 892<br />
56. Stratmann, J.G.; ADAC-Untersuchung: Welche Vorund<br />
Nachteile hat ein groBes oder kleines Auto?<br />
ADAC-Mot.-welt (1980) l0<br />
57. $eiffert, U.: Crashworthiness regulations will be hard<br />
on small carsl SAE-Jownal 4/73<br />
58. VW: Realistic compatibility concepts and associated<br />
testing; 6. ESV-Conference in Washington<br />
59. Seiffert, U., Hamilton, J. and Boersch, F.: Compatibility<br />
of traffic participants; 3. Intern. Congr. on<br />
Automotive Safety, San Francisco 1974<br />
6O. Seiffert, U.; Kompatibilitet auf der StraBe; ATZ 77<br />
(re75)
61. Danckert, H.: Development of crash energy management<br />
solutions; SAE 760793<br />
62. Weissner, R.: Fahrzeugtechnische Schwerpunkte zur<br />
Verminderung von Unfallfolgen; 4. Statussemin. Kfzu.<br />
StV-Tech. BMF[, 2. Jtag. VDI-Gesell. Fz-Tech.<br />
1976<br />
63. Weissner, R.r Fahrzeugtechnische M
Staa<br />
I{HTSA Frontal $tructures Hesearch<br />
CARL L. RAGLAND<br />
National Highway Traffic Safety<br />
Administration<br />
ABSTRACT<br />
A methodology is being developed to asses$ fleet safety<br />
in the frontal crash mode. While many individual safety<br />
contributions have been made in improving safety potential<br />
of<strong>one</strong> vehicle, few studies have successfully predicted<br />
net safety gains which may be obtained by relatively minor<br />
vehicle changes (in some cases) applied to large portions<br />
of the fleet. This study addresses the methodology for<br />
predicting the net gain in safety benefit by manipulation<br />
of input vehicle,/fleet parameters (stiffness, weight, fleet<br />
distributions, accident distributions), and occupant injury<br />
predictive analysis. The application of this methodology<br />
is the identification of optimized vehicle structural input<br />
parameters which result in minimum risk to the population<br />
as a whole.<br />
INTRODUCTION<br />
Even though protection ofoccupants in frontal crashes<br />
has been a major focus of safety efforts in recent years,<br />
frontal crashes still continue to present the largest risk<br />
to passenger car occupants. For instance, 5O7o of all<br />
passenger car fatalities and 53Vo of all light vehicle serious<br />
injuries (AIS > 3) result from frontal accidents. These<br />
data are obtained from NHTSA's Fatal Accident Reporting<br />
System and from the National Crash Severity<br />
Study.<br />
To investigate this problem, NHTSA frontal structures<br />
research is undertaking a systems approach quantitatively<br />
identifying problem areas, conducting parameter studies<br />
to optimize structural,/safety design and performance parameters,<br />
and finally recommending countermeasures<br />
that would be most effective in a specific fleet environment,<br />
The first step of this approach is identiffing all pertinent<br />
factors which influence occupant risk. These factors include<br />
exposure factors and physical factors such as stiffness,<br />
crash pulse shape, <strong>int</strong>rusion, and vehicle <strong>int</strong>erior<br />
geometric and restra<strong>int</strong> data, all of which will be derived<br />
from various data sources including but not limited to:<br />
-accident data<br />
-
GROUP<br />
A<br />
B<br />
PULSE SHAPE<br />
(S KETCH )<br />
xMr'<br />
xr'<br />
c xFr,<br />
D<br />
xF'<br />
l"<br />
E xF,<br />
F xr'<br />
G xF-<br />
H xr'<br />
xn-<br />
Figure 2. Generic crash pulse shapes.<br />
SECTION 5; TECHNICAL SESSIONS<br />
147<br />
etc., the NHTSA has eollected in a data base system over<br />
460 records ofcrash tests ofvarious types performed over<br />
the past several years. Of these crash tests, approximately<br />
24O include tests in which at least <strong>one</strong> of the vehicles<br />
were impacted with a predominantly frontal PDOF (principal<br />
direction of force). These records will be the primary<br />
emphasis of this study along with other necessary fleet<br />
properties, distributions of weights (current and projected),<br />
etc.<br />
Collection and compilation of the crash test data are<br />
being performetl to present the data in a format which is<br />
compatible with accident data. These data will be presented<br />
in tabular form showing distributions of delta V's,<br />
striking and struck car weights, collision types, and impact<br />
types. Comparisons will then be made with accident<br />
data to determine commonalities and voids in test data.<br />
As shown in Figure I and in other research findings,<br />
crash pulse shape can have a significant influence on<br />
occupant frontal crash protection (1). Therefore <strong>one</strong> of<br />
the primary physical factors associated with occupant risk<br />
is crash pulse shape. This factor has been condensed from<br />
the 2,10 crash tests <strong>int</strong>o 9 generic crash pulse shapes as<br />
shown in Figure 2 (2). These data will be useful as input<br />
to the accounting model for identifying <strong>one</strong> of the primary<br />
characteristics of the existing fleet.<br />
From this sample of crash pulses it can be determined<br />
that, while variations of crash pulse shape are available,<br />
these variations may be narrowed down to perhaps 5 or<br />
6 basic shapes. Future research work will concentrate on<br />
sales weighting these data to determine a representative<br />
fleet distribution.<br />
Another structural parameter which can be linked to<br />
crash pulse shape is structural stiffnessr Here stiffness is<br />
defined as the combination of factors influencing resistance<br />
to crash forces. Where specific stiffness is unique to<br />
each crash event, generally stiffness may best be derived<br />
from dynamic loads measured during a specified crash<br />
event such as a flrxed load cell barrier test. The NHTSA<br />
has collected and compiled such force-crush curves using<br />
a NHTSA designed load cell barrier. This barrier, shown<br />
in Figure 3, is constructed of rigid supporting structure<br />
1<br />
,1<br />
:i<br />
r-fu<br />
il<br />
r<br />
,r<br />
.1<br />
.
used to mount thirty-six, 50,00O pound capacity load cells,<br />
capable of measuring a 25,000 pound off-axis load when<br />
combined with a 25,000 inch pound moment. Extremely<br />
good data are being collected from this device. lntegration<br />
of load-time histories indicates virtually no loss of load<br />
based on impulse-momentum balance. Additionally there<br />
is very negligible noise content in data.<br />
Force-time data from the load cell barrier have been<br />
collected on a small sample of test vehicles. These data<br />
include approximately 14 model year 1980 cars, 12 model<br />
year 1980 car$, and 24 model year 1982 cars (1982 model<br />
year testing is currently in progress with approximately<br />
10 model year 82 tests completed at date of writing).<br />
Utilization of these data has been primarily to determine<br />
stiffness ofthe crash tested cars and hence to extrapolate<br />
stiffness properties to the entire fleet.<br />
A sample of the total load-time data digitally frltered<br />
at 300 Hz cut-off is shown in Figure 4.<br />
Two secondary benefits have resulted from load cell<br />
barrier data. First, load data, unlike accelerometer data,<br />
have proven to have low susceptibility to noise and vibration.<br />
Therefore load-time data. can be used to "match"<br />
the best accelerometer response, when several redundant<br />
accelerometers are available in the vehicle compartment.<br />
Secondly, the actual structural response is measured with<br />
a high degree of precision. This allows assessment of<br />
repeatability of test car structures under similar test conditions.<br />
Load data, in this case, can identify structures<br />
that behave differently in tests due to manufacturing,/<br />
design changes, etc.<br />
Complete load cell barrier data (load-time) are stored<br />
:<br />
rilm<br />
d<br />
= 8000<br />
o<br />
E<br />
F m m<br />
{100 t<br />
0m 003 06 00s 0.12<br />
rlMf lStcoNosr<br />
Figure 4. Load-time data filtered at 300 Hz. 1981 Mercury<br />
Marquis, 35 mph load cell barrier total force vs.<br />
time.<br />
EXPERIMENTAL SAFETY VEHICLES<br />
AK5 1655.31 12tfl55 78 POL<br />
015 018<br />
Table A. Stiffness comparison for 35 mph load cell barrier<br />
tests.<br />
NHTSA<br />
TEST<br />
NO.<br />
119<br />
119<br />
't?2<br />
137<br />
194<br />
273<br />
333<br />
334<br />
365<br />
380<br />
386<br />
425<br />
426<br />
427<br />
428<br />
999*<br />
999*<br />
ggg*<br />
TEST<br />
VEHICLE<br />
WEIGHT<br />
3066<br />
2M<br />
2314<br />
3714<br />
2707<br />
2456<br />
2214<br />
3417<br />
2650<br />
3965<br />
3930<br />
4615<br />
2M'1<br />
3880<br />
2767<br />
3428<br />
3060<br />
2584<br />
*TOBE<br />
ASSIGNED<br />
STIFFNESS,<br />
(LBS.<br />
/FT.I<br />
55900<br />
69200<br />
58400<br />
80900<br />
7s000<br />
77000<br />
73000<br />
87800<br />
57000<br />
52000<br />
93882<br />
89000<br />
60300<br />
84600<br />
58500<br />
45600<br />
65581<br />
88000<br />
Table B. Stitfness comparison for 35 mph load cell barrier<br />
tests, 2100-2700 pound weight class.<br />
NHTSA<br />
TEST<br />
NO.<br />
119<br />
122<br />
273<br />
333<br />
365<br />
426<br />
999"<br />
TEST<br />
VEHICLE<br />
WEIGHT<br />
2404<br />
2314<br />
2456<br />
2214<br />
2650<br />
2641<br />
2584<br />
* TO BE ASSIGNED<br />
STIFFNESS,<br />
K<br />
(LBS. IFT.I<br />
69200<br />
58400<br />
77000<br />
73000<br />
57000<br />
60300<br />
88000
Table C, Stiffness comparlson for 35 mph load cell banier<br />
tests, 2700-3300 pound weight class'<br />
NHTSA TEST<br />
TEST VEHICLE STIFFNESS,<br />
NO. WEIGHT K<br />
(LBS. /FT.I<br />
118 3066 55900<br />
194 2707 75000<br />
4?8 2767 58s00<br />
999* 3060 65581<br />
* TO BE ASSIGNED<br />
in the NHTSA data base. Table A presents <strong>one</strong> form of<br />
comparing these data using the deftnition that stiffness,<br />
K, is the maximum force divided by the dynamic crush<br />
which occurs at the same time as that maximum force<br />
value. While this straight line force-crush is not totally<br />
representative ofoverall stiffness, it serves as a reasonable<br />
approximation in most cases for classifying the selected<br />
test cars by stiffness. A weight breakdown of this small<br />
sample of data is presented in Tables B through E. Future<br />
attempts will be made to expand this sample size to in'<br />
clude a cross <strong>section</strong> of cars in terms of stiffness. Then,<br />
association of crash pulse shapes with stiffness will be<br />
used as input to the accounting methodology to be described<br />
in the following <strong>section</strong>.<br />
Other data required to analytically assess the frontal<br />
crash environment include <strong>int</strong>erior geometry of occupant<br />
compaftments, fleet weight distributions for current fleets<br />
as well as projected fleets, closing velocity frequency dis'<br />
tributions, and relationships between occupant injury se'<br />
verity with both <strong>int</strong>rusion and occupant impact speed<br />
(with <strong>int</strong>erior vehicle comp<strong>one</strong>nts). Interior geometry can<br />
Table D. Stiffness comparison for 35 mph load cell barrier<br />
tests, 3300-3900 pound weight class.<br />
NHTSA TEST<br />
TEST VEHICLE STIFFNESS,<br />
NO. WEIGHT K<br />
(LBS./FT.}<br />
137 3714 80900<br />
334 3417 87800<br />
427 3880 84600<br />
999* 3428 45600<br />
* TO BE ASSIGNED<br />
SECTION 5: TECHNICAL SESSIONS<br />
149<br />
Table E. Stitfnese comperison for 35 mph load cell banier<br />
tests, over 3900 pound weight class.<br />
NHTSA TEST<br />
TEST<br />
NO.<br />
VEHICLE<br />
WEIGHT<br />
STIFFNESS,<br />
K<br />
(LBS. /FT.I<br />
380<br />
386<br />
425<br />
396s 52000<br />
3930 93882<br />
461s 89000<br />
moet simply be expressed ae a frequency distribution of<br />
the shortest distance between an occupant's head or chest<br />
and <strong>int</strong>erior comp<strong>one</strong>nts. An example is shown in Table<br />
F. More sophisticated dimensions may be required for<br />
more detailed occupant studies. Fleet distributions are<br />
available from many sources such as fuel economy data<br />
for projected fleets, Polk Data, and accident data sources<br />
such as NCSS (National Crash Severity Study) and NASS<br />
(National Accident Sampling System). One compilation<br />
of 1985 weight projections is shown in Figure 5 while<br />
overall NCSS passenger car weight distribution is shown<br />
in Figure 6 (3,4). Frequency of closing velocity distri'<br />
butions and accident types is obtained also from NCSS<br />
and NASS data along with occupant injury relationships.<br />
It is anticipated that exposure data as currently obtained<br />
will not significantly be altered in future fleets, except<br />
weight-frequency distribution changes. Other data being<br />
compiled for possible input to the analytical accounting<br />
model are <strong>int</strong>erior data necessary to exercise an analytical<br />
2-D or 3-D occupant model. These data may include input<br />
for <strong>int</strong>rusion in the model, various occupant sizes, various<br />
seating positions, etc. It is anticipated that the more complex<br />
approach to occupant modeling will not, however,<br />
be a part of the initial research effort,<br />
ASSESSMENT OF RISK FACTORS<br />
The primary factors which are related to risk and are<br />
practical to control by vehicle designs are vehicle structures<br />
and occupant protection countermeasures. Since nu'<br />
Table F. Occupant spacing frequency distribution.<br />
X. (INCHES) F (0/6)<br />
6 3 4<br />
12 50<br />
r 8 8<br />
2 4 8<br />
X-=MINIMUM SPAcING BETWEEN OCCUPANT AND INTERIOR SURFACE<br />
F=FREAUENCY OF OCCURRENCE oF A GIVEN OCCUPANT SPACING
00<br />
s<br />
m<br />
70<br />
60<br />
s<br />
i0<br />
s<br />
20<br />
t0<br />
?675 3r)00<br />
Figure 5. 1985 passenger car weight distribution by sales.<br />
merous other studies have addressed occupant protection<br />
countermeasures in the vehicle <strong>int</strong>erior, this paper will<br />
concentrate on assessing factors relating to vehicle frontal<br />
structures for design optimization purposes. Assessment<br />
ofoccupant risk requires understanding ofgeneral effects<br />
on the occupant due to changed structural parameters.<br />
A simple occupant model will be employed.<br />
The direction for assessment of structures,/occupant<br />
response is to adequately predict trends of occupant protection<br />
by varying structural parameterri. For instance,<br />
predictions of occupant harm for unrestrained occupants<br />
will be based on the difference between the velocity of a<br />
free flying single mass object representing an occupant<br />
and the compartment velocity at the time the <strong>one</strong>-mass<br />
occupant contacts with <strong>int</strong>erior. Time of <strong>int</strong>erior contact<br />
is determined based on the difference between the <strong>int</strong>egration<br />
of the occupant velocity and the compartment<br />
F<br />
z<br />
0 L<br />
t(m ilm ,$fl)<br />
WEIGHT (LBsI<br />
Figure 6. NCSS passenger cer weight distribution.<br />
EXPERIMENTAL SAFEW VEHICLES<br />
150<br />
-<br />
velocity. Figure 5 shows the various occupant velocities<br />
which will be used to assess occupant harm. Likewise<br />
determination of contact speed is determined (if it occurs)<br />
for a restrained occupant as shown in Figure 6. Additionally,<br />
<strong>int</strong>rusion is considered very simply as a rigid<br />
coupling between the front bumper and the <strong>int</strong>ruding<br />
surface (dash, steering assembly, etc.). Therefore, when<br />
<strong>int</strong>rusion begins it is assumed the <strong>int</strong>ruding surface im'<br />
mediately undergoes the entire delta V of that crash event<br />
as shown by the theoretical representation ofthe <strong>int</strong>erior<br />
<strong>int</strong>ruding surface velocity profile in Figures 7 and L Furthermore<br />
it has been experimentally shown from crash<br />
te$t data that <strong>int</strong>rusion begins at approximately the time<br />
the crush reaches 8O7o of the value of the measured<br />
tr<br />
ni<br />
UNRESTHAINED OCCUPANT<br />
F777) SPACE BETWEEN OCCUPANT<br />
r4J AND INTERIOR SUFFACE<br />
--- VELOCITY OF INTEHIOR<br />
{INTfiUDING} SURFACE<br />
-._ VFLOCITY OF ONE.MASS<br />
OCCUPANT IVlODEL<br />
- VELOCITY OF VEHICLE COMPARTMENT<br />
Figure 7. Unrestrained occupant velocity-time relationships.<br />
RESTRAINED OCCUPANT<br />
u PANr AN o<br />
@ ,*^i+it.ot^tlUFENtcc<br />
Figure L Restrained occupent velocity-time relationships.
A - ro.o<br />
I<br />
=F{<br />
d -20.0<br />
4<br />
RABBIT TO CONCOFD @ 32 MPH FNONTAI.<br />
50.0 76.0<br />
TIME {MILLISECONDSI<br />
Figure 9. Acceleration time history for Rabbit from Rabbitto-Concord<br />
crash test and lrom analytical prediction'<br />
,<br />
distance between the engine and the front bumper' These<br />
distances on existing cars in the crash test data base may<br />
be obtained and as$essed relative to occupant safety'<br />
While these occupant injury relationships are simply<br />
conceived and are not expected to accurately predict crash<br />
protection potential of an individual vehicle in the fleet'<br />
it is expected that general "good" and "bad" structural<br />
characteristics (crash pulse, stiffness, engine placement)<br />
of individual vehicles and vehicle fleets can be identiflred'<br />
To produce the multitude of crash pulses that can be<br />
generated from various car-to-carr object, etc., collisions<br />
an analytical crash model was developed. This analytical<br />
tool is used to predict occupant compartment respon$e'<br />
By using this method, vehicle crush as well as time occurrence<br />
of crush is predicted. Therefore, all of the simplified<br />
occupant parameters as previously described can<br />
be defined. An example output is compared to actual<br />
crash data for a car-to-car collision in Figures 9 to 12.<br />
Note this shows the most difficult prediction in which<br />
two cars of incompatible structures collide head on' Particularly<br />
encouraging is the reasonable accuracy of the<br />
dynamic cru$h, see Figure 12, Compared parameters are<br />
presented in Table G. Note from Figures ll and 12,<br />
<strong>int</strong>rusion begins substantially befote the occupant would<br />
have contacted the <strong>int</strong>erior surface (without <strong>int</strong>rusion).<br />
Therefore, as can be seen by referring to previous Figure<br />
7, the occupant undergoes the total vehicle delta V as<br />
reported in the table.<br />
The basis of this crash analysis is a comparative method<br />
by which structural crushing forces generated in two-car<br />
crash tests are compared at each time increment of the<br />
crash event to determine how each car is crushing due<br />
to its lower force level and to predict the resulting crash<br />
SEfiION 5: TECHNICAL SESSIONS<br />
151<br />
f<br />
-180<br />
E<br />
i -zt.o<br />
AABBIT/CONCOFD OCCUPANT VELOCITY<br />
Figure 10. Velocity-time history of theoretical <strong>one</strong>-mass occupant,<br />
test vs. prediction.<br />
pulse. Part of the computational software assumes a constant<br />
force crush of the "weakef" car when its peak crush<br />
is reached. This plateau can be seen in Figure 9. Ad'<br />
justments are then made to the duration of impact to<br />
obtain a theoretical impulse,/momentum balance' Reftne'<br />
ment of this methodology is still ongoing to validate re'<br />
sults against crash data in all impact conditions' Also<br />
consideration is being given to the question of whether<br />
5<br />
- r8.o<br />
=<br />
{<br />
{<br />
THEOFEIICAL COi{TACT TIMES I, t'<br />
Figure 11. Rabbit unrestrained occupant spacing vs. contact<br />
time, test vs. prediction.<br />
,'<br />
,i:<br />
"fl<br />
,d<br />
1<br />
.d
RA88IT INTRUSION<br />
20'' AVAILABLE CRUSH SPACE<br />
BEFORE INTFUSION<br />
TIIVIE (MILLISECONDS)<br />
I, tI THEOflETICAL TIMES WHEN INTRUSION BEGINS<br />
Figure 12. Rabbit displacement-time history to predict <strong>int</strong>rusion,<br />
test vs. prediction.<br />
accelerometer generated force data can be used rather<br />
than currently used load cell data which have restricted<br />
availability.<br />
PARAMETER STUDIES AND<br />
OPTIMIZATION<br />
A methodology is currently being developed to account<br />
for all of the above parameters and predict their combined<br />
effect on occupant harm. The basis of this methodology<br />
was developed by Dr. A. C. Malliaris. A sample of the<br />
output generated was shown in Figure I. Results were<br />
encouraging from the initial exercise of the methodology,<br />
but several refinements are required to include "best"<br />
available input data as previously discussed.<br />
One of the major refinements to the model replaces<br />
empirically derived equation$ to predict occupant response<br />
and separate equations to predict crush and <strong>int</strong>rusion<br />
with the structural crash model as previously<br />
discussed.<br />
Other refinements to the accounting methodology will<br />
include the ability to analyze a nonhomogeneou$ fleet of<br />
varying stiffness and crash pulse shapes.<br />
As far as input refrnements, all input parameters are<br />
being validated and changed as necessary using latest and<br />
best available data. One of the major refrnements is in<br />
the area of structural data, which includes stiffness properties<br />
and crash pulse shapes. Other areas include weight,<br />
EXPEHIMENTAL SAFEW VEHICLES<br />
152<br />
crash velocity, and occupant injury data as previously<br />
discussed.<br />
EXPERIMENTAL APPROACH<br />
Once an ar,ulytical method successfully predicts trends<br />
for improved structural crash performance, an experimental<br />
technique needs to be developed to verify results<br />
of this prediction. Currently the accepted method of evaluating<br />
crashworthiness is by flat rigid barrier. While this<br />
method has proven valuable in advancing state-of-the art<br />
in crashworthiness, particularly with regards to restra<strong>int</strong><br />
development, it has d<strong>one</strong> very little to advance improvements<br />
in compatibility as evidenced by extreme variations<br />
in stiffness (Table A). Shortcomings in assessment of<br />
crashworthiness and compatibility using the flat rigid barrier<br />
are twofold. First of all the <strong>int</strong>rusion aspect of crashworthiness<br />
is not evaluated on a comparable scale. This<br />
assessment can be readily visualized when <strong>one</strong> considers<br />
that in barrier crash testing, <strong>int</strong>rusion is proportional only<br />
to kinetic energy, meaning <strong>int</strong>rusion could be just as severe<br />
for large and small cars alike. In the accident environment,<br />
however, it is recognized that <strong>int</strong>rusion is typically<br />
a greater problem for small car occupants. Also, accident<br />
data show greater <strong>int</strong>rusion than crash test data at comparable<br />
delta V's. This latter observation is due to the<br />
crash environment of usually less than full frontal engagement<br />
resulting in lower acceleration (force) and<br />
greater extent of crush. The second shortcoming of the<br />
rigid barrier is the assumption that actual objects crashed<br />
<strong>int</strong>o by a car will have the same force-crush properties<br />
as the car or will be non-yielding.<br />
This assumption, while reasonable if stiffness of the car<br />
is "average," may result in ineffective restra<strong>int</strong> designs if<br />
the structural properties of the car versus those of the<br />
fleet are not considered. Note that car-to-car force <strong>int</strong>er-<br />
Table G. Comparison of Flabbit data from Rabbit-to-Concord<br />
test and analysis.<br />
TEST<br />
DATA<br />
PEAK ACCELERATION 35gs<br />
VELOCITY CHANGE OF<br />
QF VEHICLE<br />
MAXIMUM CBUSH,<br />
RESIDUAL<br />
VELOCITY WHEN OCCUPANT<br />
HITS INTFUDING<br />
SUR FACE<br />
VELQCITY WHEN OCCUPANT<br />
HITS NON-INTRUDING<br />
SUBFACE<br />
SAI\4E AS AV<br />
ANALYTICAL<br />
slMULAToN<br />
34 s's<br />
42 MPH 4? MPH<br />
28 6 INCHES 28 INCHES<br />
42 MPH-<br />
(CALCULATED)<br />
35 MPH<br />
{CALCUI.ATED)<br />
42 MPH.<br />
38 MPH
T 3"<br />
I<br />
V<br />
DRIVEf, SFIT<br />
,fl<br />
BOX BEAM DIMENSIONS<br />
Figure 13. Seat positioning method used in detormable moving<br />
barrier testing.<br />
actions are emphasized here because only 4OVo of the AIS<br />
> 3 injuries are associated with fixed object collisions<br />
with a very small percentage of that number being a truly<br />
rigid, flat surface. The remaining 6O7o frontal AIS > 3<br />
injuries result from car-to-car collisions with a relatively<br />
large share, especirrlly the more severe crashes, associated<br />
with front-to-front collisions. Thus the largest percentage<br />
of accidents, in which peak accelerations approach the<br />
peak dynamic force capability of the structure (divided<br />
by the mass), are accidents involving reasonably symmetric<br />
front-to-front collisions.<br />
Therefore the crash environment initially chosen for<br />
experimental structure crashworthiness and compatibility<br />
evaluation. is <strong>one</strong> that creates maximum acceleration and<br />
maximum <strong>int</strong>rusion under a delta V environment which<br />
is inversely proportional to test car weight. Intrusion is<br />
SECTION 5: TECHNICAL SESSIONS<br />
DISTANCE AFT FROTI HISSCAT<br />
Tf,ACK FGITIOI{<br />
Table H. Dummy response using frontal deformable moving barrier.<br />
CAR<br />
CITATION<br />
VOLVO<br />
MARQUIS<br />
CONCORD<br />
CUTLASS<br />
RABBIT<br />
TEST<br />
TYPE<br />
DMB<br />
DMB<br />
DMB<br />
DMB<br />
DMB<br />
DMB<br />
Htc<br />
also <strong>int</strong>ended to be inversely proportional to structural<br />
stiffness of the test car, unlike the rigid barrier environment,<br />
in which <strong>int</strong>rusion is proportional to kinetic energy<br />
or energy dissipated by the cars structural collapse.<br />
The means of testing cars in this crash environment is<br />
performed with a deformable moving barrier. Incidentally,<br />
load cells are mounted behind the deforming ele'<br />
ment to enhance knowledge of the structural behavior of<br />
the test car. This barrier is constructed of aluminum<br />
h<strong>one</strong>ycomb and is the same barrier developed for side<br />
impact testing (5). It is designed to absorb energy roughly<br />
equivalent to that of a 16fi) pound car impacting a rigid<br />
barrier at 35 mph. The purpose of this design is to force<br />
larger cars to absorb more energy for compatibility assessment<br />
and <strong>int</strong>rusion assessment.<br />
Results of dummy response parameters using Part 572<br />
dummies are shown in Table H. To eliminate variability<br />
in these tests the restra<strong>int</strong>s were fixed at the "D" ring,<br />
thus eliminating restra<strong>int</strong> spool-out. Also for comparative<br />
analysis the seats were placed identically, as shown in<br />
Figure 13, to represent an <strong>int</strong>uitively average seating position.<br />
One more deformable barrier test is planned in the<br />
near future using a Fiat Strada. Analysis of the data has<br />
not been completed and will be presented at a later date.<br />
CONCLUSIONS<br />
This study is based on the premise that occupant risk<br />
is dependent notjust on the singular propefties ofa vehicle<br />
but rln the properties of the entire fleet. Research studies<br />
have shown that occupant response is indeed related to<br />
crash pulse shapes. It may also be rationalized that crash<br />
pulse shapes are dependent upon stiffness and on the<br />
combination of stiffness in car-to-car events. Therefore<br />
occupant response is also dependent on stiffness as it<br />
indirectly affects the crash pulse shape. Stiffness also affects<br />
the occupant harm environment directly by either<br />
preventing or allowing <strong>int</strong>rusion, particularly in oar-tocar<br />
collisions.<br />
NHTSA research will continue to quantify the effects<br />
CHEST G's<br />
3 MSEC<br />
FEMUH LOADS<br />
DRIVER PASSENGER<br />
DRIVERPASSENGERDRIVER PASSENGERLEFT RIGHTLEFT RIGHT<br />
483<br />
352<br />
313<br />
806<br />
1101<br />
?2ffi<br />
418<br />
361<br />
269<br />
523<br />
751<br />
707<br />
40<br />
29<br />
27<br />
58<br />
,18<br />
59<br />
153<br />
30<br />
35<br />
28<br />
38<br />
35<br />
39<br />
255<br />
500<br />
800<br />
1825<br />
520<br />
550<br />
750<br />
2000<br />
600<br />
1 100<br />
225<br />
400<br />
1700<br />
200<br />
600<br />
675<br />
1 585<br />
650<br />
300<br />
750<br />
600<br />
525<br />
1800<br />
400<br />
$<br />
1<br />
j:<br />
:,.<br />
ti<br />
,: :!<br />
,+ff<br />
fli!<br />
: i 5
of these and other parameters that affect occupant response.<br />
Finally, this research is <strong>int</strong>ended to identify the<br />
structural properties which are optimal for occupants protection<br />
in the real world environment. Initially the effoft<br />
will consist of a simplified analytical approach. Follow<br />
up studies may employ more sophisticated techniques<br />
such as the Fiat Methodology (6) or the Safety System<br />
Optimization Model.<br />
REFERENCES<br />
L Cohen, D.S., Jettner, E. and Smith, W.E., "Light Vehicle<br />
Frontal Impact Protection," SAE Paper No.<br />
820243, Warrendale, Pennsylvania, February, 1982.<br />
2. Dimasi, P., "Generic Crash Pulse Study and Preliminary<br />
Data on Characterization of Generically Similar<br />
Kinematic Response in X vs X Plane," (A Progress<br />
Report) Transportation Systems Center, September<br />
1982.<br />
RUNE ALMQVIST, HUGO MELLANDER,<br />
MAGNUS KOCH<br />
Volvo Automotive Safety Centre Volvo Car<br />
Corporation<br />
ABSTRACT<br />
Volvo's Safety Engineering Philosophy is described in<br />
detail starting with Volvo traffrc accident investigations<br />
as <strong>one</strong> of the most important inputs to the safety characteristics<br />
specified for a new Volvo car. How the safety<br />
characteristics are transformed to measurable properties<br />
in laboratory environment is then explained and exemplified.<br />
The car speciflrcation is further broken down to<br />
system and subsystem specifications suitable and<br />
understandable to the engineer at the drawing board.<br />
The engineering follow-up procedure, including<br />
Crashworthiness Design Review Meetings and at the end<br />
certification tests and production control tests, is discussed.<br />
How variations in test results affect the engineering<br />
procedure and methods to set engineering limits to be<br />
used during the different design phases are discussed.<br />
How this Safety Engineering Philosophy is implemented<br />
<strong>int</strong>o the development of a new Volvo car is then<br />
descnbed step by step and exemplified by different technical<br />
solutions and test results.<br />
EXPERIMENTAL SAFEW VEHICLES<br />
Frontal Crash Protection ln a Modern Car Concept<br />
154<br />
Segal, D.f. and Milter, P.M., "Methodology<br />
for Recommending<br />
Side Impact Moving Barrier Weight," October<br />
1979, Progress Report, MGA Report No. 69-<br />
003-v-l<br />
Jatras, K. and Carlson, W., *'Frequency Distributions<br />
of Passenger Cars by Weight and Wheelbase by State-<br />
July 7, 1976," Report No. DOT-HS-803-382, June<br />
1978.<br />
Davis, S. and Ragland, C., "Development of a Deformable<br />
Side Impact Moving Barrier," Eighth International<br />
Technical Conference on Experimental Safety<br />
Vehicles, October 1980, Wolfsburg, Germany.<br />
Shaw, L. M. and Ragland, C., "Application 4.<br />
6.<br />
of the Fiat<br />
Methodology for Characterizing Vehicle Structural<br />
Responses in Side Impacts" to be published in the<br />
proceedings of the N<strong>int</strong>h International Technical Conference<br />
on Experimental Safety Vehicles, November<br />
1982, Kyoto, Japan.<br />
INTRODUCTION<br />
With the Volvo Safety Engineering Philosophy as a<br />
background this paper describes how the crashworthiness<br />
characteristics at the very first beginning of a project are<br />
built <strong>int</strong>o a new car and how this is controlled through<br />
the total development programme.<br />
"<br />
;Fc''<br />
VOLVO SAFETY ENGINEERING<br />
PHILOSOPHY<br />
One of the primary characteristics of a Volvo car has<br />
for a long time been safety and with the safety characteristics<br />
Volvo has always meant safe transportation in<br />
the real trafftc environment.<br />
Volvo Safety Engineering Philosophy can be explained<br />
by a circle as in Figure 1.<br />
As safety in the traffrc environment is the primary goal,<br />
it is important to know the real performance of our cars<br />
in actual accidents.<br />
Accident Analysis<br />
Since 1965 Volvo has carried out traffrc accident re-<br />
search on Volvo cars and the knowledge from this research<br />
is used to set up our own safety requirements.<br />
Volvo's Traffic Accident Research consists of two main<br />
parts
mol|f{x'r.<br />
corfl*ril,<br />
BoSy<br />
SIRufIutr<br />
trriflaH<br />
T*,AFFld<br />
fru|Frffiil<br />
til!ilEtrafrr<br />
Acdtpftfr<br />
enery$lS<br />
$Y$r[m<br />
+{,iF.s4r+ilE'.<br />
cr{uRfiuxTs<br />
Figure 1. Volvo Safety Engineering Philosophy.<br />
-multidisciplinary accident investigations<br />
{ata collection and statistical analysis<br />
The multidisciplinary accident team is on call round<br />
the clock, seven days a week. All accidents with occupant<br />
injuries in a Volvo car, truck or bus are investigated. On<br />
the scene of the accident, the investigator looks for all<br />
information which can be of importance during his later<br />
analysis. This analysis consists of finding the cause of the<br />
accident and the consequences to the occupantg and the<br />
vehicle. The medical expert of Volvo's investigation team<br />
gets in touch with his colleagues at the hospital to which<br />
the injured persons have been taken. With the help of<br />
data from the vehicle and information concerning the<br />
sustained injuries, it is possible to relate the pattern of<br />
injuries to the type of impact which caused them.<br />
To get a material large enough to be used in a statistical<br />
analysis Volvo's unique insurance system has for a long<br />
time been used. All Volvo cars sold in Sweden are covered<br />
by a three-year motor vehicle damage warranty. This<br />
damage warranty is administrated by Volvo's insurance<br />
company. Through this motor vehicle warranty system<br />
Volvo has access to all data concerning the accidents.<br />
Each year, about 45,0(X) such accidents are reported to<br />
the warranty department. About 5,000 of the more seriously<br />
damaged vehicles are insp€cted by Volvo's staff<br />
of 12 damage as$es$ors who are placed throughout the<br />
country. The basic information for our statistical accident<br />
research comes from this group of serious accidents.<br />
Our own data in combination with data from different<br />
accident data files from all over the world are the basic<br />
background for setting our priorities.<br />
Laboratory Requirement<br />
The first step in the engineering procedure is to transform<br />
the accident scene to a controlled laboratory envi-<br />
SECTION 5: TECHNICAL SESSIONS<br />
fotrment. The complex acsident has to be transformed to<br />
a test which is repeatable and reproducible. Examples of<br />
these tests are frontal impacts <strong>int</strong>o a rigid barrier, movable<br />
deformable barrier for side collisions and rollover simulations.<br />
The occupants in the car have to be simulated with<br />
test dummies. These dummies are of course not in every<br />
detail copies of the human being but they are anthro'<br />
pometric and anthropomorphic. Dummies of different<br />
sizes are available (such as 5th percentile female, 50th<br />
percentile male, 95th percentile male and many different<br />
sizes of child dummies). Several different injury criteria<br />
are connected to the dummies, e.g., head injury criterion'<br />
chest injury criterion, femur injury criterion. These criteria<br />
have been found through biomechanical research.<br />
Within our function analysis staff Volvo has an expert in<br />
biomechanics who monitors this research in detail.<br />
Engineering Requirements<br />
Having the functional laboratory requirements on thc<br />
complete car is not enough. The car must be divided <strong>int</strong>o<br />
various systems and the system <strong>int</strong>o various subsystems.<br />
With this technique the complete car requirement for<br />
different collisions could be broken down <strong>int</strong>o a set of<br />
system and subsystem requirements which can be checked<br />
in laboratories and which are understandable to the draftmen<br />
and engineers.<br />
The requirements on systems and subsystems form the<br />
basis for our development technique within the safety<br />
engineering procedure. The two major systems are the<br />
body structure system and the <strong>int</strong>erior system, The body<br />
structure system covers the "body in white" and drive<br />
line (engine-transmission) and the <strong>int</strong>erior system covers<br />
all the <strong>int</strong>erior of the car such as instrument panel, steering<br />
wheel, seats and safety belts.<br />
The requirements for the structure system are built up<br />
around a measuring technique using barrier tests, "body<br />
tests" and comp<strong>one</strong>nt tests. During the entire development<br />
procedure analytical tools such as structural mass,/<br />
spring models and finite-element calculations are used to<br />
further optimize the mechanical engineering.<br />
Two very important requirements for the structural<br />
sy$tem are <strong>int</strong>rusion and deceleration characteristics in<br />
the different crash tests. The reason is that these characteristics<br />
form the inputs to the <strong>int</strong>erior system. The<br />
basic development technique for the <strong>int</strong>erior system is a<br />
crash simulator in which the <strong>int</strong>rusion and deceleration<br />
can be reproduced. In this way the development of the<br />
<strong>int</strong>erior is not depending on the possibilities to crashtest<br />
complete cars. As for the structure system the <strong>int</strong>erior<br />
system uses several subsystem tests and in parallel calculations<br />
in mathematical models are made.<br />
After a couple of loops between the structure and <strong>int</strong>erior<br />
engineering departments in which an optimization<br />
of performance, weight and cost is d<strong>one</strong>, the complete<br />
.I<br />
i.;<br />
,i<br />
.E<br />
1<br />
:l<br />
,'.J<br />
' t<br />
I<br />
E
EXPEHIMENTAL SAFETY VEHICLES<br />
sTnugfuRE +iviTht<br />
I+J PHA6E nd PrtAff 3rd PIIAEE<br />
wPwFslt)rh<br />
CofimilEilf<br />
{EsTr}ta<br />
,rrAIll.<br />
CArduu|Ttoil&<br />
FEPTUHWs<br />
tutr fFsrftld<br />
Cprr{roilErf<br />
t+'ffi,:u<br />
jl<br />
I lcAldrtArtol|s<br />
t l<br />
+l<br />
IrrfnrDn #nsffm<br />
ttrdWAse<br />
(ffi+<br />
il<br />
Jrv.ArltAT'o)r<br />
I PIIASE<br />
ffiE*'l<br />
I<br />
lsr AFFeor(,sLEtFust rrd.APq3,Dxwtsr 5rd 6y1FED1 l1tw4<br />
Wfrt StltrtffiOSl WW1JW EEo+t tW-OUt Fovl<br />
Svfilfirttawflt6flBll PEtrIU{WE td Pil}TEtJIE trEODutI/nlA<br />
tl'4f/f1.tA'(}.|tfrIiottt tt}4,rtr.dAttutATrof$$ dhlmffrtc<br />
Figure 2. Development cycle lor a new car.<br />
car is ready for the evaluation and certification phase. In<br />
this phase complete cars (try-out and preproduction cars)<br />
are tested with the speciflred test methods and controlled<br />
against the specified criteria. A few extra loops back to<br />
structure and <strong>int</strong>erior system may be ilecessary during<br />
the evaluation phase. Certification tests against legal requirements<br />
are then made, sometimes with representatives<br />
from the authorities witnessing the actual tests. Figure 2<br />
shows a typical development cycle for a new car.<br />
Production Control<br />
During the development many different types of documentation<br />
are produced to ensure the production quality.<br />
A special documentation system for Vital Safety Parts<br />
(VSP) is used to<br />
-guide product engineering, manufacturing and assembly<br />
in accordance with government requirements<br />
iemonstrate compliance with government requirements<br />
-limit the number of vehicles affected by recall action<br />
in case of non-compliance or safety defect<br />
-limit product liability exposure and demonstrate that<br />
due care has been exercised<br />
During production control many systems and subsystems<br />
(e.g. safety belts, windshields, seats, sunvisor) are<br />
tested and complete cars are taken as samples for crash<br />
tests.<br />
The circle (see Figure l) is closed and the new car is<br />
ready for the actual traffrc environment. The Volvo<br />
PIIASIE<br />
PFoprrdtlail dAFf mofir{toil<br />
STAKf<br />
Traffrc Accident Research can start its investigations to<br />
evaluate the safety performance ancl to gain more knowledge<br />
for further improvements.<br />
FRONTAL COLLISION PERFORMANCE<br />
FOR THE NEW VOLVO 760<br />
The above described engineering philosophy will now<br />
be repeated and the special considerations during the<br />
development of the new Volvo 760 will be accounted for.<br />
From all <strong>int</strong>ernational traffic accident statistics as well<br />
as our own (refs l, 2) it is obvious that frontal collisions<br />
are the type of collision with the highest number of accidents<br />
as well as the highest total cost for the society.<br />
This has since a long time been recognized by Volvo<br />
and since the early fifties Volvo has gradually <strong>int</strong>roduced<br />
different kinds of technical solutions to improve frontal<br />
crash protection (ref 3). When the work to specify a new<br />
Volvo for the eighties started, <strong>one</strong> of the highest priorities<br />
wa$ to engineer a car with outstanding performance in<br />
frontal collision.<br />
Test Method<br />
The first step in our safety engineering procedure was<br />
to transform the overall specifrcations to functional requirements<br />
measurable in laboratory environment. Different<br />
safety regulations have since a long time used<br />
impacts against fixed barriers as their test procedures. Of<br />
course these test procedures are very simple simulations
of actual accidents and must be combined with careful<br />
analysis by experienced test engineers as well as by accident<br />
investigators. To limit development cost it was<br />
nevertheless decided to u$e these procedures (impact<br />
against a fixed barrier 0', t 30) as the main laboratory<br />
te$ts as they must be used in the certification phase. It<br />
was decided to test at 35 mph.<br />
Test Dummies<br />
What type of dummies to use was the next decision to<br />
be taken. During the development of the Volvo 240,/260<br />
most of the tests were made with the Part 572 (50 percentile)<br />
male dummy. From our own experiences (ref 4)<br />
as well as others (ref 5) it is obvious that the total measurement<br />
chain with a dummy as "sensor" is a very complicated<br />
<strong>one</strong> and large variations in test results are to be<br />
expected. Careful analysis of test signals together with<br />
studies of the behaviour of the dummy during the test<br />
must be used to overcome the shortcomings of the<br />
dummy. As no other well documented dummies were<br />
available the Part 572 dummv was chosen.<br />
Injury Criteria<br />
The conventional measurements to be taken in the dummies<br />
are head and chest acceleration and femur forces.<br />
From these readings special injury criteria such as HIC,<br />
SI, Max Chest acceleration etc. can be derived.<br />
In spite of heavy criticism the criteria stipulated in<br />
FMVSS 208, namely HIC, peak chest acceleration (3 ms)<br />
and maximum femur forces, are frequently used.<br />
The protection levels of these criteria, HIC 1000, 60 g<br />
and 2250 lbf (10 kN) respectively have also been questi<strong>one</strong>d,<br />
in particular the level of the HIC value. Patrick<br />
et al. (ref 6) suggested in 1974 that HIC of 3000 was<br />
below the acceptable limit and Walfish et al. (ref 7) recommends<br />
a tolerance limit of 1500.<br />
To have consistency with all our previous experimental<br />
work it was nevertheless decided to use HIC 1000, chest<br />
acceleration 60 g and femur force l0 kN as protection<br />
levels.<br />
During later years the problem of detecting submarining<br />
or penetration of lap belt <strong>int</strong>o the abdomen has<br />
been focused. Our experience is that an optimal restra<strong>int</strong><br />
system is heavily depending on the performance of the<br />
seat. One way to evaluate this performance is to measurc<br />
submarining or submarininglike behaviour. Even if submarining<br />
is not a great problem in real life the benefits<br />
of a good suppoft from the seat cushion in experimental<br />
work have been documented by several authors (refs 8t0).<br />
Transducers on the iliac crest were therefore used in<br />
combination with high speed film analysis to evaluate the<br />
performance of the belt $ystem.<br />
SECTION 5: TECHNICAL SESSIONS<br />
Vehicle Related Criteria ,.<br />
Vehicle criteria were also set up, such as FMVSS 212<br />
Windshield Retention, FMVSS 219 Windshield Z<strong>one</strong> Intrusion,<br />
and FMVSS 301 Fuel System Integrity.<br />
ENGINEERING METHODOLOGY<br />
System and Subsystem Requirements<br />
Having the functional requirements on the complete<br />
car was not enough. The draftsman at the drawing table<br />
cannot design for example a front side member only<br />
knowing that certain injury criteria in a dummy should<br />
be below a specified level. The car must be divided <strong>int</strong>o<br />
various main systems and the main systems <strong>int</strong>o various<br />
subsystems. For the frontal collision two main systems<br />
are body structure system and <strong>int</strong>erior system (Figure 3).<br />
The body structure system covers the "body in white"<br />
and driveline and the <strong>int</strong>erior system covers all the <strong>int</strong>erior<br />
such as instrument panel, steering wheel, seats and safety<br />
belts.<br />
By using mathematical modelling technique, stnrctural<br />
mass/spring models, fltnite element calculations as well<br />
as different models of occupant simulations, the complete<br />
car functional requirements were broken down <strong>int</strong>o requirements<br />
for the two main systems.<br />
157<br />
Body Structure System<br />
The body structure system was specified for example<br />
by body deceleration curves for 0' and 30'barrier tests,<br />
<strong>int</strong>rusion limits for different parts of the body such as<br />
floor pan, instrument panel and steering wheel <strong>int</strong>rusion<br />
and vertical movement. These requirements formed an<br />
+TRudrlrtr livirf:M<br />
Rf QtJrtrllf:ntl?<br />
8f,lEfirre,+r,c+<br />
f l.tHl*lloil Rt
input to the body engineers for a further procedure broken<br />
down <strong>int</strong>o subsystem requirements.<br />
These systems and subsystems requirements were then<br />
controlled with test techniques such as comp<strong>one</strong>nt testing,<br />
subsystem testing, "body tests" and prototype tests. The<br />
"body<br />
test" is a technique used during early stages of<br />
development when no prototypes are available. By taking<br />
an existing car body and replacing specific parts in front<br />
of the A-pillar with prototype body concept$ early te$t<br />
results such as force,/deflection curves can be obtained.<br />
Our experiences from these body tests are that they are<br />
very useful both when different body concepts are to be<br />
evaluated as well as during the process of optimization<br />
between the structure design and material selection (ref<br />
I l).<br />
Interior System<br />
For the <strong>int</strong>erior system the barrier test requirements<br />
are broken down to a sled test deceleration curve (the<br />
same a$ the body deceleration curve) and <strong>int</strong>rusion limits<br />
for body and <strong>int</strong>erior parts such as the instrument panel<br />
and the steering wheei.<br />
These requirements are the inputs to the <strong>int</strong>erior engineering<br />
process which uses a HYGE crash simulation<br />
sled as an evaluation tool. From our early experiences of<br />
the use of the HYGE sled a good correlation between<br />
barrier tests and their simulations on the sled can be<br />
achieved at test speeds up to 30 mph (ref l2). Testing at<br />
higher velocities has however shown the need of further<br />
development of the simulation technique. Due to the<br />
higher test speed the body deceleration characteristics also<br />
in the vertical direction (pitch) and dynamic <strong>int</strong>rusions<br />
of body and <strong>int</strong>erior panel including the steering wheel<br />
play an important role for the results in the dummies.<br />
Different techniques are used (max <strong>int</strong>rusion, <strong>int</strong>rusion<br />
at contact between dummy and <strong>int</strong>erior, pitch simulations)<br />
but still much development has to be d<strong>one</strong> to get<br />
an optimal simulation at speeds higher than 30 mph. In<br />
the meantime careful evaluation of test results from sled<br />
tests and a detailed comparison with results from barrier<br />
te$ts must be d<strong>one</strong> during the development process. The<br />
importance of not being lost in these highly simplified<br />
simulations of actual traffic accident is obvious. For that<br />
reason our traffrc accident analysis experts are involved<br />
also in the test evaluation process to ensure that not only<br />
good test results but also good performance in accidents<br />
will be achieved.<br />
During both the structure and the <strong>int</strong>erior engineering<br />
process mathematical calculations are used to back up<br />
the engineering and test work. Mathematical calculations<br />
have proven to be very helpful in concept evaluations and<br />
parameter optimizations.<br />
The body structure and <strong>int</strong>erior sy$tems are developed<br />
in parallel during the early phases of a complete car<br />
project (see Figure 2). Several loops between the two<br />
EXPERIMENTAL SAFETY VEHICLES<br />
systems are d<strong>one</strong> in which performance, weight and cost<br />
are optimized. During the complete car evaluation phase<br />
tryout and preproduction cars are tested with specified<br />
test methods and controlled against specified criteria. A<br />
few extra loops back to the structure and <strong>int</strong>erior system$<br />
may be necessary.<br />
The number of complete cars crashed during the development<br />
of the Volvo 760 have been 50 and added to<br />
that around 70 body and comp<strong>one</strong>nt tests and 150 sled<br />
tests.<br />
Crashworthiness Design Review Meeting<br />
The safety characteristics influence more or less all the<br />
systems and subsystems in the car and consequently all<br />
departments in the organization have to be involved.<br />
Therefore a special steering committee meeting "Crashworthiness<br />
Design Review Meeting" was formed to control<br />
the implementation of the Volvo Safety Engineering<br />
Philosophy <strong>int</strong>o the design process.<br />
The responsibility to chair these meetings was given to<br />
the Crashworthiness Functional Analyst. The Functional<br />
Analyst is a person in the organization responsible for<br />
converting the crashworthiness characteristic$ set by the<br />
Product Planning Department <strong>int</strong>o Functional Requirements<br />
of the complete vehicle.<br />
In the case of crashworthiness the Functional Analyst<br />
is also responsible for the Volvo Automotive Safety Test<br />
Centre including Volvo Traffrc Accident Research which<br />
ensures that neither test re$ult nor actual traffrc accident<br />
results are neglected during the development process.<br />
The meetings have taken place every month and participants<br />
have been all of the managers in the line organization<br />
including representatives for Engine and<br />
Transmission Engineering, heads of different safety test<br />
departments, trafftc accident experts and also representatives<br />
from Legal Requirement and Product Liability<br />
department.<br />
The Crashworthiness Design Review Meeting was<br />
proven to be a very effective way to follow and control<br />
the development of the car safety characteristics during<br />
all stages of development. Optimization problems between<br />
different engineering areas have been possible to solve at<br />
the earliest possible time in the project.<br />
ENGINEERING LIMITS<br />
The various national and <strong>int</strong>ernational requirements on<br />
safety characteristics are usually expressed as a maximum<br />
limit that no cars are allowed to exceed.<br />
This implies that the average performance of the manufactured<br />
cars mu$t be engineered with a margin to the<br />
limits.<br />
The margin must include allowance for a number of<br />
factors. Some of these are<br />
-uncerta<strong>int</strong>y in the parameters that are used by the<br />
engineer in his work
-inaccuracies in the measurement techniques and data<br />
evaluation in the crash test<br />
-unrepeatability of nominally identical cra$h te$t executions<br />
iifference between prototype cars and production<br />
cars<br />
{iffrculties in making statistical inference from a<br />
small number of laboratory tests<br />
Note that a single test outcome above the limit does<br />
not imply that the actual car value is outside the limit.<br />
It might equally well have been random fluctuations in<br />
the laboratory test procedures that have given this result'<br />
A thorough treatment of the statistical consequences<br />
of some of these factors is given by Versace (ref 13). He<br />
has illustrated how the engineering limit can be related<br />
to the regulatory limit, by paying attention to all the above<br />
factors.<br />
As input during the early stages of a new car project<br />
experience data from crash tests ofprevious models, data<br />
from the accident research and predictions on future technologies<br />
are used. If there is a larger technological step,<br />
say for instance a proposed change from belt restra<strong>int</strong>s<br />
to airbag systems, due respect must be paid to the uncerta<strong>int</strong>y<br />
concerning the behaviour of the new system.<br />
Based upon this, requirements are formulated which require<br />
the first tests with the prototype to exhibit values<br />
well below a limit. As the development continues and the<br />
test data accumulates for the new concept, the <strong>conf</strong>idence<br />
increases in the soundness of the new product. This increased<br />
<strong>conf</strong>idence makes it possible to revise the requirements<br />
so that the average performance is closer to the<br />
requirement than first permitted, even while the risk of<br />
having <strong>one</strong> car exceeding the limit is kept low.<br />
It must be noted here that the requirement during<br />
development work is not, as some technicians may think,<br />
a more severe requirement than the requirement on the<br />
production cars. It is only an augmented and reformulated<br />
requirement on the engineers' work that must be achieved<br />
in order to get just the performance of the flrnal car that<br />
the customers expect and the regulations require (ref l4).<br />
TECHNICAL SOLUTIONS<br />
The overall dimension and weight requirements for the<br />
76O car were as such a challenge, The length from bumper<br />
to A-pillar was to be decreased some l0 cm as compared<br />
with the 240/260 car. The kerb weight should also be<br />
lowered some 50 kg. As a high crash performance was<br />
to be designed <strong>int</strong>o the 760 car these goals demanded a<br />
thorough optimization between structure and <strong>int</strong>erior engineering.<br />
Structure<br />
The 760 concept is a front engine, rear wheel drive,<br />
<strong>five</strong>-seat passenger car,<br />
SECTION 5: TECHNICAL SESSIONS<br />
159<br />
Figure 4. Structure design concept 760.<br />
To optimize the stiffness and weight relationship, member<br />
design, <strong>section</strong>al properties, welded jo<strong>int</strong>s and other<br />
jo<strong>int</strong>s have, for the monocoque body, been carefully cal'<br />
culated, analyzed and compared with experiences gained<br />
from previous designs (Figure 4).<br />
The front side members (Figure 5) are designed as<br />
closed <strong>section</strong>s and from the front and backwards they<br />
form a continuously increasing cross <strong>section</strong>. The side<br />
members run under the floor with an outward angle and<br />
are connected to the doorsills with a cross member in<br />
order to distribute forces.<br />
The front wheel housing and the suspension strut form<br />
together with the side member an <strong>int</strong>egrated structure<br />
welded to the compartment.<br />
The system is able to effectively absorb the kinetic<br />
energy in a frontal crash. The side members are at the<br />
front provided with "trigger swages" to initiate and control<br />
the buckling during deformation.<br />
The aim has been to construct a body which, despite<br />
a large body area, weighs less than its predecessor' High<br />
strength steel (HSLA) has therefore been used in the front<br />
<strong>section</strong> of the front side members and sheet metal thick'<br />
ness has in different parts ofthe body been varied in order<br />
to optimize strength and weight.<br />
lnterior<br />
The <strong>int</strong>erior restra<strong>int</strong> systems are engineered not only<br />
to meet the overall safety requirements but also to improve<br />
the systems performance in the following areas: belt com'<br />
fort, webbing guidance to eliminate problems with pi-<br />
Figure 5. Front member system.
voting webbing guides, seat cushion yieldingness for front<br />
and rear seats optimizing the balance of the forces acting<br />
on the restrained occupant in a crash.<br />
For the front seats a three-po<strong>int</strong> manual belt with lower<br />
anchorage po<strong>int</strong>s in the seat frame was chosen. The system<br />
incorporates <strong>one</strong> reel and webbing guide fully covered<br />
behind a panel. The webbing guide in the B'pillar is<br />
inclined "aligned" and bolted to the pillar hereby giving<br />
consistent performance in crash testing.<br />
The lower belt anchorages are located in the seat structure<br />
giving constant belt geometry of the lap belt independent<br />
of the seat position. The dynamic forces in a<br />
crash are transmitted through the rails which are engineered<br />
to withstand this extra loading.<br />
The seat structure shown in Figure 6 has e special tube<br />
under the frontal part of the cushion which limits the<br />
vertical movement of the occupant during a crash.<br />
To minimize steering wheel <strong>int</strong>rusion during a crash<br />
the system has at two locations a collapsible shaft, <strong>one</strong><br />
for bending moments and <strong>one</strong> for axial loadings, in combination<br />
with a, for rearward forces, strong mounting of<br />
the upper shaft bearing.<br />
Forces generated by chest impacts of unbelted occupants<br />
in a crash will be absorbed at a tolerable force level<br />
by deforming the steering wheel and the bracket for the<br />
upper shaft bearing.<br />
The steering wheel with its four spokes, padded rim<br />
and hub is designed to mitigate head and face injuries on<br />
belted occupants in case ofcontact with the steering wheel<br />
during a crash.<br />
The primary goal has been to keep the instrument panel<br />
away from the belted occupant during a crash. This has<br />
put special demands on the fire-wall and scuttle area as<br />
well as the attachments of the instrument panel.<br />
At the same time efforts have been made to design an<br />
instrument panel without protruding parts, projecting a<br />
"clean"<br />
surface towards the occupant.<br />
Sheet metal structure and padding characteristics have<br />
been combined to give tolerable forces if, in spite of all,<br />
a head contact would occur.<br />
The three-po<strong>int</strong> belt in the rear seat has the same fixed,<br />
EXPERIMENTAL SAFEW VEHICLES<br />
i."<br />
,:llit<br />
ffi<br />
.; ;il<br />
160<br />
inclined webbing guide as described above. The floor under<br />
the seat cushion has a special ridge which prevents<br />
excessive vertical movement and submarining during a<br />
crash. This design was built on the experience from the<br />
Volvo Concept Car (ref l2).<br />
All belt geometries have within the limits of existing<br />
regulations been elaborated to give good protection and<br />
comfort for occupants spanning from 5th female to 95th<br />
male percentile.<br />
TEST HESULTS<br />
During the complete development procedure (see Figure<br />
2) a lot of testing was d<strong>one</strong> at comp<strong>one</strong>nt, subsy$tem,<br />
system and complete car level.<br />
At the end of the development it was decided to run<br />
three identical frontal barier tests at 35 mph. The number<br />
of tests was chosen as a compromise between cost and<br />
the need to cover the repeatability and reproducibility<br />
problem. These three tests were run at MIRA (Motor<br />
Industry Research Association, England). They are identiflred<br />
by the numbers 227-229 in the following result<br />
presentation.<br />
For comparison two previous tests d<strong>one</strong> at the Volvo<br />
crash test laboratory are presented. The Volvo tests are<br />
taken from some early test series and the car$ are prototypes<br />
not completely identical with the MIRA cars.<br />
The test numbers arc 225 and 226. The test results are<br />
shown to illustrate the variation in test results during<br />
development.<br />
TEST PROCEDURES<br />
The tests were run according to the test procedure<br />
specified in FMVSS 208. Both MIRA and Volvo crash<br />
test laboratories have a long experience with this test<br />
procedure and fullflrll all instrument requirements including<br />
a well organized dummy calibration procedure. The<br />
main difference between the two laboratories is the propulsion<br />
sy$tem used. MIRA uses an electrical linear motor<br />
directly connected to the car and Volvo uses a tyristor<br />
controlled electrical rotational motor and an endless wire<br />
connected to the car.<br />
The test cars were Volvo 760 GLE with automatic<br />
transmission (see Figure 7).<br />
Test weight was as speciflred in FMVSS 208 (unloaded<br />
vehicle weight plus its rated cargo and luggage capacity<br />
weight plus two Part 572 dummies) which for the Volvo<br />
760 means 1630 kg (3590 lb).<br />
A total of 50 signals cover both the dummies and<br />
different car related measurements as well as a segmented<br />
force measuring barrier. The tests were covered by eight<br />
high speed cameras.<br />
The dummies were calibrated before every single test.<br />
Table I shows some test parameters.
Figure 7. The Volvo 760 GLE.<br />
Figure 8. Body deceleration pulse.<br />
Table 1. Test parameters.<br />
Test Weight<br />
kg<br />
Test Speed<br />
mph<br />
Test Temp<br />
"c<br />
'r SD : standard deviation defined es SD :<br />
:<br />
I<br />
:<br />
i<br />
I<br />
-/<br />
SECTION 5: TECHNICAL SESSIONS<br />
MIRA<br />
227<br />
1630<br />
35.3<br />
22.O<br />
Table 2. FMVSS 2'12,219 and 301 test results.<br />
Reoulation<br />
FMVSS 212<br />
o/o Retention<br />
FMVSS 219<br />
Penetration<br />
FMVSS 301<br />
Leakaoe oram<br />
MIRA<br />
227<br />
100<br />
OK<br />
0<br />
MIRA<br />
228<br />
1 630<br />
35.3<br />
22.O<br />
Structure Flelated Test Results<br />
8.<br />
A typical body deceleration pulse is shown in Figure<br />
A typical force,/deflection cuwe is shown in Figure 9.<br />
The following structure related regulations were<br />
checked: FMVSS 212 Windshield Retention, FMVSS 219<br />
Windshield Z<strong>one</strong> Intrusion and FMVSS 301 Fuel System<br />
Integrity.<br />
Table 2 shows results of the test.<br />
qILL<br />
III!TI: AJ6dT<br />
Figure 9. Dynamic Force/Deflection Curve during 35 mph<br />
barrier test.<br />
MIRA<br />
228<br />
100<br />
OK<br />
o<br />
MIRA<br />
229<br />
1630<br />
35.2<br />
22.O<br />
Mean<br />
Value SD')<br />
1630<br />
35.27<br />
22.0<br />
MIRA<br />
229<br />
100<br />
OK<br />
o<br />
0.0<br />
0.006<br />
0.0<br />
Volvo<br />
225<br />
100<br />
OK<br />
0<br />
Volvo<br />
225<br />
1630<br />
35.2<br />
1S<br />
Volvo<br />
226<br />
1 630<br />
35.4<br />
20<br />
Volvo<br />
226<br />
r00<br />
OK<br />
0
Interior Related Test Results<br />
The occupant crash protection was evaluated by measuring<br />
dummy signals as required in FMVSS 208.<br />
Chest Injury Criteria<br />
In Table 3 two chest injury criteria are shown.-Resultant<br />
chest acceleration duration longer than 3 rns, 83.,<br />
and Chest Severity Index, CSI, (weighted time <strong>int</strong>egral<br />
of chest resultant during crash).<br />
Head lniury Criteria<br />
Table 4 shows the Head Injury Criteria calculated as<br />
defined in FMVSS 208 (HIC) and also the same calculation<br />
but during head contact (HIC").<br />
Femur Injury Criteria<br />
In Table 5 femur injury criteria as defined in FMVSS<br />
208 are presented.<br />
Table 3. Dummy results{hest injury criteria.<br />
Chest Injury<br />
Criteria<br />
Driver<br />
9s-u<br />
csl<br />
Passenger<br />
9s."<br />
CSI<br />
EXPERIMENTAL SAFETY VEHICLES<br />
MIRA<br />
227<br />
46.4<br />
370<br />
41.6<br />
293<br />
Table 4. Dummy results-Head injury criteria.<br />
Head Injury<br />
Criteria<br />
Driver<br />
HIC<br />
Htc-<br />
Passenger<br />
Htc<br />
Htc^<br />
MIRA<br />
227<br />
945<br />
645<br />
729<br />
27<br />
Table 5. Dummy results-Femur injury criteria.<br />
Femur<br />
Force kN<br />
Driver<br />
F. (Left)<br />
F- (Rioht)<br />
Passenger<br />
F, (Left)<br />
F- (Rioht)<br />
MIRA<br />
227<br />
4.96<br />
0.61<br />
3.gl<br />
1.31<br />
MIHA<br />
228<br />
50.0<br />
427<br />
45.0<br />
311<br />
MIRA<br />
228<br />
897<br />
676<br />
890<br />
?09<br />
MIRA<br />
228<br />
4.74<br />
1.76<br />
5.52<br />
2.98<br />
162<br />
Seat Belt Loads<br />
Seat belt loads in the lap belt and shoulder belt were<br />
also measured<br />
and are listed in Table 6.<br />
30" Barrier Test Results<br />
Two tests were also d<strong>one</strong> to evaluate the 30'barrier<br />
performance. One test 30'right-first contact passenger<br />
side and <strong>one</strong> test 30'left-first contact driver side and<br />
both tests at a velocity of 35 mph.<br />
Requirements in FMVSS 212 Windshield Retention,<br />
FMVSS 219 Windshield Z<strong>one</strong> Intrusion and FMVSS 301<br />
Fuel System Integrity were all met.<br />
Dummy test results as for FMVSS 208 can be seen in<br />
Table 7.<br />
CONCLUSIONS<br />
This work has demonstrated that by <strong>int</strong>egrating the<br />
desired safety properties from the very beginning ofa new<br />
MIRA<br />
229<br />
47.O<br />
417<br />
45.0<br />
323<br />
MIRA<br />
229<br />
820<br />
820<br />
990<br />
87<br />
MIRA<br />
229<br />
4.24<br />
1.07<br />
3.36<br />
0.87<br />
Mean<br />
Value SD<br />
47.8<br />
405<br />
43.9<br />
306<br />
1.9<br />
30<br />
2.0<br />
21<br />
Mean<br />
Value SD<br />
821<br />
714<br />
870<br />
108<br />
124<br />
93<br />
132<br />
s3<br />
Mean<br />
Value SD<br />
4.65<br />
1.15<br />
4.26<br />
1.72<br />
o.37<br />
0.58<br />
1.12<br />
1.1 1<br />
Volvo<br />
225<br />
54.0<br />
455<br />
45.8<br />
345<br />
Volvo<br />
225<br />
898<br />
898<br />
1 030<br />
349<br />
Volvo<br />
225<br />
5.8<br />
2.O<br />
3.6<br />
1.0<br />
Volvo<br />
226<br />
45.2<br />
428<br />
41.4<br />
372<br />
Volvo<br />
226<br />
825<br />
825<br />
1 2S0<br />
686<br />
Volvo<br />
226<br />
4.4<br />
1.3<br />
3.1<br />
2.3
Table 6. Dummy results+sat belt loads.<br />
Belt load<br />
KN<br />
Driver<br />
Lap<br />
Shoulder<br />
Passenger<br />
Lap<br />
Shoulder<br />
Table 7. Dummy results-3O" barrier.<br />
Test Parameters<br />
Chest g.*<br />
csl<br />
Hrc<br />
Hlc"<br />
Femur Forcgs<br />
F. kN<br />
F" kN<br />
Belt Loads<br />
Lap kN<br />
Shoulder kN<br />
SECTION 5: TECHNICAL SESSIONS<br />
MIRA<br />
227<br />
6.3<br />
7.4<br />
7.3<br />
7.6<br />
MIFIA<br />
228<br />
7.9<br />
8.2<br />
7.0<br />
6.8<br />
car project and by continuously following up the engineering<br />
process it is possible to achieve an increased level<br />
of safety.<br />
It has po<strong>int</strong>ed out the inherent complexity of crash<br />
testing and the need to use statistical methods in order<br />
to make qualified judgments during a car development<br />
process.<br />
Emphasis has also been placed on the nece$sity to use<br />
experience from field accidents in order to complement<br />
the laboratory simulation.<br />
REFERENCES<br />
1. H. Norin et al. Injury reducing effect of seat belts on<br />
rear seat passengers. ESV-Conference Wolfsburg<br />
1980.<br />
2. Fatal Accident Reporting System 1979. United States<br />
Department of TransPortation.<br />
3. N. J. Bohlin. Refinements of Restra<strong>int</strong> System Design-A<br />
Primary Contribution to Seat Belt Effectiveness<br />
in $weden. International Symposium on<br />
Occupant Restra<strong>int</strong>. Toronto June 198 1.<br />
4. G. O'Connel, R. Almqvist. A Survey Concerning the<br />
Quality of Part 572 Hybrid II Dummies as measuring<br />
instruments for crash testing. SAE 770263.<br />
5. V. Seiffert, H. Leyer. Dynamic Dummy Behaviour<br />
under Different Temperature Influence. SAE 7608G+'<br />
6. L. M. Patrick, A. Andersson, N. J. Bohlin. Three-<br />
MIHA<br />
225<br />
7.5<br />
7.5<br />
7.9<br />
6.7<br />
Mean<br />
Value SD<br />
7.2<br />
7.7<br />
7.4<br />
7.0<br />
0.8<br />
0.4<br />
0.5<br />
0.5<br />
Volvo<br />
225<br />
7.O<br />
8.2<br />
7.4<br />
7.8<br />
Volvo<br />
226<br />
Velocitu: 36.5 mph Riqht: 36.2 mph Left Weight: 1630 kg'<br />
30'Risht/MIHA<br />
30'Left/MIHA<br />
Driver Passenger Driver Passenger<br />
35.0<br />
216<br />
418<br />
285<br />
3'1.0<br />
227<br />
5't7<br />
258<br />
47.O<br />
388<br />
762<br />
361<br />
44.0<br />
315<br />
570<br />
73<br />
3.2<br />
1.4<br />
1.4<br />
2.8<br />
5.9<br />
6.S<br />
163<br />
2.8<br />
2.4<br />
2.2<br />
5.1<br />
2.6<br />
4.2<br />
6.8<br />
0.8<br />
8.S<br />
7.6<br />
6.1<br />
7.7<br />
7.5<br />
7.7<br />
po<strong>int</strong> Harness Accident and Laboratory Data Comparison.<br />
lEth STAPP Car Crash Conference 1974.<br />
7. G. Walfisch ct al. Human Head Tolerance to Impact:<br />
Influence of the Jerk on the Occurrence of Brain<br />
Injuries. IRCOBI 1981.<br />
L. G. Svensson, Means for Effective lmprovement of<br />
the Three-Po<strong>int</strong> Seat Belt in Frontal Crashes. 22th<br />
STAPP Car Crash Conference 1978.<br />
9. D. Adomeit, H. Appel. Influence of Seat Design on<br />
the Kinematics and Loadings of the Belted Dummy.<br />
IRCOBI I979.<br />
10. B. Lundell et al. Safety Performance of a Rear Seat<br />
Belt System with Optimized Seat Cushion Design.<br />
SAE Passenger Car Meeting 1981, SAE 810796.<br />
ll. S. Runberger. Dynamic Test Method for Crash Testing<br />
of Front Structures. To be presented at Open<br />
University, Milton Keynes UK November 1982.<br />
12. H. Mellander, M. Koch. Restra<strong>int</strong> System Evalua'<br />
tion-A Comparison Between Barrier Crash Tests,<br />
SIed Tests and Computer Simulation. SAE Passenger<br />
Car Meeting 1978. SAE 780605.<br />
13. J. Versace. Safety Test Performance Level. 6th Ex'<br />
perimental Safety Vehicle Conference. Washington<br />
DC 1976.<br />
14.<br />
M. Koch, A. Nilsson-Ehle. Setting Realistic Design<br />
Limits in Vehicle Safety Development. To be pre'<br />
sented at the 1983 SAE International Congress and<br />
Exposition, Detroit February,/March 1983.<br />
.'l<br />
rI<br />
r,<br />
:.<br />
:,j<br />
.1<br />
r<br />
ii<br />
iii<br />
7
EXPERIMENTAL SAFETY VEHICLES<br />
Gomputer Modeling of Occupant Dynamics in Very<br />
Severe Frontal Crashes<br />
SHERMAN E. HENSON<br />
Ford Motor Company<br />
ABSTRACT<br />
36ey r<br />
Computer simulations of occupant dynamics in frontal<br />
crashes have pretty much been d<strong>one</strong> like sled tests, in<br />
that crash-induced deformation of the <strong>int</strong>erior-which<br />
may be signif,rcant for the occupant-has usually not been<br />
accounted for. The object of occupant dynamics simulation<br />
studies is often to as$ess the effect of changes in<br />
vehicle front-end parameter$ on occupant response. But<br />
these parameter variations may influence the amount of<br />
<strong>int</strong>erior deformation. In order to simulate more accurately<br />
occupant dynamics in very severe cra$hes, the <strong>int</strong>erior<br />
deformation caused by engine <strong>int</strong>rusion should concurrently<br />
be simulated. Crash test results over a range of<br />
speeds were used in a computer simulation study of occupant<br />
compartment <strong>int</strong>rusion in high speed barrier crash<br />
tests. It was found that <strong>int</strong>rusion has a significant effect<br />
on occupant response and where appropriate should be<br />
included in crash simulations. For the crash conditions<br />
simulated, <strong>int</strong>rusion increased the restrained occupant's<br />
head and chest accelerations while no clear trend emerged<br />
for the unrestrained occupant.<br />
INTRODUCTION<br />
This paper describes the use of a computer model to<br />
simulate dummy dynamics in very severe frontal car<br />
crashes
Figure 3. MVMA-ZD computer model.<br />
TIME=0 MSEC.<br />
To estimate the movement of the <strong>int</strong>nrding comp<strong>one</strong>nts<br />
<strong>int</strong>o the passenger compartment, films of crash tests run<br />
by the NHTSA on Chevrolet Citations at 35, 4O, and 48<br />
mph were analyzed. The availability of test data at these<br />
high speeds was the main reason for choosing the Citation<br />
for this simulation study. High speed film analysis was<br />
used to determine the relative engine movement as a<br />
function of time in these three crashes because the engine,<br />
in effect, forced the <strong>int</strong>ruding comp<strong>one</strong>nts rearward <strong>int</strong>o<br />
the passenger companment. Figure 4 shows the results<br />
of the film analysis, the average dynamic engine <strong>int</strong>rusion<br />
in inches as a function of time in milliseconds at the three<br />
speeds. The maximum <strong>int</strong>rusion varies from about 3 in.<br />
at 35 mph to about 22 in. at 48 mph and reaches the<br />
maximum at about 90 to 120 ms.<br />
Knowing the engine movement as a function of time,<br />
and the Chevrolet Citation <strong>int</strong>erior dimensions. the vehicle<br />
<strong>int</strong>erior deformation was estimated for these crashes.<br />
The maximum rearward movement of the windshield. Apillar,<br />
and upper instrument panel were gotten from postcrash<br />
vehicle photographs and from post-crash measurements<br />
included in the crash reports. The above compo-<br />
A YEHA GE<br />
oYHArlc<br />
EIGIHE<br />
ItlRusroi<br />
ItcHES<br />
T5<br />
?o<br />
l5<br />
to<br />
t<br />
I<br />
t<br />
o 50 roo<br />
T|HE __ |.|LL|SECoHOS<br />
r30 t00<br />
Figure 4. Average dynamic engine <strong>int</strong>rusion ys. time.<br />
SECTION 5: TECHNICAL SESSIONS<br />
165<br />
-50<br />
-40<br />
-30<br />
z<br />
(rNcHESl<br />
-20<br />
-10<br />
-to o to 20 30 40 50<br />
x {tNcHEs}<br />
Figure 5. Passenger side <strong>int</strong>erior deformation.<br />
nent$ were assumed to begin relative movement at the<br />
time when engine <strong>int</strong>rusion began and to reach maximum<br />
deformation at the time of maximum vehicle crush. Displacement<br />
of each comp<strong>one</strong>nt between these two times<br />
was assumed to increase linearly with time. It had to be<br />
assumed that the lower instrument panel, dash panel,<br />
steering wheel, and floor pan displacement-time relationships<br />
were identical to that of the engine <strong>int</strong>rusion since<br />
the data were not available from the test to e$tabli$h the<br />
<strong>int</strong>rusion precisely as a function of time and the area was<br />
hidden from the high speed camera coverage. It is recognized<br />
that the lower instrument panel rearward movement<br />
may not be identical to that of the engine, but the<br />
assumption was necessary in this ca$e and the error <strong>int</strong>roduced<br />
by this assumption is believed to be small. During<br />
model validation at 48 mph, the maximum rearward<br />
displacement of the steering wheel was adjusted $omewhat<br />
to improve simulation fidelity. Figure 5 shows an outline<br />
of the maximum deformation of the passenger-side windshield<br />
and instrument panel at the three speeds as well<br />
as the undeformed location. The windshield position at<br />
35 mph is the same as the undeformed position. A line<br />
drawing of the seat is shown for reference. Notice how<br />
the instrument panel and windshield move back and rotate<br />
as the crash speed is increased. Figure 6 shows the<br />
same thing for the driver side, except the steering wheel<br />
maximum deformation is included. As in Figure 5, the<br />
z<br />
lrHcHEsl<br />
-50<br />
-ao<br />
-30<br />
-20<br />
-ro<br />
-lo o to 20 30 rto 50<br />
x ltHcHEsl<br />
Figure 6. Driver side <strong>int</strong>erior deformation.<br />
,T<br />
'il<br />
i
HEAD<br />
G<br />
250<br />
200<br />
150<br />
100<br />
50<br />
TESr\<br />
EXPERIMENTAL SAFEW VEHICLES<br />
DRIVER PASSENGER<br />
| | /.slHULArlOH<br />
) {<br />
Figure 7. Model validation at 35 mph.<br />
iifl<br />
I<br />
I<br />
40 60 80 100 120 140 180<br />
TIME (MILLISECONDS)<br />
windshield is not deformed at 35 mph. The steering wheel<br />
position shown is the expected position without occupant<br />
loading. Figures 5 and 6 show the maximum deformation<br />
of the comp<strong>one</strong>nts, but for input <strong>int</strong>o the model, the<br />
positions as a function of time for not only these comp<strong>one</strong>nts<br />
but the floor pan and toe board were required.<br />
To get the comp<strong>one</strong>nt positions as a function of time,<br />
functional relationships for the movement of all of these<br />
comp<strong>one</strong>nts were derived from the test results and the<br />
functions were inputted <strong>int</strong>o the model as tables of surface<br />
displacement as a function of time.<br />
The MVMA-2D model was set up to represent a 5fth<br />
percentile male in a Citation package. The belt-restrained<br />
occupant is shown in Figure 3, but an unrestrained occupant<br />
was also simulated. Exercising these models is a<br />
very complex and time-consuming procedure, since<br />
hundreds of input variables are required to describe the<br />
occupant and vehicle <strong>int</strong>erior. For each ofthe panels that<br />
can be contacted by the occupant such as the windshield,<br />
instrument panel, and seat, force-deflection characteristics<br />
are inputted <strong>int</strong>o the model in either tabular or polynomial<br />
format. Belt restra<strong>int</strong> material properties have to<br />
be inputted as well as the acceleration-time pulse of the<br />
occupant compartment. Once all the input data were gathered<br />
and put <strong>int</strong>o the computer correctly, several runs<br />
were made and the results were compared to those of the<br />
Citation te$t$ to see if the model was a reasonable sim-<br />
166<br />
HEAD<br />
G<br />
CHEST<br />
G<br />
SIMULATION<br />
,r/<br />
TrilE (iilLLTSECONDS)<br />
t t<br />
I t -<br />
I llr'<br />
ulation of the event. The following <strong>section</strong> describes the<br />
model validation.<br />
VALIDATION<br />
Figure 7 shows a comparison of the dummy head and<br />
chest acceleration as a function of time for a driver and<br />
right front pa$senger in a 35 mph barrier crash. The solid<br />
lines are the test values from the Chevrolet Citation tests<br />
and the dashed lines are the simulation results. The results<br />
of the simulations compare reasonably to the test results<br />
especially when the large test-to-test variability ofbarrier<br />
crashes is considered. The same comparison at 40 mph<br />
is shown in Figure 8. The match again is reasonable except<br />
that, as in Figure 7, the peak head g's in the simulation<br />
occur somewhat later than in the test. The comparison<br />
at 48 mph in Figure 9 again shows that the simulation<br />
peaks occur later than the test.<br />
Although there is room for improvement in the simulation,<br />
overall, the results were considered acceptable<br />
for the pre$eflt study. Matching peak accelerations over<br />
the wide range of crash severity represented here proved<br />
to be more difficult than tuning a model to a single, less<br />
severe crash. The model predictions could not be compared<br />
to test results for the unrestrained occupant because<br />
a comparable set of tests has not been run.
100<br />
80<br />
€o<br />
CHEST<br />
G &<br />
20<br />
0<br />
DRIVER<br />
TEST*<br />
\<br />
["//'slrutAr*il<br />
lin<br />
I I .zr zSltULATlOt{<br />
20 & 00 80 100 120 lro 100<br />
TlrE (MlLLlsEcot{DS)<br />
Figure 8. Model validation at 40 mph.<br />
CHEST<br />
G<br />
SECTION 5: TECHNICAL SESSIONS<br />
CHE$T<br />
G<br />
PASSENGEH<br />
I<br />
,l<br />
tl<br />
t l<br />
, t<br />
,<br />
'<br />
,<br />
i/<br />
TrmE (HILLISECOHDS)<br />
DRIVER PASSENGER<br />
TIHE (mILLISECOHDS}<br />
Figure 9. Model validation at 48 mph.<br />
167<br />
HEAD<br />
G 100<br />
SITULATIOH<br />
^/<br />
I<br />
\ ^..<br />
TllrE (HrLLrsEcoHDsl<br />
r<br />
irf<br />
,,+<br />
fil<br />
.t<br />
,i<br />
1<br />
ili<br />
j<br />
qi:l<br />
i !<br />
'.<br />
,i<br />
;<br />
ri<br />
.,t:
400<br />
300<br />
3 lts<br />
HEAD 2OO<br />
G<br />
100<br />
o<br />
100<br />
3MS<br />
CHEST 50<br />
G<br />
o<br />
35 40 45<br />
V IMPHI<br />
Figure 10. Intrusion effects on re$trained passenger.<br />
PRELIMINARY RESULTS<br />
Figure 1 1. Intrusion effects on restrained passenger at 100<br />
milliseconds.<br />
EXPERIMENTAL SAFETY VEHICLE$<br />
iloo<br />
300<br />
3ts<br />
HEAD 2OO<br />
G<br />
100<br />
o<br />
too<br />
3ts<br />
CHEST 50<br />
G<br />
o<br />
35 40 45 50<br />
Y (rPH)<br />
IHTHUSIOH<br />
NO II{TFUSIOH<br />
IHTRUSIOT{<br />
Figure 12. Intrusion effects on restrained driver.<br />
HO IT{TRUSIOH<br />
Once the model was validated, computer runs were<br />
It can be seen in the upper figrres, the <strong>one</strong>s where <strong>int</strong>rusion<br />
was simulated, that the occupant strikes the instrument<br />
panel rnore forcefully as the crash speed is<br />
made to explore the effect of <strong>int</strong>rusion on dummy dy- increased because the instrument panel and floor pan are<br />
namics. This was d<strong>one</strong> by simply repeating the simula- moving closer to him. It was shown in Figure 4 that<br />
tions ofthe Citation barrier crash tests at the three speeds maximum engine <strong>int</strong>rusion occurs at about the same time,<br />
without the occupant compartment deformation. Figure 100 ms. In the lower set of flrgures, the case with no<br />
l0 shows the maximum head acceleration of the restrained <strong>int</strong>rusion, the occupant moves nearly the same distance<br />
right front dummy for the three crash speeds with <strong>int</strong>ru- forward even as speed increases and never hits the insion<br />
and with no <strong>int</strong>rusion. The dots on the graph are strument panel because the panel remains in the same<br />
the values from the Citation tests. It is apparent that relative position.<br />
eliminating the <strong>int</strong>rusion for the restrained occupant has The peak head and chest accelerations for the restrained<br />
little effect at 35 mph where the <strong>int</strong>rusion is small, but driver are shown in Figure 12. As in the case of the<br />
the effect increases with speed and the head acceleration restrained passenger, head and chest accelerations are<br />
is much larger at 48 mph. Without <strong>int</strong>rusion, the dummy lower when there is no <strong>int</strong>rusion. The apparent decrease<br />
responses are nearly constant as speed increases. The in head acceleration is an artifact due to the 3 ms cut-<br />
constant response occurs because at these large values of off; the absolute peak acceleration actually increases<br />
structural crush, the crush resistance is nearly constant slightly with speed.<br />
and so the vehicle average deceleration is nearly constant The restrained driver position f,t 100 ms is shown in<br />
over the range from 35 to 48 mph.<br />
Figure l3 for the simulations with <strong>int</strong>rusion and with no<br />
Figure I I shows the occupant kinematics for the same <strong>int</strong>rusion. It is again apparent from the flrgures that the<br />
simulations as Figure 10. The upper set shows the oc- occupant loads the <strong>int</strong>ruding comp<strong>one</strong>nts more forcefully<br />
cupant position at about the time of maximum forward when there is <strong>int</strong>rusion, resulting in higher head and chest<br />
movement, which is about 100 ms, for the three crash accelerations.<br />
speeds when <strong>int</strong>rusion was included in the simulations. While eliminating <strong>int</strong>rusion appears to be an attractive<br />
INTHUSION@<br />
NO<br />
INTFUSION<br />
@<br />
35 MPH 40 i,tPH<br />
168<br />
INTRUSION<br />
Ho ..1,0 '<br />
rNrnusroN<br />
,,1tj fq _<br />
,Fl-<br />
,r-<br />
Lj<br />
t*S' '<br />
, trri f', -<br />
s3i\<br />
f lc?<br />
, ) ,<br />
\'/dF\<br />
W<br />
,sfr#J<br />
ll8 MPH<br />
Figure 13. Intrusion effects on restrain€d driver at 100 milliseconds.
4()0<br />
300<br />
3HS<br />
HEAD 2OO<br />
G<br />
100<br />
o<br />
100<br />
3IS<br />
CHEST 50<br />
G<br />
o<br />
Figure 14. Intrusion effects on unrestrained passenger.<br />
way to reduce occupant Ioads for both driver and passenger,<br />
it is diflicult in practice. In order to eliminate<br />
<strong>int</strong>rusion in these very severe crashes, the front $tructure<br />
would have to be made either very stiff, or the front of<br />
the car would have to be made very long. If the structure<br />
were stiffened, the vehicle acceleration would increase and<br />
the occupant in the bottom set of pictures in Figures I I<br />
and 13 would move farther forward and probably strike<br />
the instrument panel like the occupant in the upper pictures<br />
where <strong>int</strong>rusion is included. lncreasing the length,<br />
on the other hand, of the front of the car by the large<br />
amount nece$$ary to eliminate <strong>int</strong>rusion in these very<br />
severe collisions would be impractical.<br />
Figure 14 is similar to Figure 10 except the results are<br />
for the unrestrained pas$enger. The unrestrained model<br />
is identical to the validated restrained model except the<br />
belts were removed. There is no clear difference between<br />
the simulations with <strong>int</strong>rusion and those with no <strong>int</strong>rusion<br />
either for head or chest accelerations. There is an <strong>int</strong>eresting<br />
effect, however, for the head acceleration in the<br />
case of <strong>int</strong>rusion. The head acceleration decreases somewhat<br />
as the crash speed increases. This is probably due<br />
to an effect known as ride-down, where the relative speed<br />
that the head contacts the windshield decreases at hisher<br />
INTRUSION<br />
NO<br />
INTRUSIQN<br />
, H<br />
\4<br />
35 MPt{<br />
, H<br />
\ry<br />
'l{t ilPll<br />
,-h<br />
\'ffi<br />
*,4<br />
SECTION 5: TECHNICAL SESSIONS<br />
\<br />
W48 MPH<br />
B<br />
!4J<br />
Figure 15. Intrusion etlects on unrestrained passenger at Figure 17.<br />
Intrusion effects on unrestrained driver at 100<br />
100 milliseconds.<br />
milliseconds.<br />
3rs<br />
HEAD<br />
G<br />
3n3<br />
CHEST<br />
G<br />
4()0<br />
300<br />
200<br />
100<br />
o<br />
2()0<br />
1()()<br />
o<br />
35 aO a5 50<br />
Y (TPHI<br />
Figure 16. lntrusion effects on unrestrained driver.<br />
impact speeds because the windshield is moving closer to<br />
the occupant.<br />
Figure 15 shows the kinernatics for the unrestrained<br />
occupant. Notice that the occupant kinematics <strong>conf</strong>irm<br />
the conclusion drawn from Figure 14, that there is very<br />
little difference in the unrestrained occupant response<br />
whether or not there is <strong>int</strong>rusion. The final occupant<br />
position in the simulations with <strong>int</strong>rusion shown in the<br />
upper figures looks almost like the bottom row of figures<br />
where no <strong>int</strong>rusion was included.<br />
The head and chest acceleration results for the unrestrained<br />
driver are shown in Figure 16. Head acceleration<br />
is somewhat lower for the case with no <strong>int</strong>rusion, but is<br />
quite high in both cases. There is little difference in chest<br />
acceleration for <strong>int</strong>rusion compared to no <strong>int</strong>rusion except<br />
in the extremely severe 48 mph collision where the simulated<br />
steering column bottoms out. The validity of the<br />
simulation in this region is not known since test results<br />
for unrestrained occupants were not available. The high<br />
chest acceleration is determined by the assumed forcedeflection<br />
characteristic of the steering sy$tem in the region<br />
beyond the normal collapse z<strong>one</strong>. Because forcedeflection<br />
characteristics for the steering column were not<br />
available under these severe conditions, the simulation<br />
\^<br />
rNrFUsroN<br />
, rds-<br />
, $ffi.J<br />
\--"t1-/ti<br />
35 MPH<br />
N o , H<br />
rNrRUsroN ,r<br />
4,]<br />
\ldl<br />
.O MPH {E MPH<br />
\ ,'+f,-<br />
\4'<br />
t<br />
I<br />
!<br />
l<br />
:'j<br />
,<br />
i
esults could be considerably in error. The kinematics of<br />
the unrestrained driver are shown in Figure 17.<br />
DISCUSSION AND CONCLUSIONS<br />
The results of the computer simulation study indicate<br />
that simulations, whether by mathematical model or by<br />
impact sled, of severe collisions should take <strong>int</strong>rusion <strong>int</strong>o<br />
account. Including <strong>int</strong>rusion is most important for the<br />
restrained occupant where <strong>int</strong>rusion may make the difference<br />
between contacting or not contacting the instrument<br />
panel or windshield, or where <strong>int</strong>rusion may have<br />
a large influence on the force generated by the contact.<br />
In all the restrained occupant simulations, the effect of<br />
<strong>int</strong>rusion was to increase occupant accel€ration. The effect<br />
of <strong>int</strong>rusion on the unrestrained dummy was not as clear<br />
as for the restrained dummy. In some cases <strong>int</strong>rusion<br />
reduced accelerations while in other simulations, accelerations<br />
were increased by <strong>int</strong>rusion,<br />
The results of the simulations discussed above should<br />
not be generalieed and applied to all accidents. Only a<br />
small fraction of frontal collisions were simulated in this<br />
study. Offset and angular collisions with other size occupants<br />
could produce different results. Also, while it is<br />
easy to eliminate <strong>int</strong>rusion in mathematical models, it is<br />
not so simple in practice. Using today's technology, major<br />
structural changes would be required (particularly for the<br />
higher speed crashes) which, even if possible, would<br />
greatly increase weight, cost, and fuel consumption and<br />
could adversely affect the safety of vehicles now on the<br />
road through increased aggressiveness in car-to'car collisions.<br />
A major challenge for the future is to determine<br />
through sy$tems analysis tradeoff studies, the optimal<br />
balance of vehicle structure characteristics.<br />
ACKNOWLEDGEMENT<br />
The simulations described in this paper were set up<br />
and run by John Dueweke. Matthew Huang developed<br />
EXPERIMENTAL SAFETY VEHICLES<br />
the program which created the computer graphics of the<br />
MVMA-2D occupant. Assistance and consultation by<br />
other MVMA-2D users at Ford is gratefully acknowledged.<br />
REFERENCES<br />
t. Bowman, B. M., Bennett, R. 0., and Robbins, D. H.,<br />
"MVMA<br />
Two-Dimensional Crash Victim Simulation,<br />
Version 4," Volume I (UM-HSRI-79-5-I) and Volume<br />
2 (UM-HSRI-79-5-2), Highway Safety Research Institute,<br />
The University of Michigan, June 29, 1979.<br />
Bowman, 8.M., Bennett, R. O., Robbins, D. H., and<br />
Becker, J. M., "MVMA Two-Dimensional Crash Victim<br />
Simulation, Version 4," Volume 3 (UM-HSRI-79-<br />
5-3), Highway Safety Research Institute, The University<br />
of Michigan, June 29, 1979.<br />
Levan, W. E., and Alianello, D. A., "New Car Assessment<br />
and Standards Effircement Indicant Tesh<br />
lhg-FMVSS Nos. 212, 219, and 301-75, General<br />
Motors Corporation 1980 Chevrolet Citation S-Door<br />
Hatchback, NHTSA 308-Tl-430," Report No. 6525-<br />
V-1, (39.93 Mph), Calspan Corporation, Buffalo, N.Y.,<br />
June 6. 1979.<br />
Levan, W. E., and Alianello, D. A., "New Car Assessment<br />
and Standards Enforcement Indicant Testrhg-FMVSS<br />
Nos. 212, 219, and 301-75, General<br />
Motors Corporation 1980 Chevrolet Citation 5-Door<br />
Hatchback, NHTSA 308-T2-431," Report No. 6525-<br />
V-2, (48.0 Mph), Calspan Corporation, Buffalo, N.Y.,<br />
June 7. 1979.<br />
Levan, W. E., arrd Alianello, D. A., "New z.<br />
3.<br />
4,<br />
Car Assessment<br />
and Standards Enforeement Indicant Testrzg-FMVSS<br />
Nos. 212, 219, and 301-75, General<br />
Motors Corporation 1980 Chevrolet Citation S-Door<br />
Hatchback, NHTSA 308-T3-432," Report No. 6525-<br />
V-3, (35.0 Mph), Calspan Corporation, Buffalo, N.Y.,<br />
June 12, 1979.<br />
Possible Future Trends Towards Increasing Occupant Protection in<br />
Frontal lmpacts<br />
G. JONES<br />
Austin Rover Group Ltd.<br />
ABSTRACT<br />
,5#<br />
Over the past decade or so of ESV/RSV activity it has<br />
been a priority to improve occupant protection in frontal<br />
impacts and there is evidently a need to continue research<br />
170<br />
towards establishing maximum protection in this mode<br />
of impact.<br />
In the ESV program we have seen developments aimed<br />
at making larger heavier car$ more accommodating to<br />
the smaller lightweight cars in collision situations. We<br />
have also seen that there are big problems in reducing<br />
the aggressiveness of the larger heavier vehicles.<br />
Future developments, particularly for lightweight cars,<br />
may therefore have to be based on the assumption that
it is not alwayt possible to achieve the ideal of little or<br />
no <strong>int</strong>rusion matched to a restra<strong>int</strong> systern which ideally<br />
attenuates the vehicle deceleration.<br />
In these circumstances there appears to be considerable<br />
merit in the concept that the occupant be held much more<br />
rigidly in the seating position by seat belts considerably<br />
stiffer than those curretrtly used.<br />
Recent tests using a typical 30 mph barrier crash pulse<br />
show that reduced injury levels and much reduced forward<br />
displacement to avoid or reduce the effects of secondary<br />
impact, are obtained when adopting this concept'<br />
With a more $evere pulse the latter advantages are<br />
retained and injury levels, though higher, are still below<br />
accepted tolerable levels.<br />
Bearing in mind the fact that a high proportion of<br />
frontal impacts are assymetric, producing relatively lower<br />
deceleration values but with more <strong>int</strong>rusion, the overall<br />
trade-off would appear to favour the system with reduced<br />
forward displacement.<br />
INTRODUCTION<br />
This paper conceflls an investigation <strong>int</strong>o the possibility<br />
ofobtaining increased protection from seat belts in frontal<br />
impacts.<br />
It is well known that belts as currently provided, and<br />
when correctly worn, do enable occupants to survive impacts<br />
of much greater severity than would be so if the<br />
occupants were unrestrained. Howeyer, there is evidently<br />
a need to continue the search for further improvements<br />
in restra<strong>int</strong> system performance particularly in view of<br />
the fact that initiatives towards producing a degree of<br />
conrpatibility between large and small vehicles in frontal<br />
impacts has proved to be much less fruitful than was<br />
expected at the start of the ESV program.<br />
Accident data show that in some impacts the most<br />
serious injuries are a$ a result of the occupant striking<br />
forward <strong>int</strong>erior comp<strong>one</strong>nts such as the steering wheel<br />
or facia partly because the restra<strong>int</strong> itself can allow considerable<br />
forward displacement and partly because of <strong>int</strong>rusion.<br />
These injuries are generally more severe than those<br />
produced by the belts themselves.<br />
The tests described in this paper were therefore carried<br />
out to determine the effect of having a restra<strong>int</strong> system<br />
which very much reduced the forward displacement of<br />
the occupan<br />
ACCIDENT DATA<br />
The most recent data which indicate the general effectiveness<br />
of seat belts in the United Kingdom have been<br />
provided by the Transport and Road Research Laboratory<br />
and by the University of Birmingham Accident Research<br />
Unit.<br />
SECTION 5: TECHNICAL SESS|ONS<br />
171<br />
One of the conclusions in e TRRL report by Hobbs<br />
(l) was that a seat belt wearing rate of 1007o would give<br />
an estimated further saving of over 12,000 fatal and se'<br />
rious casualties per year. If only 857o wearing rate were<br />
achieved, which is a more realistic figure, the potential<br />
further saving would be 9,000. An estimate by the University<br />
of Birmingham Accident Research Unit, based on<br />
detailed studies of fatal accidents (2) suggests that in the<br />
United Kingdom about 8fi) people each year die needlessly<br />
in their cars simply because they do not use the<br />
seat belts available to them. These people represent l27d<br />
of all road accident fatalities, because car occupant fatalities<br />
comprise only about <strong>one</strong>-third of the total road<br />
deaths.<br />
Note that the overall average seat belt wearing rate in<br />
Britain during the period covered by these statements has<br />
been about 307o.<br />
Frontal impacts, even for those wearing seat belts, do<br />
however present the greatest risk ofserious injury though<br />
this risk is much lower than for those not wearing belts.<br />
One of the TRRL findings was that where injuries due<br />
to direct seat b€lt loading occurred they were mainly of<br />
minor severity.<br />
It was also reported that the head was the most commonly<br />
injured region of the body and, because of the<br />
presence of the steering wheel, there were more drivers<br />
with serious injures (A153-6) than there were front seat<br />
passengers within the same injury range.<br />
However, the difference wa$ not statistically significant'<br />
Similar general statements on the TRRL findings were<br />
reported by Hobbs in a more recent paper (3).<br />
In-depth investigations have also been carried out by<br />
the University of Birmingham Accident Research Unit<br />
and findings (4) were similar to those of the TRRL with<br />
regard to belted drivers suffering more severe head injuries<br />
than belted front seat passengers in frontal impacts.<br />
Using the University of Birmingham data it is calculated<br />
that for injuries A153-6 the difference between drivers<br />
and front seat passengers was not statistically<br />
significant in this study also. When moderate injuries are<br />
included so that the range is 4152-6 the difference, as<br />
reported, is statistically significant.<br />
For drivers, the head and face was the most frequently<br />
injued body area, followed by the legs and the chest. For<br />
front seat passengers the head and face was the most<br />
frequently injured body area but its importance was much<br />
reduced compared with drivers and the chest was almost<br />
as important followed by the legs.<br />
As would be expected, head or facial contacts wcre<br />
much more frequent where there was headspace <strong>int</strong>rusion,<br />
there being severe head space <strong>int</strong>rusion in accidents involving<br />
under-run and significant <strong>int</strong>rusion compromising<br />
belt performance in partial overlap impact <strong>conf</strong>igurations'<br />
Although chest injuries were almost as important as<br />
head and face injuries for front seat pas$engers, it is noted<br />
that in the absence of <strong>int</strong>rusion and additional loading
from rear seat passengers, or luggage, no occupant sustained<br />
a chest injury more severe than AIS3, that is they<br />
were non-life-threatening.<br />
A later publication by the University of Birmingham<br />
Accident Research Unit (5) deals specifically with steering<br />
wheel induced head injuries amongst drivers restrained<br />
by seat belts and a paper by Mackay (6) has emphasised<br />
the fact that injury producing contacts with the steering<br />
wheel and other forward comp<strong>one</strong>nts are subjects for<br />
further investigation in the search for better protection<br />
in frontal impacts.<br />
BASIC CONCEPTS AND PRACTICAL<br />
REALITIES<br />
One currently popular concept for obtaining increased<br />
occupant protection is to assume that there is little significant<br />
<strong>int</strong>rusion <strong>int</strong>o the pas$enger compartment and to<br />
provide a restra<strong>int</strong> system which attenuates the vehicle<br />
deceleration to produce minimum forces on the occupant.<br />
Such a concept relies on inelastic deformation of the restra<strong>int</strong><br />
system and use of all available space.<br />
In cases where <strong>int</strong>rusion is small it is natural to endeavour<br />
to produce the ideal by allowing the restra<strong>int</strong><br />
system to make full use of the forward displacement available<br />
before the occupant contacts the facia or steering<br />
wheel, etc.<br />
However, current safety belt systems are not suffrciently<br />
inelastic or in other words the displacement is not sufficiently<br />
plastic as to produce attenuation. In fact there<br />
is usually a degree of magnification as associated with<br />
the performance of a damped elastic $ystem.<br />
Whilst this may indicate that future developments towards<br />
providing a more plastic restra<strong>int</strong> system deformation<br />
would be beneficial, freld experience shows that<br />
there is little <strong>int</strong>rusion only in a limited propoftion of<br />
real crash events.<br />
Therefore good energy absorption qualitieo need to be<br />
linked to the practical limitations of available space when<br />
<strong>int</strong>rusion occurs.<br />
An alternative concept, based on acceptance ofthe fact<br />
that considerable <strong>int</strong>rusion does occur in a proportion of<br />
the more severe frontal impacts, is to restrain the occupant<br />
so that he or she experiences little displacement within<br />
the passenger compartment and is subject to substantially<br />
the same deceleration pulse as the vehicle itself, virtually<br />
all ofthe energy-absorption being exterior to the occupant<br />
compartment.<br />
In theory even when there is no <strong>int</strong>rusion the occupant<br />
should at least be better off than with an elastic restra<strong>int</strong><br />
system in that there should be no magnification of deceleration.<br />
The Battelle Memorial Institute proposed such a system<br />
a$ a near-term recommendation in their 1970 report 'The<br />
Evaluation of Phase I Reports on the Experimental Safety<br />
EXPERIMENTAL SAFEW VEHICLES<br />
172<br />
Vehicle Program' (7Fthe recommendation being based<br />
mainly on reducing occupant mass sensitivity problems<br />
associated with elastic restra<strong>int</strong> systems, and concerned<br />
with vehicles in which there would be little <strong>int</strong>rusion.<br />
In the context of the present study there are obvious<br />
advantages when considerable <strong>int</strong>rusion occurs.<br />
TEST PROGRAMME<br />
To obtain some facts related to this concept a series of<br />
tests was carried out on the 'Hyge' sled at the Motor<br />
Industry Research Association. These were to compare<br />
the performance of a typical inertia reel belt system with<br />
a belt system broadly in accordance with the Battelle<br />
recommendations, i.e., an elongation rate l0 to 20 percent<br />
of current belts under comparable loading.<br />
This stiffer belt system consisted of a laminate of four<br />
thicknesses of current webbing for the lap and diagonal<br />
<strong>section</strong>, and for test purposes it was a static system with<br />
the shoulder belt terminating the 'B' post anchorage, to<br />
also minimise the effective belt length.<br />
We estimate that at comparable loading the elongation<br />
of this system was in the order of 5 to l0 percent of that<br />
for the inertia reel system.<br />
FIRST TEST SERIES<br />
Figure I shows the 'Hyge' pulse used for the initial<br />
series of tests,-it is similar to the crash signatures from<br />
some medium size UK cars subjected to 30 mph barrier<br />
tests.<br />
In this initial series of tests the Part 572 manikin was<br />
installed on the sled in a rigid seat as normally used for<br />
ECE 16 type seat belt tests.<br />
Comparative forward displacements and injury criteria<br />
for the Part 572 manikin are shown in Table 1.<br />
With standard inertia reel belts the mean maximum<br />
forward displacement of the head was 460 mm and with<br />
the stiff belts the figure was 300 mm.<br />
The mean chest 'g' value exceeded for a cumulative<br />
o to 20 30 40 50 60 70 80 90 too<br />
Figure 1. 'HYGE'<br />
test pulse,first series of tests.
Table 1. Results from part 572 manikin'first seriss'<br />
Mirn Trrt<br />
lhlurycdtffir EtmdTdanrrth SF*idrtlffb.'lt<br />
rul balt ryrird<br />
Mrrimum lrilrrd Olrphcrmrnt<br />
ol Ha.d-mm<br />
Gh[t'G' Ercildrd fo: Gumuhtiv.<br />
3 mllllrGondr<br />
Chft P..k nrtultmt<br />
D*.tffittofi'c'<br />
Hmd Inlury<br />
Critaril<br />
H.d'g'Exc..drdforcufruhdv.<br />
3frlllhH.rll<br />
H.rrl F.rI F.rult|rt<br />
Dstl.r.tlon'c'<br />
SECTION 5: TECHNICAL SESSIONS<br />
4o'o 36'0<br />
66.{1 4Z,O<br />
6t'6 EO'o<br />
3 m sec period was 36.2 for the standard inertia reel belt<br />
system and 32.6 with the stiff belt system.<br />
Although many regard measured head injury criteria<br />
as being of no consequence when there is no contact<br />
between the head and any vehicle comp<strong>one</strong>nt, it is of<br />
<strong>int</strong>erest to note that in these tests, in which there were<br />
no comp<strong>one</strong>nts to contact, the mean HIC was 635 with<br />
the standard belts and 424 with the stiff belt system.<br />
It will be noted that with the stiff belt system the<br />
maximum forward displacement-that is, at the headis<br />
approximately 65 p€rcent of that which occurs with<br />
the standard belt system and at the same time the numerical<br />
injury values are less.<br />
A further po<strong>int</strong> noted was the tendency for the torso<br />
of the manikin to roll out of the diagonal <strong>section</strong> of the<br />
standard inertia reel belts.<br />
This tendency was less evident with the stifr belts.<br />
SECOND TEST SERIES<br />
A further series of test$ was carried out using a 'Hyge'<br />
pulse which lies within the ECE 16 envelope and which<br />
is shown in Figure 2.<br />
This series of tests was carried out to determine the<br />
effect of using a differently shaped pulse, i.e., <strong>one</strong> having<br />
a more rapid build-up to peak 'g'.<br />
As in the initial test series the ECE 16 seat and the<br />
Part 572 manikin were used.<br />
tlrHnLaaaarda<br />
Figure 2. 'HYGE'<br />
test pulse-second series of tests.<br />
173<br />
Figure 3. Shoulder anchorage po<strong>int</strong> positions.<br />
For this further series of tests the shoulder anchorage<br />
po<strong>int</strong> was also raised in an endeavour to reduce the torso<br />
roll-out which had occurred particularly when standard<br />
inertia reel belts were used in the initial series. The respective<br />
anchorage po<strong>int</strong>s are shown in Figure 3.<br />
The raised anchorage po<strong>int</strong> still complies with the requirements<br />
of Regulation ECE 14 but the belt fit was<br />
more suited to the Part 572 manikin and there was no<br />
tendency to roll out.<br />
Figure 4 shows comparative forward displacements of<br />
the manikin.<br />
In this case with standard inertia reel belts the maximum<br />
forward displacement of the head was 530 mm and<br />
with the stiffbelts the figure was 310 mm, i.e., less than<br />
60 percent of the amount with standard belts.<br />
Table 2 shows forward displacements relative to the<br />
ECE regulation requirements, this time at chest level.<br />
Head displacement is also shown frrr comparison.<br />
Compared with the ECE 16 range of between 100 and<br />
300 mm, measurements at chest level were 310 and 135<br />
mm respectively for standard inertia reel and stiff belt<br />
system.<br />
-<br />
It#leritionrt@mm'ffit<br />
Marlmum lwrad arcu.rion-<br />
Emariffiv t*ll4 r*l blt<br />
Hrrimum toilrrd.xcurrlu-<br />
6tiff rtrtic rxt blt<br />
Figure 4. Forward movement of manikin restrained by emergency<br />
locking reel belt and by stiff static seat belt.<br />
t<br />
\.<br />
I t t<br />
+:l<br />
,: i<br />
':ri
Table 2. Fonrvard displacement of manikin-second series.<br />
Hr.d<br />
lxrdffit<br />
tb.s l.twrft<br />
Dl|Irffit lOOa 3OO<br />
trrh,|r Ltffi<br />
ol|Iilffit aor 2OO<br />
ilrrt|rtlildt|<br />
EGE tt tirndrrde*rdr lFd.lrnfib.lt<br />
iaq|dffit rtlLlt tyrtafr<br />
It is of <strong>int</strong>erest to note that although the Part J72<br />
manikin is quite different from that used in testing belts<br />
to Regulation ECE 16 the forward displacements with<br />
standard reel belts are in the region of the higher ECE<br />
16 values whereas with stiffbelts they are near the lower<br />
values.<br />
The comparative mean measured injury values from<br />
the Part 572 manikin are shown in Table 3. In this test<br />
series the mean chest 'g' value exceeded for a cumulative<br />
3 m sec period was 44.5 for the standard reel belt system<br />
and 54.3 for the stiff system.<br />
Comparable peak resultant chest values were 48.8 and<br />
59.6 'g' respectively.<br />
Note that whereas in the initial series of teste the values<br />
for the stiff system were lower, the values in this second<br />
series are higher.<br />
However the results from these tests, using a pulse<br />
which some regard as being excessively severe, do show<br />
that even the peak resultant chest value does not exceed<br />
the 60 'g' which is accepted as being tolerable for a cumulative<br />
period of no more than 3 m sec.<br />
With regard to head injuries it may again be po<strong>int</strong>ed<br />
out that the quoted values may be of no consequence in<br />
the absence of head contact.<br />
Even if they were considered to be of consequence the<br />
slightly higher results from the stiff belt system are not<br />
sienificant.<br />
Table 3. Results from part 572 manikin-second series.<br />
hlury C.ltirlr<br />
Chart 'G' Ercmdrd for Cumuhtivr<br />
3millirHndt<br />
Ch6rt F.rk F.fult|frt<br />
Dccrbntbn'B'<br />
Hild Inlil?y<br />
Crlt dr<br />
Hmd'G' Excmdrd for Cumulrtir "<br />
J mflltftom3<br />
H[d Frdr n rultrnt<br />
Dft.t.iltion'G'<br />
Mfrn T.rt fi.rcltr<br />
EXPERIMENTAL SAFETY VEHICLES<br />
ttE<br />
$trnd.rd in.rtir Spchl ftFl balt<br />
rul b.lt ryrtam<br />
44.5<br />
84.3<br />
60.2 63.i<br />
62'2 66-1<br />
174<br />
CONCLUSIONS<br />
The results of the tests indicate that the forward movement<br />
of the occupant in an impact can be significantly<br />
reduced by the use of seat belts which at a comparable<br />
loading have much less elongation than current reel belt<br />
systems. This is particularly significant in the case of the<br />
driver whose $pace available for forward movement is<br />
limited by the steering wheel and also when in more severe<br />
impacts there is <strong>int</strong>rusion <strong>int</strong>o the passenger compartment.<br />
Though there is some trade-off in chest injury when<br />
the more severe test pulse is used, it must be noted that<br />
no special attention was paid to damping propertie$ and<br />
it is possible that an increased amount would be an advantage.<br />
Belt tensioning and webbing clamping devices are<br />
known developments towards the objective of reducing<br />
forward movement of the occupant. Low elongation webbing<br />
of minimum length, possibly in combination with a<br />
suitably developed webbing clamping system may be the<br />
most practical means of producing further improvements<br />
in reel belt systems. Any future developments along these<br />
lines must however run in parallel with developments<br />
towards providing maximum possible levels of comfort<br />
and convenience.<br />
ACKNOWLEDGEMENTS<br />
The writer would like to thank colleagues in the Austin<br />
Rover Group of BL Cars for assistance in preparing this<br />
Paper.<br />
Management are also thanked for permission to publish<br />
this paper.<br />
REFERENCES<br />
l. Hobbs C. A. The Effectiveness of Seat Belts in Reducing<br />
Injuries to Car Occupants. Department of<br />
Transport TRRL Report LR8ll. Crowthorne, 1978<br />
(Transport and Road Research Laboratory).<br />
2. Mackay G. M. University of Birmingham Accident<br />
Research Unit-Press Statement, May 1981.<br />
3. Hobbs C. A. Car Occupant Injury Patterns and Mechanisms.<br />
Transport and Road Research Laboratory.<br />
Crowthorne, paper at Eighth International Technical<br />
Conference on Experimental Safety Vehicles-Wolfsburg,<br />
1980.<br />
4. Rattenbury S. J. et al.: The Biomechanical Limits of<br />
Seat Belt Protection. The American Association for<br />
Automotive Medicine. Kentucky, 1979.<br />
5. Gloynes P. F. et al.: Steering Wheel Induced Head<br />
and Facial Injuries Amongst Drivers Restrained by<br />
Seat Belts. Sixth IRCOBI Conference, France, 1981.
6. Mackay G. M. Seat Belts In EuropeTheir Use and<br />
Performance in Collisions. International Symposium<br />
on Occupant Restra<strong>int</strong>. Ontario, Canada, June 1981.<br />
SECTION 5: TECHNICAL SESSIONS ''I<br />
'x<br />
7. The Evaluation of Phasc I Reports on the Experimental<br />
Safety Vehicles Program. Battelle Memorial<br />
lnstitute-Columbus Laboratories, Ohio, 1970.<br />
Occupant Protection from lmpact with the Steering Assembly<br />
JOHN B. MORHIS, LEE STUCKI,<br />
RICHARD M. MORGAN and NANCY BONDY<br />
National Highway Traffic Safety<br />
Administration<br />
ABSTHACT<br />
This paper will discuss areas of NHTSA research relating<br />
to the accident environment of the driver impacting<br />
the steering assembly. These include:<br />
r Acciderrt analyses to define the problem.<br />
r Development of biomechanical criteria for assessment<br />
of injury severity on test surrogates.<br />
r Laboratory testing of steering assemblies to determine<br />
the safety performance.<br />
r Computer modeling for reconstructing accidents and<br />
assessing the effects of changes to steering assembly<br />
characteristics on driver responses.<br />
The accident analyses quantify the problem in terms<br />
of injuries and fatalities sustained by drivers as a result<br />
of impacting the steering assembly. Relationships will be<br />
developed between frequency and severity of injury and<br />
source of injury, alfected body regions, crash direction<br />
and severity, and steering assembly response parameters.<br />
Biomechanical injury criteria on blunt thoracic impact<br />
is available and may be applicable to chest impact with<br />
steering wheel hubs.<br />
A program was recently completed which evaluated<br />
the safety performance of several production steering assemblies<br />
and, also, <strong>one</strong> improved steering assembly constructed<br />
from comp<strong>one</strong>nts with desirable safety attributes.<br />
The performance was evaluated via comp<strong>one</strong>nt tests and<br />
dynamic sled tests with instrumented Hybrid III dummies.<br />
A computer program entitled "^Steering<br />
Column and<br />
Occupant REsponse,Srmulation" (SCORES) has been developed<br />
to model the various <strong>int</strong>eractions of a driver<br />
impacting a steering assembly in a frontal collision. The<br />
SCORES model is used to predict the occupant/steering<br />
assembly response when certain assembly characteristics<br />
are changed, i.e., column force deflection properties, and<br />
to reconstruct actual accident cases,<br />
A jo<strong>int</strong> effort by NHTSA and Transportation Systems<br />
Center (TSC) is being conducted to reconstruct the accident<br />
environment of occupants injured by the steering<br />
assemblv. The SCORES model will be exercised for var-<br />
175<br />
-rejh<br />
ious make./model vehicles, occupant sizes, and accident<br />
<strong>conf</strong>igurations which essentially comprise this accident<br />
environment. Countermeasures will be <strong>int</strong>roduced <strong>int</strong>o<br />
the SCORES model and the effect on injury and fatality<br />
reduction will be assessed.<br />
BACKGROUND<br />
The steering column is responsible for producing more<br />
injuries and fatalities than any other vehicle comp<strong>one</strong>nt.<br />
In an effort to alleviate the harm caused by the steering<br />
assembly, the automobile industry started designing and<br />
developing energy absorbing steering assemblies in the<br />
late 1950's (l). Methods were also devised to prevent<br />
rearward <strong>int</strong>rusion of the steering column during the<br />
crash event. In 1965, the Society of Automotive Engineers<br />
(SAE), recognizing the need for a test procedure for this<br />
new device, issued Recommended Practice J9,14 (2). This<br />
practice describes the laboratory test procedure for evaluating<br />
the characteristics of steering control systems under<br />
simulated driver impact conditions. It consists of a<br />
body form weighing 75 pounds that impact$ a steering<br />
assembly mounted in the production <strong>conf</strong>iguration. A<br />
load cell mounted between the wheel and column is used<br />
to measure the force imparted to the system.<br />
In 1966, the General Services Administration (GSA)<br />
issued a $teering assembly protection rule (GSA Standard<br />
515/4a) which became effective in October 1967 (3X4).<br />
All passenger cars purchased by GSA after the effective<br />
date were required to comply with this standard. The<br />
standard specified that the force imparted to the SAE<br />
J9,t4 body form must not exceed 2,500 pounds when<br />
impacting the steering assembly at l5 mph. The <strong>int</strong>rusion<br />
prevention portion of the standard specified that the rearward<br />
horizontal displacement of the upper end of the<br />
column mu$t not exceed 5 inches during a 30 mph frontal<br />
barrier test.<br />
In 1967, NHTSA adopted the GSA standard but separated<br />
the energy absorption and rearward displacement<br />
requirements <strong>int</strong>o two standards, FMVSS Nos. 203 and<br />
204. These standards became effective on January l, 1968<br />
(5). Federal Motor Vehicle Safety Standard (FMVSS) No.<br />
203, "Impact Protection for the Driver From the Steering<br />
Control System," specifies requirements for minimizing<br />
chest, neck, and facial injuries by providing steering sys'<br />
tems that yield forward, cushioning the impact of the<br />
driver's chest by absorbing much of his impact energy in<br />
n<br />
ir<br />
'f<br />
';!<br />
I<br />
ri"
frontal crashes. FMVSS No. 2O4,<br />
"Steering Control Rearward<br />
Displacement," specifltes requirements limiting the<br />
rearward displacement of the steering control <strong>int</strong>o the<br />
passenger compartment to reduce the likelihood of chest,<br />
neck, or head injuries.<br />
Compliance with these standards has resulted in various<br />
designs for absorbing the energy of the occupant<br />
impacting the steering assembly, usually an energy absorbing<br />
device in the column (FMVSS No. 203). The<br />
prevention of column <strong>int</strong>rusion <strong>int</strong>o the occupant compartment<br />
is usually accomplished by a shear capsule<br />
(FMVSS No. 204). The standards were subsequently extended<br />
to light trucks and vans effective September I,<br />
198 l.<br />
Many accident analysee have been conducted to assess<br />
the effect of post-1968 steering assemblies. Garrett (6),<br />
Huelke (7), Nahum (8), Levine (9), O'Day (10), and<br />
Mclean (11) all reported a reduction in severe injuries<br />
as a result of the energy absorbing steering column. Two<br />
studies have been conducted by NHTSA to determine the<br />
effectiveness of post-1968 steering assemblies. One study<br />
was conducted by Kahane (4)(12), and the other which<br />
Teble 1. Harm to car occupant Bs e function of contact po<strong>int</strong>.<br />
Contact<br />
1 Steering assembly<br />
2 Steering assembly<br />
3 Side <strong>int</strong>erior surface<br />
4 Windshield<br />
5 A-Pillars<br />
6 Instrument panel<br />
7 Steering assembly<br />
I Roof edge<br />
I Side <strong>int</strong>erior surface<br />
10 Instrument panel<br />
11 Instrument panel<br />
12 Roof<br />
13 Instrument panBl<br />
14 Instrument panel<br />
15 Arm rests<br />
16 Glove comp. area<br />
17 Steering assembly<br />
18 Mirrors<br />
19 Glove comp. area<br />
20 Window glass<br />
21 Window frame<br />
22 Front seat backs<br />
23 Side <strong>int</strong>erior sudace<br />
24 Floor<br />
25 Roof edge<br />
All the above<br />
All other <strong>int</strong>erior contacts<br />
All non-contact<br />
All exterior contacts<br />
Atl<br />
Malliaris (15)<br />
EXPERIMENTAL SAFETY VEHICLES<br />
is included in the rulemaking support paper for FMVSS<br />
Nos. 201, 203, and 204 Extension to Light Trucks and<br />
Vans (13).<br />
Kahane (4) reported that in pre-standard cars in the<br />
National Crash Severity Study (NCSS), 58 percent of the<br />
drivers who were killed or hospitalized in frontal crashes<br />
were seriously injured by contacts with the steering assembly.<br />
This is in agreement with a study by Nahum (8)<br />
based on 1960-1966 model cars. Kahane also reported<br />
that the pre-standard steering column entered <strong>int</strong>o the<br />
passenger compartment in 3.5 percent of the towaway<br />
accidents. There also was column displacement in 20 percent<br />
of the cases involving steering assembly contact and<br />
75 percent of the driver fatalities (14).<br />
Using data from the Fatal Accident Reporting System<br />
(FARS), Kahane concluded that energy absorbing steer'<br />
ing systems reduced the risk of driver fatalities in frontal<br />
crashes by 12 percent. Using NCSS data the study also<br />
concluded that energy absorbing systems reduced by 38<br />
percent the risk of serious injury due to the steering assembly.<br />
Also observed was that post-standard steering<br />
system reduced the incidence of column <strong>int</strong>rusion <strong>int</strong>o<br />
Body Harm o/o<br />
Chest<br />
Abdomen<br />
Chest<br />
Head and face<br />
Head and face<br />
Lower extremities<br />
Head and face<br />
Head and face<br />
Abdomen<br />
Chest<br />
Abdomen<br />
Head and face<br />
Head and face<br />
Upper extremities<br />
Abdomen<br />
Abdomen<br />
Upper extremities<br />
Head and face<br />
Chest<br />
Head and face<br />
Head and face<br />
Abdomen<br />
Lower extremities<br />
Lower extremities<br />
Neck<br />
't76<br />
of Total<br />
11.90<br />
9.41<br />
4.94<br />
4.68<br />
4.O4<br />
3.43<br />
3.13<br />
3.02<br />
2.36<br />
2.06<br />
1.85<br />
1.80<br />
1.65<br />
1.40<br />
1.25<br />
1.23<br />
1 .16<br />
1.08<br />
0.84<br />
0.79<br />
0.77<br />
0.76<br />
0,71<br />
0.69<br />
0.57<br />
65.52<br />
14.74<br />
7.91<br />
11,83<br />
100.0
the passenger compartment by 58 percent. It should be<br />
noted that since it is difficult to $eparate the effects of<br />
FMVSS Nos. 203 and ?O{ on injury reduction, the above<br />
estimates are based on the combined effectiveness of the<br />
two standards.<br />
Despite the apparant safety improvefients of steering<br />
assemblies since 1968, the steering assembly remains the<br />
major source of injury. Using NCSS data, Malliaris (15)<br />
ranked source of injury (contact po<strong>int</strong>) by percent of<br />
harm. Four of the top 17 most harmful body region,/<br />
contact po<strong>int</strong> <strong>int</strong>eractions are produced by the steering<br />
assembly. Table I presents harm to the occupant as a<br />
function of contact po<strong>int</strong>/body region.<br />
Cohen (16) in analyzing NCSS data concluded that the<br />
steering assembly is responsible for 27 percent of all serious<br />
(AIS 3-6) injuries. The body areas involved and<br />
their percentage of total serious injury is shown in Table<br />
2. As can be seen, steering assembly impacts with the<br />
chest and abdomen account for nearly 20 percent of all<br />
serious injuries. A tabulation ofthe distribution ofsteering<br />
assembly injury by body region is shown in Table 3.<br />
Serious to fatal injuries attributed to the steering assembly<br />
occur predominately to the chest (547o) and aMomen<br />
(25%). Cohen also investigated the effect of delta V on<br />
injury produced by the steering assembly. Figure I illustrates<br />
the results of this analysis. The mean delta V for<br />
serious chest injury is approximately 27 mph and 32 mph<br />
for the abdomen. Additional analysis of the accident data<br />
as it relates to the steering column will follow later.<br />
Table 2. Percent of all Als 3-6 injuries caused by steering<br />
assemblies,<br />
Steering assembly/all<br />
body parts 27.3o/o (698)<br />
Steering assembly/<br />
chest<br />
Steering assembly/<br />
abdomen<br />
Steering assembly/<br />
upper extremity<br />
Steering assembly/<br />
head and face<br />
Steering assembly/<br />
pelvis<br />
14.5<br />
6.6<br />
1.8<br />
1.7<br />
1,4<br />
Table 3, Distribution of steering assembly injuries (AtS 3-6)<br />
by body part and impact direction.<br />
Part Frontal Non-Frontal<br />
Chest 53.5% 51.86/o<br />
Head and face 6.6 5.5<br />
Abdomen 24.9 22.1<br />
Pelvis 5.8 4.5<br />
Upper extremity 5.0 1 1.1<br />
Lower extremity 2.2 2.5<br />
TotalAlS 3-6 Injuries 499 199<br />
Cohdfl (tB)<br />
SECTION 5: TECHNICAL SESSIONS<br />
177<br />
t*f<br />
I<br />
sf<br />
I<br />
"r<br />
,L<br />
f l<br />
': st.<br />
I *l-<br />
i st.<br />
, i f<br />
rF I<br />
'l<br />
to l-<br />
I<br />
OL<br />
to<br />
Figure 1. Distribution of steering assembly injuries-AlS<br />
3-6 injuries-for drivers in frontal impacts by delta<br />
V.<br />
As reported by $tucki (17) several issues have been<br />
raised regarding the adequacy of the FMVSS No. 203<br />
test procedures. Key among these issues are:<br />
. The test device does not physically simulate the<br />
driver impacting the steering assembly in actual<br />
crash simulations.<br />
r The test device is not a good human surrogate and<br />
the performance criteria are not adequate indicators<br />
of injury severity.<br />
. The inability of the test and,/or performance criteria<br />
to distinguish "good" and "bad" design steering assemblies<br />
as a result of the previous inadequacies.<br />
Observations of the inability of the current test procedure<br />
to address the effects of accident-induced steering<br />
column behavior were made by Gloyns (18) and Garrett<br />
(le).<br />
Stucki also noted that the FMVSS No. 203 force criteria<br />
do not account for load distribution and that improvements<br />
to the safety of the steering assembly such as load<br />
distribution features are not rewarded by the performance<br />
criteria. Ways to realistically evaluate the safety performance<br />
of the steering assembly will be addressed later in<br />
this paper.<br />
ACCIDENT ANALYSIS<br />
The National Crash Severity Study (NCSS) contains<br />
12,050 accidents in which a passenger car, light truck, or<br />
van had to be towed. Accidents were sampled from seven<br />
areas throughout the United States from January 1977 to<br />
March 1979. The NCSS file repofr$ 67,559 weighted drivers<br />
in towaway passenger cars, of which 14,512 had a<br />
known contact source. Of the 14,512 drivers 5,902 or<br />
ffi.1% had contact with the steering assembly of which<br />
154 or 2.69Vo were fatally injured. The data presented in<br />
this <strong>section</strong> consist ofonly those drivers in passenger cars<br />
having contact with the steering assembly.<br />
I<br />
j l
Table 4 shows the distribution of driver injury severity<br />
in terms of AlS, by crash mode. Crash mode is defltned<br />
by the variable 'General Area of Deformation' which is<br />
the second comp<strong>one</strong>nt of the Collision Deformation Classification<br />
(CDC) and describes the general area of impact<br />
to the vehicle. The most severe impact to the vehicle was<br />
used to define crash mode.<br />
Table 4 shows that 7?Vo of the drivers having steering<br />
assembly contact were in frontal impacts. Almost 74Vo<br />
of the injuries caused by steering assembly contact were<br />
minor injuries (AIS l). Note: in right and left impacts,<br />
there are almost the same number of drivers contacting<br />
the steering assembly.<br />
Table 5 shows the distribution of AIS for drivers having<br />
contact with the steering assembly by delta V. Delta Y<br />
is defined as the change in velocity which occurs during<br />
the collision.<br />
Deleting the'other' category, Table 5 shows that 767o<br />
of the drivers were occupants of passenger cars having a<br />
delta V between l-20 miles per hour. Approximately 82Vo<br />
EXPERIMENTAL SAFETY VEHICLES<br />
of the AIS I and 2 injuries occur at the delta V between<br />
l-20 mph. The severe injuries AIS 3-6, increase proportionally<br />
as the delta V increases.<br />
Table 6 describes the injuries sustained by drivers contacting<br />
the steering assembly in terms of body region and<br />
AIS.<br />
Table 6 shows that over 60 percent of the injuries to<br />
drivers contacting the steering assembly are to the body<br />
regions face and chest, followed by upper extremities,<br />
head and abdomen. Note: the majority of these injuries<br />
are of low severity; however, over 40 percent of the injuries<br />
to the abdomen and <strong>one</strong>-fourth of the injuries to<br />
the chest are AIS 3 and above.<br />
The National Accident Sampling System-Continuous<br />
Sampling Subsystem (NASS-CSS) is a random sample of<br />
police-reported accidents in l0 sites throughout the<br />
United States. These accidents when weighted produce<br />
national estimates. Because the potential error in many<br />
of the estimates is large, these numbers should be used<br />
as estimates, not as precise counts.<br />
Table 4. AIS for drlvers having contact with the steering assembly by crash mode (NCSS).<br />
Frequency<br />
Percent<br />
Row %<br />
Column %<br />
Ars<br />
Front Right Left Back Top Other* Tota!<br />
3113 264 246 213 106 420 4362<br />
52.75 4.47 4.17 3.61 1.80 7.12 73.S1<br />
I<br />
71.37 6.05 5.64 4.88 2.43 9.63<br />
73.21 71.16 66.49 8S.50 75.71 79.10<br />
558 53 60 11 I 65 756<br />
9.45 0.90 1.02 0.19 0.15 1.10 12.81<br />
2<br />
73.81 7.O1 7.94 1.46 1.19 8.60<br />
13.12 14.29 16.22 4.62 6.43 12.24<br />
3<br />
325<br />
5.51<br />
71.43<br />
7.64<br />
33<br />
0.56<br />
7.25<br />
8.89<br />
32<br />
0.54<br />
7.03<br />
8.65<br />
13<br />
0.22<br />
2,86<br />
5.46<br />
19<br />
0,32<br />
4.18<br />
13.57<br />
33<br />
0.56<br />
7.25<br />
6.21<br />
455<br />
7.71<br />
9<br />
1.68<br />
9 7<br />
0.12<br />
1<br />
0.29<br />
7<br />
j<br />
0<br />
0<br />
2<br />
0.03<br />
8 1<br />
0.14<br />
3 3<br />
2.25<br />
4<br />
74.44 5.26 12.78 0 1.50 6.02<br />
2.33 1.89 4.59 0 1.43 1.51<br />
5<br />
90<br />
1 .53<br />
7S.65<br />
2.11<br />
I<br />
0.1 4<br />
7.08<br />
2.16<br />
I<br />
0.1 5<br />
7.96<br />
2.43<br />
1<br />
0.02<br />
0.88<br />
0.42<br />
3<br />
0.05<br />
2,65<br />
?.14<br />
2<br />
0.03<br />
1.77<br />
0.38<br />
113<br />
1 .S1<br />
6<br />
1<br />
o.27<br />
80.00<br />
0.38<br />
6<br />
0.03<br />
10.00<br />
0.54<br />
2<br />
0.03<br />
10.00<br />
0.54<br />
2 0<br />
0<br />
0<br />
0<br />
0<br />
0<br />
0<br />
0<br />
0<br />
0<br />
0<br />
0<br />
2 0<br />
0.34<br />
Injured<br />
Severity<br />
Unknown<br />
51<br />
0.86<br />
80.95<br />
1.20<br />
4<br />
0.07<br />
6.35<br />
1.08<br />
4<br />
0.07<br />
6.35<br />
1.08<br />
0<br />
0<br />
0<br />
0<br />
1<br />
0.02<br />
1.59<br />
0.71<br />
3<br />
0.05<br />
4.76<br />
0.56<br />
63<br />
1.O7<br />
Total 4252<br />
72.04<br />
371<br />
6.29<br />
370<br />
6.27<br />
238<br />
4.03<br />
140<br />
2.37<br />
531<br />
9.00<br />
5902<br />
100<br />
*Other includes undercarriage, unclassifiable, and unknown<br />
178
Table 5. AIS for drivers having contact with the steering assembly by detta V (NCSS).<br />
Frequency<br />
Percent<br />
Row o/o<br />
Column %<br />
Delta V (miles per hour)<br />
AIS 1 -1 0 1 1 -20 21 -30 31 -40 41 -50 51 '60 61-SS Other* Total<br />
1<br />
823<br />
13.94<br />
18.87<br />
88.59<br />
1351<br />
22.85<br />
30,97<br />
7s.35<br />
358<br />
6.07<br />
8.21<br />
60.58<br />
46<br />
0.78<br />
1.05<br />
?5.56<br />
I<br />
0.15<br />
0.21<br />
18.37<br />
2<br />
0.03<br />
0.05<br />
14.29 i<br />
0<br />
0<br />
0<br />
0<br />
1773<br />
30.04<br />
40.65<br />
75.80<br />
4362<br />
73.91<br />
2<br />
80<br />
1.36<br />
10.58<br />
8.61<br />
275<br />
4.66<br />
36.38<br />
1 5.34<br />
89<br />
1.51<br />
't1.77<br />
15.06<br />
37<br />
0.63<br />
4.89<br />
?0.56<br />
6<br />
0.10<br />
0,79<br />
12.24<br />
1<br />
0.02<br />
0.13<br />
7 .14<br />
0<br />
0<br />
0<br />
0<br />
268<br />
4.s4<br />
35.45<br />
1 1 .46<br />
756<br />
12.81<br />
20 107 87 46 13 2 1 179 455<br />
3<br />
,<br />
4<br />
0.34<br />
4.40<br />
2.15<br />
't<br />
0.02<br />
0.75<br />
0.1 1<br />
1.81<br />
23.52<br />
5.97<br />
28<br />
0.47<br />
21.05<br />
1 .56<br />
1.47<br />
19.1?<br />
14.72<br />
27<br />
0.46<br />
20.30<br />
4.57<br />
0.78<br />
10.11<br />
25.56<br />
19<br />
O.32<br />
14.29<br />
10.56<br />
0.22<br />
2.86<br />
26.53<br />
7<br />
O.12<br />
5.26<br />
14.29<br />
0.03<br />
0.44<br />
14.2S<br />
1<br />
0.02<br />
0.75<br />
7 .'t4<br />
0.02<br />
0.22<br />
14.29<br />
1<br />
0.02<br />
0.75<br />
1 4.29<br />
3.03<br />
39.34<br />
7.65<br />
49<br />
0.83<br />
36.84<br />
2.09<br />
7.71<br />
133<br />
2.?5<br />
0 1 5 2 5 2 5 1 3 6 4 2 5 1 1 3<br />
0 0.25 0.42 0.42 0.22 0.10 0.07 0.42 1.91<br />
5 0 13.27 22.12 22.12 11.50 5.31 3.54 22.12<br />
0 0.84 4.23 13.89 26.53 42.86 57.14 1.07<br />
6<br />
0<br />
0<br />
0<br />
0<br />
1<br />
0.02<br />
5,00<br />
0.06<br />
0<br />
0<br />
0<br />
0<br />
4<br />
0.07<br />
20.00<br />
2.22<br />
1<br />
0.02<br />
5.00<br />
2.04<br />
1<br />
0.02<br />
5.00<br />
7.14<br />
1<br />
0.02<br />
5.00<br />
14.29<br />
1 2<br />
0.20<br />
60.00<br />
0.51<br />
20<br />
0.34<br />
Injured<br />
Severity<br />
Unknown<br />
Total<br />
5<br />
0.08<br />
7.54<br />
0.54<br />
s2s<br />
15.74<br />
16<br />
0.27<br />
25.40<br />
0.89<br />
1 793<br />
30.38<br />
5<br />
0.08<br />
7.54<br />
0.85<br />
591<br />
10.01<br />
3<br />
0.05<br />
4.76<br />
1.67<br />
180<br />
3.05<br />
0<br />
0<br />
0<br />
0<br />
49<br />
0.83<br />
1<br />
0.02<br />
1.59<br />
7.14<br />
14<br />
0.?4<br />
0<br />
0<br />
0<br />
0<br />
7<br />
0.12<br />
3 3<br />
0.56<br />
52.38<br />
1.41<br />
2339<br />
39.63<br />
63<br />
1.07<br />
5902<br />
100<br />
%Als
EXPERIMENTAL SAFETY VEHICLES<br />
Table 6. AIS for drivers having steerlng assembly contact by body region (NCSS).<br />
Frequency<br />
Percent<br />
Row %<br />
Column % AIS<br />
Body<br />
Region<br />
1<br />
1 3 4 5<br />
Injured<br />
Severity<br />
6 Unknown<br />
Total<br />
*Upper<br />
Extremities<br />
Chest<br />
682<br />
11.56<br />
84.0<br />
15.64<br />
1046<br />
17.72<br />
65.62<br />
23.98<br />
78<br />
1.3?<br />
9.61<br />
10.32<br />
't44<br />
2.44<br />
9.03<br />
19.05<br />
43<br />
0.73<br />
5.30<br />
9.45<br />
27ts<br />
4.68<br />
17.31<br />
60.66<br />
I<br />
0.15<br />
1.1 1<br />
6.77<br />
41<br />
0.6S<br />
2.57<br />
30.83<br />
0<br />
0<br />
0<br />
0<br />
60<br />
1.0?<br />
9.76<br />
53.09<br />
0<br />
0<br />
0<br />
0<br />
17<br />
0.20<br />
1 .O7<br />
85.00<br />
0 812<br />
013.76<br />
0<br />
0<br />
10 1594<br />
0.17 27.A1<br />
0.63<br />
15.87<br />
Face<br />
1723<br />
29.19<br />
83,00<br />
39.50<br />
318<br />
5.39<br />
15.32<br />
42.06<br />
29<br />
0.49<br />
1,40<br />
6.37<br />
5<br />
0.08<br />
0.24<br />
3.76<br />
0<br />
0<br />
0<br />
0<br />
0<br />
0<br />
0<br />
0<br />
1 2076<br />
0.02 35.17<br />
0.05<br />
1.59<br />
2 1 8 9 7 1 3 3 9 1 3 4 3 7 5<br />
3.69 1.64 0.22 0.05 0.15 0.02 0.58 6.35<br />
Head 58.13 25.87 3.47 0.80 2,40 0.27 s.07<br />
5.00 12.83 2.86 2.26 7.96 5.00 53.e7<br />
8 4 1 2 4 0 0 0 0 1 0 0<br />
1.42 0.20 0.07 0 0 0 0 1.69<br />
Knee 84.00 12.00 4.00 0 0 0 0<br />
1.93 1.59 0.88 0 0 0 0<br />
189 2 28 64 44 1 16 344<br />
3.20 0.03 0.47 1.08 0.75 0,02 0.27 5.83<br />
Abdomen 54.94 0.87 8.14 18.60 12.79 0.29 4.65<br />
4.33 0.26 6.15 48.12 38.94 5.00 25.40<br />
7 1 1 6 3 5 1 0 0 1 1 2 4<br />
1.20 0.27 0.59 0.02 0 0 0.02 2,10<br />
Pelvis 57.26 12.90 28.22 0.81 0 0 0.81<br />
1.63 2.12 7,69 0.75 0 0 1.59<br />
J33 ,3! ol2 3 3 3 ool ,133<br />
Shoulder 71.19 25.42 2.97 0 0 0 O.4Z<br />
3.85 7.94 1.54 0 0 0 1.59<br />
Thigh<br />
Other<br />
Unknown<br />
Total<br />
88<br />
1.49<br />
73.95<br />
2.02<br />
93<br />
1.58<br />
76.23<br />
2.13<br />
4362<br />
73.91<br />
'lncludes<br />
erm, elbow, lorearm, and wrist/hand.<br />
12<br />
0.20<br />
10.08<br />
1.59<br />
17<br />
0.29<br />
13.93<br />
2.25<br />
756<br />
12,81<br />
14<br />
0.23<br />
11.76<br />
3.08<br />
6<br />
0.10<br />
4.92<br />
1.32<br />
455<br />
7.71<br />
180<br />
5<br />
0.08<br />
4.20<br />
3.76<br />
E<br />
0.08<br />
4.09<br />
3.76<br />
133<br />
2.25<br />
0<br />
0<br />
0<br />
0<br />
0<br />
0<br />
0<br />
0<br />
113<br />
1.91<br />
0<br />
0<br />
0<br />
0<br />
1<br />
0.02<br />
0.82<br />
5.00<br />
20<br />
0.34<br />
0<br />
0<br />
0<br />
0<br />
119<br />
2.02<br />
0 122<br />
0<br />
0<br />
0<br />
2.07<br />
63 5902<br />
1.07 100
Table 7. AIS lor drivers contacting the steering assembly by crash mode (NASS).<br />
Frequency<br />
Percent<br />
Row %<br />
Column %<br />
AIS<br />
I<br />
2<br />
3<br />
4<br />
5<br />
6<br />
Injured<br />
Severity<br />
Unknown<br />
Front Right Left Back Top Other* Total<br />
413779 22080 39209 24455 12388 183047 694962<br />
50.35 2.69 4.77 2.98 1.51 22,28 84.57<br />
59.54 3.18 5.64 3.52 1.78 26.34<br />
83.12 75.64 70.46 78,99 62.68 94.78<br />
45756 4850 6942 6015 999 8606 73168<br />
5.56 0.59 0.84 0.73 0.12 1,05 8.90<br />
62.54 6.63 9.49 8.22 1.37 1 1.76<br />
9.1 1 1 6.62 1 2.48 1 9.43 6,67 4.45<br />
241 10 1850 8749 491 1596 1485 38281<br />
2.93 0.23 1.06 0.05 0,19 0.18 4.66<br />
62.98 4,83 22.85 1.28 4.17 3.88<br />
4.84 6.34 15.72 1.59 10.65 0.77<br />
6194 110 276 0 0<br />
0.75 0.01 0.03 0 0<br />
94.13 1.67 4,19 0 0<br />
1.24 0.38 0.50 0 0<br />
4 5 1 4 0 0 0 0<br />
0<br />
1<br />
0<br />
0<br />
.<br />
.<br />
0<br />
5<br />
.<br />
9 0 1<br />
5<br />
0<br />
0<br />
0<br />
0<br />
0<br />
0<br />
0<br />
0<br />
0<br />
0<br />
0<br />
0<br />
0<br />
1 4 9 8 2 9 9 0 0 0<br />
0.18 0.04 0 0 0<br />
83.36 16.64 0 0 0<br />
0.30 1.02 0 0 0<br />
1 961<br />
0.24<br />
80.70<br />
0.39<br />
Total 49781 2<br />
60.58<br />
0<br />
0<br />
0<br />
0<br />
291 89<br />
3.55<br />
*Other includes undercafflago, unknown, and uncla8Biti€d.<br />
46S<br />
0.07<br />
r 9.30<br />
0.84<br />
55645<br />
6.77<br />
results are similar to those shown in Table 6 from the<br />
NCSS. Differences which appear are primarily due to the<br />
small number of actual cases sampled.<br />
SUMMARY<br />
The NCSS and NASS files both indicate that driven<br />
are more likely to contact the steering assembly in frontal<br />
impacts than in any of the other impacts. The severity of<br />
the impact defined by delta V shows that the severity of<br />
the injuries (AIS 3-6) increases as the delta V increases.<br />
The common injuries sustained by drivers contacting the<br />
steering assembly primarily to the face and chest, followed<br />
by upper extremities, head, and abdomen. The majority<br />
of these injuries are AIS I and 2, however, the severe<br />
injuries, AIS 3-6 occur to the body regions, abdomen and<br />
chest.<br />
SECTION 5: TECHNICAL SESSIONS<br />
0<br />
0<br />
0<br />
0<br />
30965<br />
3.77<br />
0<br />
0<br />
0<br />
0<br />
14983<br />
1.82<br />
INJURY CHITERIA<br />
0 6580<br />
0 0.80<br />
0<br />
0<br />
0 4514<br />
0 0.55<br />
0<br />
0<br />
o 1797<br />
0 0.22<br />
0<br />
0<br />
0<br />
0<br />
0<br />
0<br />
1 931 38<br />
23.50<br />
2430<br />
0.30<br />
821732<br />
100<br />
In order to sssess the protective capability ofa steering<br />
assembly a criterion for estimating injury is required. As<br />
noted previously the two most prevalent body regions<br />
injured by the steering assembly are the thorax and the<br />
abdomen. In the following <strong>section</strong> a review of previous<br />
studies addressing thoracic and abdominal injury tolerance<br />
is undertaken, and the most appropriate continuous<br />
injury criteria for frontsl thoracic and abdominal impact<br />
are presented.<br />
THORAX INJURY CRITERIA-A variety of kinematic<br />
parameters have been utilized in the literature for<br />
predicting the results of a blow to the thorax-thoracic<br />
acceleration, force, deflection, power, etc. The data bases<br />
for these approaches also vary extensively in type ofsubject<br />
tested----cadavers, porcine subjects, squirrel monkeys,<br />
;';l<br />
;i'i<br />
s'!l<br />
I
Table 8. AIS for drivers having contact with the steedng assembly by delta V (NASS).<br />
Frequency<br />
P6rcent<br />
Flow %<br />
Column o/o<br />
Delta V (miles per hour)<br />
AIS<br />
1-10 11-20 21-30 31-40 41-50 51-60 Other" Total<br />
I<br />
89174<br />
10.85<br />
12.83<br />
126837<br />
15.44<br />
18.2s<br />
34646<br />
4.22<br />
4,99<br />
7583<br />
0.92<br />
1.09<br />
2175<br />
0.26<br />
0.31<br />
2522<br />
0.31<br />
0.36<br />
432022 694959<br />
52.58 84.57<br />
62.17<br />
92.35 86.51 67.5S 56.18 40.28 71.26 85.57<br />
2<br />
5275<br />
0.64<br />
7.21<br />
5.46<br />
15423<br />
1.88<br />
21.08<br />
10.52<br />
7355<br />
0.S0<br />
10.05<br />
14.35<br />
3327<br />
0.40<br />
4.55<br />
24.65<br />
0<br />
0<br />
0<br />
0<br />
782<br />
0.10<br />
1.07<br />
22j0<br />
41009 73171<br />
4,99 8.S0<br />
56.04<br />
8.12<br />
3<br />
1204<br />
0.15<br />
3.15<br />
1.25<br />
1830<br />
0.22<br />
4.78<br />
1.25<br />
6688<br />
0.81<br />
17.48<br />
13.05<br />
551<br />
0,07<br />
1.44<br />
4.08<br />
2110<br />
0.26<br />
5.51<br />
33.08<br />
235<br />
0.03<br />
0.61<br />
6.64<br />
25653 38271<br />
3.12 4.66<br />
67.03<br />
5.08<br />
4<br />
0<br />
0<br />
0<br />
0 0<br />
1418<br />
0.17<br />
21 .55<br />
. 9<br />
1gg3<br />
0.24<br />
30.29<br />
7 3 .<br />
0<br />
0<br />
0<br />
8 9 0<br />
0<br />
0<br />
0<br />
0 0<br />
0<br />
0<br />
0<br />
0 .<br />
3169<br />
0.39<br />
48.1 6<br />
6 3<br />
6580<br />
0.80<br />
5<br />
0<br />
0<br />
0<br />
0<br />
666<br />
0.08<br />
14.76<br />
0.45<br />
0<br />
0<br />
0<br />
0<br />
1801<br />
0.22<br />
39.91<br />
13,34<br />
635<br />
0.08<br />
14.07<br />
1 1.76<br />
0<br />
0<br />
0<br />
0<br />
1411 4513<br />
0.17 0.55<br />
31.26<br />
0.28<br />
6<br />
o<br />
0<br />
o<br />
0<br />
440<br />
0.05<br />
24.47<br />
0.30<br />
399<br />
0.05<br />
22.19<br />
0,78<br />
235<br />
0.03<br />
13.07<br />
1.74<br />
0<br />
0<br />
0<br />
0<br />
0<br />
0<br />
0<br />
0<br />
724<br />
0.09<br />
40.27<br />
0.14<br />
1798<br />
0.22<br />
lniured<br />
Severity<br />
Unknown<br />
Total<br />
6/oA15 g3<br />
911<br />
0.11<br />
37.47<br />
0.94<br />
96564<br />
11.75<br />
1.3<br />
0<br />
0<br />
0<br />
0<br />
1 4661 4<br />
17.84<br />
3.0<br />
180<br />
0.02<br />
7.40<br />
0.35<br />
51 261<br />
6.24<br />
17.7<br />
0<br />
0<br />
0<br />
0<br />
't3497<br />
1,64<br />
19.2<br />
479<br />
0.06<br />
19.70<br />
8.87<br />
5399<br />
0.65<br />
55.8<br />
0<br />
0<br />
0<br />
0<br />
3539<br />
0.43<br />
6.6<br />
861 2431<br />
0,10 0.30<br />
35.42<br />
0.17<br />
504849 821723<br />
61.44 100<br />
*Other includes unknown and not applicable.<br />
rhesus monkeys, baboon, etc. Each of these data bases<br />
has diffrculties associated with its use. Using cadavers,<br />
the muscle tension and lung inflation (as compared to<br />
living subjects) must be considered. Animal tests must be<br />
scaled to account for size, shape, and anatomical differences.<br />
The approach taken herein is based on two facetsr [1]<br />
the injury criteria must be continuous and [2] only data<br />
sets compo$ed of human cadavers or porcine subjects shall<br />
be utilized and other animal species shall be used only to<br />
guide the analysis. Porcine subjects are used based on the<br />
understanding that the circulatory, respiratory, and skeletal<br />
systems of the pig are important human analogues<br />
which establish the pig as structurally a very similar animal<br />
species to man (20).<br />
The first body of experiments to be considered is the<br />
EXPEHIMENTAL SAFETY VEHICLES<br />
182<br />
Kroell data (21, 22). These data are comprised of 24<br />
cadavers which received frontal blunt thoracic impacts.<br />
The Kroell data (where the cadaver weights were 90-209<br />
pounds) are shown in Figure 2. The numbers in the center<br />
of the figure are the associated injury (using the l97l AIS<br />
scale). The AV term for the Kroell data should be the<br />
maximum change-of-velocity between the sternum and a<br />
po<strong>int</strong> on the spine, say fourth thoracic vertebra. In actuality,<br />
that number is often not available and the AV of<br />
the impactor is substituted. This turns out to be a reasonable<br />
approximation for the Kroell data because the<br />
$ternum pulse is over by the time the spine pulse begins<br />
(21). In Reference 23, the average ratio of first <strong>int</strong>egral<br />
of the sternal spike pulse to the contact velocity of the<br />
impactor is l:ll.<br />
Where this approximation breaks down is when the
Frequency<br />
Percent<br />
How %<br />
Column "/o Als<br />
Injured Total<br />
SeveritY<br />
Body<br />
Fleoion 1 2 3 4 5 6 U n k n o w n<br />
'Upper<br />
Extremities<br />
1 03258<br />
12.56<br />
80.91<br />
14.86<br />
21818<br />
2.66<br />
17.10<br />
29.82<br />
1458<br />
0.18<br />
1 ,14<br />
3.81<br />
1087<br />
0.13<br />
0.85<br />
16.52<br />
0<br />
0<br />
0<br />
0<br />
0<br />
0<br />
0<br />
0<br />
o 127621<br />
0 15.53<br />
0<br />
0<br />
Chest<br />
165235<br />
20.1 1<br />
78.04<br />
2379<br />
11641<br />
1.4?<br />
5.50<br />
15.91<br />
26981<br />
3.28<br />
12.74<br />
70.48<br />
3379<br />
0.41<br />
1'60<br />
51 .34<br />
2097<br />
0.26<br />
0'99<br />
46.46<br />
1350<br />
0.17<br />
0.64<br />
75.53<br />
1050 211741<br />
0'13 25.77<br />
0.50<br />
43-21<br />
Face<br />
267544<br />
32.56<br />
90.27<br />
38.50<br />
28082<br />
3.42<br />
9.48<br />
38.38<br />
746<br />
0.09<br />
0.25<br />
1.95<br />
0<br />
0<br />
0<br />
0<br />
0<br />
0<br />
0<br />
0<br />
0<br />
0<br />
0<br />
0<br />
0 296377<br />
0 36,06<br />
0<br />
0<br />
Head<br />
25905<br />
3.15<br />
86.21<br />
3.73<br />
3721<br />
0.45<br />
12.38<br />
5.08<br />
424<br />
0.05<br />
1.41<br />
1.1 1<br />
0<br />
0<br />
0<br />
0<br />
0<br />
0<br />
0<br />
0<br />
0<br />
0<br />
0<br />
0<br />
0<br />
0<br />
0<br />
0<br />
30050<br />
3.66<br />
Knee<br />
241 65<br />
2.S4<br />
97.15<br />
3.48<br />
709<br />
0.09<br />
2.85<br />
0.96<br />
0<br />
0<br />
0<br />
0<br />
0<br />
0<br />
0<br />
0<br />
0<br />
0<br />
0<br />
0<br />
0<br />
0<br />
0<br />
0<br />
0<br />
0<br />
0<br />
24874<br />
3.03<br />
Abdomen<br />
33057<br />
4.02<br />
73.52<br />
4]8<br />
511<br />
0.06<br />
1 .14<br />
0.70<br />
6151<br />
0.75<br />
1 3.75<br />
16.07<br />
2115<br />
0.26<br />
4.73<br />
32.14<br />
2417<br />
0.29<br />
5.40<br />
53.54<br />
0<br />
0<br />
0<br />
0<br />
469 44720<br />
0.06 5-44<br />
1 .05<br />
19.30<br />
Shoulder<br />
31 306<br />
3.87<br />
87.60<br />
4.52<br />
3533<br />
0.43<br />
9.86<br />
4.83<br />
0<br />
0<br />
0<br />
0<br />
0<br />
0<br />
0<br />
0<br />
0<br />
0<br />
0<br />
0<br />
0<br />
0<br />
0<br />
0<br />
91 1 35840<br />
0.11 4.36<br />
2.54<br />
37.49<br />
Thigh<br />
Other<br />
27962<br />
3.40<br />
100.00<br />
4.02<br />
't<br />
6440<br />
2.00<br />
72.89<br />
2.37<br />
0<br />
0<br />
0<br />
0<br />
31 54<br />
0.38<br />
13.98<br />
4.31<br />
0<br />
0<br />
0<br />
0<br />
2522<br />
0.31<br />
1 1.18<br />
6.59<br />
0<br />
0<br />
0<br />
0<br />
0<br />
0<br />
0<br />
0<br />
0<br />
0<br />
0<br />
0<br />
0<br />
0<br />
0<br />
0<br />
0<br />
0<br />
0<br />
0<br />
440<br />
0.05<br />
1.95<br />
24.47<br />
0<br />
0<br />
0<br />
0<br />
0<br />
0<br />
0<br />
0<br />
27962<br />
3.40<br />
225s6<br />
2.74<br />
Total<br />
694S62<br />
84.57<br />
73169<br />
8.90<br />
38282<br />
4.66<br />
6581<br />
0.80<br />
4514<br />
0.55<br />
1798 2430 821736<br />
0.30 10q<br />
'lncludss arm, elbow, forearm, end wrist/hand.<br />
SECTION 5; TECHNICAL SESSIONS<br />
Table 9. AIS for drfuere having steering aseembly contact by body region (NASS).<br />
impactor mass is very light which is the case for a handful<br />
of the Kroell data. (In those few ca$es, momentum cal-<br />
where<br />
culations were made to better estimate the sternum AV.) AV : impact velocity (fps),<br />
Two models-to define the dependent variable, AIS, P : penetration'<br />
as a function of the response parameters-were considered.<br />
These were:<br />
D : depth of chest,<br />
P /D : normalized total deflection,<br />
AIS : f (AV, p,zD, Age)<br />
and<br />
, and<br />
AIS : g (P/D, Age) , AGE is in Years'<br />
183<br />
,t<br />
1
I<br />
50F<br />
.nOf<br />
l<br />
S sor<br />
E 20F<br />
t0r<br />
t<br />
'0<br />
.2<br />
3<br />
Numbers Denote AIS<br />
. i r . i . i<br />
Figure 2. GM cadaver frontal impacts to the thorax.<br />
The following equation is the AIS predictive expression<br />
as a function of P/D and AGE:<br />
where<br />
AIS : 17.4P/D + 0.0313 AGE - 5.li (l)<br />
R : multiple correlation coefficient : .87<br />
SE : standard error of estimate : .87<br />
This is Neathery's equation from Reference 22. Naturally,<br />
this regression equation is only good for values of<br />
P/D and AGE which lie within the region covered by<br />
the original data (24); e.g., this equation is not to be used<br />
for a 5-year-old child because children were not included<br />
in the original data set.<br />
For the regression analysis on AIS : f (AV, P,zD,<br />
AGE), the coeflicient in front of the AV term is not<br />
significant. In other words, AV is not a good independent<br />
parameter for the GM cadaver test$. This po<strong>int</strong> bears<br />
further consideration.<br />
Recently, Eppinger (25) used a combination of digital<br />
convolution theory and least-squares approximation techniques<br />
to predict relative velocity and deflection based on<br />
accelerometer readings from side impact$ of human cadavers.<br />
Eppinger found a relationship which suggests that<br />
the magnitude or severity of the resulting trauma is not<br />
only the result of the maximum deflection the thorax<br />
experiences but also a function of the rate at which the<br />
thoracic deflection is produced.<br />
In 1975, Fayon et al. (26) investigated frontal crash<br />
simulations with 3 po<strong>int</strong> seat belts. Results were presented<br />
for 31 cadavers in dynamic tests and 7 other in static<br />
tests. Fayon concluded that it is not possible to specify<br />
a tolerance level for thorax deflection without specifying<br />
the deflection speed which the thorax undergoes.<br />
Jonsson (27) exposed anesthetized rabbits to controlled<br />
compression blunt impact on the right side. The results<br />
of this study suggest that velocity, as well as compression,<br />
might be a primary factor in nonpenetrating thoracic<br />
injury mechanisms. Predominantly fatal injuries were ob-<br />
EXPERIMENTAL SAFEry VEHICLES<br />
184<br />
served at velosities y 39 fps and input compressions of<br />
2O-307o, whereas compression of 50-60% were required<br />
for a lethal outcome at velocities < 39 fps.<br />
The apparent injury mechanism was different for impact<br />
velocities above and below the 39 fps impact velocity<br />
region. In the higher velocity exposures the lung lesions<br />
resembled those found in blast injury.<br />
Twenty-<strong>one</strong> living and post mortem porcine subjects<br />
were exposed to blunt thoracic impact by GM (20, 28).<br />
The impactor wa$ a 46.3 pound mass with a flat contact<br />
surface traveling at 9.8 to 34.8 fps. The contacting <strong>int</strong>erface<br />
was an unpadded, 6-inch-diameter wooden block<br />
with a half-inch edge radius to prevent localizing loading<br />
at the perimeter. The GM argued that a comprehensive<br />
review of comparative anatomy between the swine and<br />
man would indicate that the cardiovascular, respiratory,<br />
and thoracic skeletal systems of the pig are anatomically<br />
and functionally a good parallel of similar structures in<br />
man. During the impacts, the force was applied in the<br />
horizontal direction through the vertically aligned contact<br />
block and was centered midsagitally over the sternum.<br />
In their most recent swine experiments (29), the GM<br />
team concluded that-while chest compression is clearly<br />
an important factor related to injury in severe blunt thoracic<br />
impact-there is a specific role for velocity as well.<br />
In other words, for a given level of thoracic compression,<br />
a higher average loading velocity represents a potentially<br />
more damaging exposure.<br />
There is a possible reason AV is not a significant independent<br />
variable for the Kroell data. Figure 3 shows<br />
the GM swine data, or Viano data, for blunt thoracic<br />
impact. (The weight of the swine varied from 102-154<br />
pounds). The Viano data have po<strong>int</strong>s of high AV and low<br />
P,zD while the cadaver data do not.<br />
The Viano data suggest that the magnitude of the resulting<br />
trauma is not only the result of the maximum<br />
deflection the thorax experiences but is also a function<br />
of the rate at which the thoracic deflection is produced.<br />
Finally, chest deflection was used for a Highway Safety<br />
.a .o<br />
"r<br />
'o<br />
.t .l<br />
.r-.0'. .l<br />
.0<br />
ll t. r.i<br />
., r.. - ,io<br />
'.<br />
.r I,r<br />
r-i ;-s- ; i<br />
F/D<br />
Numb.rE O.noro Al8<br />
Figure 3. GM swine frontal impact to the thorax.<br />
-,sr-s<br />
ii
Re*arch Institute (HSRI) study (30) as the indicator of<br />
injury.<br />
The whole of the GM, HSRI, Fayon, Jonsson, and<br />
Eppinger work suggest$ that the most appropriate continuous<br />
injury criteria for frontal impact to the thorax<br />
should be based on at least two kinematic parameters:<br />
maximum deflection of the thorax and the rate at which<br />
the thoracic deflection is produced.<br />
At this time, the best continuous injury criteia is:<br />
(1) The Neathery equation<br />
Ars : r7.4PtD + 0.0313 AGE - 5.15<br />
Plus (both part$ are to be used together)<br />
(2) The following restriction on the rate at which the<br />
thoracic deflection is produced as suggested by Figure<br />
4 if<br />
AV < 30 fps, use Neathery equation<br />
if 30 fps g AV < 40 fps,<br />
use Greater of AIS : 3 or Neathery equation<br />
if 4O fps < AV < 50 fps,<br />
use Greater of AIS : 4 or Neathery equation<br />
I if 50 fps 4 AV,<br />
use Greater of AIS : 5 or Neathery equation<br />
The duration over which the rate of thoracic deflection<br />
is calculated should not exceed 120 msec.<br />
ABDOMEN INJURY CRITERIA-The mechanisms<br />
of injury to various abdominal organs are not well understood.<br />
Biomechanical studies by Stalnaker et al. (31) have<br />
defined tolerance values or injury severity as function of<br />
a dimensionless parameter involving force magnitude, duration<br />
of impact, mass of the impacted subject, and the<br />
area of contact. Melvin et al. (32) have established a<br />
loading rate sensitivity of the isolated liver and kidney to<br />
injury. In a recent study of closed blunt impacts delivered<br />
to anesthetized rabbits, Lau and Viano (33) also dem-<br />
L ^,"-.<br />
SECTION 5: TECHNICAL SESSIONS<br />
ilumbqrr Oonor. AIS<br />
.6 .7 .8<br />
Figure 4. Velocity layers for frontal impact to the thor$(.<br />
"l "f<br />
:l L<br />
t{umb.6 Dmb Alg<br />
,f .2 -3 .,1 ,5 ,6 .7 I<br />
onstrated that injury severity of the liver was velocity<br />
dependent.<br />
One of the earliest studies to try to relate kinematic<br />
parameters to abdominal injury level is a 1953 report by<br />
Winquist et al. (Discussed in Reference 34.). They employed<br />
upright seated swine to examine the effects of<br />
frontal abdominal impacts against objects that might be<br />
struck in an aircraft cockpit. These object$ were a control<br />
wheel, a stick-like protrusion-struck end-on-and a<br />
large, flat surface similar to a radio box. The animals<br />
received impacts in both their midriff and lower abdominal<br />
regions at velocities of 20 and 40 fps. All of the high<br />
velocity exposures were fatal. These data are shown in<br />
Figure 5. These swine weighed from 95-187 pounds.<br />
A regression analysis of these data results in a lower<br />
correlation coeffrcient for AIS as a function of P/D al<strong>one</strong>.<br />
This lower correlation coefficient is probably due to<br />
the AIS : I at P/D : .7. The impactor in that event<br />
was the stickJike protrusion. What may have happenedas<br />
suggested by the second author of Reference (34) in<br />
personal communication-is that the rod went in at a<br />
lower speed and allowed the midriff organs to avoid the<br />
main thrust.<br />
In Reference (35), 15 swine (43-65 pounds) werc exposed<br />
to controlled frontal abdominal impact. The rigid<br />
impactor weighed 30 pounds and had a 3-inch-diameter<br />
circular impacting surface.<br />
The swine test data are shown in Figure 6. Regression<br />
models for this data have a correlation coefftcient of about<br />
0.75.<br />
The data for abdominal impact suggest a dependence<br />
of injury on normalized abdominal penetration and upon<br />
rate of change of the penetration. The data are not abundant<br />
enough to allow the exact understanding of these<br />
parameters (or of possible age effects).<br />
The equation for abdominal impact to the HSRI swine<br />
(frontal) and Winquist swine (frontal) shows some similarity<br />
to the GM work for frontal impact to the thorax.<br />
P/O<br />
Figure 5. Winquist's swine frontal impect to the abdomen.<br />
.s<br />
,ii<br />
l,'<br />
.i<br />
::<br />
J<br />
1<br />
-t
EXPEHTMENTAL SAFETY VEHICLES<br />
:t<br />
F<br />
.<br />
"<br />
.l .o<br />
.r,t<br />
.t i'r'"<br />
- i<br />
,.,t<br />
.i<br />
of several production steering a*semblies via static comp<strong>one</strong>nt<br />
and dynamic systems tests. The selection of steering<br />
assembly types was based on acquiring a cross <strong>section</strong><br />
ofproduction available types ofenergy absorbers as shown<br />
in Table 10. Since publication of this paper additional<br />
research was conducted in this same program. An improved<br />
dynamic systems test was developed where the<br />
complete Hybrid III dummy is impacted <strong>int</strong>o a stationary<br />
assembly. Tests were conducted on four make's types of<br />
steering assemblies (Ford Fairmont, Chevy Citation,<br />
,<br />
Figure 6. HSRI swine frontal impact to the abdomen.<br />
If the assumption is made that severe injury begins to<br />
appear after 30 percent normalized total penetration (the<br />
same as in the thorax for frontal impact), then an injury<br />
criteria can be hypothesized.<br />
The most appropriate conlinuous injury criteria for frontal<br />
abdominal impact are:<br />
(l)<br />
AIS:0<br />
AIS : .15 P,/D - 1.5<br />
AIS:6<br />
plus (both parts are to be used together)<br />
Volvo, and a hybrid type) in the frontal mode at 20 and<br />
25 mph and 30" oblique at 25 mph.<br />
The hybrid steering assembly was constructed from<br />
comp<strong>one</strong>nts which yielded the best results based on eadier<br />
testingr a Ford Fairmont column and energy absorber<br />
and Volvo steering wheel. Table I I shows the results of<br />
the dynamic testing.<br />
P/D < .l<br />
.l
Tebl€ 10. Steering column types.<br />
SECTION 5: TECHNICAL SESSIONS<br />
Make/Model EA Othar Features<br />
Chevrolet Citation<br />
Volvo<br />
Ford Fairmont<br />
Mercedes<br />
Honda<br />
K-car<br />
Ball-tube<br />
Convoluted iacket<br />
Fling-tube<br />
Convoluted hub<br />
Hook bends plate<br />
Cowl bracket guide<br />
Self-aligned wheel<br />
EA unit in lower column<br />
Table 11. Dynamic test results (phase ll).<br />
Column<br />
Test No.<br />
2251<br />
2254<br />
2282<br />
2260<br />
2262<br />
2278<br />
2357<br />
2362<br />
2287<br />
2237<br />
2350<br />
2288<br />
Citation<br />
Citation<br />
Citation<br />
Volvo<br />
Volvo<br />
Volvo<br />
Fairmont<br />
Fairmont<br />
Fairmont<br />
Hybrid<br />
Hybrid<br />
Frontal<br />
Frontal<br />
Oblique<br />
Frontal<br />
Frontal<br />
Oblique<br />
Frontal<br />
Frontal<br />
Oblique<br />
Frontal<br />
Frontal<br />
SCORES (Steering Column and Occupant Response Sim'<br />
ulation) was the subject of an SAE paper by Stucki and<br />
Fitzpatrick (37).<br />
As noted in the report more work was needed to val'<br />
idate the model and to add the capability of modeling<br />
occupant impact with the windshield and,/or header. As<br />
part of a larger computer modeling effort which was<br />
awarded in September 1982, the first task will be to incorporate<br />
the windshield and header <strong>int</strong>o the current<br />
SCORES model and to validate these additions'<br />
A program is currently being conducted at NHTSA's<br />
Safety Research Laboratory (SRL) to validate the<br />
SCORES model. Two passenger cars (Ford Fairmont and<br />
Chevrolet Citation) were selected for the study. All inputs<br />
for the modeling will be obtained from available sources<br />
such as vehicle and dummy specification, through direct<br />
measurement and from testing of dummies and steering<br />
assembly comp<strong>one</strong>nts. Frontal sled tests at 20 and 25<br />
mph were conducted on both vehicles. The unrestrained<br />
driver dummy is the same Hybrid III which was used in<br />
the comp<strong>one</strong>nt tests to ensure consistent responses' These<br />
sled tests will be used as cases for the validation $tudy'<br />
comparing dummy and steering assembly responses pre'<br />
dicted by the SCORES model to the measured responses<br />
in the sled tests.<br />
19.8<br />
24.6<br />
24.9<br />
19.0<br />
25.0<br />
24.9<br />
20.0<br />
25.0<br />
25.0<br />
19.7<br />
25.0<br />
25.1<br />
187<br />
Peak Chest Maximum Chest<br />
Acceleration Deflection Maximum<br />
38.4<br />
46.5<br />
35.5<br />
28,7<br />
49.4<br />
40.5<br />
39.7<br />
61.1<br />
50.6<br />
34.0<br />
47.9<br />
36.6<br />
FUTURE PHOJECTS<br />
3.1<br />
2.6<br />
20.5<br />
1.6<br />
2.5<br />
1.92<br />
1.6<br />
2.9<br />
2.7<br />
1.6<br />
1.95<br />
1.76<br />
0.94<br />
3.75<br />
3.42<br />
3.50<br />
3.1<br />
2.2<br />
3.05<br />
3.8<br />
1.8<br />
2.5<br />
4.5<br />
1.2<br />
A project was recently started by the NHTSA to give<br />
a b€tter understanding of harm resulting from steering<br />
assembly impact and methods of alleviating the problem.<br />
The following tasks, to be conducted, will contribute to'<br />
wards these objectives:<br />
A. Establish relationship between injury and occupant<br />
and vehicle response measurements'<br />
B. Extrapolate this analysis to a national representative<br />
accident environment such as that predicted by thc<br />
NASS and/or NCSS files'<br />
C. Propose countermeasures to reduce injuries and fa'<br />
talities which will be applied to the predicted accident<br />
environment.<br />
D. Analyze the effects of these countermeasures on injury<br />
and fatality, nationwide and select the most<br />
viable candidates for further development through<br />
sled and crash testing.<br />
The spectrum of accidents will be those in which an<br />
injury to the occupant was caused from impact with the<br />
steering assembly. The form of the accident data will be<br />
a multi"element array of the following parameters:<br />
(a) Body region injured.
(b)<br />
(c)<br />
(d)<br />
AIS level: I through 6.<br />
Vehicle Make/model, 1975 and later.<br />
Occupant size and sex: A maximum of 3 categories<br />
for each.<br />
(e) Principle Direction of Force (PDOF): l l, 12, and I<br />
o'clock.<br />
(f) Object contacted: Other vehicle or fixed object.<br />
(g) Velocity change: Either 5 or 10 mph increments from<br />
5 to 35 mph.<br />
The SCORES computer model will be exercised for<br />
each cell of this matrix, i.e., for each make,/model vehicle,<br />
occupant size, and sex, PDOF, object contacted, and velocity<br />
change SCORES will predict responses for each<br />
body region (for SCORES this is limited to head, chest,<br />
abdomen, and femurs). These responses will be converted<br />
to injury level (AIS) by the applicable biomechanical criteria<br />
for the particular body region. The outcome of this<br />
exercise will be an AIS level for each cell in the multielement<br />
array. The frequency ofoccurrence can be applied<br />
to each cell and summed to give overall frequency of each<br />
AIS level for comparison with the actual accident file. If<br />
the AIS distributions are not similar between the<br />
SCORES prediction and the actual accident data, adjustments<br />
will be made to the SCORES inputs until good<br />
agreement is achieved.<br />
One of the major effofts of this project is to acquire<br />
the inputs necessary to exercise SCORES on each cell of<br />
the matrix. The Transportation Systems Center (TSC)<br />
has responsibility for providing all vehicle dimensions for<br />
approximately 40 post-1974 passenger car lines which<br />
account for more thzn 9OVo of the passenger cars produced<br />
in this period (<strong>one</strong> car line will generally include<br />
several models). These measurement$ include dimensions<br />
such as steering column angle, wheel location, etc., and<br />
force-deflection properties of the wheel rim and energy<br />
absorber unit in the column.<br />
TSC is also generating vehicle crash pulses for different<br />
velocity change, PDOFs, and object contacted. The final<br />
requirement for input is the anthropometric and biomechanical<br />
properties ofthe various occupant sizes for each<br />
sex. Much of this information currently exists for certain<br />
size occupants and may have to be extrapolated to other<br />
size occupants using engineering judgment.<br />
The output of the SCORES model will be verified by<br />
checking against results of other models, such as the<br />
MVMA-2D, and sled and crash test results. The input<br />
parameters will continually be upgraded by this verification<br />
process and by the latest biomechanical criteria.<br />
One of the primary injury risks to occupants involved<br />
in collisions is the relative velocity at which the occupant<br />
strike$ <strong>int</strong>erior contact surfaces. The SCORES output will<br />
provide the information, in terms of body part velocities<br />
and responses, needed to construct relationships between<br />
body part response (which can be converted to an injury<br />
level) and impact velocity. Figure 7 shows this relation-<br />
EXPERIMENTAL SAFEW VEHICLES<br />
188<br />
cfrcrt Deflamion<br />
I Stsrnum v.tfttty<br />
{in.l<br />
I (to"t<br />
3.0 l-. 30<br />
--<br />
zs<br />
Ias<br />
'ol-'<br />
l<br />
r.s<br />
I rs<br />
,of,'o<br />
I<br />
0-- ;<br />
"nu*t 9l--<br />
.,,<br />
10 15 2{r<br />
Vslocity at lfrpdcr lmphl<br />
Figure 7. Chest/steering wheel hub impact.<br />
I I Ch6Bt G'e<br />
i<br />
I<br />
I<br />
lt*<br />
-l ao<br />
I<br />
lso<br />
j*<br />
ship for the chest impacting the steering wheel hub, where<br />
the given responses are the most probable indicators of<br />
chest injury level. This is a preliminary analysis based on<br />
several SCORES runs with a 5fth percentile male occupant<br />
and 1979 Volvo dimensions and properties. Once<br />
relationships such as these have been developed, countermea$ures,<br />
which will lower the injury risk, in this case<br />
impact velocity, can be investigated using the SCORES<br />
Model.<br />
SUMMARY<br />
The steering column is responsible for producing more<br />
injuries and fatalities than any other vehicle comp<strong>one</strong>nt:<br />
27Vo of all serious to fatal (AIS 3-6) injuries. Steering<br />
assembly impact with the chest and abdomen accounts<br />
for over AOVI of all serious injuries.<br />
The most appropriate continuous injury criteria for<br />
frontal impact to the thorax are based on maximum deflection<br />
and the rate at which the thorax deflection is<br />
produced. The most appropriate injury criteria for abdominal<br />
impact are abdominal penetration and rate of<br />
change of penetration.<br />
An improved dynamic systems test has been developed<br />
and the performance of several steering assemblies evaluated.<br />
A steering assembly computer model has been developed<br />
and is being validated.<br />
We are establishing the relationship between injury and<br />
occupant and vehicle re$ponse measurements, investigating<br />
countermeasures, and analyzing the effects of these<br />
countermeasures on injury reduction.<br />
1'<br />
I<br />
I
REFERENCES :<br />
SECTTON 5: TECHNICAL SESSIONS<br />
L Marquis, D.P., "The General Motors Energy Absorbing<br />
Column" SAE Report 670039, Society of<br />
Automotive Engineers.<br />
2. Recommended Practice J944, 1981 SAE Handbook,<br />
Society of Automotive Engineers.<br />
3. Federal Register, Vol. 31, National Archives, Washington,<br />
D.C., July 15, 1956, pg. 9631-2.<br />
4. Kahane, C. J., "An Evaluation of Federal Motor<br />
Vehicle Safety Standards for Passenger Car Steering<br />
Assemblies; Standard No. ZO3-Impact Protection<br />
for the Driver, Standard No. Z04-Rearward Column<br />
Displacement," DOT Report No. DOT-HS-805 705,<br />
1981.<br />
5. Federal Register, Vol. 32, National Archives, Washington,<br />
D.C., February 3, 1967, pg.2414.<br />
6. Garrett, J. W., "A First-Look-Difference$ in Injurics<br />
in l96E and Pre-1968 Automobiles," Society of Automotive<br />
Engineers Report No. 680542, August 1968.<br />
7. Huelke, D. F., and Chewning, W. A., *'The Energy<br />
Absorbing Steering Column," Highway Safety Research<br />
Institute, Report Bl0-7, 1968, (DOT-HS-002<br />
615).<br />
8. Nahum, A. M., Siegal, A.W., and Brooks, S., "The<br />
Reduction of Collision Injuries; Past, Present, and<br />
Future," Society of Automotive Engineers, Report<br />
No, 700895. 1970.<br />
9. Levine, D. N., and Cambell, B. J., "Effectiveness<br />
of<br />
Lap Belts and the Energy Absorbing Steering Systems<br />
in the Reduction of Injuries," Highway Safety Research<br />
Center, November 1971, (DOT-HS-O11 537).<br />
10. O'Day, J., and Creswell, J. S., "Can The Effect of<br />
Changes in Vehicle Design be Seen in Mass Accident<br />
Data?" HIT LAB Reports, University of Michigan,<br />
February l97l (DOT-HS-009 8ll).<br />
I L Mclean, A. J., "Collection and Analysis of Collision<br />
Data for Determining the Effectiveness of Some Vehicle<br />
Systems" Motor Vehicle Manufacturers Association.<br />
1974.<br />
12. Kahane, C. J., "Evaluation of Current Energy Absorbing<br />
Steering Assemblies" Society of Automotive<br />
Engineers, Report No. 820473, 1982.<br />
13. Federal Register, Vol.44, No. 321, National Archivee,<br />
Washington, D.C., November 29, 1979.<br />
14. Huelke, D. F., and Gikas, P. W., "How Do They<br />
Die? Medical Engineering Data From On-Scene Investigation<br />
of Fatal Automobile Accidents" Highway<br />
Vehicle Safety, Society of Automotive Engineers,<br />
I 968.<br />
15. Malliaris, A.C., Hitchcock, R., and Hedlund, J., "A<br />
Search For Priorities In Crash Protection", Society<br />
of Automotive Engineers, Report No. 820242, 1982.<br />
16. Cohen, D. S., Jettner, E., and Smith, W. E., "Light<br />
Vehicle Frontal Impact Protection", Society of Automotive<br />
Engineers, Report No. 8202,13, 1982.<br />
17. Stucki, S.L., and Hannemann, N., "Study of Steering<br />
189<br />
Assemblies for Evaluation and Rating of Safety Performance",<br />
Society of Automotive Engineers, Report<br />
No. 820476, 1982.<br />
18. Gloyns, P. F., and Mackay, G. M., "Impact Performance<br />
of Some Designs of Steering Assembly in<br />
' Real Accidents and Under Test Conditions", SAE<br />
Paper 741 176, Proceedings of the Eighteenth Stapp<br />
Car Crash Conference. 1974.<br />
19. Garrett, J. W., and Hendricks, D. L., "Factors Influencing<br />
the Performance of the Energy Absorbing<br />
Steering Column in Accidents", 5th International<br />
Conference on Experimental Safety Vehicles, London,<br />
England, June 1974.<br />
20. Viano, D. C., and Warner, C. Y., "Thoracic Impact<br />
Response of Live Porcine Subjects", 20th Stapp Car<br />
Crash Conference, October 1976.<br />
21. Kroell, C. K., Schneider, D. C., and Nahum, A.M.,<br />
"Impact<br />
Tolerance and Response of the Human<br />
Thorax II", 18th Stapp Car Crash Conference, December<br />
4-5, 1974.<br />
22. Neathery, R. F., Kroell, C. K., and Mertz, H. J.,<br />
"Prediction<br />
of Thoracic Injury from Dummy Responses",<br />
l9th Stapp Car Crash Conference, November<br />
l7-19, 1975.<br />
23. Nahum, A.M., Schneider, D. C., and Kroell, C. K.,<br />
"Cadaver<br />
Skeletal Response to Blunt Thoracic Im,<br />
pact", l9th Stapp Car Crash Conference, November<br />
17-19. 197s.<br />
24. Draper, N. R., and Smith, H., "Applied Regression<br />
Analysis", Second Edition, John Wiley and Sons,<br />
Inc., New York, 1981, pg. 8.<br />
25. Eppinger, R. H., and Chan, H. S., "Thoracic Injury<br />
Prediction via Digital Convolution Theory", 25th<br />
Stapp Car Crash Conference, October 1981.<br />
25. Fayon, A., Tarriere, C., Walflrsch, G., Got, C,, and<br />
Patel, A., "Thorax of 3-Po<strong>int</strong> Belt Wearers During<br />
a Crash (Experiments with Cadavers)", lgth Stapp<br />
Car Crash Conference, November 17-19, 1975.<br />
27. Jonsson, A., Clemedson, C. J., Sundquist, A. 8., and<br />
Arvebo, E., "Dynamic Factors Influencing the Production<br />
of Lung Injury in Rahbits Subjected to Blunt<br />
Chest Wall Impact", Aviation, Space, and Environment<br />
Medicine, Vol. 50, No. 4, April 1979, pp. 325-<br />
JJ /.<br />
28. Viano, D. C., Kroell, C. K., and Warner, C. Y.,<br />
"Comparative<br />
Thoracic Impact Response of Living<br />
and Sacrificed Porcine Siblings", 2lst Stapp Car<br />
Crash Conference, October l9-21, 1977.<br />
29. Kroell, C. K., et al., "Interrelationship<br />
of Velocity<br />
and Chest Compression in Blunt Thoracic Impact to<br />
Swine", 25th Stapp Car Crash Conference, September<br />
28-30,1981.<br />
30. Melvin, J. W., Mohan, D., and Stalnaker, R. L.,<br />
"Occupant<br />
Injury Assessment Criteria", Warrendale,<br />
Pennsylvania, SAE Paper No. 750914, 1975.<br />
31. Stalnaker, R. L., et al., "Door Crashworthiness Cri-
'<br />
teria", Final Report for Contract No. DOT-HS-031-<br />
2-382, September 1973.<br />
32. Melvin, J. W., et al., "Impact Injury Mechanisms in<br />
Abdominal Organs", l7th Stapp Car Crash Conference.<br />
November 1973.<br />
33. Lau, V. K., and Viano, D. C., "Influence of Impact<br />
Velocity on the Severity of Nonpenetrating Hepatic<br />
Injury", Journal of Trauma, Vol. 21, November 2,<br />
198 t.<br />
34. Mertz, H. J., and Kroell, C. K., "Tolerance of Thorax<br />
and Abdomen", fmpact Injury and Crash Protection,<br />
Charles C. Thomas, Springfield, Illinois, 1970.<br />
EXPEHIIVIENTAL SAFETY VEHICLES<br />
A Study on the Ride-Down Evaluation<br />
HIROSHI KATOH and RYOJI NAKAHAMA<br />
Passenger Car Engineering Center<br />
Mitsubishi Motors Co., Ltd,<br />
ABSTRACT<br />
3667<br />
v<br />
The injury of occupants restrained by seat belt is dominantly<br />
affected by the vehicle crash characteristics and<br />
seat belt effectiveness. Matching both performances is<br />
essential in attaining occupant's safety with most reasonable<br />
weight and cost.<br />
Hitherto the effrciency of occupant's energy disposal<br />
has been evaluated in terms of a concept of Ride-Down,<br />
a ratio of energy absorbed vicariously by the vehicle to<br />
the occupant's initial kinetic energy.<br />
This long established idea, however, has a certain limit<br />
for further analysis. In this paper, a new method of assessing<br />
relative effectiveness of vehicle structure and seat<br />
belt system is proposed to enable to attain a balanced<br />
approach as a whole.<br />
The Ride-Down efficiency is decomposed to <strong>one</strong> that<br />
concerns vehicle structure and the other that relates to<br />
restra<strong>int</strong> system. The former is determined as relative<br />
Ride-Down effrciency when the simulated system of the<br />
vehicle is subjected to collision with a standard restra<strong>int</strong><br />
system. The latter is obtained in the relation of conventional<br />
and the newly obtained method.<br />
The two-way Ride-Down approach paves the way to<br />
indicating straightforwardly the most effective direction<br />
in which occupant protection is harmoniously attained in<br />
each vehicle design.<br />
INTRODUCTION<br />
The trend toward smaller car and weight reduction of<br />
automobiles has progressed increasingly to save energy<br />
and material.<br />
190<br />
35. Beckman, D. L., et al., "fmpact Toleranc+Abdom,<br />
inal Injury", Report No. DOT-HS-800 549, June 30,<br />
r971.<br />
36. Broadhead, W. G., Final Report, Contract No.<br />
DTNH22- 82 -P -O7 024, "Development of a Measuring<br />
Device for Chest Contact Area", June 30, 1982.<br />
37. Stucki, S. L., and Fitzpatrick, M. U., "A Computer<br />
Model for Simulating an Unrestrained Driver in<br />
Frontal Collisions", $ociety of Automotive Engineers<br />
Report No. 820469, 1982.<br />
To make down-sizing and safety compatible, it is well<br />
known to be important to utilize Ride-Down phenomena<br />
effectively.<br />
Many studies (Refs. l-8) have been made regarding<br />
what kind ofvehicle crash characteristics or seat belt <strong>one</strong><br />
can decrease occupant injury with.<br />
However, there seems no study to clarify the effect of<br />
seat belt and vehicle crash characteristics on Ride-Down<br />
efficiency. It is diffrcult to separate the effect of seat belt<br />
and that of vehicle body, since Ride-Down phenomena<br />
consist of a combined effect of vehicle crash characteristics<br />
and seat belt <strong>one</strong>s.<br />
Here an idea, which we call "Ride-Down index," is<br />
<strong>int</strong>roduced and utilizied for safety design to evaluate each<br />
effect of vehicle body and seat belt separately.<br />
RELATIONSHIP BETWEEN RIDE-DOWN<br />
EFFICIENCY AND PASSENGER<br />
CHEST DECELERATION<br />
Figure I shows the macrosocopic model of vehicle collision<br />
against fixed barrier. K is a spring which denotes<br />
seat belt and is assumed constant.<br />
Passenger energy absorption is written in equation (l).<br />
l/ZMYoz = M)'(rdX, + l/2 K (Xr - Xr)' (l)<br />
where M<br />
!o<br />
+,<br />
xr<br />
x2<br />
K<br />
Passenger mass<br />
Velocity at collision<br />
Passenger deceleration<br />
Passenger displacemcnt<br />
Vehicle displacement<br />
$pring constant of seat belt<br />
The first term of right hand of equation (l) denotes<br />
the energy which vehicle body vicariously absorbs and is<br />
generally called Ride-Down energy. The rate of Ride-<br />
Down energy to initial passenger kinetic energy (l/2 M<br />
Vo') is called Ride-Down effrciency. That is
Figure 1. Macroscopic model of collision.<br />
Ride-Down energy:<br />
Ride-Down efficiency:<br />
K(BTLT)<br />
ilfr = -K ( Xr - Xz)<br />
r<br />
Er= | t',lir d Xz<br />
rXffi<br />
E:I'M)i,dx,<br />
.lo<br />
f'^tli,dx,<br />
t<br />
n':y2yJffir<br />
where Xrmax : Maximum vehicle displacement<br />
Furthermore. it is well known that Ride'Down effi'<br />
ciency is closely related to occupant injury value. Figure<br />
2 shows this relationship between Ride-Down efftciency<br />
and passenger chest deceleration of frontal collision tests<br />
at 35 mph. Here Ride-Down efftciency is calculated according<br />
to equation (2) where t, is replaced with fore<br />
and aft comp<strong>one</strong>nt ofpassenger chest deceleration. These<br />
data are based on 35 mph collision tests performed on<br />
various vehicles since 1978 as a part of NCAP (New Car<br />
Assessment Program) by NHTSA (National Highway<br />
Traflic Safety Administration) in U.S.A.<br />
Figure 2 clearly indicates the relationship that passenger<br />
chest deceleration decreases as Ride-Down efTiciency<br />
increases.<br />
However, since Ridc-Down efficiency, as shown in Figure<br />
I and equation (2), is the result of a combined effect<br />
of both vehicle body and seat belt, each effect cannot bc<br />
estimated separately. But from the standpo<strong>int</strong> of safety<br />
design, if each effect of vehicle body and seat belt can be<br />
estimated independently, it is very useful.<br />
INTRODUCTION OF "RIDE-DOWN<br />
INDEX''<br />
Considering the collision model shown in Figure 1, we<br />
assume that seat belt has the characteristics shown in<br />
SECTION 5: TECHNICAL SESSIONS<br />
(2)<br />
LD<br />
ts<br />
O<br />
G<br />
50<br />
qij<br />
lil<br />
30 q3 50 60 7l "t"<br />
RII]E_D()IiN EFi:ICITNCY (CHEST DECILiRATIOiI)<br />
Figure 2. Passenger chest G and Flide-Down efficiency.<br />
Figure 3(A), where spring rate K is constant and initial<br />
slack 6o is chosen as a parameter of seat b€lt characteristics.<br />
Besides vehicle crash characteristics are defined by<br />
sine wave deceleration time history shown in Figure 3(B),<br />
and maximum deceleration Gm is selected as a parameter<br />
of vehicle body characteristics. Because the collision velocity<br />
is constant (35 mph), Gm.Tt becomes constant.<br />
In this simple model, Ride-Down effrciency qt becomes<br />
a function of two variables (Gm, 6o). In order to obtaiu<br />
each effect of vehicle body and seat belt, we keep either<br />
Gm or 6o constant and vary the other. Then "Ride-Down<br />
index of vehicle body" 4v is for convenience deflrned as<br />
a function of Gm (while 6u : const.). Similarly "Ride-<br />
E<br />
d<br />
J<br />
rrJ<br />
E4<br />
(5<br />
u<br />
-J<br />
I<br />
-<br />
H<br />
><br />
SIROI(E (Xr -Xz)<br />
(A) S[P.T B[LI CHARACTTRISIICS<br />
TII'lE ( t)<br />
Tt<br />
(B) VEII ICLE DTCILEI',,'t.TIiII II I STIPY<br />
Figure 3. Conditions used for calculation.<br />
= Gm'SIN(r<br />
G*'Tt = CI,NST<br />
'I<br />
'<br />
..H<br />
.,'/-
Down index of seat b€lt" tb is deflrned as a function of<br />
6o (while Gm : const.). That is<br />
Ride-Down effrciency 4t : /(Dq, Gm)<br />
Ride-Down index of<br />
vehicle body 4v : /(60", Gm); Dog<br />
: const. (5 mm) (3)<br />
Ride-Down index of<br />
seat belt qb : /(8* Gmu); Gmu<br />
: const. (l7G)<br />
where<br />
8o : seat belt slack<br />
60" : the slack of the standard seat belt (5 mm)<br />
Gm : maximum vehicle deceleration<br />
Gmu: maximum vehicle deceleration of the standard<br />
vehicle (17 c)<br />
The value of Suu, Gmu is selected practically as the most<br />
optimum value after various attempts were made.<br />
Then, simulation calculation results in the constant 4t<br />
curves shown in Figure 4. Now 4t is divided <strong>int</strong>o 4b and<br />
4v. Therefore we can estimate each effect of vehicle body<br />
and seat belt on the Ride-Down effrciency Tt, and the<br />
most cost-benefit direction on the improvement of Tt can<br />
be indicated. The change in 4t due to the variation in 4v<br />
or r1b can be respectively estimated using Figure 4. For<br />
example, in case of 4t : SOTo and r1b : 40To, r1v is<br />
shown to be large, about 807o. Therefore to increase 4t,<br />
it seems more practical to improve r;b rather than 4v.<br />
On the other hand,in case of 4t : 307o, qv : 4OVo, it<br />
seems better to improve 4v rather than qb.<br />
Figure 5 shows the flow chart of actual improvement<br />
method.<br />
Figure 4. Constant value lines of 4t.<br />
EXPEHIMENTAL SAFETY VEHICLES<br />
192<br />
ORIGII{AL VEHICI.E<br />
CMSH TTSI<br />
SII'IULATION<br />
CALCULATION<br />
/ I{ECESSARY OUAI{IITY \<br />
\ oF rr'rpnovrnrHr I<br />
I I'lPR{]VED VEH I CLE<br />
Figure 5, Flow chart of improvement method.<br />
THH METHOD TO OBTAIN rb AND rv lN<br />
ACTUAL TEST<br />
First, 4t is obtained from actual test data by substituting<br />
the fore and aft comp<strong>one</strong>nt of passenger chest<br />
deceleration ur j(, <strong>int</strong>o equation (2).<br />
In order to obtain 4v, two-dimensional simulation<br />
model shown in Figure 6 is used. Here seat belt characteristics<br />
shown in Figure 7 are applied for all vehicles,<br />
and for vehicle crash characteristics. vehicle deceleration<br />
time history of the actual test is used. Then 4v is obtained.<br />
Two-dimensional simulation model is used here instead<br />
of <strong>one</strong>-dimensional model shown in Figure I because the<br />
chest deceleration can be calculated in two-dimensional<br />
model. Then 4v using the chest deceleration in two-dimensional<br />
simulation becomes comparable with 4t substituting<br />
the chest deceleration measured in actual test as<br />
described above.<br />
Accordingly 4b can be known when 4t, Tv are plotted<br />
on Figure 4. Now the effect of vehicle crash characteristics<br />
and seat belt characteristics on Ride-Down efficiency in<br />
actual test can be obtained separately.
Figure 6. Two-dimensional<br />
simulation model.<br />
Here a consideration mutt be gtven to the fact that 4v<br />
and 4b are not really independent, so evaluation by r;v<br />
and 4b are not absolute but relative. However, within the<br />
scope ofactual vehicle collision, 4v and 4b are considered<br />
to be ofpractical signifrcance in evaluating each functions<br />
of the various vehicles relatively.<br />
4b can be approximately obtained by the following<br />
simple method. As we take 8o as a parameter of seat belt<br />
characteristics, consider the seat belt slack 6,*, which<br />
indicates relative displacement between passenger and vehicle<br />
when shoulder belt load reaches 100 kg (220 lb.).<br />
S,*: relative displacement between passenger and vehicle<br />
when shoulder belt load reaches 100 kg (220 lb.).<br />
Here 6,* is chosen instead of 8o in Figure 3(A), because<br />
it is diffrcult to obtain So in actual test.<br />
Figure 8 shows the relationship between rlb and D,*.<br />
It can be said that they are mutually related. From Figure<br />
8, r1b can be approximately obtained if 6100 is known.<br />
APPLICATION TO TEST DATA<br />
Figure 9 shows the summary of qv, 4b for various<br />
vehicles subjected<br />
to NCAP crash tests at 35 mph, The<br />
200 300 400t0t (r<br />
5TR0xI 5rh0(E<br />
Figure 7. Seat belt characteristics<br />
used for calculation.<br />
SECTION 5: TECHNICAL SESSIONS<br />
193<br />
90<br />
80<br />
70<br />
nELr slecr 1/,,,,, 1<br />
Figure 8. Seat belt slack and 4b.<br />
data are classified based on whether the vehicle passed<br />
injury criteria of FMVSS 208 or not"<br />
To pass injury criteria, qt Z 507o becomes a necessary<br />
condition.<br />
Furthermore, improvement direction and quantity can<br />
be easily obtained from Figure 9. For example, 4v of<br />
vehicle A is almost the same as that of vehicle B, but 4b<br />
is considerably different and as a result vehicle B could<br />
not pass injury criteria. If vehicle B were equipped with<br />
the same seat belt as vehicle A, vehicle B could be expected<br />
to pass the criteria. Keeping 4b at the same value,<br />
and increasing Tv up to 83Vo, a similar result could be<br />
expected.<br />
EXAMPLE OF ACTUAL IMPROVEMENT<br />
Figure l0 shows a result of improvement on vehicle C1<br />
in Figure 9. As t1v of vehicle C1 is relatively high, im-<br />
Figure 9. Test data ananged by 4v and 4b.<br />
o C0tiPLIED lllTH It{JURy CFTITERIA<br />
r fl(]r C0HPLIID<br />
c0'lPLL,l{CE LIirilI<br />
(2t =stlz)
(l<br />
U<br />
I<br />
ORIGGGGGIl{AL Ib= 0.57<br />
Figure 10. Example improved by increasing qb (C, and C,<br />
car in Figure 9).<br />
provement of 4b was made. In original test (C,) 8rm :<br />
120 mm and 4b : 57Vo. To pass injury criteria, 4b must<br />
be increased np to 75Yo and seat belt slack 6,* must be<br />
shortened by about 60 mm from Figure 8. Therefore seat<br />
belt retractor was modified to minimize the spool-effect<br />
:J<br />
-U<br />
F<br />
U<br />
a<br />
U<br />
2 U<br />
il<br />
n.<br />
Lb<br />
q"f<br />
*l<br />
I<br />
st H<br />
o I I4PR0VED<br />
f I<br />
I ORI6IIIAL<br />
50 70 tio E<br />
7'n<br />
EXPERIMENTAL SAFETY VEHICLES<br />
i 50 MSEC<br />
!p= 0,56<br />
///oRltrINAL<br />
= 0,65<br />
//MrnuED4l6<br />
Figure 11. Example improved by increasing tb (at 30 mph).<br />
194<br />
p<br />
U<br />
J<br />
=U<br />
><br />
{9<br />
F<br />
6<br />
E<br />
L2<br />
#<br />
@<br />
L<br />
It'lPRovED'Uv= J.t;<br />
n/ *,.;<br />
Figure 12. Example improved by increasing both tv and 4b<br />
(D, and D"
I<br />
G<br />
e3o<br />
J<br />
H =<br />
o<br />
€<br />
@<br />
@<br />
L<br />
6<br />
0<br />
50<br />
40<br />
4,<br />
7<br />
70<br />
60<br />
'60<br />
P IttPRovED<br />
I<br />
J t)RIGINAL<br />
70 80 I<br />
71<br />
IrV<br />
It'lPR0vED<br />
zr - 0.68<br />
0RlrJIllAL<br />
?u = 0,68<br />
SECTION 5: TECHNICAL SESSIONS<br />
ORtGti,lAL ?5 = 0,61<br />
I 50 M5EC<br />
Figure 14. Example improved by increasing both 4v and 4b<br />
(at 30 mph).<br />
Figures 13 and 14 also show the test results of the<br />
similar improvement made on both vehicle body and seat<br />
belt. Generally, if the base body structure is unchanged,<br />
it seems very hard to increase 4t without changing the<br />
front side member layout largelY.<br />
CONCLUSION<br />
(l) Ride-Down efficiency qt has a close relation to the<br />
occupant injury value in the vehicle frontal collision.<br />
(2) The new idea to separate the effect of seat belt and<br />
vehicle body on the Ride'Down efftciency (4t) is proposed.<br />
(3) The vehicle crash characteristics can be evaluated by<br />
Ride-Down index of vehicle body (4v) which is obtained<br />
by using the mathematical simulation with the<br />
standard seat belt.<br />
(4) The seat belt characteristics can be evaluated by Ride-<br />
Down index of seat belt (qb) which is obtained by<br />
using the mathematical simulation with the standard<br />
vehicle body.<br />
(5) By using 4b and 4v, the problem of which side and<br />
how much improvement of vehicle body and seat belt<br />
should be made is easily clarified. This idea of Ride-<br />
Down index is practically useful for safety design.<br />
REFERENCES<br />
R. McHenry et al., "Computer Simulation of the Crash<br />
Victim-A Validation Studyn', SAE 660792.<br />
H. Furusho, "Effect of Vehicle Body Crush Ctarecteristics<br />
on Occupant Second Collision", JSAE VOL<br />
22. No. 8. 1968.<br />
D. F. Moore, **Minimieation of Occupant Injury by<br />
Optimum Front-End Design", 1970 International Automobile<br />
Safety Conference Compendium.<br />
R. McHenry, "Analysis of the Dynamics of Automobile<br />
Passenger-Restra<strong>int</strong> System", 7th Stapp Car<br />
Crash Conference.<br />
K. Higuchi, "Characteristics of Body Energy Absorption<br />
and Restra<strong>int</strong> System", sth Internetional Technical<br />
Conference on E.S.V.<br />
N. Aya, "A Method How to Estimate the Crashworthiness<br />
ofBody Construction", 6th International Technical<br />
Conference on E.S.V.<br />
N. Bohlin, "Safety and Comfort Factors in Volvo Occupant<br />
Compartment Packaging", SAE 780135.<br />
H. Nakaya, "Collision l.<br />
7.<br />
Safety Design by Structural<br />
Analysis", JSAE VOL 34, No. 9, 1980.<br />
Optimlzing Knee Heetralnt Characteristlcs for lmpr6ved<br />
Air Bag System Performance of a $mall Car<br />
HIDEO TAKEDA and SABURO KOBAYASHI<br />
HondaR&DCo.,Ltd. 1J ( E.r--<br />
ABSTRACT<br />
The two known systems for restraining vehicle occupants<br />
in a crash situation are the seat belt and the air<br />
bag. A series of head-on crash tests against a barrier<br />
indicated that these restraining devices present widely<br />
different G waveforms for the chest of a dummy seated<br />
195<br />
behind the steering wheel as the crash pulse becomes more<br />
severe. The dummy chest, when restrained by a seat belt,<br />
showed a gentle G waveform, while with an air bag, it<br />
presented another waveform with unusual spikes.<br />
An analysis of the test findings reveals that spikes in<br />
chest G are always accompanied by similar spikes in G<br />
for the pelvis. It was found that this is attributable to a<br />
substantial shock when the dummy's upper leg contacts<br />
the molded pelvic structure. This suggests that the existing<br />
dummy might have some structural deficiency. This con-<br />
:d I<br />
4<br />
:l]<br />
, "i<br />
.A<br />
:l
tact occurs when the restraining force for the upper torso<br />
of the dummy is much less than that for the pelvis.<br />
An air bag was used to restrain the driver's upper torso<br />
and a knee restra<strong>int</strong> to hold the pelvis. The restraining<br />
force for the upper torso was limited by the characteristics<br />
ofthe bag. Therefore, use ofa softer knee bolster appeared<br />
to be the only available alternative for keeping the upper<br />
and lower restraining forces well-balanced.<br />
Another series of crash tests was conducted on an<br />
improved air bag system using softer knee bolsters. The<br />
findings indicate that the improved system can allow<br />
gentle G waveforms even with severe crash pulses despite<br />
the shortcoming of the existing dummy.<br />
INTRODUCTION<br />
A series of head-on erash tests against a barrier was<br />
conducted to develop a suitable air bag for small cars.<br />
When the vehicle crash speed was increased from 30mph<br />
to 35mph and the vehicle $tructure modified accordingly,<br />
unusual spikes began to appear frequently in chest G for<br />
the driver side dummy. Available data were analyzed by<br />
various methods to find why such spikes occur and how<br />
they could be precluded. This report discusses the research<br />
efforts that have successfully solved the chest G<br />
spike problem.<br />
AIR BAG/SEAT BELT-RESTFIAINED<br />
DRIVER CHEST G<br />
Figures I and 2 present typical chest G for the driver<br />
dummy restrained by two alternative methods-an air<br />
bag and a seat belt-in 30mph and 35mph head-on crash<br />
tests against a barrier. The dummy chest, when restrained<br />
by a seat belt, continued to show a gentle G waveform<br />
with no appreciable change even if the crash speed was<br />
increased to 35mph, while with an air bag, it presented<br />
another waveform with unusual spikes at 35mph crash<br />
speed.<br />
G<br />
goo<br />
U)<br />
u<br />
T<br />
(J ZW<br />
0<br />
G<br />
rg 6o<br />
F<br />
U'<br />
U<br />
Sro<br />
o<br />
3OmFh HEAD-ON CRASH<br />
36moh HEAD-ON CfiASH<br />
TIME(nrs)<br />
Figure 1. Air bag-restrained<br />
driver dummy chest G.<br />
EXPERIMENTAL SAFEW VEHICLES<br />
196<br />
G<br />
o6o<br />
F<br />
u)<br />
U<br />
(J20<br />
o<br />
G<br />
tr6o<br />
-<br />
U<br />
T<br />
(J20<br />
0<br />
3orneh HEAD-ON CRASH<br />
TIME(mS)<br />
Figure 2. Seat belt-restrained driver dummy chest G.<br />
CONCEIVABLE CAUSES OF UNUSUAL<br />
CHEST G SPIKES<br />
Initially, we simply auributed the unusual spikes in<br />
chest G to inadequate energy-absorbing capability of the<br />
air bag system. Therefore a variety of techniques were<br />
developed to increase the energy-absorbing capability including<br />
the use ofa larger air bag, increased gas generator<br />
capacity, and a longer stroke for the energy-absorbing<br />
column. N<strong>one</strong> of them resulted in any appreciable improvement.<br />
Longitudinal, vertical, and lateral G traces were separately<br />
analyzed in relation to the position of the dummy<br />
from high speed films. The analysis revealed that a vertical<br />
G spike always appeared immediately preceding a longitudinal<br />
G spike. The findings led to the assumption that<br />
unusual spikes in chest vertical G create big longitudinal<br />
G with high peaks and deep valleys. (See Fig. 3.) The<br />
dummy's behavior was carefully examined with particular<br />
attention given to the movement of its pelvis because this<br />
region is the only conceivable source ofvertical G input.<br />
LONG.<br />
VERT<br />
LAT.<br />
G<br />
20<br />
o<br />
-?0<br />
35meh HEA0.ON CFASH<br />
TIME (ms)<br />
Figure 3. Typical measured chest G with unusual spike.
Figure 4. Typical measured pelvis G.<br />
As shown in Figure 4, it was found that the vertical<br />
G for the pelvis has similar spikes as those in the<br />
chest vertical G.<br />
Figure 5 shows another important finding: these spikes<br />
occur when the hip jo<strong>int</strong>s reach their maximum angle<br />
due to the upper leg segments firmly contacting the<br />
molded pelvic structure. Unlike the dummy, we can bend<br />
over until our thighs touch the abdomen. This suggests<br />
that the existing dummy might have some structural deficiency.'The<br />
impact occurring under this condition is<br />
presumably transmitted to the chest through the steel<br />
cable which forms the central core of the lumbar spine<br />
as shown in Figure 5.<br />
RESEAHCH EFFORTS TO REDUCE<br />
CHEST G SPIKES<br />
Chest G spikes might occur, as noted earlier, when the<br />
dummy's hip jo<strong>int</strong>s are bent to the utmost limit. It was<br />
assumed therefore that the spikes could be removed simply<br />
by reducing the extent to which the hip jo<strong>int</strong>s bend<br />
in a crash test.<br />
Figure 5. Excessive bending of hip io<strong>int</strong>.<br />
SECTION 5: TECHNICAL SESSIONS<br />
LUMBAR SPINE STRUCTURE<br />
Major Factors of Large Hip Jo<strong>int</strong> Bending<br />
_ _ - _ =<br />
In our crash tests on air bag systems, the dummy's<br />
upper tor$o was restrained by an air bag, while pelvis was<br />
held by a knee bolster. The sharp bending ofthe hipjo<strong>int</strong>s<br />
is attributable to a large difference between these two<br />
system$ in developing restraining force. (See Fig. 6.)<br />
The air bag cannot develop a restraining force as<br />
quickly as the knee bolster since the gas inside the bag<br />
has to be compressed by the dummy to some extent to<br />
produce a suffrcient reaction force, The difference between<br />
these systems' initial restraining forces permits the upper<br />
torso of the dummy to move forward substantially more<br />
than the lower part in a crash situation. This is probably<br />
why the hip jo<strong>int</strong>s bend sharply.<br />
As noted earlier, unusual spikes in chest G began to<br />
appear after the vehicle crash speed was increased to<br />
35mph and the vehicle structure stiffened as required, In<br />
other words. a crash of a stiffer vehicle structure at a<br />
speed 5mph faster than the previous level reduced the<br />
crash pulse duration. As the crash pulse becomes more<br />
severe, the imbalance in restraining forces between thc<br />
air bag and knee bolster systems becomes greater. This<br />
is a significant factor affecting hip jo<strong>int</strong> bending.<br />
System lmprovements to Reduce Hip Jo<strong>int</strong><br />
Bending (Table 1)<br />
The following paragraphs discuss the system improve<br />
ments we made to reduce sharp hip jo<strong>int</strong> bending and<br />
the problems we faced in working out such improvements.<br />
Several attempts were made to improve the unfavorable<br />
characteristics of the air bag in developing a restraining<br />
force. These improvement effofts included the use of a<br />
larger bag and increased gas generator capacity for faster<br />
bag deployment. As discussed earlier, however, a series<br />
of tests revealed that n<strong>one</strong> of these changes resulted in<br />
any appreciable improvement and at the same time tended<br />
to increase air bag deployment noise.<br />
u<br />
E<br />
o<br />
=<br />
E,<br />
itt<br />
E<br />
BOLSTER<br />
,,,,,<br />
:j<br />
{<br />
rttttt<br />
10Q 200<br />
DUMMY DISPLACEMENT AFTER RESTRAINT CONTACT<br />
\utttt ronso BAG<br />
Figure 6. Typical restraining force of knee bolster and upper<br />
torso bag.<br />
' ' i<br />
i<br />
''i
Table 1. Causes and remedies of sharp hip jo<strong>int</strong> bending.<br />
Causes Remedies Problems<br />
I lnadequate air bag capability<br />
to qurckJy develop a<br />
restrainins force<br />
1 Greater restrainrng force of<br />
the knee bolster<br />
Use of a larger bag and<br />
faster deployment<br />
svstem<br />
We concluded that the only available means to ensure<br />
well-balanced restraining forces for the upper and lower<br />
parts of the dummy would be to reduce the knee bolster's<br />
restraining force. Our improvement efforts were then concentrated<br />
on the development of a modified knee bolster.<br />
KNEE BOLSTER MODIFICATION<br />
A series of 35mph head-on crash tests against a barrier<br />
using a buck was conducted with knee bolsters of different<br />
hardness levels and sizes installed at different distances<br />
from the occupant. The findings may be summarized as<br />
follows: As shown in Figure 7, a greater forward displacement<br />
of the pelvis results in lower chest G. In<br />
other words. favorable results can be achieved if the<br />
knees sink deeper <strong>int</strong>o the bolster. However, when a<br />
smaller, harder knee bolster is used to minimize the<br />
required space and is installed farther away from the<br />
occupant to allow a greater forward displacement of<br />
the pelvis, spikes in chest G still occur if the bolster's<br />
collapsing load exceeds a 1400 lb. level in femur load<br />
equivalent. A knee bolster installed closer to the occupant<br />
to immediately produce a restraining force<br />
also fails to preclude chest G spikes because it stops<br />
SOFT KNEE BOLSTER<br />
CLOSER TO THE OCCUPANT<br />
FROM THE OCCUPANT<br />
Figure 7. Pelvis forward displacement v$. chest G.<br />
EXPERIMENTAL SAFEW VEHICLES<br />
Reduction of the knee<br />
bolster's restrainlng<br />
force by increasing its crush<br />
198<br />
I-arger noises during bag<br />
deployment<br />
Reduced passenger leg<br />
space in a small<br />
automobile<br />
the forward movement of the dummy's pelvis too<br />
early and causes sharp hip bending. These findings<br />
suggest that a satisfactory solution to the chest G<br />
spike problem requires the use of a larger, softer knee<br />
bolster which has a much smaller collapsing load<br />
than the allowable femur load limit as specified in<br />
FMVSS 208. The knee bolster must be installed at a<br />
proper distance from the occupant to allow sufficient<br />
forward displacement of the pelvis.<br />
Figure I shows typical examples of chest G curves<br />
recorded at ayerage femur loads of 1720 lb., 1350 lb.,<br />
and 1100 lb. As is apparent from the diagram, vertical<br />
chest G spikes become smaller, reducing the maximum<br />
resultant chest G. as femur load decreases.<br />
F<br />
t4<br />
U<br />
T<br />
-q<br />
r.u<br />
G<br />
60<br />
?0<br />
0<br />
-20<br />
G<br />
60<br />
20<br />
0<br />
-20<br />
AVEBAGE FEMUF LOAD r72olh..<br />
AVERAGE FEMUF LOAD l350lhc<br />
AVEBAGE FEMUF LOAD lIOOIb.<br />
Figure 8. Typical chest G with different femur load.
KNEE BOLSTER<br />
MODIFICATION<br />
Figure 9. Etfects of knee bolster modilication on chest G.<br />
FULL-SCALE CHASH TESTS<br />
Some full-scale crash tests were performed to demonstrate<br />
the effects ofthe above remedies for chest G spikes.<br />
Figure 9 shows the chest G traces recorded before<br />
and after the improvements were made in the knee<br />
bolster. As expected, the results are similar to those<br />
of the buck tests; no unusual spikes appeared in chest<br />
G. The improved restra<strong>int</strong> system produced acceptable<br />
head and chest G and femur loads in a 35 mph head-on<br />
crash test against a barrier. (See Table 2.)<br />
CONCLUSION<br />
The modification of knee bolster characteristics enabled<br />
us to prepare an expenmental vehicle with a driver air<br />
Table 2. Test results with air bag system-research stage<br />
(35 mph head-on crash).<br />
Hlc Che3t G<br />
465<br />
859<br />
437<br />
364<br />
50.5<br />
56.)<br />
47.2<br />
55.8<br />
Driver<br />
SECTION 5: TECHNICAL SESSIONS<br />
Femur load fibsl<br />
Left R Sht<br />
I 526<br />
I 790<br />
r 557<br />
l6l6<br />
854<br />
4t6<br />
43E<br />
447<br />
Figure 10. Required seat positioning.<br />
* 1 0 AlEr [NEE_-Bg.L_ST.g_E MqD,rfle&T-t8N<br />
3 2' PBE_SENT_f_[QqU-C_T|Q|!_<br />
yEl.r.tct E<br />
bag system that produced good results. Unusual spikes<br />
in chest G traces appearing when the dummy's hip jo<strong>int</strong>s<br />
are bent to the utmost limit are very likely to occur in<br />
small automobiles that have $evere crash pulses. The improvement<br />
of the restra<strong>int</strong> system discussed in this report<br />
required the use of a larger knee bolster. Therefore the<br />
front seats had to be moved rearward to give the driver<br />
suffrcient leg space to freely to operate the control pedals.<br />
This unfavorably affected the <strong>int</strong>erior layout of the car<br />
as the rear leg space was reduced substantially. (Fig, 10)<br />
Installing an air bag system in an existing small vehicle<br />
design will drastically impact its basic layout and utility.<br />
REFERENCES<br />
l. D. Theodore Zinke, "Small Car Front Seat Occupant<br />
Inflatable Restra<strong>int</strong> System, Volume Il-Citation Air<br />
Bag Systems".<br />
2. H. T. E. Hertzberg,<br />
"The Anthropology of Anthropomorphic<br />
Dummies", l3th STAPP Car Crash Conference.<br />
3. Gerald \#. Nyquist and Clarence J. Murton, "Static<br />
Bending Response of the Human Lower Torso", l9th<br />
STAPP Car Crash Confererrce.<br />
4. Naveen K. Mital, Richard Cheng, Robert S. Levine<br />
and Albert L King, "Dynamic Characteristics of the<br />
Human Spine During - G- Acceleration", 22nd<br />
STAPP Car Crash Conference
tr"L,j-<br />
fi<br />
On the Optlmum Parameter$ of a Seat Belt Pre-loading Device<br />
KOJI KURIMOTO, HAYAO HIRAI ANd<br />
TSUTOMU SUGAWARA<br />
Toyo Kogyo Co., Ltd.<br />
ABSTRACT<br />
The effectiveness of occupant restra<strong>int</strong> system is generally<br />
reduced as the impact velocity of vehicle increases.<br />
The addition of a pre-loading device to seat belt system<br />
has been proposed as <strong>one</strong> ofuseful measures to this kind<br />
of degradations.<br />
This paper proposes the optimum selection of activation<br />
time and level of load produced by the assumed preloading<br />
device in case of 2-po<strong>int</strong> diagonal seat belt system<br />
with knee bolster on the frontal impact at 40mph.<br />
The two dimensional, <strong>five</strong> mass occupant mathematical<br />
model is developed and the validation of the model is<br />
carried out by adjusting various parameter$ of the model<br />
in comparison of the simulated results with those of the<br />
actual sled test, where a typical pre-loading device is<br />
employed.<br />
The set of optimum parameters of pre-loading device<br />
is derived in relation to the level of HIC (head injury<br />
criteria) and the displacement of occupant through the<br />
computer simulation of this kinematic model.<br />
PHEFACE<br />
On frontal collision at higher impact speed, so called<br />
"spool out" and additional elongation of the webbing<br />
reduce the restra<strong>int</strong> capability of seat belt system with<br />
retracting device. As <strong>one</strong> of the measures to avoid this,<br />
a pre-loading device is proposed which retracts a certain<br />
length of webbing during the first few milliseconds of a<br />
crash (l).<br />
The effectivetress of preJoading device, in correspondence<br />
to a target velocity where its maximum effectiveness<br />
is obtainable, varies substantially depending on such parameters<br />
as its activation time and the level of load produced.<br />
In this respect, this paper discusses the selection<br />
of these optimum parameters at the impact velocity of 40<br />
mph, as the improvements of the restra<strong>int</strong> capability could<br />
be attainable with tather conventional manner below this<br />
speed.<br />
As a typical case, a Z-po<strong>int</strong> diagonal $eat belt system<br />
with knee bolster is considered, where the anchorage locations<br />
are selected based on a certain 4-door sedan. [n<br />
addition, the vehicle deceleration profile selected is a halfsine<br />
curve simulating a result of actual crash test of the<br />
vehicle that does not tend to undergo a large peak de-<br />
EXPERIMENTAL SAFEW VEHICLES<br />
celeration in the passenger compatrment around the end<br />
of vehicle deformation.<br />
The conventional anthropomorphic dummy is treated<br />
as a two dimensional, <strong>five</strong> mass mathematical model,<br />
whose validation is made as follows. First, various parameters<br />
of the mathematical model are adjusted to obtain<br />
agreement with the actual sled test results, for the case<br />
where the dummy is restrained by the 2-po<strong>int</strong> diagonal<br />
seat belt without preJoading device. Second, the results<br />
by the computer simulation with the parameters thus<br />
determined and those by the actual sled test are compared<br />
for the case where the preJoading device is activated,<br />
resulting that the computed results are in good agreement<br />
with test results. Then, computer simulations are made<br />
to find the optimum parameters for the preJoading device,<br />
employing the mathematical model of the aforementi<strong>one</strong>d<br />
characteristics.<br />
MATHEMATICAL MODELING<br />
General Description<br />
A two dimensional, <strong>five</strong> mass model is employed, the<br />
schematic of which is shown in Figure l, since a dummy<br />
makes a virtually two dimensional movements on frontal<br />
collision, and a modeling of unnecessarily complicated<br />
design would make characterization and input to the<br />
model excessively complex. Here, the front seat pa$senger<br />
is dealt, since it is generally diffrcult for the driver to<br />
avoid impact against the steering wheel, making it necessary<br />
to consider the energy absorption ofsteering $ystem<br />
by the occupant.<br />
This mathematical model is provided with toe board,<br />
$eat, and knee bolster. These surfaces are to make <strong>int</strong>eraction<br />
with parts of the dummy expressed as circular<br />
segments, generating friction force on contact. The characteristics<br />
of seat belt are mathematically adjusted on two<br />
dimensional plane by designating the relative anchorage<br />
locations and the actual elongation of the webbing. The<br />
seat belt on the mathematical model is to contact with<br />
the dummy model at two po<strong>int</strong>s, generating friction force<br />
at respective po<strong>int</strong>.<br />
Dummy Characteristics<br />
By referring to the geometric, inertial, and jo<strong>int</strong> characteristics<br />
of Part 572 Hybrid II dummy described in<br />
publications (2-3), and by conducting some measurement$,<br />
dummy characteristic$ are determined. The neck<br />
jo<strong>int</strong> characteristic, as a representative example, is shown<br />
in Figure 2, where the torque versus rotational movement<br />
is nonlinearly represented with angular velocity depend-
(XKP YKP)<br />
ent hysteresis. Similar approaches are made in determining<br />
the characteristics of other jo<strong>int</strong>s.<br />
Characteristics of Restra<strong>int</strong> Comp<strong>one</strong>nts<br />
The seat cushion is represented by a plate on two vertical<br />
nonlinear resistances, <strong>one</strong> of which is fixed at the<br />
front end of the plate. The other is connected at the<br />
bottom of the dummy's hip, making it possible to move'<br />
forward with the hip displacement. These characteristics,<br />
whose typical examples are shown in Figure 3, are determined<br />
by pressing the seat cushion with hip-shaped<br />
ram.<br />
Figure 2. Representative neck jo<strong>int</strong> characteristic.<br />
o<br />
a g<br />
E<br />
€-LF<br />
€**-_=".-LZ<br />
Figure 1. Schematic of mathematical model.<br />
SECTION 5; TECHNICAL SESSIONS<br />
1000<br />
NecK<br />
The knee bolster is represented by a plate, where the<br />
force versus deflection is nonlinearly represented with<br />
hysteresis. A typical characteristic is shown in Figure 4,<br />
ot<br />
.j(<br />
q)<br />
o<br />
o<br />
LL<br />
20 40 60 BO 100 120 140<br />
Vertical deformation-mm<br />
Figure 3. Representative seat cushion (rear part) charac.<br />
t6ristic.<br />
f{<br />
E<br />
1<br />
!<br />
fi<br />
.i
..:(<br />
I<br />
o<br />
()<br />
o<br />
u,<br />
I<br />
r000<br />
800<br />
400<br />
?00<br />
0<br />
Figure 4. Representative knee bolster characteristic.<br />
which is determined by pressing a knee-shaped ram on a<br />
knee bolster.<br />
The load versus elongation characteristics of the seat<br />
belt webbing between upper and lower anchorages is also<br />
nonlinearly represented with hysteresis. This characteristic<br />
is determined as the combination of the following<br />
three characteristics, whose typical example is shown in<br />
Figure 5:<br />
-Elongation characteristic of seat belt webbing is determined<br />
by the method stipulated in FMVSS 209.<br />
-The "spool out" of seat belt webbing taken up in the<br />
retractor is determined by measuring the actual spool<br />
out characteristics.<br />
-Deflection characteristic of chest on <strong>int</strong>eraction with<br />
seat belt at Part 572 Hybrid II dummy is determined<br />
by such method as described in the literature (4).<br />
VALIDATION OF MATHEMATICAL MODEL<br />
Seat Belt System Without Pre-loading Device<br />
A computer simulation is executed at 33.5 mph with<br />
the aforementi<strong>one</strong>d characteristics, resulting smaller head<br />
displacement and larger HIC value compared to actual<br />
sled test results at the same velocity. The reason for this<br />
is substantially because, in actual test, the dummy's rotational<br />
movement toward sideways causes the head to<br />
move forward. whose effects is not taken <strong>int</strong>o account on<br />
this mathematical model.<br />
To compensate this inconsistency the elongation characteristic<br />
of the seat belt is partially adjusted. As the<br />
consequence, the computation yields results in good<br />
agreement with those by the actual test, as shown in<br />
Figure 6.<br />
EXPEHIMENTAL SAFETY VEHICLES<br />
202<br />
Smol aul ol retaclor<br />
Figure 5. Representative seat belt system characteristics.<br />
Seat Belt System with Pre-loading Device<br />
As a result of the aforementi<strong>one</strong>d mathematical computation<br />
for the case without pre-loading device, the time<br />
sequence can be plotted on the load versus elongation<br />
characteristics of a seat belt system as shown in Figure<br />
7. Respective time on the plot is utilized to specify the<br />
activation time of a pre-loading device. Once this acti-<br />
- Test<br />
-- - - Simulation<br />
Head displacement<br />
Head resultant acceleration<br />
- T6st (HtC 60g)<br />
---- Simulation (HlC s77)<br />
Figure 6. Comparison of the results between simulation and<br />
test (without pre-loading device).<br />
E<br />
E<br />
L co<br />
rU<br />
FE.<br />
6 d<br />
> E
Figure 7. Representative seat belt syctem characteristics<br />
(with and without pre-loading device).<br />
vation time and a particular extraction force produced by<br />
a pre-loading device are specified, the characteristic curve<br />
is shifted along the horizontal axis as the elongation increases<br />
in correspondence with the load.<br />
This procedure is used to provide the load versus elongation<br />
characteristics ofthe seat belt system with a given<br />
pre-loading device of speciflrc parameters. Figure 7 also<br />
presents an example of the characteristics of the case<br />
where the activation time is 15 msec and the extraction<br />
force is 150 ke.<br />
To compare the results by computation with those by<br />
experiment, an actual sled test is run at 36.3 mph, where<br />
a typical pre-loading device which produces the maximum<br />
load of 150 kg is installed as shown in Figure I and<br />
activated at 15 msec. Then, Computer Simulation with<br />
the aforementi<strong>one</strong>d parameters is executed at 36.3 mph,<br />
where a half-sine acceleration profile similar to the actual<br />
crash pulse for the test above is set as shown in Figure<br />
9. The results thus obtained show in good agreement with<br />
those by the actual sled test, some typical examples of<br />
which are shown in Figure 10.<br />
OPTIMUM PARAMETERS AT 40 MPH<br />
Computer $imulations at 40 mph are carried out with<br />
various combinations of activation time and load of the<br />
preJoading device, thus to clarify the influence of parameters<br />
on HIC level and head displacement, the results of<br />
which are shown in Figure 11. Figure ll also indicates<br />
Flgure 8. Schematic of pre.loadlng device installation.<br />
SECTION 5; TECHNICAL SESSIONS<br />
209<br />
c<br />
.9<br />
(u<br />
-E<br />
0)<br />
(J<br />
a<br />
Figure 9. Crash pulse.<br />
50<br />
Time-msec<br />
the shaded horizontal lines which implies the target HIC<br />
level and the permissible head displacement short of contacting<br />
a forward <strong>int</strong>erior object. Here, the target HIC<br />
level is specified at 800 and the permissible head displacement<br />
is set at 600 mm, assuming probable contact<br />
with the instrument panel beyond this value.<br />
Since this simulation model is made without instrument<br />
panel, the calculated HIC level registered is low, even<br />
when head displacement exceeded the permissible level.<br />
In actual situations, however, a higher level as shown by<br />
broken line in Figure I I would be assumed to result, once<br />
when the head is brought <strong>int</strong>o $trong contact with the<br />
instrument panel. Consequently, it is important to hold<br />
the head displacement to below the permissible level.<br />
It is observed, in Figure 11, that both HIC and head<br />
displacement are decreased as the activation time is reduced<br />
and the load ofthe pre-loading device is increased.<br />
Head disolacemeni<br />
- Test<br />
- - -- Sinlulation<br />
Foward disolac€|D€fit{nln<br />
U"".M<br />
-<br />
Test (HlC 3C3)<br />
-*-- Simulation (HlC 452)<br />
Figure10.<br />
Comparison of the results between simulation<br />
and test (with pre.loading device).<br />
E<br />
E<br />
c<br />
0<br />
F<br />
6<br />
3H<br />
bq*<br />
> E<br />
f,<br />
;;<br />
,l<br />
",.t<br />
' :i'J<br />
"s :
E<br />
T<br />
E<br />
E<br />
3<br />
!<br />
!<br />
H6ad lowFftl drsDlacemenl<br />
T<br />
0#<br />
0 r0o 200 300 4m 500 600 700 800<br />
Lmd prMuced bv pre -lof,drng dcvrce-kg<br />
fH!il<br />
lm 200 300 400 500 6aJ0 7m 800<br />
t ond tr(drx:ed by pre-loadln0 devtric-kg<br />
Psmi$ibls lcvel<br />
Figure 11. Influences of pre-loading device at 40 mph simulation.<br />
However, there is restriction against the load parameter<br />
to keep the HIC and the head displacement under the<br />
respective permissible levels. Namely, it is said that the<br />
number of rib fractures increases as the load produced<br />
by seat belt increases, and there is an instance where rib<br />
fracture was suffered at as low a shoulder load as 200 kg<br />
or $o, according to tests using human cadavers (5)' and<br />
the higher load produced by inadvertent activation of the<br />
pre-loading device could lead to driver's error in vehicle<br />
operation. There is also restriction against the activation<br />
time to ma<strong>int</strong>ain the sensing reliability.<br />
Thus, in the example aited, it is considered that the<br />
load produced by the preJoading device should be held<br />
to below 220 kg. With this condition, the activation time<br />
is required to be less than 15 msec, as shown in Figure<br />
11, to meet the target of both HIC and head displacement.<br />
PERFORMANCE AT LOW SPEED<br />
Computer simulation is executed on an impact velocity<br />
of, as an example, 25 mph, to observe the feasibility of<br />
the pre-loading device with the optimum parameters obtained<br />
at 40 mph. The sled acceleration profile for the<br />
above-menti<strong>one</strong>d 40 mph was rearranged to that for 25<br />
mph as follows.<br />
EXPERIMENTAL SAFEW VEHICLES<br />
204<br />
First, the acceleration profile at 36.3 mph, as shown<br />
in Figure 9, was doubly <strong>int</strong>egrated with respect to time,<br />
resulting the force versus deformation characteristic.<br />
Then assuming <strong>one</strong> dimensional, <strong>one</strong> mass and <strong>one</strong> spring<br />
model whose spring rate is given by the abovementi<strong>one</strong>d<br />
characteristics, the acceleration proftle at 25 mph is ob'<br />
tained as response of the mass on impacting the model<br />
<strong>int</strong>o the flrxed barrier at 25 mph. Generally, the activation<br />
time of pre-loading device comes to be rather late as the<br />
impact velocity of the vehicle decreases' In this case, it<br />
is assumed to be 25 msec rather arbitrarily, since the<br />
precise value depends on the specifltc sensing device for<br />
the preJoading device.<br />
With this assumption and load produced by the preloading<br />
device to be 220 kg as before, a computer sim'<br />
ulation is executed at 25 mph. It is demonstrated as the<br />
result that the pre-loading device is still effective in re'<br />
ducing HIC and head displacement at 25 mph, too, as<br />
shown in Figure 12, thus indicating that the parameters<br />
specified for 40 mph would have no adverse effects in<br />
low speed collisions.<br />
SUMMARY<br />
(t) A two dimensional, ftve mass mathematical model<br />
can be used effectively to estirnate such response as HIC<br />
and head displacement occurring at actual impact test.<br />
(2) The computer simulation is an effective tool to<br />
determine the optimum parameters of a pre-loading device<br />
with respect to activation time and load. This approach<br />
could be applicable to various types of seat belt<br />
system, anchorage locations which vary with vehicle geometric<br />
features, and vehicle body deformation characteristics.<br />
(3) On the simulated 4-door front drive car presumed<br />
to suffer deformation at an impact velocity of 40 mph,<br />
the optimum parameters of the preJoading device are<br />
proposed to be activation time of 15 msec and load of<br />
220 kg.<br />
l--]<br />
ffi<br />
witnout Prs-lffidrnE dsvice<br />
*'tn pre-l€drn9 devrcs ol optrmam perameters at 4omph<br />
Figure 12. SWimulated effect of pre-loading device at 25<br />
mpn.
(4) The aforementi<strong>one</strong>d optimum parameters obtained<br />
from the computer simulations seem to have no adverse<br />
effects at lower speed collisions and to be still effective<br />
in reducing HIC level and head displacement.<br />
Thus it is observed that the pre-loading device is effective<br />
to the extent of a typical frontal collision studied'<br />
To put it <strong>int</strong>o practical application, however, further extensive<br />
technical development has yet to be made, in<br />
addition of consumer acceptability, on such areas as elimination<br />
of occupant's uneasiness at activation of explosives,<br />
sensing reliability for the activation only when it is<br />
necessary, and ensuring reliability of the complex system'<br />
ACKNOWLEDGEMENT<br />
The authoru wish to exprest heartful appreciation to<br />
related persons at Toyo Kogyo Co., Ltd. who extended<br />
valuable suggestion for this study.<br />
SECTION 5: TECHNICAL SESSIONS<br />
REFERENCES<br />
l. W. Reidelbach and H. Scholz, "Advanced Restra<strong>int</strong><br />
System Concepts", SAE paper No. 790321' 1979.<br />
2. R. P. Hubbard and D. G. Mcleod, "Geometric, Inertial,<br />
and Jo<strong>int</strong> Characteristics of Two Part 572 Dummies<br />
for Occupant Modeling", 2lst Stapp Car Crash<br />
Conf., SAE Paper No. 770937, 1977.<br />
3. B. M. Bowman, R. O. Bennett, D. H' Robbins and J'<br />
W. Becker.<br />
"MVMA Two-Dimensional Crash Victim<br />
Simulation, Version 4, Volume l-3", HSRI' 1979.<br />
4. D. C. Viatto and C. C' Culver, *'Test Dummy Interaction<br />
with a Shoulder or Lap Belt", 25th Stapp Car<br />
Crash Conf., SAE Paper No. 811017' 1981.<br />
5. A. Fayon, C' Tarriere, G. Walfisch, C' Got and A'<br />
Patel. "Thorax of 3-Po<strong>int</strong> Belt Wearers During a Crash<br />
(Experiments with Cadavers), lgth Stapp Car Crash<br />
Conf., SAE Paper No. 751148, 1975'<br />
Itlathematlcal Models for the Assessment of Pedestrian Protectlon<br />
Provided by a Gar Contour<br />
J. WISMANS and J. van WIJK<br />
Research Institute for Road Vehicles TNO<br />
Delft, The Netherlands<br />
SUMMAHY<br />
Injuries sustained by pedestrians $truck by the front of<br />
cars are dependent on the proflrle and the local stiffness<br />
characteristics of the vehicle. Mathematical Crash Victim<br />
models, if well-validated, could provide a suitable method<br />
for the assessment of pedestrian protection provided by<br />
different car contours.<br />
In this presentation, first a review will be given of a<br />
number of existing pedestrian models along with the as'<br />
sociated validation $tudies. On the basis of this review<br />
and results of recent accident analysis studies a series of<br />
pedestrian models with varying complexity were developed<br />
using the Crash Victim Simulation Program MA-<br />
DYMO.<br />
The predictions of these models are compared with<br />
experimental results for two impact velocities and the<br />
reliability with respect to their complexity is discussed.<br />
INTRODUCTION<br />
Pedestrians sre among the moct wlnerable trafftc participants.<br />
A pedestrian runs more than twice as high a<br />
205<br />
risk of being fatally injured in a road accident as a car<br />
occupant. [n recent years trafftc safety research has concentrated<br />
more and more on the problem of pedestrian<br />
accidents.<br />
Since the end of 1980 three research institutes: Bundesanstalt<br />
fiir Strassenwesen (BASI), Organisme National<br />
de S6curit6 Routidre (ONSER) and the Research Institute<br />
for Road Vehicles (IW-TNO) have co-operated in the<br />
field of pedestrian safety. The aim of this study is to<br />
propo$e a standardized test methodology that can be applied<br />
to pedestrian safety tests carried out for research or<br />
for compliance testing of passenger cars.<br />
A part of this project was the formulation of a math'<br />
ematical model of a pedestrian during an impact. Several<br />
advantages of mathematical models are the exact reproducibility<br />
of a simulation, the absence of measuring problems<br />
and the possibility to conduct sensitivity-analyses in<br />
a simple, rapid and inexpensive way.<br />
This study was conducted with the MADYMO program<br />
package, developed at the Research Institute for<br />
Road Vehicles TNO, Delft, The Netherlands. A descrip<br />
tion of this package, along with several examples of applications<br />
can be found in (l l). The main features of this<br />
package can be summarized as follows:<br />
-a compact FORTRAN source which can be implemented<br />
on small computer systems;<br />
a 2D and a 3D option;<br />
-a variable number of linkage systems;
-s ssf of standard force <strong>int</strong>eraction routines;<br />
----€asy incorporation of user deflrned subroutines for<br />
specific force <strong>int</strong>eractions and user deflrned output.<br />
In this paper, flrrst a brief review will be given of a<br />
number of existing pedestrian models along with the associated<br />
validation studies. On the basis of this review<br />
and results of recent accident analysis studies a series of<br />
three pedestrian models with varying complexity were<br />
formulated. The predictions of these models will be compared<br />
with experimental results with an Audi lfi) for two<br />
impact velocities, namely 30 and 40 km,/h.<br />
REVIEW OF MATHEMATICAL<br />
PEDESTRIAN<br />
MODELS<br />
In this <strong>section</strong> a literature review will be presented<br />
concerning existing mathematical models for the simulation<br />
of car-pedestrian collisions.<br />
Table I summarizes the source and background of ten<br />
models that were analyzed. The models are numbered<br />
according to the numbers in the reference list. Four<br />
models are based on the CALSPAN CVS program. These<br />
models are not identical since different versions of this<br />
computer program were used and modifications were <strong>int</strong>roduced<br />
by the users. The PRAKIMOD model is based<br />
on the MVMA-program.<br />
In Table I the main characteristics of the models are<br />
summarized. A first distinction which can be made is<br />
Table 1. Summary of ten pedestrian models.<br />
EXPERIMENTAL SAFETY VEHICLES<br />
between 2D and 3D models. This last type of models, in<br />
general, will be more realistic since the kinematics of a<br />
pedestrian impacted by a car are found to be of a threedimensional<br />
nature. However, such a 3D model is much<br />
more complicated and in addition a lot of extra input<br />
data has to be defined.<br />
A CVS-model consists of a series of rigid bodies, connected<br />
by hinge or ball-and-socket (3D) jo<strong>int</strong>s. The number<br />
of elements in the various models is included in Table<br />
L<br />
In most of the models, the vehicle is represented by a<br />
number of straight line segments (2D) or planes (3D). In<br />
the PROMETHEUS 2 model, however, <strong>int</strong>erconnected<br />
segments are used for the simulation of the vehicle contour.<br />
The position of these segments can be defined by<br />
means of an auxiliary program, which transforms the<br />
input parameters <strong>int</strong>o a flrnite element model of the vehicle.<br />
The user can define the hood-contour by a skewed<br />
hyperellipse.<br />
Most of the mathematical models for pedestrian collisions<br />
are limited to the impact of the pedestrian with<br />
the vehicle. Ground impact is not considered in these<br />
simulations. Reasons for this are (6);<br />
-a meaningful simulation of the secondary impact is<br />
extremely diffrcult since inaccuracies in the simulation<br />
of the primary impact will strongly affect the<br />
pedestrian kinematics in the secondary impact;<br />
-in the airborne phase the pedestrian has time for<br />
voluntarv muscle action:<br />
Ref. author/model Year 2D/3D Number of Institute<br />
1 Transportation<br />
Research Department<br />
1S71 2D 3 Cornell Aeronautical Laboratory pSA)<br />
2 Gldcker 1S73 2D 1 Institut fUr Krattfahrzeuge, Technische<br />
Universitflt Berlin (Germany)<br />
3 Kramer 1974 2D 3 lnstitut fUr KraftfahEeuge, Technische<br />
UniversitAt Berlin (Germany)<br />
4 Mac Laughlin 1574 2D 4 National Highway Traffic Safety<br />
Administration. U,S, Dept. of<br />
s youns, lezs sD 12 l:il-#l1t:illu"risil,l rn=titute, rexas<br />
TTICVS A&M University (USA)<br />
6 Twigg,<br />
Prometheus 2<br />
1577 2D 11 Boeing Computer Services Inc. (USA)<br />
7 Fowler,<br />
Calspan 3-D CVS, version lll<br />
1S76 3D 15 British Leyland Limited (Britain)<br />
8 Padgaonkar,<br />
Calspan version lll<br />
1577 3D 15 Biomechanics Research Center,<br />
Wayne State University, Detroit (USA)<br />
9 Lestrelin,<br />
Prakimod (MVMA)<br />
1980 2D 8 Laboratoire de Physiologie et de<br />
Biom6canique de Peugeot S.A./<br />
Renault (France)<br />
10 Cotte, 1S80 3D 15 Laboratoire de chocs et de<br />
version lll ioue ONSEH<br />
206
. -thc simulation time must be increased from ?00 ms<br />
to about 1000 ms resulting in a considerable increase<br />
of computer costs.<br />
In addition it follows from accident analyses that the<br />
secondary impact in general causes less severe injuries<br />
than the primary impact (Ashton (12), Mackay (13).<br />
For the <strong>int</strong>eraction between pedestrian and vehicle<br />
three types of contact models are used:<br />
.<br />
-in models 2 and 3 contact <strong>int</strong>eraction is based orr<br />
the classical theory of collisions between two rigid<br />
bodies. According to this theory the impact time is<br />
taken as zero. Consequently force and acceleration<br />
time histories during the impact phase cannot<br />
be evaluated by this type of model;<br />
-in model 6 (PROMETHEUS 2) the vehicle contour<br />
is represented by an arbitrary number of <strong>int</strong>erconnected<br />
segment$;<br />
-in the other models description of the contact is based<br />
on <strong>int</strong>eractions between contact surfaces (lines,<br />
planes, ellipses, etc.) connected to the vehicle and<br />
the predestrian. Whenever a positive penetration<br />
between contact surfaces is detected. normal and<br />
friction forces are calculated. Force-penetration<br />
characteristics have to be defined and are based on<br />
measurements or assumptions. Realistic simulation<br />
ofcontacts between pedestrian and sharp edges (e.g.,<br />
between lower leg and bumper) may cause problems<br />
in this type of contact models (7).<br />
Table 2. Validation of the models.<br />
Fef<br />
1<br />
2<br />
3<br />
4 5<br />
6<br />
7<br />
I<br />
I<br />
Pedestrian<br />
50th % male<br />
child dummy<br />
50th % malg<br />
6-yr Sierra dummy<br />
Sth % Sierra dummy female<br />
95th o/o Sierra dummy male<br />
Pert 572 modified<br />
6-yr child dummy<br />
Ogle OPAT<br />
95th o/o<br />
$ierra dummy<br />
50th % dummy<br />
10 ONSEH 50<br />
'Drop<br />
tests on mock-up. Drop height 0,4-0,8 m.<br />
"ln<br />
addition four cadav€r t€sts and drop tests ol Yor.rng (S).<br />
SECTION 5: TECHNICAL SESSTONS<br />
Pedestrian<br />
orientation<br />
Frontal<br />
Frontel<br />
Frontal<br />
Oblique<br />
Lateral<br />
Lateral<br />
Lateral<br />
Frontal<br />
Frontal<br />
Frontal<br />
207<br />
In most studiee model predictions have been compared<br />
with experimental results in order to get an impression<br />
of the reliability of the models. Table 2 summarizes some<br />
of the test conditions used for validation of the various<br />
models. The last item of Table 2 is the type of data used<br />
for validation.<br />
The degree of validation, however, differs strongly in<br />
the various studies. Some models are not validated at all<br />
(models 2 and 4); others are compared with several experiments<br />
for a number of conditions. The first column<br />
shows the pedestrian surrogate used in the test. Most<br />
researcher$ have concentrated on dummies. because these<br />
are a relative easily accessible source for model input data.<br />
Measurements of masses, moments of inertia, jo<strong>int</strong>torques,<br />
etc. easily and accurately can be carried out at<br />
dummies. Padgaonkar (8) has simulated cadaver experiments.<br />
One of the differences between his dummy- and<br />
cadaver-model was in the knee,jo<strong>int</strong>: a hinge-type for the<br />
dummy and a ball and socket jo<strong>int</strong> for the cadaver in<br />
order to admit lateral deflection.<br />
The orientation of the pedestrian, in these tests, varies<br />
from frontal via oblique to lateral (see Table 2). Simu-<br />
Iation of a lateral or oblique impact in general will be<br />
more dillicult than a frontal impact, due to the more<br />
complex three-dimensional motions. Twigg, for instance,<br />
(model 6, 2D) observes that the elbow of the pedestrian<br />
can act as a lever to vault the torso up over the hood,<br />
thus reducing the injury incurred by the head and torso.<br />
Table 2 also summarizes the cars which were used in<br />
Vehicle<br />
Ford Galaxie<br />
1 966<br />
Mock-up<br />
lmpala 1974,<br />
Test bucks<br />
Leyland cars<br />
SRV2 Marina<br />
Chevrolet 1973<br />
Ford FalrlanE<br />
Renault 5<br />
Honda N360<br />
Feugeot 204<br />
Opel Kadett<br />
Peugeot 304<br />
Citroen GS<br />
Citroen Visa<br />
Veloclty<br />
/h<br />
16<br />
36<br />
t<br />
32<br />
16,32<br />
22,241<br />
30,39)**<br />
16,28,33,40<br />
36<br />
43<br />
40<br />
45<br />
22<br />
43,48<br />
20,25<br />
Validation<br />
criteria<br />
gross motion<br />
gross motion<br />
throwing<br />
distance<br />
gross motion<br />
accelerations<br />
acceleration$<br />
gross motion,<br />
accelerations<br />
gross motion,<br />
accelerations<br />
traiectory head<br />
gross motion,<br />
head<br />
impact<br />
=-t<br />
l<br />
:.:.<br />
i<br />
I j.?
the e*periments as well as the impact velocity. The fact<br />
that different validation criteria are used prevents an adequate<br />
comparison of the reliability of the several models.<br />
Most researchers stress in their conclusions the importance<br />
of the contact model. The contact model must<br />
be able to cope with the problem of edge-contacts, as well<br />
as inertial effects. Another crucial po<strong>int</strong> is the description<br />
of the jo<strong>int</strong>s. Inelastic failure and dynamical effects<br />
(damping) must be taken in account. Both the contact<br />
and the jo<strong>int</strong>-model must be based on realistic, preferably<br />
measured, input data.<br />
MADYMO z.DIMENSIONAL PEDESTRIAN<br />
SIMULATIONS<br />
Based on the preceding literature review of existing<br />
pedestrian models and results of several recent accident<br />
analyses, a number of requirement$ were formulated for<br />
simulations of pedestrian-vehicle impacts with the general<br />
CVS program package MADYMO. The literature study<br />
did not show a clear relationship between the complexity<br />
of the different models (i.e., number of elements, 2D<br />
versus 3D) at the <strong>one</strong> side and their reliability at the other<br />
side. One of the aims of our study therefore was to get<br />
first a better insight in this problem. It was decided to<br />
develop several models with a differing complexity. Three<br />
models are presented which were formulated with the 2D<br />
option of MADYMO. In a future study (14) results of<br />
3D-simulations will be presented.<br />
The simulations are limited to the primary impact (pedestrian-car<br />
contact) and are concerned with lateral impacts,<br />
since this is the most frequent type of impact<br />
observed in pedestrian accidents (12). The three models<br />
have 2, 5 and 7 segments, respectively, as is shown in<br />
Figure l. The same contact ellipses are attached to the<br />
2- and S-segment model. In the present models the arms<br />
are not incorporated as separate segments: a part of the<br />
mass of the arms is added to the mass of the thorax<br />
segments,<br />
The input data set describing the pedestrian (e.g., the<br />
geometry, mass distribution and jo<strong>int</strong> characteristics) are<br />
derived from a standard data set of a Part 572 50th<br />
percentile male dummy, which itself is based on a number<br />
of measurements conducted in our laboratory.<br />
One of the most important aspects concerning the simulation<br />
of pedestrian accidents is the representation of<br />
the contacts between vehicle and pedestrian, especially<br />
for the edge-contacts. A special contact model was developed<br />
in which the external geometries of pedestrian<br />
and vehicle are simulated by hyperellipses. A hyperellipse<br />
is a general form ofa standard ellipse and can be described<br />
by the following equation:<br />
(H)".<br />
*E)'=<br />
t<br />
EXPERIMENTAL SAFETY VEHICLES<br />
208<br />
Z -segmenl<br />
; = jornt<br />
15 20 ?5<br />
=_* y(ml<br />
Figure 1. Geometry and contact-ellipses of resp. 2-, 5- and<br />
7-segment model.<br />
where ea and eb are the semi-axes of the hyperellipse and<br />
n the degree (see Fig. 2). Ifn : 2, this equation describes<br />
a standard ellipse; however, ifn increases, the hyperellipse<br />
approximates more and more a rectangle as is shown in<br />
Fig. 2 for n : 8. This geometrical description is particulady<br />
of <strong>int</strong>erest for the representation of the car and<br />
bumper geometry, since vehicle edges quite well can be<br />
approximated in this way. A more detailed description<br />
of hyperellipse contact models will be presented in reference<br />
(14).<br />
The three models presented were applied to simulate<br />
a pedestrian impact with a vehicle of the type Audi 100.<br />
The geometry of this vehicle is represented by two hyperellipses:<br />
<strong>one</strong> for the bumper and <strong>one</strong> for the hood (see<br />
Fig. 3). The vehicle dimensions were determined from<br />
scale drawings and mea$urement$.<br />
Figure 2. Hyperellipses with identical semi-axes, n : 2 and<br />
n:8.
10 z( ml<br />
t I<br />
00 00<br />
Figure 3. Geometry of Audi 100.<br />
Dynamic force-deflection characteristics of the bumper,<br />
hood and hood edge of the Audi lfi) vehicle were determined<br />
experimentally by the BASt (Bundesanstalt fiir<br />
Strassenwesen). Pendulum tests with a rigid wooden pendulum<br />
were used for the bumper and the hood edge. This<br />
pendulum was equipped with an accelerometer, while the<br />
vehicle deflection was measured with a linear transducer.<br />
mounted in the car. The pendulum mass was l0 kg for<br />
the bumper impact and 15 kg for the hood edge while<br />
the impact velocity was 25 km/h in these tests. For the<br />
hood instead of a pendulum test a drop-test was used.<br />
The impacting body was a rigid wooden sphere with a<br />
mass of 5.25 kg and an impact velocity of 30 km/h.<br />
VALIDATION TESTS<br />
The mathematical model results are compared with a<br />
number of dummy tests, which were conducted by the<br />
BASt. The dummy in these tests, a 50th percentile male,<br />
Part 572 was equipped with triaxial accelerometers in the<br />
head, chest and pelvis and uniaxial accelerometers in the<br />
knees and feet. Test velocities were taken 30 and 40<br />
Figure 4. Dummy position at impact.<br />
SECTION 5: TECHNICAL SESSIONS<br />
209<br />
km,/h and the car deceleration 6 m,/s2. At each impact<br />
velocity three tests were conducted.<br />
The dummy position before impact is shown in<br />
Figure 4. This position was selected after several pretests.<br />
In these pretests it could be observed that in<br />
case of a pure lateral impact no direct head-hood<br />
contact occurs due to the stiff neck and shoulder assembly<br />
of the part 572 dummy. Since head-impact<br />
was desired in these tests the dummy tor$o was<br />
slightly rotated (25) causing the dummy to rotate<br />
around its vertical axis during impact and resulting in<br />
a direct head impact. The geometry of the ellipses of<br />
the pedestrian model was selected in such a way that<br />
they approximate the projection of the geometry of<br />
the rotated dummy on the plane of simulation.<br />
Experimental results of these tests will be presented in<br />
the next <strong>section</strong> together with mathematical model results.<br />
RESULTS<br />
Figure 5 shows model predictions for the kinematics<br />
resulting from the 7-segment pedestrian model in a 4O<br />
km/h impact, A good agreement in general between<br />
model and experimental result could be observed. A comparison<br />
of predicted trajectories of the head, chest, pelvis<br />
and foot relative to the vehicle, resulting from the 2-, 5and<br />
7-segment model, is presented in Figure 6 (30 km/h<br />
impact) and Figure 7 (40 km/h impact). Locations of the<br />
head impact po<strong>int</strong> on the hood predicted by the variou$<br />
models are summarized in Table 3. All models appear to<br />
predict this location within or close to the range of experimental<br />
results.<br />
Table 3 includes model predictions and experimental<br />
results for the head impact velocity just before impact<br />
with the hood. Both the 5- and 7-segment model appear<br />
to predict too high values for this quantity compared to<br />
experimental observations.<br />
Figure 8 presents model results together with experimental<br />
data for the knee, pelvis, chest and head accelerations<br />
in a 40 km,/h impact. Results are given for the<br />
2-, 5- and 7-segment model respectively. For the pelvis,<br />
chest and head, resultant linear accelerations are pre-<br />
Figure 5. Kinematics of 7-segment model, v : 40 km/h.<br />
.T<br />
I<br />
:<br />
,.<br />
rJ<br />
!i<br />
H<br />
.H<br />
:{t<br />
r:i<br />
"d<br />
;4<br />
,.i<br />
;l<br />
NI<br />
'::<br />
.rl<br />
i{<br />
,i<br />
'1<br />
ir<br />
,''<br />
''I<br />
'i
Figure 6. Trajectories of 2, 5 and 7 segment models, v =<br />
30 km/h.<br />
Figure 7. Traiectories of 2, 5 and 7 segment models, v :<br />
40 km/h.<br />
EXPERIMENTAL SAFETY VEHICLES<br />
-!- ?-segment<br />
---- 5 -segmenf<br />
-* 7 -segmenl<br />
20 y(ms)<br />
sented and for the knee jo<strong>int</strong> the linear acceleration in<br />
lateral direction. It follows that the simple Z-segment<br />
model gives quite reasonable results for the accelerationtime<br />
histories (i.e., these accelerations appear to be in or<br />
close to the experimental corridors). Application of the<br />
5-segment model does not result in better predictions for<br />
the knee and pelvis acceleration. A small improvement<br />
of the head and chest acceleration-time histories, howeyer,<br />
can be observed particularly for t < 20 ms, where head<br />
and chest acceleration become smaller and more corresponding<br />
to the experimental observations. The peak head<br />
acceleration, however, becomes too high in this simulation.<br />
Extension of the 5-segment model with 2 segments in<br />
order to represent the left and right leg separately in the<br />
model, results in a more realistic prediction of the knee<br />
accelerations. Also, the alignment between model and<br />
experimental head and chest accelerations appears to become<br />
more realistic now.<br />
A comparison of bumper load-time histories for the 4O<br />
km,/h impact, predicted by the 5- and 7-segment model,<br />
respectively, is shown in Figure 9. Due to the <strong>int</strong>roduction<br />
of a second leg in the model, peakbumper loads are found<br />
to decrease by about 25Vo. Furthennore, the curve has<br />
two peaks. The bumper loads resulting from this model<br />
are more close to the results of experiments than results<br />
from the more simple models.<br />
Accelerations predicted by the 2-, 5- and 7-segment<br />
models in a 30 km,/h impact showed in general the same<br />
characteristics as in the 40 km/lr impact. The agreement<br />
between model and experiment in this impact was found<br />
to be less, however, than in the more severe 40 km,/h<br />
impact.<br />
A limited sensitivity study was conducted to analyze<br />
the response of the 2-, 5- and 7-segment models to variations<br />
in some of the model input parameters. Two different<br />
series of variations will be presented here.<br />
The first series concerns a change on the stiffness of<br />
the bumpers by +25% and -25Vo respectively. Results<br />
of these calculations are summarized in Table 4. It follows<br />
that the 3 models predict an almost identical relative<br />
Teble 3. Head impact velocity and head impact po<strong>int</strong> for three moJels, along with experimental results.<br />
v : 30 km/h<br />
resultant head-impact<br />
velocity (m/s)<br />
distance head-impact<br />
po<strong>int</strong>/hood-edge (m)<br />
v : 40 km/h<br />
resultant head-impect<br />
velocity (m/s)<br />
distance head-impact<br />
/hood<br />
210<br />
2 segment<br />
9.1<br />
.91<br />
12.7<br />
.96<br />
Model Experimental<br />
test-range<br />
12.3<br />
.s0<br />
16.6<br />
.s5<br />
12.0<br />
1.02<br />
15.8<br />
1.08<br />
6.7-9.2<br />
0,82-1.00<br />
11.2-12.5<br />
1.00-1.07
-.* *<br />
a ) 0<br />
E*<br />
c) o<br />
SECTION 5: TECHNICAL SESSIONS<br />
Figure 8. Accelerations of knee, pelvis, chest and head for a) 2-segment, b) 5-segment and c) 7-segment model (- : model,<br />
-- : experimental corridor) in a 40 kmi h impact.<br />
change in peak bumper loads. However, predictions for<br />
the relative change in accelerations of the impacted leg<br />
(i.e., foot and knee accelerations) are found to be strongly<br />
dependent on the number of elements in the model. In<br />
the models with a greater number of elements, the peak<br />
foot and knee accelerations are found to be much more<br />
sensitive to changes in the bumper stiffness.<br />
forre ( N)<br />
-trme<br />
(ms)<br />
Figure 9. Bumper force for (a) S-segment and (b) 7-segment<br />
model in a 40 km/h impact.<br />
211<br />
r0o !5o<br />
tft(mE)<br />
A second eeries of variations is concerned with the<br />
friction between foot and ground. In the reference simulation<br />
(Audi tfi), 40 kmA impact), the friction coeflicient<br />
was taken 0.7. Table 5 shows the results of a series<br />
of simulations in which the friction between ground and<br />
foot is omitted. Predictions of the three models for most<br />
of the output quantities are found to be close to each<br />
other. The influence of this variation in general is minor:<br />
bumper force and foot acceleration are somewhat lQwer<br />
and the knee acceleration becomes higher.<br />
DISCUSSION AND CONCLUSIONS<br />
Mathematical simulation of the highly complicated<br />
gross motion of the human body impacted by a vehicle<br />
has gained increasing importance in the past years. A<br />
brief literature review was given of various pedestrian<br />
models along with the associated validation studies.<br />
These models varied strongly in complexity: 2-dimensional<br />
models with the number of segments for the pedestrian<br />
varying between I and I I as well as 3-
Table 4. Eflect of bumper stiffnessr.<br />
Bumper Stiffness Increased by 25o/o<br />
EXPERIMENTAL SAFETY VEHICLES<br />
Max. accelerations<br />
(a %)<br />
Mal
-High speed films were used to determine the head<br />
impact velocity before impact with the hood. Due to<br />
3-dimensional head motions and absence of adequate<br />
calibration procedure$, this measurement might b€<br />
rather inaccurate.<br />
-Dynamic force-deflection characteristics wcre determined<br />
for the bumper, hood arrd hood edge. However,<br />
due to possible differences in impact velocities,<br />
shape of contact bodies, and location of the impact,<br />
the force-deflection characteristics in the actual<br />
dummy-vehicle impact may vary. Development of a<br />
contact model that accounts for geometric and velocity<br />
effects could considerably contribute to the<br />
improvement of the model's reliability. The sensitivity<br />
of the model to changes in the bumper stiffness<br />
(see Table 4) indicates the importance of an adequate<br />
description of the pedestrian-vehicle<br />
contact.<br />
The influence of the complexity of the model (i.e., the<br />
number of model segments) can be summarized as follows:<br />
The reliability of the model if used for a lateral impact<br />
seems to be slightly improved if a greater number of<br />
segments is used to represent the pedestrian. The most<br />
significant changes are absence of an initial peak in head<br />
(and chest) accelerations if the number of segments increases<br />
from 2 to 5 and more realistic lower leg accelerations<br />
(and probably also bumper loads) if the number<br />
of segments is increased to 7.<br />
In the next phase of this project, mathematical simulations<br />
for different car types are planned. [n addition to<br />
adult dummy te$t$, also child dummy and cadaver experiments<br />
will be simulated. Further, it will be analyzed<br />
to what extent more complex models like a l5-segment<br />
3D model can contribute to the reliability of the simulations.<br />
If the mathematical models then show reliable<br />
results for such different conditions, successful model application<br />
for the evaluation and improvement of pedestrian<br />
protection provided by different car contours might<br />
be expected.<br />
REFERENCES<br />
l. Transportation Research Department: '*Research<br />
in<br />
Impact Protection for Pedestrians and Cyclists". Final<br />
NHTSA Contract Report, Cornell Aeronautical<br />
Laboratory, Buffalo, 1971.<br />
2. Gkickner, H.: "Beitrag zur Simulation det Zusammen$tos$es<br />
Fahrzeug-Fussgiinger". Automobil-Industrie,<br />
pp. 71-76, 1973.<br />
3. Kramer, M.: "Ein einfaches Modell zur Simulation<br />
der Fahrzeug-Fussgdnger Unfall". Automobiltechnische<br />
Zeitschrift 76,3, 1974.<br />
4. Mac Laughlin, T. F., Daniel, S.: "A Parametric Study<br />
of Pedestrian Injury". Proceedings of the 3rd International<br />
Congress on Automotive Safety, San Francisco.<br />
1974.<br />
SECTION 5; TECHNICAL SESSIONS<br />
Young, R. D., Lammert, W. F., Rose, H. E.: "Vehicle<br />
Exteriors and Pedestrian Injury Prevention, Vol. V,<br />
A 3-D Mathematical Simulation of a Crash Victim".<br />
Final NHTSA Contract Report, Texas Transportation<br />
Institute, Texas, 1975.<br />
a. Twigg, D. W.: "PROMETHEUS 2-A User Oriented<br />
Program for Human Crash Dynamics". Final<br />
NHTSA Contract Report, Boeing Computer<br />
Service$, Seattle, 1977.<br />
b. Twigg, D. W., Tocher, J. L.r "Pedestrian Model<br />
Parametric Studies. Vol. II". Final NHTSA Contract<br />
Repoft, Boeing Computer Services, Seattle,<br />
1917.<br />
Fowler, J. 8., Axford, R. K., Batterfield, K. R.;<br />
"Computer<br />
Simulation of the Simulation of the Pedestrian-Development<br />
of the Contact Model". Proceedings<br />
of the 6th International Cnnference on<br />
Experimental Safety Vehicles, Washington, 1976.<br />
Padgaonkar, A. J., Krieger, K. W., King, A. I.: "A<br />
Three-Dimensional Mathematical Simulation of P+<br />
destrian-Vehicle Impact with Experimental Verification".<br />
Journal of Biomechanical Engineering, May<br />
1977, pp. l16-123.<br />
Lestrelin, D., Brun-Cassan, F., Fayon, A., Tarriere,<br />
C., Castan, F.: "PRAKIMOD: Mathematical Simulation<br />
of Accident Victims. Validation and Application<br />
to Car Pedestrian Collisions". Proceedings of<br />
the 8th International Conference on Experimental<br />
Safety Vehicles, Wolfsburg, 1980.<br />
Cotte, J. P., Laurent, M.: "Improvement of a Mathematical<br />
Model to Study Pedestrian Safety". Proceedings<br />
of the 5th IRCOBI Conference on the<br />
Biomechanics of Impacts, Birmingham, 1980.<br />
Wismans, J., Maltha, J., Wijk, J. J. van, Janssen, E.<br />
G.: MADYMO-A Crash Victim Simulation Com'<br />
puter Program for Biomechanical Research and Optimization<br />
of Designs for Impact Injury Prevention".<br />
AGARD Conference Proceedings, Cologne, 1982.<br />
Ashton, S. J., Mackay, G. M.: "Car Design for Pedestrian<br />
Injury Minimisation". Accident Research<br />
Unit, University of Birmingham. Proceedings of the<br />
7th International Conference on Experimental Safety<br />
Vehicles, Paris, 1979.<br />
Mackay, G. M., Fonseka, C. P. de: "Some Aspects<br />
of Traffic Injury in Urban Road Accidents". Proceedings<br />
of the llth Stapp Car Crash Conference,<br />
Los Angeles, 1967.<br />
Wijk, J. J. van, Wismans, J., Maltha, J.: "MADYMO<br />
7.<br />
10,<br />
12.<br />
13.<br />
14.<br />
Pedestrian Simulations". To be presented at the SAE<br />
1983 W<strong>int</strong>er Congress.<br />
ACKNOWLEDGEMENTS<br />
The authors wholeheartedly thank the BASI for conducting<br />
the experiments and Mr. L. Wittebrood for his<br />
efforts in running the MADYMO package.<br />
'r rAc<br />
r#<br />
'l<br />
t4<br />
,.":]
EXPEHIMENTAL SAFETY VEHICLES<br />
Practical Vehicle Design for Pedestrian Protection<br />
J. E. FOWLER and J. HARFIIS<br />
Austin Rover Group Ltd, BL Cars PLC,<br />
Cowley, Oxford<br />
Transport and Road Hesearch Laboratory,<br />
Crovythorne<br />
ABSTRACT<br />
,'4t r''J<br />
t<br />
7b / / r<br />
The objective of the study described in the paper is to<br />
determine the extent to which pedestrian protection can<br />
be provided by practical car design measures. The project<br />
examines the effects of vehicle impacts upon the six-yearold<br />
child and 50th percentile male adult.<br />
Evaluation of vehicle designs primarily involves the use<br />
of the Calspan CVS computer program for pedestrian<br />
impact simulation. Computer models of dummies have<br />
been developed with the simulation method being validated<br />
against practical testing. Modifications have been<br />
carried out on the OGLE adult dummy to improve the<br />
performance of the leg in lateral impacts. Adduction of<br />
the hip jo<strong>int</strong> has been increased and the knees have been<br />
given lateral compliance together with suitable torque<br />
characteristics. The results from tests and simulation<br />
show good correlation and give <strong>conf</strong>idence in the modelling<br />
technique.<br />
The influence of various front-end changes have been<br />
studied with computer simulation using a simpliflred vehicle<br />
representation.<br />
INTRODUCTION<br />
Pedestrians form a significant proportion of road accident<br />
casualties and therefore warrant an investigation<br />
to establish if vehicle design measures can mitigate injuries<br />
and reduce the costs incurred by society.<br />
This paper describes the first stages of a 21, year collaborative<br />
project between the UK Government and BL<br />
Cars PLC that studies simulated pedestrian impacts up<br />
to a speed of ,10 km/h. Such an investigation should give<br />
car designers a better understanding of the <strong>int</strong>eraction<br />
between changes in car design and the resulting change<br />
in severity of an impact with a pedestrian.<br />
The project is based on computer simulation of pedes.<br />
trian impact and examines the influence of car shape and<br />
structural stiffness on the kinematics, impact forces and<br />
accelerations imparted to adult and child pedestrian<br />
models. It is <strong>conf</strong>ined to the most important and predictable<br />
injury-producing phase of the pedestrian collision,<br />
namely, the impact between the pedestrian and the<br />
vehicle (l).<br />
A computer simulation modelling technique was chosen<br />
since it facilitates the study of many difTerent shapes and<br />
stiffnesses and gives complete repeatability, thereby en-<br />
214<br />
abling the efrect of changes to a single comp<strong>one</strong>nt to be<br />
clearly resolved.<br />
COMPUTEH SIMULATION MODEL<br />
For many years BL Cars have been using computer<br />
simulation techniques to study and optimise vehicle performance<br />
in terms of occupant and pedestrian protection<br />
(2), (3), (4). During this time, the Calspan Corporation's<br />
3D Crash Victim Simulation Program has been a major<br />
tool (5), (6), (Figure l). For the work reported here BL<br />
have made changes to the current version ofthe program<br />
(CVS III Version 20) tor<br />
. improve the vehicle to victim contact model (7)<br />
r output additional jo<strong>int</strong> force data<br />
. retain kinematic dummy plotting facility from ver*<br />
sion 15<br />
The program has been extensively validated and an<br />
example of this is given in $ection 6.<br />
Dummy Models<br />
The simulation models of the OGLE adult and child<br />
dummies have been developed from data derived from a<br />
comprehensive study of the two dummies. This included<br />
the establishment of:<br />
. the location, axis of rotation and ranges of motion<br />
of each jo<strong>int</strong>;<br />
r thejo<strong>int</strong>'s stiffness and viscous properties, including<br />
the nature of the jo<strong>int</strong> stops;<br />
r the inertial characteristics of each body segmentl<br />
r the contact stiffness and energy recovery properties<br />
, of each body segment;<br />
r the external profile of each body segment.<br />
For the project, the simulation of the adult dummy<br />
was modified to give increased limits of adduction at the<br />
hip and also lateral compliance of the knees (described<br />
in Section 3). The latter entailed the addition of an extra<br />
segment in each leg at the knee to enable the inclusion<br />
of a jo<strong>int</strong> to provide the extra direction of knee movement.<br />
The victim contact surface model is defined by ellip-<br />
Figure 1. Computer simulation model.
soidal contact surfaces corresponding to each body segment<br />
and these were determined from the data. The<br />
stiffness characteristic of each segment was obtained by<br />
compressive tests between flat and curved rigid surfaces.<br />
In the simulation program, contact forces can be generated<br />
between ellipsoids and vehicle panels, and are calculated<br />
as a function of penetration of the surfaces, with<br />
sliding friction forces generated to oppo$e any relative<br />
motion. Any such contact must therefore be defined in<br />
terms of the combined characteristics of the two surfaces<br />
involved as a tabular or analytical function (7).<br />
Vehicle Model<br />
The vehicle contact surface model consists of up to 30<br />
rectangular plane panels. For a particular vehicle model,<br />
panels are chosen to represent the surfaces as required.<br />
The stiffness data are determined from comp<strong>one</strong>nt impact<br />
tests. Each significant area is impacted normal to its surface<br />
using an appropriate rigid form weighted according<br />
to the part of the body it represents, for example, the<br />
bumper would be impacted with a leg form and the windscreen<br />
by a head form.<br />
Several impact speeds are used up to and including the<br />
speed to be used in the simulation. From thesc results<br />
each force versus deflection characteristic and the nature<br />
of the energy recovery and permanent distortion can be<br />
determined.<br />
Program Operation<br />
When setting up a full impact simulation model the<br />
contacts between each vehicle panel and the appropriate<br />
body segment ellipsoids are specified, and, using the available<br />
stiffness data, the mutual force deflection characteristics<br />
are derived. The output from the program is both<br />
by pr<strong>int</strong>out of simulation parameters and by post processor<br />
plotting of the dummy kinematics at selected time<br />
frames. In addition, it is possible to plot variables in a<br />
graphical format either against each other or against time,<br />
and to calculate relevant injury criteria. A BL modification<br />
makes it possible to pr<strong>int</strong>out the forces and torques<br />
at any jo<strong>int</strong> in the geometric reference $ystem of a segment<br />
as seen at any po<strong>int</strong> within that segment. Additionally,<br />
the data are output in the same reference system as the<br />
vehicle. From these data and a knowledge of contacts<br />
with vehicle panels, it is possible to investigate segment<br />
bending moments. This is particularly useful when considering<br />
the lower limbs of an impacted pedestrian.<br />
PEDESTRIAN DUMMIES<br />
Although the project is based on computer simulation,<br />
it was necessary to conduct some experimental tests with<br />
dummies, Firstly, to validate the program and its input<br />
data, and secondly to provide occasional experimental<br />
'reference po<strong>int</strong>s' to check for drift in the computer pre-<br />
SECTION 5: TECHNICAL SESSIONS<br />
215<br />
diction that might occur after a wide range of parameter<br />
changes.<br />
The dummies used as the standard for the pedestrian<br />
models were of OGLE design and manufacture, and represented<br />
a 50th percentile male adult, 1.76 m tall weighing<br />
75 kg and a six-year-old child, L19 m tall weighing 21.5<br />
kg. They were basically conventional vehicle occupant<br />
test devices, strengthened where appropriate and modified<br />
to allow the dummy to stand upright. All jo<strong>int</strong>s were<br />
torque loaded at I g.<br />
The adult dummy also had additional modifications to<br />
the hip and knee jo<strong>int</strong>s as described below.<br />
Hip Jo<strong>int</strong><br />
In the human body, values of hip jo<strong>int</strong> adduction of<br />
up to 40" have been reported (8). With the dummy in the<br />
required stance, the hip jo<strong>int</strong> of the impacted leg was<br />
found to have no residual adduction. To represent the<br />
human characteristic more realistically, the hip jo<strong>int</strong> of<br />
the impacted leg was modified to the maximum practical<br />
extent so that adduction was increased to 28'but at the<br />
expense of some abduction.<br />
The leg on the non-impacted side was not modiflred; so<br />
both legs were able to swing relative to the torso for at<br />
least 25' in the direction of impact.<br />
Both hip jo<strong>int</strong>s were flrtted with compressible washert<br />
to reduce the severity of the shock loads when the jo<strong>int</strong>s<br />
reached the limits of their travel.<br />
Knee Jo<strong>int</strong><br />
Impact tests on cadavers (9), (10) have shown that the<br />
human knee will bend to a limited extent in the lateral<br />
direction. To reproduce this effect both knee jo<strong>int</strong>s were<br />
modified to permit rotation in both lateral directions, with<br />
friction plates added to give an adjustable but constant<br />
level of friction torque (Figure 2).<br />
INJURY TOLERANCE LEVELS<br />
Tolerance levels for the different body regions have<br />
been selected so that an assessment can be made of the<br />
relative safety potential of the car <strong>conf</strong>igurations studied.<br />
They are based on quantities that can be measured<br />
from practical tests as well as computer simulation, and<br />
are acceleration of the head, thorax and pelvis, and bending<br />
moments in the leg.<br />
Head, Thorax and Pelvis<br />
The acceleration levels chosen, are at'the lower end of<br />
the range known to be in common use, and are shown<br />
in Table l.<br />
However, to enable several vehicle profiles to be assessed<br />
simultaneously during the first stages of this study,<br />
a head impact velocity criterion was preferred to accel-<br />
j;<br />
.<br />
I
Figure 2. Modified adult knee.<br />
eration. This was set at the maximum vehicle impact<br />
velocity of I I m/s and represented the level of kinetic<br />
energy which might realistically be absorbed whilst ma<strong>int</strong>aining<br />
an acceptable acceleration condition.<br />
This relationship between energy absorption and maximum<br />
acceleration does not apply to the stiffest parts of<br />
the vehicle structure and so the head impact location was<br />
also considered in conjunction with its velocity.<br />
The Leg<br />
The aim of the research concerning the legs is primarily<br />
to save the knee from serious injury, and secondly, to<br />
reduce the risk of long b<strong>one</strong> fracture.<br />
For the lower limbs it has been assumed that long b<strong>one</strong><br />
fracture or knee injury results from either horizontal<br />
shear, crush or bending loads. The torsional failure mode<br />
has not been considered. However, it was found in early<br />
tests that to obtain an acceptable level of bending moment<br />
Table 1. Tolsrance levels based on acceleration.<br />
Head<br />
Thorax<br />
Pelvis<br />
Acceleration<br />
g for<br />
3ms Htc sr<br />
80<br />
60<br />
60<br />
'10<br />
EXPERIMENTAL<br />
SAFETY VEHIGLES<br />
1 000<br />
1 000<br />
216<br />
in the leg, the neccAsary low stiffnese of the contacting<br />
car structure would reduce the risk of crush or shear<br />
failure. So, to simplify the assessment of injury, only<br />
bending moments are considered. Values of bending<br />
strength for the knee and long b<strong>one</strong>s were not available<br />
and estimates have therefore been developed from existing<br />
data.<br />
The Long B<strong>one</strong>s<br />
Estimates of long b<strong>one</strong> tolerance values have been ob-<br />
tained from published data on static bending tests in the<br />
anteposterior direction (l l). There was claimed to be no<br />
significant diflerence in the ultimate strength of the bending<br />
breaking load in the lateral and the anteposterior<br />
direction. Consequently, the derived values have been<br />
used as a first estimate for bending in any flirection.<br />
Quoted values of ultimate deflection, ultimate speciflrc<br />
deflection and bending breaking load have been used to<br />
calculate the following bending moment$ at fracture:<br />
Femur<br />
Tibia<br />
Fibula<br />
2l2Nm<br />
tffilil<br />
| zr+n-<br />
A value of 200Nm has therefore been adopted for both<br />
the upper and lower leg. 200Nm has also been used for<br />
the child because no data were available.<br />
Knee-Adult<br />
To establish the tolerance limit of lateral compliance<br />
for the adult knee there were two parameters to be determined.<br />
The first was jo<strong>int</strong> stiffness (represented by<br />
friction torque in the model) and the second, the magnitude<br />
of lateral rotation representing the tolerance limit.<br />
For the lateral stiffness, comparative tests on cadavers<br />
and adult dummies (9) claimed that representative deformations<br />
of the dummy lower leg were seen when a<br />
short length of 12.5-mm-diameter threaded rod was inserted<br />
axially <strong>int</strong>o the leg directly below the knee jo<strong>int</strong>.<br />
In the model, a lateral friction torque of 200Nm at the<br />
knee jo<strong>int</strong> would provide a similar resistance to that of<br />
the threaded rod.<br />
Consequently,'a lateral friction torque of 200Nm was<br />
adopted.<br />
Because the friction torque setting in the knee jo<strong>int</strong><br />
was the same value as the bending momert tolerances<br />
adopted for the long b<strong>one</strong>s, the leg model had a constant<br />
tolerance to applied bending moment over its entire<br />
length. The effect of this was that the leg tolerance level<br />
was most frequently exceeded at the po<strong>int</strong> of impact. This<br />
is in agreement with accident studies (15) which found<br />
that leg injury most frequently occurred adjacent to the<br />
po<strong>int</strong> of major impact.<br />
For lateral rotation an angle of 6' was chosen to represent<br />
collateral ligament failure. This value was determined<br />
by utilising the work by Aldman et al. (14). By
taking the maximum r€ported elongation for the medical<br />
collateral ligament (7.2 mm) and the active distance of<br />
the ligament from the condyle (70 mm), an angle of 6'<br />
was produced.<br />
Knee{hild<br />
No attempt was made to determine a tolerance value<br />
for the child knee because of the infrequency of serious<br />
injury to the knees of children as noted in an appraisal<br />
of accidents investigated by Dr. S. J. Ashton (Birmingham<br />
University, Accident Research Unit). In this investigation,<br />
from a total of 83 accident case$ of children ten<br />
years of age or younger, there were 24 cases of fractured<br />
long b<strong>one</strong>, 15 cases of minor surface injury at the knee<br />
and only I case of non-minor injury*a fracture of the<br />
tibial plateau rated at AIS 2. It was therefore assumed<br />
for this study that for the range of shapes and stiffnesses<br />
to be investigated, bending moment at the knee would be<br />
unlikely to cause serious injury.<br />
IMPACT CONDITIONS :<br />
The following conditions applied throughout the project.<br />
Dummy<br />
The dummy was struck on the right hand side, with<br />
the right leg backward and the left leg forward to represent<br />
a walking stance. Both legs were straight and the<br />
full weight of the dummy was judged to be evenly distributed<br />
between the two legs at the moment of impact.<br />
The dummy was rotated 60" from a position directly<br />
facing the vehicle, as shown in Figure 3.<br />
The left arm of the dummy was allowed to hang vertically<br />
down whereas the upper $egment of the right arm<br />
was inclined rearwards at 30' to the vertical plane and<br />
the lower segment allowed to hang vertically down.<br />
The torque settings for the jo<strong>int</strong>s were I g.<br />
This stance was chosen for several important reasons:<br />
r to avoid knee to knee impact<br />
r to give a lateral impact to the lower limbs that is<br />
representative of typical accident conditions<br />
r to improve the probability of head to vehicle contact<br />
without the shoulder striking in such a manner that<br />
it gives unrealistically high protection to the head<br />
r to give a predictable trajectory, the dummy being<br />
inclined to rotate face down onto the vehicle.<br />
Vehicle<br />
The dummy was impacted on the centre line of the car<br />
at 40 km4r. This speed was considered to be the maximum<br />
at which pedestrian protection could be practicable.<br />
The vehicle was braked at the instant of dummy contact<br />
SECTION 5: TECHNICAL SESSIONS<br />
217<br />
Figure 3. Pedestrian standing position.<br />
with a nominal deceleration of 0,?g. The vehicle suspension<br />
was locked at normal running height to give repeatable<br />
impact conditions.<br />
COMPARISON BETWEEN<br />
EXPERIMENTAL TEST AND<br />
COMPUTEH SIMULATION<br />
Prior to the $tart of this project, it was es$ential to<br />
establish that computer simulation could accurately reproduce<br />
the results from practical tests. The simulation<br />
method was validated by comparing the results from high<br />
speed cine records of dummy impacts with post processor<br />
plots from the mathematical model. From these, <strong>one</strong> such<br />
adult comparison is presented to demonstrate the accuracy<br />
of the computer simulation, using the dummy and<br />
impact conditions described in Section 5. The results from<br />
the simulation and practical test are compared with respect<br />
to the kinematics (Figure 4), and head impact location<br />
and velocity (Table 2 and Figure 5).<br />
Detailed analysis of the head plus a visual trajectory<br />
comparison of all the body segments was considered to
Figure 4. Kinematic validation.<br />
be suffrcient for flrnal <strong>conf</strong>irmation of the performance of<br />
the model. From these results, it was concluded that, in<br />
general, the correlation wa$ good, especially during the<br />
critical periods of impact, e.g., head contact. It was considered<br />
suffrcient for the computer predictions to be<br />
within the order of variation normally associated with<br />
nominally identical dummy tests (12). Consequently, the<br />
overall agreement in results, including those from numerous<br />
other validations, was such as to allow the project<br />
to proceed with <strong>conf</strong>idence.<br />
PARAMETRIC STUDY BY COMPUTER<br />
SIMULATION<br />
This <strong>section</strong> describes the use of the computer program<br />
to evaluate the effect of various vehicle front-end profiles<br />
on impacted pedestrians. Since the project is ongoing,<br />
only the initial findings are discussed.<br />
Vehicle Representation<br />
EXPERIMENTAL<br />
SAFETY VEHICLES<br />
Table ?. Summary of validation results-head.<br />
Figure 6 shows the six panels or groups ofpanels used<br />
in the model. These represent the under-bumper region,<br />
bumper, grille, leading edge, bonnet and windscreen. To<br />
enable an extended amount of information to be gained<br />
from each run of the program, three bonnet lengths were<br />
modelled simultaneously, each having the same leading<br />
and trailing edge heights. Associated with each bonnet<br />
length was a group of three windscreens to which were<br />
given negligible stiffnesses. By this melun the impact velocity<br />
of the head with each windscreen could be obtained.<br />
Where a radiused leading edge was investigated, a slightly<br />
A typical vehicle front was modelled by using a minimum<br />
number of flat planes to represent a simplified shape<br />
which n<strong>one</strong>theless contained the most important features<br />
for pedestrian impact. The planes themselves were given<br />
idealised stiffness functions based upon those for current<br />
production vehicles. Figure 5. Head validation results.<br />
218<br />
J<br />
=<br />
I<br />
Contact Time to<br />
Vehicle<br />
Location Head to<br />
Vehicle<br />
-Horizontal<br />
-Veftical<br />
Resultant Head lmpact<br />
Velocity<br />
Head lmpact Contact<br />
Angle<br />
(to horizontal)<br />
.ry<br />
I<br />
Simulation Practical Tesl<br />
122 ms<br />
-1350 mm<br />
-560 mm<br />
10,9 m/s<br />
72"<br />
119 ms<br />
*1425 mm<br />
*585 mm<br />
11,3 m/s<br />
68'<br />
-Ea,:.,prls]--&sd__Yq!Qs!y__Bels!!c__ro,_Wlc.<br />
Vertrcol Heod Velocity Re_lotive Td Vehicld,<br />
U E<br />
;<br />
--, r<br />
s<br />
d<br />
-.oc 5<br />
Ug:teCnlSl_yClE_U5__yell_!9!_q__QrEp&_qenent ReldtNe To Vehrcle<br />
9<br />
H
4 - Fn..r h.{t{ ..F - H.rr<br />
ar - - lsilt t.rdt4 .dF - rFfi<br />
Figure 6. Vehicle simulation panels.<br />
more complex model was used (Figure 6 inset). The three<br />
panels used to model the curvature op€rated in a dependent<br />
manner, the panel with the greatest contact with<br />
each segment being used at any <strong>one</strong> time.<br />
Stiff ness Characteristics<br />
The idealised stiffness characteristics shown in Figure<br />
7 dcscribe forces normal to the vehicle panels. All reached<br />
a force plateau at which there was no limit on deflection<br />
(the stiffness of the understructure not being considered).<br />
By this means, nece$sary material crush depths could be<br />
assessed for each condition. Within the program, the stiffness<br />
for the irrteraction of each panel upon the relevant<br />
body segment was derived by combining their characteristics.<br />
For each combined stiffiress, the permanent deflection<br />
and energy recovery were set to be constant<br />
proportions of the maximum values reached after impact.<br />
Parametric Variables<br />
Throughout the initial parametric study the bonnet<br />
trailing edge height and windscreens were ma<strong>int</strong>ained<br />
constant while the parameters under investigation were<br />
concentrated at the front face of the vehicle. Table 3 and<br />
Figure 6 summarise the type and extent of the variations.<br />
Since the total number of permutations for the parametric<br />
adjustments selected wa$ extremely large, the choice of<br />
combinations had to be selectively based upon logical<br />
progres$ion and a deepening understanding of the mechanics<br />
of the impacts. It became apparent that the three<br />
initial leading edge heights chosen displayed distinctive<br />
characteristics during pedestrian impact. Consequently,<br />
the approach adopted was to assess the effects of parametric<br />
change against each of these leading edge heights,<br />
using the primary run as the baseline. The comments in<br />
the following <strong>section</strong>s refer specifically to these simulations.<br />
SECTION 5; TECHNICAL SESS|ONS<br />
219<br />
Adult lmpact Response<br />
To assist comparison of the difrerent conditions, the<br />
period of impact has been divided <strong>int</strong>o four phases as<br />
described in Figure 8. The length and timing of each<br />
phase varied depending upon the vehicle shape. Figure 9<br />
summarises the results to date.<br />
Low Leading Edge<br />
Phase I tends to be at its longest with this profile<br />
because of the delay before leading edge contact. Consequently,<br />
a large proportion of the total energy iflparted<br />
to the victim is transferred from the bumper. The knees<br />
undergo a high level of abduction and the lower legs are<br />
subjected to high bending moments with the localised<br />
impact close to the knee.<br />
Phase 2 is short because the leading edge contact is<br />
only slight, its contribution being again close to the knee.<br />
Phase 3 involves high rotational velocity with little<br />
thorax or arrn contact with the bonnet. This trajectory is<br />
a consequence of the bumper and leading edge energies<br />
being centred on an area that is well below the overall<br />
centre of gravity of the victim.<br />
Head contact (Phase 4) velocities are high due to the<br />
angular velocity of the whole body. All windscreens are<br />
contacted.<br />
Medium Leading Edge<br />
Phase I is shorter than for the low leading edge profilc<br />
because of the earlier leading edge contact. The bumper<br />
therefore impacts less energy during this phase and while<br />
the bending moments in the lower legs are similar, knee<br />
abduction cannot reach as gref,t an angle in the shorter<br />
time.<br />
Phase 2 is initiated by the leading edge contacting the<br />
central region of the upper leg. The still considerable<br />
difference in speed between vehicle and victim means that<br />
the contact is severe and causes a high local bending<br />
Figure 7. Simulation vehicle panel stiffness.<br />
J<br />
, J;<br />
lil<br />
r,f<br />
"{
Table 3. Vehicle parametric variables.<br />
moment. In addition, rapid angular motion of the upper<br />
leg puts the knee jo<strong>int</strong> <strong>int</strong>o severe abduction as the lower<br />
leg is being accelerated. This is in addition to that already<br />
imposed by the bumper during Phase 1. It is acknowledged<br />
that in a human victim, the knee injury would be<br />
greatly different if the upper leg was in fact broken.<br />
Compared with the low leading edge, Phase 3 involves<br />
lower angular velocity of the torso because the leading<br />
edge is closer to the overall body centre of mass.<br />
Head impact (Phase 4) velocities are close to the initial<br />
vehicle impact velocity but are less than those for the low<br />
leading edge case because of the reduced rotational velocity<br />
ofthe torso. Since the torso pivots about the leading<br />
edge, the impact sites are also less rearward.<br />
High Leading Edge<br />
Phase I is at its shortest for this <strong>conf</strong>iguration and<br />
there is only limited knee abduction before the leading<br />
edge contact, although the bending moments in the lower<br />
legs reach similar values to the other leading edge heights.<br />
Phase 2 starts with the leading edge contactirrg the<br />
upper leg near to the hip at almost initial impact velocity<br />
(ll m/s). There is very little hip rotation because of the<br />
proximity of the impact and the force is transmitted almost<br />
directly <strong>int</strong>o the pelvis; this also gives reduced upper<br />
EXPERIMENTAL SAFEW VEHICLES<br />
ruN NUMBER L1 L2 13. M1 M3* M4 M5 M6 WI M8 HT H2 H3* H4 HE H6 H7<br />
VEHICLE<br />
DIMENSIONS<br />
(mm)<br />
(SEE FIG" 6}<br />
LEADING EDGE<br />
SHAPE (SEE FIG,6)<br />
A 600 600 600 720 12Q 720 720 720 720 720 Bs0 850 850 850 850 850 850<br />
B 450 3s0 450 450 450 450 450 4S0 350 450 4s0 350 450 450 450 450 350<br />
c 320 270 320 320 320 320 320 320 270 262 320 270 3?0 320 320 320 2-10<br />
D r50 150 150 150 150 250 350 150 150 r50 150 150 150 250 350 150 '| 50<br />
E 150 1s0 150 150 150 1s0 150 150 150 r50 r50 150 150 r50 150 150 150<br />
F 0 0 0 0 0 100 ?00 0 0 0 0 0 0 100 200 0 0<br />
G r60 160 160 r60 r60 160 160 160 160 25 rou 160 160 160 160 160 r60<br />
l I I<br />
*l<br />
I I I I I I I I<br />
leg bending moments. The consequence of this is that the<br />
hip jo<strong>int</strong> is subjected to high forces and the pelvic region<br />
therefore sustains high accelerations. With a high bonnet<br />
there is a low rate of leg rotation about the leading edge,<br />
and therefore low inertial forces across the knee results<br />
in little abduction of this jo<strong>int</strong>.<br />
Phase 3 is controlled by the leading edge contact being<br />
close to the centre of body mass with the result that the<br />
rate of body rotation is low.<br />
Phase 4 head impacts are well below the vehicle impact<br />
velocity as a consequence of the slow rotation rate. The<br />
contacts are only with the foremost group of windscreens.<br />
Child lmpact Response<br />
The impact has again been divided <strong>int</strong>o four phases as<br />
shown in Figure 10. Figure I I summarises the child results<br />
to date.<br />
Low Leading Edge<br />
-t<br />
I I<br />
(*) Dual Phase Leading Edge Stiffncss - See Fig ?<br />
220<br />
Phase I is again at its longest with this profile because<br />
of the delayed leading edge contact. As the bumper accelerates<br />
the upper leg, the inertia of the lower leg puts<br />
a bending moment across the knee. There is also a bending<br />
-l<br />
I -l I<br />
I<br />
I
moment at the site of impact due to the inertia of the<br />
whole leg.<br />
Phase 2 is brief and involves a moderate contact with<br />
the leading edge.<br />
Phase 3 involves the body flexing around the leading<br />
edge. The torso gains a high angular velocity constrained<br />
only by the stiffness of the hips. The impact velocity of<br />
the thorax with the bonnet is therefore high and results<br />
in a high chest deceleration.<br />
Phase 4 continues from the previous phase with a head<br />
impact velocity just less than that of the vehicle,<br />
Medium Leading Edge<br />
Phase I is similar to that for the low leading edge but<br />
shortened by the earlier leading edge contact.<br />
Phase 2 involves direct leading edge contact with the<br />
pelvis and this results in both high forces and accelera-<br />
tions.<br />
Phase 3 is similar to that for the low leading edge except<br />
that it is the thorax and head which are rotating above<br />
the contact. The thorax contact velocitv is low and both<br />
SECT|ON 5: TECHNICAL SESSIONS<br />
r.or (rr) Iruur(mt) ursu (x0<br />
Figure L Adult impact phases for baseline profiles.<br />
221<br />
acceleration and rotation are small. The head rotation<br />
velocity is however affected by its inertia causing initial<br />
neck fluxion away from the vehicle only for the head to<br />
be rapidly accelerated forward when the neck recover$<br />
and the thorax decelerates.<br />
Phase 4 therefore involves a head impact velocity which<br />
is only slightly below that of the vehicle.<br />
High Leading Edge<br />
Phase I is little affected by raising the leading edge<br />
although it is shortencd slightly.<br />
Phase 2 involves direct leading edge to thoru contact<br />
with resulting high chest accelerations.<br />
Phase 3 is significantly different from those of previous<br />
profiles in that the torso does not rotate onto the bonnet,<br />
thus exacerbating the inertial effects upon the head and<br />
neck.<br />
The head impact velocity (Phase 4) is low as most of<br />
the deceleration of the head is provided by the neck. For<br />
this reason, neck injury might well arise in real accidente<br />
of this type.<br />
PHASE T<br />
gutfER rr.PAcT wrTH Lf,6S<br />
PHASE T<br />
tEAOIfio FOGE COHTACI AHD<br />
COHTII{UII./G BUI'PER<br />
COHT^CT<br />
PHTSE 3<br />
slt ioTlTtf.G Am{JilS<br />
LEADIHG EDGE ^HO LFBS<br />
HWIHG TNAY Fioii AUHPER<br />
PHASE {<br />
t€AD COflrAct<br />
;l<br />
I<br />
:Ti<br />
. t<br />
''<br />
;i 1
CONCLUSIONS<br />
A mathematical model for the simulation of a pedestrian<br />
dummy has been described and its capability to<br />
effectively reproduce a car to dummy impact, demonstrated.<br />
Tolerance levels for leg bending moments and lateral<br />
knee compliance have been determined and these have<br />
been used to as$ert$ the performance of varioufi car $hapes<br />
and stiffnesses, together with the generally accepted acceleration-based<br />
tolerance limits for head, thorax and pelvis.<br />
A knee jo<strong>int</strong> with limited lateral rotation, coupled with<br />
a constant frictional torque proved to be an effective<br />
method of representing the lateral flexibility of the knee.<br />
The studies to date show the following general relationship<br />
between vehicle design and the resulting severity<br />
of impact to pedestrians at speeds of 40 km,zh.<br />
r A low leading edge profile has two major disadvan*<br />
tages. By concentrating most of its load input below<br />
\<br />
SECTION 5: TECHNICAL SESSIONS<br />
El dual phase<br />
:l:'j":::,J':i<br />
L I<br />
tront end protrle<br />
(see also taule 3) t, \<br />
L D .T_l_<br />
I "1 -t<br />
H 5<br />
--l l't I { q . I<br />
--l<br />
lr<br />
_n1<br />
I<br />
T J<br />
---Tl<br />
1<br />
H 4<br />
-l -EJ- A D -t --l<br />
most rearward ^<br />
htad impact *<br />
po<strong>int</strong>. /: '<br />
wlndscreen<br />
[<br />
averege head<br />
to<br />
impact vel.<br />
1l<br />
for windscreen<br />
orouo 1 (M/S) 6<br />
peek<br />
r]t,<br />
iL<br />
Fl]<br />
f'L r-.1<br />
11fl I ]<br />
I .'L<br />
t-l<br />
l;::1<br />
t ' 4<br />
r . l<br />
l: :. I<br />
fr] t',1 rT r.:'l r.1<br />
t l r':-r t-l<br />
f-]<br />
t l<br />
[,] ilfl<br />
r . l<br />
t 1<br />
rTrl<br />
t' 1<br />
[ , l<br />
,L'rl-<br />
tnorar (9) 60<br />
acceletation V4 1n U u LI E LI tJ uiil il U U<br />
peak<br />
petvis (B) 60<br />
acceleral ion<br />
peak right<br />
kn6e angle<br />
(degrees)<br />
peak upper<br />
09<br />
20<br />
6.O<br />
al n<br />
DUU<br />
EE leg B.M. 400<br />
(N.M)<br />
?r|n<br />
9VV<br />
peak lowel<br />
leg B.M. 4OO<br />
(N.M)<br />
?oo<br />
LJ tl "l<br />
L.:l ti.i<br />
L.il [^l LJ LI LJ L_] l".l<br />
t!<br />
t=l Fr:l<br />
t't<br />
tT.I It T. l<br />
|:-I<br />
II<br />
r. I<br />
[.1<br />
t l<br />
rt<br />
l lti..l t.ln F]<br />
il<br />
tt lt tl [.1<br />
LI t-:J LJ LI t i:l t-j-l<br />
R l': 'l F.7<br />
1',1 F:l<br />
l_:-lHtI t.-l H<br />
tTl<br />
t. I fil n f11<br />
tl<br />
r.. 1<br />
t . l<br />
Figure 9. Parametric study results-adult. (Values related to applicable tolerance levels).<br />
t.J<br />
t . l<br />
t . I H IJ<br />
the centre of gravity of the pedestrian high angular<br />
rotation is induced and this results in head impact<br />
velocities of greater magnitude than the initial vehicle<br />
impact speed. Secondly this concentration of load<br />
about the knee causes severe local injury.<br />
The medium leading edge profile has serious problems<br />
associated with adult leg and knee injuries and<br />
child pelvis acceleration. All the geometric changes<br />
to reduce these, increases the head impact velocities<br />
for the adult, but not for the child. Of the shapes<br />
considered, only the rounding of the leading edge<br />
reduced both upper and lower leg bending moments<br />
in the adult.<br />
A signiflrcant feature of the high leading edge is that<br />
both adult and child head impact velocities are consistently<br />
below vehicle impact speed. There are, however,<br />
problems associated with direct child thoracic<br />
and pelvis impact but these can be reduced by increasing<br />
the bumper lead.<br />
For the structural stiffnesses and leading edge heights<br />
t-J<br />
ff<br />
Ftt<br />
J.,'l<br />
r.rt<br />
[,,]<br />
F-l<br />
t"l n fi r-n t'.. I fi fl n Iil<br />
222
t-\N<br />
\lq\,*<br />
EXPERIMENTAL SAFEW VEHICLES<br />
r-ow (r-t) HEDTUU (M1) tttcx (xr)<br />
\\.N\ \'\ \<br />
Figure 10. Child impact phases for baseline profiles.<br />
studied, the resulting adult thoracic accelerations<br />
were always low and the pelvic accelerations only<br />
exceeded 609 for 3 milliseconds on two occasions.<br />
The results to date suggest that further reductions in<br />
the severity of impact can probably be achieved with the<br />
medium to high leading edges. More detailed stiffness and<br />
geometric investigations will be conducted to study this<br />
possibility.<br />
ACKNOWLEDGEMENTS<br />
The authors would like to express their thanks to those<br />
who have contributed towards this project. Thanks are<br />
especially due to Mr. N. D. Grew, Mr. G. O. Davies and<br />
Mr. D. R. Gebbels of Austin Rover Group Limited.<br />
REFERENCES<br />
l. S. J. Ashton, G. M. MacKay, "Car Design for Pedestrian<br />
Injury Minimisation". Proc 7th Int Tech<br />
Conference on Experimental Safety Vehicles.<br />
2. J. E. Fowler, K. F. Newman, "The use of Computer<br />
Simulation for the Design of Safer Vehicles". Proc I<br />
PHASE 1<br />
BUI.TPER rtdFACT WlTh t EGS<br />
PHASE 2<br />
LEADING EOGE COftTACT<br />
AT{i ICfoTINUING<br />
EUiIIPER cONYACT<br />
eHASE 3,<br />
EOOY FOTATION AND BOHI{EI<br />
ll',,lPACT LEGS l{OvrNG<br />
AWAY FROTT Bi},IPEF<br />
PHASE 4<br />
HEAO CONTACT<br />
Mech E Conference-Progress Towards Safer Passenger<br />
Cars in the UK-1980.<br />
W. E. Emmerson. J. E. Fowler, "Simulation of Frontal<br />
Vehicle Impacts". Proc I Mech E Conference-<br />
Vehicle Safety Legislation-Its Engineering and Social<br />
Implications-l 973.<br />
W. E. Emmerson, J. E. Fowler, "The Application of<br />
Computer Simulation in Vehicle Safety". Proc 5th<br />
Int Tech Conference on Experimental Safety Vehicles.<br />
J. A. Bartz, "A Three-Dimensional Computer Simulation<br />
of a Motor Vehicle Crash Victim". Phase I-<br />
Development of the Computer Program, Cornell Aer'<br />
onautical Laboratory 1971.<br />
J. A. Bartz, F. E. Butler, "A Three-Dimensional<br />
Computer Simulation of a Motor Vehicle Crash Victim.<br />
Phase II- Validation Study of the Model, Cornell<br />
Aeronautical Laboratory 1972.<br />
J. E. Fowler, R. K. Axford, K. R. Butterfield,<br />
"Com-<br />
3.<br />
4.<br />
5.<br />
6.<br />
7.<br />
puter Simulation of the Pedestrian Impact-Development<br />
of the Contact Model", Proc 6th Int Tech<br />
Conference on Experimental Safety Vehicles-1976.<br />
J. A. Searle, C. M. Haslegrave,<br />
"Improvements<br />
in<br />
the Design of Anthropometric/Anthropomorphic<br />
l<br />
,li<br />
'l<br />
.;1<br />
':
EXPEHIMENTAL SAFEW VEHICLES<br />
[ijl durl ph$G<br />
rtitlncre (rco<br />
1116 trbli G )<br />
tront ftd profih<br />
(ear rlto trble 3) \,<br />
| 6u, ttEtttt ltl<br />
\ >,<br />
-r -E,<br />
l, \ \ I ]<br />
utrau<br />
h.rd imp|ct<br />
po<strong>int</strong> lrom r<br />
bonnGt l..Ot<br />
h6etl imprct<br />
velocity rith<br />
bonnrt<br />
-1, -t L l, l<br />
l.i n l7| rl F? Pttl !-l ffi r,n f.'3 FI<br />
to<br />
t1<br />
ttu<br />
Pc!k<br />
tholtr (91 60<br />
rccflarrtion<br />
t.l<br />
rrt,<br />
parh<br />
p.lvit (g) 60<br />
tecalGirtion<br />
tn<br />
C<br />
I.JJ<br />
r<br />
LI<br />
n m tn t='tl<br />
I..:J t-ut lnll rJlt I!]<br />
FA [''1R r:] n ITTI F:+r trt<br />
Fl I'T<br />
ilru<br />
pcsk<br />
.ight kn . r80<br />
torquc (H.Hl<br />
n nnHlL;lEl Elnf,ltltilfil [7 Ll til El<br />
*i;'ii "' eoo FI<br />
4J tst t*l t4,l<br />
F-:'l<br />
t4d<br />
Figure 1 1. Parametric study results-child. (Values related to applicable tolerance levels).<br />
Dummies", MIRA BULLETIN No. 5 1970 Sept/<br />
Oct 1G-2.<br />
9. H. B. Prite,<br />
10.<br />
"Comparison of the Dynamic Response<br />
of Anthropomorphic Test Devices and Human Anatomic<br />
Specimens in Experimental Pedestrian Impacts.<br />
Proc 22nd STAPP Car Crash Conference Ann<br />
Arbor USA October 1978.<br />
B. Aldman, et al., "An Experimental model for the<br />
Study of Lower Leg and Knee Injuries in Car-Pedestrian<br />
Impact$", Proc 5th Int Conference on the<br />
Biomechanics of Impact IRCOBI Birmingham England<br />
September 1980.<br />
Hiroshe Yamada, "Strength ll.<br />
of Biological Materials",<br />
Baltimore 1970-The Williams and Wilkins Co.<br />
12. Jo<strong>int</strong> Biomechanical Research Project KOB*1982.<br />
224<br />
R. H. Eppinger, H. B. Pritz, "Development of a<br />
Simplified Vehicle Performance Requirement for Pedestrian<br />
Injury Mitigation", Proc of 7th Int Tech<br />
Conference on Experimental Safety Yehicles, Paris,<br />
June 1979.<br />
B. Aldman, L. Thorngern, 0. Bunketorp, B. Romanus,<br />
"An Experimental Model System for the<br />
Study of Lower Leg and Knee Injuries in Car Pedestrian<br />
Accidents", Proc of 8th Int Tech Conference<br />
on Experimental Safety Vehicles, Wolfsburg, Germany,<br />
October 1980.<br />
S. J. Ashton, J. B. Pedder, G. M. MacKay, "Pedes-<br />
13.<br />
14.<br />
r5.<br />
trian Leg Injuries, The Bumper and other front structures",<br />
Proc 3rd International Conference Biokinetics<br />
of Impact, International Research Committee on<br />
Biokinetics of Impact, Lyon 1977.<br />
w
Application of the Fiat Methodology for Gharacterizlng Vehicle<br />
Structural Responses in Frontal lmpacts<br />
L. M. "MORFIIE''<br />
SHAW<br />
Arndt & Associates<br />
CARL RAGLAND<br />
National Highway Traffic Safety<br />
Administration<br />
ABSTRACT<br />
Over the past rcveral years, Dynamic Science, Inc.,<br />
under funding from Fiat Auto S.p.A., developed a methodology<br />
for evaluating vehicle crash compatibility. The<br />
ultimate goal was to provide compatibility characterization<br />
technology in the frontal, side, and rear impact environments.<br />
The result of this research has been extremely<br />
encouraging, providing accurate analysis and predictive<br />
capabilities, as well as justiflrcation of the methodology<br />
approach.<br />
Because of the increasing concern for vehicle crash<br />
compatibility, the U.S. National Highway TrafTic Safety<br />
Administration (NHTSA) acquired the Fiat Methodology<br />
in 1980. The NHTSA then increased the funding of an<br />
on-going program to apply the Fiat Methodology to a<br />
side impact research program. Frontal and side structural<br />
characterizations were used in the side impact analysis.<br />
This paper summarizes the results from the above<br />
NHTSA research program emphasizing the applicability<br />
of the Fiat Methodology to the characterization of vehicle<br />
structural respon$es in frontal impacts. Validation of the<br />
frontal structure characterization is discussed and presented<br />
along with comparisons between predictive analysis<br />
and crash test results.<br />
INTRODUCTION<br />
For more than a decade automotive safety researchers<br />
have recognized the signiflrcance of vehicle crash compatibility<br />
in evaluating vehicle crashworthiness within the<br />
overall accident environment. This problem has become<br />
particularly evident in the United States due to the increasing<br />
number of small vehicles. During that period,<br />
however. the traditional measure of crashworthiness and<br />
compliance in frontal impacts has been and remains based<br />
on the rigid barrier SAE J 850a test. Researchers have<br />
voiced concern with regard to the limitations and ability<br />
of this test procedure for representing real world accidents.<br />
Some of the rigid barrier test limitations include:<br />
. Is unable to simulate the great majority of automobile<br />
encounters<br />
SECTION 5: TECHNICAL SESSIONS<br />
225<br />
. Produces vehicle crashworthiness results which can<br />
deviate significantly from the trafftc mix environment<br />
. Overestimates the survival performance of smaller<br />
vehicles<br />
r Underestimates the survival performance of largcr<br />
vehicles.<br />
These limitations have promptd rcsearchers to study<br />
and recommend other testing and evaluative approaches<br />
which more closely represent the crash dynamics and<br />
structural <strong>int</strong>eractions associated with traffrc mix crash<br />
encounters. To effectively manage such a complex <strong>int</strong>eractive<br />
evaluation, it would be necessary that efforts be<br />
concentrated on vehicle test and analysis techniques<br />
which consider all significant aspects of the crash environment.<br />
In 1973, Fiat Auto S.p.A. and Dynamic $cience, Inc.<br />
began formulation of test and analysis techniques for evaluation<br />
of vehicle crash compatibility. Since this initial<br />
formation, Dynamic Science, Inc., under funding from<br />
Fiat Auto S.p.A. developed a methodology for evaluating<br />
vehicle crash compatibility. The ultimate goal was to provide<br />
compatibility characterization technology in frontal,<br />
side and rear impact environments. The results of this<br />
research have been extremely encouraging-accurate<br />
analysis and predictive capabilities have been developed,<br />
as well as justiflrcation of the methodology approach.<br />
Because of the increasing concern for vehicle crash<br />
compatibility, the U.S. National Highway Traffrc Safety<br />
Administration (NHTSA) acquired the Fiat Methodology<br />
in 1980. The NHTSA then increased the funding of an<br />
on-going program (Reference l) to initialize the applicability<br />
of the Fiat Methodology to side impact analysis.<br />
Both frontal and side structural characterizations were<br />
used in this study.<br />
This paper summarizes the results from the above<br />
NHTSA research program emphasizing the applicability<br />
of the Fiat Methodology to the characterization of vehicle<br />
structural responses in frontal impacts. A companion paper,<br />
Reference 2, deals with the applicability of the Fiat<br />
Methodology to the characterization of side impacts, utilizing<br />
the frontal model characterizations presented<br />
herein.<br />
FIAT METHODOLOGY APPROACH<br />
Franchini (References 3 and 4) discussed and highlighted<br />
the Fiat Methodology in prior Experimental<br />
Safety Vehicles (ESV) <strong>conf</strong>erences. However, it seems
eppropriate to summarize the Fiat Methodology approach<br />
prior to presenting the results used for the NHTSA study.<br />
The Fiat Methodology has resulted in new tesr and<br />
analysis approaches and techniques for evaluating vehicleto-vehicle<br />
crash <strong>int</strong>eractions. The research accomplished<br />
to date has resulted in the design and development of test<br />
hardware, test techniques, data analysis software and<br />
crash simulation software, along with validation of the<br />
basic methodology. Figure I flow charts the basic engineering<br />
approach and illustrates the coupling of experimental<br />
test data and analytical technology to define and<br />
characterize a vehicle's response to crash enviroflments.<br />
lt was recognized from the beginning of the Fiat Methodology<br />
development effort that the results and analyses<br />
must be based on experimental data. As illustrated in<br />
Figure l, the first step is a structural characterization test<br />
of the vehicle under the appropriate impact conditions.<br />
For our research, this was accomplished through the use<br />
of a test device developed to enhance structural data<br />
acquisition. The test device has been discussed and presented<br />
by Franchini in References 3 and 4 and consists<br />
of a 36-module load-measuring moving barrier fitted with<br />
energy-absorbing h<strong>one</strong>ycomb blocks attached to each<br />
module. The purposes of the test device include:<br />
L Simulation of the structural <strong>int</strong>erface <strong>int</strong>eractions involved<br />
in vehicle-to-vehicle encounters,<br />
2. Measurement of crash <strong>int</strong>erface loads and deflections<br />
between the test device and vehicle being characterized.<br />
and<br />
3. Simulation, as closely as possible, of inertia reacti<strong>one</strong><br />
associated with vehicle-to-vehicle impacts.<br />
Of equal importance in the characterization test i$ the<br />
instrumentation of the vehicle being characterized. It<br />
must adequately define the structural dynamics and inertial<br />
reactions (including occupants, restra<strong>int</strong>s, engine,<br />
suspensions, etc.) that characterize the vehicle's response<br />
to the crash environment. The vehicle instrumentation is<br />
dependent upon the impact mode (front, side, rear) and<br />
upon the vehicle's design <strong>conf</strong>lrguration.<br />
The second step of the Fiat Methodology was to develop<br />
analysis techniques which would permit characterization<br />
of a vehicle's structural response to a crash test<br />
environment. This was accomplished by developing a data<br />
processing software package referred to as Computer Program<br />
A. As illustrated in Figure l, Program A accepts<br />
as input the kinematic and dynamic behavior obtained<br />
from the vehicle characterization test data, the vehicle<br />
parametric data, and analytical model <strong>conf</strong>iguration. The<br />
program then processes these data to deflrne the necessary<br />
structural properties of the general lumped-parameter vehicle<br />
model which are required to reproduce the given<br />
kinematic input. The end product is an analytical model<br />
of the vehicle being characterized, using full-scale crash<br />
data.<br />
The third step of the Fiat Methodology was to develop<br />
EXPERIMENTAL SAFETY VEHICLES<br />
226<br />
e@<br />
Eilr c rrbn6<br />
tlfr cof,tEuR^mf,,<br />
YIffiII FAN T'TTRICT<br />
Figure 1. Fiat methodology approach.<br />
techniques which simulate crash encounters between<br />
characterized vehicles. This was accomplished through<br />
the development of a software package referred to as<br />
Computer Program B. As illustrated in Figure l, Program<br />
B accepts as input lumped-mass non-linear spring model<br />
representations such as defined by Program A output (or<br />
other desired impact conditions) and computes the crash<br />
response of the vehicles. Program B can also be used to<br />
check Program A output by simulating the vehicle characterization<br />
test, thus providing model validation and a<br />
means for model improvement.<br />
Once a vehicle's model characterization has been validated,<br />
it can be used to study structural crash <strong>int</strong>eraction<br />
with other characterized vehicle structures or barriers. A<br />
suffrcient number of characterieed vehicles representing<br />
the traffrc mix environment could then provide a data<br />
base for evaluating an individual vehicle's structural<br />
crashworthiness compatibility with a traffic mix population<br />
environment.<br />
FRONT STHUCTURAL CHARACTER-<br />
IZATION<br />
In the Fiat S.p.A.-sponsored Fiat Methodology development<br />
efforts, the Fiat 132 sedan was the primary evaluation<br />
vehicle. As a result. a considerable test data base
had trun gencrated for that vehicle in both the frontal<br />
and side impact <strong>conf</strong>igurations. The Fiat 132 was consequently<br />
selected as the study vehicle for the NHTSA<br />
demonstration program (Reference l). The Fiat 132 fourdoor<br />
sedan is a conventional front engine, rear wheel drive<br />
vehicle with a curb weight of approximately 2,380 pounds<br />
(1,080 kg).<br />
The Fiat 132 front structures characterization effort is<br />
illustrated in Figure 2. It included full-scale characterization<br />
testing, computer data processing, model development,<br />
and model validation.<br />
STRUCTURAL CHARACTERIZATION TEST<br />
The front characterieation test consisted of a head-on<br />
impact between the Fiat test tool (described in References<br />
3 and 4) and a Fiat 132 Sedan. Table I summarizes the<br />
test conditions for this test. The Fiat 132 carried fully<br />
instrumented driver and right front passenger Part 572<br />
dummies and extensive accelerometer instrumentation on<br />
all significant inertial masses. The test tool carried 36<br />
load cells along with string potentiometers for measuring<br />
I<br />
I<br />
I<br />
I<br />
I IIIIII<br />
I<br />
I<br />
I<br />
I<br />
I<br />
I<br />
I<br />
I<br />
I<br />
I<br />
I<br />
I I<br />
L<br />
TEST:40 MPH CLOSURE<br />
FIAT TEST TOOL TO<br />
FIAT I3Z FRONT<br />
COMPUTER<br />
PROGRAM A<br />
FIAT 132<br />
FRONT MODEL<br />
COMPUTER<br />
PROGRAM B<br />
FIAT 132 FNT<br />
VALIDATION<br />
Figure 2. Flow chart of front structural characterization.<br />
SECTION 5: IECHNICAL SESSIONS<br />
227<br />
Table 1. Fiat tEst tool to Fiat 132 frontal characterization<br />
test.<br />
Fiat 132 Test Weight 2798 lb (1269 kg mass)<br />
Test Tool Weight 4040 lb (1833 kg mass)<br />
Closure Velocity 39.2 mph (63 km/h)<br />
lmpact Orientation Head on with Aligned<br />
Centerlines<br />
tcst tool h<strong>one</strong>ycomb deflections and frame accelerometers.<br />
STRUCTURAL MODEL DEVELOPMENT<br />
AND VALIDATION<br />
The data from the Fiat test tool-to-Fiat 132 frontal<br />
characterization test was processed through a Class 60<br />
digital filter and input, along with the Fiat 132 parametric<br />
data and representative model <strong>conf</strong>iguration <strong>int</strong>o Computer<br />
Program A. The output of Program A defined the<br />
<strong>int</strong>erconnecting spring load deflection characteristics between<br />
the analytical model masses. For the Fiat 132 characterization<br />
test, the analytical model <strong>conf</strong>iguration, with<br />
resp€ct to vehicle mass representations, is illustrated in<br />
Figure 3. This model incorporates both the Fiat 132 and<br />
Fiat test tool inertial repre$entations.<br />
The Fiat 132 model, along with the <strong>int</strong>erconnecting<br />
spring characteristics and the analytical model of the Fiat<br />
test tool were input <strong>int</strong>o Computer Program B and exercised<br />
under the impact conditions of the characterization<br />
test. This procedure validated the Fiat 132 analytical<br />
model by direct comparison of predicted and test results<br />
and provided an opportunity to flrne tune the spring characteristics.<br />
It has been our experience that fine tuning,<br />
following the initial Program B validation run, is normally<br />
<strong>conf</strong>ined to improvements in the definition of the analytical<br />
spring unloading characteristics. This definition is<br />
extremelv sensitive to data inaccuracies near the end of<br />
RICET<br />
SUSPENSIOI{<br />
COMPARruENT<br />
Figure 3. Model <strong>conf</strong>iguration for the Fiat front.
Table 2, Fiat 132 frontal model validation results summary<br />
Parameter Test Data Simulation<br />
Closure Velocity (mph)<br />
Fiat 132 Weight (lb)<br />
Test Tool Weight (lb)<br />
Fiat 132 Velocity<br />
39.2<br />
2798<br />
4040<br />
39.2<br />
2798<br />
4040<br />
Change (mph) 24.5 26.2<br />
Test Tool Velocity<br />
Change (mph)<br />
Maximum Dynamic Mutual<br />
Crush (in.)<br />
Fiat 132 Average Dynamic<br />
Crush (in.)<br />
17.4<br />
24.8<br />
21.0<br />
, , 17.4<br />
24.3<br />
20.6<br />
the crash pulse. Other fine tuning should not be necessary<br />
if test data retrieval is accurate.<br />
The results of the Fiat 132 frontal model valiation are<br />
summarized in Table 2. Figure 4 compares the predicted<br />
response of the compartment of the Fiat 132 to the actual<br />
test data. Similarly, Figure 5 compares the predicted response<br />
ofthe test tool to the actual test data. Ofparticular<br />
<strong>int</strong>erest in a frontal simulation is the ability to characterize<br />
the dynamics of vehicle comp<strong>one</strong>nts as well as structural<br />
responses. Figures 6 and 7 respectively compare Fiat 132<br />
engine and left front suspension predicted responses to<br />
actual test results. The right front suspension response<br />
(not shown) was essentially the same as that shown in<br />
Figure 7 for the left front suspension. The results indicate<br />
excellent representation by the analytical model of the<br />
actual crash response of the vehicle. The Computer Pro-<br />
gram B input which provided these results consisted of<br />
a Fiat 132 frontal model and test tool model totaling 41<br />
degrees of freedom.<br />
VEHICLE.TO.VEH ICLE<br />
PREDICTIVE CAPABILITY<br />
The validated Fiat 132 frontal model was duplicated<br />
and both model sets were input <strong>int</strong>o Computer Program<br />
B, along with the initial crash conditions of a Fiat 132<br />
r &<br />
ZE<br />
O r<br />
{t<br />
qU<br />
E -<br />
O F<br />
O FREDICTED ACCELERATION<br />
A PREDICTED VELOCITY<br />
Figure 4. Gomparison between predicted and test results for<br />
the Fiet 132 compartment-Fiat 132 frontal vali'<br />
dation.<br />
EXPERIMENTAL SAFEW VEHICLES<br />
228<br />
Figure 5. Comparison between predicJed and test results for<br />
the Fiat test tool vehicle-Fiat 132 frontal validation.<br />
I<br />
z<br />
4 0<br />
3H<br />
O O{<br />
% A #<br />
#<br />
\"*<br />
u<br />
Q FREDICTED ACCELERATION<br />
A PREDICTED \TELOCITY<br />
40 60 80<br />
TTME - MSEC<br />
TEST TOOL<br />
Figure 6. Comparison between predicted and test results lor<br />
the Fiat 132 engine-Fiat 132 frontal validation.<br />
u IB<br />
F<br />
j o<br />
r.l<br />
o<br />
_r00<br />
\<br />
-tnd g<br />
/$ s<br />
Figure 7. Comparison between predicted and test results for<br />
the Fiat 132 lelt suspension*Fiat 132 frontal validation.<br />
front to Fiat 132 front crash test conducted at a closure<br />
velocity of 48.7 mph (78.4 km/hr) (Reference 5). This<br />
effort is illustrated in Figure 8. The resulting simulation<br />
provided 46 degrees of freedom, including both vehicle<br />
representations. Table 3 compares the predicted results<br />
to the actual test data. The vehicle analytical models were<br />
identical, therefore, producing exactly the same predicted<br />
responses. The crash test, however presents two identical<br />
60<br />
TIME * MSEC<br />
O PREDICTEI' ACCELERATIOI{<br />
ll.+.<br />
---q{E<br />
\"d /-E<br />
r+r<br />
J PREDICTEN ACCELEITATION<br />
b- I I<br />
FIAT I3Z<br />
ENGINE<br />
I<br />
{0 60<br />
L-<br />
TIME - MSEC<br />
t- HAT I3Z<br />
LEFT SUSPENSION
COMPUTER<br />
PROGRAM B<br />
FIAT I3Z FNT-<br />
TO.FIAT 132 FNT<br />
PREDICTION<br />
COMPARISON<br />
TEST: 50 MPH CLOSURE<br />
FIAT 132 FRONT-TO.<br />
FIAT 132 FRONT<br />
Figure 8. Flow chart for vehicle-to-vehicle prediction.<br />
Table 3. Fiat 132 front to front predicted crash result* summary,<br />
Palqllqt€r<br />
Bullet Vehicle Weight<br />
(lb)<br />
Target Vehicle weight<br />
(lb)<br />
Bullet VehiclE Velocity<br />
(mph)<br />
Target Vehicle Velocity<br />
(mph)<br />
Maximum Dynamic Mutual<br />
Crush<br />
-lntegrated Acceleration<br />
(in.)<br />
-Photography (in.)<br />
Velocity Change at 100<br />
msec<br />
(From Acceleration<br />
Data)<br />
-Bullet Vehicle<br />
(mph)<br />
-Target Vehicle<br />
Simulation<br />
2798<br />
2798<br />
24.4<br />
24.4<br />
35,0<br />
N/A<br />
26.1<br />
26.1<br />
SECTION 5: TECHNICAL SESSIONS<br />
Test Data<br />
2820<br />
2826<br />
24.4<br />
24.4<br />
37.0<br />
34,0<br />
26.1<br />
27-O<br />
r a<br />
ZE<br />
F I<br />
EF<br />
rcE<br />
14u<br />
9 H<br />
U><br />
\ ,AA,d<br />
t t<br />
OPF EDICTED ACCELERATION<br />
AFI EDICTED VELOCI?I<br />
fsH ffi<br />
- q E I nir rre-s<br />
FIAT I32-8<br />
I<br />
Figure 9. Comparison between predicted and test results for<br />
the Fiat 132 compadment.<br />
vehicle models with corresponding responses representative<br />
of the real-world manufacturing and data acquisition<br />
tolerances. The Fiat I32 frontal model used was identical<br />
to that used in the validation analysis without adjustment<br />
of total vehicle mass differences.<br />
Figure 9 compares the predicted Fiat 132 compartment<br />
re$ponse to the response accompanying each of the Fiat<br />
132 test vehicles and Figure l0 compares the predicted<br />
engine response to the responses measured on each ofthe<br />
test vehicles. Figure I I presents the predicted dynamic<br />
crush of the Fiat 132 models compared to the measured<br />
post-test residual crush for the test vehicles at bumper<br />
level.<br />
o<br />
0<br />
7<br />
F { -?t<br />
d - -<br />
@<br />
J<br />
F<br />
O<br />
60<br />
TIME - MSEC<br />
I<br />
oFl EDICTED ;CELERATTOI<br />
\<br />
ii<br />
l l<br />
ii<br />
o<br />
{0 60<br />
TTTE - MSEC<br />
ii &<br />
ff^<br />
i iY*<br />
i ;.'. l'-vt<br />
lfcFo*<br />
I<br />
- raT l lt-o<br />
---- raT Iet-t<br />
Figure Comparison between predicted and test results<br />
for the Fiat 132 engine.<br />
I<br />
.'r !<br />
r, !<br />
1
E I<br />
F*<br />
F<br />
I<br />
tJ<br />
&<br />
F<br />
E<br />
- FIAT lt?-t TEST tfo, all9-1<br />
O PRDICTED DYilAMTC CRVIf,<br />
Figure 11. Comparison between simulated and test results<br />
lor the Fiat 132 exterior crush at bumper level.<br />
CONCLUSIONS<br />
- HAT r3z-r rutr NO. {t69*l<br />
RESIDUA.L CRUEH<br />
u 0 1 0 0 1 0 e 0<br />
LATlltt! DlsTAlfct t?ou \rEHtcLE cEt'ttERLlNE - rN,<br />
The objective of the Fiat Methodology is to provide a<br />
means by which vehicle <strong>int</strong>eractions within a variety of<br />
crash environment can be determined with minimal testing.<br />
The applicability of the Fiat Methodology, test tool,<br />
and computer analysis procedures to the frontal head-on<br />
impact problem was demonstrated. The predicted results<br />
documented herein were well within the variability which<br />
can be expected when production vehicles are tested under<br />
identical conditions, using current instrumentation.<br />
Early Fiat Methodology research revealed that the development<br />
of the predictive technology was evolutionary<br />
in nature-the achievement of a certain level of model<br />
sophistication resulted in improved modeling and characterization<br />
techniques. A great deal of the capabilities<br />
reported herein involved methodologies and upgraded<br />
computer programs which are presently proprietary to<br />
Fiat Auto S.p.A. Therefore, only the results of these analyses<br />
can be presented in this report.<br />
The side impact model development on which the<br />
NHTSA program (Reference 1) focussed indicated that<br />
considerably more detail and capabilities, over and above<br />
EXPERIMENTAL SAFETY VEHICLES<br />
230<br />
'the<br />
capabilities of the NHTSA versions of the Fiat Methodology,<br />
computer programs, were required to provide<br />
side impact characterization. Consequently, to ma<strong>int</strong>ain<br />
compatiblity between the frontal and side characterization<br />
programs, the frontal characterization model discussed<br />
herein also required this additional reflrnement.<br />
Accuracy of the electronic test data is critical to the<br />
effective application of the Fiat Methodology. Significant<br />
time can be saved if the accuracy of the electronic test<br />
data is verified prior to its input <strong>int</strong>o Program A. In<br />
addition, the vehicle characterization and model predictive<br />
accuracies can never be better than the test data used.<br />
As a result, the accuracies and refinement of the Fiat<br />
Methodology can be improved concurrently with improvements<br />
in instrumenation hardware and techniques.<br />
Furthermore, the use of the Fiat Methodology to evaluate<br />
a vehicle's crashworthiness is not frxed or dependent upon<br />
<strong>one</strong> evaluation condition or compliance environment. It<br />
is a methodology which is compatible with changing compliance<br />
criteria.<br />
REFERENCES<br />
l. Shaw, L. M., Knight, R. E. and Trudgen, A. C., ,,Application<br />
of the Fiat Methodology to Vehicle Side Impact",<br />
Report Number to be Assigned by the National<br />
Highway Traffrc Safety Administration, Contract<br />
Number DOT-HS-8-01933, Modification Number 4,<br />
Dated September 1981.<br />
2. Shaw, L. M., Ragland, C.,"Application of the Fiat<br />
Methodology for Characterizing Vehicle Structural<br />
Responses in Side Impact", N<strong>int</strong>h International Technical<br />
Conference on Experimental Safety Vehicles,<br />
Kyoto, Japan, November I through 4, lg82.<br />
3. Franchini, E., "Fiat Technical presentation'r. Sixth<br />
International Technical Conference on Experimental<br />
Safety Vehicles, Washington, D.C., U.S.A., pages 129<br />
through 157, October 12 through 15, 1976.<br />
4. Franchini, E., "Side Collision", Seventh International<br />
Technical Conference on Experimental Safety Vehicles,<br />
Paris, France, Pages 456 through 476, June 5<br />
through 8, 1979.<br />
5. "Data Submittal Report Entitled, Excerpts From an<br />
Existing Fiat Auto S.p.A. Report of Fiat 132 Frontto-Front<br />
Head-On Impact, Test Data for Task 1",<br />
Contract Number DOT-HS-8-01933, Modification<br />
Number 4.
SECTION 5: TECHNICAL SESSIONS<br />
lnfluence of Occupant Seatlng Posture and Size on<br />
Head and Chest Injuries<br />
in Frontal Collision<br />
TSUYOSHI AIBE, KUNIYUKI WATANABE,<br />
TATSUMASA OKAMOTO and<br />
TAKASHI NAKAMOHI<br />
Nissan Motor Co., Ltd.<br />
ABSTRACT<br />
The evaluation of vehicle occupant protection performance<br />
in a collision is generally based on the injury criteria.<br />
The seat is placed in the standard design position, using<br />
a 50th-percentile dummy, as represented in the FMVSS<br />
208.<br />
On the highway, however, vehicles are driven by individuals<br />
of various physical sizes and in various seat<br />
positions.<br />
In this study, we have examined the rclationship be,<br />
tween injury level and ocsupant size or seating posture.<br />
This paper presents examination results concerning<br />
forces acting on the chest and also on factors causing<br />
injury to the head.<br />
TEST PROCEDURES<br />
Test Eguipment<br />
In order to compare occupant injury levels in various<br />
conditions, we have conducted tests using a weight-drop<br />
type sled tester. This sled tester was considered to be a<br />
highly accurate reproduction when combined with a<br />
shock absorbcr, capable ofproducing a deceleration curve,<br />
simulating a 30-mph frontal barrier collision.<br />
Figure I shows a schematic drawing of the test equipment.<br />
Figure 2 shows a deceleration curre caused by the<br />
combination of the weight-drop type sled and the shock<br />
absorber. Another deceleration curve produced by a 30-<br />
Figure L Test equipment.<br />
231<br />
G<br />
tz<br />
F4 J<br />
U<br />
4<br />
DULATION TIME (rEd) +<br />
Figure 2. Deceleration curve.<br />
.,.t-<br />
' Jd 7at.t<br />
- WEIGHT.DROP<br />
IMPACT TEST<br />
rySLED<br />
- - 3o-mph FBONTAL<br />
BARRIER COLLTSION<br />
TEST WCAR<br />
mph frontal barrier coltision with a vehicle is also shown.<br />
This can be regarded as an actual simulation of the collision.<br />
Test Conditions<br />
We conducted all sled tests with the same instrument<br />
panel, seats, seat belts, and seat belt anchorage po<strong>int</strong>s as<br />
found in an actual car.<br />
To consider the influence of occupant body size, we<br />
used the following three typ€s of dummies:<br />
Tabfe 1. Types of dummies.<br />
;il';ilttilfrii | 745<br />
AMERICAN, FEMALE,<br />
5th PERCENTILE<br />
fli[li,"<br />
47 2 | 78.0<br />
REMARKS<br />
M. I HYBRID II<br />
I ALDERSON.MADE<br />
S6 5 I ALDERSON-MADE<br />
Next, tests were conducted to examine the influence of<br />
occupant seating posture by setting up flrve po<strong>int</strong>s as<br />
ehown in Figure 3. The seat slide was moved forward or<br />
rearward by 100 mm from the normal middle position.<br />
The seat back angle was set where the seat back was<br />
inclined forward or backward by 9 degrees from the normal<br />
middle position.<br />
Using three different sized dummies to examine the<br />
relationship between injury levels and occupant sizes, a<br />
series of tests were carried out under the conditions shown<br />
in Table 2.<br />
Next, to scc what efrect the scat slide positon had on
SEAT SLIDE<br />
Figure 3. Positions of seat back and seat slide.<br />
Table 2. Test condition (1).<br />
Table 3. Test condition (2).<br />
M50 M9s<br />
'"-.T!++::1"-t.'rii<br />
DRIVER PASSENGER DFIVER PASSENGEB<br />
B<br />
c<br />
Table 4.<br />
(5 (0 r9<br />
2t e (l0 o (}<br />
(iS (i4 (i0 LO<br />
M50 MS5<br />
DFII/ER PASSENGER DHIVER PASSENGER<br />
(D @ L$ @<br />
@ @ o (}<br />
ED @ 6 €b<br />
injury level, te$ts were conducted under conditions shown<br />
in Table 3.<br />
To determine what effect the seat back angle had on<br />
the injury level, tests were conducted under the condition<br />
shown in Table 4.<br />
EXPERIMENTAL SAFETY VEHICLES<br />
232<br />
Table 5.<br />
\\===JUMMY --'--Sgnf ---=\<br />
---{tsrtoru<br />
sEAr BELr<br />
-\\<br />
ELONGATION RATE<br />
M50<br />
DRIVER PASSENGER<br />
STD WEBBING rql @<br />
15% MORE<br />
ELONGATING WEBBING e9 @<br />
Finally, to determine the effect of the seat belt elongation<br />
rate on the injury level, tests were conducted under<br />
the same conditions as in Test Nos. (9) and (10), with<br />
the belt elongation itself increased by approximately 15<br />
percent, as shown in Table 5,<br />
RELATIONSHIP BETWEEN INJURY<br />
LEVEL AND OCCUPANT BODY SIZE<br />
Figures 4 and 5 show the extent of injuries sustained<br />
by the head and by the chest, as a result of tests of Test<br />
Nos. (1) through (12) under the conditions shown in Table<br />
1<br />
In Figures 4 and 5'<br />
(l) The head injury level increases as the dummy size<br />
decrease$, especially with the F05 which shows high injury<br />
levels, and<br />
(2) The chest injury level also increases as the occupant<br />
size decreases.<br />
Here, force applied to the dummy during a collision is<br />
shown in Figure 6. The difference in occupant size does<br />
not change the initial restra<strong>int</strong> caused by the seat belt.<br />
E-]<br />
E ]<br />
-r*1<br />
+ ' FO5 M50 M95<br />
DUMMY SIZE<br />
Figure 4. Head injury level.
I<br />
Y I<br />
H l<br />
E<br />
q?<br />
tr<br />
ul<br />
J<br />
E<br />
f<br />
=<br />
(n<br />
uJ<br />
I<br />
(-)<br />
SEAT SLIDE POSITIONS B A<br />
DRIVER o A<br />
PASSENGER t ^.<br />
DUMMY SIZE<br />
Figure 5. Chest injury level (3 msec.G).<br />
After approximately 40 to 50 msec from the start of the<br />
collision, the chest becomes restrained by the shoulder<br />
belt, and after another 30 msec, the chest stops moving.<br />
Then, the head begins to pivot on the neck, and thus, the<br />
phenomenon caused by the collision comes to an end.<br />
We examined the reason why, in a similar phenomenon,<br />
the tendencies shown in Figures 4 and 5 occur.<br />
The chest is restrained by the shoulder belt. Our examination<br />
revealed, in each test case, that the relationship<br />
between the tension on the shoulder belt and the occupant<br />
weight was highly correlated as shown in Figure 7. Generally<br />
the substantial mass weight applied to the shoulder<br />
belt is said to account for 25 percent ofthe overall weight.<br />
The Substantial mass weight frgured out from the belt<br />
tension and the deceleration G produced on the chest is<br />
shown in Table 6. This shows clearly that the substantial<br />
mass weight makes up approximately 25 percent of the<br />
overall weight.<br />
The force produced on the chest can be calculated by<br />
t<br />
BESTRAINT BY FAPID HEAD<br />
BEIT START$ SHAKING STARTS<br />
EELT TENSION<br />
SECTION 5: TECHNICAL SESSIONS<br />
CHEST DECELERATION G<br />
IRESULTANT}<br />
- HEAD DECFLEMTTON G<br />
..'- (RESULTANT)<br />
Figure 6. Phenomenon occurring on each part in collision.<br />
;<br />
6<br />
z<br />
U<br />
tr U<br />
(D<br />
y:348 + 26 6x<br />
r=099<br />
22 24<br />
Figure 7. Relationship between occupant weight and belt<br />
tension.<br />
using a simple equation. From the correlative equation<br />
in Figure 7, the following equation is formed:<br />
F:WG (l)<br />
where F : Shoulder belt tension (kg)<br />
W: Substantial mass weight (kg)<br />
G: Deceleration produced on chest<br />
F:26.6W+348<br />
From equations (l) and (2), the deceleration produced<br />
on the chest is expressed by the following equation;<br />
348<br />
rJ: W<br />
+ 26.6 (3)<br />
From equation (3), it is found that the chest injury<br />
level is lowered in a reciprocal proportion to the dummy<br />
size and weight.<br />
Table 6. Substantial mass weight applied to shoulder belt.<br />
)UMMY<br />
slzE<br />
FG5<br />
M5{t<br />
M96<br />
SEAT<br />
SLIDE<br />
6<br />
A<br />
B<br />
6<br />
A<br />
OUMMY<br />
SEATING<br />
FOStTtOH )*'n<br />
tG)<br />
INITIAL: A6E<br />
BE LT<br />
TENSION<br />
tFl<br />
*'T^t-f<br />
TIAL Wt.<br />
lwl<br />
q6G<br />
T|-'l,:.|h<br />
zuesr;;<br />
TIAL Wt.<br />
twl<br />
r*f.urF..__ 10 t20 12 57 Sgtt t2,l<br />
'A$9EN6 E R<br />
to 120 12 EI 636 1.8<br />
)RIVEF 70 8r0 l.a<br />
PASSET{G E ff t0 140 r4 57 670 il.8<br />
DFIVER lo t20 l2 52 8it0 t5.a<br />
PASSENGER lo t50 t5 a6 866 t8.8<br />
DRIVER lo r80 18 43 840 19.5<br />
PASSENGER t0 r80 t8 50 830 13.8<br />
DRIVER t0 250 25 {6 sa0 2r.3<br />
PASENdER to jto 3l 32 1,020 31.8<br />
bHIVEF to 2ao 28 't0 r.010 ?5.2<br />
FASSENGER to 3S 35 ,t3 990 ?3.o<br />
YYEICHT<br />
(ksl<br />
SUBSTANIIAI.<br />
MASS wr. AY.<br />
tkql<br />
FERCENTAGE<br />
t%t<br />
F05 17.Z 12.2 26.8<br />
M5{t 74.5 16,3 ?t.e<br />
ils6 s7.7 t5.l 25.7<br />
5 4<br />
.:<br />
.;<br />
il<br />
J<br />
I<br />
-i4<br />
t<br />
-. rl<br />
',il<br />
,tl<br />
':'
F<br />
z<br />
lu<br />
E<br />
tJJ<br />
o<br />
E<br />
{(J<br />
tr (E<br />
LlJ<br />
6<br />
fi<br />
I<br />
+ TURNING<br />
BADIUS<br />
(r:11O)<br />
o<br />
CENTEF<br />
TRA"JECTORY<br />
M5O HEAD'S<br />
CENTER OF GRAVITY<br />
TURNING--<br />
RADIUS<br />
(r:190)<br />
TRAJECTORY OF<br />
MgS HEAD'S<br />
CENTER OF<br />
TURN<br />
RADIUS<br />
(r:20O)<br />
--+<br />
HEAD FOR\AARD MOVEMENT<br />
Figure 8. Head behavior by size.<br />
EXPEHIMENTAL SAFETY VEHICLES<br />
TMJECTOBY OF FO5<br />
HEAD'S CENTER OF<br />
GRAVITY<br />
lO0msec<br />
lO0msec<br />
CENTER<br />
lOomsec<br />
TURNING CENTER<br />
Next, let's consider the influence of the dummy size<br />
on the head injury level. It is found that although the<br />
aforementi<strong>one</strong>d chest deceleration influences the head injury,<br />
the dummy size has a more dominant effect.<br />
That is, when the curve of deceleration produced on<br />
the head is looked at after a period of time, we can<br />
consider the phenomenon in the following two stages:<br />
According to the deceleration curves in Figure 6,<br />
(l) Approximately 80 msec after the initial collision,<br />
the deceleration on the chest reaches a peak. In the mean-<br />
Figure 9. Restra<strong>int</strong> positions by size.<br />
time, the head, affected by the chest, traces a large circular<br />
arc trajectory with the waist as a pivot, and thus, a peak<br />
at the first stage is reached.<br />
(2) The chest stops moving after the peak of the first<br />
stage. The remaining speed energy on the head is absorbed<br />
by the head shaking motion. It has an extremely small<br />
turning radius, and uses the neck as a pivot. Centrifugal<br />
force generated by the head shaking motion produces the<br />
second-stage peak deceleration.<br />
In this study, the level of head injury $ustained by the<br />
F05 dummy is highly comparable to those cases of the<br />
M50 and M95 dummies. This is thought to be due to the<br />
second-stage peak menti<strong>one</strong>d above.<br />
Figure 8 shows head behavior graphed according to<br />
dummy size. From the head behavior after the chest<br />
ceases to move (approximately 80 msec after the initial<br />
collision), the turning radius of the head shaking motion<br />
is measured to be equal to the values shown in Figure 8.<br />
The difference ofthese turning radii ofthe head shaking<br />
motion was caused by the difference in the position of<br />
chest restra<strong>int</strong> by the shoulder belt.<br />
Let's discuss the head turning radius. Changes in the<br />
early position ofchest restra<strong>int</strong> by the shoulder belt, which<br />
is caused by the difference in occupant size, will have<br />
different effects on the attitude of the restrained dummy<br />
during a collision. As shown in Figure 9, the difference<br />
in restra<strong>int</strong> ranges from a rapid head shaking motion,<br />
with the neck as a pivot (F05 type), to a comparatively<br />
gentle head shaking motion with the neck turning with<br />
the twisting torso (M50 and M95 types).<br />
As described above, it can be seen that the head injury<br />
level is largely influenced by the difference between the<br />
chest restra<strong>int</strong> position and dummy size, namely due to<br />
the difference in the head turning radius, even if the<br />
occupant compartment has no comp<strong>one</strong>nts to cause a<br />
secondary collision to the head.<br />
INFLUENCE OF SEAT SLIDE POSITION ON<br />
INJURY LEVEL<br />
Figuree 10 and ll show the cheet injury level and thc<br />
head injury level as they relate to the position ofthe seat<br />
slide, with the following results:<br />
(l) The chest injury level tends to increase as the seat<br />
slide is positi<strong>one</strong>d rearward.<br />
(2) The head injury level tends to increase as the seat<br />
slide is moved rearward. When the seat slide is positi<strong>one</strong>d<br />
forward, a phenomenon can occur in which a secondary<br />
collision against the steering wheel, etc, become$ more<br />
severe and the iqiury level increases.<br />
Hereupon, we examined the reason why we see increased<br />
deceleration on the chest when the seat slide is<br />
moved rearward.<br />
Figure 12 is a comparison graph showing deceleretion<br />
produced on the chest, belt tension and cheet moving
3msec-G<br />
I<br />
uJ<br />
e<br />
Ef-)<br />
z<br />
F<br />
a<br />
Iu<br />
I<br />
L)<br />
60<br />
DRIVER<br />
MSO A<br />
M95 s<br />
; B A-+<br />
SLIDE POSITION<br />
Figure 10. Seat slide position and chest injury level.<br />
speed of Test Nos. (3), (9) and (13), when conducted<br />
using an M50 dummy.<br />
The time when the shoulder belt begins to restrain the<br />
chest changes by 4 to 6 msec according to the position<br />
of the seat slide.<br />
This difference in time influences the amount of tension<br />
produced on the shoulder belt and the rise ofdeceleration<br />
produced on the chest. On the other hand, an observation<br />
of the relative speed between the occupant's chest and<br />
the sled reveals that there is a difference of 4 to 5 km/h<br />
in relative speed due to variations in the time when the<br />
restra<strong>int</strong>s begin.<br />
It can be considered that a delay in initiating the seat<br />
J 1<br />
H+<br />
J l<br />
EI<br />
f l<br />
z<br />
o<br />
fi<br />
r<br />
SLIDE POSITION<br />
A."------*<br />
SECTION 5: TECHNICAL SESSIONS<br />
PASSENGER<br />
Figure 11. Seat slide position and head injury level.<br />
!<br />
235<br />
DULATION TIME +<br />
tmffi,<br />
Figure 12. Results of tests by seat $lide position.<br />
slide rearward position restra<strong>int</strong> results in a lowered Ride-<br />
Down Effect, and thus leads to an increase in chest deceleration<br />
and in injury level.<br />
INFLUENCE OF SEAT BACK ANGLE ON<br />
INJUHY LEVEL<br />
Figures 13 and 14 show changes in injury level, caused<br />
when the seat back angle was changed. The chest injury<br />
level rises slightly when the seat is inclined backward.<br />
As clearly seen in Figure 14, the head injury level<br />
increases remarkably when the seat is inclined backward.<br />
Figure 15 shows how deceleration acts on each part.<br />
The graph shows that a delay in chest restra<strong>int</strong> by the<br />
shoulder belt is caused in the same way as in the test<br />
conducted by changing the position of the seat slide.<br />
+<br />
SEAT BACK ANGLE<br />
Figure 13. Seat back angle and chest injury level.
UJ<br />
[J<br />
CE<br />
:)<br />
z,<br />
o<br />
LU<br />
I<br />
Hrc<br />
DRIVERPASSENGER<br />
M50 o t<br />
M95 A A<br />
SEAT BACK Affi<br />
34<br />
Figure 14. Seat back angle and head injury level.<br />
FEMUR LOAD ACCORDING TO SEAT<br />
POSITION<br />
Table 7 shows femur loads obtained in all the tests<br />
reported so far. As is clear in this table, even the heaviest<br />
femur loads are within 70 percent of the injury criteria<br />
provided in FMVSS 208, etc., and have no significant<br />
influence.<br />
The level of the femur load is determined by whether<br />
or not the knees have collided with the instrument panel<br />
or the steering shaft, or by the severity of the knee collision.<br />
kffi/h<br />
CHEST I<br />
MOVEMENT-<br />
SPEED (km/hl ./'<br />
EXPEHIMENTAL SAFEW VEHICLES<br />
, --CHEST DECELERATIQN ic)<br />
r (RESULTANT]<br />
Figure 15. Results of tests by seat back angle.<br />
Table 7. Femur load.<br />
E<br />
=<br />
o<br />
rf)<br />
P<br />
o<br />
r.cl<br />
E<br />
lo<br />
ct)<br />
E<br />
DRIVER PASSENGEB<br />
(nu) lt= c 5(<br />
l%<br />
'twot<br />
0<br />
5( tt%<br />
lao%<br />
B 2s<br />
, l,rJ<br />
EE rlrJ<br />
A 25'<br />
c 2s'<br />
B<br />
16' I +<br />
25<br />
34'<br />
A 25' I +<br />
B<br />
16'<br />
2X +<br />
34 +<br />
A 25" -t<br />
RELATIONSHIP BETWEEN SEAT BELT<br />
AND OCCUPANT INJURY LEVEL<br />
We have conducted an examination to frnd out the<br />
influence of the seat belt webbing elongation rate, when<br />
increased by 15 percent over the standard, on the behavior<br />
of the occupant.<br />
Table 8 shows the increased amount of movement of<br />
each body part of the dummy when the seat belt webbing<br />
elongation rate is increased. From this it is seen that an<br />
increase in the webbing elongation rate leads to an increase<br />
in the amount of chest and pelvis movement, which<br />
is directly restrained by the seat belt.<br />
Figure 16 shows the movement speeds of the sled and<br />
the dummy chest. It also shows the amount of tension<br />
acting on the shoulder belt. When the seat belt webbing<br />
elongation rate is increased, the chest movement speed is<br />
greatly delayed by 6 to 8 msec. Further, the seat belt<br />
gently raises the tension, and causes an 8 to l0 msec delay<br />
for the same tension and a 15 msec delav for the tension<br />
to reach a peak.<br />
Table L lncreased emount of movement of each part.<br />
PART DRIVER PASSENGER<br />
HEAD 1O7% 110%<br />
CHEST 120% 136%<br />
PELVIS 119% 123%
Kg km/h<br />
t- I<br />
800-<br />
600-<br />
400-<br />
200<br />
BELT TENSION (ks)<br />
Figure 16. Movement speeds of sled and chest,<br />
It follows from this that an increase in webbing elongation<br />
rate will somewhat ease the chest restra<strong>int</strong> and<br />
lower the injury level.<br />
Figure 17 shows the behavior of the head. It is when<br />
the chest is restrained by the seat belt that an increase in<br />
seat belt webbing elongation rate begins to cause a difference<br />
in the head behavior. The head's forward movement<br />
is increased by as much as the chest restra<strong>int</strong> is<br />
loosened.<br />
The head behavior in Figure 17 is sharply changed<br />
because the top of the head has collided with the upper<br />
side of the instrumental panel caused by an increased in<br />
forward movement. This phenomenon is very advantageous<br />
for decreasing the dummy injury level. It can be<br />
decreased by increasing the rate of the seat belt webbing<br />
elongation. For the head, however, this signifies that a<br />
secondary collision has occurred due to an increase in<br />
forward movement.<br />
The length of seat belt webbing left on the retractor<br />
spool may cause injury to the occupant, Suffrcient webbing<br />
is generally wound inside the seat belt retractor, so<br />
that the seat belt can be used in any seat position. Further,<br />
in order for the belt to restrain the dummv in a collision.<br />
Figure 17. Behavior ol head.<br />
15P; MORE ELONGATING<br />
SECTION 5: TECHNICAL SESSIONS<br />
237<br />
a device is installed for immediately locking the retractor<br />
mechanism when a collision occurs! that is, Emergency<br />
Locking Retractor.<br />
An examination of the movement of a tightly belted<br />
dummy in a collision was d<strong>one</strong>. It was found that approximately<br />
40 to 50 msec after the collision, the seat<br />
belt starts to re$train the dummy. In the meantime, the<br />
dummy moves forward approximately 100 mm.<br />
The cause for this is thought to be that the seat belt<br />
webbing in the retractor is spooled out. Therefore, we<br />
conducted tests on the amount of spooled out seat belt<br />
webbing in the three stage$ of 400 mm, 800 mm and 1,100<br />
mm. These are the lengths of webbing found on the retractors<br />
before the respective tests. Figure l8 shows the<br />
amount seat belt spooled out in the process of applying<br />
a 1,000 kg load.<br />
Another phenomenon in Fig. l8 is that when l0 percent<br />
of the tension acting on the seat belt is produced, the<br />
amount of spooled out webbing covers approximately 70<br />
percent of the maximum spooled out amount, and when<br />
20 percent of the tension is producedn the amount of<br />
spooled out webbing covers approximately 75 to 80 percent<br />
of the maximum spooled out amount.<br />
It follows from this that the amount of spooled out<br />
seat belt webbing will lead to a delay in the beginning of<br />
occupant restra<strong>int</strong>.<br />
SOOmm<br />
RETRACTED<br />
4OOmm<br />
RETRACTED<br />
0 1OO 2OO 50O *,----+ 10OO<br />
BELT TENSION (kg)<br />
Figure 18. Amount of spooled out seat belt webbing'<br />
,f<br />
;i<br />
ri<br />
;:i<br />
'ri<br />
,r<br />
":.<br />
i:r{<br />
,/i:l<br />
#<br />
r'<br />
' .li<br />
'd<br />
,{<br />
{<br />
Ti.;1 l<br />
'fl<br />
:s<br />
i,$
CONCLUSIONS<br />
As a result of this study, it is found that the occupant<br />
injury level varies largely according to occupant body<br />
size, seating posture, and the seat b€lt. That is,<br />
(1) The larger the occupant body size, the less the injury<br />
level. Especially with the head injury level, it is found<br />
that when the occupant size is small, the head turning<br />
radius becomes small. Thus, the injury level is increased<br />
after completion of the chest movement, because the distance<br />
between the seat belt restra<strong>int</strong> po<strong>int</strong> on the occupant<br />
and the head's center of gravity is short.<br />
(2) The beginning of the chest restra<strong>int</strong> is delayed as<br />
the seat slide is moved rearward. Due to this lapse in<br />
time, the Ride-Down Effect is lowered, and thereby the<br />
injury level is increased.<br />
(3) As the seat is inclined backward, the beginning of<br />
restra<strong>int</strong> is delayed as in the case ofthe seat slide position.<br />
(4) When the $eat belt webbing elongation rate is increased,<br />
the chest restra<strong>int</strong> is reduced and the injury level<br />
is lowered. However, the head forward movement is increased,<br />
and thus the danger of a secondary collision<br />
against the instrument panel, etc. is increased.<br />
(5) Furthermore, it is certain that the spooled out webbing<br />
length from the seat belt retractor, even under a<br />
load equivalent to 100 kg, amounts to approximately 70<br />
percent of the overall spooled out amount, thus leading<br />
to a delay in the beginning of restra<strong>int</strong>.<br />
It is important to conduct evaluations under various<br />
conditions on the occupant restra<strong>int</strong> system used in the<br />
market. There are many subjects still to be examined;<br />
some of them are menti<strong>one</strong>d below;<br />
(l) A quick restra<strong>int</strong> of the occupant by the eeat belt<br />
immediately after a collision is effective in the sense of<br />
reducing the injury level. On the highway, people of various<br />
physical siees are driving in various positions; thus,<br />
to cope with this, the seat belt should be improved in its<br />
fitting performance, taking its comfort and convenience<br />
<strong>int</strong>o consideration.<br />
EXPERIMENTAL SAFETY VEHICLES<br />
238<br />
(2) For evaluation of the occupant protection performance<br />
according to size, the performances and speciflrcations<br />
of dummies should be realistic. This is a subject of<br />
development necessary to solve the present problems.<br />
There are some differences even in measurement data<br />
obtained by tests carried out in the same conditions. We<br />
would like to pursue our study for the development of a<br />
better occupant protection system.<br />
(3) All of the tests were conducted using weight-drop<br />
sleds, in order to evaluate occupant protection systems<br />
in collisions. In actual collisions, however, complicated<br />
secondary collisions and various vehicle behaviors will<br />
come <strong>int</strong>o play. For this reason, we should continue to<br />
analyze various factors affecting the comparison between<br />
weight-drop type sled and actual vehicle tests.<br />
REFERENCES<br />
l. Heinrich Hontshik, Egbert Milller and Gert Riiter,<br />
"Necessities<br />
and Possibilities of Improving the Protective<br />
Effect of Three-Po<strong>int</strong> Seat Belts," SAE Paper<br />
770933.<br />
2. Murray Dance and Bert Eneerik, "Safety Performance<br />
Evaluation of Seat Belt Retractors," SAE Paper<br />
790680.<br />
3. Roger P. Daniel, Kenneth R. Trosien and Burgess O.<br />
Young, "The Impact Behavior of Hybrid II Dummy,"<br />
SAE Paper 751145.<br />
4. L. M. Patrick, N. Bohlin and A. Anderson, '*Three-<br />
Po<strong>int</strong> Harness Accident and Laboratory Data Comparison,"<br />
SAE Paper 741181.<br />
5. David C. Herbert, John D. Scott and Christopher W.<br />
Corben, "Head Space Requirements for Seat Belt<br />
Wearers," SAE Paper 751164.<br />
6. Riidiger Weissner, "A Comparison of Advanced Belt<br />
Systems Regarding Their Effectivene$s," SAE Paper<br />
780414.