2010 Salary Recommendation - Arizona Human Resources
2010 Salary Recommendation - Arizona Human Resources
2010 Salary Recommendation - Arizona Human Resources

You also want an ePaper? Increase the reach of your titles
YUMPU automatically turns print PDFs into web optimized ePapers that Google loves.
JANICE K. BREWERGovernorSeptember <strong>2010</strong>ARIZONA DEPARTMENT OF ADMINISTRATIONOFFICE OF THE DIRECTOR100 North Fifteenth Avenue, Suite 401Phoenix, <strong>Arizona</strong> 85007(602) 542-1500DAVID RABERInterim DirectorThe Honorable Janice K. BrewerGovernor, State of <strong>Arizona</strong>The Honorable Robert BurnsPresident, <strong>Arizona</strong> State SenateThe Honorable Kirk AdamsSpeaker, <strong>Arizona</strong> House of Representatives1700 West WashingtonPhoenix, <strong>Arizona</strong> 85007Dear Governor Brewer, President Burns and Speaker Adams:Pursuant to <strong>Arizona</strong> Revised Statutes section 41-763.01, the <strong>2010</strong> Advisory <strong>Recommendation</strong> isintended to provide information concerning the compensation of state employees and an objectiveassessment of the job market.<strong>Salary</strong> increases provided in 2006 and 2007 significantly reduced the gap between our stateemployee salaries and the market. The state had previously been almost 22% behind the market; adiscrepancy that was significantly affecting agencies’ ability to attract and retain quality talent. Afterthe increase in 2007, that gap had been closed to almost 7%, and the state was close to achievingthe previously established goal to be within 5% of the market.Unfortunately, the economy at both the national and local levels suffered severe setbacks. In 2008 ahiring freeze was implemented and agency budgets were reduced along with other measuresnecessary to balance the state’s budget. These conditions precluded providing salary increases in2008 and 2009. Subsequently the state lost ground to the prevailing job market and salaries arecurrently estimated to be on average 13.6% behind the market. The negative impact on employeesalaries will be further exacerbated in FY2011 with the elimination of the performance pay program(2.75%) and the introduction of six furlough days each of the next two fiscal years. Comparing thesenegative pressures on employee salaries with the projected increases to the market, it is expectedthat state salaries will lose further ground compared with the market.Nevertheless, given the realities of the state’s current budget situation and considering the health ofthe economy and the estimated movement of employee salaries in the market, the Department isrecommending to defer any salary increases until budget conditions improve. As soon as it is fiscallypossible, addressing issues of state employee compensation should be a priority and the goal ofbringing salaries within 5% of the market should be addressed.We hope that the Annual Advisory <strong>Recommendation</strong> will provide the information you need whenmaking decisions regarding <strong>Arizona</strong> state government and its employees’ compensation.Sincerely,David RaberInterim Director
<strong>2010</strong> Advisory <strong>Recommendation</strong> on State Employee SalariesEvery September, the <strong>Arizona</strong> Department of Administration (ADOA) provides an Advisory<strong>Recommendation</strong> to the Governor and the Legislature pursuant to A.R.S. §41-763.01. Thisdocument provides an analysis of the state’s current compensation levels compared to otherpublic and private sector employers, and a review of the critical factors that must be consideredwhen reviewing compensation strategies. These factors include turnover rates, retirementprojections, economic forecasts, and projected market movement. The report concludes with arecommendation to the salary plan for employees in state service.This report reflects the current status of <strong>Arizona</strong> state employee compensation asit relates to market conditions at the end of Fiscal Year <strong>2010</strong>. The guidelinescontained herein are provided as a resource to guide statewide budgetconsiderations during the preparation of the Fiscal Year 2012 budget.HISTORY OF COMPENSATIONOver the past several years, the state has implemented a number of different strategies toadjust employee salaries. These strategies included general salary adjustments, meritadjustments, special market adjustments, and other miscellaneous adjustments specificallytargeted by the legislature. However, there have also been years where no salary adjustmentswere funded.In 2005, the Department of Administration recommended a 5-year plan to bring employeesalaries to within 5% of the prevailing job market. The plan developed in 2005 was used toguide the development of the FY 2007 budget, a budget that included an appropriation of a flatdollar amount ($1,650) to increase employee’s base salary, and the introduction of a paypractice for <strong>Arizona</strong> state government employees called “performance pay”. Performance pay isavailable to state employees if the governmental unit meets or exceeds prescribed performancemeasures. If the measures were not met, the employees in that unit are not entitled to receiveperformance pay.In 2006 the Department of Administration recommended continuation of the original 5-year plan.The FY 2008 budget included an appropriation that provided for a 3.0% increase to basesalaries, and an increase in the funding authorized for performance pay, bringing the totalamount of performance pay available up to 2.75%.In 2007 the state was experiencing the beginning of a budget crisis. The Department ofAdministration did not recommend a specific amount for salary increases due to the uncertaintyof the budget situation in September 2007. The FY 2009 budget did not provide for any salaryincreases.In 2008 and 2009 the state was deep in the throes of the worst budget crisis in recent history.The Department of Administration did not recommend salary increases due to the uncertainty ofthe budget situation in September 2008 and 2009. The FY <strong>2010</strong> budget did not provide for anysalary increases, and the FY2011 budget included the elimination of the performance payprogram (2.75%) and the introduction of six furlough days each of the next two fiscal years.2
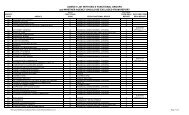
<strong>Recommendation</strong>Year(Calendar Year)Figure 1History of the State’s Compensation AdjustmentsBudgetYear(Fiscal Year)AverageCovered<strong>Salary</strong>General <strong>Salary</strong>AdjustmentsMerit orPerformanceAllocations forSelected Classes1996 1998 $26,874 2.5% 2.5% Merit Yes1997 1999 $28,249 -0- 2.5% Merit Yes1998 2000 $29,208 -0- 2% Merit Yes1999 2001 $29,725 -0- 2% Merit Yes2000 2002 $30,331 $1,4502001 2003 $31,824 -0-2002 2004 $31,859 -0-2003 2005 $32,059 $1,000 Yes2004 2006 $32,897 1.7% Yes2005 2007 $36,195 $1,650 2.5% Perf Pay Yes2006 2008 $38,023 3.0% 0.25% Perf Pay Yes2007 2009 $38,097 -0-2008 <strong>2010</strong> $38,478 -0-2009 2011 $37,684 -0-2.75% Perf PayEliminatedSource: Joint Legislative Budget Committee FY2008 Appropriations Report. Merit Adjustment figures represent the percentage allocated toan agency's personnel services base. Allocations for Selected Classes are provided to address specific job classes or specific agencyneeds addressed by legislation. Average Covered <strong>Salary</strong> data are based on regular covered employees in agencies within the ADOAPersonnel System calculated as of the end of July; figures for FY 2007, 2008, 2009, and <strong>2010</strong> have been adjusted to account forperformance pay. Average salary for FY 2011 does not include performance pay.CURRENT STATE OF COMPENSATIONThe job market is a constantly moving target, and state salaries must continually be analyzed toassess the competitive position of the state with respect to the market. The most recent analysisof market competitiveness suggests the market exceeds state salaries by an estimated 13.6%.Figure 2 below illustrates the relative difference between state salaries and the market.0%Figure 2 – Percent Needed to Get to Market-5%2005 Goal = within 5% of market-7.1%-10%-11.5%-9.5% -9.5%-15%-17.5%-13.2%-14.0%-16.4%-16.3%-14.9%-13.6%-20%-22.5%-20.4%-21.7%-25% -25.7%-30%1997 1998 1999 2000 2001 2002 2003 2004 2005 2006 2007 2008 2009 <strong>2010</strong> 2011Source: Percent Needed to Get to Market is based on a suite of compensation surveys, includingthe <strong>Arizona</strong> Compensation Survey (previously referred to as the Joint Governmental <strong>Salary</strong> Survey).Average State Employee Salaries are based on employees in the ADOA Personnel Systemcalculated as of the beginning of the fiscal year (July 1).3
FUTURE CONSIDERATIONSThere are a number of factors that must be considered in developing a strategy to ensure statesalaries become competitive, including predictions of future market movement.Market MovementWhen reviewing information from compensation consulting firms, employers are asked topredict or project the increases that will occur in the future. Several surveys were analyzed toestimate market movement in the coming year (Figure 3). It is worth noting that in 2007 and2008, salary increases were typically in the range of 3-4%. <strong>Salary</strong> increases in 2009 were closerto 2%. While organizations nationally and regionally estimate increases averaging 2.5% in<strong>2010</strong>, of particular importance to this report, the estimated increase for public sectororganizations in <strong>2010</strong> in <strong>Arizona</strong> is 0%.Figure 3 – Actual and Projected <strong>Salary</strong> IncreasesReference2008ActualIncrease2009ActualIncrease<strong>2010</strong>EstimatedIncrease2011ProjectedIncreaseNational - Hay 1.9% 2.6% 2.9%National - WorldatWork 3.9% 2.2% 2.5% 2.9%Local (Phoenix) - WorldatWork N/A 1.8% 2.5% 2.9%Local (Public & Private)AZ Compensation SurveyN/A 1.9% 1.5% 2.2%Local (Public Sector Only)AZ Compensation SurveyN/A 1.1% 0.0% 0.4%State of <strong>Arizona</strong> 0% 0% -2.75% TBDSource: National data from Hay and WorldatWork websites; <strong>Arizona</strong> data from <strong>2010</strong> <strong>Arizona</strong> Compensation Survey; FY2011estimates for State of <strong>Arizona</strong> include the reduction of Performance Pay and the impact of 6 unpaid furlough days.TurnoverThe separation rate of covered employees remained essentially unchanged from 2009 (Figure4), and appears to indicate a general downward trend over the past 5 years. This figure makesan interesting supplement to Figure 2 on page 3, which shows the trend of state salariescompared to the market. When state salaries were furthest off the market (2005-2007), theturnover rates were the highest. When state salaries were closest to the market (2008), theturnover rate was the lowest it has been in recent years. It remains to be seen if state salariescontinue to fall significantly below the prevailing market, whether turnover rates will increase.Figure 4 – Separation Rates of Covered Employees22%21%20%21.2%AZ TurnoverState & LocalAll Govt19%18%17%17.9%17.3%16%15%15.4%14.9%14.8%15.6% 15.5%14%13%12.7%12%2002 2003 2004 2005 2006 2007 2008 2009 <strong>2010</strong>Source: <strong>2010</strong> State of <strong>Arizona</strong> Workforce Report. Separations are defined as covered employees leavingstate service during the fiscal year (July 1 to June 30). Comparative data from the national Bureau ofLabor Statistics, U.S. Department of Labor, seasonally adjusted turnover rates. State and local includesState and local government entities in the 50 States and the District of Columbia. All Government includesFederal, State, and local government entities in the 50 States and the District of Columbia.4
There is still debate about whether the economy remains in a period of recession, or if therecovery has started. What is clearer, however, is the likely impact of economic conditions onthe mobility of the workforce. A recent study 1 reports that 37% of employees reported feelingthey are not being fairly compensated for assuming a greater workload during the recession.The same study goes on to reveal that 4 out of 10 professionals polled said they are moreinclined to look for new opportunities outside their firms as a result of the recession.Many employers are anticipating an increased need to attract and retain talent in the nearfuture. Despite efforts to engage employees during the past year, organizations have growingconcerns about whether their valued employees will stay once the economy recovers. Nearlytwo-thirds of companies believe that voluntary turnover will increase as the economy and jobmarket continue to improve. 2Size of the WorkforceOf particular interest in <strong>2010</strong> was the second year of dramatic and significant reductions in thesize of the government’s workforce. The number of filled positions in the ADOA PersonnelSystem decreased by 7.2%, to the lowest levels in the past decade (Figure 5). The overallreduction in the workforce since 2007 was a reduction of over 6,400 positions or 17.4%. As aresult of budgetary constraints, in addition to implementing a statewide hiring freeze, manyagencies were required to implement layoffs and reductions in force. Thus, although totalturnover may have remained essentially unchanged from 2009, the overall size of the workforcehas been significantly reduced.Figure 5 – Employee Headcount – ADOA Personnel System40,00038,488 38,50638,00036,00037,29337,30636,67436,44235,847 36,03034,00033,23632,00030,83230,0002001 2002 2003 2004 2005 2006 2007 2008 2009 <strong>2010</strong>Source: <strong>2010</strong> State of <strong>Arizona</strong> Workforce Report. Includes covered and uncovered employees inthe ADOA Personnel System, excluding limited, seasonal, and part-time of less than 0.25 FTE.1 Workplace Redefined – Shifting Generational Attitudes During Economic Change. Robert Half. <strong>2010</strong>2 Global Attraction and Retention Survey, Mercer, <strong>2010</strong>5
Retirement RatesOne of the critical issues facing the state is the ability to retain a skilled and effective workforce.This may be especially poignant with the well-documented trend of increasing retirements andthe subsequent loss of institutional knowledge (Figure 6).Figure 6 – Percent of Separations Due to Retirement25%20%15%10%5%5.3% 5.9% 10.9%9.4%11.7% 12.2% 13.9% 14.2% 22.0%10.2%0%2001 2002 2003 2004 2005 2006 2007 2008 2009 <strong>2010</strong>Source: <strong>2010</strong> State of <strong>Arizona</strong> Workforce Report. Includes covered and uncovered employeesin the ADOA Personnel System separating from state service during the fiscal year.Current estimates suggest that over 93% of the larger state agencies are expected to have over25% of their active workforce eligible to retire in the next five years (<strong>2010</strong> ADOA <strong>Human</strong><strong>Resources</strong> System Annual Report), including six agencies that are anticipated to have over 40%of their workforce eligible to retire in five years. The data further emphasizes the need for theState to be prepared to attract and retain an effective workforce in the near future.Economic ForcesA key factor that must be taken into consideration when developing a compensation strategy toaddress employee salaries is the health of the economy. In June <strong>2010</strong>, the <strong>Arizona</strong>unemployment rate remained unchanged from the month before at 9.6% and virtually identicalto the national rate of 9.5%. 3 However, even though analysts are beginning to grow slightlymore optimistic about the employment conditions for the nation and the Western states, jobgrowth continues to be negative every month. Analysts have justified their optimism bydescribing current conditions as “worsening more slowly”. Nevertheless, the consensus amongeconomists is that <strong>2010</strong> will be another year of job losses for the nation and for <strong>Arizona</strong> 4 .3 <strong>Arizona</strong> Workforce Employment Report, July 15, <strong>2010</strong>.4 Economy, W.P.Carey School of Business. ASU. June 1, <strong>2010</strong>.6
CONCLUSIONThe state made significant progress towards improving the position of state employee salariesrelative to the market during FY 2007 and FY 2008. The Executive and Legislative branchessent a clear message to state employees that salary issues were important, and the gapbetween state employee salaries and the market was reduced to the lowest level in nearly twodecades. Unfortunately, due to the economic challenges at the national and local levels, thestate did not allocate funding for salary increases in FY 2009 or FY<strong>2010</strong>. The impact onemployee salaries will be increased in FY2011 with the elimination of the performance payprogram (2.75%) and the introduction of six furlough days each of the next two fiscal years.Comparing these negative pressures on employee salaries with the projected increases to themarket, it is expected that state salaries will lose further ground compared with the market.RECOMMENDATIONAs soon as it is fiscally possible, addressing issues of state employee compensation should bea priority and the goal of bringing salaries within 5% of the market should be addressed.However, the Department of Administration understands and appreciates the realities of thecurrent economic situation of the state’s budget. When taken into consideration along with thehealth of the economy, both at a national and regional level, and considering the estimatedmovement of employee salaries in the market, the Department is recommending to defer anysalary increases until budget conditions improve.7