2013-dot-sustainable-streets-lowres
2013-dot-sustainable-streets-lowres 2013-dot-sustainable-streets-lowres
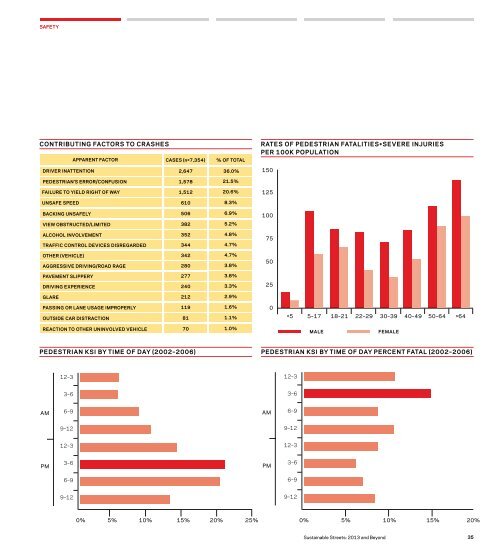
SAFETYCONTRIBUTING FACTORS TO CRASHESAPPARENT FACTOR CASES (n=7,354) % OF TOTALRATES OF PEDESTRIAN FATALITIES+SEVERE INJURIESPER 100K POPULATIONDRIVER INATTENTION2,647 36.0%150PEDESTRIAN’S ERROR/CONFUSION1,57821.5%FAILURE TO YIELD RIGHT OF WAY1,51220.6%125UNSAFE SPEED6108.3%BACKING UNSAFELY5066.9%100VIEW OBSTRUCTED/LIMITED3825.2%ALCOHOL INVOLVEMENTTRAFFIC CONTROL DEVICES DISREGARDED3523444.8%4.7%75OTHER (VEHICLE)AGGRESSIVE DRIVING/ROAD RAGE3422804.7%3.8%50PAVEMENT SLIPPERY2773.8%DRIVING EXPERIENCE2403.3%25GLARE2122.9%PASSING OR LANE USAGE IMPROPERLYOUTSIDE CAR DISTRACTION119811.6%1.1%064REACTION TO OTHER UNINVOLVED VEHICLE701.0%MALEFEMALEPEDESTRIAN KSI BY TIME OF DAY (2002–2006)PEDESTRIAN KSI BY TIME OF DAY PERCENT FATAL (2002–2006)12–312–33–63–6AM6–9AM6–99–129–1212–312–3PM3–6PM3–66–96–99–129–120% 5% 10% 15% 20% 25%0% 5% 10% 15% 20%Sustainable Streets: 2013 and Beyond35
SAFETY36
- Page 1 and 2: Sustainable Streets:2013 and Beyond
- Page 3 and 4: CONTENTS4 Letter from the Mayor5 Co
- Page 5 and 6: Letter from the MayorDear Friends:T
- Page 8: Introduction44acres red paintedbus
- Page 11 and 12: 10Safety
- Page 13 and 14: SAFETYSustainable Streets set the g
- Page 15 and 16: SAFETYchildren and the elderly. On
- Page 17 and 18: SAFETY16
- Page 19 and 20: SAFETYAt locations where major engi
- Page 21 and 22: SAFETY14%decrease in crashesafter S
- Page 23 and 24: SAFETY21%decrease in crashesafter D
- Page 25 and 26: SAFETY84%decrease in pedestrianinju
- Page 27 and 28: SAFETY“Interventions to make the
- Page 29 and 30: SAFETY73%decrease in risk ofserious
- Page 31 and 32: SAFETY36%decline in frequencyof inj
- Page 33 and 34: SAFETY32
- Page 35: SAFETYData and design analysis have
- Page 39 and 40: SAFETY38
- Page 41 and 42: SAFETYSCHOOL SPEED ZONESTo compleme
- Page 43 and 44: SAFETYAs the number of red light ca
- Page 45 and 46: SAFETYDOT staff visited 4,000 busin
- Page 47 and 48: SAFETY46
- Page 49 and 50: SAFETY41%decrease in crashes atHarl
- Page 51 and 52: SAFETYFOURTH AVENUE, BROOKLYNReside
- Page 53 and 54: SAFETYOne quarter of New Yorkers su
- Page 55 and 56: SAFETYCurbside Haikus generated a b
- Page 57 and 58: SAFETYThe DOT’s 5 Safety City fac
- Page 60 and 61: SAFETYLooking AheadNew York City mu
- Page 62 and 63: MOBILITYIntroduction44acres of pain
- Page 64 and 65: MOBILITYMOBILITYSustainable Streets
- Page 66 and 67: MOBILITYChapter 5Better Bus Service
- Page 68 and 69: MOBILITYMOBILITYSustainable Streets
- Page 70 and 71: MOBILITY10%increased ridershipon th
- Page 72 and 73: MOBILITYAdditional Bus Priority Pro
- Page 74 and 75: MOBILITYSustainable Streets: 2013 a
- Page 76 and 77: MOBILITYNYCDOT identified dozens of
- Page 78 and 79: MOBILITYREGULATING INTERCITY BUSEST
- Page 80 and 81: MOBILITYChapter 6A City of Rivers a
- Page 82 and 83: MOBILITYSTATEN ISLAND FERRYEAST RIV
- Page 84 and 85: MOBILITYChapter 7Streets for All:Im
SAFETYCONTRIBUTING FACTORS TO CRASHESAPPARENT FACTOR CASES (n=7,354) % OF TOTALRATES OF PEDESTRIAN FATALITIES+SEVERE INJURIESPER 100K POPULATIONDRIVER INATTENTION2,647 36.0%150PEDESTRIAN’S ERROR/CONFUSION1,57821.5%FAILURE TO YIELD RIGHT OF WAY1,51220.6%125UNSAFE SPEED6108.3%BACKING UNSAFELY5066.9%100VIEW OBSTRUCTED/LIMITED3825.2%ALCOHOL INVOLVEMENTTRAFFIC CONTROL DEVICES DISREGARDED3523444.8%4.7%75OTHER (VEHICLE)AGGRESSIVE DRIVING/ROAD RAGE3422804.7%3.8%50PAVEMENT SLIPPERY2773.8%DRIVING EXPERIENCE2403.3%25GLARE2122.9%PASSING OR LANE USAGE IMPROPERLYOUTSIDE CAR DISTRACTION119811.6%1.1%064REACTION TO OTHER UNINVOLVED VEHICLE701.0%MALEFEMALEPEDESTRIAN KSI BY TIME OF DAY (2002–2006)PEDESTRIAN KSI BY TIME OF DAY PERCENT FATAL (2002–2006)12–312–33–63–6AM6–9AM6–99–129–1212–312–3PM3–6PM3–66–96–99–129–120% 5% 10% 15% 20% 25%0% 5% 10% 15% 20%Sustainable Streets: <strong>2013</strong> and Beyond35


