2013-dot-sustainable-streets-lowres
2013-dot-sustainable-streets-lowres 2013-dot-sustainable-streets-lowres
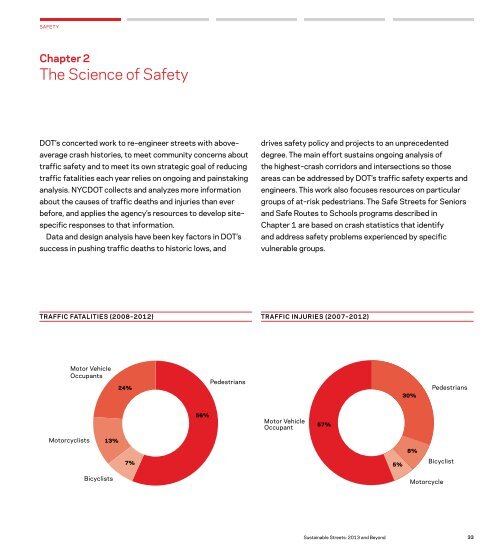
SAFETYChapter 2The Science of SafetyDOT’s concerted work to re–engineer streets with above–average crash histories, to meet community concerns abouttraffic safety and to meet its own strategic goal of reducingtraffic fatalities each year relies on ongoing and painstakinganalysis. NYCDOT collects and analyzes more informationabout the causes of traffic deaths and injuries than everbefore, and applies the agency’s resources to develop site–specific responses to that information.Data and design analysis have been key factors in DOT’ssuccess in pushing traffic deaths to historic lows, anddrives safety policy and projects to an unprecedenteddegree. The main effort sustains ongoing analysis ofthe highest–crash corridors and intersections so thoseareas can be addressed by DOT’s traffic safety experts andengineers. This work also focuses resources on particulargroups of at–risk pedestrians. The Safe Streets for Seniorsand Safe Routes to Schools programs described inChapter 1 are based on crash statistics that identifyand address safety problems experienced by specificvulnerable groups.TRAFFIC FATALITIES (2008–2012) TRAFFIC INJURIES (2007–2012)Motor VehicleOccupants24%Pedestrians30%Pedestrians56%Motor VehicleOccupant57%Motorcyclists13%8%7%5%BicyclistBicyclistsMotorcycleSustainable Streets: 2013 and Beyond33
SAFETYData and design analysis have beenkey factors in DOT’s success in pushingtraffic deaths to historic lowsA NEW ANALYTIC FOUNDATIONMOTOR VEHICLE OCCUPANT FATALITIES BYCAUSE AND LOCATION, 2012NYCDOT established a new basis for safety analysis with its seminal2010 Pedestrian Safety Study & Action Plan. NYCDOT researchersexamined dozens of factors and a wide variety of datasets from over7,000 severe and fatal pedestrian crashes in New York City during2002–2006 that could be associated with each pedestrian injuryand with the number of injuries in given geographic areas. Variableswith significant levels of correlation with pedestrian crashes wereidentified, then used to build a carefully designed statistical model.Experts from NY University, Rensselaer Polytechnic Institute andSUNY Buffalo supported the effort.The state–of–the–art data statistical modeling techniques usedattempted to control for pedestrian exposure to crashes, using factorslike population, vehicle registrations, presence of traffic signals(generally located at higher–volume intersections) and transit usage.The study used two distinct approaches to modeling: crash frequencyanalysis and crash severity analysis. Crash frequency analysis aims todetermine the causes of a high frequency crash location, while crashseverity analysis aims to determine why some crashes resulted in asevere injury, while others resulted in a fatality.The vast size and diversity of New York City’s street network andneighborhoods presented a robust opportunity for this advancedanalysis, as crash rates could be compared across neighborhoodsthat differ by a wide variety of characteristics but contain very similargeometric dimensions and engineering treatments.The Action Plan accompanying the pedestrian safety studysummarized its findings, some of which are shown here. The analysiscontinues to inform DOT’s annual set of street improvement projects.Highway–Other CausesLocal StreetsOther CausesHighway–Speeding11%18%26%PEDESTRIAN ACTION AT TIME OF CRASHCROSSING WITH SIGNALCROSSING, NO SIGNAL OR SIDEWALKCROSSING AGAINST SIGNALOTHER ACTIONS IN ROADWAYEMERGED FROM BEHIND PARKED VEHICLECROSSING, NO SIGNAL, MARKED CROSSWALKNOT IN ROADWAYPLAYING IN ROADWAYGETTING ON/OFF VEHICLEWORKING IN ROADWAY45%Local Streets–SpeedingPEDESTRIAN ACTION SEVERE FATAL TOTAL %TOTAL1,589 123 1,712 26.9%1,3381,155399401327204888366168146833837303151,5061,301 20.4%482 7.6%43936423491847123.6%6.9%5.7%3.7%1.4%1.3%1.1%ALONG HIGHWAY WITH TRAFFIC416470.7%ALONG HIGHWAY AGAINST TRAFFIC245290.5%CHILD GETTING ON/OFF SCHOOL BUS8190.1%34Chapter 2: The Science of Safety
- Page 1 and 2: Sustainable Streets:2013 and Beyond
- Page 3 and 4: CONTENTS4 Letter from the Mayor5 Co
- Page 5 and 6: Letter from the MayorDear Friends:T
- Page 8: Introduction44acres red paintedbus
- Page 11 and 12: 10Safety
- Page 13 and 14: SAFETYSustainable Streets set the g
- Page 15 and 16: SAFETYchildren and the elderly. On
- Page 17 and 18: SAFETY16
- Page 19 and 20: SAFETYAt locations where major engi
- Page 21 and 22: SAFETY14%decrease in crashesafter S
- Page 23 and 24: SAFETY21%decrease in crashesafter D
- Page 25 and 26: SAFETY84%decrease in pedestrianinju
- Page 27 and 28: SAFETY“Interventions to make the
- Page 29 and 30: SAFETY73%decrease in risk ofserious
- Page 31 and 32: SAFETY36%decline in frequencyof inj
- Page 33: SAFETY32
- Page 37 and 38: SAFETY36
- Page 39 and 40: SAFETY38
- Page 41 and 42: SAFETYSCHOOL SPEED ZONESTo compleme
- Page 43 and 44: SAFETYAs the number of red light ca
- Page 45 and 46: SAFETYDOT staff visited 4,000 busin
- Page 47 and 48: SAFETY46
- Page 49 and 50: SAFETY41%decrease in crashes atHarl
- Page 51 and 52: SAFETYFOURTH AVENUE, BROOKLYNReside
- Page 53 and 54: SAFETYOne quarter of New Yorkers su
- Page 55 and 56: SAFETYCurbside Haikus generated a b
- Page 57 and 58: SAFETYThe DOT’s 5 Safety City fac
- Page 60 and 61: SAFETYLooking AheadNew York City mu
- Page 62 and 63: MOBILITYIntroduction44acres of pain
- Page 64 and 65: MOBILITYMOBILITYSustainable Streets
- Page 66 and 67: MOBILITYChapter 5Better Bus Service
- Page 68 and 69: MOBILITYMOBILITYSustainable Streets
- Page 70 and 71: MOBILITY10%increased ridershipon th
- Page 72 and 73: MOBILITYAdditional Bus Priority Pro
- Page 74 and 75: MOBILITYSustainable Streets: 2013 a
- Page 76 and 77: MOBILITYNYCDOT identified dozens of
- Page 78 and 79: MOBILITYREGULATING INTERCITY BUSEST
- Page 80 and 81: MOBILITYChapter 6A City of Rivers a
- Page 82 and 83: MOBILITYSTATEN ISLAND FERRYEAST RIV
SAFETYChapter 2The Science of SafetyDOT’s concerted work to re–engineer <strong>streets</strong> with above–average crash histories, to meet community concerns abouttraffic safety and to meet its own strategic goal of reducingtraffic fatalities each year relies on ongoing and painstakinganalysis. NYCDOT collects and analyzes more informationabout the causes of traffic deaths and injuries than everbefore, and applies the agency’s resources to develop site–specific responses to that information.Data and design analysis have been key factors in DOT’ssuccess in pushing traffic deaths to historic lows, anddrives safety policy and projects to an unprecedenteddegree. The main effort sustains ongoing analysis ofthe highest–crash corridors and intersections so thoseareas can be addressed by DOT’s traffic safety experts andengineers. This work also focuses resources on particulargroups of at–risk pedestrians. The Safe Streets for Seniorsand Safe Routes to Schools programs described inChapter 1 are based on crash statistics that identifyand address safety problems experienced by specificvulnerable groups.TRAFFIC FATALITIES (2008–2012) TRAFFIC INJURIES (2007–2012)Motor VehicleOccupants24%Pedestrians30%Pedestrians56%Motor VehicleOccupant57%Motorcyclists13%8%7%5%BicyclistBicyclistsMotorcycleSustainable Streets: <strong>2013</strong> and Beyond33


