Seismic Network Data From Quetta, Pakistan, The Chaman Fault ...
Seismic Network Data From Quetta, Pakistan, The Chaman Fault ...
Seismic Network Data From Quetta, Pakistan, The Chaman Fault ...

Create successful ePaper yourself
Turn your PDF publications into a flip-book with our unique Google optimized e-Paper software.
lo6)J. ARMBRUSTER, L. SEEBER, R. QUITTMEYER & A. FARAHAbstract: Preliminary results from a telemetered seismic network in the <strong>Quetta</strong> area indicate seismicactivity along the <strong>Quetta</strong> fault that ruptured during the 30 May 1935 earthquake (M = 7.5) and alongthe Chman fault. However, the seismicity is concentrated in sections of these faults contiguous to, butnot included in, the latest major rupture of each fault.<strong>The</strong> epicenter and the surface effects of the 1935 <strong>Quetta</strong> earthquake suggest that the associatedrupture propagated northward from Kalat to <strong>Quetta</strong> where it was clearly associated with the Chhn fault.A number of well-located, shallow (0-15 lun deep) hypocenters fall within the section of this fault-zonejust north of <strong>Quetta</strong>. A composite fault-plane solution indicates left-lateral strike slip for the <strong>Quetta</strong> fault.<strong>The</strong> last known large rupture on the <strong>Chaman</strong> fault occurred on 20 December 1892 and it is recognizedfrom abut latitude 30.3" northward. No instrumental or felt earthquakes are reported for the sectionoi the Chnman fault south of this latitude until 1975. Since then, the record of the <strong>Chaman</strong> fault consistsof 3 of the 4 teleseismic epicenters (3 October 1975, M_ 6.7 and hl 6.4; 16 May 1978, M_ 5.9) and mostof the epicenters from the network data (June to ~ovknber 1978) in a 2' square centeredit <strong>Quetta</strong>. Thisincrease in seismicity in the southern portion of the Charnan fault warrants careful consideration as apremonitory signal.<strong>The</strong> <strong>Chaman</strong> fault-zone south of the 1892 break is a series of subparallel left-lateral strikeslip faultswhich include the <strong>Quetta</strong> fault. <strong>Seismic</strong>ity in this section is high, but it does not include any majorevent (M > 7.5). A comparison between this section of the <strong>Chaman</strong> fault system and the San Andreasfault system south of the big bend is suggested.INTRODUCTION<strong>The</strong> city of <strong>Quetta</strong> is strategically located at theapex of the Sibi re-entrant that divides the north-southtrending Kirthar-Brahui ranges from the Loralai(<strong>Quetta</strong>) transverse ranges (Figures 1 and 4). <strong>The</strong><strong>Chaman</strong> fault is the most obvious surface expression ofthe continent-continent boundary of the Indian plateand the Afghanistan block of the Eurasian plate. Thisfault strikes NNE, through the town of <strong>Chaman</strong>, 70 kmWNW of <strong>Quetta</strong>. In the Spring of 1978 a network offive telemetered seismic stations was established in the<strong>Quetta</strong> area for the study of tectonics and earthquakeprediction in a cooperative effort between the Lamont-Doherty Geological Observatory, New York, and theGeological Survey of <strong>Pakistan</strong>, Ql ietta. Because thesystem response of these seismic stations has very highdisplacement gains ( + at the high frequenciestypical of local earthquakes, numms small-magnitudeearthquakes can be recorded and studied. <strong>The</strong> signalsfrom these five stations are continuously transmittedto the offices of the Geological Survey of <strong>Pakistan</strong> in<strong>Quetta</strong> where they are recorded on a common timebase.__IILamont-Doherty, Geological Observatory Contribution No. 2804.<strong>The</strong> hypocenter and first-motion data from 62local earthquakes obtained from the <strong>Quetta</strong> seismic networkin a two month period in 1978 are here interpretedtogether with teleseismic and geologic data in afirst attempt to decipher the pattern of ongoing activityin the tectonically complex <strong>Quetta</strong> region.~ ~ O N SEWING I CAccording to the heory of plate tectonics, theIndian plate is moving northward with respect to itsadjacent stable block, the Eurasian plate (Molnar andTapponnier, 1975; Fig. 1, inset). <strong>The</strong> rate of convergenceis approximately 3.5 cm/yr near the longitude ofOuetta (Minster and Tordan. 1978; . Fin. - 8). <strong>The</strong>&aman 'fault (~i~ure"1) is - usually consideied -?hi- - -- --dLtectonics requires kit-lateral sdike-slid on tks boundary.This lift-lateral motion may not be fully taken upby the <strong>Chaman</strong> fault, but it may occur on a numberof subparallel faults within a wide zone of deformtion.Proc. Intern. Commit. Gedynamics, Grp. 6, Mtg. Peshawar, Nov. 23-29, 1979: Spec. Issue, GeoL ~ d. Univ.Peshawar, Vol. 13, 1980.
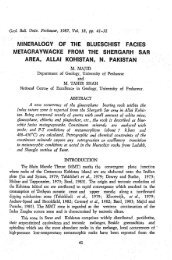
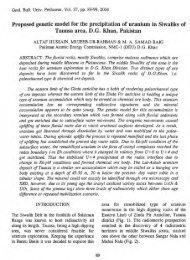
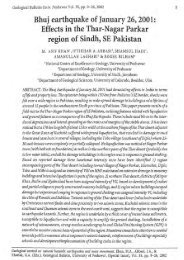
Fig 1. Index map of the northwestern boundary of the Indian subcontinent (from Quittmeyer and Jacob, 1979). Mappedsurface faults ate shown. <strong>The</strong> 2 km sea-depth contour is also shown. <strong>The</strong> filled circles in Iran represent centers ofQuaternary volcanism. Geographic features indicated are as follows: AR = Aravalli range, CB = Cambay basin,CF = <strong>Chaman</strong> fault, CH = Chagai hills, CR = Central Brahui rmge, GF = Gardez fault, HR = Hazara range,HF = Herat fault, HH = Harboi hills, HK = Hindu Kush region, HM = Himalayas, HS = Hazara-Kashmir syntaxis,K = ICirthar range proper, KF = Kunm fault, KR = Karakorum region, M = Makran region, OF = Ornach-Nalfault, OF2 = Owen fracture zone, P = Padrs, QTR = <strong>Quetta</strong> transverse ranges, RK = Rann of Kutch, S =Sulaiman range and SR = Salt range. SweraI cities are indicated by filled triangles: HRT = Herat, HYD Hyderabad, KAR = Karachi, KBL = Kabul, LAH = Lahore, NDI = New Delhi, QUE = Queta, RWP =Rawalpindi. <strong>The</strong> inset in the lower right hand corner shoxvs the plate tectonic setting of the region.<strong>Quetta</strong> lies within the Bduchistan geosyncline, with an eastern source area. Ultrabasic submarine vol- 'which is part of the Mesozoic and early Cenozoic Teth- canics interpreted as an cqhiolitic suture-zone betweenyan belt (Jones, 1961). A tectonic axis divides this the Indian plate and the microplates of AfghanktanIbroad depositional belt into two basins, a western occur along this axis, m s suture or axial zone andbasin with a western source area and an eastern basin other geologic structures bend at the apex of the Sibi-!130 IIIIIIi I
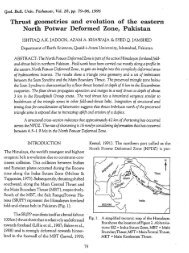
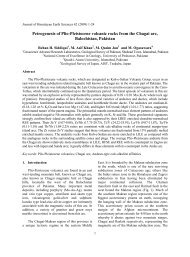
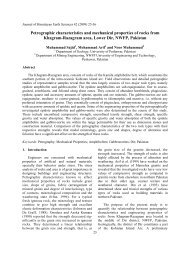
Fig. 3. Epicentral map of crustal seismicity (depth h < 85 kxn) for <strong>Pakistan</strong> and surrounding regions (compare withFigure 2) from 1914 to 1975. Events from 1914 to 1964 have been relocated. Open circles represent large earthquakesthat occurred from 19% to 1914. UD = Undetermined magnitude, Open circles, events 1905-1914. (<strong>From</strong>Quittmeyer and Jacob, 1979).zone of the 1909 event, the aftershock zone of the 1931 historic earthquakes with an intensity (Modifkd Mereventand the ongoing seismic activity of the <strong>Quetta</strong> calli scale) of eight and gteater. In addition a numbertransverse ranges (Quittmeyer et a!., 1979) attest to of earthquakes which occurred prior to installation ofthe complexity of the active tectonic patterns of this the <strong>Quetta</strong> seismic network were large enough to bearea.located by seismic instruments operating around theworld (teleseismic epicenters; Figures 3 and 4).Within the area in which earthquakes were locatedby the <strong>Quetta</strong> seismic network there have been three <strong>The</strong> 20 December 1892 event brought attention
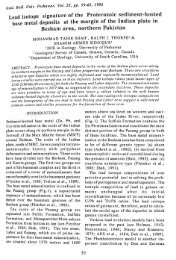
Fig.Earthquake epicenters in the <strong>Quetta</strong> area from 1914 to July 1975 (open circles) and Modified Mercalli isoseismahfor the three largest earthquakes in this period as well as the 1892 event (from Quittmeyer and Jacob, 1979). Doublecircles indicate epicenters for earthquakes occurring after this time period: <strong>The</strong> 3 October 1975, maghde Ms =6.7, 6 4, Spin T&a e&ql,&es; the 13 July 1977, magnitude Ms = 5.5, Kolpur earthquake southeast of Quma;and the 16 March 1978, magnitude Ms = 5.9, Nushki earthquake. C = tom of Chamaa; S = Spin Taha; N =Nushki. Sequences of events are indicated by number: 1935 <strong>Quetta</strong> = numbers upright, 1931 Mach = numbersfacing right (sane fall outside the map). Preliminary epicenters from the <strong>Quetta</strong> network (filled triangles) areindicated by X (hypocentral depth ranges from o to 15 la), + (hypeneal deprh ranges from 15 to 30 km), andfilled circles (hypocentral depth fixed at 15 ion). Note the recent (1975) increase of seismicity on the section of the<strong>Chaman</strong> fault in this figure and the st~k.ing rel&n between the 1892 mezosdsmal area and the recent seismicityon this fault.133
crust; A l~f t-lateral .strike+lip movement was observedwhere a railwajr line crosses the fault (at approximatothe <strong>Chaman</strong> fault as a major boundary in the earth'ctely 30.85"N, 66.52 "E; Griesbach, 1893). Elders fromvillages along the trace ;of $he fault in this area indicatedthat previous events had produced surface faultingthree times during their lifetimes (McMahon, 1897).Two teleseismic locations in the area of Figure 4can be associate4 with the <strong>Chaman</strong> fault. A focal mecl~anismsolution for the 3 October 1975 (magnitudeM "= 6.4) event (Quittmeyer et al., 1979) gives left-slateral strike-slip* on a steeply dipping plane of theexpected strike for the <strong>Chaman</strong> fault. Farah (1976)reported ground cracks in alluvium, a~sociated withthis event along the <strong>Chaman</strong> fault-trace h Palcistannear the town of Spin Tezha, north of the epicenter inFigure 4. Observed 'motion was left-lateral as well aswest side up with amplitudes of a few, centimeters.First-motion data for ,the 16 March 1978, .Nushki event(magnitude MS = 5.9) is consistant with left-lateralstrike-slip 6n the chaman fault, but conclusive data isnot yet available from this earthquake.. .<strong>The</strong> 24/27 Altgzlst. 1931 earthquakes, M = 7.0and M = 7.4, respectively, and the related aftershocksare associated with a complex system of faultsnear the axis of the syntaxis. <strong>The</strong> mezoseismal zone ofthe August 27 event is'kxtended south-southwest alongthe eastern flank of the Brahui range (Figure 4). Howqver,all except one of the aftershocks of this event(Quittmeyer and Jacob, 1979) lie outside of the mezoseismalzone and form a northwest trending patternparallel to and north of the 1909 mezoseismal' area,(Figure' 2). . <strong>The</strong> . instrumental epicenter of the mainshockis at the intersection of these two zones (at29.9N and 67.3E in Figure 3). At least two faults are.probably involved in the August 27 everit, one 'striking-northwest along the aftershack zone, another southsouthwestalong the mezoseismal zone. <strong>The</strong> very littleinformation available about, the August 24 event indicatesthat the ruptures associated with this earthquakeare not contiguous with the August 27 rupture.<strong>The</strong> city' of ~u~tta was almost totally destroyedby the 30 May 1935 earthquake with loss of life inexcess of 30,O 00 persons. <strong>The</strong> maximum intensitieswere observed from <strong>Quetta</strong> south-southwestward toMastung (Figure 5) and Kalat (29.0eN, 66.GoE) thusdefinini a narrow and approximately linear mezoseismalzone ab6ut i5O Ern long (West, 1935). <strong>The</strong> epicentral.location of the main shock near Kalat and aftershocksnear <strong>Quetta</strong> fan in the same zone (Figure 4).' On the east face of Chiltan, the prominentmountain ridge west of <strong>Quetta</strong> (Figure 5), unusuallynumerous rock, falls were observed. A sequence ofcracks in the alluvium aligned with these rockfallswas followed to the south-southwest of Chiltan. Alongthis line of fissures a railroad was most severely dis.rupted ("R" in Figure 5). <strong>The</strong> sense of motion wasnot reported but the description of the ground cracksindicates little vertical displacement and a predominantstrike-slip motion. <strong>The</strong> pattern of destruction in <strong>Quetta</strong>indicates a maximum acceleration in the north-southdirection and is consistent with the near-field effectsfrom strike-slip on a fault that coincides with themezoseismal zone (Figure 4).In condusion, the intensity data suggest that thefault responsible for the 1935 <strong>Quetta</strong> earthquake out.crops along the east face of Chiltan and extends to thesouth-southwest (Jones, 1961, p. 373). <strong>The</strong> northernextent of rupture along this fault probably coincideswith the northern end of the Chiltan ridge (Figure 5)as indicated by the rapid fall-off of intensity north of<strong>Quetta</strong> and by the aftershock distribution. <strong>The</strong> narrownessof the zone of highest intensity suggests ashallow depth of rupture.<strong>The</strong> Chiltan fault along the eastern flank of theChiltan ridge is one of a set of westward-dippingparallel faults that occur in the northern portion ofthe mezoseismal zone (Figures 4 and 6). However, adirect correlation between these faylts and the 1935rupture is not obvious as no displacement was reportedalong any of these surface traces at the time of theearthquake, Thus, the fault associated with the 30 May1935 <strong>Quetta</strong> earthquake is here refered to as the"<strong>Quetta</strong> fault".On 18 February 1955 an earthquake (magnitude6.2) occurred near the northern end of the <strong>Quetta</strong>earthquake rupture (Figures 4 and 7). Kazmi (1979)reports one kilometer length of ground fracture northwestof <strong>Quetta</strong> on an extension of the Chiltan faultbeneath alluvium. This event may have extended the1935 rupture northward.MICROSEISMIC DATALocations for 62 small earthquakes (Figures 4 and5) are obtained from the analysis of two months ofdata from the <strong>Quetta</strong> seismic network (October andNovember, 1978, a period during which all seismicstations operated reliably). In this preliminary study,the crustal structure determined for the Tarbela areain the Hazara arc of northern <strong>Pakistan</strong> (Armbrusteret at., 1978) was used for computing hypocenters by amodified form of the program "HYPO 71" (Lee andLahr, 1972). In a first approximation, it is reasonableto assume a similar velocity structure in the Hazaraarc and in the Sibi re-entrant, since both are sectionsof the thrust and fold belt that stretches along thenorthwestern boundary of the Indian craton. Accuratehypocentral depths could be determined for earthquakesless than 40 krn from the nearest seismic station.Beyond this distance from the network, less reliable
Fig. 5. Detailed map of the local activity recorded by the <strong>Quetta</strong> seismic network (triangles). Events. are indicated. by anumber which gives hypocentral depth in kilometers. Topographic contours at 2000 and 2500 ..n$ters are "4hhwith areas abwe 2500 m shaded. "T" indicates OIigocene to Pleistocene age deposits which save' been upLifted.Three composite focal mechanism solutions are shown in upper hemisphere projections; filled circles compressionsopen circles dilitations. Arrows indicate events which were included in each composite. <strong>The</strong> number identifyii thd*fault plane solution lies at the position of the axis elf maximum compression ("2" is at the position consistent with*thrusting). Solution number 3 also includes teleseismic data ' (triangles) for a large event which occurred before thenetwork began. operating (July 13, 1977; see Figure 4).. Some geographic features referred to in the text are indi:,5cated. Section C-D is shown in Figure 6.. I135>.
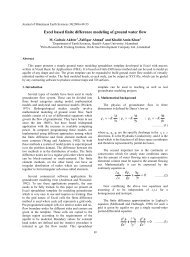
"0DlP"ODy:z:Daaaoobo0000a000~oo~~OoOQUATERNARYALLUVIALUPPER TERTIARYDE TR l DALMESOZOICFig. 6. Vertical cross section (C-14 in Figure 5) through the <strong>Quetta</strong> seismic network with main gedogic structures (Jones,1961). Note that Upper Tertiary includes the Pleistocene in many cases. Small circles indicate hypocenters determinedby the <strong>Quetta</strong> seismic network. <strong>The</strong> focal mechanism for events along the fault which is presumed tohave ruptured in the 1935 <strong>Quetta</strong> earthquake is also shown (upper hemisphere, viewed from this side, compressionalquadrant shaded). Note the agreement between the Chiltan fault on the east face of Chiltan, and the faultplane as determined by the focal mechanism. Some of the scatter in the seismicity related to this mechanism canbe attributed to bending of the fault trace north of the <strong>Quetta</strong> valley. <strong>The</strong> shallow dipping fault to the west alsoappears to be active. <strong>The</strong> activity in the eastern half of the figure is not oriented well for viewing in this projection,epicenters wete obtained arbitrarily fixing the depth at15 krn. In the latter category are all the epicentersobtained in the <strong>Chaman</strong> fault area.<strong>Chaman</strong> F ~ E : This fault is the most active seismiczone observed by the <strong>Quetta</strong> network. About halfof a11 the microearthquake epicenters in Figure 4occur along the <strong>Chaman</strong> fault, within the possible errorin location. Considering the distance of this fracturefrom the network (- 70 km), this seismic source mustbe at least an order of magnitude more active thanthe area within the seismic network. Most of thesemicroearthquakes fall on the same segment of the<strong>Chaman</strong> fault presumably associated with the two recentteleseismically located events, the 3 October 1975,magnitude Mc 6.4 and 6.7 Spin Taha eanhquakes,and the 16 Match 1978, magnitude Ms 5.9 Nushkiearthquake (Figure 3). It is possible that the microearthquakesoccurring on the <strong>Chaman</strong> fault 36 and 7months, respectively, after these moderate size earthquakesare part of a prolonged and complex aftershocksequence.Qaetta Fadr: <strong>The</strong> northern portion of this fault,which by definition ruptured in the 1935 <strong>Quetta</strong>earthquake, is well covered by the <strong>Quetta</strong> network. Anumber of hypocenters aligned with the Chiltan ridgeand located northwest of <strong>Quetta</strong> are probably associatedwith this fault (Figure 5). Most d these hypocenterscluster near the northern end of the 1935 mezoseismalzone and occur to the north of all the located1935 aftershocks (Figure 4). It is possible that most ofthe current seismicity on the <strong>Quetta</strong> fault occursbeyond but near the north end of the 1935 npture(Figure 7). Only four epicenters correlate with thecentral pottion of the fault which ruptured in 1835.<strong>The</strong> hypocentral locations, focal mechanism and1mapped faults (Jones, 1961) are all consistent with ai
Fig. 7. Spacetime for the <strong>Quetta</strong> fault. In the map, the box gives the area sampled; the isoseisrnds and the epicam forthe 1935 earthquake are shown for rdpmce (see Figure 4). <strong>The</strong> dashed lines indicate the extent of the aftershockzone. Crosses and dots in 1978 are the epicenters from the network data (see Figure 4). Note that the seismicityafter the 1935 earthquake is ccmcentrated near the ends of the rupture associated with this earthquake.
fault or fault-zone striking north-northeast and steeplydipping to the west-northwest. <strong>The</strong> apparently complexdistribution of hypocenters on the <strong>Quetta</strong> fault-zonein Figure 6 may be ascribed to activity on more thanone parallel faults and/or to the bending of these faultsnorth of the <strong>Quetta</strong> valley. <strong>The</strong> composite focal mechanismof these events (Figures 5 and 6) indicates thenorthern portion of the <strong>Quetta</strong> fault is presently strikeslippingin a left-lateral sense.Other Active Zones: Three shallow hypocentersoccur west of the network but within the area ofFigures 5 and 6. <strong>The</strong>se events fit well with the shallowdippingthrust-fault associated with the next ridge westof Chiltan along this fault. Mesozoic limestone isthrusted eastward over Pleistocene sediments, furthersuggesting that this is a recent fault (Jones, 1961 ;Gansser, 1979).In general, the maximum hypocentral depth increaseseastward across the network (Figure 6). <strong>The</strong>deepest hypocenters at 43 km occured east of <strong>Quetta</strong>below Zarghun mountain at the axis of the Sibi reentrant.<strong>The</strong> first motion data for the earthquakes inthis area deeper than 15 km (Figure 5, Solution # 2)define a north westward striking plane which is consistentwith the spatial distribution of the hypocenters,and, in the context of this limited data, can be takenas the plane of rupture. According to the first-motiondata this plane dips steeply to the northeast and themotion could range from pure dipslip, north side up,to pure left-lateral strike-slip. A reverse slip on thisfault is consistent with the recent and probably ongoinguplift of the Zarghun range where Pleistocene molasseof the Urak group (Jones, 1961, p. 312-314) is morethan 3.5 km above sea level (T in Figure 5). Left laterals trike-slip is consistent with the surface displacementon th; Mach fault (Kazmi, 1979), the trace ofwhich is direcTlyuF&i Tom Thirselsmicstrurture .-Anoblique slip would account for both surface features.Seeber and Armbruster (1979) have argued that adetachment probably decouples the surface structuressurrounding the Sibi re-entrant from the basement.Note that focal mechanism solutions (Figure 5) includeevents either all greater than or all less than approximately15 1- deep. If a detachment decouples theupper 15 kilometers of the crust from the lower crust,the correlation between the Mach fault and the seismicstructure of fault-plane solution 2 in the deep crust(Figure 5) is fortuitous.<strong>The</strong> moderate (Ms = 5.5) earthquake of 13 July1977 was most strongly felt in Kolpur (Figure 5) andwas teleseismically located near there (Figure 4). Atight cluster of hypocenters from the network dataoccur quite dose to the teleseismic epicenter of theKolpur event. Solution * 3 of Figure 5 contains firstmotiondata of both the microearthquakes and thelarger event. <strong>The</strong> teleseismic data (&st motion reportedin bulletins only) obviously contains a n~~mber ofinconsistent points. <strong>The</strong> composite data are equallycompatible with normal faulting and strike-slip faulting,both with an east-west tension axis. <strong>The</strong> strike slipsolution is more compatible with the general tectonicenvironment of the study area and with the llypocentraldepth of the microearthquakes in the lower crustwhere normal faulting usually is not observed.In the strike slip solution shown in Figure 5, thenortheast striking plane with lef t-lateral slip coincideswith the north westward alignment of the microeanhquakedata. However, the epicenter of the 27 August193 1 Mach earthquake is also dose to Kolpur (29.91•‹N,67.25"E, Figure 4). <strong>The</strong> northwest trend of the aftershockpattern of that event indicates that a major northweststriking fault, perhaps in the lower crust, is activein the Kolpur area. <strong>The</strong> northwest striking plane withright-lateral slip in solution No. 3 (Figure 5) could beassociated with such a fault.N FAULT VS. SAN ANDREAS FAULTHistoric, teleseismic and network data examinedtogether indicate that since 1975 the pattern of seismicityin the <strong>Quetta</strong> area is characterized by unusuallyhigh activity on the <strong>Chaman</strong> fault west of <strong>Quetta</strong>.A 3/4 meter displacement was observed on the<strong>Chaman</strong> fault near the town of <strong>Chaman</strong> after the 1892event (Griesbach 1893). In contrast to reports indicatingrepeated offsets on the <strong>Chaman</strong> fault occurring inthe 19th century (McMahon, 1897), no offsets arereported for the period between 1892 and 1975(Figure 2) although two railways cross the fault (at30.8"N and 29.4"N) and the area has been occupiedby military garrisons.A pattern similar to the distribution of reported-------intensities (Figure 2) is obtained from die-tiikeseismicdata prior to 1975 (Figure 3). <strong>The</strong> seismicity along thefold belt east and south of <strong>Quetta</strong> is generally high,but no epicenters occur along the Charnan fault southof latitude 31•‹N. However, most of the seismicitydetected since 1975 in the area of Figure 4 is concentratedalong the <strong>Chaman</strong> fault south of the southernlimit of the 1892 mezoseisrnal area at abut 30.3"N(Heuckroth and Karim, 1970). This recent seismicityincludes two teleseismic epicenters, the Spiin Tezha 1975(Ms = 6.4 and 6.7) and the Nushki 1975 (Ms = 5.9)earthquakes, and mast of the microearthquakes detectedby the <strong>Quetta</strong> network.Thus, there has been a recent increase of seismicityon the <strong>Chaman</strong> fault south of the 1892 event,However, the possibility of another such burst of activityon this section of the <strong>Chaman</strong> fault after 1892and before 1963, when the teleseismic detectionlevel in this area was lowered to about magnitudeMb = 4.8 (Seeber et al. 1979), cannot be ruled out,
<strong>The</strong> seismicity along the <strong>Quetta</strong> fault after the 1935event is also concentrated at the extremities of thefracture zone as determined from the mezoseismalarea. Four out of five of the teleseisrnic epicenters thatcan be related with the <strong>Quetta</strong> fault occur within 30l a of either of the extremities of the 150 lm longpresumed rupture (Figures 4 and 7). Given the uncertaintyof the locations these earthquakes may haveoccurred on the <strong>Quetta</strong> fault very near the extremi..ties of the fracture. <strong>The</strong> February 18, 195.5 (M 6.2)event is particularly significant because a mile-longfissure was observed after this event along the northernextension of the Chgtan fault in the <strong>Quetta</strong>valley north of <strong>Quetta</strong>, at the presumed northernextremity of the 1935 rupture. <strong>The</strong> network data forthe <strong>Quetta</strong> fault (Figures 4 and 5) confirn~ the patternof seismicity indicated by the teleseismic data. Microearthquakehypocenters cluster in a 30 km segment ofthe <strong>Quetta</strong> fault at the northern extremity of the 1935rupture.Thus, the general pattern of seismicity in the<strong>Quetta</strong> area is one of large events and aftershock sequences.During the interseismic periods the segments ofthe faults that ruptured at the large events are almostaseismic and the seismicity is concentrated at theextremities of these segments. Such a pattern hasbeen observed in California along the San Andreasfault system (Allen, 1975). <strong>The</strong> 150 km long segmentof the San Andreas fault between the northern end ofthe 1857 and the southe~t end of the 1906 breaksnever ruptured in a major event during historic times.A detailed examination of surface displacement andgeodetic data in this segments of the fault (Brown andWallace, 1968; Savage and Burford, 1973) indicatethat the slip in the last 60 years has been rather continuousand uniform at about 3.2 cm/year, a rate whichprobably corresponds to the long term rate of slip.Thus, strain energy for a large event in this segmentof the San Andreas fault is not accumulating. In thesame segment, the seismicity is characterized by smalland intermediate earthquakes (M < 6.5; see below)with relatively short recurrence times (an earthquakewhich is "intermediate" may still be destructive locally).On the other hand, in the segment of the SanAndreas fault that ruptured in 1857, major earthquakeshave occurred systematically over the past 14 centuriesat an average rate of 1 earthquake every 160 years(Sieh, 1978) but few small earthquakes are occurringthere now. Thus, the San Andreas fault is characterizedby distinct portions with contrasting and stable patternsof behaviour.<strong>The</strong> San Andreas fault system in California andthe Alpine fault system in New Zealand exhibit changein strike or bends such that the angle between theregional slip-vector and the strike of the master-faultvaries along the 'fsut system. Scholz (1977) comparesthe portion of the San Andreas fault that ruptured in1857, lcnown as the "big bend", with the centrdportion of the Alpine fault of New Zealand adjacentto the southern Alps (Figure 8). This section of theAlpine fault has not ruptured in historic time (150years), it is not associated with intermediate or smallearthquakes, it is not creeping, and it is expected torupture in a major event, similar to the 1857 event.(Following Scholz, the magnitude in a major earthqueis M > 7.5, in a large earthquake 7.5 2M 1: 6.5, in a moderate or small earthquake M < 6.5;with this definition the <strong>Quetta</strong> 1935 M = 7.5, is classifiedas a large but not major earthquake).It is here suggested that the segment of the<strong>Chaman</strong> fault between 30% and 33"N that includes the1892 rupture (only the southern limit of this ruptureis approximately known) fits in the same category asthe segments of the San Andreas and Alpine faultsmentioned above, i.e., strain relief by rare but majorevents.In all these three segments the fault zone is rathernarrow and it may rupture only in major earthquakes.Scholz ascribes this behaviour to the relatively largeangle between the slipvector and the strike of the faultwhich would, in all three cases, tend to increase thenormal component of stress across the fault, and hencethe frictional strength. In each of the regions inFigure 8, south of the "bend" the strike of the faultsystem is nearly parallel to the regional slip. In theseareas the fault zone widens and slip appears to betaken up by a number of subparallel faults. Furthermore,in these same sections of the fault-zones majorearthquakes do not occur, but large to small earthquakesoccur frequently and, together with possiblecrecpzones, probably account for the total long-termslip-rate across the fault-zones (see Figure 3). <strong>Data</strong>presented in this paper indicate that the <strong>Quetta</strong> 1935event ruptured a fault subparallel to the <strong>Chaman</strong> faultand accounted for a portion of the left-lateral strikesIiptaken up by this fault system.Lawrence and Yeats (1979) have investigated theportions of the <strong>Chaman</strong> fault in <strong>Pakistan</strong>. <strong>The</strong>y contrastthe "long, straight active trace" of the fault inthe area of the 1892 event with the "short traces,multiple erz echelon traces and local absence of activetraces" observed to the south, in the Nushki area. <strong>From</strong>a comparison of the contrasting surface features alongthe 1906 break and the "creeping" segmtnt of the SanAndreas fault with the similarly contrasting featuresalong the 1892 segment and the Nushki segment of the<strong>Chaman</strong> fault, they suggest a pattern of major earthquakesversus creep and small earthquakes in these twosegments of the <strong>Chaman</strong> fault, respectively.<strong>The</strong> surface-wave to body-wave magnitude ratio,MS/Mb, for the three recent earthquakes in the area of
Figure 4, the Spin Tezha 1975, the Nushki, 1978, andthe Kolpur 1977 events, are 6-4/57> 6.7/5.8, 5.9/5.3,and 5,5/5.1, respectively (Epicenter DeterminationReport, U.S.G.S.). <strong>The</strong> unusually high ratios for thethree earthquakes on the <strong>Chaman</strong> fault suggest lowstress-drops for these emhquakes (Archambeau, 1978).similarly the stress-drop for earthquakes along theSari Andreas fault are low and generally lower thanfor other earthquakes in Southern California (Thatcherand Hanks, 1973). Since the recent instmmental seis-micity associated with both the San Andreas and the<strong>Chaman</strong> faults occur along segments of these faultsbetween major ruptures, the low stress-drops maydtaracterize these segments only, and not necessarilythe rest of the fault where major earthquakes occur.CONCLUSIONS<strong>The</strong> Charnan fault and the <strong>Quetta</strong> fault (whichruptured in the 30 May 1935 earthquake) exhibitleft-lateral strike-slip motion.<strong>The</strong> seismicity deepens to the east across the<strong>Quetta</strong> network: it is confined in the upper20 km along the <strong>Quetta</strong> fault zone but reachesdeeper than 40 km below the Zarghun Range,30 km east of <strong>Quetta</strong>. This seismicity may berelated to a dual level tectonics similar to thatobserved in the Hazara arc region near Tarbeladam.On the <strong>Chaman</strong> fault and <strong>Quetta</strong> fault, smallto intermediate earthquakes are concentratedat the ends of tones which ruptured in largeor major earthquakes.<strong>The</strong> <strong>Chaman</strong> fault and the San Andreas faultare both considered transform faults at plateboundaries. <strong>The</strong> spatial and temporal distributionof seismicity of major, intermediate andsmall earthquakes, the stress-drop characterand surface morphology of the fault trace appearsto be similar in both these faults.A seismically quiescent period along the <strong>Chaman</strong>fault south of 30.3'N and north of Nushki(at least for magnitudes M 2 4.8) hasended in 1975. Since then, in this 60 kmlong segment of the fault, three moderate(Ms = 6.7, 6.4, 5.9) and many small earthquakeshave occurred. This recent change inthe seismic pattern may be a premonitorysignal.Acknowledgements: This project would not have been pwsible without the support of the Geological Survey of <strong>Pakistan</strong>and its personnel in establishing and maintaining the instrumentsin the field. K. DeJong was instrumental in the organizationalaspects <strong>The</strong> Watec and Power Development Authorityloaned the project some essential equipment. Klaus Jacob andTerry Engelder reviewed the manuscript. This work was supportedby the following grants: USGS 14-MbWOl-16749;NSF Internaitonal, INT 76-22304 (Univ. of Cincinnati,K. DeJong); and NSF EAR 77-15187)Men, C.R. (1975). geological criteria for evaluating seismicity,Geol. Soc. Ameu. BulE., 86, 1041-1057.Archambeau, L. (1978). Estimation of non-hydrostatic stress inthe earth by seismic methods : Lithospheric stresslevels along Pacific and Nazca plate subduction zones,Proceedings of Conf erence VI Methodology for identifyingseismic gaps and soon to break gaps, U.S.G.S.Open-File Report 78-943.Ambruster, J ., L. Seeber, and K. H. Jacob (1978). <strong>The</strong> northwesterntermination of the Himalayan mountainfront. Active tectonics from microearthquakes,3. Geophys. Res., 83, n. B1, 26P-282.Brown, R.D., and R E. Wallace (1968). Current and historicfault movement along the San Andreas fault betweenPaicines and Camp Dix, California, Proceedings ofthe Conference on Geologic Problems o•’ the SanAndreas <strong>Fault</strong> System, Stanford Uniu. Publ. Univ.Ser. Geol. Sci., 11, 2241,Farah, A. (1976). Study of recent seisrnotectonics in <strong>Pakistan</strong>:Report CENT0 Working Group on Recent Tectonics,Istanbul.Gmsser, A. (1979). Reconnaissance visit to the ophiolites inBaluchistan and the Himdayas, In : Geodynamics of<strong>Pakistan</strong>, A. Farah and K. DeJong (eds.)..'Griesbach, C.L. (1893). Notes on the earthquake in Baluchistanon the 20,th December 1892, Rec. Geol. Suv. India,%, n. 1, 47-41.' lleron, A M. (1911). <strong>The</strong> Balucldstan earthquake of the 21stOctober 1909, Rec. Geol. Sw. lindia, 41, part 1,22-35.Neuckroth, L.E., and R.A. Karim (1970) Earthquake history,seismicity, and tectonics of the reg?om of Afghanistan,Kabul University, 102 p.Jones, A.G. (ed.) (1961). Reconnaissance geology of part ofWest <strong>Pakistan</strong>; A Colombo Plan Cooperative Pmject, Government of Canada, Toronto, 550 p.Kazmi, AX. (1979). Active fault systems in <strong>Pakistan</strong>, inGeodynamics of <strong>Pakistan</strong>, A. Farah and K. DeJong(eds.1, Spec. hbl. GSP, <strong>Quetta</strong>.Lawrence, R.D., and R.S. Yeats ( 1979). Geological reconnaissanceof the Charnan fault in <strong>Pakistan</strong>, in:Geodynamics of <strong>Pakistan</strong>, A. Farah and K. DeJong(eds.), Spec. Publ. GSP, <strong>Quetta</strong>.Lee, W.H.K, and .J.C. Lahr (1972). HYPO 71 (revised): Acomputer program for determining hypocenter, magnitude,and first motion pattern of local earthquakes,U.S.G.S. Open-File Report 75-311.R4ci\1&onJ A.I.I. (1897). <strong>The</strong> southern borderlands of Afghanistan,<strong>The</strong> Geographical Jour,, 9, n. 4, 393415.
Rfiddlemiss, C.S. (1910). <strong>The</strong> Kangra earthquake of 41th April1905, Mem. Geol. Stir. India, 38, 149.hlinster, J.B., and T.H. Jordan ( 1978). Present-day platemotions, J. Geophys. Res., 83, 5331.hlolnar, P., and 1'. Tapponnier (1975). Cenozoic tectonics ofAsia: Egects of a continental collision, Science, 189,419-426.Powell, C.McA. (1979). A spectulative tectonic history of <strong>Pakistan</strong>,in: Geodymmics of <strong>Pakistan</strong>, A. Farah and K.DeJong (eds.), Spec. Publ. GSP, <strong>Quetta</strong>.Quittmeyer, RC., and K.H. Jacob (1979). Historical andmodern seismicity in <strong>Pakistan</strong>, Afghanistan, NorthwestIndia, and Southeast Iran, Bull. Seism. Soc. Am., 69,773-823.Quittmeyer, R.C., A. Farah, and K H. Jacob (1979). <strong>The</strong> seismicityof <strong>Pakistan</strong> and its relation to surface faults, in:Geodynamics of <strong>Pakistan</strong>, A. Farah and K. DeJong(eds.), <strong>Quetta</strong>, p. 271-284.Savage, J C., and R.O. Burford (1973). Geodetic determinationof relative plate motions in Central California,J. Geopbys. Res,, 78, 832-845.Scholz, C.H. (1977). Transform fault systems of California andNew Zealand: Similarities in their tectonic andseismic styles, J. Geol. Soc., 133, 215-229.Seeber ,Seeber , L., J. Armbruster, and S. Farhatulla (1979). <strong>Seismic</strong>hazard at the Tarbela dam site and surroundingregion frm a model of the active tectonics, preprint.Seeber,L., and J. Arrnbruster (1979). <strong>Seismic</strong>ity of the Hazaraarc in northern <strong>Pakistan</strong> : Decollement vs. basementfaulting, In: Geodynamics of <strong>Pakistan</strong>, A. Farah andK. DeJong (eds.1, <strong>Quetta</strong>, p. 131-142.L., R C. Quittmeyer, and J. Armbruster (1979). Himalayanearthquake belts : Implications from networkdata from the western syntaxial area, submitted toStructural Geology of the Himalayas, ed. P.S. Saklani,Delhi University.Sieh, K.E. (1978). Prehistoric large earthquakes produced bysliw on the San Andreas fault at Pallett Creek, Cali-:,ornia, J. Geophys. Res., 83, 3907.Thatcher, W., and T.C. Hanks (1973). Source parameters ofsouthern California earthquakes, J. Geoph ys. Res., 78,8547-8576.West, W.D. (1934). <strong>The</strong> BaIuchistan earthquakes of August25th and nth, 1931, Mem. Geol. Sw. India, 67, part I,1-82.West, V7.D. (1935). Preliminary geological report on the Baluchistan(<strong>Quetta</strong>) earthquake of May 31st, 1935,Rec. Geol. Szrr. I~dia, 69, part 2, 203-!NO.