Characterizing Hydrocarbon Traps Through Surface Geology And ...
Characterizing Hydrocarbon Traps Through Surface Geology And ...
Characterizing Hydrocarbon Traps Through Surface Geology And ...

You also want an ePaper? Increase the reach of your titles
YUMPU automatically turns print PDFs into web optimized ePapers that Google loves.
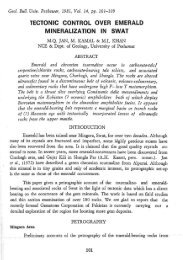
CHARACTERIZING HYDROCARBON TRAPS THROUGHSURFACE GEOLOGY AND SUBSURFACE GEOPHYSICS INTHE TALAGANG AREA, POTWAR PLATEAU, NORTHPAKISTANBYOMER AZIZThesis submitted to the National Center of Excellence in <strong>Geology</strong>,University of Peshawar in partial fulfillment of the requirements for thedegree of Master of Philosophy in <strong>Geology</strong>NATIONAL CENTRE OF EXCELLENCE IN GEOLOGYUNIVERSITY OF PESHAWAR2013
ABSTRACT<strong>Hydrocarbon</strong> traps in the Potwar Plateau of northern Pakistan are generally theproduct of the Tertiary Himalayan orogeny, where fold-thrust belt system in the foreland isformed. For the last about two decades, the Potwar Plateau received much attention in termsof petroleum exploration. In this regard, a number of petroleum national and multinationalcompanies are seriously involved to understand the structural complexities of the area.However, very limited data is published highlighting the trap configurations and their 2D and3D geometries. In this study, a key area known as Talagang, located in the centre of thePotwar Plateau, is selected to decipher the 2D structural geometries of the hydrocarbon trap.For this purpose, surface geological maps and 2D subsurface geophysical seismic sectionsalong and across the strike of the beds are integrated. <strong>Surface</strong> geological corss-section showsa pair of anticline and synicline, that make up the southern portion of the study area. Thesemap-scale folds are E-W trending, with shallowly dipping limbs in the north and south andhence ‘open’ in their interlimb angle. Whereas, the core forms the Nagri formation and limbsforms the Dhok Pathan Formation. In this study, the anticlinal structure has been named as‘Jhatla Anticline’, whereas the synclinal structure has been assinged as ‘Khichh Syncline’.Since, the surface structural cross-section shows gentle-dipping pair of anticline (Jhatla) andsyncline (Khichh) with open interlimb angle, therefore, the same, at least part of, is wellmanifested in the N-S trending seismic sections (0/984-TLG-02, 0/984-TLG-03, 0/984-TLG-04). However, the E-W trending strike-seismic section (0/984-TLG-15) shows prominentanticlinal structure. The geometry of this fold is not manifestedin the N-S dip-seismic section,therefore, it can be inferred that this fold can best be viewed in the E-W strike section.Therefore, the axis of this fold is inferred ca. N-S. This further suggests that this fold is eitherformed by bulk E-W crustal subsurface shortening or by local subsurface intrusion of saltplug.East-West stratigraphic correlation is made using well data. Following wells wereconsidered in the construction of stratigraphic correlation: Dhermund 01(OGDC), Jhaltla -1P(POL), Karsal-04 (POL) and Karsal -01(POL). Correlation is based on the referenceformation that is the Murree Formation. In the Dhermund 01 well, the Murree Formation is532m thick followed by Fatehjang formation (34m;), Sakesar Limestone (101m), NammalFormation (95m), Patala Formation (88m), Khairabad Limestone (22m), Dhakpass Formation(13m) Datta Formation (68m), Chhidru Formation (64m), Wargal Limestone (112m), AmbFormation (107), Sardhai Formation (133m), Warcha Sandstone(122m), DandotFormation(18m), Tobara Formation (12m), Khewara Sandstone ( 42m) and Salt RangeFormation ( 64.67m+). The TD (Total Depth) of Dhermund 01 well was 4331.78m (see alsoTable 3.2.). Similarly, in Jhatla 1P the Murree Formation is 560m thick, followed by BhadrarFormation (51m), and Sakesar (118m+). The total depth of the well was 1995m. In Karsal- 04the Murree formation is 904m thick followed by Bhadrar Formation (25m), SakesarLimestone (149), Patala Formation (35m) and Chhidru Formation, which is 20m thick. Thetotal depth of the Karsal-04 is 3725meters. In Karsal-01 the Murree Formation is 939m thickfollowed by Fathejang formation (25m), Chorgali Formation (53m), Sakesar Limestone(87m), Nammal Formation (36m), Patala Formation (42m), Lockhart Limestone (49m),Hangu Formation (21m),WargalLst (28m), Amb Formation (8m) and Sardhai Formation,which is 2.5+m. The total depth of the oil well is 3886m.For structural correlations same wells that is Dhermund 01(OGDC), Jhaltla -1P(POL), Karsal-04 (POL) and Karsal -01(POL) wells are used in the correlation. Thecorrelation shows that Jhatla is the highest area and creates an anticline and this is consistenti
with the E-W trending seismic section, where prominent anticlinal structure has beenidentified.North-South stratigraphic correlation of the study area comprises the Jhatla-1P (POL),Karsal-04 (POL) and Kotsarang -01(OGDC). Correlation shows that the Nammal Formationis missing in the Karsal-04, whereas the same is present in the Kotsarang well. Projectedthickness of the formation is increasing to the north with respect to the south. In theKotsarang well, the thickness of the Murree formation is 1037m thick followed by SakesarLimestone (70m), Nammal Formation (62m), Patala Formation (54m), Lockhart Limestone(49m), Hangu Formation (25m) Kingriali Formation ( 30m)Wargal Formation and(60m+).The TD of the Kotsarng -01 is 4153m.North-South structural correlation of the studyarea comprises on the Jhatla-1P (POL), Karsal-04 (POL) and Kotsarang-01 (OGDC). Thecorrelation shows part of the Jhatladomal structure and is manifested in the Kotsarang, Jhatlaand Karsal wells.The Isopach net pay map shows the vertical closure of the Jhatlastructure, and fromthe standard formula and parameters estimated from the surrounding wells, followingreserves have been calculated.Based on volumetric output ca. 247 MMbbl have beenestimated for the top Eocene horizon. While applying different recovery factors e.g. at 30%recovery ca. 74 MMbbl will be recovered. Similarly, at 40% recovery, ca. 99 MMbbl will berecovered and so on. For top Permian, based on volumetric calculations ca. 231 MMbbl havebeen estimated, however, while applying recovery factors of 30% only ca. 69 MMbbl will berecovered, 40% will produced 92MMbbl and so on.ii
DedicationThis research work is lovingly dedicated to my son,Asfand Omeriii
ACKNOWLEDGEMENTSAll praise to almighty ALLAH, the source of all knowledge, wisdom withinand beyondour comprehension. Great thanks to ALLAH, who gave me the strengthand enabledme to overcome the difficulties that I faced during the completion of thiswork.I offer my sincerest gratitude to my supervisor, Dr.Muhammad Sayab, who hassupported me throughout my thesis with his patience andknowledge whilst allowingme the room to work in my own way. I attribute the levelof my M.Phil degree to hisencouragement and effort without which this thesis wouldnot have been completed.I extend my heartily thanks to Prof. Dr. M. Asif Khan, Director, NCE in <strong>Geology</strong>,whose encouragement and support from the initial to the final level enabled me todevelop better understanding of the subject. Words can hardly suffice to expressdepth of gratitude I owe for Prof. Dr. M.Tahir Shah, Graduate student advisor,NCEG, university of Peshawar, who hasalways been kind and supportive.Finally, this work is highly acknowledged to all my family members who supportedme to achieve this goal.Omer Aziz16April, 2013iv
CONTENTSABSTRACTDEDICATTIONACKNOWLEDGEMENTSLIST OF CONTENTSLIST OF ILLUSTRATIONSLIST OF TABLESLIST OF CONTENTSPAGE NO.iiiiivviiviiix1. CHAPTER#1 1Introduction 11.1. Research outline 11.2. Location of the study area 21.3. Objectives 41.4. Methodology 41.4.1. Compilation and digitization of existing geological maps 41.4.2 Seismic sections interpretation and data analysis 41.5. Data sources 51.6. Significance of this study 51.7. Tectonics of the study area 61.8. Stratigraphy of the study area 61.9. Sources and reservoir rocks 82. CHAPTER#2 9<strong>Geology</strong> and Geophysical methods 92.1. <strong>Geology</strong> of the study area 92.2. <strong>Surface</strong> geological cross section (line A-A) 102.3. Seismic data interpretation 112.3.1 Structural Analysis 112.3.2 Stratigraphic analysis 112.4. Depth section 122.5. Interpretation prerequisites 122.6. Base Map 122.7. 0/984- TLG-02 132.8. 0/984- TLG-03 132.9. 0/984- TLG-04 142.10. 0/984- TLG-15 142.11. Jhatla 1P well 142.12. Reflector identification 152.13. Structural interpretation 152.13 Faults identification 252.14. Time-contour map 252.15. Depth contour map 253. CHAPTER#3 32Correlation of stratigraphy and structural setup based on well data 323.1. Corelations 323.1.1. Stratigraphic correlation 323.1.2. Structural correlation 323.2. East-West stratigraphic correlation of the study area 333.3. East-west structural correlation of the study area 353.4. North-South stratigraphic correlation of the study 363.5. North-South structural correlation of the study 36v
CHAPTER#4 41Volumetric reserve estimation 414.1. Reserve estimation 414.2 Volumetric method 414.3. Isopach net pay map 434.4. Volumetric estimation of Jhatla structure 43CONCLUSIONS 52REFERENCES 55vi
Fig. NoFig. 1.1Fig. 1.2Fig. 2.1Fig. 2.2Fig. 2.3Fig. 2.4Fig. 2.5Fig. 2.6Fig. 2.7Fig. 2.8Fig. 2.9Fig. 2.10Fig. 2.11Fig. 2.12Fig. 2.13Fig. 2.14Fig. 2.15Fig. 2.16Fig. 2.17Fig. 3.1Fig. 3.2Fig. 3.3Fig. 3.4Fig. 4.1Fig. 4.2LIST OF ILLUSTRATIONSDescriptionGeneralized structural map of Potwar Plateau showing the locationof the study area in box (after Khan et al., 1986).Google map showing the location of the study area (Lower leftportion). The area can be accessible via M2 section.Geological map of Talagang area (Unpublished map of GeologicalSurvey of Pakistan). Note, location of seismic lines on map.Geologic cross-section showing structural geometry across line A-A.Seismic base map of the study area showing N-S dip and E-Wstrike lines and the location of the Jhatla-1p well.Uninterpreted seismic line 0/984- TLG-02. X-axis represents theshot points (SP), whereas y-axis shows time (milli-sec).Interpreted seismic line 0/984- TLG-02, showing top Eocene, topPermian and top Basement level.Uninterpreted seismic line 0/984- TLG-03. X-axis represents theshot points (SP), whereas y-axis shows time (milli-sec).Interrupted seismic line 0/984- TLG-03, showing top Eocene, topPermian and top Basement level.Uninterpreted seismic line 0/984- TLG-04. X-axis represents theshot points (SP), whereas y-axis shows time (milli-sec).Interpreted seismic line 0/984- TLG-04, showing top Eocene, topPermian and top Basement level.Uninterpreted seismic line 0/984- TLG-15. X-axis represents theshot points (SP), whereas y-axis shows time (milli-sec).Interpreted interrupted seismic line 0/984- TLG-15, showing topEocene, top Permian and top Basement level.Two-way-Time on Top Eocene level.Depth structure map on Top Eocene level.Two-way-Time on Top Permian level.Depth structure map on Top Permian level.Two-way-Time on Top Basement level.Depth structure map on Top Basement level.E-W stratigraphic correlation of the study area showing thatthicknesses are increasing in the east.E-W structural correlation of the study area showing thatthicknesses are increasing in the east. The structural correlation ofeach formation along each well portrayed a pronounced anticlinalstructure.NS -Stratigraphic correlation of the study area showing thatthicknesses are increasing north.NS-Structural correlation of the study area showing that thicknessesare increasing in the northward direction.Isopach net pay map of top Eocene level showing the net thicknessof the closure.Isopach net pay map of top Permian level showing the net thicknessof the closure.Page No45121215192021222324252628293031vii
Table No.Table 1Table 3.1Table 4.1Table 4.1Table 4.2Table 4.2Table 4.3Table 4.4LIST OF TABLESDescriptionGeneralized stratigraphic column of the Potwar plateau (afterKemal,1991).Showing Well name, location, spud date, total depth, operator,status and height between ground and rig (Kelly Bushing)Showing formation thicknesses and measured across eachformation in respective wells.Standarad parameters obtained from isopach map and surroundingwells calculated for the top Eocene (possibly Sakesar Limestone).Volumetric method showing reserves calculated for the topEocene.Standarad parameters obtained from isopach map and surroundingwells calculated for the top Permian (possibly Tobra Formation).Volumetric method showing reserves calculated for the topPermian.Volumetric method showing reserves calculated for the topPermian.Page No.9354546474748viii
CHAPTER 1Introduction1.1. Research outline<strong>Hydrocarbon</strong> traps in the Potwar Plateau of northern Pakistan are generally structurallycontrolled, however, local stratigraphic traps are also reported (e.g., Kemal, 1991). The structuraltraps are the product of the Tertiary Himalayan orogeny, where fold-thrust belts in the forelandare formed. There is no second opinion of pre-existing or pre-Himalayan structurally controlledtraps in the Potwar area (e.g., Jaswal et al., 1997). This firmly suggests that the structural traps inthe Potwar should be analyzed under the framework of fold-and thrust-belt system. For the lastabout two decades, the Potwar Plateau received much attention in terms of petroleum exploration(e.g., Jaswal, 1990; Kemal, 1991; Kadri, 1995; Moghal et al., 2007). In this regard, a number ofpetroleum national and multinational companies have seriously been involved to understand thestructural complexities of the area. However, very limited data is published highlighting the trapconfigurations and their 2D and 3D geometries.In this study, a key area known as Talagang, located in centre of the Potwar Plateau, isselected to decipher the 2D structural geometries of the hydrocarbon traps. For this purpose,surface geological maps and 2D (after permission from DGPC) subsurface geophysical seismicsections along and across the strike of the beds are integrated. <strong>Through</strong> this approach, followinggoals will be achieved:1) Structural geometry of the subsurface traps.2) Tectonic interaction between stratigraphic and structural traps.1
3) Size, shape in 2D and volumetric estimates.4) Complexities involved in terms of tectonic evolution.The Potwar Plateau is located at the northern margin of the Indian plate in northernPakistan. Well data and surface geology indicate that the Potwar Plateau consists of almost entiresequence of lithological successions exposed along the Salt range thrust, and, therefore, thePotwar Plateau is a prolific area for hydrocarbon occurrence. The first commercial discovery ofhydrocarbons from the Himalayan foreland was made in the Potwar Plateau at the Khaur in1914, which is located in the northern Potwar Plateau. Since then hydrocarbons have beenreported from different areas of the Potwar Plateau (Fig. 1.1).The Potwar Plateau, and especially the northern part exposed along the Main BoundaryThrust (MBT), has experienced severe deformation during the Himalayan Orogeny in Plioceneto Middle Pleistocene (e.g., Jaswal, 1990; Jadoon et al., 1997, Johnson et al., 2009). <strong>Surface</strong>geological features at some parts of the Potwar Plateau mismatch the subsurface geometry due tocomplexities involved at the upper and middle crustal levels (McDougall and Hussain, 1991). Inthis study, surface structural elements and subsurface geometries will be integrated in the lightof existing geological maps and seismic sections.1.2. Location of the study areaThe Talagang area is located about 150 Kilometres to the southwest of Islamabad (Latitude:32 o 30 00.00 to 33 o 00 00 N, Longitude: 71 o 49 00.00 to 73 o 00 00 E) and covers an area ofabout 256 Km 2 . The area is accessible via motorway (M2 section) from the Balkassar interchangeand is approachable via Talagang-Chakwal Road (Fig. 2.1).2
Fig. 1.1. Generalized structural map of the Potwar Plateau showing the location of the study areain box (after Khan et al., 1986).Fig 1.2. Google map showing the location of the study area (lower left portion). The area can beaccessible via M2 section.3
1.3. ObjectivesFollowing objectives are designed:1. To understand the structural geometries using surface geological cross-sections andsubsurface seismic sections in the Talagnag area.2. To delineate the potential stratigraphic/structural traps and measure their size and shapein 2D.3. To analyze the evolution of traps, either tectonically or stratigraphically.4. To calculate trap resource reserves by using volumetric method with the help ofsubsurface isopach contours.1.4. Methodology1.4.1. Compilation and digitization of existing geological mapsExisting geological map(s) prepared by the Geological Survey of Pakistan (GSP) areused. The GSP map(s) are at 1:50,000 scale showing major structural elements and are helpful inunderstanding the surface structural frame work of the study area.1.4.2. Seismic sections interpretation and data analysisPost-stack time migration seismic sections of different vintage data is interpreted onKingdom software (version 8.6), which is available in the NCE in <strong>Geology</strong> University ofPeshawar. <strong>Surface</strong> geological maps and 2D subsurface geophysical seismic sections areintegrated. This will provide control to analyze subsurface structural and/or stratigraphic trapgeometries, their size and shape in 2D, and their complexity in terms of tectonic/stratigraphicevolution. Stratigraphical and structural correlations, based on surrounding wells, are also4
generated on both east-west and north-south directions on Kingdom software to understand thestructural and stratigrpahic thicknesses/pinch outs and structural evolution of the study area. Inaddition, resource reserves from volumetric analyses are carried out to estimate the hydrocarbonpotential in a given trap.1.5. Data sourcesFollowing seismic lines have been recognized and acquired from the DGPC withpermission (letter attached). 0/984-TLG-02 0/984-TLG-04 0/984-TLG-03 0/984-TLG-15Well data (LAS files) of Karsal -01 and Balkassar oxy-01 was acquired from Land MarkResources, Pakistan (LMKR).1.6. Significance of this studyThe results of this study, which are presented in the forthcoming chapters of thisdissertation, particularly highlight the geometry of subsurface hydrocarbon traps in the Talagangarea, their size and shape in 2D, which is empirical in understanding the reservoir evolution. Thisstudy will answer that whether the targeted traps are structurally controlled or stratigraphicallyevolved in the southern Potwar Plateau and their formation mechanism in terms of tectonicevolution. In addition, resource reserves from volumetric study will help us to provide anestimate of the trap potential of hydrocarbons.5
1.7. Tectonics of the study areaThe Potwar Plateau is composed of three domains. The Northern Potwar DeformedZone (NPDZ) exposed in the northern part of the Potwar Plateau, the central SoanSyncline, and in the south the area is fringed by the Salt Ranges (Jaswal et al., 1997).Tectonically, the Potwar Plateau is bounded by Main Boundary Thrust to the North and theSalt Range Thrust towards the south. The western part is truncated against the KalabaghFault, whereas, the eastern side is bounded by the Jhelum Fault. It has been estimated that~55Km of horizontal shortening has been accommodated from the central Soan syncline tonorthern part of the NPDZ during 5.1 to 2.0 Ma, whereas, 20Km of horizontal shorteninghas occurred along he Salt Ranges after 2.0 Ma (Jaswal et al., 1997; Baker et al., 1988).The study area lies at the south part of the Soan syncline and locally comprises of Jhatlaand Dhadambar anticlines. In this research, major focus will be on Jhatla anticlinalstructure, which is inferred to be the sub-structure of the Soan syncline. In the field, theJhatla anticline consists of isolated outcrops of Nagri and Dhok Pathan formations partlycovered by the alluvium.1.8. Stratigrpahy of the study AreaThe stratigraphy of the Potwar plateau is established from outcrops as well as fromthe well log sections (Kemal, 1991; Jaswal et al., 1997). In the subsurface, the PotwarPlateau preserves the sediments from Pre-Cambrian to Quaternary age, while surfaceexpression of these formations are exposed in the Salt Range. Detail account on eachstratigraphic unit, its sedimontological record and regional distribution is beyond thescope of this study, therefore, a table summarizing brief details of each unit is given in6
Table 1.1. Interested readers are referred to papers by Kemal, (1991) and Jaswal et al.(1997) and a book by Kadri (1995).Table 1.1. Generalized stratigraphic column of the Potwar Plateau (after Kemal, 1991).7
2.3. Seismic data interpretationSeismic interpretation is the transformation of geophysical data (seismic reflectionprofile) into a meaningful stratigraphic and structural framework. There are two mainapproaches to interpret seismic reflection data, 1) structural analysis, and 2) stratigraphicanalysis.2.3.1. Structural AnalysisIt is the study of reflector geometry on the basis of reflection time (Ashcroft, 2011).The main application of the structural analysis of seismic section is in the search forstructural traps containing hydrocarbons. Most structural interpretation uses two-wayreflection times rather depth. Time structural maps are constructed, figures below, to displaythe geometry of selected reflection events, for example, discontinuity in the reflectionindicate faults and undulating reflections reveal folded horizons.2.3.2. Stratigraphic AnalysisStratigraphic analysis involves the subdivision of seismic sections into sequence ofreflections that are interpreted as a seismic expression of genetically related sedimentarysequences (Dobrin and Savit 1988, Kearey et al., 2002). The principles behind this seismicsequence analysis are of two types:1) First of all reflections are taken as chronostratigraphical units, since the type of rockinterface that produce reflections.2) Secondly, genetically related sedimentary sequences normally comprise the set ofconcordant strata that exhibit discordance with underlying and overlying strata. Stratigraphicoil traps can result from reefs, pinchouts, erosional truncations, facies, transitions and sand11
lenses etc. Stratigraphic interpretation also involves seismic attribute analysis, seismicinversion and seismic facies.2.4. Depth sectionThe depth section gives the configuration of reflectors in the same way as it is in theTime section. To determine the depth, average velocity is used. Using the appropriatevelocity values and time, the depth of each reflector is calculated as follows:Depth = (V x T)/2 ……………………. (1)Where,V = the velocity of respective reflector (m/s).T =the two way travel time of each reflector (sec).2.5. Interpretation prerequisitesIn order to deduce the seismic patterns, it is important to have a basic understandingof the tectonic activity that has influenced the area and depositional system within the area.Available wells data and surface geology are gathered and organized for better results ofseismic data. As the digital data is available, therefore, Kingdom 8.2 workstation is used forinterpretation, hosted in the National Centre of Excellence in <strong>Geology</strong>, University ofPeshawar. Any observation that is made by using seismic data can be pasted on a base map.In this study, only time and depth maps are constructed and explained below.2.6. Base MapThe base map of the Talagang area, obtained from the DGPC (Fig. 2.3), shows thelocation of the seismic profiles under study. Map shows three dip lines trending in northsouthdirection (/984-TLG-02, 0/984-TLG-03, 0/984-TLG-04) and one strike line, striking ineast-west direction (0/984-TLG-15).12
Seismic line 0/984- TLG-03 was acquired by OGDCL in 1984 (Fig. 2.6). The lengthof the line is 7.5 Km. The line starts from SP 101 and ends at SP 249. Total numbers of shotpoints (SP) are 148 and record length is 4.8 second. Data quality is poor to fair from 0.5second to 3 second but very poor from 0 to 0.5 second and below 3 second where it isuninterpretable. The line direction is N-S and it is a dip line (Fig. 2.3).2.9. 0/984- TLG-04Seismic line 0/984- TLG-04 was acquired by OGDCL in 1984. The length of the lineis 7.5 Km. The line starts from SP 100 and ends at SP 250 (Fig. 2.8). Total numbers of shotpoints (SP) are 150 and record length is 4.8 second. Data quality is poor to fair from 0.5second to 3 second but very poor from 0 to 0.5 second and below 3 second where it isuninterpretable. The line direction is N-S and it is a dip line (Fig. 2.3).2.10 0/984- TLG-15Seismic line 0/984- TLG-15 was acquired by OGDCL in 1984. The length of the lineis 56 Km. The line starts from SP 100 and ends at 2340 (Fig. 2.10). Total numbers of shotpoints SP are SP 2240 and record length is 4.8 second. Data quality is poor to fair from 0.5second to 3 second but very poor from 0 to 0.5 second and below 3 second where it isuninterpretable. The line direction is NW-SE and it is a Strike line (Fig. 2.3).2.11. Jhatla 1P wellJhatla 1P was an exploratory well drilled by Pakistan Oilfield Ltd (POL) in1956. The total depth of the well is 1995 m and the well was abandoned. The welltook around one year to complete and due to operational problems it could not reachits target formation, which was projected at Permian level.14
2.12 Reflector identificationThree reflectors of top Eocene, top Permian and top basement were picked from theseismic section on the basis of typical seismic signatures (Figs. 2.5, 2.7, 2.9, 2.11). Typicalseismic signature of the Murree Formation in this area is of low frequency (resolution)appearance on the seismic record. The top Eocene shows a very prominent reflection, whichis related to the high acoustic impedance contrast between the overlying Miocene MurreeFormation, which dominantly consist of shale, claystone, and sandstone, and ChorgaliFormation, which consist of limestone. The basement rocks also show strong reflection. Asthe seismic data of the project is of low resolution, therefore, it is unable to delineate verythin beds. The prominent reflectors were tied with the well data of Jhatla-1P.2.13. Structural interpretationSince, the surface structural cross-section (A-A') shows gentle-dipping pair ofanticline (Jhatla) and syncline (Khichh) with open interlimb angle, therefore, the same, atleast part of, is well manifested in the N-S trending seismic sections (0/984-TLG-02, 0/984-TLG-03, 0/984-TLG-04). However, the E-W trending strike-seismic section (0/984-TLG-15)shows prominent anticlinal structure (Figs. 2.10, 2.11). The geometry of this fold is notpicked up in the N-S dip seismic section, therefore, it can be inferred that this fold can best beviewed in the E-W strike section. From here, it is interpreted that the axis of this fold is ca.N-S, means that this fold is either formed by E-W crustal subsurface shortening oralternatively by local subsurface intrusion of salt plug, explained below.Generally, surface expression of E-W shortening is manifested in the form of manyfolded structures exposed in the eastern part of the Potwar Plateau (Fig. 1.1) and in thewestern Trans-Indus Ranges, where N-S trending Surghar-Shinghar Anticline and theMakarwal Anticline are excellent surface examples of N-S trending folds. Thus, it can befurther interpreted that the N-S trending structures overprint over the E-W trending structures15
in the region. This can also suggests the formation of domal (type-1 of Ramsay and Huberfold interference classification, 1987) structures in the region, which might be responsible forthe trap of hydrocarbons. However, since no macro-scale N-S trending structures are exposedin the Talagang area, therefore this subsurface fold might be formed as a result of localinjection of salt plug from the Salt Range Formation.16
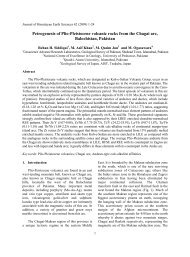
Fig. 2.4. Uninterpreted seismic line 0/984- TLG-02. X-axis represents the shot points (SP), whereas y-axis shows time (milli-sec).17
SOUTH0/984 TLG-02NORTHTOP EOCECNETOP PERMAINTOP BASMENTFig. 2.5. Interpreted seismic line 0/984- TLG-02, showing top Eocene, top Permian and top Basement level.18
Fig. 2.6. Uninterpreted seismic line 0/984- TLG-03. X-axis represents the shot points (SP), whereas y-axis shows time (milli-sec).19
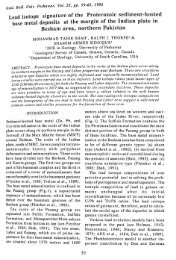
Fig. 2.8. Uninterpreted seismic line 0/984- TLG-04. X-axis represents the shot points (SP), whereas y-axis shows time (milli-sec).21
SOUTH0/984 TLG-04NORTHTOP EOCECNETOP PERMAINTOP BASMENTFig. 2.9. Interpreted seismic line 0/984- TLG-04, showing top Eocene, top Permian and top Basement level.22
Fig. 2.10. Un interpreted seismic line 0/984- TLG-15. X-axis represents the shot points (SP), whereas y-axis shows time (milli-sec).23
Fig. 2.11. Interpreted seismic line 0/984- TLG-15, showing Top Eocene, Top Permian and Top Basement level.24
2.13 Faults identificationThe faults are typically identified on the basis of break in the continuity of the reflectors.The prominent faults are obvious on the seismic record. Two high-angle reverse faults arerecognized. These faults are located on the axis of the Jhatla Anticline. The fault F1 is NNE-SSW trending, while the fault F2 is NNW-SSE on Eocene Level (Fig. 2.12).2.14. Time-contour mapThe Two way time contour map (twt) of the marked horizons and the faults marked onthe base map are contoured to make a time-contour map on Eocence level (Fig. 2.12) Permianlevel (Fig. 2.14) and on Basement level (Fig. 2.16). The time-contour map shows that both F1and F2 faults are penetrative and continued throughout the basement. The contours show theexact locations of the structures present in the area. Twt map shows time on different levels andby using time and velocity depth was calculated.2.15. Depth contour mapThe depth of the marked horizons and the faults marked on the base map are contoured todevelop a depth contour map. Depth maps of top Eocene, (Fig. 2.13 ) top Permian (Fig. 2.15)and top basement level (Fig. 2.17) have been generated. The depth contours map shows the depthof the horizons and, hence, the closure of the reservoir. Depth map provide a picture of thereservoir in the shape of almost closing contours. From depth structure map, resource reserveshave been calculated using volumetric method (Chapter 4). Structural position of the reservoir iscalculated from net pay map which is assumed on the first and last closing contours on depthstructure map (Chapter 4).25
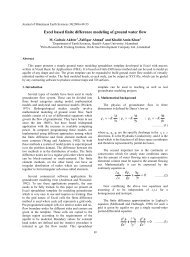
F2F1Fig. 2.12. Two-way-Time map on Top Eocene level.26
F2F1Fig. 2.13. Depth structure map on Top Eocene level.27
Fig. 2.14. Two-way-Time map on top Permian level.28
Fig. 2.15. Depth structure map on Top Permian level.29
Fig. 2.16. Two-way-Time map on top Basement level.30
Fig. 2.17. Depth structure map on Top Basement level.31
CHAPTER 3Correlation of stratigraphy and structural setup based on well data3.1. CorrelationsWell- to well correlation of different geological units can be used to construct correlationmaps in 2D. Normally, correlations can be accurately done on the basis of different wells datadrilled in the surrounding areas, given the appropriate scale of the area under investigation. Ithelps us to generate model thicknesses of a given geological unit(s) with reference to the earthsurface. Correlations of different wells are constructed to understand stratigarphic trend ofdifferent formations, their thicknesses, pinch-outs and to understand the unconformities. Thereare two types of correlations.3.1.1. Stratigraphic correlationStratigraphic correlation is the comparison of different rock formations lying above eachother. It provides a true picture of any particular section by correlating different characteristics offormations, their thicknesses or pinch-out and basin-wise distribution. In addition, detailedsedimentological studies can reveal depositional trend of that particular formation undercover.3.1.2. Structural correlationStructural correlation provides a control to structurally model different formations in agiven area based on well-to- well correlation. By using well-to-well correlation, more or lesscomplete structural style of the area can be portrayed. For example, as shown below, ananticlinal structure has been modeled based on well-to-well structural and stratigraphiccorrelation and discussed in detailed below.32
3.2. East-West stratigraphic correlation of the study areaEast-West stratigraphic correlation is made on the Kingdom software (version 8.2),which is available in the National Centre of Excellence in <strong>Geology</strong>, University of Peshawar. Inorder to develop well-top profile for each formation, formation tops were taken and processedthrough commercially available software Energy Management System (EMS). Following wellswere considered in the construction of stratigraphic correlation: Dhermund 01(OGDCL), Jhaltla -1P (POL), Karsal-04 (POL) and Karsal -01(POL). Table 3.1 and 3.2 show details of each welland their respective thicknesses. Fig. 3.1 shows well-to-well correlation of stratigraphicformations. Correlation is based on the reference formation that is the Murree Formation. In theDhermund 01 well, the Murree Formation is 532m thick followed by Fatehjang formation (34m;‘m’ stands for meter in this and subsequent suffixes), Sakesar Limestone (101m), NammalFormation (95m), Patala Formation (88m), Khairabad Limestone (22m), Dhakpass Formation(13m) Datta Formation (68m), Chhidru Formation (64m), Wargal Limestone (112m), AmbFormation (107), Sardhai Formation (133m), Warcha Sandstone (122m), Dandot Formation(18m), Tobara Formation (12m), Khewara Sandstone ( 42m) and Salt Range Formation (64.67m+). The TD (Total Depth) of Dhermund 01 well was 4331.78m (see also Table 3.2.).Table 3.1. Shows well name, location, spud date, total depth, operator, present status and heightbetween ground and rig floor (Kelly Bushing) of different wells used in stratigraphic correlation.Well Name Latitude Longitude Spud Date Total Depth(TD) meterOperator Status KellyBushing(meter)Dhermend-01 32°56’44.97”N 72°09’53.96”E Dec 30,1978 4331.78 OGDCL (P&A) 423.51Jhatla-1P 32°48’19.00”N 72°20’37.00”E July 06,1956 1995.1 POL P&A 585Karsal 04 32°58’28.00”N 72°58’24.00E July 21,1960 3725.10 POL P&A 381Karsal 01 32°59’15.00N 72°33’14.00E May3886 POL OIL 42202,1955Kotsarang-01 32°04’5.00N 72°24’12.00E July 22,1966 4153 OGDC P&A 42333
Similarly, in Jhatla 1P well the Murree Formation is 560m thick, followed by BhadrarFormation (51m), and Sakesar Limestone (118m+). The total depth of the well was 1995m. InKarsal- 04 the Murree formation is 904m thick followed by Bhadrar Formation (25m), SakesarLimestone (149), Patala Formation (35m) and Chhidru Formation (20m). The total depth of theKarsal-04 well is 3725m. In Karsal-01 well the Murree Formation is 939m thick, followed byFathejang formation (25m), Chorgali Formation (53m), Sakesar Limestone (87m), NammalFormation (36m), Patala Formation (42m), LockhartLimestone (49m), Hangu Formation(21m),Wargal Lst (28m), Amb Formation (8m) and Sardhai Formation (2.5+m). The total depthof the oil well is 3886m.Table 3.2. Shows formation thicknesses in each respective well used in correlation.Dhermund -01 Jhatla-1P Karsal-04 Karsal-01 Kotsarang-01Formation thickness Formation thickness Formation thickness Formation thickness Formation thickness(meters)(meters)(meters)(meters)(meters)Dhok PathanFm. 545NagriFm.Chinji Fm.Kamlial Fm.98493068Nagri Fm. 384 Dhok PathanFm.283 Dhok PathanFm.Chinji Fm. 818.43 Nagri Fm. 1063 Nagri Fm. 1070Kamlial 62.49 Chinji Fm. 1021 Chinji Fm. 113Fm.1MurreeFm.560.83 KamlialFm.309 Dhok Pathanfm.414Nagri Fm. 1054Chinji fm. 104397 Kamlial Fm. 82 Kamlial Fm. 159Murree Fm. 532 Bhadrar fm 51.2 Murree Fm. 904 Murree Fm. 939 Murree Fm. 1037Fatehjang fm.Red clays fm.Bhadrar fm.341622SakesarLst.T D 1995.1meters118.05+ FatehjangfmRed claysfm22 Fatehjang fm. 25 Kuldana fm. 525 Chorgali Fm. 53 Bhadrar fm. 60Bhadrar fm 25 Bhadrar fm --- Sakesar Lst. 70Sakesar Lst. 101 Sakesar Lst. 149 Sakesar Lst. 87 Nammal fm. 62Nammal Fm.95Nammal Fm Nammal Fm. 36 U.RanikotFm.634
Patala Fm. 88 Patala Fm 35 Patala Fm. 42 Patala Fm. 54KhairabadKhairabadLockart Lst. 49 Hangu Fm. 25Limestone 32LimestoneDhak Pass fmDhak PassDhak Pass fm. - Dhak Pass fm ---13fmJurassic 68 Jurassic 49 Hangu Fm. 21 Kingriali Fm. 30Triassic 72 Triassic 27 Wargal Fm. 28 Wargal Fm. 66+Chidru Fm. 64 Chidru Fm. 20 Amb Fm 8 TD 4153mWargal Fm. 112 TD : 3725m Sardhai Fm. 2.5Amb Fm. 107 TD 3886mSardhai Fm. 133Warcha Fm. 122Dondot Fm. 18Tobra Fm. 12BaghanwalaFm. 7Jutana Fm. 20Kussak Fm. 30Khewra Sst 42Salt RangeFm.64.67+TD 4331.78m3.3. East-West structural correlation of the study areaSame four wells that is Dhermund 01(OGDC), Jhaltla -1P (POL), Karsal-04 (POL) andKarsal -01(POL) are used in the structural correlation. The correlation shows that the Jhatlaanticline is consistent with the E-W trending seismic section, where prominent anticlinalstructure has been identified. The distance of the adjacent wells and the formation depths aregiven on the Fig. 3.2 (see also Table 3.2).35
3.4. North-south stratigraphic correlation of the study areaNorth-South stratigraphic correlation of the study area comprises the Jhatla-1P (POL),Karsal-04 (POL) and Kotsarang -01(OGDC) wells. Correlation shows that the NammalFormation is missing in the Karsal-04, whereas the same is present in the Kotsarang well.Projected thickness of the formation is increasing to the north with respect to the south (Fig. 3.3).In the Kotsarang well, the thickness of the Murree formation is 1037m thick by SakesarLimestone (70m), Nammal Formation (62m), Patala Formation (54m), Lockhart Limestone(49m), Hangu Formation (25m) Kingriali Formation (30m) and Wargal Formation (60m+).TheTD of the Kotsarng -01 well is 4153m.3.5. North-south structural correlation of the study areaNorth-South structural correlation of the study area was generated by using the formationthicknesses encountered at wells: Jhatla-1P (POL), Karsal-04 (POL) and Kotsarang-01 (OGDC).Fig. 3.4 shows northern part of the Jhatla domal structure and is manifested in the Kotsarang,Jhatla and Karsal wells.36
westEastFig. 3.1. E-W stratigraphic correlation of the study area shows that thicknesses are increasingtowards east.37
westEastFig. 3.2. E-W structural correlation of the study area shows that thicknesses are increasing towards east.The structural correlation portrayed a pronounced anticlinal structure.38
Fig. 3.3. NS-Stratigraphic correlation of the study area showing that thicknesses are increasing towards north.39
Fig. 3.4. NS-Structural correlation of the study area showing that thicknesses are increasing inthe northward direction.40
CHAPTER 4Volumetric reserve estimation4.1. Reserve estimationOil and gas reserves are those quantities of petroleum which can be commerciallyrecovered from known accumulations. Three main classes of reserves are recognized: proved,probable, and possible according to Petroleum Reserves Definitions, 1997. ‘Probable’ and‘possible’ are collectively known as unproved. Proved reserves are those quantities ofhydrocarbons that have reasonable certainty of being recovered, indicating a high degree ofconfidence. Proved reserves may be developed or undeveloped. The total estimated amount ofoil in an oil reservoir, including both producible and non-producible oil, is called “oil in place”(OIP).4.2. Volumetric methodVolumetric methods are used to determine the amount of OIP by using the size of thereservoir as well as the physical properties of rocks and fluids. Then a recovery factor isassumed, using assumptions from fields with similar characteristics. Recovery factors for oilfields around the world range between 10 to 60 percent; however, some are over 80 percent. Thefirst requirement in the volumetric method is to ascertain the volume of the potentiallyhydrocarbon bearing rocks. This quantity is given by the product of the area of the accumulationof hydrocarbons and the mean gross reservoir thickness above the hydrocarbon/water contact andrepresents the gross volume of the potentially productive reservoir. The volumetric methodprovides a static measure of oil or gas in place. The accuracy of the volumetric method dependson data, such as porosity, net pay thickness, areal extent and hydrocarbon saturations.41
The volumetric method is also known as the geologist’s method because it is based ongeological maps, core data, and analysis of wireline logs. Isopach maps are used to compute thebulk volume of the reservoir (V). By considering the mean porosity and the mean hydrocarbonsaturation of the net pay section, the magnitude of the hydrocarbons in place may be estimated.For liquid hydrocarbons, this quantity is referred to as oil initially in place, OIIP, i.e.,OIIP = A * h* N/G * φ (1-Sw)………………………..(2)where:A = productive area (acres or hectares)h = gross reservoir thickness above the hydrocarbon/water contact (ft or m)N/G = net-to-gross ratioΦ = average porosity, fraction of bulk volumeSw = average initial water saturation, fraction of porosityOIIP can be converted into recoverable reserves in terms of stock tank oil initially inplace, STOIIP, by applying three additional factors, i.e.,STOIIP = (7758 * A * h* N/G * φ (1-Sw) Ro)/Bo………………………(3)where:7758 is a conversion factor that converts A * h* N/G from acre ft to barrels.Ro is the primary recovery factor, and it depends on the drive mechanism, permeability,reservoir depth, temperature and hydrocarbon viscosity. It can be as high as 45% or 50% in cleanoil-bearing sandstone reservoirs with good inter-granular petrophysical properties and under anactive water drive, and as low as 15% or 20% in carbonate reservoirs with fracture or vuggyporosity and under solution gas or gas cap expansion.42
Bo is the oil formation factor and it is essential for converting oil volumes from reservoir tostock tank conditions (STOIIP). Bo is obtained from PVT data and mostly range from 1.14 to1.6.4.3. Isopach net pay mapIsopach maps are used to compute the bulk volume of the reservoir (V). Depth Structuremap on top reservoir formation is prepared and then the contour intervals are replaced by the netpay calculated through logs. The logs are used to calculate the net pay of the reservoir and afterapplying the cutoffs and other adjustments, a map is prepared with the calculated results. Thismap prepared from cutoff values and calculated net pay are used in reserve estimation of thereservoir.4.4. Volumetric estimation of Jhatla structureBoth time and depth contour map shows the extent of the Jhatla anticline (Fig. 4.1 and4.2; see Chapter 2, sections 2.14, 2.15, 2.16 for details). Jhatla anticline is bounded by two faultson Eocene, Permian to Basement level. The Isopach net pay map shows the vertical closure ofthe structure (Fig. 4.1 and 4.2) and from the standard formula and estimated parameters from thesurrounding wells, following reserves have been estimated.The standard values are incorporated in the reserve estimation so that average reservescan be calculated. Based on volumetric output ca. 247 MMbbl have been estimated for the topEocene horizon. While applying different recovery factors e.g. at 30% recovery ca. 74 MMbblwill be recovered. Similarly, at 40% recovery, ca. 99 MMbbl will be recovered and so on (Table4.1 and 4.2). For top Permian, based on volumetric calculations ca. 231 MMbbl have been43
estimated, however, while applying recovery factors of 30% only ca. 69 MMbbl will berecovered, 40% will produce 92 MMbbl and so on (Table. 4.4).44
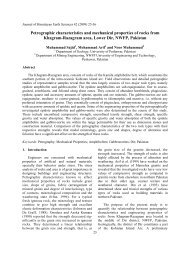
Fig. 4.1. Isopach net pay map of top Eocene level showing the net thickness of the closureTable 4.1. Standard parameters obtained from isopach map and surrounding wells calculated forthe top Eocene (possibly Sakesar Limestone).45
THE VOLUMETRIC METHODOil Initially In placeInput DataCEASEDNet X Acer per footConstant = 7758 NAF = 851287.01A = 5189 acres 21 sq.kmh = 164 ft 50.00 meter Temp =φ = 10 %S wi = 55 %FVF = 1.2 rbbl/stb atIntial ReservoirPressureRecoverableReserves74 30%Initial Gas In place = OIP = 247660674 BBL ( barels ) 99 40%Formula:FVF =247 MMbbl (Million barel ) 148 60%198 80%OIIP =7758 X NAF XФ X (1 – Sw) /FVFTable 4.2. Volumetric method showing reserves calculated for the top Eocene.46
Fig. 4.2. Isopach net pay map of Top Permian level showing the net thickness of the closure.Table 4.3. Standard parameters obtained from isopach map and surrounding wells calculated forthe top Permian (possibly Tobra Formation).47
THE VOLUMETRIC METHODOil Initially In placeInput DataCEASEDNet X Acer per footConstant = 7758 NAF = 794534.55A = 6919 acres 28 sq.kmh = 115 ft 35.00 meter Temp =φ = 10 %S wi = 55 %FVF = 1.2 rbbl/stb atIntial ReservoirPressureRecoverable Reserves69 30%Initial Gas In place = OIP = 231149963 BBL ( barels ) 92 40%Formula:FVF =231 MMbbl (Million barel ) 138 60%184 80%OIIP =7758 X NAF XФ X (1 – Sw)/FVFTable 4.4. Volumetric method showing reserves calculated for the top Permian.48
CONCLUSIONSFollowing conclusions can be drawn based on geology, geophysical and well data:1. <strong>Surface</strong> geological corss-section (A-A') shows a pair of anticline and synicline, that makeup the sorthern portion of the map (Fig. 2.2). These map-scale folds are E-W trending,with shallowly dipping limbs in the north and south and hence ‘open’ in their interlimbangle. Whereas, the core forms the Nagri formation and limbs forms the Dhok PathanFormation. In this study, the anticlinal structure has been named as ‘Jhatla Anticline’ ,whereas the synclinal fold has been assinged as ‘Khichh Syncline’.2. Since, the surface structural cross-section (A-A') shows gentle-dipping pair of anticline(Jhatla) and syncline (Khichh) with open interlimb angle, therefore, the same, at least partof, is well manifested in the N-S trending seismic sections (0/984-TLG-02, 0/984-TLG-03, 0/984-TLG-04).3. The E-W trending strike-seismic section (0/984-TLG-15) shows prominent anticlinalstructure (Figs. 2.10, 2.11). The geometry of this fold is not picked up in the N-S dipseismic section, therefore, it can be inferred that this fold can best be viewed in the E-Wstrike section. It is interpreted that the axis of this fold is ca. N-S. It is further inferredthat this fold is either formed by E-W crustal subsurface shortening or alternatively bylocal subsurface intrusion of salt plug. Since, no macro-scale N-S trending structures areexposed in the Talagang area, therefore, this subsurface fold might be formed as a resultof local injection of salt plug from the Salt Range Formation.4. East-West stratigraphic correlation is made on the Kingdom software (version 8.2).Following wells were considered in the construction of stratigraphic correlation:49
Dhermund 01(OGDC), Jhaltla -1P (POL), Karsal-04 (POL) and Karsal -01(POL).Correlation is based on the reference formation that is the Murree Formation.5. In the Dhermund 01 well, the Murree Formation is 532m thick followed by Fatehjangformation (34m), Sakesar Limestone (101m), Nammal Formation (95m), PatalaFormation (88m), Khairabad Limestone (22m), Dhakpass Formation (13m) DattaFormation (68m), Chhidru Formation (64m), Wargal Limestone (112m), Amb Formation(107), Sardhai Formation (133m), Warcha Sandstone(122m), Dandot Formation(18m),Tobara Formation (12m), Khewara Sandstone ( 42m) and Salt Range Formation (64.67m+). The TD (Total Depth) of Dhermund 01 well was 4331.78m. Similarly, inJhatla 1P the Murree Formation is 560m thick, followed by Bhadrar Formation (51m),and Sakesar (118m+). The total depth of the well was 1995m. In Karsal- 04 the Murreeformation is 904m thick followed by Bhadrar Formation (25m), Sakesar Limestone(149), Patala Formation (35m) and Chhidru Formation, which is 20m thick. The totaldepth of the Karsal-04 is 3725meters. In Karsal-01 the Murree Formation is 939m thickfollowed by Fathejang formation (25m), Chorgali Formation (53m), Sakesar Limestone(87m), Nammal Formation (36m), Patala Formation (42m), Lockhart Limestone (49m),Hangu Formation (21m),Wargal Lst (28m), Amb Formation (8m) and Sardhai Formation,which is 2.5+m. The total depth of the oil well is 3886m.6. For structural correlations same wells that is Dhermund 01(OGDC), Jhaltla -1P (POL),Karsal-04 (POL) and Karsal -01(POL) wells are used in the correlation. The correlationshows that Jhatla is the highest area and creates an anticline and this is consistent with theE-W trending seismic section, where prominent anticlinal structure has been identified.50
7. North-South stratigraphic correlation of the study area comprises the Jhatla-1P (POL),Karsal-04 (POL) and Kotsarang -01(OGDC). Correlation shows that the NammalFormation is missing in the Karsal-04, whereas the same is present in the Kotsarang well.Projected thickness of the formation is increasing to the north with respect to the south(Fig. 3.3). In the Kotsarang well, the thickness of the Murree formation is 1037m thickfollowed by Sakesar Limestone (70m), Nammal Formation (62m), Patala Formation(54m), Lockhart Limestone (49m), Hangu Formation (25m) Kingriali Formation (30m)Wargal Formation and (60m+).The TD of the Kotsarng -01 is 4153m.8. North-South structural correlation of the study area comprises on the Jhatla-1P (POL),Karsal-04 (POL) and Kotsarang-01 (OGDC). Fig. 3.4 shows northern part of the Jhatladomal structure and is manifested in the Kotsarang, Jhatla and Karsal wells.9. Based on volumetric calculations ca. 247 MMbbl have been estimated for the top Eocenehorizon. While applying different recovery factors e.g. at 30% recovery ca. 74 MMbbland at 40% recovery, ca. 99 MMbbl will be recovered and so on (Table 4.1 and 4.2).10. For top Permian, based on volumetric calculations ca. 231 MMbbl have been estimated,however, while applying recovery factors of 30% ca. 69 MMbbl and 40% will produce92MMbbl and so on (Table. 4.4.)51
ReferencesAshcroft, W., 2011. A petroleum geologist’s guide to seismic reflection. John Wiley & Sons.Baker, D.M., Lillie, R.J., Yeats, R.S., Johnson, G.D., Yousaf, M., Zaman, A.S.H., (1988)Development of the Himalayan thrust zone: Salt Range, Pakistan, <strong>Geology</strong> 16, 3-7.Dobrin, M. B., Savit, C. H. 1988. Introduction to geophysical prospecting. McGraw-Hill.Jaswal T (1990) Structure and evolution of the Dhurnal oil Þeld, northern Potwar deformed zoneand the Main Boundary thrust in Pakistan. Thesis, Oregon State Univ, Corvallis, Oregon.Jaswal, T. M., Lillie, R. J., Lawrence, R. D., 1997. Structure and evolution of the northernPotwar deformed zone, Pakistan. AAPG Bulletin, 81, 308-328.Jadoon, I. A. K., Frisch, W., Kemal, A., Jaswal, T. M., 1997. Thrust geometries and kinematicsin the Himalayan foreland (North Potwar deformed zone), North Pakistan. Geol Rundsch, 86,120-131.Johnson, G. D., Raynolds, R. G. H. and Burbank, D. W. (2009) Late Cenozoic Tectonics andSedimentation in the North-Western Himalayan Foredeep: I. Thrust Ramping and AssociatedDeformation in the Potwar Region, in Foreland Basins (eds P. A. Allen and P. Homewood),Blackwell Publishing Ltd., Oxford, UK. doi: 10.1002/9781444303810.ch15.Kadri, I. B., 1995. Petroleum <strong>Geology</strong> of Pakistan. Pakistan Petroleum Ltd.Kearey, P., Brooks, M., Hill, I., An introduction to geophysical exploration. John Wiley & Sons.Kemal, A., (1986) <strong>Geology</strong> and new trends for petroleum exploration in Pakistan. Newdirections and strategies for accelerating petroleum exploration and production in Pakistan, 16-57.Khan, I. A., Bridge, J. S., Kappelman, J., Wilson, R., 1997. Evolution of Miocene fluvialenvironments, eastern Potwar plateau, northern Pakistan. Sedimentology, 44, 221-251.McDougall, J. W., Hussain, A., 1991. Fold and thrust propagation in the western Himalaya basedon a balanced cross section of the Surghar range and Kohat Plateau, Pakistan. AAPG Bulletin,75, 463-478.Moghal M. A., Saqi, M. I., Hameed, A., Bugti, M. N., 2007. Subsurface geometry of Potwar subbasin in relation to structuration and entrapment. Pakistan Journal of <strong>Hydrocarbon</strong> Research, 17,61-72.Ramsay, J. G., Huber, M. I., 1987. The techniques of modern structural geology: Folds andFractures. Academic Press.52