3. Integrated analysis of spatial and attribute data - RTC, Regional ...
3. Integrated analysis of spatial and attribute data - RTC, Regional ...
3. Integrated analysis of spatial and attribute data - RTC, Regional ...
SHOW LESS

Create successful ePaper yourself
Turn your PDF publications into a flip-book with our unique Google optimized e-Paper software.
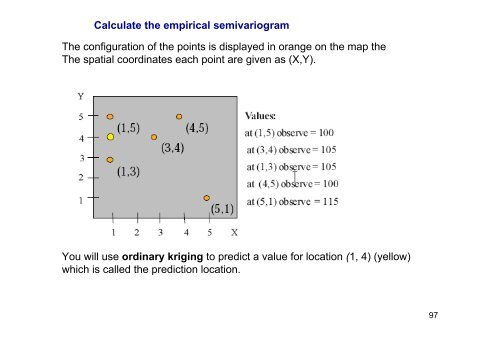
Calculate the empirical semivariogramThe configuration <strong>of</strong> the points is displayed in orange on the map theThe <strong>spatial</strong> coordinates each point are given as (X,Y).You will use ordinary kriging to predict a value for location (1, 4) (yellow)which is called the prediction location.97