3. Integrated analysis of spatial and attribute data - RTC, Regional ...
3. Integrated analysis of spatial and attribute data - RTC, Regional ...
3. Integrated analysis of spatial and attribute data - RTC, Regional ...

Create successful ePaper yourself
Turn your PDF publications into a flip-book with our unique Google optimized e-Paper software.
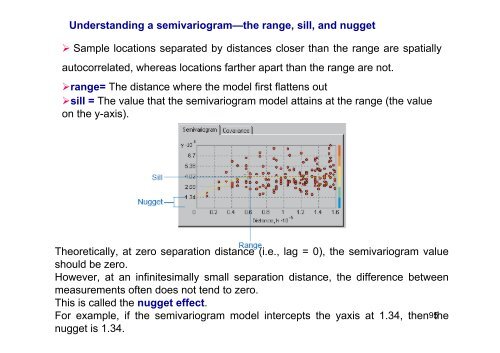
Underst<strong>and</strong>ing a semivariogram—the range, sill, <strong>and</strong> nugget‣ Sample locations separated by distances closer than the range are <strong>spatial</strong>lyautocorrelated, whereas locations farther apart than the range are not.‣range= The distance where the model first flattens out‣sill = The value that the semivariogram model attains at the range (the valueon the y-axis).Theoretically, at zero separation distance (i.e., lag = 0), the semivariogram valueshould be zero.However, at an infinitesimally small separation distance, the difference betweenmeasurements <strong>of</strong>ten does not tend to zero.This is called the nugget effect.For example, if the semivariogram model intercepts the yaxis at 1.34, then 95thenugget is 1.34.