FY14 Approved Budget for TSCC Review PDF - TriMet
FY14 Approved Budget for TSCC Review PDF - TriMet
FY14 Approved Budget for TSCC Review PDF - TriMet

You also want an ePaper? Increase the reach of your titles
YUMPU automatically turns print PDFs into web optimized ePapers that Google loves.
TABLE OF CONTENTSPageOverviewBoard of Directors ................................................................. Overview-1<strong>TriMet</strong> Officials .................................................................... Overview-1<strong>Budget</strong> Message .................................................................... Overview-22013-2014 <strong>TriMet</strong> Organization Chart ................................ Overview-10Financial SummaryGeneral Fund Resource Summary ......................... Financial Summary-1General Fund Requirement Summary ................... Financial Summary-3Capital Program Resource Summary .................... Financial Summary-6Capital Program Requirement Summary .............. Financial Summary-7Light Rail Program Resource Summary ............... Financial Summary-8Light Rail Program Requirement Summary .......... Financial Summary-9General Obligation Bond Debt Service Fund ...... Financial Summary-10Summary of Fund History ................................... Financial Summary-11Pass through Revenues and Requirements .......... Financial Summary-13Resources (General Fund)General Fund Resources....................................................... Resources-1General Fund Resource Summary ........................................ Resources-2General Fund Resource Summary by Source ....................... Resources-4<strong>TriMet</strong> Continuing Revenues and Calculationof Payroll Tax Debt Service Ratio ................................ Resources-6Federal & State/Local General Fund Grant Summary ......... Resources-7Requirements (General Fund)General Fund Requirements ........................................... Requirements-1General Fund Requirement Summary ............................ Requirements-2General Fund Requirements by Object Class ................. Requirements-5General Fund Personal Services Schedule ..................... Requirements-6General Fund Materials & Services Schedule ................ Requirements-7Summary of General Fund Employees .......................... Requirements-8Summary of Fixed Route Service ................................ Requirements-11Summary of Fixed Route and AccessibleTransportation Vehicles ............................................ Requirements-12Debt ServiceSummary of General Fund Debt Service ......................... Debt Service-1Summary of General Fund Debt ServicePrincipal and Interest ................................................... Debt Service-2PageOPEB & Pension UAAL ................................................................... OPEB-1Office of the General Manager DivisionDivision Summary .......................................................................... GM-1Office of the General Manager ....................................................... GM-2Diversity and Transit Equity ........................................................... GM-5Internal Audit .................................................................................. GM-8Public Affairs DivisionDivision Summary ........................................................................... PA-1Administration ................................................................................. PA-2Operating Projects ........................................................................... PA-5Planning & Policy ............................................................................ PA-6Government Affairs ......................................................................... PA-9Communications ............................................................................ PA-12Organization Development ............................................................ PA-15Customer In<strong>for</strong>mation Services ..................................................... PA-18Safety & Security DivisionDivision Summary ............................................................................SS-1Safety, Security and Environmental Services ...................................SS-2Operating Projects ............................................................................SS-7In<strong>for</strong>mation TechnologyDivision Summary ............................................................................ IT-1In<strong>for</strong>mation Technology ................................................................... IT-2Operating Projects ............................................................................ IT-6Finance & Administration DivisionDivision Summary ........................................................................... FA-1Administration ................................................................................. FA-2Operating Projects ........................................................................... FA-5Financial Services ........................................................................... FA-6Financial Analysis & Grants Administration ................................... FA-9Risk Management .......................................................................... FA-12Procurement & Contracts ............................................................... FA-15Fare Revenue ................................................................................. FA-18
PageLabor Relations & Human Resources DivisionDivision Summary .......................................................................... HR-1Administration & Business Partnering ............................................ HR-2Labor Relations ............................................................................... HR-5Compensation, Benefits & HRIS .................................................... HR-8Legal Services DivisionDivision Summary ........................................................................... LS-1Legal Services .................................................................................. LS-2Operations DivisionDivision Summary .......................................................................... OP-1Administration & Support ............................................................... OP-2Operating Projects ........................................................................... OP-7Bus Transportation .......................................................................... OP-9Scheduling ..................................................................................... OP-15Field Operations ............................................................................ OP-18Transportation Planning ................................................................ OP-23Accessible Transportation Programs-LIFT ................................... OP-26Accessible Transportation Programs-MTP ................................... OP-30Bus Maintenance ........................................................................... OP-34Facilities Management .................................................................. OP-37Rail Transportation ........................................................................ OP-43Rail Maintenance of Way .............................................................. OP-46Rail Equipment Maintenance ........................................................ OP-50Commuter Rail .............................................................................. OP-53Streetcar ........................................................................................ OP-57Capital Projects DivisionDivision Summary ........................................................................... CP-1Administration ................................................................................. CP-2Operating Projects ............................................................................ CP-5Bus Stop Development ..................................................................... CP-6Development & Operations Support ................................................ CP-9Columbia River Crossing ............................................................... CP-13PageLight Rail ProgramLight Rail Program Resource Summary ................ Light Rail Program-1Light Rail Program Requirement Summary .......... Light Rail Program-2Light Rail Program Requirements(Detailed By Project) ...................................... Light Rail Program-3Division Summary ................................................. Light Rail Program-4South Corridor Project ........................................... Light Rail Program-5Milwaukie Light Rail Project ................................ Light Rail Program-8Debt Service FundGeneral Obligation Bond Debt Service Fund ..................... G. O. Bond-1General In<strong>for</strong>mationExhibit 1 Ridership and Service (Fixed Route) ....................... General-1Exhibit 2 Fares and Passenger Revenue (Fixed Route) ........... General-2Exhibit 3 Employer Taxes (Unadjusted CPI-W) ..................... General-3Exhibit 4 Expenses (Fixed Route) ........................................... General-4Exhibit 5 Fixed Route Financial Indicators ............................. General-5Exhibit 6 LIFT Revenue, Ridership and Service ..................... General-6Exhibit 7 Local Economic Trends ........................................... General-7Exhibit 8 Debt and Capital Investment .................................... General-8Local Economic Trends ........................................................... General-9Ridership ................................................................................ General-10Service ................................................................................... General-11Expense .................................................................................. General-12Revenue ................................................................................. General-13AppendixNotice of <strong>Budget</strong> Committee Hearing .................................. Appendix-1Resolution Approving FY13-14 <strong>Budget</strong> ............................... Appendix-2Capital ProgramCapital Program Resource Summary ......................... Capital Program-1Capital Program Requirement Summary ................... Capital Program-2Capital Program Detail ............................................... Capital Program-3
BOARD OF DIRECTORSBruce Warner, President(District #1)TRIMET OFFICIALSNeil McFarlane, General ManagerDavid Auxier, <strong>Budget</strong> OfficerTiffany Sweitzer, Vice President(District #2)Vacant(District #3)Consuelo Saragoza(District #4)Dr. T. Allen Bethel(District #5)Travis Stovall(District #6)Craig Prosser(District #7)Mailing Address:<strong>TriMet</strong> Board of DirectorsOffice of the General Manager1800 SW 1 st Avenue, Suite 300Portland, Oregon 97201Mailing Address:<strong>TriMet</strong>1800 SW 1 st Avenue, Suite 300Portland, Oregon 97201Staff to the Board:Kelly RunnionTelephone 503-962-4831Facsimile 503-962-6451Email runnionk@trimet.orgOverview-1
<strong>Budget</strong> Message – Fiscal Year 2013 – 14<strong>FY14</strong> <strong>Budget</strong> OverviewThe <strong>FY14</strong> <strong>Approved</strong> <strong>Budget</strong> continues <strong>TriMet</strong>’s multi-year plan toachieve long term fiscal stability. 1The <strong>FY14</strong> <strong>Approved</strong> <strong>Budget</strong> assumes <strong>TriMet</strong>’s current contractproposal 2 and that the Employment Relations Board sustains theJuly 2012 binding arbitration decision. Should <strong>TriMet</strong> lose eithercase, we will need to plan budget reductions in all budget areas tobegin in FY15.<strong>TriMet</strong>'s successful arbitration award of last summer and strongerrevenue growth provide a short window of financial stabilityallowing <strong>TriMet</strong> to advance four key priorities:Stability <strong>for</strong> riders – the budget assumes no fare increasesthis year and no service cuts;State of good repair – the budget advances <strong>TriMet</strong>’s state ofgood repair, substantially increasing bus replacements andusing new federal funds to rehabilitate older portions of ourrail system. These investments are more fully describedbelow.Services fixes – <strong>TriMet</strong> is able to fix a limited number ofservice problems, such as overcrowded lines, poor1 <strong>TriMet</strong>’s Fall 2012 <strong>Budget</strong> Forecast and Financial Analysis can be viewed athttp://trimet.org/publications/index.htm#72 <strong>TriMet</strong>’s contract offer can be viewed athttp://trimet.org/newcontract/index.htmconnectivity, access to new jobs, and schedule delays dueto increased congestion. Increase union DB pension plan funding, which is just 52%funded.With 96% of construction funding provided by our federal, stateand local partners, the agency continues to advance the Portland toMilwaukie light rail project, so far delivering over 5,000 jobs tothe region.It must be emphasized that <strong>TriMet</strong>’s cost structure is unsustainabledue to the high cost of health insurance benefits <strong>for</strong> unionemployees, retirees and dependents. Without changes to activeand retiree health insurance benefits, changes that other Oregonpublic employers made years ago, <strong>TriMet</strong> will face a series offinancial crises starting in FY15. Our riders and our regiondeserve so much more.Financial Planning Process<strong>Budget</strong> Process and Multi-Year Financial Forecast: <strong>TriMet</strong>’sbudget process begins each fall with a long term <strong>for</strong>ecast ofrevenues and expenditures. The <strong>for</strong>ecast is an important feature ofthe budget process as it helps insure that current budget decisionsare made in the context of the long term financial strategy of thedistrict. The <strong>for</strong>ecast can be thought of as a multi-year “budget.”<strong>TriMet</strong>’s <strong>for</strong>ecast begins with status quo projections, whichincorporate the assumption that the current cost structure remainsin place and cost trends continue indefinitely. Status quoprojections (also known as baseline projections) provide abenchmark that can be used in considering changes needed to bringOverview-2
evenues and expenditures in balance, to add services, invest inassets or reduce liabilities.After the status quo projections are updated, <strong>TriMet</strong> creates abusiness plan or recommended plan <strong>for</strong>ecast that includes anycosts, cost savings or revenue recommendations needed to achievefiscal stability and meet <strong>TriMet</strong>’s service commitments to theregion. The <strong>FY14</strong> <strong>Approved</strong> <strong>Budget</strong> incorporates theserecommendations.ExpendituresCollective Bargaining: In July 2012, an arbitrator issued a bindingarbitration decision selecting <strong>TriMet</strong>’s contract proposal with theAmalgamated Transit Union (ATU), which represents 85% of<strong>TriMet</strong>’s work <strong>for</strong>ce, <strong>for</strong> the December 1, 2009 to November 30,2012 contract period. The award included a healthcare plan design<strong>for</strong> union employees enrolled in the PPO health plan that migratesfrom $5 co-pays to 10% co-insurance, an annual deductible, higheremployee contributions <strong>for</strong> prescription drugs, and a definedcontribution pension plan that replaced the traditional pension plan<strong>for</strong> new union hires. The defined contribution plan has the sameelements as the non-union defined contribution plan. The awardsaved <strong>TriMet</strong> $4.8 million in the first year compared to the union’sproposal. <strong>TriMet</strong> implemented most elements of the arbitrationaward immediately. 33 However, in August, the ATU filed a nine-count unfair labor practice chargechallenging virtually every aspect of the arbitrator’s binding award except, the 3percent retroactive wage increase.The binding arbitration decision, combined with higher thanprojected payroll tax revenues has provided relief from immediateservice cuts and more fare increases and af<strong>for</strong>ded <strong>TriMet</strong> theopportunity to address key vulnerabilities in the <strong>FY14</strong> <strong>Approved</strong><strong>Budget</strong>.The <strong>FY14</strong> <strong>Approved</strong> <strong>Budget</strong> assumes <strong>TriMet</strong>’s current contractproposal and <strong>TriMet</strong> sustains the July 2012 binding arbitrationdecision. Should <strong>TriMet</strong> lose either case, we will need to planboard budget reductions in all budget areas.Areas of vulnerability addressed in the <strong>FY14</strong> <strong>Approved</strong> <strong>Budget</strong>include:Service: $1.6 million of additional bus service needed to maintainschedule reliability, reduce peak crowding and solve persistentservice problems is included in the <strong>FY14</strong> <strong>Approved</strong> <strong>Budget</strong>.Fare Levels: The $1.3 million low income fare program isretained. No fare increase is proposed in <strong>FY14</strong>. <strong>TriMet</strong>'scontribution to the student pass program is included, as agreed toin an MOU between <strong>TriMet</strong>, the City of Portland, and the PortlandSchool District.Union DB Pension: The funding of the union defined benefit (DB)pension is increased $4 million a year in <strong>FY14</strong> and an additional$2 million on-going in FY15. The union DB pension plan is just52% funded, putting it in the bottom 10% of states andmunicipalities nationwide. 4 The funding increases in <strong>FY14</strong> andFY15 will put the plan on a path to full funding by 2031.4 Public Plans Database at the Center <strong>for</strong> Retirement Research at Boston CollegeOverview-3
Safety: Eleven bus operators are added to prevent excessiveconsecutive hours of service ($956,000 annual cost). We continueannual safety focused training <strong>for</strong> all operators and supervisors,and will extend implementation of the safety management system.We will also add contracted security <strong>for</strong> events and on boardpresence.Capital repair and replacement: To maintain service levels,<strong>TriMet</strong> cut back investment in capital replacement and repairsignificantly over the last ten years. This has resulted in anaccumulation of capital replacement and repair that had beenminimally addressed in prior finance plans. This budget turns thataround:Buses: Because of the increase in payroll tax revenues<strong>TriMet</strong> is increasing bus replacement purchases from 40per year FY13 to FY16 (160 buses) to 70 buses in FY13,60 in <strong>FY14</strong>, 64 in FY15 and 60 in FY16 (254). The entirefleet will be low-floor low emission and air conditioned,and at the desired 8 year average age by FY16, four yearsearlier than previously expected.Rail: MAP-21 authorized additional funding <strong>for</strong> railagencies to address rail capital repair and maintenance.The additional authorization af<strong>for</strong>ds <strong>TriMet</strong> the opportunityto increase investments in light rail system maintenanceand repair that had been only minimally addressed in priorfinance plans. This additional investment is reflected in the<strong>FY14</strong> <strong>Approved</strong> <strong>Budget</strong>. The additional funds will helppay <strong>for</strong> the additional labor and materials <strong>for</strong> Type 2 lightrail vehicle progressive overhauls, Blue Line station safetyand renewal improvements (“Renew the Blue”),improvements to the Steel Bridge to restore light railspeeds to 15 miles per hour, and other projects. All areimprovements that address the safety and reliability ofservice. 5 The new level of investment is reflected insubsequent years in the <strong>for</strong>ecast.Operating Facilities: The <strong>FY14</strong> <strong>Approved</strong> <strong>Budget</strong> fundsan accumulation of operating facilities replacement andrepairs. These include replacing bus maintenance hoiststhat are approaching 40 years of age, and end of lifemaintenance <strong>for</strong> the Center Street operating facility.Customer Facilities: The <strong>FY14</strong> <strong>Approved</strong> <strong>Budget</strong> providesfunds to refurbish damaged plat<strong>for</strong>m and station finishes,particularly at the Hollywood, Washington Park and SunsetTransit Centers.Non-revenue vehicles: Replacements can no longer bedeferred. The <strong>FY14</strong> <strong>Approved</strong> <strong>Budget</strong> includes $2 millionto begin an annual non-revenue vehicle fleet replacementprogram. The age of the vehicles being replaced rangesfrom 17 to 22 years.Staffing: Several Operations management positions were cutduring the recession with negative consequences. The ratio offront-line mangers to operators increased from 85 to 115.Operations management has been unable to satisfactorily addressoperator coaching, concerns attendance and per<strong>for</strong>mance. The5 The Capital Asset Management and Improvement Plan (CAMIP) is thefoundation <strong>for</strong> capital investments. It is available online athttp://trimet.org/publications/index.htm#7.Overview-4
<strong>FY14</strong> <strong>Approved</strong> <strong>Budget</strong> includes 3 additional transportationAssistant Station Managers and 1 Assistant Manager <strong>for</strong> theOperations Control Center. The anticipated outcomes will beimproved safety, customer service, attendance, and reliability ofservice.Position Control: As focus changes, non-union staffing willlikewise change. Two positions were added in Finance andAdministration. One position is grant funded, and one positionaddressed severe understaffing of revenue collection and controls.Additional positions were added <strong>for</strong> the bus stop developmentprogram, the Columbia River Crossing project, and State of GoodRepair. All the additional positions are funded with new grants.To cover the costs of additional non-union staff, such as theDeputy General Manager, other positions have been reduced,including a procurement director and an in<strong>for</strong>mation technologyposition. A 'position control' system will be established during thecontinued tight budget times.Interest Arbitration: Key to achieving long term fiscal stability isreducing the growth of active and retiree medical costs and othercompensation costs that are above market. That will requireachieving market based wages and benefits through collectivebargaining or binding arbitration.Interest Arbitration and Active and Retiree Health Benefits: Overthe last twelve years, <strong>TriMet</strong> has taken many actions to correct theunsustainable path we are on. 6 But <strong>TriMet</strong> has not fully addressed6 Actions taken can be found at http://trimet.org/publications/index.htm#7active and retiree health costs, which are significantly abovemarket. If unchecked the growth of these costs will lead to servicecuts and fare increases in just a few years.<strong>TriMet</strong>’s fully subsidized active health benefits continue intoretirement <strong>for</strong> retiree and family at age 55 after ten years of servicewith no reduction in benefits based on years of service, even afterthe retiree and spouse are eligible <strong>for</strong> Medicare.<strong>TriMet</strong>’s retiree medical benefit is 0% funded (0% of benefitsearned have been set aside to fund a trust during the working lifeof each employee). Instead, <strong>TriMet</strong> pays medical premiums ofretired employees on a pay-as-you-go (PAYGO) basis.<strong>TriMet</strong> provides 2,040 retirees and dependents with the samesubsidized medical benefits that active employees receive. By2025, just twelve years away, <strong>TriMet</strong> expects to provide 3,129retirees and dependents with retiree medical benefits, an increasein beneficiaries of more than 50%.PAYGO costs have increased 15% per year over the last ten yearsand are projected to increase at an annual compound rate of 18%over the next 10 years without a change in benefits as moreemployees retire and as health care costs increase.The total retiree medical unfunded liability post interest arbitrationis approximately $850 million. To adequately fund this debtwould require depositing $60 million a year increasing withinflation <strong>for</strong> the next thirty years in a trust. 77 Tri-County Metropolitan Transportation District of Oregon Actuarial Valuationand <strong>Review</strong> of Other Postemployment Benefits (OPEB) as of December 31,2011 in accordance with GASB Statement No. 45Overview-5
To reduce the growth of retiree medical costs to what is PAYGOaf<strong>for</strong>dable without service cuts or tax rate increases, <strong>TriMet</strong> isproposing that union active employees and retirees receive thesame health benefit plan non-union employees and retirees receiveand that retiree medical <strong>for</strong> new union hires and unvested unionemployees is limited to 50% of employee cost to age 65 only. Asof April 1, 2009, new non-union hires do not receive retireemedical benefits.Without these changes, <strong>TriMet</strong> will need to plan painful reductionsin all areas of the budget to begin in FY15.Other <strong>FY14</strong> <strong>Approved</strong> <strong>Budget</strong> ProgramsDiesel Fuel: The weighted average budgeted price in <strong>FY14</strong> is$3.45 per gallon, the same as in FY13.Debt Service: Total debt service is estimated to be $38.5 millionin <strong>FY14</strong>. $15 million of <strong>TriMet</strong>’s debt service is funded by MTIPrevenues, the regional federal flexible highway funds that arepledged to <strong>TriMet</strong>’s 2005 and 2011 Capital Grant Receipt RevenueBonds and thus have no impact on <strong>TriMet</strong>’s operating budget.Senior lien payroll tax funded debt service is 4.5% of continuingrevenues in <strong>FY14</strong>, well below the board’s standard of 7.5%.New borrowing: Depending on <strong>TriMet</strong>’s cash position, <strong>TriMet</strong>may borrow in late <strong>FY14</strong> or early FY15 <strong>for</strong> bus purchases.Issuance of these payroll tax bonds is consistent with the <strong>TriMet</strong>Board’s approved debt policy. The <strong>FY14</strong> <strong>Approved</strong> <strong>Budget</strong>assumes issuance and interest costs <strong>for</strong> a $23 million borrowinglate <strong>FY14</strong>.Columbia River Crossing: <strong>TriMet</strong>’s financial participation in theColumbia River Crossing (CRC) Project is limited to sharing theoperating costs of the extension to Vancouver with CTRAN whenthe line opens in FY19. <strong>TriMet</strong>’s share of CRC operating costswill be $1.5 million when it opens in FY19 or $1.3 million inFY13 dollars. The line will recover 40% of its costs through fares.The operating cost net of fares in FY13 dollars is $756,000 a yearabout .2% of <strong>TriMet</strong>’s FY13 budget.<strong>TriMet</strong> is not participating in the capital costs of construction andis fully reimbursed by the State of Washington and the State ofOregon <strong>for</strong> <strong>TriMet</strong> staff and consultants who work on the project.The <strong>FY14</strong> <strong>Approved</strong> <strong>Budget</strong> includes expenditures of $1.6 million<strong>for</strong> <strong>TriMet</strong> staff and consultants <strong>for</strong> the project. All costs are fullyreimbursed by a like amount of revenues. Columbia RiverCrossing costs are embedded in the Capital Projects Divisionbudget. The CRC Project address I-5 highway and bridge safety,capacity, connectivity, freight mobility, interstate travel andcommerce with highway, bridge and transit improvements,including the extension of MAX to downtown Vancouver.Revenue AssumptionsApproximately 90% of <strong>TriMet</strong>’s revenues <strong>for</strong> operations, debtservice and capital investments come from three sources—payrolltax revenues, passenger revenues and federal <strong>for</strong>mula funds.Payroll Tax Revenues: <strong>TriMet</strong> is projecting strong payroll taxrevenue growth through FY16. In FY13, underlying employerOverview-6
payroll tax revenues 8 are <strong>for</strong>ecast to increase 5.1%, 1.6% above theFY13 Adopted <strong>Budget</strong> assumption of 3.5%. For <strong>FY14</strong>, underlyingemployer payroll tax revenues are <strong>for</strong>ecast to increase 7.2%, 7.6%in FY15 and 6.9% in FY16. By comparison average annualgrowth of underlying employer payroll tax has been 5.5% over thelast twenty years.Self-employment tax revenues: Forecast to increase 10.1% inFY13, 4.9% in <strong>FY14</strong>, 6.6% in FY15, and 5.2% in FY16.Stronger revenue growth af<strong>for</strong>ds <strong>TriMet</strong> the opportunity to reducedeferred capital maintenance, increase service to meet demand,<strong>for</strong>ego a fare increase in FY2014 and put the union DB pension ona path to full funding.Passenger revenue: At approximately 25% of operating revenuein <strong>FY14</strong>, passenger fare revenue is <strong>TriMet</strong>’s second largest sourceof operating funds. In September 2012 <strong>TriMet</strong> eliminated FarelessRail and fare zones and increased cash and pass fares. Passengerrevenue is projected to increase 11% or $11 million in FY13.Ridership losses have been lower than initially expected. Bus andWES commuter rail ridership have continued to increase since thefare increase, while MAX ridership losses appear to be limited tothe Free Rail zone.Federal Formula Grants: Federal <strong>for</strong>mula funds in total constituteabout 15% of <strong>TriMet</strong>’s continuing resources <strong>for</strong> operations.In addition to approximately $50 million of Section 5307Urbanized Area and Section 5337 State of Good Repair funds,<strong>TriMet</strong> receives $15 million dollars a year in federal highwayprogram funds through the Surface Transportation Program (STP)and Congestion Mitigation & Air Quality (CMAQ) Program to pay<strong>for</strong> regional rail program debt service, passenger amenityimprovements and Regional Transportation Options.Sequestration will not impact <strong>TriMet</strong>’s FY13 or <strong>FY14</strong> federaloperating funds. Future appropriation levels when currentbalances in the Mass Transit Account are depleted in early FY15remain uncertain. The <strong>for</strong>ecast assumes that Congress continues toappropriate the amounts authorized by MAP-21 and finds longtermfunding to continue the federal transit program at MAP-21levels increased annually <strong>for</strong> inflation.MAP-21 authorized funding levels <strong>for</strong> 5307 urbanized area<strong>for</strong>mula funds are just $1 million above <strong>TriMet</strong>’s FY13 projectionlast year and just $250,000 above <strong>TriMet</strong>’s <strong>FY14</strong> projection lastyear.MAP-21 authorized funding levels <strong>for</strong> State of Good Repair fundsare $9.5 million a year higher than projected last year. Theprojected increase in State of Good Repair funds will fundaccumulated light rail maintenance that had not been fullyaddressed in the <strong>for</strong>ecast previously.Rail Construction ProgramPortland-Milwaukie Light Rail (PMLR): <strong>TriMet</strong> entered into aFull Funding Grant Agreement (FFGA) with the Federal TransitAdministration on May 22, 2012.8 Underlying payroll tax revenues exclude revenues from the annual .01% increase in thepayroll tax rate.Overview-7
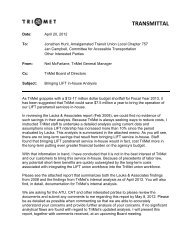
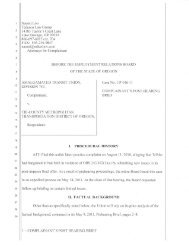
The PMLR project will cost a total of $1.49 billion, with 50% ofthe cost provided by grants from the Federal New Starts program.The project will begin service September 2015.March 1, 2013 <strong>TriMet</strong> sold $325 million of fixed rate interimfinancing bonds <strong>for</strong> the PMLR project to fund construction inadvance of receiving federal New Starts funds. The bonds arefunded by the PMLR Full Funding Grant Agreement and intereston the bonds is an eligible project cost.Sequestration is highly likely to reduce the scheduled payment offederal New Starts funds <strong>for</strong> the PMLR project. Currentprojections indicate that the capital grants funding program will bereduced 5% this fiscal year. Sequestration may reduce scheduledNew Starts funding in future years as well. The project willreceive all funds owed to it, but over a longer period. This willincrease project interim finance interest costs. Even withsequestration as the new normal, modeling demonstrates thatinterim finance interest costs are projected to be below budget.Funding <strong>for</strong> Portland-Milwaukie Project construction costs isprovided by a State grant of Lottery Bond proceeds, MTIP bondproceeds, <strong>TriMet</strong> bond proceeds, City of Portland contributions,Clackamas County and Federal Transit Administration New Startsgrants.Only 4% of the $1.49 billion project is paid <strong>for</strong> by <strong>TriMet</strong>revenues. <strong>TriMet</strong>’s share is paid <strong>for</strong> from a small portion of the tenyear increase in the payroll tax rate from .6218% to .7218%. Achart illustrating the services and <strong>TriMet</strong>’s share of projects paid<strong>for</strong> from rate increase revenues follows this <strong>Budget</strong> Message.SummationThe <strong>FY14</strong> <strong>Approved</strong> <strong>Budget</strong> adheres to the following boardpolicies:• Unrestricted ending fund balance is a minimum of 2.5months of operating expense.• Payroll tax funded debt service is below 7.5% of continuingrevenues.• Contingency is at least 3.0% of total operating expense.• Pursues board policy to bring compensation and health carebenefit cost growth in line with the growth in our revenuebase, and in line with other public agencies and transitindustry peers.The <strong>FY14</strong> <strong>Approved</strong> <strong>Budget</strong> incorporates the impact ofmanagement’s labor offer on active and retiree health benefitscosts.The <strong>FY14</strong> <strong>Approved</strong> <strong>Budget</strong> increases pension funding $4 milliona year to put the plan on a path to full funding by 2031.The <strong>FY14</strong> <strong>Approved</strong> <strong>Budget</strong> begins to restore capital investments,to reduce the backlog in bus replacements, light rail vehicleoverhauls, and maintenance of way capital repairs.At this time, <strong>TriMet</strong> faces three possible futures: 1) <strong>TriMet</strong> is ableto implement its labor contract offer 2) <strong>TriMet</strong> is unable toimplement its labor offer and has to maintain the status quo and 3)<strong>TriMet</strong> loses the January 2013 Unfair Labor Practice complaintand has to implement the 2003 Agreement or a close variation ofthe 2003 Agreement.Overview-8
In the event that 2) or 3) happen, <strong>TriMet</strong> will begin planning largeservice cuts.More service cuts are completely avoidable with changes in wagesand benefits that other public sector employees took years ago.<strong>TriMet</strong> is committed to staying on course to get the fiscally stablefuture we need and want to keep our commitments to ouremployees, retirees, customers and payroll taxpayers long term.The following chart illustrates the new services that are and will bepaid <strong>for</strong> by the increase in the payroll tax rate from .6218% to.7218% between January 1, 2005 and January 1, 2014.FY16 Payroll Tax Rate Increase ExpendituresBus and RailReliability <strong>FY14</strong>‐FY16$4,819,88611%CapitalImprovements$4,000,0009%Debt Service <strong>for</strong><strong>TriMet</strong>'s Share ofRailConstruction*$8,529,78119%March 2013Portland toMilwaukieOperating Costs$4,545,49010%Streetcar toRiverplace, Gibbs,Lowell, OMSI$2,050,0005% LIFT$8,217,18418%Green LineOperating Costs$6,024,46013%WES OperatingCosts$6,811,03715%* includes Green and Orange Line MAX and WESoperating costs are net of faresOverview-9
<strong>TriMet</strong> Organization Chart: 2013-2014 <strong>Approved</strong> <strong>Budget</strong>General ManagerDiversity & TransitEquityDept.Internal AuditDept.Public AffairsDivisionSafety & SecurityDivisionIn<strong>for</strong>mationTechnology DivisionFinance &AdministrationDivisionLabor Relations& Human ResourcesDivisionLegal ServicesDivisionOperationsDivisionCapital ProjectsDivisionAdministrationDept.Safety, Security &Environmental ServicesDept.AdministrationDept.Administration &Business PartneringDept.Administration& SupportDept.Bus MaintenanceDept.AdministrationDept.Planning & PolicyDept.Financial ServicesDept.Labor RelationsDept.Bus TransportationDept.Facilities MgmtDept.Bus Stop DevelopmentDept.Government AffairsDept.<strong>Budget</strong>, FinancialAnalysis & GrantsAdministrationCompensation,Benefits& HRIS Dept.SchedulingDept.Rail TransportationDept.Development& Operations SupportDept.CommunicationsDept.Risk ManagementDept.Field OperationsDept.Rail Maintenanceof WayDept.Columbia RiverCrossingDept.Customer In<strong>for</strong>mationServicesDept.Procurement& ContractsDept.TransportationPlanningDept.Rail EquipmentMaintenanceDept.Fare RevenueDept.ATP/LIFTDept.Commuter RailDept.ATP/MTPDept.StreetcarDept.Overview-10
GENERAL FUND RESOURCE SUMMARYLine Actual Actual <strong>Budget</strong> Estimate <strong>Budget</strong> % Change % Change % of TotalNo. Revenue Category 10/11 11/12 12/13 12/13 13/14 <strong>Budget</strong> Estimated ResourcesBeginning Fund Balance as of July 1*1. Restricted Bond Proceeds & Other Restricted $ 87,440,987 $ 202,004,925 $ 31,300,000 $ 52,008,461 $ 34,406,711 9.93% -39.82% 2.63%2. Restricted Debt Service 20,880,542 19,844,781 22,955,000 23,249,134 29,000,000 26.33% -1.27% 1.93%3. Unrestricted 94,300,000 60,000,000 85,031,751 104,614,172 99,851,302 17.43% -4.55% 8.39%4. Total Beginning Fund Balance $ 202,623,970 $ 281,849,706 $ 139,286,751 $ 179,871,768 $ 163,258,013 17.21% -9.24% 13.72%Operating Revenue5. Passenger $ 96,889,626 $ 102,240,638 $ 115,100,000 $ 113,352,558 $ 119,645,098 3.95% 5.55% 10.05%6. Advertising 5,064,670 5,435,193 5,674,500 5,624,500 3,040,125 -46.42% -45.95% 0.26%7. Accessible Transportation Contract 3,462,201 3,058,145 2,605,706 2,537,609 2,537,609 -2.61% 0.00% 0.21%8. Service Contracts 23,719,464 24,335,846 22,461,921 22,102,171 25,083,085 11.67% 13.49% 2.11%9. Total Operating Revenue $ 129,135,961 $ 135,069,822 $ 145,842,127 $ 143,616,838 $ 150,305,917 3.06% 4.66% 12.63%Tax Revenue10. Employer Payroll** $ 211,280,445 $ 232,755,616 $ 230,598,208 $ 241,982,252 $ 263,540,039 14.29% 8.91% 22.14%11. Self-Employed** 10,918,507 12,450,843 11,081,117 12,602,270 13,385,057 20.79% 6.21% 1.12%12. State "In Lieu"** 2,659,117 2,871,517 2,778,655 2,791,584 3,056,784 10.01% 9.50% 0.26%13. Total Tax Revenue $ 224,858,069 $ 248,077,976 $ 244,457,980 $ 257,376,106 $ 279,981,881 14.53% 8.78% 23.52%Other Revenue14. Urbanized Area Formula Funds $ 39,284,476 $ 89,840,966 $ 32,508,374 $ 33,600,000 $ 33,600,000 3.36% 0.00% 2.82%15. Prior Year Carryover 9,088,881 8,243,663 -100.00% -100.00% 0.00%16. Rail State of Good Repair Funds 6,820,975 16,400,000 16,600,000 143.37% 1.22% 1.39%17. Prior Year Carryover 2,281,080 4,172,123 -100.00% -100.00% 0.00%18. MTIP Funds <strong>for</strong> Regional Rail Debt Service 13,000,000 13,000,000 15,000,000 15.38% 15.38% 1.26%19. Fund Exchange Revenue 10,138,500 10,139,000 3,077,270 -69.65% -69.65% 0.26%20. Other Federal Operating Grants 5,303,642 5,111,557 5,998,321 13.10% 17.35% 0.50%21. State Operating Grants 1,972,327 1,903,397 728,987 728,987 470,000 -35.53% -35.53% 0.04%22. Local Operating Grants 3,173,337 1,085,000 1,072,013 1,627,236 49.98% 51.79% 0.14%23. Columbia River Crossing 1,236,956 601,693 1,604,692 29.73% 166.70% 0.13%24. Interest 774,899 516,154 350,000 300,000 500,000 42.86% 66.67% 0.04%25. Miscellaneous 3,616,210 2,270,104 4,168,089 4,076,906 4,252,114 2.02% 4.30% 0.36%26. Total Other Revenue $ 45,647,912 $ 97,703,958 $ 86,710,483 $ 97,445,942 $ 82,729,633 -4.59% -15.10% 6.95%Total Operating Resources27. (Excluding Beginning Fund Balance) 399,641,942 480,851,756 $ 477,010,590 $ 498,438,885 $ 513,017,431 7.55% 2.92% 43.10%Financial Summary-1
GENERAL FUND RESOURCE SUMMARYLine Actual Actual <strong>Budget</strong> Estimate <strong>Budget</strong> % Change % Change % of TotalNo. Revenue Category 10/11 11/12 12/13 12/13 13/14 <strong>Budget</strong> Estimated Resources28. Capital Program Resources $ 25,196,622 $ 5,436,803 $ 82,747,298 $ 54,152,951 $ 66,202,868 -19.99% 22.25% 5.56%29. Light Rail Program Resources 218,191,926 129,138,256 444,464,061 368,443,773 439,640,843 -1.09% 19.32% 36.94%30. Other Non-Operating Resources 74,389,336 37,008,545 12,641,634 6,210,770 5,896,809 -53.35% -5.06% 0.50%31. Transfer from G.O. Bond Fund 2,200,000 100.00% 0.00% 0.18%32. Total Resources $ 920,043,796 $ 934,285,066 $ 1,156,150,333 $ 1,107,118,146 $ 1,190,215,964 2.95% 7.51% 100.00%* <strong>Budget</strong>ary Fund Balance. Restricted funds include funds withdrawn by the bond Trustee(s) to pay debt service, plus bond proceeds and other resources designated <strong>for</strong> specific projects.Unrestricted funds are resources maintained to cover cash flow until tax and grant revenues are collected.** <strong>Budget</strong>ed payroll tax revenues are an estimate of fiscal year payroll tax cash receipts. Actuals are an estimate of payroll taxes from wages and salaries earned in the fiscal year.Financial Summary-2
GENERAL FUND REQUIREMENT SUMMARYLine Actual Actual <strong>Budget</strong> Estimate <strong>Budget</strong> % Change % Change % of TotalNo. Division/Department 10/11 11/12 12/13 12/13 13/14 <strong>Budget</strong>* Estimated* RequirementsOffice of the General Manager Division1. Office of the General Manager $ 947,663 $ 886,628 $ 1,035,548 $ 904,225 $ 1,248,704 20.58% 38.10% 0.10%2. Diversity and Transit Equity 212,126 240,119 245,471 247,561 234,834 -4.33% -5.14% 0.02%3. Internal Audit 233,475 230,531 233,530 232,286 240,217 2.86% 3.41% 0.02%4. Total Office of the General Manager $ 1,393,264 $ 1,357,278 $ 1,514,548 $ 1,384,072 $ 1,723,756 13.81% 24.54% 0.14%Public Affairs Division5. Administration $ 191,696 $ 295,599 $ 298,225 $ 300,098 1.52% 0.63% 0.03%6. Operating Projects $ 569,69185,000 85,000 260,000 205.88% 205.88% 0.02%7. Planning & Policy 450,017 918,351 1,307,503 1,328,783 2,746,379 110.05% 106.68% 0.23%8. Government Affairs 706,945 644,206 409,205 412,951 427,083 4.37% 3.42% 0.04%9. Communications 283,298 383,034 539,078 552,539 619,450 14.91% 12.11% 0.05%10. Organization Development 395,214 392,389 0.00% 0.00% 0.00%11. Customer In<strong>for</strong>mation Services 6,463,525 6,649,239 5,669,398 5,739,378 5,920,624 4.43% 3.16% 0.50%12. Total Public Affairs $ 8,868,690 $ 9,178,914 $ 8,305,783 $ 8,416,878 $ 10,273,634 23.69% 22.06% 0.86%Safety & Security Division13. Safety, Security and Environmental Services $ 10,194,329 $ 11,501,145 $ 12,996,090 $ 13,028,721 $ 14,152,161 8.90% 8.62% 1.19%14. Operating Projects 439,000 288,572 573,999 30.75% 98.91% 0.05%15. Total Safety & Security $ 10,194,329 $ 11,501,145 $ 13,435,090 $ 13,317,293 $ 14,726,160 9.61% 10.58% 1.24%In<strong>for</strong>mation Technology Division16. In<strong>for</strong>mation Technology $ 6,721,730 $ 6,534,582 $ 6,735,689 $ 6,850,556 $ 7,082,950 5.16% 3.39% 0.60%17. Operating Projects 320,857 447,721 544,800 546,201 650,600 19.42% 19.11% 0.05%18. Total In<strong>for</strong>mation Technology $ 7,042,587 $ 6,982,303 $ 7,280,489 $ 7,396,757 $ 7,733,550 6.22% 4.55% 0.65%Finance & Administration Division19. Administration $ 1,253,520 $ 1,305,274 $ 1,471,166 $ 1,481,408 $ 1,629,814 10.78% 10.02% 0.14%20. Operating Projects 350,000 650,000 65,200 -81.37% -89.97% 0.01%21. Financial Services 3,260,955 1,635,969 3,028,542 3,017,688 2,142,959 -29.24% -28.99% 0.18%22. <strong>Budget</strong>, Financial Analysis & Grants Administration 2,240,312 2,554,939 2,706,391 2,724,857 3,737,505 38.10% 37.16% 0.31%23. Risk Management 502,587 515,279 494,834 501,345 501,858 1.42% 0.10% 0.04%24. Procurement & Contracts 964,479 1,012,089 1,180,643 1,163,305 1,034,755 -12.36% -11.05% 0.09%25. Fare Revenue 1,924,618 2,620,307 2,613,877 6,240,751 138.17% 138.75% 0.52%26. Total Finance & Administration $ 8,221,853 $ 8,948,167 $ 11,851,883 $ 12,152,480 $ 15,352,842 29.54% 26.34% 1.29%Financial Summary-3
GENERAL FUND REQUIREMENT SUMMARYLine Actual Actual <strong>Budget</strong> Estimate <strong>Budget</strong> % Change % Change % of TotalNo. Division/Department 10/11 11/12 12/13 12/13 13/14 <strong>Budget</strong>* Estimated* RequirementsLabor Relations & Human Resources Division27. Administration & Business Partnering $ 784,435 $ 1,175,665 $ 1,299,114 $ 1,346,404 $ 1,622,297 24.88% 20.49% 0.14%28. Labor Relations 375,501 386,678 389,228 3.66% 0.66% 0.03%29. Compensation, Benefits & HRIS 965,865 1,097,646 1,278,125 1,336,597 1,134,455 -11.24% -15.12% 0.10%30. Total Labor Relations & Human Resources $ 1,750,300 $ 2,273,311 $ 2,952,739 $ 3,069,679 $ 3,145,979 6.54% 2.49% 0.26%Legal Services Division31. Legal Services $ 1,604,187 $ 1,500,540 $ 1,617,543 $ 1,642,919 $ 1,737,908 7.44% 5.78% 0.15%32. Total Legal Services $ 1,604,187 $ 1,500,540 $ 1,617,543 $ 1,642,919 $ 1,737,908 7.44% 5.78% 0.15%Operations Division33. Administration & Support $ 4,575,708 $ 5,210,643 $ 4,650,458 $ 4,670,150 $ 4,996,630 7.44% 6.99% 0.42%34. Operating Projects 3,028,428 2,250,221 3,268,346 3,400,012 3,744,287 14.56% 10.13% 0.31%35. Bus Transportation 96,777,901 98,604,569 100,916,945 104,159,660 102,943,369 2.01% -1.17% 8.65%36. Scheduling 1,108,619 1,113,702 1,124,388 1,125,193 1,119,672 -0.42% -0.49% 0.09%37. Field Operations 11,636,169 12,511,236 14,192,145 14,192,666 14,659,600 3.29% 3.29% 1.23%38. Transportation Planning 1,276,364 1,191,794 1,333,834 1,071,854 1,525,441 14.37% 42.32% 0.13%39. Accessible Transportation Programs-LIFT 30,887,657 31,744,162 32,306,103 32,295,055 32,525,924 0.68% 0.71% 2.73%40. Accessible Transportation Programs-MTP 16,153,402 17,041,276 16,888,809 17,573,974 19,788,033 17.17% 12.60% 1.66%41. Bus Maintenance 50,891,212 54,428,462 56,805,153 56,177,901 56,768,422 -0.06% 1.05% 4.77%42. Facilities Management 15,282,135 14,791,697 14,323,115 14,736,708 14,723,168 2.79% -0.09% 1.24%43. Rail Transportation 15,343,125 15,905,289 16,407,195 16,811,549 16,829,969 2.58% 0.11% 1.41%44. Rail Maintenance of Way 14,313,603 15,139,263 15,687,962 15,298,127 14,026,225 -10.59% -8.31% 1.18%45. Rail Equipment Maintenance 17,931,582 20,921,310 20,384,325 21,197,957 24,854,594 21.93% 17.25% 2.09%46. Commuter Rail 5,874,938 6,078,098 6,424,306 6,415,916 6,560,396 2.12% 2.25% 0.55%47. Streetcar 5,799,568 6,171,592 9,323,096 9,323,096 9,688,028 3.91% 3.91% 0.81%48. Total Operations $ 290,880,411 $ 303,103,315 $ 314,036,182 $ 318,449,818 $ 324,753,756 3.41% 1.98% 27.29%Capital Projects Division49. Administration $ 353,448 $ 385,874 $ 391,548 $ 394,228 $ 400,634 2.32% 1.62% 0.03%50. Operating Projects 4,758,412 684,058 2,816,838 1,065,817 5,703,667 102.48% 435.15% 0.48%51. Bus Stop Development 845,454 674,641 1,045,441 1,158,372 986,749 -5.61% -14.82% 0.08%52. Development & Operations Support 3,659,438 6,906,911 11,105,253 10,228,403 2,550,777 -77.03% -75.06% 0.21%53. Columbia River Crossing 1,177,811 601,693 1,551,213 31.70% 157.81% 0.13%54. Total Capital Projects $ 9,616,753 $ 8,651,484 $ 16,536,891 $ 13,448,513 $ 11,193,040 -32.31% -16.77% 0.94%Financial Summary-4
GENERAL FUND REQUIREMENT SUMMARYLine Actual Actual <strong>Budget</strong> Estimate <strong>Budget</strong> % Change % Change % of TotalNo. Division/Department 10/11 11/12 12/13 12/13 13/14 <strong>Budget</strong>* Estimated* Requirements55. OPEB & UAAL Pension $ 41,603,359 $ 45,542,084 $ 47,758,079 $ 50,353,324 $ 57,296,402 19.97% 13.79% 4.81%56. Debt Service $ 24,989,546 $ 23,702,971 $ 48,177,780 $ 48,096,687 $ 38,471,976 -20.15% -20.01% 3.23%57. Total Operating Requirements $ 406,165,279 $ 422,741,516 $ 473,467,007 $ 477,728,418 $ 486,409,003 2.73% 1.82% 40.87%58. Capital Program $ 27,656,818 $ 27,575,635 $ 105,383,491 $ 64,187,683 $ 91,878,593 -12.82% 43.14% 7.72%59. Light Rail Program 86,891,317 225,630,574 446,410,689 393,934,861 439,640,843 -1.52% 11.60% 36.94%60. Pass Through Requirements 74,389,336 37,008,545 12,641,634 6,210,770 5,896,809 -53.35% -5.06% 0.50%61. Project Interim Financing 43,091,339 41,457,029 1,798,403 -100.00% 0.00%62. Contingency 20,000,000 14,592,270 -27.04% 1.23%Ending Fund Balance as of June 30*63. Restricted Bond Proceeds & Other Restricted 202,004,925 52,008,461 8,000,000 34,406,711 8,000,000 0.00% -76.75% 0.67%64. Restricted Debt Service 19,844,781 23,249,134 28,696,820 29,000,000 37,000,000 28.93% 27.59% 3.11%65. Unrestricted 60,000,000 104,614,172 61,550,692 99,851,302 106,798,445 73.51% 6.96% 8.97%66. Total Ending Fund Balance 281,849,706 179,871,768 98,247,512 163,258,013 151,798,445 54.51% -7.02% 12.75%67. Total Requirements $ 920,043,796 $ 934,285,066 $ 1,156,150,333 $ 1,107,118,146 $ 1,190,215,964 2.95% 7.51% 100.00%* <strong>Budget</strong>ary Fund Balance. Restricted funds include funds withdrawn by the Trustee to pay debt service, plus bond proceeds and other resources designated <strong>for</strong> specific projects.Unrestricted funds are resources maintained to cover cash flow until tax and grant revenues are collected.Financial Summary-5
EXTERNAL CAPITAL PROGRAM RESOURCESLine Actual Actual <strong>Budget</strong> Estimate <strong>Budget</strong>No. 10/11 11/12 12/13 12/13 13/141. Beginning Fund Balance $ 36,406,7112. State, local government & private contributions $ 9,725,168 $ 3,209,8853. Federal Transit Administration grants 8,652,501 2,226,918 $ 22,819,046 $ 19,559,662 8,651,1574. New money revenue bond proceeds & short term financing 6,818,953 59,928,252 34,593,289 21,145,0005. Operating resources required <strong>for</strong> capital program 3,698,901 10,967,494 22,636,193 10,034,732 25,675,7256. Total External General Fund Fund Resource $ 28,895,523 $ 16,404,297 $ 105,383,491 $ 64,187,683 $ 91,878,593Financial Summary-6
CAPITAL PROGRAM REQUIREMENTSLine Actual Actual <strong>Budget</strong> Estimate <strong>Budget</strong> % of TotalNo. 10/11 11/12 12/13 12/13 13/14 Requirements1. Public Affairs Division $ 487,000 $ 487,000 $ 100,0000.11%2. Safety & Security Division 308,727 158,727 1,310,124 1.43%3. In<strong>for</strong>mation Technology Division $ 6,973,431 $ 15,914,572 29,863,945 26,784,281 6,903,899 7.51%4. Finance & Administration Division 7,347 370,000 185,000 3,769,381 4.10%5. Legal Services Division 50,000 50,000 - 0.00%6. Operations Division 8,045,601 9,194,752 62,902,494 33,328,656 64,069,311 69.73%7. Capital Projects Division 12,637,786 2,458,964 11,401,325 3,194,019 15,725,878 17.12%8. Total capital project requirements $ 27,656,818 $ 27,575,635 $ 105,383,491 $ 64,187,683 $ 91,878,593100.00%Financial Summary-7
EXTERNAL LIGHT RAIL PROGRAM RESOURCESLine Actual Actual <strong>Budget</strong> Estimate <strong>Budget</strong>No. 10/11 11/12 12/13 12/13 13/141. State, local government & private contributions $ 63,657,708 $ 22,738,257 $ 211,983,067 $ 207,429,939 $ 24,755,0882. Contributed ROW 19,264,1003. Revenue bond proceeds 132,371,977 40,000,000 40,000,0004. Federal Transit Administration grants 21,399,9995. Federal New Starts Grants 85,000,000 132,626,785 100,000,000 100,000,0006. Local interest 2,898,141 20,000,000 16,997,527 17,143,9277. Interim Financing 39,854,209 4,016,307 297,741,8288. Operating Resources or Bond Proceeds in Fund Balance 25,491,0889. Total Resources $ 218,191,926 $ 129,138,256 $ 444,464,061 $ 393,934,861 $ 439,640,843WILSONVILLE TO BEAVERTON COMMUTER RAIL PROJECT RESOURCESLine Actual Actual <strong>Budget</strong> Estimate <strong>Budget</strong>No. 10/11 11/12 12/13 12/13 13/141. State, local government & private contributions $ 137,4422. Total Project Resources $ 137,442PORTLAND-MILWAUKIE LIGHT RAIL PROJECT RESOURCESLine Actual Actual <strong>Budget</strong> Estimate <strong>Budget</strong>No. 10/11 11/12 12/13 12/13 13/141. State and local government contributions $ 63,657,708 $ 22,600,815 $ 211,983,067 $ 207,429,939 $ 24,755,0882. Revenue Bond Proceeds 132,371,977 40,000,000 40,000,0003. Contributed ROW 19,264,1004. Federal Transit Administration (not New Starts) Grants 21,399,9995. Federal New Starts Grants 85,000,000 132,626,785 100,000,000 100,000,0006. Local interest 2,898,141 20,000,000 16,997,527 17,143,9277. Interim Financing 39,854,209 4,016,307 297,741,8288. Total Project Resources $ 218,191,926 $ 129,000,814 $ 444,464,061 $ 368,443,773 $ 439,640,843Financial Summary-8
LIGHT RAIL PROGRAM REQUIREMENTSLine Actual Actual <strong>Budget</strong> Estimate <strong>Budget</strong>No. 10/11 11/12 12/13 12/13 13/141. South Corridor Project $ 1,341,338 $ 2,136,194 $ 1,946,628 $ 736,0002. Portland-Milwaukie Light Rail Project 85,549,979 223,494,380 444,464,061 393,198,861 $ 439,640,8433. Total light rail program requirements $ 86,891,317 $ 225,630,574 $ 446,410,689 $ 393,934,861 $ 439,640,843Financial Summary-9
G. O. BOND DEBT SERVICE FUNDLine Actual Actual <strong>Budget</strong> Estimate <strong>Budget</strong>No. 10/11 11/12 12/13 12/13 13/14Resources1. Beginning Fund Balance $ 9,432,000 $ 14,288,264 $ 10,901,873 $ 11,776,763 $ 1,965,6232. Previously Levied Taxes - Estimated to be Received 438,000 481,430 225,330 225,330 234,3773. Other Resources 4,149,0004. Earnings from Temporary Investments 49,000 19,761 20,000 20,0005. Total Resources Except <strong>for</strong> Taxes $ 14,068,000 $ 14,789,455 $ 11,147,203 $ 12,022,093 $ 2,200,0006. Taxes Necessary to Balance 10,259,000 7,006,9447. Total Resources $ 24,327,000 $ 21,796,399 $ 11,147,203 $ 12,022,093 $ 2,200,000RequirementsGeneral Obligation Refunding Bonds (Light Rail Extension)1999 Series A8. Redemption of Principal $ 8,845,000 $ 9,315,000 $ 9,800,000 $ 9,800,0009. Interest Expense 1,194,000 704,636 256,470 256,47010. Unappropriated Ending Fund Balance 14,288,000 11,776,763 1,090,733 1,965,62311. Transfer to General Fund $ 2,200,00012. Total Requirements $ 24,327,000 $ 21,796,399 $ 11,147,203 $ 12,022,093 $ 2,200,000Last property tax assessment <strong>for</strong> Westside bonds was November 2011.Financial Summary-10
SUMMARY OF FUND HISTORYActual Actual <strong>Budget</strong> General Fund Proposed <strong>Approved</strong> Adopted10/11 11/12 12/13 13/14 13/14 13/14I. Operating ProgramA. Resources$ 202,623,970 $ 281,849,706 $ 139,286,751Beginning Fund Balance-Restricted and Unrestricted $ 165,240,108 $ 163,258,01396,889,626 102,240,638 115,100,000 Passenger Revenue 119,645,098 119,645,09832,246,335 32,829,184 30,742,127 Other Operating Revenue 30,660,819 30,660,819224,858,069 248,077,976 244,457,980 Tax Revenue 279,981,881 279,981,88145,647,912 97,703,958 86,710,483 Other Revenue 82,729,633 82,729,63374,389,336 37,008,545 12,641,634 Other Non-Operating Resources 5,896,809 5,896,809Transfer from G.O. Bond Fund 2,200,000$ 676,655,248 $ 799,710,007 $ 628,938,975Total Operating Program Resources $ 684,154,348 $ 684,372,253B. Requirements$ 252,824,986 $ 265,291,296 $ 275,499,407Personnel Services $ 287,406,463 $ 292,833,138128,350,749 133,747,249 149,789,820 Materials & Services 159,118,346 155,103,89024,989,546 23,702,971 48,177,780 Debt Service 38,471,976 38,471,97674,389,336 37,008,545 12,641,634 Pass Through Requirements 5,896,809 5,896,80943,091,339 41,457,029 Project Interim Financing20,000,000 Contingency 14,549,904 14,592,270281,849,706 179,871,768 98,247,512 Ending Fund Balance-Restricted and Unrestricted 152,410,126 151,798,445$ 805,495,663 $ 681,078,857 $ 604,356,153Total Operating Program Requirements $ 657,853,624 $ 658,696,528II. Capital ProgramA. Resources$ 9,725,168 $ 3,209,885State, Local Government & Private Contributions8,652,501 2,226,918 $ 22,819,046Federal Transit Administration Grants $ 8,651,157 $ 8,651,1576,818,953 59,928,252 Revenue Bond Proceeds and Short Term Financing 57,551,711 57,551,711$ 25,196,622 $ 5,436,803 $ 82,747,298Total Capital Program Resources $ 66,202,868 $ 66,202,868B. Requirements$ 27,656,818 $ 27,575,635 $ 105,383,491Projects $ 92,503,593 $ 91,878,593$ 27,656,818 $ 27,575,635 $ 105,383,491Total Capital Program Requirements $ 92,503,593 $ 91,878,593Financial Summary-11
SUMMARY OF FUND HISTORYActual Actual <strong>Budget</strong> General Fund Proposed <strong>Approved</strong> Adopted10/11 11/12 12/13 13/14 13/14 13/14III. Light Rail ProgramA. Resources$ 132,371,977$ 40,000,000<strong>TriMet</strong> Revenue Bond Proceeds19,264,100 Contributed ROW63,657,708 $ 22,738,257 211,983,067 State, Local Government & Private Contributions $ 24,755,088 $ 24,755,088106,399,999 132,626,785 Federal Transit Administration Grants 100,000,000 100,000,0002,898,141 20,000,000 Local Interest 17,143,927 17,143,92739,854,209 Interim Financing 297,983,435 297,741,828$ 218,191,926 $ 129,138,256 $ 444,464,061Total Light Rail Program Resources $ 439,882,450 $ 439,640,843B. Requirements$ 1,341,338 $ 2,136,194 $ 1,946,628South Corridor Project85,549,979 223,494,380 444,464,061 Portland-Milwaukie Light Rail Project $ 439,882,450 $ 439,640,843$ 86,891,317 $ 225,630,574 $ 446,410,689Total Light Rail Program Requirements $ 439,882,450 $ 439,640,843$ 920,043,796 $ 934,285,066 $ 1,156,150,333 Total General Fund Resources $ 1,190,239,666 $ 1,190,215,964$ 920,043,796 $ 934,285,066 $ 1,156,150,333 Total General Fund Requirements $ 1,190,239,666 $ 1,190,215,964G. O. Bond Debt Service FundI. G. O. Bond Debt Service FundA. Resources$ 9,432,000 $ 14,288,264 $ 10,901,873Beginning Fund Balance $ 1,965,623438,000 481,430 225,330 Previously Levied Taxes 234,3774,149,000 Other Resources49,000 19,761 20,000 Earnings from Investments10,259,000 7,006,944 Taxes Necessary to Balance$ 24,327,000 $ 21,796,399 $ 11,147,203Total G. O. Bond Debt Service Fund Resources $ 2,200,000B. Requirements$ 8,845,000 $ 9,315,000 $ 9,800,000Redemption of Principal1,194,000 704,636 256,470 Interest Expense14,288,000 11,776,763 1,090,733 Unappropriated Ending Fund BalanceTransfer Unappropriated Ending Fund Balance to General Fund 2,200,000$ 24,327,000 $ 21,796,399 $ 11,147,203Total G. O. Bond Debt Service Fund Requirements $ 2,200,000Financial Summary-12
PASS THROUGH REVENUES AND REQUIREMENTSLine Actual Actual <strong>Budget</strong> Estimate <strong>Budget</strong> % Change % of TotalNo. 10/11 11/12 12/13 12/13 13/14 <strong>Budget</strong> Resources1. Elderly and Disabled Special Transportation Fund Formula $ 2,080,052 $ 2,499,900 $ 3,100,000 $ 2,086,136 $ 2,086,136 -32.71% 35.38%Discretionary E and D2. Ride Connection State 5310 343,544 (16,668) 310,000 310,000 -100.00% 0.00%3. Title XIX Match Washington & Clackamas 379,882 368,324 300,000 300,000 255,000 -15.00% 4.32%4. Ride Connection Vehicles 643,108 (42,732) 0.00%5. Ride Connection Community Resource Center 750,000 750,000 -100.00% 0.00%Ride Connection Veteran's Grant 133,000 133,000 100.00% 2.26%Ride Connection FTA Livability <strong>for</strong> Resource Center 2,000,000 100.00% 33.92%6. Elderly and Disabled Special Transportation Operating 632,088 375,145 0.00%7. Tacoma Street Project 1,114,454 1,114,454 -100.00% 0.00%Portland Streetcar8. Streetcar 5312 Prototype Grant 482,171 1,707,693 1,000,000 450,000 450,000 -55.00% 7.63%9. Streetcar 5312 Vehicle Domestic Manufacture Grant 490,000 0.00%10. Streetcar 5309 Small Starts Grant 61,204,656 14,415,703 5,000,000 -100.00% 0.00%11. Streetcar ARRA STP Capital Grant 224,888 131,944 0.00%Streetcar STP Sitework 972,673 100.00% 16.49%SW Moody Street & Streetcar Reconstruction12. Moody TIGER Grant 7,908,948 15,295,050 0.00%13. Moody Section 112 STP Grant 2,019,783 0.00%14. Moody TCSP Earmark Grant 254,402 94,507 94,507 -100.00% 0.00%15. Moody STP Grant 972,673 972,673 -100.00% 0.00%16. Total pass through revenues and requirements $ 74,389,336 $ 37,008,545 $ 12,641,634 $ 6,210,770 $ 5,896,809 -53.35% 100.00%Financial Summary-13
[This Page Left Intentionally Blank]Financial Summary‐14
GENERAL FUND RESOURCES<strong>Budget</strong> 13/14Payroll Taxes$279,981,881 (27.32%)Other Sources$34,912,933 (3.41%)Light Rail Program$439,640,843 (42.90%)Federal Grants$74,275,591 (7.25%)Interest$500,000 (0.05%)Passenger Revenue$119,645,098 (11.68%)Other Non-Operating$5,896,809 (0.58%)Local Grants$1,627,236 (0.16%)Total Resources = $1,024,757,951**Resources exclude Beginning Fund Balance of $163,258,013and G.O. Bond Unappropriated Ending Balance of $2,200,000.Capital Program$66,202,868 (6.46%)State Grants$2,074,692 (0.20%)Resources-1
GENERAL FUND RESOURCE SUMMARYLine Actual Actual <strong>Budget</strong> Estimate <strong>Budget</strong> % Change % Change % of TotalNo. Revenue Category 10/11 11/12 12/13 12/13 13/14 <strong>Budget</strong> Estimated ResourcesBeginning Fund Balance as of July 1*1. Restricted Bond Proceeds & Other Restricted $ 87,440,987 $ 202,004,925 $ 31,300,000 $ 52,008,461 $ 34,406,711 9.93% -39.82% 2.63%2. Restricted Debt Service 20,880,542 19,844,781 22,955,000 23,249,134 29,000,000 26.33% -1.27% 1.93%3. Unrestricted 94,300,000 60,000,000 85,031,751 104,614,172 99,851,302 17.43% -4.55% 8.39%4. Total Beginning Fund Balance $ 202,623,970 $ 281,849,706 $ 139,286,751 $ 179,871,768 $ 163,258,013 17.21% -9.24% 13.72%Operating Revenue5. Passenger $ 96,889,626 $ 102,240,638 $ 115,100,000 $ 113,352,558 $ 119,645,098 3.95% 5.55% 10.05%6. Advertising 5,064,670 5,435,193 5,674,500 5,624,500 3,040,125 -46.42% -45.95% 0.26%7. Accessible Transportation Contract 3,462,201 3,058,145 2,605,706 2,537,609 2,537,609 -2.61% 0.00% 0.21%8. Service Contracts 23,719,464 24,335,846 22,461,921 22,102,171 25,083,085 11.67% 13.49% 2.11%9. Total Operating Revenue $ 129,135,961 $ 135,069,822 $ 145,842,127 $ 143,616,838 $ 150,305,917 3.06% 4.66% 12.63%Tax Revenue10. Employer Payroll** $ 211,280,445 $ 232,755,616 $ 230,598,208 $ 241,982,252 $ 263,540,039 14.29% 8.91% 22.14%11. Self-Employed** 10,918,507 12,450,843 11,081,117 12,602,270 13,385,057 20.79% 6.21% 1.12%12. State "In Lieu"** 2,659,117 2,871,517 2,778,655 2,791,584 3,056,784 10.01% 9.50% 0.26%13. Total Tax Revenue $ 224,858,069 $ 248,077,976 $ 244,457,980 $ 257,376,106 $ 279,981,881 14.53% 8.78% 23.52%Other Revenue14. Urbanized Area Formula Funds $ 39,284,476 $ 89,840,966 $ 32,508,374 $ 33,600,000 $ 33,600,000 3.36% 0.00% 2.82%15. Prior Year Carryover 9,088,881 8,243,663 -100.00% -100.00% 0.00%16. Rail State of Good Repair Funds 6,820,975 16,400,000 16,600,000 143.37% 1.22% 1.39%17. Prior Year Carryover 2,281,080 4,172,123 -100.00% -100.00% 0.00%18. MTIP Funds <strong>for</strong> Regional Rail Debt Service 13,000,000 13,000,000 15,000,000 15.38% 15.38% 1.26%19. Fund Exchange Revenue 10,138,500 10,139,000 3,077,270 -69.65% -69.65% 0.26%20. Other Federal Operating Grants 5,303,642 5,111,557 5,998,321 13.10% 17.35% 0.50%21. State Operating Grants 1,972,327 1,903,397 728,987 728,987 470,000 -35.53% -35.53% 0.04%22. Local Operating Grants 3,173,337 1,085,000 1,072,013 1,627,236 49.98% 51.79% 0.14%23. Columbia River Crossing 1,236,956 601,693 1,604,692 29.73% 166.70% 0.13%24. Interest 774,899 516,154 350,000 300,000 500,000 42.86% 66.67% 0.04%25. Miscellaneous 3,616,210 2,270,104 4,168,089 4,076,906 4,252,114 2.02% 4.30% 0.36%26. Total Other Revenue $ 45,647,912 $ 97,703,958 $ 86,710,483 $ 97,445,942 $ 82,729,633 -4.59% -15.10% 6.95%Total Operating Resources27. (Excluding Beginning Fund Balance) 399,641,942 480,851,756 $ 477,010,590 $ 498,438,885 $ 513,017,431 7.55% 2.92% 43.10%Resources-2
GENERAL FUND RESOURCE SUMMARYLine Actual Actual <strong>Budget</strong> Estimate <strong>Budget</strong> % Change % Change % of TotalNo. Revenue Category 10/11 11/12 12/13 12/13 13/14 <strong>Budget</strong> Estimated Resources28. Capital Program Resources $ 25,196,622 $ 5,436,803 $ 82,747,298 $ 54,152,951 $ 66,202,868 -19.99% 22.25% 5.56%29. Light Rail Program Resources 218,191,926 129,138,256 444,464,061 368,443,773 439,640,843 -1.09% 19.32% 36.94%30. Other Non-Operating Resources 74,389,336 37,008,545 12,641,634 6,210,770 5,896,809 -53.35% -5.06% 0.50%31. Transfer from G.O. Bond Fund 2,200,000 100.00% 0.00% 0.18%32. Total Resources $ 920,043,796 $ 934,285,066 $ 1,156,150,333 $ 1,107,118,146 $ 1,190,215,964 2.95% 7.51% 100.00%* <strong>Budget</strong>ary Fund Balance. Restricted funds include funds withdrawn by the bond Trustee(s) to pay debt service, plus bond proceeds and other resources designated <strong>for</strong> specific projects.Unrestricted funds are resources maintained to cover cash flow until tax and grant revenues are collected.** <strong>Budget</strong>ed payroll tax revenues are an estimate of fiscal year payroll tax cash receipts. Actuals are an estimate of payroll taxes from wages and salaries earned in the fiscal year.Resources-3
GENERAL FUND RESOURCE SUMMARY BY SOURCELine Actual Actual <strong>Budget</strong> Estimate <strong>Budget</strong> % Change % Change % of TotalNo. Revenue Category 10/11 11/12 12/13 12/13 13/14 <strong>Budget</strong> Estimated ResourcesBeginning Fund Balance as of July 1*1. Restricted Bond Proceeds & Other Restricted $ 87,440,987 $ 202,004,925 $ 31,300,000 $ 52,008,461 $ 34,406,711 9.93% -33.84% 2.89%2. Restricted Debt Service 20,880,542 19,844,781 $ 22,955,000 23,249,134 29,000,000 26.33% 24.74% 2.44%3. Unrestricted 94,300,000 60,000,000 85,031,751 104,614,172 99,851,302 17.43% -4.55% 8.39%4. Total Beginning Fund Balance $ 202,623,970 $ 281,849,706 $ 139,286,751 $ 179,871,768 $ 163,258,013 17.21% -9.24% 13.72%Operating Revenue5. Passenger $ 96,889,626 $ 102,240,638 $ 115,100,000 $ 113,352,558 $ 119,645,098 3.95% 5.55% 10.05%6. Advertising 5,064,670 5,435,193 5,674,500 5,624,500 3,040,125 -46.42% -45.95% 0.26%7. Accessible Transportation Contract 3,462,201 3,058,145 2,605,706 2,537,609 2,537,609 -2.61% 0.00% 0.21%8. Service Contracts 23,719,464 24,335,846 22,461,921 22,102,171 25,083,085 11.67% 13.49% 2.11%9. Total Operating Revenue $ 129,135,961 $ 135,069,822 $ 145,842,127 $ 143,616,838 $ 150,305,917 3.06% 4.66% 12.63%Non-Operating Resources10. Interest $ 774,899 $ 516,154 $ 350,000 $ 300,000 $ 500,000 42.86% 66.67% 0.04%11. Miscellaneous 3,616,210 2,270,104 4,168,089 4,076,906 4,252,114 2.02% 4.30% 0.36%12. Total Non-Operating Resources $ 4,391,109 $ 2,786,258 $ 4,518,089 $ 4,376,906 $ 4,752,114 5.18% 8.57% 0.40%Tax Revenue13. Employer Payroll** $ 211,280,445 $ 232,755,616 $ 230,598,208 $ 241,982,252 $ 263,540,039 14.29% 8.91% 22.14%14. Self-Employed** 10,918,507 12,450,843 11,081,117 12,602,270 13,385,057 20.79% 6.21% 1.12%15. State "In-Lieu"** 2,659,117 2,871,517 2,778,655 2,791,584 3,056,784 10.01% 9.50% 0.26%16. Total Tax Revenue $ 224,858,069 $ 248,077,976 $ 244,457,980 $ 257,376,106 $ 279,981,881 14.53% 8.78% 23.52%Grants17. Federal Operating Grants $ 39,284,476 $ 89,840,966 $ 79,141,451 $ 90,666,343 $ 74,275,591 -6.15% -18.08% 6.24%18. State Operating Grants 1,972,327 1,903,397 728,987 728,987 470,000 -35.53% -35.53% 0.04%19. Local Operating Grants 3,173,337 1,085,000 1,072,013 1,627,236 49.98% 51.79% 0.14%20. Columbia River Crossing 1,236,956 601,693 1,604,692 29.73% 166.70% 0.13%21. Capital Grants 8,652,501 108,626,917 155,445,831 119,559,662 108,651,157 -30.10% -9.12% 9.13%22. Total Grants $ 49,909,304 $ 203,544,617 $ 237,638,225 $ 212,628,698 $ 186,628,676 -21.47% -12.23% 15.68%* <strong>Budget</strong>ary Fund Balance. Restricted funds include funds withdrawn by the bond Trustee(s) to pay debt service, plus bond proceeds and other resources designated <strong>for</strong> specific projects.Unrestricted funds are resources maintained to cover cash flow until tax and grant revenues are collected.** <strong>Budget</strong>ed payroll tax revenues are an estimate of fiscal year payroll tax cash receipts. Actuals are an estimate of payroll taxes from wages and salaries e arned in the fiscal year.Resources-4
GENERAL FUND RESOURCE SUMMARY BY SOURCELine Actual Actual <strong>Budget</strong> Estimate <strong>Budget</strong> % Change % Change % of TotalNo. Revenue Category 10/11 11/12 12/13 12/13 13/14 <strong>Budget</strong> Estimated ResourcesOther Capital23. Capital Assistance $ 95,545,117 $ 25,948,142 $ 231,983,067 $ 224,427,466 $ 41,899,015 -81.94% -81.33% 3.52%24. Total Other Capital $ 95,545,117 $ 25,948,142 $ 231,983,067 $ 224,427,466 $ 41,899,015 -81.94% -81.33% 3.52%Other Resources25. Bond Proceeds $ 139,190,930$ 139,782,461 $ 78,609,596 $ 355,293,539 154.18% 29.85%26. Other Non-Operating Resources 74,389,336 $ 37,008,545 12,641,634 6,210,770 5,896,809 -53.35% -5.06% 0.50%27. Transfer from G.O, Bond Fund 2,200,000 100.00% 0.18%28. Total Other Resources $ 213,580,266 $ 37,008,545 $ 152,424,095 $ 84,820,366 $ 363,390,348 138.41% 328.42% 30.53%29. Total Resources $ 920,043,796 $ 934,285,066 $ 1,156,150,333 $ 1,107,118,146 $ 1,190,215,964 2.95% 7.51% 100.00%Resources-5
TRIMET CONTINUING REVENUES AND CALCULATION OF PAYROLL TAX DEBT SERVICE RATIOLine Actual Actual <strong>Budget</strong> Estimate <strong>Budget</strong>No. Revenue Category 10/11 11/12 12/13 12/13 13/14Operating Revenue1. Passenger $ 96,889,626 $ 102,240,638 $ 115,100,000 $ 113,352,558 $ 119,645,0982. Advertising 5,064,670 5,435,193 5,674,500 5,624,500 3,040,1253. Accessible Transportation Contract (see note 1) 3,462,201 3,058,145 2,605,706 2,537,609 2,537,6094. Service Contracts (see note 2) 5,800,000 5,800,000 5,801,115 5,772,213 5,784,0875. Total Operating Revenue $ 111,216,497 $ 116,533,976 $ 129,181,321 $ 127,286,880 $ 131,006,919Tax Revenue6. Employer Payroll $ 211,280,445 $ 232,755,616 $ 230,598,208 $ 241,982,252 $ 263,540,0397. Self-Employed 10,918,507 12,450,843 11,081,117 12,602,270 13,385,0578. State "In Lieu" 2,659,117 2,871,517 2,778,655 2,791,584 3,056,7849. Total Tax Revenue $ 224,858,069 $ 248,077,976 $ 244,457,980 $ 257,376,106 $ 279,981,881Other Revenue10. Federal Operating Grants (see note 3) $ 39,284,476 $ 62,483,475 $ 50,699,310 $ 62,415,786 $ 50,200,00011. State Operating Grants (see note 4) 1,972,327 305,604 728,987 728,987 470,00012. Interest 774,899 557,320 350,000 300,000 500,00013. Miscellaneous 3,616,210 5,443,441 4,168,089 4,076,906 4,252,11414. Total Other Revenue $ 45,647,912 $ 68,789,840 $ 55,946,386 $ 67,521,679 $ 55,422,11415. Net Continuing Resources* $ 381,722,478 $ 433,401,792 $ 429,585,687 $ 452,184,664 $ 466,410,91416. Debt Service on Senior Lien Bonds $ 16,917,055 $ 15,888,277 $ 30,941,124 $ 30,669,505 $ 21,048,91017. Senior Lien Debt Service as a Percent of Net Continuing Revenues 4.4% 3.7% 7.2% 6.8% 4.5%* Net Continuing Revenues exclude :- Revenues received from the State of Oregon which are legally required to be used <strong>for</strong> the Medical Transportation program- Surface Transportation Program/Congestion, Mitigation & Air Quality grant funds pledged to <strong>TriMet</strong> by Metro to support grant receipt bonds- Other state and federal grant revenues legally required to be used <strong>for</strong> an intended purpose (New Freedom, Jobs Access, RideWise, RTO, fund exchanges)Notes:1. Revenue offsets rides already provided by LIFT2. Streetcar personnel revenue and Wilsonville and Washington County revenues3. 5307 <strong>for</strong>mula and 5309 Rail Modernization4. STF <strong>for</strong>mulaResources-6
FEDERAL & STATE/LOCAL GENERAL FUND GRANT SUMMARY% of <strong>Budget</strong>Type of Funding Purpose Federal Funding 13/14Federal Operating GrantsSection 5307 Urbanized Area Formula Preventive Maintenance 80.00% $ 33,600,000Section 5337 State of Good Repair Capital Maintenance 80.00% 16,600,000Surface Transportation Program/Congestion, Mitigation & Air Quality Regional Rail Debt Service 89.73% 15,000,000State 5310 STP <strong>for</strong> Waivered Non-Medical Waivered Non-Medical Transportation Match 89.73% 1,577,270STP <strong>for</strong> Fund Exchanges Metro Transit Oriented Development Fund Exchange 89.73% 1,500,000Homeland Security/TSA Canine Unit Homeland Security 100.00% 428,999Congestion Mitigation & Air Quality Regional Transportation Options Program 89.73% 367,931New Freedom/Section 5310 Transportation <strong>for</strong> Elderly and People with Disabilities 50.00% 1,496,000Jobs Access Reverse Commute-Formula Transportation Services 80.00% 765,189Operating Project Federal Funds Operating Projects 89.73% 1,423,080Congestion Mitigation & Air Quality Bus Stop Development 89.73% 1,096,111State Elderly and Disabled Transportation Program Ride Connection Service Discretionary State Grants 89.73% 421,012Total Federal Operating Grants $ 74,275,591Federal Capital Program GrantsState Elderly and Disabled Transportation Program 27 ATP Replacement Vehicles Buses+BDS Component 89.73% $ 2,020,303TIGGER On-Board Energy Storage Units 100.00% 1,100,000Regional Funds BRT First Corridor (Powell-Division) 100.00% 100,000Section 5337 State of Good Repair Replacement Low Floor 40' Buses 80.00% 5,150,000Regional Funds Bus Shelters 89.73% 280,854Total Federal Capital Program Grants $ 8,651,157Total Federal General Fund Grants $ 82,926,748State Operating GrantsState Elderly and Disabled Transportation Program LIFT Operations $ 470,000State of Washington/State of Oregon Columbia River Crossing Project 100.00% 1,604,692Total State General Fund Grants $ 2,074,692Local Operating GrantsVarious Local Operating Funds Wilsonville Contribution to WES, City of Portland PMMI $ 1,627,236Reimbursement, Lloyd TMA Improvements, City ofMilwaukie (PMLR)Total Local General Fund Grants $ 1,627,236Resources-7
[This Page Left Intentionally Blank]Resources‐8
Light Rail Programs$439,640,843 (42.34%)GENERAL FUND REQUIREMENTS<strong>Budget</strong> 13/14Operations$324,753,756 (31.27%)OPEB & Pension UAAL$57,296,402 (5.52%) 52%)Pass ThroughRequirements $5,896,809(0.57%)Capital Projects$11,193,040 (1.08%)Contingency$14,592,270 (1.41%)Debt Service$38,471,976 (3.70%)General & Administrative$54,693,829 (5.27%)Total Requirements = $1,038,417,519**Requirements exclude Ending Fund Balance of $151,798,445.Capital Programs$91,878,593 (8.85%)Requirements-1
GENERAL FUND REQUIREMENT SUMMARYLine Actual Actual <strong>Budget</strong> Estimate <strong>Budget</strong> % Change % Change % of TotalNo. Division/Department 10/11 11/12 12/13 12/13 13/14 <strong>Budget</strong>* Estimated* RequirementsOffice of the General Manager Division1. Office of the General Manager $ 947,663 $ 886,628 $ 1,035,548 $ 904,225 $ 1,248,704 20.58% 38.10% 0.10%2. Diversity and Transit Equity 212,126 240,119 245,471 247,561 234,834 -4.33% -5.14% 0.02%3. Internal Audit 233,475 230,531 233,530 232,286 240,217 2.86% 3.41% 0.02%4. Total Office of the General Manager $ 1,393,264 $ 1,357,278 $ 1,514,548 $ 1,384,072 $ 1,723,756 13.81% 24.54% 0.14%Public Affairs Division5. Administration $ 191,696 $ 295,599 $ 298,225 $ 300,098 1.52% 0.63% 0.03%6. Operating Projects $ 569,69185,000 85,000 260,000 205.88% 205.88% 0.02%7. Planning & Policy 450,017 918,351 1,307,503 1,328,783 2,746,379 110.05% 106.68% 0.23%8. Government Affairs 706,945 644,206 409,205 412,951 427,083 4.37% 3.42% 0.04%9. Communications 283,298 383,034 539,078 552,539 619,450 14.91% 12.11% 0.05%10. Organization Development 395,214 392,389 0.00% 0.00% 0.00%11. Customer In<strong>for</strong>mation Services 6,463,525 6,649,239 5,669,398 5,739,378 5,920,624 4.43% 3.16% 0.50%12. Total Public Affairs $ 8,868,690 $ 9,178,914 $ 8,305,783 $ 8,416,878 $ 10,273,634 23.69% 22.06% 0.86%Safety & Security Division13. Safety, Security and Environmental Services $ 10,194,329 $ 11,501,145 $ 12,996,090 $ 13,028,721 $ 14,152,161 8.90% 8.62% 1.19%14. Operating Projects 439,000 288,572 573,999 30.75% 98.91% 0.05%15. Total Safety & Security $ 10,194,329 $ 11,501,145 $ 13,435,090 $ 13,317,293 $ 14,726,160 9.61% 10.58% 1.24%In<strong>for</strong>mation Technology Division16. In<strong>for</strong>mation Technology $ 6,721,730 $ 6,534,582 $ 6,735,689 $ 6,850,556 $ 7,082,950 5.16% 3.39% 0.60%17. Operating Projects 320,857 447,721 544,800 546,201 650,600 19.42% 19.11% 0.05%18. Total In<strong>for</strong>mation Technology $ 7,042,587 $ 6,982,303 $ 7,280,489 $ 7,396,757 $ 7,733,550 6.22% 4.55% 0.65%Finance & Administration Division19. Administration $ 1,253,520 $ 1,305,274 $ 1,471,166 $ 1,481,408 $ 1,629,814 10.78% 10.02% 0.14%20. Operating Projects 350,000 650,000 65,200 -81.37% -89.97% 0.01%21. Financial Services 3,260,955 1,635,969 3,028,542 3,017,688 2,142,959 -29.24% -28.99% 0.18%22. <strong>Budget</strong>, Financial Analysis & Grants Administration 2,240,312 2,554,939 2,706,391 2,724,857 3,737,505 38.10% 37.16% 0.31%23. Risk Management 502,587 515,279 494,834 501,345 501,858 1.42% 0.10% 0.04%24. Procurement & Contracts 964,479 1,012,089 1,180,643 1,163,305 1,034,755 -12.36% -11.05% 0.09%25. Fare Revenue 1,924,618 2,620,307 2,613,877 6,240,751 138.17% 138.75% 0.52%26. Total Finance & Administration $ 8,221,853 $ 8,948,167 $ 11,851,883 $ 12,152,480 $ 15,352,842 29.54% 26.34% 1.29%Requirements-2
GENERAL FUND REQUIREMENT SUMMARYLine Actual Actual <strong>Budget</strong> Estimate <strong>Budget</strong> % Change % Change % of TotalNo. Division/Department 10/11 11/12 12/13 12/13 13/14 <strong>Budget</strong>* Estimated* Requirements55. OPEB & UAAL Pension $ 41,603,359 $ 45,542,084 $ 47,758,079 $ 50,353,324 $ 57,296,402 19.97% 13.79% 4.81%56. Debt Service $ 24,989,546 $ 23,702,971 $ 48,177,780 $ 48,096,687 $ 38,471,976 -20.15% -20.01% 3.23%57. Total Operating Requirements $ 406,165,279 $ 422,741,516 $ 473,467,007 $ 477,728,418 $ 486,409,003 2.73% 1.82% 40.87%58. Capital Program $ 27,656,818 $ 27,575,635 $ 105,383,491 $ 64,187,683 $ 91,878,593 -12.82% 43.14% 7.72%59. Light Rail Program 86,891,317 225,630,574 446,410,689 393,934,861 439,640,843 -1.52% 11.60% 36.94%60. Pass Through Requirements 74,389,336 37,008,545 12,641,634 6,210,770 5,896,809 -53.35% -5.06% 0.50%61. Project Interim Financing 43,091,339 41,457,029 1,798,403 -100.00% 0.00%62. Contingency 20,000,000 14,592,270 -27.04% 1.23%Ending Fund Balance as of June 30*63. Restricted Bond Proceeds & Other Restricted 202,004,925 52,008,461 8,000,000 34,406,711 8,000,000 0.00% -76.75% 0.67%64. Restricted Debt Service 19,844,781 23,249,134 28,696,820 29,000,000 37,000,000 28.93% 27.59% 3.11%65. Unrestricted 60,000,000 104,614,172 61,550,692 99,851,302 106,798,445 73.51% 6.96% 8.97%66. Total Ending Fund Balance 281,849,706 179,871,768 98,247,512 163,258,013 151,798,445 54.51% -7.02% 12.75%67. Total Requirements $ 920,043,796 $ 934,285,066 $ 1,156,150,333 $ 1,107,118,146 $ 1,190,215,964 2.95% 7.51% 100.00%* <strong>Budget</strong>ary Fund Balance. Restricted funds include funds withdrawn by the Trustee to pay debt service, plus bond proceeds and other resources designated <strong>for</strong> specific projects.Unrestricted funds are resources maintained to cover cash flow until tax and grant revenues are collected.Requirements-4
GENERAL FUND REQUIREMENTS BY OBJECT CLASS (Summary of Detail Estimate Sheets)Line Actual Actual <strong>Budget</strong> Estimate <strong>Budget</strong> % Change % of TotalNo. 10/11 11/12 12/13 12/13 13/14 FY13-<strong>FY14</strong>* RequirementsPersonnel Services1. Office of the General Manager $ 832,353 $ 809,627 $ 882,815 $ 905,083 $ 1,117,050 26.53% 0.09%2. Public Affairs 5,968,084 6,927,658 5,913,254 6,024,048 6,152,537 4.05% 0.52%3. Safety & Security 1,010,535 1,159,618 1,338,164 1,361,795 1,373,420 2.63% 0.12%4. In<strong>for</strong>mation Technology 5,410,581 4,986,785 4,827,292 4,942,105 5,158,826 6.87% 0.43%5. Finance & Administration 4,254,543 4,479,870 6,025,238 6,094,182 8,091,061 34.29% 0.68%6. Labor Relations & Human Resources 1,266,651 1,564,397 1,972,899 2,018,078 2,039,122 3.36% 0.17%7. Legal Services 1,416,120 1,322,528 1,432,252 1,457,628 1,485,615 3.73% 0.12%8. Operations 188,668,579 196,354,838 203,773,501 208,012,119 207,085,504 1.63% 17.40%9. Capital Projects 2,394,180 2,143,889 1,575,912 1,599,526 3,033,600 92.50% 0.25%10. OPEB & UAAL Pension 41,603,359 45,542,084 47,758,079 50,353,324 57,296,402 19.97% 4.81%11. Total Personnel Services $ 252,824,986 $ 265,291,296 $ 275,499,407 $ 282,767,888 $ 292,833,138 6.29% 24.60%Materials & Services12. Office of the General Manager $ 560,910 $ 547,651 $ 631,733 $ 478,989 $ 606,706 -3.96% 0.05%13. Public Affairs 2,900,607 2,251,256 2,392,529 2,392,829 4,121,097 72.25% 0.35%14. Safety & Security 9,183,794 10,341,527 12,096,926 11,955,498 13,352,740 10.38% 1.12%15. In<strong>for</strong>mation Technology 1,632,006 1,995,517 2,453,197 2,454,652 2,574,724 4.95% 0.22%16. Finance & Administration 3,967,313 4,468,297 5,826,645 6,058,298 7,261,781 24.63% 0.61%17. Labor Relations & Human Resources 483,650 708,914 979,840 1,051,601 1,106,857 12.96% 0.09%18. Legal Services 188,066 178,013 185,291 185,291 252,293 36.16% 0.02%19. Operations 102,211,831 106,748,477 110,262,680 110,437,699 117,668,252 6.72% 9.89%20. Capital Projects 7,222,572 6,507,595 14,960,980 11,848,987 8,159,440 -45.46% 0.69%21. Total Materials & Services $ 128,350,749 $ 133,747,249 $ 149,789,820 $ 146,863,844 $ 155,103,890 3.55% 13.03%22. Capital Program $ 27,656,818 $ 27,575,635 $ 105,383,491 $ 64,187,683 $ 91,878,593 -12.82% 7.72%23. Light Rail Program 86,891,317 225,630,574 446,410,689 393,934,861 439,640,843 -1.52% 36.94%24. Pass Through Requirements 74,389,336 37,008,545 12,641,634 6,210,770 5,896,809 -53.35% 0.50%25. Debt Service 24,989,546 23,702,971 48,177,780 48,096,687 38,471,976 -20.15% 3.23%26. Project Interim Financing 43,091,339 41,457,029 1,798,403 0.00%27. Contingency* 20,000,000 14,592,270 -27.04% 1.23%Ending Fund Balance as of June 30*28. Restricted Bond Proceeds & Other Restricted 202,004,925 52,008,461 8,000,000 34,406,711 8,000,000 0.00% 0.67%29. Restricted Debt Service 19,844,781 23,249,134 28,696,820 29,000,000 37,000,000 28.93% 3.11%30. Unrestricted Funds 60,000,000 104,614,172 61,550,692 99,851,302 106,798,445 73.51% 8.97%31. Total Ending Fund Balance 281,849,706 179,871,768 98,247,512 163,258,013 151,798,445 54.51% 12.75%32. Total Requirements $ 920,043,796 $ 934,285,066 $ 1,156,150,334 $ 1,107,118,146 $ 1,190,215,964 2.95% 100.00%* <strong>Budget</strong>ary Fund Balance. Restricted funds include funds withdrawn by the Trustee to pay debt service, plus bond proceeds and other resources designated <strong>for</strong> specific projects.Unrestricted funds are resources maintained to cover cash flow until tax and grant revenues are collected.Requirements-5
GENERAL FUND PERSONNEL SERVICES SCHEDULEEarnings<strong>Budget</strong> <strong>Budget</strong> % ChangeExpense Category Explanation 12/13 13/14 FY13-<strong>FY14</strong>Salaries & Wages Base compensation <strong>for</strong> all non-limited term positions, including training pay, student training cost, and union $ 142,241,813 $ 147,118,120 3.43%employee wage premiums based on years of service.Sick & Vacation/Holiday Payoff $120,064 <strong>for</strong> union sick payoff; $290,491 <strong>for</strong> union vacation/holiday payoff; $241,901 <strong>for</strong> non-union vacation payoff. 615,399 652,456 6.02%Other Wage Categories Road relief, night & shift differential, incentive pay, tool allowance, time slip differential, extra service pay, 1,780,955 1,827,699 2.62%premium pay <strong>for</strong> union employees.Scheduled Overtime Overtime that has been built into union operator shifts. 8,547,959 8,592,188 0.52%Unscheduled Overtime All other overtime except scheduled overtime. 6,091,354 6,140,559 0.81%Limited Term Employment Salaries of employees hired <strong>for</strong> 6 or more months, work 20 or more hours per week, and have a predetermined end date. 116,443 16,367 -85.94%Unemployment Expense <strong>TriMet</strong> reimburses the State of Oregon <strong>for</strong> actual claims paid. 108,264 109,197 0.86%Unpaid Absence All excused and unexcused time loss <strong>for</strong> which employees are not paid. (2,615,959) (2,676,180) 2.30%Fringe BenefitsHealth & Welfare Benefits $19,202 per full-time union employee; $13,959 per part-time union employee; $13,997 per non-union employee. 41,939,423 44,205,051 5.40%Disability & Life Insurance $370 per full-time union employee; $254 per part-time union employee; $905 per non-union employee. 1,049,803 1,083,533 3.21%Social Security - Medicare 7.65% of first $113,700 of salaries and wages; 1.45% thereafter. 12,000,615 12,381,211 3.17%<strong>TriMet</strong> Payroll Tax .7178% of gross income (.7137% in 2013, .7237% in 2014). 987,990 1,038,353 5.10%Pension Expense-Normal Cost $5,745 per union employee; 8.68% of gross income per non-union employee in Defined Benefit Plan; 13,107,959 13,714,155 4.62%(cost of benefits earned this year) 8.0% of gross income per union and non-union employee in Defined Contribution Plan.Union UAAL Pension Expense Current year portion of 20 year funding of Unfunded Accrued Actuarial Liability 24,354,519 33,619,101 38.04%Mgmt UAAL Pension Expense Current year portion of 20 year funding of Unfunded Accrued Actuarial Liability 3,119,958 3,833,101 22.86%Retiree/Disabled Medical Post employment medical benefits <strong>for</strong> current union and non-union retirees. 20,361,808 21,106,562 3.66%Medicare Part B Reimbursement Post employment medical benefits <strong>for</strong> current union retirees. 1,106,228 1,117,274 1.00%Other Retiree Benefits Union health benefit reimbursement <strong>for</strong> cost increases to Kaiser & Secure Horizon plans effective 7/1/2003, 540,000 447,791 -17.08%cost of life insurance premiums <strong>for</strong> union and non-union retirees, interest rate pension charge.Capitalized Labor and Fringe Capitalized labor and fringe plus OPEB & UAAL grant fringe reimbursement. (5,952,735) (7,390,857) 24.16%OPEB Trust Funding Contribution to OPEB Trust to begin funding future union and non-union retiree OPEB benefits. 865,760 235,000 -72.86%Workers' Compensation Medical and time loss payments to employees injured in work related accidents. Time loss is paid at 66.7% of 5,131,846 5,662,457 10.34%average weekly wage not to exceed $1,120.55 per week.Total Personnel Services $ 275,499,407 $ 292,833,138 6.29%Requirements-6
GENERAL FUND MATERIALS & SERVICES SCHEDULE<strong>Budget</strong> <strong>Budget</strong> PercentExpense Category 12/13 13/14 Change ExplanationContracted Transportation Services $ 29,690,647 $ 31,087,164 4.70%Revenue Vehicles - Diesel Fuel 21,631,850 21,605,456 -0.12% $3.40/gallon <strong>for</strong> bus $3.55/gallon <strong>for</strong> ATP.Medical Transportation Program (MTP) 16,475,391 19,365,748 17.54% State of Oregon estimate. 100% of costs reimbursed by State.Revenue Vehicle - Maintenance Materials & Services 14,684,320 17,634,257 20.09% Additional light rail vehicle overhaul.Interagency Transfers 13,021,922 5,856,941 -55.02% Varies from year to year based on requirement (fund exchanges).Security Related Materials & Services 10,651,912 11,847,259 11.22%Operating Projects 8,118,984 10,997,753 35.46% State of Good Repair and other deferred maintenance.Light Rail Propulsion Power 4,854,626 5,039,384 3.81%Facilities Maintenance - Materials & Services 4,701,837 4,777,428 1.61%Professional & Technical Services 3,820,172 4,186,994 9.60%Insurance Premiums and Self-Insurance Funding 3,808,408 3,830,547 0.58%Utilities (Natural Gas, Electricity, Water/Sewer) 2,750,695 2,883,922 4.84%Other Materials & Services 2,555,787 2,586,178 1.19%Personal Injury & Property Damage Self-Insurance 2,266,000 2,300,000 1.50%Office Administrative Materials & Services 1,842,027 1,873,011 1.68%Lease Expenses 1,658,853 1,573,496 -5.15%Computer Maintenance Materials & Services 1,409,502 1,446,827 2.65%Support Vehicles - Maintenance & Materials 785,146 793,880 1.11%Marketing & Advertising 618,732 630,172 1.85%Uni<strong>for</strong>ms and Laundry 567,901 564,709 -0.56%Tickets, Passes, Transfers, Schedules & Guides 556,838 676,882 21.56% <strong>Budget</strong> reallocation.Revenue Vehicles - Oil & Lubricants 440,051 431,363 -1.97%Telephone Expense 436,564 431,698 -1.11%Employee Attendance & Incentive Programs 357,178 374,363 4.81%Communications System Maintenance 330,662 332,386 0.52%Contracted Legal Services 271,329 423,485 56.08% Early termination of leases, bond counsel, arbitration.Health Benefit Administration 252,396 257,933 2.19%Dues (including APTA & OTA) & Subscriptions 237,808 253,677 6.67%Metro Unified Work Program 225,000 225,000 0.00%Customer In<strong>for</strong>mation Materials 224,347 230,405 2.70%Waste Disposal Fees 203,000 213,400 5.12%Education & Training 171,279 186,136 8.67%Money Collection & Transport 168,660 186,035 10.30%Total Materials & Services $ 149,789,820 $ 155,103,890 3.55%Requirements-7
SUMMARY OF GENERAL FUND EMPLOYEESActual <strong>Budget</strong> <strong>Budget</strong>6/30/12 12/13 13/14 % ChangeOffice of the General Manager DivisionNon-Union EmployeesFull-Time Employees 6.75 6.50 7.50 15.38%Part-Time Employees 0.00 0.25 0.25 0.00%Total Office of the General Manager Division 6.75 6.75 7.75 14.81%Public Affairs DivisionNon-Union EmployeesFull-Time Employees 36.75 38.75 39.40 1.68%Project Limited Term Employees 0.50 0.50 0.00 -100.00%Grant Funded Employees 7.25 7.25 6.85 -5.52%Part-Time Employees 4.95 5.10 5.10 0.00%Union EmployeesFull-Time Employees 14.00 13.50 14.00 3.70%Total Public Affairs Division 63.45 65.10 65.35 0.38%Safety & Security DivisionNon-Union EmployeesFull-Time Employees 12.00 12.00 12.00 0.00%Union EmployeesFull-Time Employees 1.00 1.00 1.00 0.00%Total Safety & Security Division 13.00 13.00 13.00 0.00%In<strong>for</strong>mation Technology DivisionNon-Union EmployeesFull-Time Employees 42.00 41.39 40.75 -1.55%Project Limited Term Employees 2.00 0.00 1.00 100.00%Total In<strong>for</strong>mation Technology Division 44.00 41.39 41.75 0.87%Finance & Administration DivisionNon-Union EmployeesFull-Time Employees 29.00 28.94 31.54 8.99%Project Limited Term Employees 1.00 0.00 0.00 0.00%Part-Time Employees 0.75 0.75 0.75 0.00%Union EmployeesFull-Time Employees 27.00 29.50 46.50 57.63%Total Finance & Administration Division 57.75 59.19 78.79 33.12%Labor Relations & Human Resources DivisionNon-Union EmployeesFull-Time Employees 19.00 17.25 17.25 0.00%Part-Time Employees 1.73 1.10 1.60 45.45%Total Labor Relations & Human Resources Division 20.73 18.35 18.85 2.72%Requirements-8
SUMMARY OF GENERAL FUND EMPLOYEESActual <strong>Budget</strong> <strong>Budget</strong>6/30/12 12/13 13/14 % ChangeLegal Services DivisionNon-Union EmployeesFull-Time Employees 11.00 11.00 11.00 0.00%Total Legal Services Division 11.00 11.00 11.00 0.00%Operations DivisionNon-Union EmployeesFull-Time Employees 114.00 121.80 128.05 5.13%Project Limited Term Employees 1.00 1.00 1.00 0.00%Grant Funded Employees 0.00 0.00 0.25 100.00%Part-Time Employees 0.80 0.00 0.00 0.00%Union EmployeesFull-Time Employees 1,716.00 1,729.00 1,738.67 0.56%Part-Time Employees 286.00 291.00 293.17 0.75%Total Operations Division 2,117.80 2,142.80 2,161.14 0.86%Capital Projects DivisionNon-Union EmployeesFull-Time Employees 11.75 4.00 4.50 12.50%Project Limited Term Employees 1.00 0.25 0.25 0.00%Grant Funded Employees 7.25 11.25 25.00 122.22%Part-Time Employees 0.50 0.00 0.00 0.00%Total Capital Projects Division 20.50 15.50 29.75 91.94%General Fund Operating ProgramNon-Union EmployeesFull-Time Employees 282.25 281.63 291.99 3.68%Project Limited Term Employees 2.50 1.75 2.25 28.57%Grant Funded Employees 14.50 18.50 32.10 73.51%Part-Time Employees 8.73 7.20 7.70 6.94%Total 307.98 309.08 334.04 8.08%Union EmployeesFull-Time Employees 1,758.00 1,773.00 1,800.17 1.53%Part-Time Employees 286.00 291.00 293.17 0.75%Total 2,044.00 2,064.00 2,093.34 1.42%Total General Fund Operating Program Employees (1) 2,351.98 2,373.08 2,427.38 2.29%(1) Actual number of employees, at any given, time, may vary significantly from these totals due to the nature of some operations.Requirements-9
SUMMARY OF GENERAL FUND EMPLOYEESActual <strong>Budget</strong> <strong>Budget</strong>6/30/12 12/13 13/14 % ChangePortland-Milwaukie Light Rail ProjectNon-Union EmployeesFull-Time Employees 80.25 112.00 113.00 0.89%Project Limited Term Employees 11.00 16.25 15.75 -3.08%Part-Time Employees 3.20 1.05 2.65 152.38%Union Employees (Start-Up)Full-Time Employees 3.67 17.00 32.00 88.24%Total Portland-Milwaukie Light Rail Project 98.12 146.30 163.40 11.69%Light Rail ProgramNon-Union EmployeesFull-Time Employees 80.25 112.00 113.00 0.89%Project Limited Term Employees 11.00 16.25 15.75 -3.08%Part-Time Employees 3.20 1.05 2.65 152.38%Total 94.45 129.30 131.40 1.62%Union Employees (Start-Up)Full-Time Employees 3.67 17.00 32.00 88.24%Total 3.67 17.00 32.00 88.24%Total Light Rail Program Employees (1) 98.12 146.30 163.40 11.69%(1) Actual number of employees, at any given, time, may vary significantly from these totals due to the nature of the program.Requirements-10
SUMMARY OF FIXED ROUTE SERVICE (Weekly Vehicle Hours)Actual Actual <strong>Budget</strong> Estimate <strong>Budget</strong> % Change % Change % ofApril '11 April '12 April '13 April '13 April '14 <strong>Budget</strong> Estimate TotalFixed RouteBus Service 33,772 34,024 33,961 34,029 34,349 1.14% 0.94% 86.64%Light Rail 5,380 5,175 5,175 5,175 5,175 0.00% 0.00% 13.05%Commuter Rail 122 122 122 122 122 0.00% 0.00% 0.31%Fixed Route Total 39,274 39,321 39,258 39,326 39,646 0.99% 0.81% 100.00%Requirements-11
SUMMARY OF FIXED ROUTE AND ACCESSIBLE TRANSPORTATION VEHICLESActual Actual <strong>Budget</strong> Estimate <strong>Budget</strong> % Change % ChangeFixed Route Services April '11 April '12 April '13 April '13 April '14 <strong>Budget</strong> EstimateBus ServicePeak Vehicles 493 493 495 495 495 0.00% 0.00%Total Vehicles 626 626 620 620 620 0.00% 0.00%Light RailPeak Vehicles 103 103 102 102 102 0.00% 0.00%Total Vehicles 127 127 127 127 127 0.00% 0.00%Commuter RailPeak Vehicles 3 3 3 3 3 0.00% 0.00%Total Vehicles 3 3 5 5 5 0.00% 0.00%Actual Actual <strong>Budget</strong> Estimate <strong>Budget</strong> % Change % ChangeAccessible Transportation April '11 April '12 April '13 April '13 April '14 <strong>Budget</strong> EstimatePeak Vehicles 219 216 225 220 218 -3.11% -0.91%Total Vehicles 269 267 267 268 268 0.37% 0.00%Requirements-12
SUMMARY OF GENERAL FUND DEBT SERVICELine Operating Actual Actual <strong>Budget</strong> Estimate <strong>Budget</strong> Revenue Offset 4) % ChangeNo. 10/11 11/12 12/13 12/13 13/14 13/14 <strong>Budget</strong>1. 2001 Refunding Bonds $ 2,774,510 $ 1,785,2812. 2003 Refunding Bonds 1,930,863 1,928,221 $ 1,875,114 $ 8,355,000-100.00%3. 2005 Refunding Bonds 5,237,685 5,233,371 5,240,494 5,298,625 $ 5,300,8751.15%4. 2005 Capital Grant Receipt Bonds 9,986,053 9,974,048 10,253,599 10,511,097 10,506,981 $ 9,300,000 2.47%5. 2007 Revenue Bonds 3,040,592 3,021,716 3,049,968 3,011,000 2,993,000 2,787,540 -1.87%6. Debt Payment Undertaking Agreement 368,115 352,546 7,502,297 7,502,297 2,032,128 2,032,128 -72.91%7. Line of Credit 126,736 127,083 130,000 65,000 -100.00%8. 2009 Senior Lien Revenue Bonds Series A and B 3,438,554 3,440,059 3,843,251 3,503,832 3,507,357 1,698,821 -8.74%9. 2011 Capital Grant Receipt Bonds 1) 6,104,192 6,893,057 6,826,085 6,826,085 6,826,085 -0.97%10. 2012 Senior Lien Revenue Bonds 9,300,000 2,933,751 6,506,650 2,342,394 -30.04%11. 2014 Senior Lien Revenue Bonds 708,900 100.00%12. Arbitrage Rebate 93,060 (2,296,631)13. Capitalized Leases 107,213 115,930 90,000 90,000 90,000 0.00%14. Capital Interest 2) (2,113,835) (6,082,845)15. Total General Fund Debt Service $ 24,989,546 $ 23,702,971 $ 48,177,780 $ 48,096,687 $ 38,471,976 $ 24,986,968 -20.15%Line Project Interim Financing Actual Actual <strong>Budget</strong> Estimate 3) <strong>Budget</strong> Revenue Offset % ChangeNo. 10/11 11/12 12/13 12/13 13/14 13/14 <strong>Budget</strong>1. 2006 I-205/Portland Mall Light Rail Interim Finance $ 43,091,339 $ 41,457,029#DIV/0!2. 2013 Portland Milwaukie Light Rail Interim Finance $ 1,798,4033. Total Project Interim Financing $ 43,091,339 $ 41,457,029$ 1,798,403#DIV/0!1) Includes capitalized interest payment. Bond proceeds to pay capitalized interest are in Beginning Fund Balance.2) Capital Interest is a required accounting estimate. It is offset by a like expense named Capital Interest in the Portland-Milwaukie Light Rail budget.3) 2013 Portland Milwaukie Light Rail Project interim financing issuance costs. Interest and principal are in the Light Rail construction budget. Costs are offset by a like amount of Project revenues.4) Amount of debt service that is offset by MTIP IGA revenues or payroll tax rate increase revenues.Debt Service-1
SUMMARY OF GENERAL FUND DEBT SERVICE PRINCIPAL AND INTERESTPrincipal Interest Total2005 Refunding Bonds $ 1,655,875 $ 3,645,000 $ 5,300,8752005 Capital Grant Receipt Bonds 9,200,000 1,306,981 10,506,9812007 Revenue Bonds 1,380,000 1,613,000 2,993,000Debt Payment Undertaking Agreement 2,032,128 2,032,1282009 Revenue Bonds Series A and B 1,405,000 2,102,357 3,507,3572011 Capital Grant Receipt Bonds 6,826,085 6,826,0852012 Senior Lien Revenue Bonds 2,050,000 4,456,650 6,506,6502014 Senior Lien Revenue Bonds 708,900 708,900Capitalized Leases 90,000 90,000FY13-14 Total General Fund Debt Service $ 15,690,875 $ 22,781,101 $ 38,471,976Debt Service-2
OPEB & UAAL PENSION<strong>Budget</strong> Estimated <strong>Budget</strong> % ChangeExplanation 12/13* 12/13* 13/14* FY13-<strong>FY14</strong>Retiree/Disabled Medical Union and Non-Union Post Employment Medical Benefits $ 20,361,808 $ 18,445,010 $ 21,106,562 3.66%Medicare Part B Reimbursement Union Post Employment Medical Benefits 1,106,228 997,898 1,117,274 1.00%Union OPEB Trust Funding Union and Other Post Employment Benefits Trust Contribution 865,760 85,000 -90.18%Non-Union OPEB Trust Funding Non-Union Other Post Employment Benefits Trust Contribution 150,000 100.00%Active/Retiree Benefit Reimbursement Union Health Benefit Reimbursement <strong>for</strong> Kaiser and Secure Horizons Plans 40,000 -100.00%Life Insurance - Retired Union and Non-Union Retiree Life Insurance Premiums 450,000 429,088 447,791 -0.49%Union UAAL Pension Expense Current year portion of 20 year funding of Unfunded Accrued Actuarial Liability 24,354,519 26,795,654 33,619,101 38.04%Mgmt UAAL Pension Expense Current year portion of 20 year funding of Unfunded Accrued Actuarial Liability 3,119,958 3,685,674 3,833,101 22.86%Capitalized Fringe Capital grant fringe reimbursement (2,590,194) (3,062,427) 18.23%Professional & Technical Interest rate pension charge 50,000 -100.00%Total OPEB & UAAL Pension $ 47,758,079 $ 50,353,324 $ 57,296,402 19.97%*Pension Expense-Normal Cost (cost of benefits earned this year) is incorporated in departmental costs.OPEB-1
[This Page Left Intentionally Blank]OPEB‐2
Division Summary OFFICE OF THE GENERAL MANAGERActual <strong>Budget</strong> Estimate <strong>Budget</strong> % Change % of10/11 11/12 12/13 12/13 13/14 FY13 - <strong>FY14</strong> Dept. TotalPersonnel Services $ 832,353 $ 809,627 $ 882,815 $ 905,083 $ 1,117,05026.53% 64.80%Materials & Services 560,910 547,651 631,733 478,989 606,706 -3.96% 35.20%Total $ 1,393,264 $ 1,357,278 $ 1,514,548 $ 1,384,072 $ 1,723,75613.81% 100.00%PageOffice of the General Manager DivisionDivision Summary………………………………………………………………GM-1Office of the General Manager ………………………………………………………………GM-2Diversity and Transit Equity ………………………………………………………………GM-5Internal Audit………………………………………………………………GM-8GM-1
Department Summary OFFICE OF THE GENERAL MANAGERActual <strong>Budget</strong> Estimate <strong>Budget</strong> % Change % of10/11 11/12 12/13 12/13 13/14 FY13 - <strong>FY14</strong> Dept. TotalPersonnel Services $ 500,540 $ 493,520 $ 581,902 $ 597,099 $ 804,21838.20% 64.40%Materials & Services 447,123 393,108 453,646 307,126 444,486 -2.02% 35.60%Total $ 947,663 $ 886,628 $ 1,035,548 $ 904,225 $ 1,248,70420.58% 100.00%Responsibility:<strong>TriMet</strong> is governed by a seven-member Board of Directors. The Board setsagency policy, enacts legislation and reviews certain contracts.Per<strong>for</strong>mance Measures:• The Office of the General Manager’s per<strong>for</strong>mance is measured in thesuccessful execution of the agency’s strategic goals.The Office of the General Manager is under the direct authority of the Boardof Directors. The General Manager is appointed by the Board and is chargedwith managing the agency.Activities:• Keep the Board fully in<strong>for</strong>med on <strong>TriMet</strong>’s major activities.• Set and lead strategic direction.• Build and establish external and internal partnerships; key to <strong>TriMet</strong>’ssuccess.GM-2
BUD1 Personnel Services OFFICE OF THE GENERAL MANAGER10/11 11/12 12/1312/1313/14Actual Actual ---------<strong>Budget</strong>---------- Est ---------<strong>Budget</strong>----------Position Title Total Total Base Pos Total Total Base Pos TotalGeneral Manager $ 206,461 $ 215,000 $ 215,837 1.00 $ 215,837 $ 222,309 $ 222,309 1.00 $ 222,309Deputy General Manager 195,000 1.00 195,000Director, Business Initiatives 106,780 1.00 106,780 109,453 109,453 1.00 109,453Manager, Corporate Outreach 35,400 42,393Executive & Board Administrator 73,774 73,774 74,061 1.00 74,061 76,880 76,901 1.00 76,901Executive Coordinator 55,474 55,474 55,687 1.00 55,687 57,629 53,202 1.00 53,202Fringe Benefits 129,431 106,879 127,784 129,074 145,757Sick & Vacation/Holiday Payoff 1,596 1,596 1,596Workers' Compensation 158 158Total $ 500,540 $ 493,5204.00 $ 581,902 $ 597,0995.00 $ 804,218GM-3
BUD2 Materials & Services OFFICE OF THE GENERAL MANAGERActual Actual <strong>Budget</strong> Estimate <strong>Budget</strong> % Change % ofExpense Category 10/11 11/12 12/13 12/13 13/14 FY13-<strong>FY14</strong> M & S TotalLegal $ 124,288$ 1,350Auditing 267,181 $ 333,514 $ 336,213 246,048 $ 315,291 -6.22% 70.93%Other Services 4,503 1,642 4,182 460 4,295 2.70% 0.97%Office Supplies 5,346 9,423 10,180 4,552 10,455 2.70% 2.35%Other Materials 359 414 1,408 116 2,018 43.33% 0.45%Unreconciled Mastercard Expense 2,995 60Telephone 1,209 165 1,461 224 1,500 2.70% 0.34%Dues & Subscriptions 1,175 206 15,919 24,369 53.08% 5.48%Local Travel & Meetings 2,421 427 5,500 3,636 5,649 2.70% 1.27%Education & Training 700 714 1,036 1,064 2.70% 0.24%Out-of-Town Travel 10,581 12,304 18,927 16,712 19,438 2.70% 4.37%Official Meeting Expenses 28,765 31,222 30,000 25,040 30,810 2.70% 6.93%Board Outreach 595 82 2,040 306 2,095 2.70% 0.47%Employee Development 1,545 3,050 1,587 2.70% 0.36%Employee Recognition 25,235 5,572 25,916 2.70% 5.83%Total $ 447,123 $ 393,108 $ 453,646 $ 307,126 $ 444,486 -2.02% 100.00%GM-4
Department Summary OFFICE OF THE GENERAL MANAGER - DIVERSITY AND TRANSIT EQUITYActual <strong>Budget</strong> Estimate <strong>Budget</strong> % Change % of10/11 11/12 12/13 12/13 13/14 FY13 - <strong>FY14</strong> Dept. TotalPersonnel Services $ 104,678 $ 89,743 $ 78,120 $ 80,210 $ 83,6407.07% 35.62%Materials & Services 107,447 150,376 167,351 167,351 151,194 -9.65% 64.38%Total $ 212,126 $ 240,119 $ 245,471 $ 247,561 $ 234,834-4.33% 100.00%Responsibility:• The Diversity and Transit Equity Department is responsible <strong>for</strong> assistingall divisions in reaching the agency’s goals related to diversity, outreach tominority communities, transit equity and Disadvantaged BusinessEnterprise (DBE) ef<strong>for</strong>ts.Activities:• Disadvantaged Business Enterprise- Direct the development, implementation and monitoring of <strong>TriMet</strong>’sFederal and state DBE and MWESB program and goals.- Work with the Procurement & Contracts Department to increase DBEand MWESB participation in <strong>TriMet</strong>’s General Fund procurementprocesses.- Liaison to community, business and key-stakeholders on DBE, TransitEquity, Diversity, Equity and Inclusion issues.• Title VI/Transit Equity- Coordinate <strong>TriMet</strong>’s Title VI compliance, monitoring and reporting.- Provide Title VI and transit equity training and support to <strong>TriMet</strong> staff.- Provide opportunities <strong>for</strong> transit dependent persons to engage indecision-making through <strong>for</strong>ums and in<strong>for</strong>mational public outreachsessions.- Coordinate and conduct pertinent equity analysis and <strong>for</strong>ecasting.• Diversity and Inclusion- Coordinate the agency’s diversity, equity and strategic planningprocess.- Support development of diversity and cultural competency training.Activities - continued:- In tandem with the Labor Relations & Human Resources Division,support the recruiting and retention of a diverse work<strong>for</strong>ce.• Community Engagement- Increase <strong>TriMet</strong>’s community presence to diverse stakeholders.- Support the agency in the development of strategies and theimplementation of best practices in community relations to strengthenthe agency’s partnerships with low income, transit-dependent andcommunities of color, including opportunities to engage in decisionmakingthrough <strong>for</strong>ums and in<strong>for</strong>mational public outreach sessions.- Support the coordination and staffing of a Transit Equity AdvisoryGroup.Per<strong>for</strong>mance Measures:• Meet <strong>TriMet</strong>’s 10.29% aspirational DBE goal of identified budget.• Work with <strong>TriMet</strong> staff to coordinate, monitor and direct Title VI reportingin a timely manner.• Position <strong>TriMet</strong> as an environmental justice leader.• Develop and foster partnerships/relationships with diverse communitiesand leaders to gain support <strong>for</strong> agency programs and initiatives.• Work closely with <strong>TriMet</strong> customers, constituents and staff to help ensure<strong>TriMet</strong> meets its commitment to Equal Employment Opportunity andwork<strong>for</strong>ce diversity.GM-5
BUD1 Personnel Services OFFICE OF THE GENERAL MANAGER - DIVERSITY AND TRANSIT EQUITY10/11 11/12 12/13 12/1313/14Actual Actual ---------<strong>Budget</strong>---------- Est ---------<strong>Budget</strong>----------Position Title Total Total Base Pos Total Total Base Pos TotalDirector, Diversity & Transit Equity $ 94,510 $ 92,801 $ 90,348 1.00 $ 90,348 $ 94,858 $ 94,858 1.00 $ 94,858Policy Analyst 50,000 0.50 25,000 25,000 50,000 0.50 25,000Fringe Benefits 36,655 25,285 43,500 44,238 48,971Workers' Compensation 35 35Capitalized Labor/Fringe (26,487) (28,343) (0.75) (80,763) (83,921) (0.75) (85,188)Total $ 104,678 $ 89,7430.75 $ 78,120 $ 80,2100.75 $ 83,640GM-6
BUD2 Materials & Services OFFICE OF THE GENERAL MANAGER - DIVERSITY AND TRANSIT EQUITYActual Actual <strong>Budget</strong> Estimate <strong>Budget</strong> % Change % ofExpense Category 10/11 11/12 12/13 12/13 13/14 FY13-<strong>FY14</strong> M & S TotalFirst Step Youth $ 94,628 $ 130,919 $ 111,448 $ 111,448 $ 114,4572.70% 75.70%SOLV 5,000 3.31%Other Services 2,541 6,893 9,761 9,761 10,025 2.70% 6.63%Other Materials 28 0.00%Community Outreach 3,504 3,525 34,064 34,064 9,609 -71.79% 6.36%Telephone 542 923 913 913 338 -62.95% 0.22%Dues & Subscriptions 646 242 900 900 924 2.70% 0.61%Local Travel 50 388 431 431 443 2.70% 0.29%Education & Training 350 375 834 834 857 2.76% 0.57%Out-of-Town Travel 5,186 7,084 9,000 9,000 9,541 6.01% 6.31%Total $ 107,447 $ 150,376 $ 167,351 $ 167,351 $ 151,194-9.65% 100.00%GM-7
Department Summary OFFICE OF THE GENERAL MANAGER - INTERNAL AUDITActual <strong>Budget</strong> Estimate <strong>Budget</strong> % Change % of10/11 11/12 12/13 12/13 13/14 FY13 - <strong>FY14</strong> Dept. TotalPersonnel Services $ 227,135 $ 226,364 $ 222,794 $ 227,774 $ 229,1922.87% 95.41%Materials & Services 6,340 4,167 10,736 4,512 11,026 2.70% 4.59%Total $ 233,475 $ 230,531 $ 233,530 $ 232,286 $ 240,2172.86% 100.00%Responsibility:The Internal Audit Department per<strong>for</strong>ms audits and provides advisory servicesto give the District reasonable assurance that its control objectives are met. Thekey control objectives are:• Safeguarding and proper maintenance of assets.• Compliance with laws, regulations, contracts, plans, policies andprocedures.• Reliability and integrity of financial and operating in<strong>for</strong>mation.• Economical and efficient use of resources.Per<strong>for</strong>mance Measures:• Complete the projects identified in the Internal Audit’s Annual Plan.• Realize the improvement goals specified in the Annual Plan.• Receive at least 90% positive responses from customers on audit quality.GM-8
BUD1 Personnel Services OFFICE OF THE GENERAL MANAGER - INTERNAL AUDIT10/11 11/12 12/13 12/1313/14Actual Actual ---------<strong>Budget</strong>---------- Est ---------<strong>Budget</strong>----------Position Title Total Total Base Pos Total Total Base Pos TotalManager, Internal Audit $ 99,589 $ 99,589 $ 99,973 1.00 $ 99,973 $ 102,542 $ 102,542 1.00 $ 102,542Senior Internal Auditor 66,820 66,820 67,087 1.00 67,087 68,800 68,800 1.00 68,800Fringe Benefits 60,726 59,955 55,651 56,351 57,850Workers' Compensation 82 82Total $ 227,135 $ 226,3642.00 $ 222,794 $ 227,7742.00 $ 229,192GM-9
BUD2 Materials & Services OFFICE OF THE GENERAL MANAGER - INTERNAL AUDITActual Actual <strong>Budget</strong> Estimate <strong>Budget</strong> % Change % ofExpense Category 10/11 11/12 12/13 12/13 13/14 FY13-<strong>FY14</strong> M & S TotalOther Services $ 158$ 1622.70% 1.47%Telephone $ 203 $ 110300 $ 112308 2.70% 2.79%Dues & Subscriptions 260 936 1,000 1,310 1,027 2.70% 9.31%Local Travel 5 350 359 2.70% 3.26%Education & Training 4,887 1,260 8,000 3,090 8,216 2.70% 74.52%Out-of-Town Travel 985 1,861 928 953 2.70% 8.64%Total $ 6,340 $ 4,167 $ 10,736 $ 4,512 $ 11,0262.70% 100.00%GM-10
BUDGET PROGRESSION SCHEDULE - OFFICE OF THE GENERAL MANAGERActual Actual Adopted Proposed <strong>Approved</strong> Adopted10/11 11/12 12/13 13/14 13/14 13/14Office of the General Manager$ 500,540 $ 493,520 $ 581,902 Personnel Services $ 802,622 $ 804,218447,123 393,108 453,646 Materials & Services 444,486 444,486$ 947,663 $ 886,628 $ 1,035,548 Department Total $ 1,247,108 $ 1,248,704Diversity and Transit Equity$ 104,678 $ 89,743 $ 78,120 Personnel Services $ 83,640 $ 83,640107,447 150,376 167,351 Materials & Services 151,194 151,194$ 212,126 $ 240,119 $ 245,471 Department Total $ 234,834 $ 234,834Internal Audit$ 227,135 $ 226,364 $ 222,794 Personnel Services $ 229,192 $ 229,1926,340 4,167 10,736 Materials & Services 11,026 11,026$ 233,475 $ 230,531 $ 233,530 Department Total $ 240,217 $ 240,217Division Total$ 832,353 $ 809,627 $ 882,815 Personnel Services $ 1,115,454 $ 1,117,050560,910 547,651 631,733 Materials & Services 606,706 606,706$ 1,393,264 $ 1,357,278 $ 1,514,548 Total Office of the General Manager $ 1,722,160 $ 1,723,756GM-11
[This Page Left Intentionally Blank]GM‐12
Division Summary PUBLIC AFFAIRSActual <strong>Budget</strong> Estimate <strong>Budget</strong> % Change % of10/11 11/12 12/13 12/13 13/14 FY13- <strong>FY14</strong> Dept. TotalPersonnel Services $ 5,968,084 $ 6,927,658 $ 5,913,254 $ 6,024,048 $ 6,152,5374.05% 59.89%Materials & Services 2,900,607 2,251,256 2,392,529 2,392,829 4,121,097 72.25% 40.11%Total $ 8,868,690 $ 9,178,914 $ 8,305,783 $ 8,416,877 $ 10,273,63423.69% 100.00%PagePublic Affairs DivisionDivision Summary………………………………………………………………PA-1Administration………………………………………………………………PA-2Operating Projects………………………………………………………………PA-5Planning & Policy………………………………………………………………PA-6Government Affairs………………………………………………………………PA-9Communications………………………………………………………………PA-12Organization Development ………………………………………………………………PA-15Customer In<strong>for</strong>mation Services ………………………………………………………………PA-18PA-1
Department Summary PUBLIC AFFAIRS - ADMINISTRATIONActual <strong>Budget</strong> Estimate <strong>Budget</strong> % Change % of10/11 11/12 12/13 12/13 13/14 FY13 - <strong>FY14</strong> Dept. TotalPersonnel Services $ 180,629 $ 260,816 $ 263,442 $ 264,3761.37% 88.10%Materials & Services 11,067 34,783 34,783 35,722 2.70% 11.90%Total $ 191,696 $ 295,599 $ 298,224 $ 300,098 100.00% 100.00%Responsibility:The Public Affairs Administration Division is composed of the followingdepartments: Administration, Planning & Policy, Government Affairs,Communications and Customer In<strong>for</strong>mation Services. The division:• Builds ridership through marketing campaigns, promotions and customerservice.• Strengthens community awareness through community outreach.• Effectively communicates agency goals to the <strong>TriMet</strong> Board of Directors,elected officials and the general public.• Communicates on capital projects, service planning and marketing activities.• Manages intergovernmental relations around long-range funding, policydevelopment and implementation with local, regional, state and federallegislative and administrative officials.• Provide responsive and cost-effective transit planning in key regionalcorridors, improve access to transit and develop <strong>TriMet</strong>’s Transit InvestmentPlan.Activities:• Customer In<strong>for</strong>mation Services- Build and retain ridership.- Marketing and promotion.- Provide excellent customer service, outreach and in<strong>for</strong>mation.- Research analysis on regional needs.Activities - continued:• Communications- Build and retain ridership.- Respond to all media and public request <strong>for</strong> in<strong>for</strong>mation.- Build and establish external partnerships that are key to <strong>TriMet</strong>’s success.• Government Affairs- Communicate with local, regional, state and federal jurisdictions andpartners.- Indentify and participate in decisions impact transit operations and stability.• Planning & Policy- Lead development of the Transit Investment Plan.- Produce the Westside Service Enhancement Plan and work on the EastsideService Enhancement Plan.- Promote safe access to transit through investment in the pedestrian network.Per<strong>for</strong>mance Measures:• Per<strong>for</strong>mance ratings from the general public.• Implementation of the 5-Year Transit Investment Plan (TIP).• Implementation of regional transportation goals that support a sustainabletransportation network.• Increase ridership on Frequent Service, Bus and MAX light rail lines.• Ensure all agency activities and ef<strong>for</strong>ts focus on agency principles and goals.• Implementation of the Agency-wide More & Better 5-Year Plan.PA-2
BUD1 Personnel Services PUBLIC AFFAIRS - ADMINISTRATION10/11 11/12 12/13 12/1313/14Actual Actual ---------<strong>Budget</strong>---------- Est ---------<strong>Budget</strong>----------Position Title Total Total Base Pos Total Total Base Pos TotalExecutive Director $ 109,095 $ 152,466 1.00 $ 152,466 $ 152,466 $ 152,466 1.00 $ 152,466Administrative Coordinator 21,372 46,206 1.00 46,206 48,462 48,462 1.00 48,462Fringe Benefits 50,471 62,144 62,513 63,448Capitalized Labor/Grant (309)Total $ 180,629$ 260,816 $ 263,4422.00 $ 264,376PA-3
BUD2 Materials & Services PUBLIC AFFAIRS - ADMINISTRATIONActual Actual <strong>Budget</strong> Estimate <strong>Budget</strong> % Change % ofExpense Category 10/11 11/12 12/13 12/13 13/14 FY13-<strong>FY14</strong> M & S TotalStudent Pass/BETC Program $ 4,750Other Services $ 7,000 $ 7,000 $ 5,189 -25.87% 14.53%Office Supplies 28Other Materials 14 1,500 1,500 3,541 136.07% 9.91%Telephone 165 2,296 2,296 1,358 -40.85% 3.80%Dues & Subscriptions 10,135 10,135 10,409 2.70% 29.14%Local Travel & Meetings 69 2,492 2,492 2,559 2.69% 7.16%Education & Training 319 1,968 1,968 2,021 2.69% 5.66%Out-of-Town Travel 5,722 9,392 9,392 10,645 13.35% 29.80%Total $ 11,067 $ 34,783 $ 34,783 $ 35,722 2.70% 100.00%PA-4
BUD2 Materials & Services PUBLIC AFFAIRS - OPERATING PROJECTSActual Actual <strong>Budget</strong> Estimate <strong>Budget</strong> % Change % ofExpense Category 10/11 11/12 12/13 12/13 13/14 FY13-<strong>FY14</strong> Projects TotalBike to Transit Facilities $ 368$ 25,000 $ 25,000 $ 25,000 0.00% 9.62%Customer Assistance Office Refurbishment 60,000 60,000 -100.00% 0.00%Transit Tracker Displays (Blue & Red Line) 235,000 90.38%Pedestrian Network 16,956 0.00%Limited English Proficiency 143,811 0.00%Regional Transportation Option 408,556 0.00%$ 569,691$ 85,000 $ 85,000 $ 260,000 205.88% 100.00%PA-5
Department Summary PUBLIC AFFAIRS - PLANNING & POLICYActual <strong>Budget</strong> Estimate <strong>Budget</strong> % Change % of10/11 11/12 12/13 12/13 13/14 FY13 - <strong>FY14</strong> Dept. TotalPersonnel Services $ 398,669 $ 914,259 $ 965,964 $ 986,943 $ 876,801-9.23% 31.93%Materials & Services 51,348 4,092 341,540 341,840 1,869,578 447.40% 68.07%Total $ 450,017 $ 918,351 $ 1,307,503 $ 1,328,783 $ 2,746,379 110.05% 100.00%Responsibility:The Planning & Policy Department provides responsive and cost-effectiveplanning and design of transit corridor projects, regional planning, access totransit, strategic policy and service planning, including developing <strong>TriMet</strong>’sTransit Investment Priorities. These projects and programs are consistent withthe Regional Transportation Plan, the Capital Improvement Program, <strong>TriMet</strong>’svision and mission and the General Manager’s 5-year Plan.Activities:• Lead development of <strong>TriMet</strong>’s Transit Investment Priorities.• Complete the Westside Service Enhancement Plan and begin work on theEastside Service Enhancement Plan, during <strong>FY14</strong>, and begin theSouthwest and Eastside Service Enhancement Plans.• Foster/improve partnerships with all jurisdictions operating in the regionon transportation planning, funding and related activities toward advancingaccess to transit and transit capital investments.• Prepare capital elements and corridor plans <strong>for</strong> Bus Rapid Transit in thePowell-Division and potentially other corridors.• Identify and advance opportunities to enhance access to transit throughpartnerships and/or grants. Develop and manage <strong>TriMet</strong>’s bicycle storageinfrastructure and <strong>for</strong>m partnerships to enhance pedestrian/bicycle accessto transit.• Understand and influence federal policy that impacts <strong>TriMet</strong>.• Provide support <strong>for</strong> planning design and project management <strong>for</strong> Portland-Milwaukie Light Rail Project.• Maintain and enhance technical relations with the Federal TransitAdministration.Activities - continued:• Advance planning and conceptual design on the Southwest Corridorproject.• Work with bi-state partners on the Columbia River Crossing (CRC) projectand other elements related to the I-5 North corridor.• Provide development analysis and other geospatial project and TODanalysis <strong>for</strong> <strong>TriMet</strong>.• Foster potential major investment in transit by City of Hillsboro in theAmberglen-Tanasbourne area.• Manage policy and technical relations with Portland Streetcar.Per<strong>for</strong>mance Measures:• Produce a well-received Westside Service Enhancement Plan.• Produce and widely distribute Transit Investment Priorities.• Construct improvements in access to transit.• Develop required materials <strong>for</strong> continued success with FTA <strong>for</strong> the CRCproject.• Manage successful IGAs with City of Portland re: Portland Streetcar.• Periodically update development analysis in station areas.PA-6
BUD1 Personnel Services PUBLIC AFFAIRS - PLANNING & POLICY10/11 11/12 12/13 12/1313/14Actual Actual -----------<strong>Budget</strong>------------ Est ---------<strong>Budget</strong>----------Position Title Total Total Base Pos Total Total Base Pos TotalExecutive Director $ 165,022Director, Project Planning $ 120,176 $ 120,645 1.00 $ 120,645 $ 123,401 $ 123,401 1.00 $ 123,401Administrative Specialist 42,744 42,411 42,574 1.00 42,574 46,437 46,437 1.00 46,437Manager, Corridor Design 94,236 94,607 1.00 94,607 97,593Sr Mgr, Comm Programs & Serv Develop 91,837 92,185 1.00 92,185 94,336 94,336 1.00 94,336Senior Corridor Designer 76,030 1.00 76,030Engineer II 77,500 77,798 1.00 77,798 79,866 59,900 0.75 44,925Environmental Permit Coordinator 72,922 73,205 1.00 73,205 75,314Planner III 56,875 66,064 1.00 66,064 67,964 50,700 1.00 50,700Planner III 63,934 64,728 1.00 64,728 66,545 66,545 1.00 66,545Planner II 37,196 62,285 1.00 62,285 63,788 63,788 1.00 63,788Planner II - Active Transportation 50,764 17,572 50,968 1.00 50,968 50,968 54,204 1.00 54,204Strategic Planning Coordinator 64,490 64,490 64,728 1.00 64,728 66,545 66,545 1.00 66,545Fringe Benefits 100,566 175,110 286,478 290,117 260,346Workers' Compensation 113 113Capitalized Grant Labor/Fringe (24,917) (1.50) (135,537) (141,166) (1.00) (75,579)Sick & Vacation/Holiday Payoff 5,123 5,123 5,123Total $ 398,669 $ 914,2599.50 $ 965,964 $ 986,9438.75 $ 876,801PA-7
BUD2 Materials & Services PUBLIC AFFAIRS - PLANNING & POLICYActual Actual <strong>Budget</strong> Estimate <strong>Budget</strong> % Change % ofExpense Category 10/11 11/12 12/13 12/13 13/14 FY13-<strong>FY14</strong> M & S TotalProfessional & Technical $ 342$ 84,183 $ 84,183 $ 88,568 5.21% 4.74%Student Pass/BETC Program 42,818 0.00%Metro: Unified Work Program 225,000 225,000 225,000 0.00% 12.03%Other Services 131 572 572 587 2.62% 0.03%Intergovernmental Transfers 1,500,000 80.23%Office Supplies 1,706 1,706 1,752 2.70% 0.09%Other Materials 437 834 834 23,637 2734.17% 1.26%Telephone 876 $ 447 7,475 7,475 7,677 2.70% 0.41%Dues & Subscriptions 1,681 1,681 1,726 2.68% 0.09%Local Travel & Meetings (275) 100 0.00%Education & Training 389 325 2,410 2,710 2,475 2.70% 0.13%Travel & Meetings 5,668 17,679 17,679 18,156 2.70% 0.97%Out-of-Town Travel 963 3,220 0.00%$ 51,348 $ 4,092 $ 341,540 $ 341,840 $ 1,869,578 447.40% 100.00%PA-8
Department Summary PUBLIC AFFAIRS - GOVERNMENT AFFAIRSActual <strong>Budget</strong> Estimate <strong>Budget</strong> % Change % of10/11 11/12 12/13 12/13 13/14 FY13 - <strong>FY14</strong> Dept. TotalPersonnel Services $ 347,258 $ 346,681 $ 99,452 $ 103,198 $ 103,8324.40% 24.31%Materials & Services 359,687 297,525 309,753 309,753 323,251 4.36% 75.69%Total $ 706,945 $ 644,206 $ 409,205 $ 412,951 $ 427,0834.37% 100.00%Responsibility:The Government Affairs Department is responsible <strong>for</strong> managing on-goingintergovernmental relations and <strong>for</strong> long-range funding, policy developmentand implementation with local, regional, state and federal legislative andadministrative officials.Activities:• Develop, manage and coordinate governmental relations programs.• Establish effective communication with local, regional, state and federaljurisdictions and partners.• Develop, manage and coordinate long-range funding and policydevelopment.Per<strong>for</strong>mance Measures:• Ensure federal, state, regional and local understanding of <strong>TriMet</strong> policyand funding requirements; improve, expand revenue and funding.• Maintain a high level of support with administrative and legislativeofficials at all levels.• Establish a viable political framework <strong>for</strong> implementation of <strong>TriMet</strong>funding goals.• Provide the mechanisms and programs necessary to obtain financial,legislative and political support that will enable <strong>TriMet</strong> to fund andimplement its capital and operating programs.PA-9
BUD1 Personnel Services PUBLIC AFFAIRS - GOVERNMENT AFFAIRS10/11 11/12 12/13 12/1313/14Actual Actual ---------<strong>Budget</strong>---------- Est ---------<strong>Budget</strong>----------Position Title Total Total Base Pos Total Total Base Pos TotalExecutive Director $ 151,875 $ 151,875Administrative Coordinator 39,802 46,029Government Affairs Manager 65,156 72,921 $ 73,201 1.00 $ 73,201 $ 76,421 $ 76,421 1.00 $ 76,421Fringe Benefits 90,426 75,855 26,136 26,662 27,411Workers' Compensation 115 115Total $ 347,258 $ 346,6811.00 $ 99,452 $ 103,1981.00 $ 103,832PA-10
BUD2 Materials & Services PUBLIC AFFAIRS - GOVERNMENT AFFAIRSActual Actual <strong>Budget</strong> Estimate <strong>Budget</strong> % Change % ofExpense Category 10/11 11/12 12/13 12/13 13/14 FY13-<strong>FY14</strong> M & S TotalProfessional & Technical $ 201,798 $ 207,425 $ 241,715 $ 241,715 $ 253,376 4.82% 78.38%Other Services 75,030 5,725 3,062 3,062 1,145 -62.61% 0.35%Other Materials 1,489 1,063 560 560 575 2.68% 0.18%Telephone 3,952 1,618 917 917 521 -43.15% 0.16%Dues & Subscriptions 6,260 10,682 1,500 1,500 1,041 -30.60% 0.32%OTA Dues 55,740 55,700 57,299 57,299 58,846 2.70% 18.20%Local Travel & Meetings 3,824 3,822 1,500 1,500 1,961 30.73% 0.61%Education & Training 1,644 864 500 500 514 2.80% 0.16%Out-of-Town Travel 9,950 10,625 2,700 2,700 5,272 95.26% 1.63%Total $ 359,687 $ 297,525 $ 309,753 $ 309,753 $ 323,251 4.36% 100.00%PA-11
Department Summary PUBLIC AFFAIRS - COMMUNICATIONSActual <strong>Budget</strong> Estimate <strong>Budget</strong> % Change % of10/11 11/12 12/13 12/13 13/14 FY13 - <strong>FY14</strong> Dept. TotalPersonnel Services $ 275,676 $ 376,767 $ 521,174 $ 534,636 $ 601,06315.33% 97.03%Materials & Services 7,622 6,267 17,903 17,903 18,387 2.70% 2.97%Total $ 283,298 $ 383,034 $ 539,078 $ 552,539 $ 619,45014.91% 100.00%Responsibility:The Communications Department is responsible <strong>for</strong> facilitating open, two-waycommunication to in<strong>for</strong>m the community, the media and the agency’semployees of the successes, agency programs and initiatives and involve allconstituents in shaping agency decisions and direction. The CommunicationsDepartment is in full support of <strong>TriMet</strong>’s 5-Year Plan. The department supportsBuilding Partnerships <strong>for</strong> Transit Growth, specifically to “engage ourcustomers and constituents in ongoing conversations about service needs,improvements and funding.”Activities:Media Relations• Answer media inquiries and advise the media and the community of newef<strong>for</strong>ts and successes, as well as on-going agency activities.• Prepare public in<strong>for</strong>mation, fact sheets, articles and speeches.• Respond to citizen’s and transit industry’s in<strong>for</strong>mation requests.• Plan and develop strategies <strong>for</strong> in<strong>for</strong>ming the public of operations andpolicy changes.• In<strong>for</strong>m the public/media regarding service disruptions.Employee Communications• In<strong>for</strong>m employees about internal and external news about <strong>TriMet</strong>.• Per<strong>for</strong>m internal outreach to either gather in<strong>for</strong>mation from employees orto help educate regarding issues or concerns of the agency.• Work with Labor Relations & Human Resources to identify and distributeimportant benefits and HR in<strong>for</strong>mation.Activities - continued:Corporate Outreach• Work with Government Affairs, Customer In<strong>for</strong>mation Services, CapitalProjects as well as other agency departments to identify and implementoutreach opportunities <strong>for</strong> the General Manager.• Involve the General Manager n various community activities and arrangeoutreach opportunities through on-on-one meetings with communityleaders and stakeholders or through community roundtable events.Per<strong>for</strong>mance Measures:Media Relations• Respond to all media and employee inquiries within 24 hours.• Answer all questions within two days.• Pitch positive stories about <strong>TriMet</strong> and its work<strong>for</strong>ce.• Work with Legal in providing Public Records Request to the media.Employee Communications• Increase communication with employees.• Further develop existing employee communication channels, look <strong>for</strong> newways to communicate to the employee work<strong>for</strong>ce.• Increase awareness of <strong>TriMet</strong>’s internal programs and external initiatives.• Develop positive employee stories <strong>for</strong> both internal and external use.Corporate Outreach• Keep key stakeholders in<strong>for</strong>med and connected.• Build and establish external partnerships that are key to <strong>TriMet</strong>’s success.• Renew community partnerships.PA-12
BUD1 Personnel Services PUBLIC AFFAIRS - COMMUNICATIONS10/11 11/12 12/13 12/1313/14Actual Actual ---------<strong>Budget</strong>---------- Est ---------<strong>Budget</strong>----------Position Title Total Total Base Pos Total Total Base Pos TotalChief Media Relations Officer $ 107,394 $ 107,394 $ 107,803 1.00 $ 107,803 $ 109,745 $ 109,745 1.00 $ 109,745Director, Comm. & Corp. Outreach 44,224 95,359 1.00 95,359 98,199 100,245 1.00 100,245Manager, Corporate Outreach 82,560 1.00 82,560Public In<strong>for</strong>mation Officer 60,000 68,154 70,261 1.00 70,261 71,326 71,326 1.00 71,326Communications Coordinator 34,247 64,561 55,207 1.00 55,207 57,107 55,061 1.00 55,061Employee Comm. Coordinator 56,940 1.00 56,940 60,740 60,740 1.00 60,740Fringe Benefits 74,035 92,435 123,966 125,882 168,675Workers' Compensation 248 248Capitalized Grant Labor/Fringe (0.50) (58,679)Sick & Vacation/Holiday Payoff 11,390 11,390 11,390Total $ 275,676 $ 376,7675.00 521,174 534,636 5.50 $ 601,063PA-13
BUD2 Materials & Services PUBLIC AFFAIRS - COMMUNICATIONSActual Actual <strong>Budget</strong> Estimate <strong>Budget</strong> % Change % ofExpense Category 10/11 11/12 12/13 12/13 13/14 FY13-<strong>FY14</strong> M & S TotalOther Services $ 1,573$ 1,498 $ 1,498 $ 1,537 2.60% 8.36%Publications 983 $ 2,480 1,000 1,000 1,027 2.70% 5.59%Telephone 1,427 1,621 4,500 4,500 3,622 -19.51% 19.70%Dues & Subscriptions 2,585 1,912 660 660 678 2.73% 3.69%Local Travel & Meetings 54 55 2,500 2,500 1,568 -37.28% 8.53%Education & Training 1,000 198 2,170 2,170 2,229 2.72% 12.12%Employee Communications 2,060 2,060 2,116 2.72% 11.51%Out-of-Town Travel 3,515 3,515 5,610 59.58% 30.51%Total $ 7,622 $ 6,267 $ 17,903 $ 17,903 $ 18,387 2.70% 100.00%PA-14
Department Summary PUBLIC AFFAIRS - ORGANIZATION DEVELOPMENTPersonnel Services $ 355,707 $ 343,234Materials & Services 39,507 49,155Total $ 395,214 $ 392,389Actual <strong>Budget</strong> Estimate <strong>Budget</strong> % Change % of10/11 11/12 12/13 12/13 13/14 FY13- <strong>FY14</strong> Dept. TotalPA-15
BUD1 Personnel Services PUBLIC AFFAIRS - ORGANIZATION DEVELOPMENT10/11 11/12 12/13 12/1313/14Actual Actual ---------<strong>Budget</strong>--------- Est ---------<strong>Budget</strong>----------Position Title Total Total Base Pos Total Base Pos TotalDirector, Organization Development $ 106,373 $ 106,373Employee Comm. Coordinator 56,712 56,712Coordinator, Organization Development 86,908 79,656Fringe Benefits 105,714 100,493Total $ 355,707 $ 343,234PA-16
BUD2 Materials & Services PUBLIC AFFAIRS - ORGANIZATION DEVELOPMENTActual Actual <strong>Budget</strong> Estimate <strong>Budget</strong> % Change % ofExpense Category 10/11 11/12 12/13 12/13 13/14 FY13-<strong>FY14</strong> M & S TotalOther Services $ 732 $ 354Other Materials 270 2,176Telephone 270 295Education & Training 632 1,675Management Training 16,643 17,896Employee Communications 1,019Employee Development 1,484 887Awards & Banquets 19,475 24,852Total $ 39,507 $ 49,155PA-17
Department Summary PUBLIC AFFAIRS - CUSTOMER INFORMATION SERVICESActual <strong>Budget</strong> Estimate <strong>Budget</strong> % Change % of10/11 11/12 12/13 12/13 13/14 FY13 - <strong>FY14</strong> Dept. TotalPersonnel Services $ 4,590,773 $ 4,766,089 $ 4,065,847 $ 4,135,828 $ 4,306,4655.92% 72.74%Materials & Services 1,872,752 1,883,150 1,603,551 1,603,550 1,614,159 0.66% 27.26%Total $ 6,463,525 $ 6,649,239 $ 5,669,398 $ 5,739,378 $ 5,920,6244.43% 100.00%Responsibility:The Customer In<strong>for</strong>mation Services Department supports the agency’s 5-yearaction plan to deliver more and better service by communicating, representingand achieving safety-driven service excellence via an integrated approach tocreate the best possible experience <strong>for</strong> our customers. Our focus will remain onkey initiatives that seek to enhance ridership experience and build communitysupport in alignment with <strong>TriMet</strong>’s brand position and shared values.Activities:• Safety Education- Encourage safe behavior and increase awareness of what we do to helpkeep people safe.• Brand Management/Public Relations- Promote and protect <strong>TriMet</strong>’s key principles, aligning our vision withpublic perception by promoting and strengthening communitycustomer experience.• Ridership- Promote , support and provide training <strong>for</strong> amenities, tools and serviceto our riders and prospects to enhance the customer experience.• Customer In<strong>for</strong>mation- Deliver timely, accurate in<strong>for</strong>mation to riders via static and dynamiccontent channels proactively and in response to customer inquiries.Activities - continued:• Revenue Generation- Manage pass programs, partnerships and advertising/promotionalopportunities to maximize revenue and/or leverage resources.Per<strong>for</strong>mance Measures:• Safety Education- Develop and facilitate Safety Education Advisory Committee,increasing the visibility of safety-related outreach and events.• Brand Management/Public Relations- Promote key agency themes, maintaining favorability ratings.• Ridership- Promote Technology tools, increasing active use of rider services viaweb, digital displays and mobile devices.• Customer In<strong>for</strong>mation- Provide timely and relevant customer in<strong>for</strong>mation, completingquarterly service change in<strong>for</strong>mation across all channels accuratelyand on-time.- Meet Service Improvement Process (SIP) response targets.• Revenue Generation- Evaluate and update employer/college pass programs towardcontinued growth.- Develop new channels <strong>for</strong> advertising revenue, including website ads.PA-18
BUD1 Personnel Services PUBLIC AFFAIRS - CUSTOMER INFORMATION SERVICES10/11 11/12 12/13 12/1313/14Actual Actual ---------<strong>Budget</strong>---------- Est ---------<strong>Budget</strong>----------Position Title Total Total Base Pos Total Total Base Pos TotalCustomer In<strong>for</strong>mation Services:Director, Customer In<strong>for</strong>mation Services $ 124,128 $ 124,128 $ 124,612 1.00 $ 124,612 $ 127,305 $ 127,305 1.00 $ 127,305Manager, Marketing & Outreach Services 91,936 91,936 92,290 1.00 92,290 95,067 95,067 1.00 95,067Safety Outreach Coordinator 81,962 81,962 82,288 1.00 82,288 82,288 82,288 1.00 82,288Outreach Services Coordinator 67,587 62,950 63,183 1.00 63,183 65,104 65,104 1.00 65,104Manager, Multicultural Programs 57,772 72,895 75,544 1.00 75,544 77,611 77,611 1.00 77,611Transportation Options Coordinator 60,749 60,749 60,990 1.00 60,990 62,828 62,828 1.00 62,828Transportation Options Associate 40,104 40,317 40,570 1.00 40,570 40,570 40,570 1.00 40,570Sr. Transportation Options Representative 58,619 58,619 58,840 1.00 58,840 60,301 60,301 1.00 60,301Transportation Options Representative 48,974 48,974 49,172 1.00 49,172 50,279 50,279 1.00 50,279Transportation Options Specialist 42,427 45,427 45,602 1.00 45,602 46,625 46,625 1.00 46,625Administrative Specialist 34,462 34,627 43,242 0.80 34,594 35,713 44,641 0.80 35,713Manager, Customer In<strong>for</strong>mation 50,189 85,000 77,047 1.00 77,047 77,047 69,259 1.00 69,259Manager, Creative Services 89,221 89,221 89,554 1.00 89,554 92,081 92,081 1.00 92,081Business Systems Analyst 71,044 71,044 71,326 1.00 71,326 73,268 73,268 1.00 73,268Production Coordinator 39,267 47,098 47,982 1.00 47,982 49,193 49,193 1.00 49,193Video Production Specialist 13,837 14,657 27,102 0.50 13,551 13,927 27,854 0.50 13,927Coord. Sr. Comm/Interactive Media 57,971 60,671 58,193 1.00 58,193 61,680 72,370 1.00 72,370Customer Communications Coordinator 36,712 38,283 47,732 0.80 38,186 40,574 52,430 0.80 41,944Graphics & Web Designer 49,254 49,254 49,444 1.00 49,444 50,467 50,467 1.00 50,467Graphics & Web Designer 87,859 87,859 44,099 2.00 88,198 90,515 45,257 2.00 90,515Info. Development Specialist 252,890 254,915 67,123 3.00 201,369 201,369 67,123 4.00 268,492Coordinator, Info. Development 48,917 53,527 69,194 1.00 69,194 69,194Document Services Supervisor 45,011 45,011 45,184 1.00 45,184 46,416 46,416 1.00 46,416Document Services Operator 15,461 15,496 31,111 0.50 15,556 15,879 31,758 0.50 15,879Center Mail Services Clerk 44,366 44,741 47,408 1.00 47,408 47,408 47,408 1.00 47,408Mail Services Clerk 15,461 15,496 31,111 0.50 15,556 15,879 31,758 0.50 15,879Manager, Market Analysis 84,576 89,214Senior Research Analyst 65,761 65,761 66,023 1.00 66,023 67,818 67,818 1.00 67,818Coord. Sr. Fare Policy Program 69,029 69,029 69,301 1.00 69,301 75,544 75,544 1.00 75,544Web Service Coordinator/Librarian 37,292Web Coordinator 15,900 53,000 53,202 1.00 53,202 54,664 54,664 1.00 54,664Manager, GIS & Location Based Services 107,466 107,887 1.00 107,887 111,123 111,123 1.00 111,123GIS Data Analyst II 63,746 63,997 1.00 63,997 65,605 65,605 1.00 65,605Bus Stops Planner/Analyst 65,198 65,438 1.00 65,438 67,108 67,108 1.00 67,108PA-19
BUD1 Personnel Services PUBLIC AFFAIRS - CUSTOMER INFORMATION SERVICES10/11 11/12 12/13 12/1313/14Actual Actual ---------<strong>Budget</strong>---------- Est ---------<strong>Budget</strong>----------Position Title Total Total Base Pos Total Total Base Pos TotalFringe Benefits $ 832,559 $ 843,990$ 846,105 $ 854,154$ 887,465Workers' Compensation (630) 2,393 5,596 5,596 500Capitalized Fringe/Labor (499,445)Longevity Premium 626 626 626Unscheduled Overtime 5,228 5,635 16,294 16,294 16,294Limited Term Employment 8,442 9,096 19,167 19,167 9,167Customer Service:Director, Customer Service 94,164 140,417Manager, Customer Programs 72,840Administrative Specialist 49,567 24,697On-Street Cust. Service Coordinator 52,127 51,729 51,553 1.00 51,553 53,098 53,098 1.00 53,098Customer Assistant Supervisor 70,930Special Needs Coordinator 62,338Customer Service Specialist 510,304 42,038Customer Service Representative 217,600 213,418 59,220 4.00 236,879 236,879 59,220 8.00 473,759Supervisor, Customer Services 65,279 53,618 69,194 1.00 69,194 69,194 69,194 1.00 69,194Customer Service Trip Planner 187,240 173,042 42,758 3.50 149,653 149,653Manager, On Street Customer Service 72,115 72,115 72,391 1.00 72,391 76,254 76,254 1.00 76,254Field Out. & Comm. Rel. Representative 60,427 79,079 26,225 3.00 78,675 84,188 28,063 3.00 84,188On-Street Program Assistant 23,319 37,928 37,584 1.00 37,584 37,584 35,559 1.00 35,559Fringe Benefits 800,893 796,765 353,847 355,686 420,295Workers' Compensation 1,068 1,068 2,886Longevity Premium 626Union Insured Premium Repayment 7,234 7,234Unscheduled Overtime 6,740 11,859 5,315 5,315 5,315Extra Service Pay 15,584 15,584 20,509Premium Pay 1,045 1,045 1,045Sick & Vacation/Holiday Payoff 16,758 16,758 17,034Total $ 4,590,773 $ 4,766,08947.60 $ 4,065,847 $ 4,135,82848.10 $ 4,306,465PA-20
BUD2 Materials & Services PUBLIC AFFAIRS - CUSTOMER INFORMATION SERVICESActual Actual <strong>Budget</strong> Estimate <strong>Budget</strong> % Change % ofExpense Category 10/11 11/12 12/13 12/13 13/14 FY13-<strong>FY14</strong> M & S TotalCustomer In<strong>for</strong>mation Services:Advertising Production $ 169,028 $ 113,530 $ 123,600 $ 123,600 $ 126,937 2.70% 7.86%Professional & Technical 32,974 22,908 31,628 31,628 32,482 2.70% 2.01%Fare Program 45,176 45,176 36,627 -18.92% 2.27%Consumer Research 83,921 21,449 91,670 91,670 94,145 2.70% 5.83%Temporary Help 8,458 8,458 8,687 2.70% 0.54%Software Maintenance 53,371 51,748 56,122 56,122 57,637 2.70% 3.57%Photocopier Maint - Doc Svcs 22,963 23,101 34,106 34,106 35,027 2.70% 2.17%Other Services 27,287 47,202 37,220 37,220 41,164 10.60% 2.55%Graphics Materials 17,316 3,374 10,606 10,606 10,892 2.70% 0.67%Schedules 179,786 158,089 165,000 165,000 169,455 2.70% 10.50%Office Supplies 13,506 8,640 10,227 10,227 10,503 2.70% 0.65%Other Materials 4,276 2,038 3,152 3,152 3,237 2.70% 0.20%Postage 41,445 41,777 61,378 61,378 60,096 -2.09% 3.72%LEP Research 28,818 45,170 0.00%Doc Services Supplies 34,787 41,719 25,339 25,339 26,023 2.70% 1.61%Promotions 100,482 94,760 145,320 145,320 142,325 -2.06% 8.82%Schedule Books & Map 18,608 22,804 13,000 13,000 13,351 2.70% 0.83%Outreach 67,991 46,472 59,004 59,004 60,597 2.70% 3.75%Vanpool Shuttles 41,726 41,684 52,530 52,530 53,948 2.70% 3.34%Customer In<strong>for</strong>mation Materials 10,639 11,033 11,033 11,331 2.70% 0.70%Sales Programs 17,233 19,354 17,474 17,474 17,946 2.70% 1.11%ADA Customer In<strong>for</strong>mation 655 0.00%On-Street Customer In<strong>for</strong>mation 214,379 18,611 192,216 192,216 197,406 2.70% 12.23%Telephone 20,255 282,541 27,806 27,806 10,557 -62.03% 0.65%Dues & Subscriptions 5,841 8,699 8,699 8,934 2.70% 0.55%Chamber Dues/Fees 10,195 7,122 9,890 9,890 10,157 2.70% 0.63%Local Travel & Meetings 1,314 9,337 4,722 4,722 4,849 2.69% 0.30%Education & Training 5,348 513 9,414 9,414 9,668 2.70% 0.60%Phone Directory Listings (1,772) 4,318 2,627 2,627 697 -73.46% 0.04%PDC/LTMA Digital Display Cell Comm 7,651 9,357 0.00%Media Fees 203,033 303,489 251,920 251,920 258,722 2.70% 16.03%Web Software 12,000 13,614 12,607 12,607 16,948 34.43% 1.05%Microcomputer Software 515 515 529 2.72% 0.03%Out-of-Town Travel 2,318 2,318 2,380 2.70% 0.15%Subtotal Customer In<strong>for</strong>mation Services: 1,445,055 1,454,721 1,524,777 1,524,777 1,533,257PA-21
BUD2 Materials & Services PUBLIC AFFAIRS - CUSTOMER INFORMATION SERVICESActual Actual <strong>Budget</strong> Estimate <strong>Budget</strong> % Change % ofExpense Category 10/11 11/12 12/13 12/13 13/14 FY13-<strong>FY14</strong> M & S TotalCustomer Service:Uni<strong>for</strong>ms $ 680 $ 1,745Professional & Technical 710 $ 7,210 $ 7,210 $ 7,405 2.70% 0.46%Temporary Help 500 500 514 2.80% 0.03%Equipment Maintenance 198 198CAO Office Maintenance 30,150 25,760Other Services 38,640 43,509 4,666 4,666 2,792 -40.16% 0.17%Tickets & Passes 231,979 247,930Office Supplies 11,359 11,628 1,136 1,136 1,167 2.72% 0.07%Other Materials 38,246 27,657 2,189 2,189 2,248 2.71% 0.14%Postage 16,625 12,234 316 316 325 2.78% 0.02%On Street Customer Service 10,902 14,222 21,098 21,098 21,668 2.70% 1.34%Telephone 40,620 41,746 38,845 38,845 39,894 2.70% 2.47%Dues & Subscriptions 180 180 185 2.64% 0.01%Local Travel & Meetings 84 683Education & Training 8,215 408 2,233 2,233 4,293 92.25% 0.27%Customer Service Training 400 400 411 2.75% 0.03%Subtotal Customer Service: 427,697 428,429 78,774 78,773 80,902$ 1,872,752 $ 1,883,150 $ 1,603,551 $ 1,603,550 $ 1,614,159 0.66% 100.00%PA-22
BUDGET PROGRESSION SCHEDULE - PUBLIC AFFAIRSActual Actual Adopted Proposed <strong>Approved</strong> Adopted10/11 11/12 12/13 13/14 13/14 13/14Administration$ 180,629 $ 260,816 Personnel Services $ 264,376 $ 264,37611,067 34,783 Materials & Services 35,722 35,722$ 191,696 $ 295,599 Department Total $ 300,098 $ 300,098Operating Projects$ 569,691$ 85,000 Materials & Services $ 260,000 $ 260,000$ 569,691$ 85,000 Projects Total $ 260,000 $ 260,000Planning & Policy$ 398,669 $ 914,259 $ 965,964 Personnel Services $ 871,678 $ 876,80151,348 4,092 341,540 Materials & Services 1,869,578 1,869,578$ 450,017 $ 918,351 $ 1,307,503 Department Total $ 2,741,256 $ 2,746,379Government Affairs$ 347,258 $ 346,681 $ 99,452 Personnel Services $ 103,832 $ 103,832359,687 297,525 309,753 Materials & Services 323,251 323,251$ 706,945 $ 644,206 $ 409,205 Department Total $ 427,083 $ 427,083Communications$ 275,676 $ 376,767 $ 521,174 Personnel Services $ 589,673 $ 601,0637,622 6,267 17,903 Materials & Services 18,387 18,387$ 283,298 $ 383,034 $ 539,078 Department Total $ 608,060 $ 619,450Organization Development$ 355,707 $ 343,234Personnel Services39,507 49,155 Materials & Services$ 395,214 $ 392,389Department TotalCustomer In<strong>for</strong>mation Services$ 4,590,773 $ 4,766,089 $ 4,065,847 Personnel Services $ 4,292,131 $ 4,306,4651,872,752 1,883,150 1,603,551 Materials & Services 1,614,159 1,614,159$ 6,463,525 $ 6,649,239 $ 5,669,398 Department Total $ 5,906,290 $ 5,920,624Division Total$ 5,968,084 $ 6,927,658 $ 5,913,254 Personnel Services $ 6,121,690 $ 6,152,5372,900,607 2,251,256 2,392,529 Materials & Services 4,121,097 4,121,097$ 8,868,690 $ 9,178,914 $ 8,305,783 Total Public Affairs $ 10,242,787 $ 10,273,634PA-23
[This Page Left Intentionally Blank]PA‐24
Division Summary SAFETY & SECURITYActual <strong>Budget</strong> Estimate <strong>Budget</strong> % Change % of10/11 11/12 12/13 12/13 13/14 FY13- <strong>FY14</strong> Dept. TotalPersonnel Services $ 1,010,535 $ 1,159,618 $ 1,338,164 $ 1,361,795 $ 1,373,4202.63% 9.33%Materials & Services 9,183,794 10,341,527 12,096,926 11,955,498 13,352,740 10.38% 90.67%Total $ 10,194,329 $ 11,501,145 $ 13,435,090 $ 13,317,293 $ 14,726,1609.61% 100.00%PageSafety & Security DivisionDivision Summary …………………………………………………………………SS-1Safety, Security and Environmental Services ……………………………………………SS-2Operating Projects …………………………………………………………………SS-7SS-1
Department Summary SAFETY & SECURITY - SAFETY, SECURITY AND ENVIRONMENTAL SERVICESActual <strong>Budget</strong> Estimate <strong>Budget</strong> % Change % of10/11 11/12 12/13 12/13 13/14 FY13- <strong>FY14</strong> Dept. TotalPersonnel Services $ 1,010,535 $ 1,159,618 $ 1,338,164 $ 1,361,795 $ 1,373,4202.63% 9.70%Materials & Services 9,183,794 10,341,527 11,657,926 11,666,926 12,778,741 9.61% 90.30%Total $ 10,194,329 $ 11,501,145 $ 12,996,090 $ 13,028,721 $ 14,152,1618.90% 100.00%Responsibility:The Safety, Security and Environmental Services Department is responsible<strong>for</strong> leading the entire <strong>TriMet</strong> organization in creating a culture of safety andservice excellence, in which safety is the fundamental value, which guides allagency decisions.Activities:Safety• Safety Management System Plan.• Safety data in<strong>for</strong>mation, acquisition/analysis and reporting.• Construction safety and fire/life safety.• Safety training and committees.• Safety assurance, audits and inspections.• Safety certification.• Hazard identification, evaluation and analysis.• Occupational Safety and Health.• Substance abuse management.• Interface with regulatory agencies.Environmental Services• Chemical hazardous waste management, tracking and reporting• Industrial Wastewater/Stormwater management, sampling, maintenanceand reporting.• Underground Injection Well (UIC) program management.• Under- and above-ground storage tank testing, maintenance and reporting.• Air emissions management and reporting.• Environmental clean-up and spill response.Activities:Security• <strong>TriMet</strong> transit police, transit security officers, and deputy district attorney.• Continually identify, assess and resolve transit security threats andvulnerabilities; collect, analyze security data and intelligence.• Security Program Plan.• Employee security awareness and training development.• Crime Prevention Through Environmental Design (CPTED) incorporatedinto <strong>TriMet</strong> projects.• Security certification and program audits.• Emergency preparedness, plans, organization equipment training andprocedures, exercises/evaluations <strong>for</strong> readiness to per<strong>for</strong>m the prevention,protection, response and recovery capabilities applicable to mass transitemployees and operations during catastrophic natural disasters or terroristattacks.• Coordinate and integrate <strong>TriMet</strong> emergency plans with emergencyresponse management jurisdictions in <strong>TriMet</strong>’s service area.• DHS transit security grants.Per<strong>for</strong>mance Measures:• <strong>TriMet</strong> workplace safety incident rates at or below transit industrystandards and rates of comparable mass transit agencies.• Reported crimes per 100,000 riders.• Sustain or improve <strong>TriMet</strong> customer perception of safety and security.• Fulfill all FTA and DHS safety and security program compliances andcompliance with environmental regulation certification requirements.SS-2
BUD1 Personnel Services SAFETY & SECURITY - SAFETY, SECURITY AND ENVIRONMENTAL SERVICES10/11 11/12 12/13 12/1313/14Actual Actual ---------<strong>Budget</strong>---------- Est ---------<strong>Budget</strong>----------Position Title Total Total Base Pos Total Total Base Pos TotalAdministration:Safety & Security Executive $ 155,000 $ 155,000 1.00 $ 155,000 $ 155,598 $ 155,598 1.00 $ 155,598Fringe Benefits 19,615 36,726 36,787 37,774Safety:Manager, System Safety Programs $ 89,029 89,029 89,366 1.00 89,366 91,747 91,747 1.00 91,747Manager, Emergency Management 83,608 83,608 83,938 1.00 83,938 86,151 86,151 1.00 86,151Senior Systems Safety Specialist 102,776 77,776 78,070 1.00 78,070 80,137 80,137 1.00 80,137System Safety Specialist 210,899 69,489 69,760 1.00 69,760 71,430 71,430 1.00 71,430Safety Analyst 55,000 51,341 67,922 1.00 67,922 67,922 67,922 1.00 67,922Drug & Alcohol Program Administrator 48,048 55,000 55,207 1.00 55,207 58,276 58,276 1.00 58,276Drug & Alcohol Program Specialist 51,860 48,233 1.00 48,233 49,381 49,381 1.00 49,381Fringe Benefits 218,713 243,542 182,744 184,899 188,548Workers' Compensation 8 326 326 505Unscheduled Overtime 4,331Security:Security Coordinator 69,916 72,807 67,745 1.00 67,745 67,745 67,745 1.00 67,745Exclusions Administrator 48,501 48,614 48,692 1.00 48,692 49,987 49,987 1.00 49,987Coordinator, Operations Services 60,357 60,357 60,594 1.00 60,594 63,413 63,413 1.00 63,413Fringe Benefits 81,459 82,776 74,930 75,659 80,569Workers' Compensation 118 118Longevity Premium 2,714 2,714 3,758Unscheduled Overtime 4,294 7,076 1,560 1,560 1,560Union Insured Premium Repayment 536 536Sick & Vacation/Holiday Payoff 2,812 2,812 2,825Capitalized Labor/Fringe (62,074) (12,604)SS-3
BUD1 Personnel Services SAFETY & SECURITY - SAFETY, SECURITY AND ENVIRONMENTAL SERVICES10/11 11/12 12/13 12/1313/14Actual Actual ---------<strong>Budget</strong>---------- Est ---------<strong>Budget</strong>----------Position Title Total Total Base Pos Total Total Base Pos TotalEnvironmental:Manager, Environmental Compliance $ 89,888 1.00 $ 89,888 $ 92,832 $ 92,832 1.00 $ 92,832Environmental Engineer I 67,254 1.00 67,254 67,254 67,254 1.00 67,254Fringe Benefits 54,029 54,510 56,008Total $ 1,010,535 $ 1,159,61813.00 1,338,164 1,361,795 13.00 $ 1,373,420SS-4
BUD2 Materials & Services SAFETY & SECURITY - SAFETY, SECURITY AND ENVIRONMENTAL SERVICESActual Actual <strong>Budget</strong> Estimate <strong>Budget</strong> % Change % ofExpense Category 10/11 11/12 12/13 12/13 13/14 FY13-<strong>FY14</strong> M & S TotalSafety:Professional & Technical $ 366 $ 35,000 $ 40,000 $ 160,000 357.14% 1.25%Internal Safety Audits 30,000 30,000 30,000 0.00% 0.23%Education & Training $ 1,460295 15,000 10,000 10,000 -33.33% 0.08%Dues & Subscriptions 175 1,200 2,000 0.02%Drug and Alcohol Testing 57,650 75,578 72,000 80,000 75,000 4.17% 0.59%Safety Occupational Services 76,807 80,241 83,000 85,000 85,000 2.41% 0.67%Rail Safety Oversight 209,907 52,630 148,229 149,529 -100.00% 0.00%Other Services 31,881 50,190 133,000 120,000 36,311 -72.70% 0.28%Office Supplies 835 1,037 1,000 1,000 1,000 0.00% 0.01%Other Materials 8,659 4,970 5,200 5,200 5,200 0.00% 0.04%Telephone 4,072 7,178 6,500 7,000 7,000 7.69% 0.05%Out-of-Town Travel 7,590 9,000 0.07%Sub-Total Safety: 391,448 280,074 528,929 528,929 420,511Security:Temporary Help 20,946 40,000 0.00%Police Security Contracts 7,130,640 7,281,247 9,121,912 8,958,400 10,178,008 11.58% 79.65%Deputy DA Contract 167,397 174,075 180,000 189,000 189,000 5.00% 1.48%Other Services - Security 830,005 1,391,301 900,000 834,012 915,468 1.72% 7.16%Building Security Maintenance 59,630 116,176 50,000 55,000 55,000 10.00% 0.43%Exclusion & Tow Hearings 141,799 197,497 150,000 180,000 180,000 20.00% 1.41%Canine Program 452,823 512,979 400,000 550,000 509,783 27.45% 3.99%Anti-Terrorism Team 358,360Other Services 2,695 85 10,000 4,000 4,000 -60.00% 0.03%Office Supplies 340 3,827 1,500 3,500 3,500 133.33% 0.03%Other Materials 2,245 350 1,000 500 500 -50.00% 0.00%Telephone 4,674 4,105 4,000 4,000 4,000 0.00% 0.03%Dues & Subscriptions 405Assault Reward 100 100Sub-Total Security: 8,792,347 10,061,453 10,818,412 10,818,412 12,039,259SS-5
BUD2 Materials & Services SAFETY & SECURITY - SAFETY, SECURITY AND ENVIRONMENTAL SERVICESActual Actual <strong>Budget</strong> Estimate <strong>Budget</strong> % Change % ofExpense Category 10/11 11/12 12/13 12/13 13/14 FY13-<strong>FY14</strong> M & S TotalEnvironmental:Environmental Consulting $ 32,000 $ 32,000 $ 29,863 -6.68% 0.23%Contracted Maintenance - Environmental 25,585 18,000 24,276 -5.12% 0.19%Environmental Services 40,000 35,000 41,080 2.70% 0.32%Waste Disposal Services 200,000 212,585 210,400 5.20% 1.65%Office Supplies 1,000 10,000 1,027 2.70% 0.01%Environmental Materials 8,000 8,000 8,216 2.70% 0.06%"Green Team" Materials 1,500 1,500 1,541 2.73% 0.01%Telephone 2,500 2,500 2,568 2.72% 0.02%Sub-Total Environmental: 310,585 319,585 318,971$ 9,183,794 $ 10,341,527 $ 11,657,926 $ 11,666,926 $ 12,778,741 9.61% 100.00%SS-6
BUD2 Materials & Services SAFETY & SECURITY - OPERATING PROJECTSActual Actual <strong>Budget</strong> Estimate <strong>Budget</strong> % Change % ofExpense Category 10/11 11/12 12/13 12/13 13/14 FY13-<strong>FY14</strong> Projects TotalAll Facilities Maintenance Environmental $ 50,000 $ 49,907 $ 125,000 150.00% 21.78%System Security Improvements-Homeland Security Grant 428,999 74.74%Storm Water Underground Injection Control Permit 250,000 99,665 -100.00% 0.00%Safety and Security-Consulting Services 139,000 139,000 -100.00% 0.00%TRACS - Door & Gate TRACS Readers 20,000 3.48%$ 439,000 $ 288,572 $ 573,999 30.75% 100.00%SS-7
BUDGET PROGRESSION SCHEDULE - SAFETY & SECURITYActual Actual Adopted Proposed <strong>Approved</strong> Adopted10/11 11/12 12/13 13/14 13/14 13/14Safety, Security and Environmental Services$ 1,010,535 $ 1,159,618 $ 1,338,164 Personnel Services $ 1,370,788 $ 1,373,4209,183,794 10,341,527 11,657,926 Materials & Services 12,778,741 12,778,741$ 10,194,329 $ 11,501,145 $ 12,996,090 Department Total $ 14,149,529 $ 14,152,161Operating Projects$ 439,000 Materials & Services $ 125,000 $ 573,999$ 439,000 Projects Total $ 125,000 $ 573,999Division Total$ 1,010,535 $ 1,159,618 $ 1,338,164 Personnel Services $ 1,370,788 $ 1,373,4209,183,794 10,341,527 12,096,926 Materials & Services 12,903,741 13,352,740$ 10,194,329 $ 11,501,145 $ 13,435,090 Total Safety & Security $ 14,274,529 $ 14,726,160SS-8
Division Summary INFORMATION TECHNOLOGYActual <strong>Budget</strong> Estimate <strong>Budget</strong> % Change % of10/11 11/12 12/13 12/13 13/14 FY13- <strong>FY14</strong> Dept. TotalPersonnel Services $ 5,410,581 $ 4,986,785 $ 4,827,292 $ 4,942,105 $ 5,158,8266.87% 66.71%Materials & Services 1,632,006 1,995,517 2,453,197 2,454,652 2,574,724 4.95% 33.29%Total $ 7,042,587 $ 6,982,302 $ 7,280,489 $ 7,396,757 $ 7,733,5506.22% 100.00%PageIn<strong>for</strong>mation Technology DivisionDivision Summary ………………………………………………………………IT-1In<strong>for</strong>mation Technology ………………………………………………………………IT-2Operating Projects ………………………………………………………………IT-6IT-1
Department Summary INFORMATION TECHNOLOGY - INFORMATION TECHNOLOGYActual <strong>Budget</strong> Estimate <strong>Budget</strong> % Change % of10/11 11/12 12/13 12/13 13/14 FY13- <strong>FY14</strong> Dept. TotalPersonnel Services $ 5,410,581 $ 4,986,785 $ 4,827,292 $ 4,942,105 $ 5,158,8266.87% 72.83%Materials & Services 1,311,149 1,547,796 1,908,397 1,908,451 1,924,124 0.82% 27.17%Total $ 6,721,730 $ 6,534,582 $ 6,735,689 $ 6,850,556 $ 7,082,9505.16% 100.00%Responsibility:The In<strong>for</strong>mation Technology Department is responsible <strong>for</strong> managingin<strong>for</strong>mation resources including corporate data, computing tools and networksused to carry out agency-wide business processes and management goals.Activities:• Customer support helpdesk.• Consulting services.• Business process analysis.• Data modeling and design.• Shared data repository.• System development standards.• Project development and maintenance.• Hardware and software acquisition.• Metropolitan-wide networks.• Desktop connectivity, e-mail and Internet.• Telephones and voice-mail.• System and network security.• Application training and support.Per<strong>for</strong>mance Measures:• Network and server availability exceeding 96% uptime, measured on a24-hour basis, using industry criteria.• Resolve/acknowledge/follow-up over 90 customer service calls perweekday, with average completion time not exceeding four hours.• Application developer and maintainer productivity exceeding 30 AU(Application Units) per year.IT-2
BUD1 Personnel Services INFORMATION TECHNOLOGY - INFORMATION TECHNOLOGY10/11 11/12 12/13 12/1313/14Actual Actual ---------<strong>Budget</strong>---------- Est ---------<strong>Budget</strong>----------Position Title Total Total Base Pos Total Total Base Pos TotalChief Technology Officer $ 170,625 $ 145,625 $ 146,181 1.00 $ 146,181 $ 149,960 $ 149,960 1.00 $ 149,960Administration:Manager, IT Planning & Project Manager 105,543 105,543 105,945 1.00 105,945 111,353 111,353 1.00 111,353In<strong>for</strong>mation Technology Admin Spec. 50,710 50,771 50,905 1.00 50,905 52,054 52,054 1.00 52,054Enterprise Systems Development:Software Developer, Lead 206,305 103,551 103,941 1.00 103,941 105,841 105,841 1.00 105,841Software Systems Engineer II 104,237 104,237 104,630 1.00 104,630 107,699 107,699 1.00 107,699Systems Analyst/Programmer IV 88,879 89,220 1.00 89,220 91,058 91,058 1.00 91,058Systems Analyst/Programmer IV 186,795 189,369 91,538 2.00 183,076 185,185 88,218 2.00 176,436Systems Analyst/Programmer IV 84,463 182,792 91,747 2.00 183,494 187,628 93,814 2.00 187,628Systems Analyst/Programmer IV 182,792 287,808 91,573 3.00 274,719 281,212 98,533 2.00 197,065IT Systems Analyst 79,813 80,083 80,117 1.00 80,117 82,309 79,302 1.00 79,302Java Web Programmer 91,847 91,847 92,206 1.00 92,206 93,584 93,584 1.00 93,584Web Applications Software Engineer 71,135 1.00 71,135Oracle Application Technology:Manager, Oracle Technology 131,015 131,015 131,523 1.00 131,523 134,843 134,843 1.00 134,843Oracle Applications Technical Lead 111,417 111,417 111,854 1.00 111,854 114,631 114,631 1.00 114,631Oracle Applications Program/Analyst II 100,365 100,364 100,746 1.00 100,746 103,272 103,272 1.00 103,272Client Server Database Administrator 119,274 119,274 119,726 1.00 119,726 123,234 123,234 1.00 123,234Oracle Applications Database Admin 109,589 109,589 110,017 1.00 110,017 113,859 113,859 1.00 113,859Oracle Database Architect 113,482 113,482 113,921 1.00 113,921 117,325 117,325 1.00 117,325Geographic In<strong>for</strong>mation Systems:Manager, GIS & Location Based Services 107,466Systems Analyst/Programmer IV 273,685GIS Data Analyst II 63,746Bus Stops Planner/Analyst 65,197Operations Systems:Manager, Operations Systems 111,275 111,275 111,708 1.00 111,708 115,049 115,049 1.00 115,049Software Systems Engineer - BDS 101,980 101,980 102,375 1.00 102,375 105,611 105,611 1.00 105,611Software Systems Engineer V 88,585 88,585 88,928 1.00 88,928 92,039 82,000 1.00 82,000Software Systems Engineer V 80,988 80,988 81,307 1.00 81,307 83,123 83,123 1.00 83,123IT-3
BUD1 Personnel Services INFORMATION TECHNOLOGY - INFORMATION TECHNOLOGY10/11 11/12 12/13 12/1313/14Actual Actual ---------<strong>Budget</strong>---------- Est ---------<strong>Budget</strong>----------Position Title Total Total Base Pos Total Total Base Pos TotalSoftware Systems Engineer V-PMLR $ 94,002 1.00 $ 94,002 $ 94,002Software Systems Engineer $ 86,255 $ 86,255 86,589 1.00 86,589 88,322 $ 88,322 1.00 $ 88,322Systems Analyst/Programmer IV 83,503 83,503 83,833 1.00 83,833 85,086 85,086 1.00 85,086Project Mgr, ITS Vehicle Technologies 83,553 83,553 83,875 1.00 83,875 90,160 90,160 1.00 90,160Networks & Communications:Manager, Network Communications 114,511 114,511 114,944 1.00 114,944 116,677 116,677 1.00 116,677Systems Engineer II 95,075 95,075 95,442 1.00 95,442 98,303 98,303 1.00 98,303Systems Engineer II 79,954 79,413 92,500 1.00 92,500 92,853 92,853 1.00 92,853Voice Systems Engineer II 13,383 77,326 77,632 1.00 77,632 79,365 79,365 1.00 79,365Systems Engineer I - Network 69,755 69,755 70,032 1.00 70,032 71,598 71,598 1.00 71,598PC Support Services:Manager, Technical Services 106,439 106,439 106,843 1.00 106,843 109,202 109,202 1.00 109,202Desktop Supervisor 65,936 65,936 66,190 1.00 66,190 67,839 67,839 1.00 67,839PC System Specialist II 61,996 61,958 60,573 1.00 60,573 62,160 62,160 1.00 62,160PC System Specialist II 61,044 61,187 60,573 1.00 60,573 62,160 62,160 1.00 62,160Systems Engineer II 73,624 74,001 75,585 1.00 75,585 79,678 79,678 1.00 79,678Systems Engineer II-Unix Server 157,327 69,576 80,304 1.00 80,304 80,304 94,357 1.00 94,357Systems Engineer II-Server 77,326 77,632 1.00 77,632 79,407 79,407 1.00 79,407Systems Engineer I 65,243 65,242 65,501 1.00 65,501 70,407 70,407 1.00 70,407Technical Services Supervisor 72,906 72,905 73,184 1.00 73,184 75,606 96,893 1.00 96,893Helpdesk Technician 54,439 43,915 43,222 1.00 43,222 48,191 48,191 1.00 48,191Helpdesk Associate 44,034 47,057Helpdesk Technician II 50,785 50,913 50,634 1.00 50,634 51,594Fringe Benefits 1,440,308 1,578,790 1,278,678 1,295,227 1,302,778Capitalized Labor/Fringe (330,035) (652,121) (3.61) (539,582) (549,472) (1.25) (193,654)Sick & Vacation/Holiday Payoff 37,053 37,053 37,053Workers' Compensation 18,665 2,014 2,014 429Limited Term 75,174Unscheduled Overtime 687 617 3,500 3,500 3,500Total $ 5,410,581 $ 4,986,78541.39 $ 4,827,292 $ 4,942,10541.75 $ 5,158,826IT-4
BUD2 Materials & Services INFORMATION TECHNOLOGY - INFORMATION TECHNOLOGYActual Actual <strong>Budget</strong> Estimate <strong>Budget</strong> % Change % ofExpense Category 10/11 11/12 12/13 12/13 13/14 FY13-<strong>FY14</strong> M & S TotalLegal $ 28,400$ 55,000Professional & Technical $ 15,086 79,676 $ 417,000 400,000 $ 392,459 -5.89% 20.40%Temporary Help 1,000 25,946 5,519 35,000 15,000 171.79% 0.78%Microcomputer Maintenance Service 1,779 1,907 8,300 5,000 5,000 -39.76% 0.26%Communications Systems Maintenance 310,099 253,891 359,850 308,250 360,000 0.04% 18.71%Hardware Maintenance 99,727 106,179 140,105 103,105 105,000 -25.06% 5.46%Software Maintenance-CCTV Systems 14,096 18,654 32,000 30,000 32,000 0.00% 1.66%Other Services 5,321 6,681 8,930 9,000 9,171 2.70% 0.48%Office Supplies 6,413 9,729 7,714 5,000 7,522 -2.49% 0.39%Other Materials 2,627 12,819 12,360 6,000 7,694 -37.75% 0.40%Unreconciled Mastercard Expense 1,632 0.00%Microcomputer Software 6,633 10,454 12,360 30,000 20,694 67.43% 1.08%Cable Plant Services 798 5,313 0.00%PCI Compliance Equipment 71,359 33,800 28,000 34,713 2.70% 1.80%Microcomputer Maintenance Material 8,301 16,040 13,390 15,000 15,732 17.49% 0.82%Telephone 24,981 9,596 15,191 15,000 12,601 -17.05% 0.65%Network Access Services 28,110 42,563 42,024 41,000 43,159 2.70% 2.24%Dues & Subscriptions 1,989 1,554 2,266 2,000 2,327 2.69% 0.12%Local Travel & Meetings 1,785 583 1,030 500 1,052 2.14% 0.05%Education & Training 31,002 25,420 15,000 15,000 15,500 3.33% 0.81%Out-of-Town Travel 7,682 16,664 14,400 14,400 14,500 0.69% 0.75%Software License Fees 743,720 802,736 767,158 791,196 830,000 8.19% 43.14%Total $ 1,311,149 $ 1,547,796 $ 1,908,397 $ 1,908,451 $ 1,924,1240.82% 100.00%IT-5
BUD2 Materials & Services INFORMATION TECHNOLOGY - OPERATING PROJECTSActual Actual <strong>Budget</strong> Estimate <strong>Budget</strong> % Change % ofExpense Category 10/11 11/12 12/13 12/13 13/14 FY13-<strong>FY14</strong> Projects TotalServers Replacement $ 2,280 $ 78,900 $ 78,900-100.00% 0.00%Telecommunications Network $ 18,2130.00%Desktop - SMS Upgrade 56,941 0.00%Cable Plant Replacement 14,561 $ 80,00012.30%Servers Replacement 13,899 0.00%Application/Database Servers Replacement 45,124 52,837 0.00%Desktop Computing Replacement 241,574 378,700 378,700 566,600 49.62% 87.09%IT Security Systems Replacement 10,938 236 5,000 5,000 4,000 -20.00% 0.61%Data Communications System Replacement 12,274 80,994 1,401 0.00%Data Communications Remote Access 6,000 6,000 -100.00% 0.00%Data Communications Switches & Routers 14,000 14,000 -100.00% 0.00%Data Communications Management Tools 11,200 11,200 -100.00% 0.00%Data Communications Cable Plant 30,000 30,000 -100.00% 0.00%Data Communications Wireless Network 21,000 21,000 -100.00% 0.00%Video Communications Systems Replacement 37,800 0.00%Transit Tracker by Phone Expansion 38,116 0.00%Bus Automatic Stop Announcement 100,000 32,000 0.00%Maint Systems Replace (Diagnostic) 10,791 0.00%$ 320,857 $ 447,721 $ 544,800 $ 546,201 $ 650,600 19.42% 100.00%IT-6
BUDGET PROGRESSION SCHEDULE - INFORMATION TECHNOLOGYActual Actual Adopted Proposed <strong>Approved</strong> Adopted10/11 11/12 12/13 13/14 13/14 13/14In<strong>for</strong>mation Technology$ 5,410,581 $ 4,986,785 $ 4,827,292 Personnel Services $ 5,121,773 $ 5,158,8261,311,149 1,547,796 1,908,397 Materials & Services 1,924,124 1,924,124$ 6,721,730 $ 6,982,302 $ 6,735,689 Department Total $ 7,045,897 $ 7,082,950Operating Projects$ 320,857 $ 447,721 $ 544,800 Materials & Services $ 670,600 $ 650,600$ 320,857 $ 447,721 $ 544,800 Projects Total $ 670,600 $ 650,600Division Total$ 5,410,581 $ 4,986,785 $ 4,827,292 Personnel Services $ 5,121,773 $ 5,158,8261,632,006 1,995,517 2,453,197 Materials & Services 2,594,724 2,574,724$ 7,042,587 $ 6,982,302 $ 7,280,489 Total In<strong>for</strong>mation Technology $ 7,716,497 $ 7,733,550IT-7
[This Page Left Intentionally Blank]IT‐8
Division Summary FINANCE & ADMINISTRATIONActual <strong>Budget</strong> Estimate <strong>Budget</strong> % Change % of10/11 11/12 12/13 12/13 13/14 FY13- <strong>FY14</strong> Dept. TotalPersonnel Services $ 4,254,543 $ 4,479,870 $ 6,025,238 $ 6,094,182 $ 8,091,06134.29% 52.70%Materials & Services 3,967,313 4,468,297 5,826,645 6,058,298 7,261,781 24.63% 47.30%Total $ 8,221,853 $ 8,948,167 $ 11,851,883 $ 12,152,480 $ 15,352,84229.54% 100.00%PageFinance & Administration DivisionDivision Summary ………………………………………………………………FA-1Administration ………………………………………………………………FA-2Operating Projects ………………………………………………………………FA-5Financial Services ………………………………………………………………FA-6<strong>Budget</strong>, Financial Analysis & Grants Administration……………………FA-9Risk Management ………………………………………………………………FA-12Procurement & Contracts ………………………………………………………………FA-15Fare Revenue………………………………………………………………FA-18FA-1
Department Summary FINANCE & ADMINISTRATION - ADMINISTRATIONActual <strong>Budget</strong> Estimate <strong>Budget</strong> % Change % of10/11 11/12 12/13 12/13 13/14 FY13- <strong>FY14</strong> Dept. TotalPersonnel Services $ 276,090 $ 293,184 $ 298,549 $ 300,976 $ 288,590-3.34% 17.71%Materials & Services 977,430 1,012,090 1,172,617 1,180,432 1,341,224 14.38% 82.29%Total $ 1,253,520 $ 1,305,274 $ 1,471,166 $ 1,481,408 $ 1,629,81410.78% 100.00%Responsibility:The Finance & Administration Division is responsible <strong>for</strong> managing agencyfinancial activities, assuring effective financial controls and planning <strong>for</strong> futurefinancial requirements. Activities in support of these responsibilities include:• <strong>Budget</strong> preparation and monitoring.• Financial analysis and <strong>for</strong>ecasting.• Accounting <strong>for</strong> agency assets and activities.• Payroll and related functions.• Cash management and investments.• Debt management and compliance.• Contracts and procurement.• Grants administration and reporting.• Capital Planning and project financing.• Workers Compensation program.• Public Liability claims and agency risk management.• Defined benefit pension plan accounting and oversight.• Deferred compensation (457) plan and defined contribution (401a) planmanagement and oversight.• Fare system and revenue collection controls and oversight.Per<strong>for</strong>mance Measures:• Accurate and timely communication of financial issues with GeneralManager and Board.• Publication of accurate and timely agency financial reports with nomaterial audit findings.• En<strong>for</strong>cement of appropriate financial controls to assure safety ofDistrict assets, including implementation of cash and fare revenuepolicies.• Publication of annual District budget consistent with state law, andassurance of ongoing compliance.• Implementation of debt and lease programs to meet agency capitalneeds.• En<strong>for</strong>cement of procurement and contracting process consistent withBoard policy and FTA requirements.• Establishment of appropriate risk management programs, includingcommercial and self-insurance. Implementation of self-insurance <strong>for</strong>healthcare by 2013.• Accurate reporting of District Defined Benefit pension plan assets andliabilities and oversight of plans.• Management of agency’s deferred compensation plan and definedcontribution plan to assure compliance with fiduciary duties.FA-2
BUD1 Personnel Services FINANCE & ADMINISTRATION - ADMINISTRATION10/11 11/12 12/13 12/1313/14Actual Actual ---------<strong>Budget</strong> ---------- Est ---------<strong>Budget</strong>----------Position Title Total Total Base Pos Total Total Base Pos TotalExecutive Director $ 155,000 $ 170,415 $ 175,000 1.00 $ 175,000 $ 175,663 $ 175,663 1.00 $ 175,663Executive Assistant 58,124 58,124 58,339 1.00 58,339 59,779 59,779 1.00 59,779Fringe Benefits 62,786 64,644 65,128 65,451 53,032Workers' Compensation 179 82 82 115Total $ 276,090 $ 293,1842.00 $ 298,549 $ 300,9762.00 $ 288,590FA-3
BUD2 Materials & Services FINANCE & ADMINISTRATION - ADMINISTRATIONActual Actual <strong>Budget</strong> Estimate <strong>Budget</strong> % Change % ofExpense Category 10/11 11/12 12/13 12/13 13/14 FY13-<strong>FY14</strong> M & S TotalProfessional & Technical $ 87,633 $ 125,657 $ 156,285 $ 137,100 $ 145,282 -7.04% 10.83%Legal 25,000 100,000 7.46%Office Equipment Service 250 250 257 2.80% 0.02%Other Services 2,506 5,792 2,000 3,500 4,000 100.00% 0.30%Office Supplies 1,057 1,361 415 415 350 -15.66% 0.03%Furniture & Equipment
BUD2 Materials & Services FINANCE & ADMINISTRATION - OPERATING PROJECTSActual Actual <strong>Budget</strong> Estimate <strong>Budget</strong> % Change % ofExpense Category 10/11 11/12 12/13 12/13 13/14 FY13-<strong>FY14</strong> Projects TotalElectronic Fare Implementation Plan $ 350,000 $ 650,000-100.00% 0.00%MAX Validators Replacement $ 60,00092.02%Fare Equipment Replacement 5,200 7.98%Total $ 350,000 $ 650,000 $ 65,200 -81.37% 100.00%FA-5
Department Summary FINANCE & ADMINISTRATION - FINANCIAL SERVICESActual <strong>Budget</strong> Estimate <strong>Budget</strong> % Change % of10/11 11/12 12/13 12/13 13/14 FY13- <strong>FY14</strong> Dept. TotalPersonnel Services $ 2,145,878 $ 1,500,373 $ 1,720,895 $ 1,744,257 $ 1,850,7867.55% 86.37%Materials & Services 1,115,078 135,596 1,307,647 1,273,431 292,173 -77.66% 13.63%Total $ 3,260,955 $ 1,635,969 $ 3,028,542 $ 3,017,688 $ 2,142,959 -29.24% 100.00%Responsibility:The Financial Services Department is responsible <strong>for</strong> the day-to-day financialactivities of <strong>TriMet</strong>. The department combines the following major functions:• Accounting.• Payroll and pension.Activities:• Financial reporting.• Grant accounting and compliance.• Development and evaluation of self insurance reserves.• Capital asset accounting.• Cash management, investing and cash flow analysis.• Accounts Receivable and revenue accounting.• Accounts Payable and disbursements.• Payroll and pension processing.• Pension accounting.• Employee benefit accounting.• Federal and State tax reporting.• Wage assignments and attachments.Per<strong>for</strong>mance Measures:• There should be no material audit findings generated by <strong>TriMet</strong>’s annualexternal audit.• Monthly financial reports should be prepared in a timely manner.• Payroll and pension payments should be processed accurately and in atimely manner.• Cash and asset management controls in place and operating effectively.• Controls over pension payments implemented and operating effectively.• Lease compliance procedures per<strong>for</strong>med in a timely manner, includingperiodic terminations according to schedule.FA-6
BUD1 Personnel Services FINANCE & ADMINISTRATION - FINANCIAL SERVICES10/11 11/12 12/13 12/1313/14Actual Actual ---------<strong>Budget</strong>---------- Est ---------<strong>Budget</strong>----------Position Title Total Total Base Pos Total Total Base Pos TotalDirector & Controller Fin Serv & Invest $ 108,508 $ 108,508 $ 108,931 1.00 $ 108,931 $ 117,095 $ 117,095 1.00 $ 117,095Manager, Accounting 104,324 85,329 92,352 1.00 92,352 92,352 92,352 1.00 92,352Sr Financial Systems Business Analyst 106,300 1.00 106,300Sr Accountant-Cash Management 70,000 70,000 70,261 1.00 70,261 73,017Grant Compliance Analyst 78,200 1.00 78,200Senior Financial Analyst III 59,420 72,901 63,976 1.00 63,976 63,976 63,976 1.00 63,976Revenue Accountant 43,989 44,126 45,163 1.00 45,163 49,903 49,903 1.00 49,903Financial Accountant 52,345 52,844 55,332 1.00 55,332 57,128 57,128 1.00 57,128Financial Accountant-Pension 54,496 54,496 54,706 1.00 54,706 56,480 56,480 1.00 56,480Financial Accountant-Payroll/Pension 47,806 1.00 47,806 47,806 55,207 1.00 55,207Finance Assistant 41,533 40,928 40,382 1.00 40,382 41,593 41,593 1.00 41,593Senior Accounts Payable Clerk 61,909 61,672 65,904 1.00 65,904 65,904 65,904 1.00 65,904Finance Clerk (Accounting) 110,240 110,064 58,894 2.00 117,788 117,788 58,894 2.00 117,788Senior Payroll Clerk 123,346 124,419 65,904 2.00 131,807 131,807 65,904 2.00 131,807Finance Clerk (Payroll) 110,864 105,305 58,894 2.00 117,788 117,788 58,894 1.00 58,894Finance Clerk (Payroll) 58,894 1.00 58,894Timekeeper 67,974 67,974 72,633 1.50 108,950 108,950 72,633 1.50 108,950Money Room Supervisor 70,817Money Room Clerk 350,032Fringe Benefits 649,549 576,093 470,716 473,635 530,633Workers' Compensation 173 667 667 645Longevity Premium 3,759 3,759 3,985Unscheduled Overtime 66,359 33,936 49,114 49,114 49,000Union Insured Premium Repayment 4,555 4,555Sick & Vacation/Holiday Payoff 5,938 5,938 6,051Limited Term Employment 65,000 65,000Capitalized Labor/Fringe (108,222)Total $ 2,145,878 $ 1,500,37317.50 $ 1,720,895 $ 1,744,25718.50 $ 1,850,786FA-7
BUD2 Materials & Services FINANCE & ADMINISTRATION - FINANCIAL SERVICESActual Actual <strong>Budget</strong> Estimate <strong>Budget</strong> % Change % ofExpense Category 10/11 11/12 12/13 12/13 13/14 FY13-<strong>FY14</strong> M & S TotalUni<strong>for</strong>ms - Fare Collection $ 940.00%Professional & Technical $ 1,841 6,421 $ 95,217 $ 50,000 $ 50,288 -47.19% 17.21%Banking Charges 875,804 1 1,140,000 1,140,000 160,000 -85.96% 54.76%Temporary Help 40,635 23,327 20,000 20,000 20,540 2.70% 7.03%Other Services 14,960 9,966 10,000 13,000 15,270 52.70% 5.23%Office Supplies 14,844 13,378 14,000 14,000 14,378 2.70% 4.92%Furniture & Equipment
Department Summary FINANCE & ADMINISTRATION - BUDGET, FINANCIAL ANALYSIS & GRANTS ADMINISTRATIONActual <strong>Budget</strong> Estimate <strong>Budget</strong> % Change % of10/11 11/12 12/13 12/13 13/14 FY13- <strong>FY14</strong> Dept. TotalPersonnel Services $ 444,088 $ 438,228 $ 545,806 $ 564,272 $ 584,7647.14% 15.65%Materials & Services 1,796,224 2,116,710 2,160,585 2,160,585 3,152,741 45.92% 84.35%Total $ 2,240,312 $ 2,554,939 $ 2,706,391 $ 2,724,857 $ 3,737,50538.10% 100.00%Responsibility:The Financial <strong>Budget</strong>, Analysis & Grants Administration Department is responsible<strong>for</strong> six major functions: Agency financial planning, <strong>for</strong>ecasting and budgeting,per<strong>for</strong>mance reporting and analysis, fare revenue analysis, grants administration, debtplanning and issuance, and financial planning and grant administration <strong>for</strong> regionalelderly and disabled transportation program.Activities:• Financial planning, <strong>for</strong>ecasting and analysis.• <strong>Budget</strong> preparation.• New Starts financials.• Grant applications and grants management.• Debt planning and issuance.• Passenger revenue analysis and <strong>for</strong>ecasting.• Capital Improvement Plan preparation.• Monthly Per<strong>for</strong>mance Report and Dashboard.• Special Transportation Fund Advisory Committee.• Ride Connection contract management.• Financial planning <strong>for</strong> regional Elderly and Disabled transportation• Miscellaneous costing, legislative and statistical analysis.• Monthly National Transit Database (NTD) reporting.• Annual National Transit Database (NTD) coordination and submission.• Continuing disclosure.Per<strong>for</strong>mance Measures:• Financial <strong>for</strong>ecast document and budget manual prepared by mid-December eachyear to begin the budget process. Includes revenue and ridership <strong>for</strong>ecasts based onbest available in<strong>for</strong>mation.• Communication with senior management regarding financial <strong>for</strong>ecast andbudgetary implications throughout the year.• <strong>Budget</strong> document completed annually on schedule to meet Oregon budget lawrequirements.• Accurate and topical analysis of monthly per<strong>for</strong>mance statistics and deliveredmonthly to Board.• Initiate grant submittal process within 48 hours <strong>for</strong> <strong>for</strong>mula grants.• Seek grant opportunities weekly and <strong>for</strong>ward opportunities to appropriate staff.Follow-up and assist staff with grant production if needed.• Respond to such in<strong>for</strong>mation/analysis requests from colleagues within 24 hourswith an estimate of when the analysis can be completed.• New Starts Financial Forecast and Operating and Maintenance reports completedas required by deadlines.• Elderly and Disabled Transportation Plan updated every three years. Maintaingood relations with regional partners and citizens involved in E&D transportation.• Assist in the production of bond official statements and complete requiredcontinuing disclosure <strong>for</strong> bond issues on time each year.FA-9
BUD1 Personnel Services FINANCE & ADMINISTRATION - BUDGET, FINANCIAL ANALYSIS & GRANTS ADMINISTRATION10/11 11/12 12/13 12/1313/14Actual Actual ---------<strong>Budget</strong>---------- Est ---------<strong>Budget</strong>----------Position Title Total Total Base Pos Total Total Base Pos TotalDirector, <strong>Budget</strong> Financial Analysis & Grants $ 121,347 $ 121,347 $ 121,814 1.00 $ 121,814 $ 129,727 $ 129,727 1.00 $ 129,727Senior Financial Analyst III 72,111 72,111 77,214 0.94 72,388 75,227 80,242 0.94 75,227Senior Financial Analyst III 58,251 58,251 77,966 0.75 58,475 60,776 81,035 0.75 60,776Senior Financial Analyst IV 77,665 77,665 77,966 1.00 77,966 81,014 81,014 1.00 81,014Senior Financial Analyst III 77,214 1.00 77,214 77,214 77,214 1.00 77,214Fringe Benefits 114,713 108,854 121,987 124,351 144,988Sick & Vacation/Holiday Payoff 15,817 15,817 15,817Workers' Compensation 145 145Total $ 444,088 $ 438,2284.69 $ 545,806 $ 564,2724.69 $ 584,764FA-10
BUD2 Materials & Services FINANCE & ADMINISTRATION - BUDGET, FINANCIAL ANALYSIS & GRANTS ADMINISTRATIONActual Actual <strong>Budget</strong> Estimate <strong>Budget</strong> % Change % ofExpense Category 10/11 11/12 12/13 12/13 13/14 FY13-<strong>FY14</strong> M & S TotalProfessional & Technical $ 48,326 $ 10,994 $ 10,994 $ 5,252 -52.23% 0.17%Economic Forecasts $ 22,986 21,756 23,690 23,690 24,330 2.70% 0.77%Ridership Counts & Surveys 30,806 17,111 113,000 113,000 98,592 -12.75% 3.13%Ride Connection 974,580 946,932 1,043,390 1,043,390 1,075,000 3.03% 34.10%Contracted Services-State STF 386,693 597,756 491,621 491,621 421,012 -14.36% 13.35%Accessibility Services-5310 376,477 479,743 457,916 457,916 1,496,000 226.70% 47.45%Other Services 4,003 4,326 10,891 10,891 20,628 89.40% 0.65%Office Supplies 18 346 420 420 432 2.70% 0.01%Other Materials 8,000 8,000 8,216 2.70% 0.26%Telephone 494 220 662 662 680 2.70% 0.02%Dues & Subscriptions 166 125 2,600 0.08%Local Travel & Meetings 68 0.00%Total $ 1,796,224 $ 2,116,710 $ 2,160,585 $ 2,160,585 $ 3,152,741 45.92% 100.00%FA-11
Department Summary FINANCE & ADMINISTRATION - RISK MANAGEMENTActual <strong>Budget</strong> Estimate <strong>Budget</strong> % Change % of10/11 11/12 12/13 12/13 13/14 FY13- <strong>FY14</strong> Dept. TotalPersonnel Services $ 470,022 $ 457,284 $ 460,549 $ 466,445 $ 466,6471.32% 92.98%Materials & Services 32,566 57,995 34,285 34,900 35,211 2.70% 7.02%Total $ 502,587 $ 515,279 $ 494,834 $ 501,345 $ 501,8581.42% 100.00%Responsibility:The Risk Management Department is responsible <strong>for</strong> managing the Workers’Compensation Program, the Light Duty Program and the Liability Claimsareas.Workers’ Compensation ProgramLight Duty ProgramLiability Claims• Claim management.• Claim investigation.• Claim determination.• Claim subrogation.• Claim reporting.• Litigation management.Per<strong>for</strong>mance Measures:Workers’ Compensation Program• Immediately address all situations of safety concern.• Assure the prudent allocation of agency resources in a manner thatoptimally addresses risks and exposures.Light Duty Program• Provide work <strong>for</strong> as many employees as possible.• Meet all reporting requirements to qualify <strong>for</strong> reimbursement from theState of Oregon <strong>for</strong> wage and job site modifications.Liability Claims• The number of new liability claims, each month on average, should beequal to or less than the number of liability claims closed each month.• Assure the prudent allocation of agency resources in a manner thatoptimally addresses risk and exposure.FA-12
BUD1 Personnel Services FINANCE & ADMINISTRATION - RISK MANAGEMENT10/11 11/12 12/13 12/1313/14Actual Actual ---------<strong>Budget</strong> ---------- Est ---------<strong>Budget</strong>----------Position Title Total Total Base Pos Total Total Base Pos TotalMgr, Workers' Comp & Liability Claims $ 88,946 $ 88,946 $ 89,283 1.00 $ 89,283 $ 91,392 $ 91,392 1.00 $ 91,392Claims Adjuster 69,728 68,807 67,860 1.00 67,860 68,507 68,507 1.00 68,507Claims Adjuster 69,851 69,851 70,115 1.00 70,115 71,034 71,034 1.00 71,034Claims Coordinator 63,648 63,648 63,893 1.00 63,893 65,250 65,250 1.00 65,250Secretary II 41,122 41,122 41,280 1.00 41,280 41,280 39,756 1.00 39,756Fringe Benefits 136,719 124,911 127,936 128,801 130,603Workers' Compensation 9 182 182 106Total $ 470,022 $ 457,2845.00 $ 460,549 $ 466,4455.00 $ 466,647FA-13
BUD2 Materials & Services FINANCE & ADMINISTRATION - RISK MANAGEMENTActual Actual <strong>Budget</strong> Estimate <strong>Budget</strong> % Change % ofExpense Category 10/11 11/12 12/13 12/13 13/14 FY13-<strong>FY14</strong> M & S TotalInsurance Fees - Adjustor $ 134Claims Services 1,515 $ 2,147 $ 1,786 $ 1,600 $ 1,834 2.70% 5.21%Temporary Help 718 23,328 840 750 863 2.70% 2.45%Other Services 24,092 23,584 24,164 26,000 24,816 2.70% 70.48%Office Supplies 5,406 6,578 4,985 5,000 5,120 2.70% 14.54%Other Materials 24 980 385 350 395 2.70% 1.12%Telephone 453 275 1,375 500 1,412 2.70% 4.01%Dues & Subscriptions 30 70 250 200 257 2.70% 0.73%Education & Training 195 250 500 500 514 2.70% 1.46%Out-of-Town Travel 783 0.00%Total $ 32,566 $ 57,995 $ 34,285 $ 34,900 $ 35,211 2.70% 100.00%FA-14
Department Summary FINANCE & ADMINISTRATION - PROCUREMENT & CONTRACTSActual <strong>Budget</strong> Estimate <strong>Budget</strong> % Change % of10/11 11/12 12/13 12/13 13/14 FY13- <strong>FY14</strong> Dept. TotalPersonnel Services $ 918,464 $ 975,257 $ 1,071,915 $ 1,086,735 $ 976,055-8.94% 94.33%Materials & Services 46,015 36,831 108,728 76,570 58,700 -46.01% 5.67%Total $ 964,479 $ 1,012,089 $ 1,180,643 $ 1,163,305 $ 1,034,755 -12.36% 100.00%Responsibility:The Procurement & Contracts Department is responsible <strong>for</strong> two majorsections.ContractsActivities:• Assist District project managers with submission of timely contractrequests, structuring of solicitation processes (when required), <strong>for</strong>mulationof contract documents and follow-up contract compliance andadministration.Per<strong>for</strong>mance Measures:• Timely facilitation of District business as evidenced by the following:- Timely execution of all <strong>for</strong>ecasted new contracting actions andexpected contract extensions. Department personnel will proactivelyassist District project managers with annual review and <strong>for</strong>ecasting ofprocurement actions.- Maintenance of excellent external customer service related to integrityof contract award process and fostering of opportunities <strong>for</strong>disadvantaged, minority, women-owned and small businesses.Per<strong>for</strong>mance Measures - continued:- Proactive assistance to District project managers with ongoingadministration of active contracts to ensure continuing compliancewith original terms and conditions, as well as most current regulatoryand audit standards.PurchasingActivities:• Procurement of District operational inventory (vehicle parts) and collateralsupplies. Purchase of fuel products, office products and equipment, andother agency operating supplies. Management of agency purchasing cardprogram. Disposal of District surplus property.Per<strong>for</strong>mance Measures:• Effective sourcing of goods and materials to ensure lowest total cost,utilizing factors such as quality, price, availability, lead time and impact oninventory turnover.• Timely delivery of goods and materials in accordance with purchase orderterms and conditions.FA-15
BUD1 Personnel Services FINANCE & ADMINISTRATION - PROCUREMENT & CONTRACTS10/11 11/12 12/13 12/1313/14Actual Actual ---------<strong>Budget</strong>---------- Est ---------<strong>Budget</strong>----------Position Title Total Total Base Pos Total Total Base Pos TotalDirector, Procurement & Contracts $ 84,139 $ 83,292 $ 137,537 1.00 $ 137,537 $ 137,537Manager, Purchasing 89,906 89,906 90,243 1.00 90,243 93,229 $ 93,229 1.00 $ 93,229Senior Buyer 169,411 161,250 69,125 2.00 138,251 138,251 69,125 2.00 138,251Buyer 7,427 64,773 65,991 1.00 65,991 65,991 65,991 1.00 65,991Manager, Contracts 93,908 93,908 94,273 1.00 94,273 97,384 97,384 1.00 97,384Contract Administrator III 55,929 66,400 66,649 1.00 66,649 68,591 68,591 3.00 205,772Contract Administrator III 66,234 66,234 66,482 1.00 66,482 67,944 68,591 0.60 41,154Contract Administrator III 64,406 64,696 66,482 1.00 66,482 68,591Coordinator, Procurement & Admin 109,429 109,429 54,925 2.00 109,850 113,086 56,543 2.00 113,086Fringe Benefits 266,121 297,437 300,864 303,440 290,961Capitalized Labor/Fringe (110,125) (142,617) (1.00) (85,130) (87,732) (1.00) (89,057)Workers' Compensation 409 409Longevity Premium 9,500 9,500 10,336Union Insured Premium Repayment 1,608 1,608Sick & Vacation/Holiday Payoff 8,907 8,907 8,947Unscheduled Overtime 21,680 20,548Total $ 918,464 $ 975,25710.00 $ 1,071,915 $ 1,086,7359.60 $ 976,055FA-16
BUD2 Materials & Services FINANCE & ADMINISTRATION - PROCUREMENT & CONTRACTSActual Actual <strong>Budget</strong> Estimate <strong>Budget</strong> % Change % ofExpense Category 10/11 11/12 12/13 12/13 13/14 FY13-<strong>FY14</strong> M & S TotalProfessional & Technical $ 50,000 $ 19,000-100.00% 0.00%Office Equipment Service & Repair $ 1550.00%Photocopier Maintenance 9,449 $ 6,647 25,000 22,000 $ 24,000 -4.00% 40.89%Other Services 26,521 26,469 26,000 26,000 26,500 1.92% 45.14%Procurement Advertising 1,742 412 400 400 -2.91% 0.68%Office Supplies 1,115 789 1,030 750 1,000 -2.91% 1.70%Other Materials 2,423 80 412 800 1,000 142.72% 1.70%Telephone 1,306 550 1,468 800 800 -45.50% 1.36%Dues & Subscriptions 2,277 1,901 1,648 3,000 1,500 -8.98% 2.56%Local Travel & Meetings 637 320 0.00%Education & Training 390 395 2,758 3,500 3,500 26.90% 5.96%Total $ 46,015 $ 36,831 $ 108,728 $ 76,570 $ 58,700 -46.01% 100.00%FA-17
Department Summary FINANCE & ADMINISTRATION - FARE REVENUEActual <strong>Budget</strong> Estimate <strong>Budget</strong> % Change % of10/11 11/12 12/13 12/13 13/14 FY13- <strong>FY14</strong> Dept. TotalPersonnel Services $ 815,544 $ 1,927,524 $ 1,931,497 $ 3,924,219 103.59% 62.88%Materials & Services 1,109,074 692,783 682,380 2,316,532 234.38% 37.12%Total $ 1,924,618 $ 2,620,307 $ 2,613,877 $ 6,240,751 138.17% 100.00%Responsibility:The Fare Revenue Department consists of fare revenue collection, processing,cash controls, sales, distribution and the Honored Citizen ID and GED IDprograms. It is responsible <strong>for</strong> the day-to-day management and delivery of thefollowing major functions:Activities:• Collection and restocking of cash and coins from light rail Ticket VendingMachines (TVMs).• Sorting, counting and packaging currency and coin <strong>for</strong> depositing TVMand farebox revenues.• Cash controls via internal audits and reconciliations <strong>for</strong> cash from TVMsand fareboxes.• Operate <strong>TriMet</strong>’s Ticket Office (transit store) selling fares andmerchandise.• Administer the Honored Citizen ID and GED ID programs.• Manage over 130 retail sales outlets, including contracts and faredistribution.• Operate the following consumer fare sales programs: Pass By Mail,Legacy, Field Trips, Online Sales, including Bike Locker rentals.• Manage artwork, specs and the ordering of all fare revenue ticket and passstock.Activities - continued:• Manage transition to electronic fare collection systems.• Oversee <strong>TriMet</strong>’s Merchant Services relationship.• Maintain and support all aspects of Ticket Vending Machine maintenanceand support.Per<strong>for</strong>mance Measures:• Cash control variances less than 1% of expected revenue(TVM, Farebox, Money Room and TTO).• Sales Program processing costs less than 7.5% of revenue.• Grow retail outlets revenue by 2% over other fare distribution channels(excluding employer programs).• Maintain maximum 5-minute in-line wait time at the <strong>TriMet</strong> Ticket Officeduring peak times.• Respond to 99% of sales orders within one business day.• Achieve 95% Ticket Vending Machine System reliability.FA-18
BUD1 Personnel Services FINANCE & ADMINISTRATION - FARE REVENUE10/11 11/12 12/13 12/1313/14Actual Actual ---------<strong>Budget</strong>---------- Est ---------<strong>Budget</strong>----------Position Title Total Total Base Pos Total Total Base Pos TotalAdministration:Director, Revenue Operations $ 84,460 1.00 $ 84,460Sr Accountant-Cash Management 73,017 1.00 73,017Cash Control Accountant 51,344 1.00 51,344Fringe Benefits 78,887Revenue Processing:Money Room Supervisor $ 74,307 $ 72,633 1.20 $ 87,160 $ 87,160 72,633 1.20 87,160Money Room Clerk 302,118 70,512 4.80 338,456 338,456 70,512 4.80 338,456Fringe Benefits 179,438 179,438 188,317Longevity Premium 9,509 9,509 9,500Fare Revenue:Manager, Revenue Operations 73,198 82,194 1.00 82,194 84,460Cash Control Accountant 27,885 50,196 1.00 50,196 51,344Maintenance of Way Supervisor 74,966 1.00 74,966Assistant Supervisor - MOW 73,032 2.00 146,064Field Technician/Apprentice 63,500 15.00 952,504<strong>TriMet</strong> Ticket Office Supervisor 69,837 69,194 1.00 69,194 69,194 69,194 1.00 69,194<strong>TriMet</strong> Ticket Office Assist Supervisor 63,015 64,150 1.00 64,150 64,150 64,150 1.00 64,150Customer Service Specialist 58,591 10.00 585,914 585,914 58,591 10.00 585,914Fringe Benefits 174,053 400,241 400,799 926,340Workers' Compensation 277 277 39,856Longevity Premium 9,187 9,187 45,656Union Insured Premium Repayment 9,646 9,646Sick & Vacation/Holiday Payoff 3,231 3,231 6,748Night & Shift Differential 12,294Unscheduled Overtime 31,131 38,733 38,733 89,393Total $ 815,54420.00 $ 1,927,524 $ 1,931,49739.00 $ 3,924,219FA-19
BUD2 Materials & Services FINANCE & ADMINISTRATION - FARE REVENUEActual Actual <strong>Budget</strong> Estimate <strong>Budget</strong> % Change % ofExpense Category 10/11 11/12 12/13 12/13 13/14 FY13-<strong>FY14</strong> M & S TotalAdministration:Other Services $ 1,0000.04%Auditing 30,000 1.30%Telephone 150 0.01%Education & Training 2,000 0.09%eFare Equipment 12,823 0.55%Sub-Total Administration: 45,973Revenue Processing:Banking Charges $ 951,7091,010,780 43.63%Professional & Technical $ 24,800 $ 15,000-100.00% 0.00%Money Transport 21,479 20,600 20,600 21,156 2.70% 0.91%Ticket Vending & Servicing 120,104 144,200 144,200 148,093 2.70% 6.39%Contracted Maintenance - Fare Equipment 166,500 7.19%Laundry 607 721 721 740 2.64% 0.03%Other Services 650 3,090 3,090 3,173 2.69% 0.14%Office Supplies 1,972 3,090 3,090 3,173 2.69% 0.14%Small Hand Tools 1,667 0.07%Safety Supplies 3,770 0.16%Maintenance Materials - Fare Equipment 291,468 12.58%Telephone 1,012 1,545 1,545 1,587 2.72% 0.07%Other Materials 11,477 5,414 5,414 2,480 -54.20% 0.11%Education & Training 2,381 0.10%CDL Renewals 95 0.00%Rentals 5,953 0.26%Sub-Total Revenue Processing: 1,109,010 203,460 193,660 1,663,016FA-20
BUD2 Materials & Services FINANCE & ADMINISTRATION - FARE REVENUEActual Actual <strong>Budget</strong> Estimate <strong>Budget</strong> % Change % ofExpense Category 10/11 11/12 12/13 12/13 13/14 FY13-<strong>FY14</strong> M & S TotalFare Revenue:Uni<strong>for</strong>ms $ 1,735 $ 1,000 $ 1,7812.67% 0.08%Equipment Maintenance 2,125 2,000 2,182 2.69% 0.09%CAO Office Maintenance 32,965 32,965 33,855 2.70% 1.46%Other Services 32,523 32,523 33,401 2.70% 1.44%Tickets & Passes 368,232 368,232 483,184 31.22% 20.86%Office Supplies 10,234 5,000 10,510 2.70% 0.45%Other Materials $ 65 21,072 26,000 21,641 2.70% 0.93%Postage 17,208 18,000 17,673 2.70% 0.76%Telephone 589 500 605 2.71% 0.03%Dues & Subscriptions 119 123 2.95% 0.01%Education & Training 2,520 2,500 2,588 2.69% 0.11%Sub-Total Fare Revenue: 65 489,323 488,720 607,543Total $ 1,109,074 $ 692,783 $ 682,380 $ 2,316,532 234.38% 100.00%FA-21
BUDGET PROGRESSION SCHEDULE - FINANCE & ADMINISTRATIONActual Actual Adopted Proposed <strong>Approved</strong> Adopted10/11 11/12 12/13 13/14 13/14 13/14Administration$ 276,090 $ 293,184 $ 298,549 Personnel Services $ 288,590 $ 288,590977,430 1,012,090 1,172,617 Materials & Services 1,341,224 1,341,224$ 1,253,520 $ 1,305,274 $ 1,471,166 Department Total $ 1,629,814 $ 1,629,814Operating Projects$ 350,000 Materials & Services $ 5,200 $ 65,200$ 350,000 Projects Total $ 5,200 $ 65,200Financial Services$ 2,145,878 $ 1,500,373 $ 1,720,895 Personnel Services $ 1,846,373 $ 1,850,7861,115,078 135,596 1,307,647 Materials & Services 292,173 292,173$ 3,260,955 $ 1,635,969 $ 3,028,542 Department Total $ 2,138,546 $ 2,142,959<strong>Budget</strong>, Financial Analysis & Grants$ 444,088 $ 438,228 $ 545,806 Personnel Services $ 568,947 $ 584,7641,796,224 2,116,710 2,160,585 Materials & Services 3,152,741 3,152,741$ 2,240,312 $ 2,554,939 $ 2,706,391 Department Total $ 3,721,688 $ 3,737,505Risk Management$ 470,022 $ 457,284 $ 460,549 Personnel Services $ 466,647 $ 466,64732,566 57,995 34,285 Materials & Services 35,211 35,211$ 502,587 $ 515,279 $ 494,834 Department Total $ 501,858 $ 501,858Procurement & Contracts$ 918,464 $ 975,257 $ 1,071,915 Personnel Services $ 967,687 $ 976,05546,015 36,831 108,728 Materials & Services 58,700 58,700$ 964,479 $ 1,012,089 $ 1,180,643 Department Total $ 1,026,387 $ 1,034,755Fare Revenue$ 815,544 $ 1,927,524 Personnel Services $ 3,924,219 $ 3,924,2191,109,074 692,783 Materials & Services 2,316,532 2,316,532$ 1,924,618 $ 2,620,307 Department Total $ 6,240,751 $ 6,240,751Division Total$ 4,254,543 $ 4,479,870 $ 6,025,238 Personnel Services $ 8,062,463 $ 8,091,0613,967,313 4,468,297 5,826,645 Materials & Services 7,201,781 7,261,781$ 8,221,853 $ 8,948,167 $ 11,851,883 Total Finance & Administration $ 15,264,244 $ 15,352,842FA-22
Division Summary LABOR RELATIONS & HUMAN RESOURCESActual <strong>Budget</strong> Estimate <strong>Budget</strong> % Change % of10/11 11/12 12/13 12/13 13/14 FY13 - <strong>FY14</strong> Dept. TotalPersonnel Services $ 1,266,651 $ 1,564,397 $ 1,972,899 $ 2,018,078 $ 2,039,1223.36% 64.82%Materials & Services 483,650 708,914 979,840 1,051,601 1,106,857 12.96% 35.18%Total $ 1,750,300 $ 2,273,311 $ 2,952,739 $ 3,069,679 $ 3,145,9796.54% 100.00%PageLabor Relations & Human Resources DivisionDivision Summary ………………………………………………………………HR-1Administration & Business Partnering …………………………………………HR-2Labor Relations ………………………………………………………………HR-5Compensation, Benefits & HRIS…………………………………………HR-8HR-1
Department Summary LABOR RELATIONS & HUMAN RESOURCES - ADMINISTRATION & BUSINESS PARTNERINGActual <strong>Budget</strong> Estimate <strong>Budget</strong> % Change % of10/11 11/12 12/13 12/13 13/14 FY13 - <strong>FY14</strong> Dept. TotalPersonnel Services $ 524,214 $ 840,751 $ 913,518 $ 926,756 $ 982,4387.54% 60.56%Materials & Services 260,220 334,914 385,596 419,648 639,859 65.94% 39.44%Total $ 784,435 $ 1,175,665 $ 1,299,114 $ 1,346,404 $ 1,622,29724.88% 100.00%Responsibilities:The Labor Relations & Human Resources Division Administration &Business Partnering Department is responsible <strong>for</strong> providing subject matterexpertise to help managers implement <strong>TriMet</strong>’s human capital programs andhelp HR centers of excellence understand the business needs of theorganization.Activities:• Human Resources Business Partners use their subject matter expertise toimplement human capital programs in the divisions they support.Per<strong>for</strong>mance Measures:• Efficient and effective implementation of human capital programs within<strong>TriMet</strong>.• Increases in capacity of the organization through effective use of humancapital programs measured through the productivity index.• Offer/interview, acceptance/offer ratios. Time to fill positions. Turnoverrate. Management of employment Practices Risk. Achievement ofaffirmative action goals.• Human Resources Business Partners advocate on behalf of their clients andprovide feedback to the HR centers of excellence so that human capitalprograms, developed by Human resources, are practical and meet theorganization’s business needs.• Human Resources Business Partners harness available human capital toolsto advance the business objectives of the divisions they support.HR-2
BUD1 Personnel Services LABOR RELATIONS & HUMAN RESOURCES - ADMINISTRATION & BUSINESS PARTNERING10/11 11/12 12/13 12/1313/14Actual Actual ---------<strong>Budget</strong> ---------- Est ---------<strong>Budget</strong>----------Position Title Total Total Base Pos Total Total Base Pos TotalExecutive Director $ 175,612 $ 175,663 1.00 $ 175,663 $ 175,663 $ 175,663 1.00 $ 175,663Human Resources Business Partner $ 154,273 154,273 110,413 1.00 110,413 110,413 105,180 3.00 315,539Director, Employee Services 117,868 117,868Human Resources Business Partner 105,404 1.00 105,404 107,762Human Resources Business Partner 110,423 1.00 110,423 110,423Recruiter 67,422 1.00 67,422 68,779 68,779 1.00 68,779Operations Recruiter 52,471 1.00 52,471 55,583 55,583 1.00 55,583Candidate Sourcer 53,766 1.00 53,766 55,290 55,290 1.00 55,290Executive Assistant 61,010 61,010 61,241 1.00 61,241 63,329 63,329 1.00 63,329Administrative Specialist 35,139 42,978Receptionist - PT 30,001 42,287 29,754 1.10 32,729 33,637 29,545 1.10 32,500File Clerk 25,056 0.50 12,528Fringe Benefits 108,500 238,897 242,073 243,965 289,379Workers' Compensation 235 235Unscheduled Overtime 391 86Sick & Vacation/Holiday Payoff 17,649 17,649 17,649Capitalized Grant Labor/Fringe (0.75) (115,972) (115,972) (0.75) (103,801)Limited Term Employment 17,032 7,740Total $ 524,214 $ 840,7518.35 $ 913,518 $ 926,7568.85 $ 982,438HR-3
BUD2 Materials & Services LABOR RELATIONS & HUMAN RESOURCES - ADMINISTRATION & BUSINESS PARTNERINGActual Actual <strong>Budget</strong> Estimate <strong>Budget</strong> % Change % ofExpense Category 10/11 11/12 12/13 12/13 13/14 FY13-<strong>FY14</strong> M & S TotalProfessional & Technical $ 55,768 $ 55,077 $ 100,000 $ 139,770 153.77% 21.84%Legal 20,230 3.16%Recruitment Expense 5,483 1,300 95,000 1632.63% 14.85%Pre-Employment Screening Services 2,648 272 2,500 -5.59% 0.39%Medical Pre-Employment Services (MRO) 4,312 4,000 -7.24% 0.63%Medical Pre-Employment Services (MH) 1,185 185 1,000 -15.61% 0.16%Temporary Help $ 10,871 7,594 0.00%Other Services 2,776 20,234 21,205 21,205 71,778 238.50% 11.22%Office Supplies 6,602 11,777 4,371 5,371 6,400 46.42% 1.00%Other Materials 442 5,989 2,916 2,916 2,995 2.71% 0.47%Postage 8,564 3,460 5,530 5,530 5,679 2.69% 0.89%Telephone 1,964 1,990 2,437 2,437 2,503 2.72% 0.39%Dues & Subscriptions 1,285 1,302 2,588 2,588 2,658 2.70% 0.42%Local Travel & Meetings 13 3,188 3,188 3,274 2.70% 0.51%Education & Training 5,236 3,636 4,989 4,989 5,124 2.71% 0.80%Out-of-Town Travel 1,479 2,151 6,667 6,667 6,847 2.70% 1.07%Union Contractual Services 221,000 221,000 263,000 263,000 270,101 2.70% 42.21%Total $ 260,220 $ 334,914 $ 385,596 $ 419,648 $ 639,859 65.94% 100.00%HR-4
Department Summary LABOR RELATIONS & HUMAN RESOURCES - LABOR RELATIONSActual <strong>Budget</strong> Estimate <strong>Budget</strong> % Change % of10/11 11/12 12/13 12/13 13/14 FY13 - <strong>FY14</strong> Dept. TotalPersonnel Services $ 348,185 $ 358,996 $ 362,4164.09% 93.11%Materials & Services 27,316 27,682 26,812 -1.84% 6.89%Total $ 375,501 $ 386,678 $ 389,2283.66% 100.00%Responsibility:The Labor Relations Department provides professional labor relations supportto <strong>TriMet</strong> management in the areas of labor contract administration, disciplineand grievance administration and training in areas of fact finding and disputeresolution. Labor Relations is actively involved in labor strategy and contractnegotiation. The Labor Relations Department works with <strong>TriMet</strong> divisionshaving represented work<strong>for</strong>ces to accomplish <strong>TriMet</strong>’s mission and goalswithin legal, financial, business and ethical parameters.Activities:• Discipline administration of represented employees.• Grievance administration.• Contract administration.• Labor relations training.Per<strong>for</strong>mance Measures:• Ensure each application of discipline to the represented work<strong>for</strong>ce meetsthe seven tests of just cause.• Ensure management response to employee grievances and/or disputes areresponded to in a timely manner and in compliance with the collectivebargaining agreement.• Assist the Labor Relations attorney in the Legal department in preparation<strong>for</strong> arbitration hearings and unfair labor practice claims by providingsupporting documentation in a timely manner that aids in the District’sdefense against these types of cases.• Ensure District responses to document requests from the union areprocessed in accordance with PECBA (Public employee CollectiveBargaining Act) laws.• Train management work<strong>for</strong>ce that manages represented employees onlabor relations principles and practices to ensure consistent application ofthe labor agreement, District policy and employment laws and practices.HR-5
BUD1 Personnel Services LABOR RELATIONS & HUMAN RESOURCES - LABOR RELATIONS10/11 11/12 12/13 12/1313/14Actual Actual ---------<strong>Budget</strong> ---------- Est ---------<strong>Budget</strong>----------Position Title Total Total Base Pos Total Total Base Pos TotalDirector, Labor Relations $ 110,434 1.00 $ 110,434 $ 114,193 $ 114,193 1.00 $ 114,193Manager, Labor Relations 86,506 1.00 86,506 89,429 89,429 1.00 89,429Labor Analyst 65,041 1.00 65,041 67,818 67,818 1.00 67,818Fringe Benefits 84,796 86,148 89,568Sick & Vacation/Holiday Payoff 1,408 1,408 1,408Total 3.00 $ 348,185 $ 358,9963.00 $ 362,416HR-6
BUD2 Materials & Services LABOR RELATIONS & HUMAN RESOURCES - LABOR RELATIONSActual Actual <strong>Budget</strong> Estimate <strong>Budget</strong> % Change % ofExpense Category 10/11 11/12 12/13 12/13 13/14 FY13-<strong>FY14</strong> M & S TotalTemporary Help $ 3,399-100.00% 0.00%Other Services 13,390 $ 10,200 $ 13,752 2.70% 51.29%Office Supplies 2,678 9,988 5,000 86.71% 18.65%Other Materials 618 500 635 2.75% 2.37%Postage 1,648 1,894 1,692 2.67% 6.31%Telephone 711 700 730 2.72% 2.72%Dues & Subscriptions 942 900 968 2.71% 3.61%Local Travel & Meetings 361 300 370 2.64% 1.38%Education & Training 1,251 1,200 1,285 2.68% 4.79%Out-of-Town Travel 2,318 2,000 2,380 2.70% 8.88%$ 27,316 $ 27,682 $ 26,812 -1.84% 100.00%HR-7
Department Summary LABOR RELATIONS & HUMAN RESOURCES - COMPENSATION, BENEFITS & HRISActual <strong>Budget</strong> Estimate <strong>Budget</strong> % Change % of10/11 11/12 12/13 12/13 13/14 FY13 - <strong>FY14</strong> Dept. TotalPersonnel Services $ 742,436 $ 723,646 $ 711,197 $ 732,326 $ 694,269-2.38% 61.20%Materials & Services 223,429 374,000 566,929 604,271 440,186 -22.36% 38.80%Total $ 965,865 $ 1,097,646 $ 1,278,125 $ 1,336,597 $ 1,134,455 -11.24% 100.00%Responsibility:The Human Resources Compensation, Benefits & HRIS Department isresponsible <strong>for</strong> providing leadership in developing and facilitating businessstrategies to attract and retain a diverse, competent work<strong>for</strong>ce through expertisein the following areas:Activities:• Total rewards, including compensation, benefits, such as healthcarebenefits, deferred compensation and retirement plans; training anddevelopment, work life balance and recognition.• Human Resource in<strong>for</strong>mation systems.Per<strong>for</strong>mance Measures:• Implementation of healthcare and post-employment benefit strategies toalign costs with revenue <strong>for</strong>ecasts as measured by Monthly HealthcareCost Per Employee (Total Monthly Cost of Healthcare divided by TotalNumber of Employees and Benefits as a percent of Salary). AnnualBenefits Cost (Annual Benefits Cost divided by Annual Salary, excludingOPEB & retiree insurance) and Benefit Revenue Ratio (Total Benefit Costsdivided by Revenue [operating revenue includes passenger, auxiliary andother transportation revenue. It does not include payroll tax or operatinggrant revenue]).• Market-competitive total compensation as measured by up-to-date marketpricing <strong>for</strong> all non-union positions, implementation of appropriate salaryadministration budget controls and procedures, achievement of objectivesregarding the balance between direct and indirect compensation, and amanagement team that is trained in the compensation system and how toutilize it effectively.• Deployment of <strong>TriMet</strong>’s ORACLE technology plat<strong>for</strong>m in a way thatallows management to make better strategic decisions regarding humancapital program and empowers managers and employees through selfserviceapplications to increase the speed, efficiency, and accuracy ofhuman resources transactions.HR-8
BUD1 Personnel Services LABOR RELATIONS & HUMAN RESOURCES - COMPENSATION, BENEFITS & HRIS10/11 11/12 12/13 12/1313/14Actual Actual ---------<strong>Budget</strong> ---------- Est ---------<strong>Budget</strong>----------Position Title Total Total Base Pos Total Total Base Pos TotalEmployment:Manager, Human Resources $ 97,674 $ 98,161Senior Human Resources Rep. 67,171 67,171Senior Human Resources Rep. 58,916 58,916Human Resources Representative 49,013 52,155Human Resources Representative 50,203 53,422Fringe Benefits 144,847 149,995Compensation & Benefits:Director, Comp., Benefits & HRIS $ 118,327 1.00 $ 118,327 $ 122,754 $ 122,754 1.00 $ 122,754HRIS Business Analyst 105,404 1.00 105,404 105,404 73,289 1.00 73,289Manager, Benefits 88,000 86,900 88,343 1.00 88,343 91,329 91,329 1.00 91,329Benefits Administrator 58,109 58,109 58,339 1.00 58,339 59,592 59,592 1.00 59,592Benefits Specialist 43,310 43,077 43,242 1.00 43,242 44,161 44,161 1.00 44,161Administrative Specialist 43,556 1.00 43,556 46,479 46,479 1.00 46,479Compensation Analyst 59,153 1.00 59,153 65,041 65,041 1.00 65,041Fringe Benefits 84,959 84,657 177,486 180,220 186,029Overtime 233Sick & Vacation/Holiday Payoff 5,596 5,596 5,596Workers' Compensation 311 311Limited Term Employment 11,440 11,440Capitalized Labor/Fringe (28,917)Total $ 742,436 $ 723,6467.00 $ 711,197 $ 732,3267.00 $ 694,269HR-9
BUD2 Materials & Services LABOR RELATIONS & HUMAN RESOURCES - COMPENSATION, BENEFITS & HRISActual Actual <strong>Budget</strong> Estimate <strong>Budget</strong> % Change % ofExpense Category 10/11 11/12 12/13 12/13 13/14 FY13-<strong>FY14</strong> M & S TotalEmployment:Recruitment Expense $ 683 $ 3,3970.00%Pre-Employment Screening Services 1,752 1,738 0.00%Medical Pre-Employment Services (MRO) 30 0.00%Medical Pre-Employment Services (MH) 947 0.00%Other Services 15,700 0.00%Other Materials 170 0.00%Sub-Total Employment: 19,282 5,135Compensation & Benefits:Professional & Technical $ 7,213 $ 32,612 $ 19,408 169.07% 4.41%Temporary Help 5,000 2,500 3,000 -40.00% 0.68%Other Services 16,823 159,962 159,962 10,231 -93.60% 2.32%Office Supplies 3,461 3,461 3,364 -2.80% 0.76%Other Materials 6,121 10,485 28,478 10,768 2.70% 2.45%Postage 4,378 4,378 4,496 2.70% 1.02%Telephone 1,965 1,965 2,018 2.70% 0.46%Dues & Subscriptions 800 800 822 2.75% 0.19%Local Travel & Meetings 2,500 1,250 2,568 2.72% 0.58%Education & Training 8,199 8,199 8,420 2.70% 1.91%Out-of-Town Travel 5,279 2,640 5,421 2.70% 1.23%DOTS Renewal Medical Services 72,339 65,185 66,100 66,100 67,885 2.70% 15.42%Disability Medical <strong>Review</strong> Services 2,976 4,468 7,500 7,500 7,703 2.71% 1.75%Medical Employment Expense 1,919 0.00%FMLA/OFLA Third Party Administrator 82,730 104,636 106,840 106,840 111,500 4.36% 25.33%Health Benefit Consultant 14,362 125,746 125,056 125,056 128,433 2.70% 29.18%BHS FSA Third Party Administrator 14,803 19,096 20,500 20,500 18,000 -12.20% 4.09%Compensation Survey Services 695 12,393 10,500 10,500 14,757 40.54% 3.35%Education Reimbursement 10,716 0.00%Non-Union EAP 7,746 10,716 10,814 12,092 12.84% 2.75%Employee Awards 8,495 12,478 10,475 9,300 -11.22% 2.11%Sub-Total Compensation & Benefits: 204,146 368,865 566,929 604,271 440,186Total $ 223,429 $ 374,000 $ 566,929 $ 604,271 $ 440,186 -22.36% 100.00%HR-10
BUDGET PROGRESSION SCHEDULE - LABOR RELATIONS & HUMAN RESOURCESActual Actual Adopted Proposed <strong>Approved</strong> Adopted10/11 11/12 12/13 13/14 13/14 13/14Administration & Business Partnering$ 524,214 $ 840,751 $ 913,518 Personnel Services $ 964,788 $ 982,438260,220 334,914 385,596 Materials & Services 639,859 639,859$ 784,435 $ 1,175,665 $ 1,299,114 Department Total $ 1,604,647 $ 1,622,297Labor Relations$ 348,185 Personnel Services $ 361,008 $ 362,41627,316 Materials & Services 26,812 26,812$ 375,501 Department Total $ 387,820 $ 389,228Compensation, Benefits & HRIS$ 742,436 $ 723,646 $ 711,197 Personnel Services $ 688,673 $ 694,269223,429 374,000 566,929 Materials & Services 440,186 440,186$ 965,865 $ 1,097,646 $ 1,278,125 Department Total $ 1,128,859 $ 1,134,455Division Total$ 1,266,651 $ 1,564,397 $ 1,972,899 Personnel Services $ 2,014,469 $ 2,039,122483,650 708,914 979,840 Materials & Services 1,106,857 1,106,857$ 1,750,301 $ 2,273,311 $ 2,952,739 Total Labor Relations & Human Resources $ 3,121,326 $ 3,145,979.HR-11
[This Page Left Intentionally Blank]HR‐12
Division Summary LEGAL SERVICESActual <strong>Budget</strong> Estimate <strong>Budget</strong> % Change % of10/11 11/12 12/13 12/13 13/14 FY13- <strong>FY14</strong> Dept. TotalPersonnel Services $ 1,416,120 $ 1,322,528 $ 1,432,252 $ 1,457,628 $ 1,485,6153.73% 85.48%Materials & Services 188,066 178,013 185,291 185,291 252,293 36.16% 14.52%Total $ 1,604,187 $ 1,500,540 $ 1,617,543 $ 1,642,919 $ 1,737,9087.44% 100.00%Legal Services DivisionDivision SummaryLegal ServicesPage…………………………………………………………………LS-1…………………………………………………………………LS-2LS-1
Department Summary LEGAL SERVICES - LEGAL SERVICESActual <strong>Budget</strong> Estimate <strong>Budget</strong> % Change % of10/11 11/12 12/13 12/13 13/14 FY13- <strong>FY14</strong> Dept. TotalPersonnel Services $ 1,416,120 $ 1,322,528 $ 1,432,252 $ 1,457,628 $ 1,485,6153.73% 85.48%Materials & Services 188,066 178,013 185,291 185,291 252,293 36.16% 14.52%Total $ 1,604,187 $ 1,500,540 $ 1,617,543 $ 1,642,919 $ 1,737,9087.44% 100.00%Responsibility:The Legal Services Department provides professional, competent, highlyresponsive and cost-effective legal assistance to the <strong>TriMet</strong> Board and staff.Work with all <strong>TriMet</strong> divisions to accomplish <strong>TriMet</strong>’s mission and goalswithin legal, financial, business and ethical parameters.Activities:• Contract and Construction Law.• Municipal/Public Law.• Employment Law.• Real Estate/Land Use/Environmental.• Tort Defense.Per<strong>for</strong>mance Measures:• Provide highly effective counsel on State and Federal legislative and policyissues.• Ensure highest quality legal support through effective deployment ofinternal and external legal counsel.• Enhance productivity by more effectively managing incoming work,balancing workloads and strengthening <strong>TriMet</strong>’s preventative law programto help minimize potential project development and implementationproblems.• Provide the highest possible level of customer service by respondingquickly and professionally to the requirements of the Legal Department’scustomers and clients, both inside and outside <strong>TriMet</strong>.LS-2
BUD1 Personnel Services LEGAL SERVICES - LEGAL SERVICES10/11 11/12 12/13 12/1313/14Actual Actual ---------<strong>Budget</strong> ---------- Est ---------<strong>Budget</strong>----------Position Title Total Total Base Pos Total Total Base Pos TotalGeneral Counsel $ 200,383 $ 181,037 $ 175,663 1.00 175,663 $ 175,663 $ 175,663 1.00 175,663Director, Legal Services 161,518 148,346 145,554 1.00 145,554 148,686 148,686 1.00 148,686Senior Deputy General Counsel 123,749 123,749 124,424 1.00 124,424 130,938 130,938 1.00 130,938Senior Deputy General Counsel 134,940 134,940 135,469 1.00 135,469 139,290 139,290 1.00 139,290Deputy General Counsel 95,471 51,168 117,158 1.00 117,158 118,327 118,327 1.00 118,327Deputy General Counsel I 98,610 98,610 112,996 1.00 112,996 112,996 112,996 1.00 112,996Legal Assistant 43,242 52,000 52,200 1.00 52,200 53,578 53,578 1.00 53,578Litigation Specialist 63,375 62,400 62,640 1.00 62,640 64,310 64,310 1.00 64,310Paralegal Investigator 50,880 55,120 55,332 1.00 55,332 57,002 57,002 1.00 57,002Litigation Specialist, Labor & Discovery 58,802 58,802 59,028 1.00 59,028 59,821 59,821 1.00 59,821Records Analyst 57,821 57,821 58,046 1.00 58,046 60,343 60,343 1.00 60,343Fringe Benefits 326,430 298,535 311,989 314,918 343,321Unscheduled Overtime 900Sick & Vacation/Holiday Payoff 21,337 21,337 21,337Workers' Compensation 416 416Total $ 1,416,120 $ 1,322,52811.00 $ 1,432,252 $ 1,457,62811.00 $ 1,485,615LS-3
BUD2 Materials & Services LEGAL SERVICES - LEGAL SERVICESActual Actual <strong>Budget</strong> Estimate <strong>Budget</strong> % Change % ofExpense Category 10/11 11/12 12/13 12/13 13/14 FY13-<strong>FY14</strong> M & S TotalLegal $ 60,183 $ 44,061 $ 71,329 $ 71,329 $ 73,255 2.70% 29.04%Professional & Technical 57,761 42,467 42,467 85,614 101.60% 33.93%Temporary Help 1,740 1,740 1,787 2.71% 0.71%Other Services 93,472 35,639 29,337 29,337 50,129 70.87% 19.87%Office Supplies 8,116 3,939 5,645 5,645 5,797 2.69% 2.30%Other Materials 2,571 5,979 3,069 3,069 3,152 2.71% 1.25%Telephone 1,468 747 3,789 3,789 3,891 2.70% 1.54%Dues & Subscriptions 11,520 20,143 11,582 11,582 11,895 2.70% 4.71%Local Travel & Meetings 337 178 614 614 630 2.70% 0.25%Education & Training 4,892 5,728 9,815 9,815 10,080 2.70% 4.00%Out-of-Town Travel 5,508 3,836 5,904 5,904 6,064 2.70% 2.40%Total $ 188,066 $ 178,013 $ 185,291 $ 185,291 $ 252,293 36.16% 100.00%LS-4
BUDGET PROGRESSION SCHEDULE - LEGAL SERVICESActual Actual Adopted Proposed <strong>Approved</strong> Adopted10/11 11/12 12/13 13/14 13/14 13/14Legal Services$ 1,416,120 $ 1,322,528 $ 1,432,252 Personnel Services $ 1,464,278 $ 1,485,615188,066 178,013 185,291 Materials & Services 252,293 252,293$ 1,604,187 $ 1,500,540 $ 1,617,543 Department Total $ 1,716,572 $ 1,737,908Division Total$ 1,416,120 $ 1,322,528 $ 1,432,252 Personnel Services $ 1,464,278 $ 1,485,615188,066 178,013 185,291 Materials & Services 252,293 252,293$ 1,604,186 $ 1,500,540 $ 1,617,543 Total Legal Services $ 1,716,572 $ 1,737,908LS-5
[This Page Left Intentionally Blank]LS‐6
Division Summary OPERATIONSActual <strong>Budget</strong> Estimate <strong>Budget</strong> % Change % of10/11 11/12 12/13 12/13 13/14 FY13- <strong>FY14</strong> Dept. TotalPersonnel Services $ 188,668,579 $ 196,354,838 $ 203,773,501 $ 208,012,119 $ 207,085,5041.63% 63.77%Materials & Services 102,211,831 106,748,477 110,262,680 110,437,699 117,668,252 6.72% 36.23%Total $ 290,880,411 $ 303,103,315 $ 314,036,182 $ 318,449,818 $ 324,753,7563.41% 100.00%PageOperations DivisionDivision Summary …………………………………………………………………OP-1Administration & Support …………………………………………………………………OP-2Operating Projects …………………………………………………………………OP-7Bus Transportation …………………………………………………………………OP-9Scheduling…………………………………………………………………OP-15Field Operations …………………………………………………………………OP-18Transportation Planning …………………………………………………………………OP-23Accessible Transportation Programs-LIFT ……………………………………………OP-26Accessible Transportation Programs-MTP ……………………………………………OP-30Bus Maintenance …………………………………………………………………OP-34Facilities Management …………………………………………………………………OP-37Rail Transportation …………………………………………………………………OP-43Rail Maintenance of Way …………………………………………………………………OP-46Rail Equipment Maintenance……………………………………………OP-50Commuter Rail …………………………………………………………………OP-53Streetcar…………………………………………………………………OP-57OP-1
Department Summary OPERATIONS - ADMINISTRATION & SUPPORTActual <strong>Budget</strong> Estimate <strong>Budget</strong> % Change % of10/11 11/12 12/13 12/13 13/14 FY13- <strong>FY14</strong> Dept. TotalPersonnel Services $ 3,961,660 $ 4,242,713 $ 4,067,715 $ 4,119,150 $ 4,302,0285.76% 86.10%Materials & Services 614,048 967,930 582,743 551,000 694,602 19.20% 13.90%Total $ 4,575,708 $ 5,210,643 $ 4,650,458 $ 4,670,150 $ 4,996,6307.44% 100.00%Responsibility:The Operations Division is responsible <strong>for</strong> delivering <strong>TriMet</strong> transportationand maintenance operations in a culture of safety and service excellence.The Administration & Support Department includes these functions:• Operations executive• Operations planning and development• Operations supportActivities:• Operations Executive- Communicate/instill <strong>TriMet</strong>’s strategic direction throughout thedivision, focused on safety, service excellence, support toemployees and state of good repair.- Executive actions <strong>for</strong> division budgets, programs, projects andpersonnel.- Employee communication, recognition and training programs.• Operations Planning and Development- Annual division budgets, multi-year service plans, fleet, facilitiesand operations and maintenance programs to fulfill <strong>TriMet</strong> 5-yearplans, including Transit Investment and Financial Forecast Plans.- Operations productivity objectives, quality standards and FTAcompliance.Activities - continued:• Operations Support- Manage and coordinate operations startup of light rail extensions.- Operations planning <strong>for</strong> future fixed-route bus and LIFT operations.- Fixed-route bus, LIFT bus and light rail vehicle fleet managementplans.- Service per<strong>for</strong>mance and ridership data collection, analysis andreporting.- Maintenance planning and analysis.- Initial and re-certification training programs <strong>for</strong> operators, fieldsupervisors, bus dispatchers and rail controllers.- Training curricula, SOPs and rule books.- Recordkeeping of transportation training, curricula and SOPs.Per<strong>for</strong>mance Measures:- Boarding rides per revenue hour.- Operating cost per boarding ride and per vehicle mile.- Customer commendations and complaints.- Miles between chargeable road calls.- Successful operations startup of light rail extensions.- Timely reporting of service per<strong>for</strong>mance and ridership in<strong>for</strong>mation.- Initial and annual re-certification training <strong>for</strong> all fixed-route bus andMAX operators.OP-2
BUD1 Personnel Services OPERATIONS - ADMINISTRATION & SUPPORT10/11 11/12 12/13 12/1313/14Actual Actual ---------<strong>Budget</strong>---------- Est ---------<strong>Budget</strong>----------Position Title Total Total Base Pos Total Total Base Pos TotalAdministration:Executive Director $ 166,001 $ 166,001 $ 166,643 1.00 $ 166,643 $ 180,696 $ 180,696 1.00 $ 180,696Executive Administrator 67,366 67,366 67,630 1.00 67,630 69,990 69,990 1.00 69,990Director, Operations Planning & Develop. 129,052 129,052 129,540 1.00 129,540 134,091 134,091 1.00 134,091Coordinator, Ops. Services 68,910 68,910Director, Work<strong>for</strong>ce Devel./Trng. 110,018HR Manager, Work<strong>for</strong>ce Develop 86,176Senior Human Resources Rep. 64,797Fare Equipment Contract Manager 86,798 85,076 87,132 1.00 87,132 87,132Manager, Ops Communications 78,419Operations Support:Director, Operations Support 92,975 92,975 93,344 1.00 93,344 97,301 97,301 1.00 97,301Manager, Rail Operations Planning 101,698 101,698 102,082 1.00 102,082 105,047 105,047 1.00 105,047Manager, Procedures Development 70,102Sr. Specialist, Wrkfrce Procs./Systems 68,124 63,904 1.00 63,904 63,904 69,000 1.00 69,000Fringe Benefits 91,464 87,581 88,810 90,498Workers' Compensation 122 122Operations Analysis:Manager, Service Per<strong>for</strong>mance & Analysis 83,394 83,394 83,708 1.00 83,708 87,905 87,905 1.00 87,905Operations Analyst 192,380 224,489 56,550 4.00 226,200 232,624 58,924 4.00 235,696Fringe Benefits 107,021 125,179 122,649 124,444 128,077Workers' Compensation 190 190Employee Support:Employee Programs Coordinator 53,181 51,750 51,949 1.00 51,949 51,949 51,469 1.00 51,469Fringe Benefits 25,133 25,268 23,371 23,371 23,677Workers' Compensation 37 37OP-3
BUD1 Personnel Services OPERATIONS - ADMINISTRATION & SUPPORT10/11 11/12 12/13 12/1313/14Actual Actual ---------<strong>Budget</strong>---------- Est ---------<strong>Budget</strong>----------Position Title Total Total Base Pos Total Total Base Pos TotalOperator Training-Bus:Manager, Trans Ops Training $ 87,789 $ 87,789 $ 88,134 1.00 $ 88,134 $ 91,120 $ 91,120 1.00 $ 91,120Assist Manager, Transportation Training 75,269 74,843 75,288 1.00 75,288 75,293 75,293 1.00 75,293Administrative Specialist 53,913 59,708 53,891 1.00 53,891 55,353 55,353 1.00 55,353Lead Dispatcher/Controller 74,754 76,648Training Supervisor 853,629 1,134,409 70,512 16.00 1,128,188 1,128,188 70,512 18.00 1,269,212Fringe Benefits 466,415 653,639 570,514 571,304 659,940Workers' Compensation 933 933 39,717Longevity Premium 37,579 37,579 37,824Unscheduled Overtime - Non-Op. 31,178 90,380 138,561 138,561 153,500Operator Training-Rail:Assistant Manager, Transportation 77,201 77,201 77,507 1.00 77,507 79,281 79,281 1.00 79,281Lead Dispatcher/Controller 67,703 66,930Transportation Training Supervisor 198,265 204,323 70,512 4.00 282,047 282,047 70,512 4.75 334,931Fringe Benefits 144,761 149,452 148,014 148,329 178,579Longevity Premium 9,500 9,500 13,594Unscheduled Overtime - Non-Op. 1,569 1,382 4,361 4,361 8,809Workers' Compensation 518 518 1,655Fringe Benefits 250,655 280,496 129,747 132,319 107,009Capitalized Labor/Fringe (4,861) (95,233) (0.75) (84,404)Workers' Compensation 295 295Union Insured Premium Repayment 10,182 10,182Sick & Vacation/Holiday Payoff 6,373 6,373 7,169Total $ 3,961,660 $ 4,242,71337.00 $ 4,067,715 $ 4,119,15038.00 $ 4,302,028OP-4
BUD2 Materials & Services OPERATIONS - ADMINISTRATION & SUPPORTActual Actual <strong>Budget</strong> Estimate <strong>Budget</strong> % Change % ofExpense Category 10/11 11/12 12/13 12/13 13/14 FY13-<strong>FY14</strong> M & S TotalAdministration:Professional & Technical $ 105,335 $ 381,393 $ 40,000 $ 30,000 $ 140,000 250.00% 20.16%Laundry 299 288 100 0.00%Other Services 17,975 48,168 19,223 30,000 20,000 4.04% 2.88%Labor/Employment Process Expense 50,000 60,000 50,000 0.00% 7.20%Office Supplies 5,543 4,465 2,000 1,200 2,000 0.00% 0.29%Other Materials 6,027 1,789 1,600 5,000 2,000 25.00% 0.29%Telephone 6,889 4,042 3,931 3,000 3,200 -18.59% 0.46%Dues & Subscriptions 300 800 800 800 0.00% 0.12%APTA Dues 76,000 83,500 80,000 80,000 82,000 2.50% 11.81%Local Travel & Meetings 906 249 0.00%Education & Training 5 6,000 0.00%Out-of-Town Travel 11,241 12,148 7,200 15,000 8,000 11.11% 1.15%Assault Reward 200 100 0.00%Employee Recognition 148 14,707 4,000 7,000 5,000 25.00% 0.72%Sub-Total Administration: 230,862 550,855 208,754 238,100 313,000Employee Support:Operator Uni<strong>for</strong>ms 225,142 235,694 250,188 230,000 256,802 2.64% 36.97%Quality Assurance/ADA 16,085 31,681 50,750 25,000 50,000 -1.48% 7.20%Fixed Route Back-up - Cabs 16,655 2,104 3,600 2,000 3,000 -16.67% 0.43%Transfers-Fare Collection 46,500 54,948 0.00%Telephone 504 500Rewards & Recognition 32,518 37,157 12,360 15,000 15,000 21.36% 2.16%Special Events 14,341 22,871 14,420 17,000 15,000 4.02% 2.16%Sub-Total Employee Support: 351,240 384,959 331,318 289,500 339,802OP-5
BUD2 Materials & Services OPERATIONS - ADMINISTRATION & SUPPORTActual Actual <strong>Budget</strong> Estimate <strong>Budget</strong> % Change % ofExpense Category 10/11 11/12 12/13 12/13 13/14 FY13-<strong>FY14</strong> M & S TotalOperator Training-Bus:Accident <strong>Review</strong>/Investigations $ 6,406 $ 2,874 $ 10,000 $ 3,000 $ 8,000 -20.00% 1.15%Other Services 10 600 1,000 1,000 1,000 0.00% 0.14%Office Supplies 3,701 4,999 3,200 3,400 3,300 3.13% 0.48%Other Materials 424 10,162 5,000 3,000 5,000 0.00% 0.72%Operator Training Materials 11,701 1,490 15,000 4,000 15,000 0.00% 2.16%Telephone 4,970 6,708 4,771 6,000 5,000 4.79% 0.72%Sub-Total Operator Training-Bus: 27,213 26,834 38,971 20,400 37,300Operator Training-Rail:Other Services 5 500 500 0.00% 0.07%Office Supplies 4,733 4,958 1,200 3,000 2,000 66.67% 0.29%Other Materials 1,000 1,000 0.00% 0.14%Operator Training Materials 320 1,000 1,000 0.00% 0.14%Sub-Total Operator Training-Rail: 4,733 5,282 3,700 3,000 4,500$ 614,048 $ 967,930 $ 582,743 $ 551,000 $ 694,602 19.20% 100.00%OP-6
BUD2 Materials & Services OPERATIONS - OPERATING PROJECTSActual Actual <strong>Budget</strong> Estimate <strong>Budget</strong> % Change % ofExpense Category 10/11 11/12 12/13 12/13 13/14 FY13-<strong>FY14</strong> Projects TotalOperations Operating Projects OTO $ 102,573 $ 46,715 $ 117,881 $ 117,881-100.00% 0.00%Safety Compliance 110 0.00%LIFT Shop Equipment Replacement
BUD2 Materials & Services OPERATIONS - OPERATING PROJECTSActual Actual <strong>Budget</strong> Estimate <strong>Budget</strong> % Change % ofExpense Category 10/11 11/12 12/13 12/13 13/14 FY13-<strong>FY14</strong> Projects TotalLight Rail Shop Equipment
Department Summary OPERATIONS - BUS TRANSPORTATIONActual <strong>Budget</strong> Estimate <strong>Budget</strong> % Change % of10/11 11/12 12/13 12/13 13/14 FY13- <strong>FY14</strong> Dept. TotalPersonnel Services $ 95,550,543 $ 97,449,948 $ 98,850,681 $ 102,462,200 $ 100,848,6492.02% 97.97%Materials & Services 1,227,358 1,154,621 2,066,264 1,697,460 2,094,720 1.38% 2.03%Total $ 96,777,901 $ 98,604,569 $ 100,916,945 $ 104,159,660 $ 102,943,3692.01% 100.00%Responsibility:The Bus Transportation Department is responsible <strong>for</strong> providing safe,courteous, reliable and efficient public transportation <strong>for</strong> the region.Activities:• On-time service.• Run bus service 90% on-time or better <strong>for</strong> efficient use of vehicles,operators and better cost per mile.• Improve schedule efficiency, service reliability <strong>for</strong> customers and workingconditions <strong>for</strong> operators.• Comprehensive communication and support to operators.• Enhance the CSI process, to benefit both customers and operators.• Sustain a high-quality process <strong>for</strong> Requests <strong>for</strong> Safety Assessment (RSA)and Operating Condition Reports.• Regularly produce useful and in<strong>for</strong>mational Operators' Notices andBulletins.• Develop a strong collaborative relationship between ATU/<strong>TriMet</strong>.• Safety and Service Excellence- Partner with all agency departments in continuous development andimplementation of <strong>TriMet</strong>’s culture of safety and service excellence.Activities:• Productivity Improvement- Encourage/implement improvements identified by RSAs and operatingcondition reports.- Attendance/overtime/extraboard.- On-time service.- Minimize bus idling and drive to achieve best miles per gallon.- Minimize unscheduled overtime consistent with service requirements.• Attendance/Extraboard- Communicate/educate the importance of attendance/absence.- Manage extraboards efficiently.Per<strong>for</strong>mance Measures:• Maintain 99.5% pullout ratio.• Sustain 90.7% bus operator attendance.• Less than 2.6 bus safety incidents per 100,000 miles.• 4.7 miles per gallon.OP-9
BUD1 Personnel Services OPERATIONS - BUS TRANSPORTATION10/11 11/12 12/13 12/1313/14Actual Actual ---------<strong>Budget</strong>---------- Est ---------<strong>Budget</strong>----------Position Title Total Total Base Pos Total Total Base Pos TotalAdministration:Director, Transportation Operations $ 96,414 $ 107,482 $ 107,887 1.00 $ 107,887 $ 112,209 $ 112,209 1.00 $ 112,209Executive Administrator 62,584 52,520 52,722 1.00 52,722 53,933 53,933 1.00 53,933Manager, Work<strong>for</strong>ce Utilization 82,246 1.00 82,246 82,246 82,246 1.00 82,246Fringe Benefits 47,686 53,100 83,689 84,516 86,127Workers' Compensation 78 78Center Garage:Station Manager 84,050 81,937 82,246 1.00 82,246 84,272 84,272 1.00 84,272Assistant Manager, Transp Operations 135,801 128,691 70,992 2.00 141,984 141,282 70,641 2.00 141,282Assistant Manager, Transp Operations 70,641 2.00 141,282Operations Assistant 46,821 46,821 44,579 1.00 44,579 47,001 43,587 1.00 43,587Part-Time Operator 4,304,719 4,705,600 35,496 133.00 4,721,015 4,721,015 35,496 51.00 1,810,314Part-Time Operator 35,496 82.17 2,916,735Active Regular Operator 16,913,915 16,926,761 55,844 345.00 19,266,028 19,266,028 55,844 324.00 18,093,313Active Regular Operator 55,844 32.83 1,833,344Fringe Benefits 12,691,186 11,815,081 13,006,660 13,007,324 13,651,260Workers' Compensation 567,338 408,228 789,471 789,471 803,535Longevity Premium 242,704 242,704 225,253OP-10
BUD1 Personnel Services OPERATIONS - BUS TRANSPORTATION10/11 11/12 12/13 12/1313/14Actual Actual ---------<strong>Budget</strong>---------- Est ---------<strong>Budget</strong>----------Position Title Total Total Base Pos Total Total Base Pos TotalPowell Garage:Station Manager $ 81,936 $ 81,936 $ 82,246 1.00 $ 82,246 $ 84,272 $ 84,272 1.00 $ 84,272Assistant Manager, Transp Operations 69,890 67,500 70,992 1.00 70,992 70,641 70,641 1.00 70,641Assistant Manager, Transp Operations 69,890 70,380 70,992 1.00 70,992 70,641 70,641 2.00 141,282Operations Assistant 42,952 42,952 44,579 1.00 44,579 43,587 43,587 1.00 43,587Part-Time Operator 3,262,220 3,809,956 35,496 95.00 3,372,154 3,372,154 35,496 37.00 1,313,365Part-Time Operator 35,496 59.00 2,094,285Active Regular Operator 14,378,396 14,492,193 55,844 255.00 14,240,108 14,240,108 55,844 243.00 13,569,985Active Regular Operator 55,844 18.00 1,005,184Fringe Benefits 10,592,173 10,802,094 9,568,333 9,568,369 9,986,512Workers' Compensation 1,009,754 1,074,762 1,242,884 1,242,884 1,642,243Longevity Premium 242,373 242,373 254,759Merlo Garage:Station Manager 79,063 79,500 82,246 1.00 82,246 84,272 84,272 1.00 84,272Assistant Manager, Transp Operations 63,053 34,524 70,992 1.00 70,992 70,641Assistant Manager, Transp Operations 63,053 71,226 70,992 1.00 70,992 70,641 70,641 2.00 141,282Operations Assistant 40,914 40,914 44,579 1.00 44,579 43,587 43,587 1.00 43,587Part-Time Operator 2,098,550 2,287,307 35,496 63.00 2,236,270 2,236,270 35,496 26.00 922,905Part-Time Operator 35,496 38.00 1,348,861Active Regular Operator 8,709,520 8,879,999 55,844 158.00 8,823,282 8,823,282 55,844 150.00 8,376,534Active Regular Operator 55,844 13.00 725,966Fringe Benefits 6,322,874 6,330,860 6,063,023 6,063,072 6,347,713Workers' Compensation 502,207 364,057 617,635 617,635 656,943Longevity Premium 167,084 167,084 181,136Station Operations:Station Agent 1,391,784 1,611,935 70,512 23.00 1,621,770 1,621,770 70,512 23.00 1,621,770Chief Station Agent 304,665 386,964 73,986 4.00 295,945 295,945 73,986 4.00 295,945OP-11
BUD1 Personnel Services OPERATIONS - BUS TRANSPORTATION10/11 11/12 12/13 12/1313/14Actual Actual ---------<strong>Budget</strong>---------- Est ---------<strong>Budget</strong>----------Position Title Total Total Base Pos Total Total Base Pos TotalFringe Benefits $ 787,977 $ 853,965$ 807,165 $ 807,165$ 847,463Workers' Compensation 13,769 54,123 46,073 46,073 36,402Longevity Premium 36,688 36,688 40,760Fringe Benefits 729,322 729,322 719,092Timeslip Differential 484,112 484,112 493,674Road Relief Pay 503,683 503,683 513,594Scheduled Overtime 10,715,389 11,686,580 7,185,754 7,185,754 7,229,983Unscheduled & Report OT - Ops. 2,523,425 2,523,425 2,374,129Unscheduled Overtime - Non-Op. 219,199 219,199 230,533Student Training Cost-Center 183,150 183,150 183,150Unpaid Absence (2,373,032) (2,373,032) (2,432,427)Union Insured Premium Repayment 580,900 580,900Unemployment Expense 81,333 81,333 81,333Settlement 3,600,000Sick & Vacation/Holiday Payoff 193,120 193,120 212,262Capitalized Labor/Fringe (8.00) (713,021)Total $ 95,550,543 $ 97,449,9481,091.00 $ 98,850,681 $ 102,462,2001,111.00 $ 100,848,649OP-12
BUD2 Materials & Services OPERATIONS - BUS TRANSPORTATIONActual Actual <strong>Budget</strong> Estimate <strong>Budget</strong> % Change % ofExpense Category 10/11 11/12 12/13 12/13 13/14 FY13-<strong>FY14</strong> M & S TotalAdministration:Vehicle Control System Maintenance $ 34,514Rider Advocates - VOCS 100,114 $ 95,942Laundry 4,834 4,731 $ 5,400 $ 4,800 $ 5,000-7.41% 0.24%Other Services 9,285 35,514 20,000 28,000 22,000 10.00% 1.05%Office Supplies 106 200 0.00%Other Materials 3,030 130 5,000 2,000 5,000 0.00% 0.24%Telephone 12,497 8,858 14,552 8,000 10,000 -31.28% 0.48%Self-Insurance BI/PD 1,004,580 938,163 1,971,420 1,600,000 2,001,000 1.50% 95.53%Vehicle Registration 240 200 240 0.00% 0.01%Local Travel & Meetings 30 0.00%Education & Training 5,900 0.00%Operator CDL Renewals 4,629 5,042 8,000 8,000 8,000 0.00% 0.38%Rewards & Recognition 301 247 0.00%Sub-Total Administration: 1,173,813 1,094,632 2,024,612 1,651,200 2,051,240Center Garage:Other Services 315 4,294 2,400 2,000 2,400 0.00% 0.11%Office Supplies 1,724 4,270 3,000 3,000 3,000 0.00% 0.14%Other Materials 16,596 534 3,600 2,000 3,600 0.00% 0.17%Telephone 2,034 4,075 2,091 3,200 3,000 43.49% 0.14%Safety Awards 344 375 300 360 -4.00% 0.02%Sub-Total Center Garage: 20,670 13,516 11,466 10,500 12,360OP-13
BUD2 Materials & Services OPERATIONS - BUS TRANSPORTATIONActual Actual <strong>Budget</strong> Estimate <strong>Budget</strong> % Change % ofExpense Category 10/11 11/12 12/13 12/13 13/14 FY13-<strong>FY14</strong> M & S TotalPowell Garage:Other Services $ 912 $ 9,909 $ 2,400 $ 9,000 $ 2,4000.00% 0.11%Office Supplies 3,791 3,173 2,400 2,800 2,400 0.00% 0.11%Other Materials 1,437 2,661 1,000 600 1,000 0.00% 0.05%Telephone 4,595 4,614 4,721 3,000 4,200 -11.03% 0.20%Safety Awards 375 300 360 -4.00% 0.02%Sub-Total Powell Garage: 10,735 20,357 10,896 15,700 10,360Merlo Garage:Other Services 1,079 2,066 2,000 2,000 2,000 0.00% 0.10%Office Supplies 5,166 6,079 2,400 2,800 2,400 0.00% 0.11%Other Materials 542 923 800 600 800 0.00% 0.04%Telephone 5,259 4,222 5,833 4,000 5,200 -10.85% 0.25%Safety Awards 1,276 881 257 360 360 40.08% 0.02%Sub-Total Merlo Garage: 13,322 14,172 11,290 9,760 10,760Station Operations:Other Services 380 1,800 1,000 1,000 -44.44% 0.05%Office Supplies 8,065 10,716 5,000 8,000 8,000 60.00% 0.38%Other Materials 374 897 1,200 1,000 1,000 -16.67% 0.05%Telephone 330 300Sub-Total Station Operations: 8,818 11,943 8,000 10,300 10,000$ 1,227,358 $ 1,154,621 $ 2,066,264 $ 1,697,460 $ 2,094,7201.38% 100.00%OP-14
Department Summary OPERATIONS - SCHEDULINGActual <strong>Budget</strong> Estimate <strong>Budget</strong> % Change % of10/11 11/12 12/13 12/13 13/14 FY13- <strong>FY14</strong> Dept. TotalPersonnel Services $ 1,099,665 $ 1,106,651 $ 1,117,559 $ 1,119,993 $ 1,112,672-0.44% 99.37%Materials & Services 8,954 7,051 6,829 5,200 7,000 2.50% 0.63%Total $ 1,108,619 $ 1,113,702 $ 1,124,388 $ 1,125,193 $ 1,119,672-0.42% 100.00%Responsibility:The Scheduling Department is responsible <strong>for</strong> three major functions:Scheduling, Scheduling Systems and Special Events Planning.Activities:• Scheduling- Schedule writing.- Runcutting.- Vehicle assignment.- Material production.• Scheduling Systems- Scheduling systems maintenance.- Application development.- Website support.Per<strong>for</strong>mance Measures:• Continuous improvement to on-time per<strong>for</strong>mance, meet capacityrequirements and create safe and efficient work assignments <strong>for</strong> bus andrail operators.• Produce and distribute accurate schedule in<strong>for</strong>mation to operators andsupervisory personnel.• Make efficient use of scheduling software, hardware tools and provide ongoingsystem administration. Disseminate scheduling materials andin<strong>for</strong>mation to agency users and <strong>for</strong> web production.• Plan, design and implement service <strong>for</strong> special events. Provide plans <strong>for</strong>emergency response to service disruptions. Prepare operational serviceplans <strong>for</strong> construction-related projects.• Special Events Planning- Support to events service design.- Special events service schedules.OP-15
BUD1 Personnel Services OPERATIONS - SCHEDULING10/11 11/12 12/1312/1313/14Actual Actual ---------<strong>Budget</strong>---------- Est ---------<strong>Budget</strong>----------Position Title Total Total Base Pos Total Total Base Pos TotalManager, Scheduling $ 91,985 $ 91,985 $ 92,331 1.00 $ 92,331 $ 94,398 $ 94,398 1.00 $ 94,398Manager, Sched. Systems & Prod. 86,836 1.00 86,836Schedule Data Technician 202,198 208,637 70,512 3.00 211,535 211,535 70,512 3.00 211,535Computer Technology Specialist 195,241 197,774 98,988 2.00 197,976 197,976 98,988 1.00 98,988Schedule Writer II 267,166 275,474 70,512 4.00 282,047 282,047 70,512 4.00 282,047Schedule Writer I (Field Scheduler) 34,596Fringe Benefits 307,653 331,940 304,781 305,147 314,177Union Insured Premium Repayment 4,823 4,823Sick & Vacation/Holiday Payoff 1,615 1,615 1,542Workers' Compensation 375 375Longevity Premium 19,505 19,505 20,149Unscheduled Overtime 826 841 2,571 2,571 3,000Total $ 1,099,665 $ 1,106,65110.00 $ 1,117,559 $ 1,119,99310.00 $ 1,112,672OP-16
BUD2 Materials & Services OPERATIONS - SCHEDULINGActual Actual <strong>Budget</strong> Estimate <strong>Budget</strong> % Change % ofExpense Category 10/11 11/12 12/13 12/13 13/14 FY13-<strong>FY14</strong> M & S TotalOther Services $ 4,344 $ 4,428 $ 3,600 $ 3,200 $ 3,600 0.00% 51.43%Office Supplies 144 800 800 1,000 25.00% 14.29%Other Materials 223 438 800 600 1,000 25.00% 14.29%Microcomputer Materials 2,718 1,635 0.00%Telephone 1,450 550 1,629 600 1,400 -14.06% 20.00%Education & Training 75 0.00%$ 8,954 $ 7,051 $ 6,829 $ 5,200 $ 7,000 2.50% 100.00%OP-17
Department Summary OPERATIONS - FIELD OPERATIONSActual <strong>Budget</strong> Estimate <strong>Budget</strong> % Change % of10/11 11/12 12/13 12/13 13/14 FY13- <strong>FY14</strong> Dept. TotalPersonnel Services $ 11,391,690 $ 12,199,639 $ 13,732,245 $ 13,742,966 $ 14,189,9743.33% 96.80%Materials & Services 244,480 311,597 459,900 449,700 469,626 2.11% 3.20%Total $ 11,636,169 $ 12,511,236 $ 14,192,145 $ 14,192,666 $ 14,659,6003.29% 100.00%Responsibility:The Field Operations Department consists of Bus Dispatch, Rail Control,Road and Rail Supervisor functions and personnel in one department, <strong>for</strong>efficient use of field personnel and equipment and effective coordination oftransportation operations during regular and special event service and inresponse to incidents.Activities:Per<strong>for</strong>mance Measures:• Safe, on-time bus and MAX service delivery.• Improve fare en<strong>for</strong>cement.• High customer satisfaction <strong>for</strong> special event service operations.• Operation of rail control & bus dispatch.• Control & supervision of all light rail and bus movements according tostandard operating procedures and principles of safety and serviceexcellence.• En<strong>for</strong>cement of <strong>TriMet</strong> Codes relating to fare policy and otherregulations.• Maintain safe, secure and on-time service to <strong>TriMet</strong> customers.• Prepare and manage operating plans <strong>for</strong> special events service.OP-18
BUD1 Personnel Services OPERATIONS - FIELD OPERATIONS10/11 11/12 12/13 12/1313/14Actual Actual ---------<strong>Budget</strong>---------- Est ---------<strong>Budget</strong>----------Position Title Total Total Base Pos Total Total Base Pos TotalAdministration:Manager, Field Operations $ 89,152 $ 89,152 $ 89,492 1.00 $ 89,492 $ 93,375 $ 93,375 1.00 $ 93,375Manager, Rail Operations 92,700 92,700 93,062 1.00 93,062 96,152Asst. Mgr., Ops. Command Ctr. 79,480 1.00 79,480Asst. Mgr., Ops. Command Ctr. 79,480 1.00 79,480Assistant Manager, Field Operations 50,991 77,000 77,347 1.00 77,347 79,480 79,480 1.00 79,480Assistant Manager, Field Operations 77,132 77,132 77,347 1.00 77,347 77,347 79,480 1.00 79,480Fringe Benefits 96,766 111,800 115,374 116,988 143,549Workers' Compensation 164 164Road Operations:Field Operations Coordinator 147,285 150,278 73,986 3.00 221,959 221,959 73,986 3.00 221,959Dispatcher 1,198,851 1,201,984 70,512 18.00 1,269,212 1,269,212 70,512 18.00 1,269,212Lead Dispatcher/Controller 148,918 73,986 1.00 73,986 73,986 73,986 1.00 73,986Lead Field Supervisor 253,663 299,126 73,986 4.00 295,945 295,945 73,986 4.00 295,945Road Supervisor 1,905,173 2,059,768 70,512 37.00 2,608,935 2,608,935 70,512 37.00 2,608,935Fringe Benefits 1,560,853 1,703,578 1,920,691 1,908,716 2,017,176Workers' Compensation 40,454 70,473 76,531 76,531 52,572Longevity Premium 97,259 97,259 83,781Unscheduled Overtime 265,329 399,681 433,049 433,049 484,780Night Differential 6,306 6,306 6,306Rail Operations:Controller 1,289,652 1,326,129 70,512 19.00 1,339,723 1,339,723 70,512 19.00 1,339,723Lead Dispatcher/Controller 110,535 73,986 1.00 73,986 73,986Rail Supervisor 1,817,977 1,891,909 70,512 32.00 2,256,376 2,256,376 70,512 32.00 2,256,376Fringe Benefits 1,356,705 1,464,061 1,580,436 1,580,436 1,629,564Workers' Compensation 327,510 11,584 25,767 25,767 283,743Longevity Premium 51,887 51,887 51,922OP-19
BUD1 Personnel Services OPERATIONS - FIELD OPERATIONS10/11 11/12 12/13 12/1313/14Actual Actual ---------<strong>Budget</strong>---------- Est ---------<strong>Budget</strong>----------Position Title Total Total Base Pos Total Total Base Pos TotalUnscheduled Overtime $ 243,313 $ 296,887$ 346,783 $ 346,783$ 390,322Night Differential 5,134 5,134 5,134Fare Inspection:Fare Inspector 389,302 408,798 $ 70,512 5.00 352,559 352,559 $ 70,512 5.00 352,559Fringe Benefits 156,311 160,648 137,347 149,322 157,113Workers' Compensation 11,460 (747) 230 230 6,890Longevity Premium 7,540 7,540 12,215Unscheduled Overtime 24,540 48,246Union Insured Premium Repayment 64,306 64,306Sick & Vacation/Holiday Payoff 33,512 33,512 34,917Capitalized Labor/Fringe (3,427)Total $ 11,391,690 $ 12,199,639124.00 $ 13,732,245 $ 13,742,966124.00 $ 14,189,974OP-20
BUD2 Materials & Services OPERATIONS - FIELD OPERATIONSActual Actual <strong>Budget</strong> Estimate <strong>Budget</strong> % Change % ofExpense Category 10/11 11/12 12/13 12/13 13/14 FY13-<strong>FY14</strong> M & S TotalAdministration:Temporary Help $ 7,825 $ 13,439 $ 8,000 $ 8,200 $ 8,200 2.50% 1.75%Other Services 42,788 14,964 8,000 10,000 9,540 19.25% 2.03%Office Supplies 5,044 5,189 2,400 4,000 4,000 66.67% 0.85%Other Materials 1,066 2,502 4,000 1,200 4,000 0.00% 0.85%Telephone 16 187 240 200 200 -16.67% 0.04%Employee Recognition 600 600 600 0.00% 0.13%Sub-Total Administration: 56,738 36,281 23,240 24,200 26,540Road Operations:Uni<strong>for</strong>ms 11,919 14,847 14,225 12,000 14,400 1.23% 3.07%Vehicle Control System Maintenance 82,083 141,067 330,662 320,000 332,386 0.52% 70.78%Other Services 8,323 32,178 3,000 2,800 3,000 0.00% 0.64%Computer Supplies 217 7,000 0.00%Other Materials 5,123 5,253 6,800 14,000 7,200 5.88% 1.53%Telephone 13,026 13,859 8,810 12,000 36.21% 2.56%Education & Training 24,258 0.00%Local Travel & Meetings 2,193 80 0.00%Driver Accommodations 30 23,979 36,000 32,000 36,000 0.00% 7.67%CDL Renewals 61 400 320 400 0.00% 0.09%Sub-Total Road Operations: 147,171 231,244 399,897 388,200 405,386OP-21
BUD2 Materials & Services OPERATIONS - FIELD OPERATIONSActual Actual <strong>Budget</strong> Estimate <strong>Budget</strong> % Change % ofExpense Category 10/11 11/12 12/13 12/13 13/14 FY13-<strong>FY14</strong> M & S TotalRail Operations:Uni<strong>for</strong>ms $ 13,791 $ 11,621 $ 13,306 $ 11,000 $ 13,000 -2.30% 2.77%Other Services 1,679 2,249 2,138 2,000 2,400 12.25% 0.51%Other Materials 15,388 19,164 12,000 14,000 12,000 0.00% 2.56%Telephone 9,528 10,916 9,019 10,000 10,000 10.88% 2.13%CDL Renewals 185 122 300 300 300 0.00% 0.06%Sub-Total Rail Operations: 40,570 44,072 36,763 37,300 37,700$ 244,480 $ 311,597 $ 459,900 $ 449,700 $ 469,626 2.11% 100.00%OP-22
Department Summary OPERATIONS - TRANSPORTATION PLANNINGActual <strong>Budget</strong> Estimate <strong>Budget</strong> % Change % of10/11 11/12 12/13 12/13 13/14 FY13- <strong>FY14</strong> Dept. TotalPersonnel Services $ 713,967 $ 561,574 $ 519,980 $ 533,124 $ 589,41113.35% 38.64%Materials & Services 562,398 630,220 813,854 538,730 936,030 15.01% 61.36%Total $ 1,276,364 $ 1,191,794 $ 1,333,834 $ 1,071,854 $ 1,525,44114.37% 100.00%Responsibility:The Transportation Planning Department is responsible <strong>for</strong> service planningand program management.Activities:• Service Planning- Annual Service Plan and service change implementation.- Five-year Transit Investment Plan (TIP).- Operational plans and analysis.Per<strong>for</strong>mance Measures:• Successfully implement transit service changes within budget, on timeand achieve ridership objectives.• Sustain service reallocation program to achieve at least 75%revenue/plat<strong>for</strong>m hours <strong>for</strong> bus service.• Program Management- Jobs access and reverse commute grant.OP-23
BUD1 Personnel Services OPERATIONS - TRANSPORTATION PLANNING10/11 11/12 12/13 12/1313/14Actual Actual ---------<strong>Budget</strong>---------- Est ---------<strong>Budget</strong>----------Position Title Total Total Base Pos Total Total Base Pos TotalDirector, Service Planning & Scheduling $ 112,654 $ 112,614 $ 112,836 1.00 $ 112,836 $ 115,654 $ 115,654 1.00 $ 115,654Sr Mgr, Comm Programs & Serv Develop 91,837Manager, Service Planning 78,710 78,710 83,165 1.00 83,165 85,211 85,211 1.00 85,211Planner III 193,388 131,654 64,728 2.00 129,456 133,924 66,962 2.00 133,924Planner II 50,276 50,276 50,467 1.00 50,467 52,471 54,959 2.00 109,918Fringe Benefits 187,102 188,320 122,181 123,988 164,360Limited Term Employment 7,200 7,200 7,200Workers' Compensation 271 271Sick & Vacation/Holiday Payoff 14,404 14,404 14,404Capitalized Labor/Fringe (0.50) (41,261)Total $ 713,967 $ 561,5745.00 $ 519,980 $ 533,1245.50 $ 589,411OP-24
BUD2 Materials & Services OPERATIONS - TRANSPORTATION PLANNINGActual Actual <strong>Budget</strong> Estimate <strong>Budget</strong> % Change % ofExpense Category 10/11 11/12 12/13 12/13 13/14 FY13-<strong>FY14</strong> M & S TotalProfessional & Technical $ 3,098 $ 65,000 $ 30,000 $ 165,000 153.85% 17.63%Program Services - Job Access $ 558,090 613,595 745,072 500,000 765,189 2.70% 81.75%Other Services 78 400 2,000 1,000 150.00% 0.11%Office Supplies 2,230 2,857 1,000 1,200 1,200 20.00% 0.13%Other Materials 115 60 300 300 480 60.00% 0.05%Microcomputer Materials 133 0.00%Telephone 1,753 1,045 1,530 1,530 1,561 2.05% 0.17%Local Travel & Meetings 1,735 552 700 600 8.70% 0.06%Education & Training 1,025 0.00%Out-of-Town Travel 6,805 3,000 1,000 0.11%$ 562,398 $ 630,220 $ 813,854 $ 538,730 $ 936,030 15.01% 100.00%OP-25
Department Summary OPERATIONS - ACCESSIBLE TRANSPORTATION PROGRAMS-LIFTActual <strong>Budget</strong> Estimate <strong>Budget</strong> % Change % of10/11 11/12 12/13 12/13 13/14 FY13- <strong>FY14</strong> Dept. TotalPersonnel Services $ 1,030,312 $ 985,036 $ 1,145,263 $ 1,156,629 $ 1,183,8483.37% 3.64%Materials & Services 29,857,346 30,759,126 31,160,840 31,138,426 31,342,076 0.58% 96.36%Total $ 30,887,657 $ 31,744,162 $ 32,306,103 $ 32,295,055 $ 32,525,9240.68% 100.00%Responsibility:The Accessible Transportation Programs - LIFT Department is responsible<strong>for</strong> providing safe, reliable and efficient demand-response transportation insupport of the LIFT Program, designed to meet the American with DisabilitiesAct (ADA) requirement <strong>for</strong> complementary paratransit service <strong>for</strong> personsunable to use fixed route service.Activities:• Deliver safe, high-quality and cost-effective paratransit service that meetsor exceeds ADA requirements.• Maximize resources through the LIFT eligibility process. Effectivelyevaluate LIFT applicants’ functional abilities to determine mostappropriate mode of travel and conditions under which trips can be taken.Per<strong>for</strong>mance Measures:• Exceed 93% of pickups within 30 minutes of scheduled pickup window.• Achieve 100,000 miles or more per preventable collision.• Maintain or exceed rides per vehicle hour at 1.75.• Eligibility assessment <strong>for</strong> new and re-certification of existing LIFT clients.• Answer 95% of customer calls within 5 minutes.• 25,000 miles between mechanical failures <strong>for</strong> LIFT buses.• <strong>Review</strong> quality of customer service through analysis of customer feedbackof all aspects of experiences with LIFT service and using that process toimprove service. Improve relationships with the community throughoutreach, including staff support to <strong>TriMet</strong>’s Committee on AccessibleTransportation (CAT).OP-26
BUD1 Personnel Services OPERATIONS - ACCESSIBLE TRANSPORTATION PROGRAMS-LIFT10/11 11/12 12/13 12/1313/14Actual Actual ---------<strong>Budget</strong>---------- Est ---------<strong>Budget</strong>----------Position Title Total Total Base Pos Total Total Base Pos TotalDirector, Business Programs $ 19,039 $ 110,000 1.00 $ 110,000 $ 110,413 $ 110,413 1.00 $ 110,413Mgr, LIFT Service Delivery $ 87,208 87,208 87,550 1.00 87,550 90,181 90,181 1.00 90,181Asst. Mgr., LIFT Service Delivery 79,000 1.00 79,000ATP Operations Administrator 69,343 69,343 69,614 1.00 69,614 71,681LIFT Service Quality Administrator 58,968 30,580 53,202 1.00 53,202 54,810 54,810 1.00 54,810ATP Administrative Coordinator 42,490 46,576 53,307 0.80 42,646 44,099 55,123 0.80 44,099ATP Assistant 17,222 17,364 41,487 0.50 20,744 20,744 41,487 0.50 20,744Manager, LIFT Eligibility & Comm. Relations 74,335 75,001 83,608 1.00 83,608 83,608 83,608 1.00 83,608Senior Eligibility Specialist - LIFT Eligibility 84,822 82,850 62,244 1.00 62,244 63,788 63,788 1.00 63,788Coordinator - LIFT Eligibility 152,207 143,425 51,318 3.00 153,954 153,954 51,318 3.00 153,954Coordinator - LIFT Eligibility 49,300 49,300 51,318 1.00 51,318 51,318 51,318 1.00 51,318ATP Assistant - LIFT Eligibility 79,872 64,561 41,487 2.00 82,975 82,975 41,487 2.00 82,974Fringe Benefits 314,545 299,789 314,849 316,499 336,821Sick & Vacation/Holiday Payoff 12,138 12,138 12,138Workers' Compensation 421 421Total $ 1,030,312 $ 985,03613.30 $ 1,145,263 $ 1,156,62913.30 $ 1,183,848OP-27
BUD2 Materials & Services OPERATIONS - ACCESSIBLE TRANSPORTATION PROGRAMS-LIFTActual Actual <strong>Budget</strong> Estimate <strong>Budget</strong> % Change % ofExpense Category 10/11 11/12 12/13 12/13 13/14 FY13-<strong>FY14</strong> M & S TotalLIFT Operations:LIFT Central Dispatch $ 1,962,481 $ 2,037,547 $ 2,068,888 $ 2,066,163 $ 2,095,0001.26% 6.68%Professional & Technical 4,650 10,000 10,000 10,000 0.00% 0.03%Office Equipment Service/Repair 718 168 1,000 600 1,000 0.00% 0.00%ATP Central Maintenance Contract 2,005,655 2,024,439 1,996,502 2,033,500 2,088,400 4.60% 6.66%Background Check Services 9,262 12,424 14,160 11,000 11,160 -21.19% 0.04%Printing Services 21,497 15,268 19,500 18,500 19,525 0.13% 0.06%Other Services 7,995 5,346 8,800 11,400 9,468 7.59% 0.03%Other Services-Revenue Vehicle Maintenance 91,316 102,892 100,000 95,500 100,000 0.00% 0.32%Diesel Fuel - Revenue Vehicles 2,490,624 2,733,113 2,945,811 2,945,811 2,663,457 -9.58% 8.50%Oil & Lubricants 52,144 77,899 85,000 58,000 65,000 -23.53% 0.21%Gasoline - Revenue Vehicles 107,303 140,058 124,000 124,000 128,000 3.23% 0.41%Tires, Lease/Purchase Revenue 92,178 62,464 72,000 75,000 80,000 11.11% 0.26%Office Supplies 7,914 7,605 8,000 9,000 9,000 12.50% 0.03%Furniture & Equipment
BUD2 Materials & Services OPERATIONS - ACCESSIBLE TRANSPORTATION PROGRAMS-LIFTActual Actual <strong>Budget</strong> Estimate <strong>Budget</strong> % Change % ofExpense Category 10/11 11/12 12/13 12/13 13/14 FY13-<strong>FY14</strong> M & S TotalEducation & Training $ 671$ 750 $ 750 $ 250 -66.67% 0.00%Out-of-Town Travel 1,183 1,500 0.00%CAT Committee 20,868 $ 20,06534,805 25,600 25,465 -26.84% 0.08%Leases 32,584 0.00%Sub-Total LIFT Operations: 29,185,038 30,024,543 30,307,205 30,316,273 30,465,393LIFT Eligibility:Contracted Dispatch 46,066 47,960 50,051 57,052 65,000 29.87% 0.21%Contracted Eligibility Assessment 310,053 325,893 348,230 332,507 326,900 -6.13% 1.04%Professional & Technical 125 1,000 1,000 1,000 0.00% 0.00%Office Equipment Service/Repair 1,000 600 1,000 0.00% 0.00%ATP Central Maintenance Contract 6,950 8,230 13,500 12,750 15,125 12.04% 0.05%Printing Services 5,125 6,101 7,500 9,000 13,250 76.67% 0.04%Other Services 10,540 22,061 18,500 14,500 13,000 -29.73% 0.04%Diesel Fuel - Revenue Vehicles 11,791 12,287 14,000 15,400 16,900 20.71% 0.05%Office Supplies 10,760 8,884 12,000 8,500 8,100 -32.50% 0.03%Furniture & Equipment
Department Summary OPERATIONS - ACCESSIBLE TRANSPORTATION PROGRAMS-MTPActual <strong>Budget</strong> Estimate <strong>Budget</strong> % Change % of10/11 11/12 12/13 12/13 13/14 FY13- <strong>FY14</strong> Dept. TotalPersonnel Services $ 417,468 $ 405,902 $ 413,418 $ 426,719 $ 422,2852.14% 2.13%Materials & Services 15,735,934 16,635,374 16,475,391 17,147,255 19,365,748 17.54% 97.87%Total $ 16,153,402 $ 17,041,276 $ 16,888,809 $ 17,573,974 $ 19,788,03317.17% 100.00%Responsibility:The Accessible Transportation Programs - MTP Department is responsible<strong>for</strong> providing safe, reliable and efficient transportation in support of theMedical Transportation Program (MTP), <strong>TriMet</strong>’s IntergovernmentalAgreement with the State of Oregon Department of Medical AssistancePrograms (DMAP) to broker Medicaid-eligible trips.Activities:• Develop and implement contracting and scheduling processes to providesafe, successful service to Medicaid transportation clients via professionalride scheduling services and skilled transportation providers.Per<strong>for</strong>mance Measures:• Client transportation available <strong>for</strong> medical transports 24hours/day, 365days /year.• 80% of client calls answered within three minutes, 95% of calls answeredwithin five minutes.• Transportation provider drivers pass FBI fingerprint background checks.• Transportation provider vehicles pass annual ASE, ADA and MTPinspections.OP-30
BUD1 Personnel Services OPERATIONS - ACCESSIBLE TRANSPORTATION PROGRAMS-MTP10/11 11/12 12/13 12/1313/14Actual Actual ---------<strong>Budget</strong>---------- Est ---------<strong>Budget</strong>----------Position Title Total Total Base Pos Total Total Base Pos TotalManager, Transportation Brokerage $ 84,195 $ 84,195 $ 84,522 1.00 $ 84,522 $ 87,049 $ 87,049 1.00 $ 87,049Administrative Specialist - ATP 45,777 45,267 45,706 1.00 45,706 46,792 42,595 1.00 42,595Administrative Specialist - ATP 17,222 17,364 34,577 0.50 17,289 20,744 36,477 0.50 18,239MTP Contract Administrator 63,256 63,240 60,468 1.00 60,468 62,285 62,285 1.00 62,285MTP Programmer/Analyst 92,033 92,033 92,394 1.00 92,394 94,941 94,941 1.00 94,941Fringe Benefits 116,458 111,702 112,864 114,733 117,001Workers' Compensation 175 175 175Overtime 246Capitalized Labor/Fringe (1,720) (7,899)Total $ 417,468 $ 405,9024.50 $ 413,418 $ 426,7194.50 $ 422,285OP-31
BUD2 Materials & Services OPERATIONS - ACCESSIBLE TRANSPORTATION PROGRAMS-MTPActual Actual <strong>Budget</strong> Estimate <strong>Budget</strong> % Change % ofExpense Category 10/11 11/12 12/13 12/13 13/14 FY13-<strong>FY14</strong> M & S TotalDMAP - MTP:MTP Central Dispatch $ 1,240,862 $ 1,224,036 $ 1,220,014 $ 1,215,000 $ 1,296,7506.29% 6.70%Contracted Driver Training 92,000 0.48%Legal 3,727 3,600 2,000 3,600 0.00% 0.02%OMAP Survey 36,918 45,000 0.23%Temporary Staff 1,706 1,900 1,710 1,900 0.00% 0.01%Background Checks 33,406 29,890 39,629 38,500 38,076 -3.92% 0.20%Printing Services 1,559 5,799 7,060 6,340 5,420 -23.23% 0.03%Other Services 436 209 5,000 2,500 40,000 700.00% 0.21%Tickets 90,241 75,196 73,950 70,950 76,000 2.77% 0.39%Passes 137,850 158,233 164,730 167,730 176,000 6.84% 0.91%Office Supplies 5,280 6,679 8,550 6,100 6,840 -20.00% 0.04%Furniture & Equipment
BUD2 Materials & Services OPERATIONS - ACCESSIBLE TRANSPORTATION PROGRAMS-MTPActual Actual <strong>Budget</strong> Estimate <strong>Budget</strong> % Change % ofExpense Category 10/11 11/12 12/13 12/13 13/14 FY13-<strong>FY14</strong> M & S TotalWaivered Non-Medical:Contracted Dispatch $ 65,309 $ 64,453 $ 64,212 $ 63,870 $ 68,2506.29% 0.35%Temporary Staff 90 100 90 100 0.00% 0.00%Background Checks 2,351 1,547 2,086 2,026 2,004 -3.93% 0.01%Printing Services 78 197 240 255 180 -25.00% 0.00%Other Services 5 5,000 132 1,000 -80.00% 0.01%Tickets 1,020 1,020 700 -31.37% 0.00%Passes 3,010 3,010 3,400 12.96% 0.02%Office Supplies 1 236 450 320 360 -20.00% 0.00%Furniture & Equipment
Department Summary OPERATIONS - BUS MAINTENANCEActual <strong>Budget</strong> Estimate <strong>Budget</strong> % Change % of10/11 11/12 12/13 12/13 13/14 FY13- <strong>FY14</strong> Dept. TotalPersonnel Services $ 25,525,319 $ 26,907,402 $ 27,898,249 $ 27,942,941 $ 28,380,7421.73% 49.99%Materials & Services 25,365,892 27,521,060 28,906,904 28,234,960 28,387,680 -1.80% 50.01%Total $ 50,891,212 $ 54,428,462 $ 56,805,153 $ 56,177,901 $ 56,768,422-0.06% 100.00%Responsibility:The Bus Maintenance Department is responsible <strong>for</strong> effectively and efficientlyproviding safe, clean and reliable vehicles and other services <strong>for</strong> use by itscustomers, passengers, operators and staff.Activities:• Develop and manage replacement projects <strong>for</strong> all fixed-route buses andnon-revenue vehicles.• Conduct preventive maintenance procedures in full compliance withpreventive maintenance program guidelines <strong>for</strong> all vehicles within itsresponsibility.• Train employees to necessary safety and skill levels, administer apprenticeprogram <strong>for</strong> diesel bus mechanics. Provide recurrent update and vendortraining <strong>for</strong> the entire work<strong>for</strong>ce.• Maintain fleet appearance through daily cleaning, exterior washing,fueling.• Repair all defects and failures in mechanical and body systems.• Provide modern, safe, well-maintained shops, tools and equipment.• Develop, administer, train and utilize the Maintenance ManagementIn<strong>for</strong>mation System (MMIS) <strong>for</strong> scheduling, analysis and reporting of Busand Rail Maintenance activities.• Manage contracts <strong>for</strong> procurement of maintenance materials, services andcapital goods.• Administer revenue and NRV warranty programs.• Oversee inventory receiving, control and distribution in storerooms <strong>for</strong> Busand Rail Maintenance.Per<strong>for</strong>mance Measures:• 3,100 miles between mechanical failures.• 92.5% attendance <strong>for</strong> Bus Maintenance employees.• Maintain 15 or fewer instances of workplace accidents per 200,000 laborhours.• 85% on-time completion of preventive maintenance procedures.• Scheduled maintenance activities to account <strong>for</strong> 70% of bus repair hours.• Bus Maintenance inventory turnover rate at or more than 2.0.OP-34
BUD1 Personnel Services OPERATIONS - BUS MAINTENANCE10/11 11/12 12/13 12/1313/14Actual Actual ---------<strong>Budget</strong>---------- Est ---------<strong>Budget</strong>----------Position Title Total Total Base Pos Total Total Base Pos TotalDirector, Maintenance Operations $ 116,700 $ 116,700 $ 117,158 1.00 $ 117,158 $ 120,666 $ 120,666 1.00 $ 120,666Garage Manager 264,838 264,838 88,622 3.00 265,866 280,377 93,459 3.00 280,377Maintenance Supervisor 939,715 901,135 71,280 9.00 641,520 649,197 72,133 7.00 504,931Maintenance Supervisor 74,721 71,280 5.00 356,400 360,665 72,133 7.00 504,931Assistant Supervisor 586,083 883,844 66,311 12.00 795,728 795,728 66,311 12.00 795,728Journeyman/Apprentice Mechanic 8,410,078 8,845,808 57,668 154.00 8,880,945 8,880,945 57,668 157.00 9,053,950Maintenance Mechanic 445,345 360,261 56,952 7.00 398,666 398,666 56,952 7.00 398,666Service Worker 3,239,384 3,494,882 46,767 61.00 2,852,788 2,852,788 46,767 18.00 841,806Service Worker 46,767 45.17 2,112,466MMIS/Clerk of Maintenance 249,576 359,766 54,873 7.00 384,108 384,108 54,873 7.00 384,108Cleaner/Relief MMIS 135,570Cleaner 212,294 243,264 46,767 6.00 280,602 280,602 46,767 6.00 280,602Tire Servicer 319,465 339,086 56,948 7.00 398,637 398,637 56,948 5.00 284,741Manager, Maintenance Training 81,501 81,501 81,808 1.00 81,808 85,337 85,337 1.00 85,337Administrator Bus Maintenance 59,456 59,456 59,675 1.00 59,675 62,556 62,556 1.00 62,556Maintenance Trainer 280,743 295,461 66,311 4.00 265,243 265,243 66,311 4.00 265,243Stores Supervisor 68,910 68,910 69,175 1.00 69,175 71,034 71,034 1.00 71,034Assistant Storekeeper 180,149 184,404 62,834 4.00 251,337 251,337 62,834 4.00 251,337Junior Partsman 214,012 357,462 57,668 2.00 115,337 115,337 57,668 2.00 115,337Partsman 300,585 174,492 59,859 7.00 419,011 419,011 59,859 7.00 419,011NRV Mechanic 203,797 203,905 57,668 4.00 230,674 230,674 57,668 4.00 230,674Fringe 8,227,021 8,588,263 8,508,415 8,514,878 8,945,599Workers' Compensation 626,013 554,995 918,641 918,641 922,450Longevity Premium 686,014 686,014 668,778Night Differential 188,416 188,416 190,585Training Pay 5,758 5,758 5,758Tool Allowance 150,674 150,674 152,318Unscheduled Overtime 364,084 459,731 435,405 435,405 436,497Unpaid Absence (72,910) (72,910) (73,736)Union Insured Premium Repayment 148,440 148,440Sick & Vacation/Holiday Payoff 64,718 64,718 68,990Capitalized Labor/Fringe (5,484)Total $ 25,525,319 $ 26,907,402296.00 $ 27,898,249 $ 27,942,941299.17 $ 28,380,742OP-35
BUD2 Materials & Services OPERATIONS - BUS MAINTENANCEActual Actual <strong>Budget</strong> Estimate <strong>Budget</strong> % Change % ofExpense Category 10/11 11/12 12/13 12/13 13/14 FY13-<strong>FY14</strong> M & S TotalContracted Bus Maintenance - MAF $ 215,086 $ 253,185 $ 235,013 $ 264,937 $ 243,083 3.43% 0.86%Other Services 160,388 130,433 130,264 146,902 143,090 9.85% 0.50%CRT Filter Cleaning 44,864 43,700 45,000 44,282 44,400 -1.33% 0.16%Diesel Fuel - Revenue Vehicles 15,226,916 17,191,225 18,240,939 17,622,288 18,493,999 1.39% 65.15%Office Supplies 21,259 24,347 28,000 26,547 28,200 0.71% 0.10%Telephone 22,887 17,447 21,817 20,577 21,000 -3.74% 0.07%CDL Renewals 946 2,535 2,800 2,218 2,640 -5.71% 0.01%Employee Recognition 614 8,337 2,000 6,600 4,800 140.00% 0.02%Laundry 96,956 91,332 101,166 99,997 103,211 2.02% 0.36%Oil & Lubricants 532,119 600,835 321,431 591,871 332,163 3.34% 1.17%Tires, Lease/Purchase Revenue 700,789 640,167 603,967 670,162 607,222 0.54% 2.14%Repair Materials - Revenue Equipment 61,774 59,396 57,783 61,117 58,800 1.76% 0.21%Maint. Materials - Revenue Equipment 6,869,333 7,052,660 8,039,678 7,186,047 7,213,689 -10.27% 25.41%Freight - Priority 28,728 31,638 58,000 39,585 34,800 -40.00% 0.12%Shop Equipment Replacement 7,041 10,215 8,200 10,930 9,000 9.76% 0.03%Cleaning Supplies 157,453 186,070 183,998 193,660 188,200 2.28% 0.66%Small Hand Tools 22,640 19,237 21,000 22,295 21,600 2.86% 0.08%Other Materials 6,329 12,009 12,000 13,027 12,000 0.00% 0.04%Safety Supplies 93,771 102,304 63,829 99,992 84,063 31.70% 0.30%Winter Supplies 118,719 74,610 25,000 195,702 24,000 -4.00% 0.08%Education & Training 252 5,000 5,391 5,040 0.80% 0.02%Obsolete Inventory 34,678 27,402 19,882 0.00%Average Cost Variance (517) (206) 336 0.00%Inventory Adjustments 153,862 198,782 177,595 0.00%Invoice Price Variance (15,911) (7,823) (14,123) 0.00%Operating Expense Transfer (85,448) (64,156)Body Work - Non Revenue Vehicles 19,312 12,846 5,253 13,156 12,600 139.86% 0.04%Diesel Fuel - Non Revenue Vehicles 35,612 41,347 33,620 43,129 34,200 1.73% 0.12%Gasoline - Non Revenue Vehicles 456,210 537,151 378,216 444,491 380,400 0.58% 1.34%Tires - Non Revenue Vehicles 28,936 22,500 20,930 24,009 21,480 2.63% 0.08%Maint. Materials - NRVs 264,847 222,828 262,000 266,517 264,000 0.76% 0.93%$ 25,365,892 $ 27,521,060 $ 28,906,904 $ 28,234,960 $ 28,387,680 -1.80% 100.00%OP-36
Department Summary OPERATIONS - FACILITIES MANAGEMENTActual <strong>Budget</strong> Estimate <strong>Budget</strong> % Change % of10/11 11/12 12/13 12/13 13/14 FY13- <strong>FY14</strong> Dept. TotalPersonnel Services $ 6,922,704 $ 7,465,780 $ 7,373,098 $ 7,401,555 $ 7,574,0522.73% 51.44%Materials & Services 8,359,431 7,325,917 6,950,017 7,335,153 7,149,115 2.86% 48.56%Total $ 15,282,135 $ 14,791,697 $ 14,323,115 $ 14,736,708 $ 14,723,1682.79% 100.00%Responsibility:The Facilities Management Department is responsible <strong>for</strong> managing facilityassets, planning, acquiring and allocating resources, maintaining assets andproviding a safe, healthy and productive work environment.Activities:• Transit centers, MAX station plat<strong>for</strong>ms, park and rides and Portland Mallmaintenance.• Maintenance of operations and administration facilities.• Sustainable landscaping practices oversight and management.• Concession program management.• Maintenance and repair of bus stops.• Plant maintenance mechanic apprenticeship program.• State of Good Repair capital and operating projects.Per<strong>for</strong>mance Measures:• Maximize existing resources to increase services and efficiencies at districtfacilities, plat<strong>for</strong>ms, transit centers, park and rides and neighborhood busshelters, focusing on service quality.• Value the contributions of and invest in each employee, engage staff indecision-making. Implement improvements to expand services anddemonstrate strong commitment to safety and quality, recognizing allcontributions.• Reduce operating costs through sustainable programs and campaigns insupport of the agency goal of being an environmental leader.• Timely completion of preventive and repair maintenance tasks.OP-37
BUD1 Personnel Services OPERATIONS - FACILITIES MANAGEMENT10/11 11/12 12/13 12/1313/14Actual Actual ----------<strong>Budget</strong>---------- Est ---------<strong>Budget</strong>----------Position Title Total Total Base Pos Total Total Base Pos TotalFacilities Management:Director, Facilities Management $ 103,437 $ 107,907 $ 108,325 1.00 $ 108,325 $ 113,733 $ 113,733 1.00 $ 113,733Manager, Facilities Services 91,365 91,365 91,726 1.00 91,726 93,522 85,316 1.00 85,316Manager, Facilities Systems 59,173 90,500 91,726 1.00 91,726 93,522 93,083 1.00 93,083Supervisor, Facilities Management 70,712 70,712 71,000 1.00 71,000 72,391 73,331 1.00 73,331Supervisor, Maint Facilities Management 170,137 145,340 71,000 2.00 142,000 144,782 73,331 2.00 146,662Facilities Specialist 22,923 44,389 43,848 1.00 43,848 47,189 47,189 1.00 47,189Facilities Projects Coordinator 70,000 1.00 70,000Operations Administrator/Coordinator 49,358 49,363 49,548 1.00 49,548 52,179 52,179 1.00 52,179Engineer I 57,636 57,636 57,858 1.00 57,858 59,800 59,800 1.00 59,800Assistant Supervisor 178,603 178,011 66,311 2.00 132,621 132,621 66,311 2.00 132,621Maintenance Technician 249,399 255,513 56,952 5.00 284,761 284,761 56,952 5.00 284,761Janitor 72,737 65,890 55,716 1.00 55,716 55,716Landscaper 116,013 120,593 56,952 2.00 113,905 113,905 56,952 2.00 113,905Landscape Maintenance Technician 116,013 120,593 56,952 2.00 113,905 113,905 56,952 2.00 113,905Plant Maintenance Mechanic 667,291 759,188 57,668 10.00 576,685 576,685 57,668 10.00 576,685Plant Maintenance Mechanic Apprentices 57,668 2.00 115,337 115,337 57,668 2.00 115,337Fringe Benefits 913,753 984,114 932,273 935,636 971,590Capitalized Fringe/Labor (99,185)Workers' Compensation (377) 16,674 16,587 16,587 7,397Longevity Premium 51,417 51,417 57,002OP-38
BUD1 Personnel Services OPERATIONS - FACILITIES MANAGEMENT10/11 11/12 12/13 12/1313/14Actual Actual ----------<strong>Budget</strong>---------- Est ---------<strong>Budget</strong>----------Position Title Total Total Base Pos Total Total Base Pos TotalFacilities Management-Rail:Supervisor, Maint Facilities Management $ 145,518 $ 146,822 $ 73,038 2.00 $ 146,076 149,480 $ 73,331 2.00 $ 146,662Assistant Supervisor - MOW 143,204 143,474 66,311 2.00 132,621 132,621 66,311 2.00 132,621Facilities Maintenance Trainer 67,752 68,692 66,311 1.00 66,311 66,311 66,311 1.00 66,311Plant Maintenance Mechanic 539,749 607,669 57,668 10.00 576,685 576,685 57,668 10.00 576,685Facilities Landscaper 251,367 269,671 56,952 4.00 227,809 227,809 56,952 4.00 227,809Facilities Plat<strong>for</strong>m Cleaner 1,338,945 1,354,584 53,253 25.00 1,331,331 1,331,331 53,253 7.00 372,773Facilities Plat<strong>for</strong>m Cleaner 53,253 18.00 958,558Plant Maintenance Mechanic Apprentices 85,701 132,463 55,852 5.00 279,260 279,260 55,852 5.00 279,260Fringe Benefits 1,297,460 1,439,922 1,389,791 1,390,395 1,455,356Workers' Compensation (11,152) 165,258 55,760 55,760 100,776Longevity Premium 87,926 87,926 99,519Unemployment 6,260 6,260 6,260Unscheduled Overtime 125,986 114,740 122,810 122,810 122,810Limited Term Employment 13,636 13,636Union Insured Premium Repayment 36,976 36,976PM Apprenticeships - OTO 57,590Sick & Vacation Payoff 33,982 33,982 34,848Capitalized Labor/Fringe (36,120) (2.00) (183,374) (183,374) (2.00) (178,282)Total $ 6,922,704 $ 7,465,78080.00 $ 7,373,098 $ 7,401,55580.00 $ 7,574,052OP-39
BUD2 Materials & Services OPERATIONS - FACILITIES MANAGEMENTActual Actual <strong>Budget</strong> Estimate <strong>Budget</strong> % Change % ofExpense Category 10/11 11/12 12/13 12/13 13/14 FY13-<strong>FY14</strong> M & S TotalFacilities Management:Professional and Technical $ 14,404 $ 16,142$ 3,000Mechanical/Structural Consulting 510 890Landscape Services 41,841 32,392 $ 42,024 40,000 $ 43,100 2.56% 0.60%Portland Mall Management Services 1,628,634 1,751,090 1,540,142 1,550,000 1,564,912 1.61% 21.89%Contracted Maintenance 258,962 194,353 269,435 265,000 270,000 0.21% 3.78%Office Sup., Maintenance - Custodial 339,838 347,334 400,520 400,000 400,500 0.00% 5.60%Shelter Cleaning 894,054 858,685 849,600 857,000 850,000 0.05% 11.89%Shelter Cleaning-Vandalism 30,374 53,469 52,530 50,000 54,000 2.80% 0.76%Transit Center Cleaning 184,570 192,856 220,630 200,000 220,600 -0.01% 3.09%Transit Mall Cleaning 32,244 0.00%Office Maintenance - Other 7,338 7,584 2,230 8,000 7,800 249.78% 0.11%Laundry 12,355 12,354 16,680 15,000 17,000 1.92% 0.24%Other Services 6,462 9,742 3,880 8,000 9,000 131.96% 0.13%Office Supplies 3,846 3,418 2,640 3,500 4,000 51.52% 0.06%Maintenance Materials 174,129 143,035 157,600 155,000 162,000 2.79% 2.27%Bus Stop Signs/Poles 3,613 4,289 3,150 4,000 3,219 2.19% 0.05%Cleaning Supplies 3,541 5,278 21,010 12,000 12,000 -42.88% 0.17%Small Hand Tools 16,146 14,160 18,900 16,000 19,500 3.17% 0.27%Other Materials 6,549 3,066 8,400 7,200 8,600 2.38% 0.12%Landscape Maintenance Materials 5,097 8,137 18,900 12,000 19,000 0.53% 0.27%Transit Mall Materials 11,548 14,894 18,000 16,000 18,400 2.22% 0.26%Moving Services 21,067 20,315 18,000 20,000 18,500 2.78% 0.26%Utilities - Electricity 818,901 851,671 766,556 852,000 795,608 3.79% 11.13%Utilities - Natural Gas 177,834 153,601 154,814 154,000 160,681 3.79% 2.25%Utilities - Water/Sewer 322,088 318,831 361,989 360,000 375,708 3.79% 5.26%Shelter Electrification 27,902 25,365 33,440 33,000 34,707 3.79% 0.49%Telephone 27,309 27,319 17,794 24,000 24,000 34.88% 0.34%OP-40
BUD2 Materials & Services OPERATIONS - FACILITIES MANAGEMENTActual Actual <strong>Budget</strong> Estimate <strong>Budget</strong> % Change % ofExpense Category 10/11 11/12 12/13 12/13 13/14 FY13-<strong>FY14</strong> M & S TotalFacilities Management:Utilities - Other $ 112,805 $ 114,177 $ 72,671 $ 96,000 $ 105,564 45.26% 1.48%Property Taxes 1,736 1 0.00%Dues & Subscriptions 1,756 255 0.00%Local Travel/Meetings 130 456 0.00%Education & Training 2,738 3,971 0.00%Out-of-Town Travel 1,126 2,963 0.00%Apprenticeship Training 16,058 30,547 22,199 26,000 30,000 35.14% 0.42%Indirect Expense Allocation (54,667) (54,924) (59,347) (59,347) (60,949) 2.70% -0.85%Leases 1,024,712 2,721 0.00%Maint Materials Snow & Ice - Bus 5,393 2,764 3,000 3,000 3,200 6.67% 0.04%Education & Training - Bus 3,600 3,600 3,600 0.00% 0.05%Rentals 4,214 340 6,300 4,000 6,500 3.17% 0.09%Sub-Total Facilities Management: 6,187,155 5,173,541 5,047,287 5,137,953 5,180,752Facilities Management-Rail:Professional & Technical 2,784 800 0.00%Contracted Maintenance - Landscaping 34,175 40,055 62,000 60,000 62,000 0.00% 0.87%Contracted Maintenance - Fac. & Equipment 118,410 81,539 80,000 108,000 32.45% 1.51%Contracted Maintenance - Elevators 120,514 125,468 132,000 132,000 132,000 0.00% 1.85%Contracted Maintenance - Stations 11,700 5,850 12,600 12,000 13,000 3.17% 0.18%Street Sweeper Dump Fees 123,891 3,000 3,000 3,000 0.00% 0.04%Hillsboro Garage IGA 30,000 31,000 30,000 30,000 -3.23% 0.42%Other Services 30,000 3,819 5,200 5,000 5,340 2.69% 0.07%Office Supplies 6,973 2,852 1,300 2,400 3,000 130.77% 0.04%Maintenance Materials - Outside Plant 112,171 111,848 86,000 100,000 88,000 2.33% 1.23%Maintenance Materials - Shop 57,374 31,285 52,530 50,000 53,000 0.89% 0.74%Shop Equipment < $5,000 2,369 916 8,000 5,000 5,000 -37.50% 0.07%Cleaning Supplies - Plat<strong>for</strong>ms 50,313 55,142 65,149 65,000 65,000 -0.23% 0.91%Small Hand Tools 5,484 5,280 5,000 5,000 5,100 2.00% 0.07%Other Materials 5,487 3,028 4,202 4,200 4,300 2.33% 0.06%Maintenance Materials - Landscaping 16,447 12,757 31,518 20,000 20,000 -36.54% 0.28%OP-41
BUD2 Materials & Services OPERATIONS - FACILITIES MANAGEMENTActual Actual <strong>Budget</strong> Estimate <strong>Budget</strong> % Change % ofExpense Category 10/11 11/12 12/13 12/13 13/14 FY13-<strong>FY14</strong> M & S TotalFacilities Management:Safety Supplies $ 9,281 $ 10,706 $ 6,304$ 6,500 3.11% 0.09%Obsolete Inventory 52 $ 14,000Utilities - Natural Gas 125,280 114,049 119,586 118,000 124,118 3.79% 1.74%Utilities - Building Electricity 1,003,606 1,023,904 876,992 1,024,000 910,230 3.79% 12.73%VT Utilities - Electricity 12,581 12,827 11,532 12,500 11,969 3.79% 0.17%Utilities - Other Building 84,439 86,393 52,500 86,000 54,489 3.79% 0.76%Utilities - Parking Garages 29,876 30,531 27,349 30,500 28,386 3.79% 0.40%Tunnel Water Services 53,728 49,285 28,986 49,000 30,084 3.79% 0.42%Utilities - Other Water 267,438 269,567 180,988 270,000 187,847 3.79% 2.63%Education & Training 1,720 0.00%Employee Recognition 623 1,400 0.00%Maint Materials Snow & Ice - Rail 4,231 5,000 5,000 5,000 0.00% 0.07%Education & Training - Rail 3,000 2,400 3,000 0.00% 0.04%Rentals 4,647 3,501 9,455 10,000 10,000 5.76% 0.14%Sub-Total Facilities Management-Rail: 2,172,276 2,152,376 1,902,730 2,197,200 1,968,363$ 8,359,431 $ 7,325,917 $ 6,950,017 $ 7,335,153 $ 7,149,115 2.86% 100.00%OP-42
Department Summary OPERATIONS - RAIL TRANSPORTATIONActual <strong>Budget</strong> Estimate <strong>Budget</strong> % Change % of10/11 11/12 12/13 12/13 13/14 FY13- <strong>FY14</strong> Dept. TotalPersonnel Services $ 15,240,734 $ 15,793,846 $ 16,161,634 $ 16,566,669 $ 16,579,9522.59% 98.51%Materials & Services 102,391 111,442 245,561 244,880 250,017 1.81% 1.49%Total $ 15,343,125 $ 15,905,289 $ 16,407,195 $ 16,811,549 $ 16,829,9692.58% 100.00%Responsibilities:The Rail Transportation Department includes management and administrativesupport functions <strong>for</strong> rail operators.Activities:• Operation of regularly scheduled light rail service.• Operation of Rose Festival and other special light rail service.• Provision of rail operators to Portland Streetcar.• MAX on-time per<strong>for</strong>mance.• Rail operator attendance/overtime/extraboard.Per<strong>for</strong>mance Measures:• Strive <strong>for</strong>:- Safe, on-time MAX service delivery.- Less than 1.1 MAX safety incidents per 100,000 miles.- Sustain 91.0% rail operator attendance.OP-43
BUD1 Personnel Services OPERATIONS - RAIL TRANSPORTATION10/11 11/12 12/13 12/1313/14Actual Actual ---------<strong>Budget</strong>---------- Est ---------<strong>Budget</strong>----------Position Title Total Total Base Pos Total Total Base Pos TotalManager, Rail Operations $ 96,152 1.00 $ 96,152Assistant Manager, Transportation $ 114,446 $ 70,740 $ 70,992 1.00 $ 70,992 $ 73,143 73,143 1.00 73,143Assistant Manager, Transportation 51,153 70,992 1.00 70,992 73,143 73,143 1.00 73,143Operations Specialist 51,010 1.00 51,010 51,010 52,701 1.00 52,701LRV Operator 8,129,592 8,711,138 57,829 154.00 8,905,704 8,905,704 57,829 154.00 8,905,704Fringe Benefits 4,520,686 4,576,784 4,656,760 4,657,493 4,921,600Workers' Compensation 252,998 244,380 312,917 312,917 418,867Union Insured Premium Repayment 82,526 82,526Longevity Premium 72,984 72,984 79,161Road Relief Pay 114,814 114,814 114,814Night Differential 10,695 10,695 10,695Scheduled Overtime 2,223,012 2,139,651 1,239,049 1,239,049 1,239,049Unscheduled & Report Overtime 701,672 701,672 721,354Incentive 12,802 12,802 12,802Unpaid Absence (170,017) (170,017) (170,017)Settlement 400,000Sick & Vacation/Holiday Payoff 28,734 28,734 30,784Total $ 15,240,734 $ 15,793,846157.00 $ 16,161,634 $ 16,566,669158.00 $ 16,579,952OP-44
BUD2 Materials & Services OPERATIONS - RAIL TRANSPORTATIONActual Actual <strong>Budget</strong> Estimate <strong>Budget</strong> % Change % ofExpense Category 10/11 11/12 12/13 12/13 13/14 FY13-<strong>FY14</strong> M & S TotalUni<strong>for</strong>ms $ 34,144 $ 34,301 $ 31,000 $ 30,000 $ 32,000 3.23% 12.80%Other Services 8,562 3,437 5,000 2,000 3,600 -28.00% 1.44%Office Supplies 4,019 5,115 4,000 3,600 4,000 0.00% 1.60%Other Materials 4,605 7,210 5,000 8,000 7,057 41.14% 2.82%VT Other Materials & Services 5,762 15,000 7,200 15,000 0.00% 6.00%Telephone 3,029 3,241 2,521 2,400 2,600 3.13% 1.04%Self-Insurance BI/PD 46,564 51,067 181,280 190,000 184,000 1.50% 73.59%CDL Renewals 581 644 1,200 1,200 1,200 0.00% 0.48%Employee Recognition 886 666 560 480 560 0.00% 0.22%$ 102,391 $ 111,442 $ 245,561 $ 244,880 $ 250,017 1.81% 100.00%OP-45
Department Summary OPERATIONS - RAIL MAINTENANCE OF WAYActual <strong>Budget</strong> Estimate <strong>Budget</strong> % Change % of10/11 11/12 12/13 12/13 13/14 FY13- <strong>FY14</strong> Dept. TotalPersonnel Services $ 8,318,493 $ 8,963,863 $ 9,125,845 $ 9,148,447 $ 7,699,219 -15.63% 54.89%Materials & Services 5,995,109 6,175,401 6,562,117 6,149,680 6,327,006 -3.58% 45.11%Total $ 14,313,603 $ 15,139,263 $ 15,687,962 $ 15,298,127 $ 14,026,225 -10.59% 100.00%Responsibilities:The Rail Maintenance of Way Department is responsible <strong>for</strong> maintenance ofall “railroad” elements of <strong>TriMet</strong>’s light rail system, including track, tractionelectrification, rail signals and communications, and trackway structuresincluding bridges and tunnels. The department also is responsible <strong>for</strong> employeetraining <strong>for</strong> all of its maintenance operations. Other responsibilities includemaintaining Portland Streetcar overhead electrification and track switches --under a services reimbursement agreement with the City of Portland.Per<strong>for</strong>mance Measures:• Maintain light rail system railway elements in “as new” condition.• Per<strong>for</strong>m not less than 95% of all preventive maintenance on-time.• Per<strong>for</strong>m MOW capital projects on-time and within budget.Activities:• Preventive maintenance.• Corrective maintenance.• Overhaul.• Initial and recurrent training <strong>for</strong> classifications of track maintainer,substation and overhead electrification maintainers, signals maintainer andfield technician.• On-going development of curricula <strong>for</strong> training programs.• Maintenance operations support of Capital Projects Division constructionprojects on light rail system.• On-going productivity improvement through front-line employeeinvolvement.OP-46
BUD1 Personnel Services OPERATIONS - RAIL MAINTENANCE OF WAY10/11 11/12 12/13 12/1313/14Actual Actual ---------<strong>Budget</strong>---------- Est ---------<strong>Budget</strong>----------Position Title Total Total Base Pos Total Total Base Pos TotalManager, Rail MOW Operations $ 92,000 $ 92,000 $ 93,510 1.00 $ 93,510 $ 94,941 $ 94,941 1.00 $ 94,941Training/Engineering Supervisor 135,733 134,405 68,121 2.00 136,242 141,003 70,501 2.00 141,003Maintenance of Way Supervisor 437,088 451,860 76,125 6.00 456,750 449,898 74,966 6.00 449,796MOW Project Engineer 73,143 70,245 73,125 1.00 73,125 74,983 75,084 1.00 75,084MOW Projects Coordinator 70,000 1.00 70,000Assistant Supervisor - MOW 723,657 752,725 73,032 11.00 803,352 803,352 73,032 9.00 657,288Track Maintainer 489,743 510,970 56,353 11.67 657,640 657,640 56,353 13.00 732,589Substation Maintainer/Apprentice 379,384 454,475 63,502 6.00 381,014 381,014 63,502 6.00 381,014Power Maintainer/Apprentice 717,173 752,860 63,502 15.00 952,535 952,535 63,502 15.00 952,535Signal Maintainer/Apprentice 631,679 773,046 62,617 13.00 814,021 814,021 62,617 15.00 939,255Maintenance of Way Laborer 338,480 478,275 58,621 6.00 351,724 351,724 58,621 6.00 351,724Field Technician/Apprentice 1,265,030 1,310,242 63,500 21.00 1,333,505 1,333,505 63,500 6.00 381,002MMIS/Clerk 104,211 106,171 54,873 2.00 109,745 109,745 54,873 2.00 109,745Fringe Benefits 2,529,795 2,666,682 2,782,631 2,804,035 2,542,145Workers' Compensation 119,392 142,327 242,444 242,444 165,130Longevity Premium 197,255 197,255 160,768Night & Shift Differential 61,953 61,953 52,490Unscheduled Overtime 333,703 267,579 255,299 255,299 204,639Tool Allowance 26,543 26,543 26,543Unemployment 11,282 11,282 11,726Union Insured Premium Repayment 42,335 42,33510 MOW Apprenticeships - OTO 277,945Sick & Vacation/Holiday Payoff 27,488 27,488 12,112Capitalized Labor/Fringe (51,719) (6.67) (684,549) (684,549) (11.00) (1,104,687)Total $ 8,318,493 $ 8,963,86389.00 $ 9,125,845 $ 9,148,44772.00 $ 7,699,219OP-47
BUD2 Materials & Services OPERATIONS - RAIL MAINTENANCE OF WAYActual Actual <strong>Budget</strong> Estimate <strong>Budget</strong> % Change % ofExpense Category 10/11 11/12 12/13 12/13 13/14 FY13-<strong>FY14</strong> M & S TotalContracted Maintenance - Landscaping $ 18,782 $ 15,167 $ 13,000 $ 12,000 $ 13,000 0.00% 0.21%Contracted Maintenance - Power Facility 4,000 3,600 4,000 0.00% 0.06%Contracted Maintenance - Signals 25,895 11,140 64,000 60,000 66,000 3.13% 1.04%Contracted Maintenance - Track 98,021 100,915 154,500 140,000 160,000 3.56% 2.53%Contracted Maintenance - OCS 27,500 24,000 0.38%Contracted Maintenance - Bridges 37,041 116,819 45,000 44,000 46,000 2.22% 0.73%Contracted Maintenance - Communications 453,102 431,572 26,556 24,000 26,000 -2.09% 0.41%Contracted Maintenance - Fare Equipment 39,579 9,045 162,000 225,000 -100.00% 0.00%Contracted Maintenance - Substation 23,501 56,500 48,000 56,000 -0.88% 0.89%Calibration & Tool Repair 24,405 27,049 10,000 12,500 12,000 20.00% 0.19%Other Services 5,599 1,579 5,000 2,500 4,800 -4.00% 0.08%Office Supplies 4,503 4,844 3,400 4,800 4,000 17.65% 0.06%Freight 11,298 7,356 4,000 0.00%Maintenance Materials - Outside Plant 40 89 0.00%Maintenance Materials - Shop 30 400 0.00%Small Hand Tools 9,731 11,583 8,000 9,200 6,733 -15.84% 0.11%Other Materials 19,647 21,359 16,000 20,000 18,000 12.50% 0.28%Safety Supplies 24,091 29,568 18,000 24,000 15,230 -15.39% 0.24%Maintenance Materials - Fare Equipment 256,606 205,348 290,000 200,000 -100.00% 0.00%Maintenance Materials - Track 98,462 126,589 136,000 130,000 136,000 0.00% 2.15%Maintenance Materials - Signals 183,586 106,749 132,000 132,000 136,000 3.03% 2.15%Maintenance Materials - Communications 43,963 40,519 48,000 46,000 48,000 0.00% 0.76%Maintenance Materials - OCS 45,515 31,959 36,000 36,000 37,000 2.78% 0.58%Maintenance Materials - Substations 20,262 34,237 22,000 20,000 22,000 0.00% 0.35%Electrical Power (Propulsion) 4,075,996 4,299,183 4,854,626 4,500,000 5,039,384 3.81% 79.65%Telephone 78,626 77,455 69,347 60,000 70,000 0.94% 1.11%PI/PD Expense 88,302 (9,896) 0.00%Dues & Subscriptions 197 200 200 180 200 0.00% 0.00%OP-48
BUD2 Materials & Services OPERATIONS - RAIL MAINTENANCE OF WAYActual Actual <strong>Budget</strong> Estimate <strong>Budget</strong> % Change % ofExpense Category 10/11 11/12 12/13 12/13 13/14 FY13-<strong>FY14</strong> M & S TotalLocal Travel & Meetings $ 10 $ 62 $ 100 $ 6,000 $ 1,000 900.00% 0.02%Education & Training 5,971 16,544 12,188 16,000 11,627 -4.60% 0.18%Out-of-Town Travel 2,756 13,457 4,500 6,000 4,800 6.67% 0.08%Steel Bridge Maintenance Agreement 278,320 299,740 330,000 330,000 330,000 0.00% 5.22%CDL Renewals 247 677 400 600 385 -3.75% 0.01%Employee Recognition 1,297 220 800 800 800 0.00% 0.01%Rentals 30,000 24,000 24,047 -19.84% 0.38%OCC Equipment & Supplies 1,101 0.00%Computer Supplies 2,250 64,618 0.00%Contracted Maintenance - Fac. & Equipment 8,045 0.00%Obsolete Inventory 13,479 47,007 100 0.00%Hillsboro Maintenance Agreement 10,000 8,000 10,000 0.00% 0.16%$ 5,995,109 $ 6,175,401 $ 6,562,117 $ 6,149,680 $ 6,327,006 -3.58% 100.00%OP-49
Department Summary OPERATIONS - RAIL EQUIPMENT MAINTENANCEActual <strong>Budget</strong> Estimate <strong>Budget</strong> % Change % of10/11 11/12 12/13 12/13 13/14 FY13- <strong>FY14</strong> Dept. TotalPersonnel Services $ 14,120,183 $ 15,619,872 $ 16,387,381 $ 16,405,357 $ 17,196,7794.94% 69.19%Materials & Services 3,811,398 5,301,437 3,996,944 4,792,600 7,657,815 91.59% 30.81%Total $ 17,931,582 $ 20,921,310 $ 20,384,325 $ 21,197,957 $ 24,854,59421.93% 100.00%Responsibilities:The Rail Equipment Maintenance Department is responsible <strong>for</strong> maintenanceof <strong>TriMet</strong>’s light rail vehicles (LRVs), including employee training, andprovides vehicle maintenance technicians to Portland Streetcar.Per<strong>for</strong>mance Measures:• Maintain light rail vehicles in effectively “as new” condition.• Per<strong>for</strong>m not less than 95% of all preventive maintenance on time.Activities:• Preventive maintenance.• Corrective maintenance.• Overhaul.• LRV modifications <strong>for</strong> improvements in reliability/maintainability.• Cleaning of MAX vehicles and shop facilities.• Initial and recurrent training <strong>for</strong> classifications of LRV maintenancetechnicians and rail-specific training <strong>for</strong> LRV cleaners.• On-going development of curricula <strong>for</strong> training programs.• Receive and commission additional LRVs to be delivered <strong>for</strong> future MAXservice increases.• On-going productivity improvement through front-line employeeinvolvement.OP-50
BUD1 Personnel Services OPERATIONS - RAIL EQUIPMENT MAINTENANCE10/11 11/12 12/13 12/1313/14Actual Actual ---------<strong>Budget</strong>---------- Est ---------<strong>Budget</strong>----------Position Title Total Total Base Pos Total Total Base Pos TotalManager, Rail Equip. Maintenance $ 87,681 $ 87,681 $ 88,009 1.00 $ 88,009 $ 93,125 $ 93,125 1.00 $ 93,125Manager, Rail Equip. Maintenance 92,219 92,219 92,582 1.00 92,582 95,171 95,171 1.00 95,171Manager, Warranty Programs 86,219 81,985 82,309 1.00 82,309 84,167 84,167 1.00 84,167Coordinator Operations Services 50,833 50,888 69,175 1.00 69,175 52,701 70,658 1.00 70,658Training/Engineering Supervisor 165,040 145,040 73,221 2.00 146,442 149,932 74,966 3.00 224,898Training/Engineering Supervisor 73,355 73,355 73,221 1.00 73,221 74,966 74,966 1.00 74,966Rail Maintenance Supervisor 511,786 511,786 73,244 7.00 512,708 526,617 74,333 6.00 445,998Rail Maintenance Supervisor 74,333 1.00 74,333Engineering Technician III 55,182 55,182 55,395 1.00 55,395 56,689 56,689 1.00 56,689Assistant Supervisor 450,904 467,857 66,311 6.00 397,864 397,864 66,311 6.00 397,864MMIS/Clerk 93,922 53,924 54,873 1.00 54,873 54,873 54,873 1.00 54,873Janitor 327,697 435,209 46,767 3.00 140,301 140,301 46,767 3.00 140,301Vehicle Cleaner/Helper 974,124 1,070,792 55,844 26.00 1,451,933 1,451,933 55,844 5.00 279,218Vehicle Cleaner/Helper 55,844 21.00 1,172,715Vehicle Maintainer/Apprentice 5,154,977 5,332,579 57,668 109.33 6,304,894 6,304,894 57,668 113.00 6,516,537Vehicle Maint/Apprentice Streetcar 508,706 508,225Stores Supervisor 67,643 67,643 67,902 1.00 67,902 69,718 69,718 1.00 69,718Assistant Storekeeper 129,359 135,094 62,834 2.00 125,668 125,668 62,834 2.00 125,668Junior Partsman 91,548Partsman 177,209 173,095 59,859 2.00 119,718 119,718 59,859 2.00 119,718Vehicle Cleaner/Helper 440,964 55,844 6.00 335,061 335,061 55,844 6.00 335,061Vehicle Maintainer/Apprentice 57,668 12.00 692,022 692,022 57,668 13.67 788,328Vehicle Cleaner/Helper OTO 55,844 (1.00) (55,844) (55,844)Vehicle Maintainer/Apprentice OTO 57,668 (7.00) (403,679) (403,679)Fringe Benefits 4,608,310 4,900,364 5,085,299 5,087,931 5,737,475Workers' Compensation 90,062 264,400 586,417 586,417 335,669Longevity Premium 323,905 323,905 306,576Unscheduled Overtime 324,134 671,590 540,800 540,800 592,221Tool Allowance 67,515 67,515 74,613Night & Shift Differential 102,580 102,580 111,184Unemployment 9,388 9,388 9,877Union Insured Premium Repayment 80,919 80,919Sick & Vacation/Holiday Payoff 28,597 28,597 33,289Capitalized Labor/Fringe (728) (8.33) (788,591) (788,591) (13.00) (1,224,131)Total $ 14,120,183 $ 15,619,872167.00 $ 16,387,381 $ 16,405,357176.67 $ 17,196,779OP-51
BUD2 Materials & Services OPERATIONS - RAIL EQUIPMENT MAINTENANCEActual Actual <strong>Budget</strong> Estimate <strong>Budget</strong> % Change % ofExpense Category 10/11 11/12 12/13 12/13 13/14 FY13-<strong>FY14</strong> M & S TotalProfessional & Technical $ 62,971Calibration & Tool Repair $ 6,67720,909 $ 5,600 $ 5,000 $ 12,000 114.29% 0.16%Contracted Maintenance 350 16,000 3,000 16,000 0.00% 0.21%Laundry 65,706 68,596 96,050 72,000 82,501 -14.11% 1.08%Other Services 14,318 2,803 20,000 12,000 16,000 -20.00% 0.21%Graphics Supplies 676 466 1,000 400 600 -40.00% 0.01%Office Supplies 7,270 8,452 7,000 9,000 9,000 28.57% 0.12%Computer Supplies 5,298 2,753 1,500 3,600 2,400 60.00% 0.03%Maint. Materials - LRV Overhaul 1,289,127 2,386,632 1,200,000 2,400,000 5,209,500 334.13% 68.03%VT Maintenance Materials - Trolley 679 2,000 800 800 -60.00% 0.01%Repair Materials - LRV Accident 18,000 124,000 24,000 33.33% 0.31%Repair Materials - Rev Equipment 2,909 22,502 0.00%Repair Materials - LRV Vandalism 69,913 69,305 46,000 94,000 72,000 56.52% 0.94%Maint. Materials - Service Equip. 6,325 7,319 7,000 0.00%Maint. Materials - LRVs 1,810,810 2,064,268 2,209,124 1,600,000 1,800,338 -18.50% 23.51%Freight 90,496 69,588 72,000 70,000 72,000 0.00% 0.94%Furniture & Equipment
Department Summary OPERATIONS - COMMUTER RAILActual <strong>Budget</strong> Estimate <strong>Budget</strong> % Change % of10/11 11/12 12/13 12/13 13/14 FY13- <strong>FY14</strong> Dept. TotalPersonnel Services $ 1,266,778 $ 1,370,512 $ 1,410,218 $ 1,416,156 $ 1,429,8071.39% 21.79%Materials & Services 4,608,160 4,707,586 5,014,088 4,999,760 5,130,589 2.32% 78.21%Total $ 5,874,938 $ 6,078,098 $ 6,424,306 $ 6,415,916 $ 6,560,3962.12% 100.00%Responsibility:The Commuter Rail Department is responsible <strong>for</strong> safe, reliable, on-timeoperation of the Westside Express Service (WES) Commuter Rail service, withclean and well-maintained rail vehicles, stations and park and ride facilities.WES operates as part of the general railroad system of transportation, and assuch, is governed by regulations of the Federal Railroad Administration (FRA).The Portland and Western Railroad (P&W) is the owner/operator of commoncarrier railroad rights along the WES line. Under a Shared-Use Agreementbetween <strong>TriMet</strong> and P&W, WES trains operate as part of P&W railroadoperations. WES functions per<strong>for</strong>med by P&W are: training of engineers andconductors, train dispatching and maintenance of way (track, signals and gradecrossings). WES functions per<strong>for</strong>med by <strong>TriMet</strong> are: overall operationsmanagement, maintenance and cleaning of vehicles, stations and park/rides,fare system and customer service in<strong>for</strong>mation.Per<strong>for</strong>mance Measure:• 98% or better on-time per<strong>for</strong>mance.• Train miles between train collisions - exceeding commuter rail industrystandards.• Train miles between passenger safety incidents - exceeding Commuter Railindustry standards.• 100% compliance with FRA-required inspections and maintenance<strong>for</strong> commuter rail vehicles, signals and grade crossing systems.OP-53
BUD1 Personnel Services OPERATIONS - COMMUTER RAIL10/11 11/12 12/13 12/1313/14Actual Actual ---------<strong>Budget</strong>---------- Est ---------<strong>Budget</strong>----------Position Title Total Total Base Pos Total Total Base Pos TotalCommuter Rail:Director, Commuter Rail $ 152,016 $ 152,016 $ 152,591 1.00 $ 152,591 $ 155,660 $ 155,660 1.00 $ 155,660Operations Manager 86,438 86,438 86,777 1.00 86,777 88,949 88,949 1.00 88,949Commuter Rail Maint Asst Supv 212,846 226,510 66,311 3.00 198,932 198,932 66,311 3.00 198,932Commuter Rail Maint Technician 345,147 365,884 57,668 6.00 346,011 346,011 57,668 6.00 346,011Facilities Management-Rail:Maintenance of Way Cleaner 105,759 105,906 55,844 2.00 111,687 111,687 55,844 2.00 111,687Fringe Benefits 380,354 386,009 392,607 393,304 410,939Workers' Compensation 146 1,235 1,235 181Longevity Premium 33,617 33,617 36,436Unscheduled Overtime 117,906 47,603 64,288 64,288 64,288Tool Allowance 9,285 9,285 9,285Night & Shift Differential 5,319 5,319 5,319Union Insured Premium Repayment 5,895 5,895Sick & Vacation/Holiday Payoff 1,974 1,974 2,121Capitalized Labor/Fringe (133,688)Total $ 1,266,778 $ 1,370,51213.00 $ 1,410,218 $ 1,416,15613.00 $ 1,429,807OP-54
BUD2 Materials & Services OPERATIONS - COMMUTER RAILActual Actual <strong>Budget</strong> Estimate <strong>Budget</strong> % Change % ofExpense Category 10/11 11/12 12/13 12/13 13/14 FY13-<strong>FY14</strong> M & S TotalAdministration-CR:Professional & Technical $ 38,940 $ 8,651$ 8000.00%Office Supplies 1,179 1,796 $ 1,2001,600 $ 1,40016.67% 0.03%Unreconciled Mastercard Expense 170 240 0.00%Local Travel & Meetings 530 1,043 500 900 600 20.00% 0.01%Inventory Adjustments (5,079) 258 500 0.00%Invoice Price Variance (488) (58) 0.00%Fines and Penalties 165 0.00%Telephone & Comm. Services 56,394 55,796 68,924 56,000 66,000 -4.24% 1.29%Sub-Total Administration: 91,641 67,656 70,624 60,040 68,000Vehicle Maintenance-CR:Calibration & Tool Repair 466 152 500 600 500 0.00% 0.01%Contracted Maintenance 11,677 19,616 10,000 70,000 12,000 20.00% 0.23%Laundry 4,216 4,481 5,000 4,800 5,000 0.00% 0.10%Other Services 10,476 4,374 4,000 4,600 4,500 12.50% 0.09%Diesel Fuel - Commuter Trains 287,354 386,065 431,100 400,000 431,100 0.00% 8.40%Maintenance Materials 114,541 174,944 150,000 170,000 170,000 13.33% 3.31%Shop Equipment 12,084 17,269 8,000 8,000 8,000 0.00% 0.16%Cleaning Supplies 3,682 5,458 5,000 5,200 5,200 4.00% 0.10%Small Hand Tools 12,183 312 2,000 2,000 2,000 0.00% 0.04%Other Materials 10,534 6,218 8,000 9,000 8,400 5.00% 0.16%Maintenance Materials - Landscape 2,778Safety Supplies 2,279 1,958 2,000 1,500 2,000 0.00% 0.04%Freight 4,206 10,547 5,000 16,000 7,200 44.00% 0.14%Sub-Total Vehicle Maintenance: 473,698 634,172 630,600 691,700 655,900OP-55
BUD2 Materials & Services OPERATIONS - COMMUTER RAILActual Actual <strong>Budget</strong> Estimate <strong>Budget</strong> % Change % ofExpense Category 10/11 11/12 12/13 12/13 13/14 FY13-<strong>FY14</strong> M & S TotalRailroad Services:Train Crew Uni<strong>for</strong>ms $ 1,438 $ 1,522 $ 1,200 $ 600 $ 1,2000.00% 0.02%Railroad Protective Insurance 1,383,312 1,378,057 1,364,124 1,379,520 1,380,000 1.16% 26.90%Self-Insurance BI/PD 113,300 40,000 115,000 1.50% 2.24%Train Operations 1,954,068 1,993,648 1,807,835 1,810,000 1,860,000 2.89% 36.25%Maintenance of Way 335,628 246,890 602,514 600,000 615,000 2.07% 11.99%On-Time Per<strong>for</strong>mance Incentive 265,471 268,412 277,358 276,000 285,000 2.76% 5.55%Sub-Total Railroad Services: 3,939,917 3,888,529 4,166,331 4,106,120 4,256,200Facilities Maintenance-CR:Facilities Maint. Agreements - WES 19,762 24,030 39,923 40,000 41,689 4.42% 0.81%Maintenance Materials 6,697 13,423 13,260 13,600 13,600 2.56% 0.27%Maintenance Materials - Snow & Ice 926 800 900 -2.81% 0.02%Landscape Materials 2,049 45 3,000 2,200 3,000 0.00% 0.06%Landscape Services 74 3,496 4,000 3,800 4,000 0.00% 0.08%Contracted Maint - Facilities 3,538 4,465 4,000 4,800 4,200 5.00% 0.08%Waste Disposal Services 3,940 116 3,000 2,400 3,000 0.00% 0.06%Cleaning Supplies-Plat<strong>for</strong>ms 158 472 3,600 1,800 3,600 0.00% 0.07%Utilities - Electricity 41,953 43,227 42,436 42,000 43,600 2.74% 0.85%Utilities - Water/Sewer 6,673 6,951 13,390 12,500 13,700 2.32% 0.27%Utilities - Gas 14,649 17,833 14,878 14,500 15,000 0.82% 0.29%Utilities - Other 3,411 3,170 4,120 3,500 4,200 1.94% 0.08%Sub-Total Facilities Maintenance: 102,904 117,228 146,533 141,900 150,489$ 4,608,160 $ 4,707,586 $ 5,014,088 $ 4,999,760 $ 5,130,5892.32% 100.00%OP-56
Department Summary OPERATIONS - STREETCARActual <strong>Budget</strong> Estimate <strong>Budget</strong> % Change % of10/11 11/12 12/13 12/13 13/14 FY13- <strong>FY14</strong> Dept. TotalPersonnel Services $ 3,109,064 $ 3,282,098 $ 5,570,213 $ 5,570,213 $ 5,576,0870.11% 57.56%Materials & Services 2,690,504 2,889,494 3,752,883 3,752,883 4,111,941 9.57% 42.44%Total $ 5,799,568 $ 6,171,592 $ 9,323,096 $ 9,323,096 $ 9,688,0283.91% 100.00%Responsibility:• The Streetcar Department is a City of Portland and <strong>TriMet</strong> partnershipactivity. It consists of job classifications defined by Portland Streetcar,filled by <strong>TriMet</strong> rail transportation and rail maintenance personnel whoper<strong>for</strong>m these jobs in operating the Portland Streetcar under supervision ofPortland Streetcar management. These personnel remain <strong>TriMet</strong>employees, are paid and receive benefits from <strong>TriMet</strong> in the same manneras if their work was regular <strong>TriMet</strong> operations.Per<strong>for</strong>mance Measures:• Operation and supervision of Streetcar vehicles in revenue service (underCity management).• Maintenance of Streetcar vehicles (under City management).• Separately, <strong>TriMet</strong> funds approximately 50% of the annual operating cost<strong>for</strong> Portland Streetcar. This expense is budgeted as a materials & servicesitem.• The <strong>TriMet</strong> funding and personnel support described above are peragreements between <strong>TriMet</strong> and the City of Portland, and between <strong>TriMet</strong>and the Amalgamated Transit Union (ATU).OP-57
BUD1 Personnel Services OPERATIONS - STREETCAR10/11 11/12 12/13 12/1313/14Actual Actual ---------<strong>Budget</strong>---------- Est ---------<strong>Budget</strong>----------Position Title Total Total Base Pos Total Total Base Pos TotalSuperintendent, Rail Transportation $ 298,763 $ 303,231 $ 84,077 3.00 $ 252,232 $ 252,232 $ 84,077 3.00 $ 252,232Streetcar Vehicle Operator 1,299,140 1,344,805 57,829 41.00 2,370,999 2,370,999 57,829 41.00 2,370,999Streetcar Signals Maintainer 51,819 60,529 1.00 60,529 60,529 60,529 1.00 60,529Streetcar Track Maintainer 78,525 60,529 1.00 60,529 60,529 60,529 1.00 60,529Streetcar Maintenance Technician 196,590 143,215 57,668 10.00 576,685 576,685 57,668 10.00 576,685Fringe Benefits 924,334 975,085 1,644,878 1,644,878 1,727,050Workers' Compensation 99,909 70,007 181,569 181,569 142,478Sick & Vacation/Holiday Payoff 10,051 10,051 10,796Union Insured Premium Repayment 30,010 30,010Longevity Premium 56,463 56,463 48,520Scheduled Overtime 123,157 123,157 123,157Unscheduled OT - Operators 290,328 315,411 89,264 89,264 89,264Unscheduled OT - Non-Operator 99,352 99,352 99,352Night Differential 7,248 7,248 7,248Tool Allowance 7,247 7,247 7,247Total* $ 3,109,064 $ 3,282,09856.00 $ 5,570,213 $ 5,570,21356.00 $ 5,576,087*These Streetcar operations costs, plus an amount <strong>for</strong> overhead, are reimbursed by the City of Portland. The reimbursement is included in Operating Revenue - Service Contracts.OP-58
BUD2 Materials & Services OPERATIONS - STREETCARActual Actual <strong>Budget</strong> Estimate <strong>Budget</strong> % Change % ofExpense Category 10/11 11/12 12/13 12/13 13/14 FY13-<strong>FY14</strong> M & S TotalStreetcar Partnership Funding $ 2,690,504 $ 2,889,494 $ 3,963,250 $ 3,752,883 $ 4,070,258 2.70% 98.99%Funding Adjusted FY13 <strong>for</strong> Eastside Opening Date (210,367) -100.00% 0.00%OUS Bldg. Service Enhancement 41,683 1.01%Total* $ 2,690,504 $ 2,889,494 $ 3,752,883 $ 3,752,883 $ 4,111,941 9.57% 100.00%*Amount of money <strong>TriMet</strong> provides to the City of Portland to support Streetcar operations.OP-59
BUDGET PROGRESSION SCHEDULE - OPERATIONSActual Actual Adopted Proposed <strong>Approved</strong> Adopted10/11 11/12 12/13 13/14 13/14 13/14Administration & Support$ 3,961,660 $ 4,242,713 $ 4,067,715 Personnel Services $ 4,293,314 $ 4,302,028614,048 967,930 582,743 Materials & Services 694,602 694,602$ 4,575,708 $ 5,210,643 $ 4,650,458 Department Total $ 4,987,916 $ 4,996,630Operating Projects$ 3,028,428 $ 2,250,221 $ 3,268,346 Materials & Services $ 8,241,811 $ 3,744,287$ 3,028,428 $ 2,250,221 $ 3,268,346 Projects Total $ 8,241,811 $ 3,744,287Bus Transportation$ 95,550,543 $ 97,449,948 $ 98,850,681 Personnel Services $ 100,848,649 $ 100,848,6491,227,358 1,154,621 2,066,264 Materials & Services 2,094,720 2,094,720$ 96,777,901 $ 98,604,569 $ 100,916,945 Department Total $ 102,943,369 $ 102,943,369Scheduling$ 1,099,665 $ 1,106,651 $ 1,117,559 Personnel Services $ 1,112,672 $ 1,112,6728,954 7,051 6,829 Materials & Services 7,000 7,000$ 1,108,619 $ 1,113,702 $ 1,124,388 Department Total $ 1,119,672 $ 1,119,672Field Operations$ 11,391,690 $ 12,199,639 $ 13,732,245 Personnel Services $ 14,177,999 $ 14,189,974244,480 311,597 459,900 Materials & Services 475,557 469,626$ 11,636,169 $ 12,511,236 $ 14,192,145 Department Total $ 14,653,556 $ 14,659,600Transportation Planning$ 713,967 $ 561,574 $ 519,980 Personnel Services $ 575,007 $ 589,411562,398 630,220 813,854 Materials & Services 936,030 936,030$ 1,276,364 $ 1,191,794 $ 1,333,834 Department Total $ 1,511,037 $ 1,525,441Accessible Transportation Programs-LIFT$ 1,030,312 $ 985,036 $ 1,145,263 Personnel Services $ 1,171,709 $ 1,183,84829,857,346 30,759,126 31,160,840 Materials & Services 31,342,076 31,342,076$ 30,887,657 $ 31,744,162 $ 32,306,103 Department Total $ 32,513,785 $ 32,525,924OP-60
BUDGET PROGRESSION SCHEDULE - OPERATIONSActual Actual Adopted Proposed <strong>Approved</strong> Adopted10/11 11/12 12/13 13/14 13/14 13/14Accessible Transportation Programs-MTP$ 417,468 $ 405,902 $ 413,418 Personnel Services $ 422,285 $ 422,28515,735,934 16,635,374 16,475,391 Materials & Services 19,365,748 19,365,748$ 16,153,402 $ 17,041,276 $ 16,888,809 Department Total $ 19,788,033 $ 19,788,033Bus Maintenance$ 25,525,319 $ 26,907,402 $ 27,898,249 Personnel Services $ 28,365,380 $ 28,380,74225,365,892 27,521,060 28,906,904 Materials & Services 28,387,680 28,387,680$ 50,891,212 $ 54,428,462 $ 56,805,153 Department Total $ 56,753,060 $ 56,768,422Facilities Management$ 6,922,704 $ 7,465,780 $ 7,373,098 Personnel Services $ 7,552,813 $ 7,574,0528,359,431 7,325,917 6,950,017 Materials & Services 7,149,115 7,149,115$ 15,282,135 $ 14,791,697 $ 14,323,115 Department Total $ 14,701,929 $ 14,723,168Rail Transportation$ 15,240,734 $ 15,793,846 $ 16,161,634 Personnel Services $ 16,578,858 $ 16,579,952102,391 111,442 245,561 Materials & Services 250,017 250,017$ 15,343,125 $ 15,905,289 $ 16,407,195 Department Total $ 16,828,875 $ 16,829,969Rail Maintenance of Way$ 8,318,493 $ 8,963,863 $ 9,125,845 Personnel Services $ 7,687,107 $ 7,699,2195,995,109 6,175,401 6,562,117 Materials & Services 6,327,006 6,327,006$ 14,313,603 $ 15,139,263 $ 15,687,962 Department Total $ 14,014,113 $ 14,026,225Rail Equipment Maintenance$ 14,120,183 $ 15,619,872 $ 16,387,381 Personnel Services $ 17,196,779 $ 17,196,7793,811,398 5,301,437 3,996,944 Materials & Services 7,657,815 7,657,815$ 17,931,582 $ 20,921,310 $ 20,384,325 Department Total $ 24,854,594 $ 24,854,594Commuter Rail$ 1,266,778 $ 1,370,512 $ 1,410,218 Personnel Services $ 1,429,807 $ 1,429,8074,608,160 4,707,586 5,014,088 Materials & Services 5,130,589 5,130,589$ 5,874,938 $ 6,078,098 $ 6,424,306 Department Total $ 6,560,396 $ 6,560,396OP-61
BUDGET PROGRESSION SCHEDULE - OPERATIONSActual Actual Adopted Proposed <strong>Approved</strong> Adopted10/11 11/12 12/13 13/14 13/14 13/14Streetcar$ 3,109,064 $ 3,282,098 $ 5,570,213 Personnel Services $ 5,576,087 $ 5,576,0872,690,504 2,889,494 3,752,883 Materials & Services 4,111,941 4,111,941$ 5,799,568 $ 6,171,592 $ 9,323,096 Department Total $ 9,688,028 $ 9,688,028Division Total$ 188,668,579 $ 196,354,838 $ 203,773,501 Personnel Services $ 206,988,469 $ 207,085,504102,211,831 106,748,477 110,262,680 Materials & Services 122,171,707 117,668,252$ 290,880,411 $ 303,103,315 $ 314,036,182 Total Operations $ 329,160,176 $ 324,753,756OP-62
Division Summary CAPITAL PROJECTSActual <strong>Budget</strong> Estimate <strong>Budget</strong> % Change % of10/11 11/12 12/13 12/13 13/14 FY13 - <strong>FY14</strong> Dept. TotalPersonnel Services $ 2,394,180 $ 2,143,889 $ 1,575,912 $ 1,599,526 $ 3,033,60092.50% 27.10%Materials & Services 7,222,572 6,507,595 14,960,980 11,848,987 8,159,440 -45.46% 72.90%Total $ 9,616,753 $ 8,651,484 $ 16,536,891 $ 13,448,513 $ 11,193,040-32.31% 100.00%PageCapital Projects DivisionDivision Summary …………………………………………………………………CP-1Administration …………………………………………………………………CP-2Operating Projects …………………………………………………………………CP-5Bus Stop Development …………………………………………………………………CP-6Development & Operations Support ……………………………………………CP-9Columbia River Crossing …………………………………………………………………CP-13CP-1
Department Summary CAPITAL PROJECTS - ADMINISTRATIONActual <strong>Budget</strong> Estimate <strong>Budget</strong> % Change % of10/11 11/12 12/13 12/13 13/14 FY13 - <strong>FY14</strong> Dept. TotalPersonnel Services $ 271,615 $ 311,609 $ 313,078 $ 315,758 $ 320,0452.23% 79.88%Materials & Services 81,833 74,265 78,470 78,470 80,589 2.70% 20.12%Total $ 353,448 $ 385,874 $ 391,548 $ 394,228 $ 400,6342.32% 100.00%Responsibility:The Capital Projects Division is responsible to plan, design and construct highvalue transit projects. Work includes bus stops, light rail systems, along withoperations and administration facilities, bus garages and light rail operationsbases. With Public Affairs, the department also plans future and improvementsto existing <strong>TriMet</strong> transit facilities and serves as the district’s landlord to workand implement opportunities <strong>for</strong> transit-supportive developments.Activities:Per<strong>for</strong>mance Measures:• Assure the continued deployment of the bus shelters, signs and amenitiesaccording to plan and schedule.• Implement all aspects of the Full Funding Grant Agreement <strong>for</strong> thePortland-Milwaukie light rail extension.• Per<strong>for</strong>m scheduled maintenance of bus stops and transit stations.• Continue construction on the Portland-Milwaukie light rail extension.• Direct preliminary and final design of capital projects per<strong>for</strong>med by staffand contracted consultants.• Participate in bi-state I-5 partnership transportation planning and finaldesign of the Columbia River Crossing Project.• Manage renovation and construction of <strong>TriMet</strong> facilities.CP-2
BUD1 Personnel Services CAPITAL PROJECTS - ADMINISTRATION10/11 11/12 12/13 12/1313/14Actual Actual ---------<strong>Budget</strong>---------- Est ---------<strong>Budget</strong>----------Position Title Total Total Base Pos Total Total Base Pos TotalExecutive Director $ 180,288 $ 180,288 $ 180,696 1.00 $ 180,696 $ 180,696 $ 180,696 1.00 $ 180,696Manager, Office 62,996 62,996 63,246 1.00 63,246 65,521 65,521 1.00 65,521Fringe Benefits 28,331 68,325 64,972 65,376 69,748Sick & Vacation/Holiday Payoff 4,080 4,080 4,080Workers' Compensation 85 85Total $ 271,615 $ 311,6092.00 $ 313,078 $ 315,7582.00 $ 320,045CP-3
BUD2 Materials & Services CAPITAL PROJECTS - ADMINISTRATIONActual Actual <strong>Budget</strong> Estimate <strong>Budget</strong> % Change % ofExpense Category 10/11 11/12 12/13 12/13 13/14 FY13-<strong>FY14</strong> M & S TotalRail-Volution Conference $ 15,000 $ 15,000 $ 15,000 $ 15,000 $ 15,000 0.00% 18.61%Temporary Help 3,000 3,000 0.00% 3.72%Printing Services 744 1,500 1,200 -20.00% 1.49%Other Services, Genl & Admin 140 2,000 1,200 -40.00% 1.49%Office, Other Supplies 2,716 675 2,500 500 2,500 0.00% 3.10%Other Materials 134 866 8,500 2,500 5,000 -41.18% 6.20%Dues & Subscriptions 886 1,488 1,750 1,000 1,000 -42.86% 1.24%Local Travel & Meetings 1,808 3,678 1,220 500 1,189 -2.54% 1.48%Education & Training 14,959 8,320 7,000 12,970 10,500 50.00% 13.03%Out-of-Town Travel 45,447 44,238 36,000 46,000 40,000 11.11% 49.63%$ 81,833 $ 74,265 $ 78,470 $ 78,470 $ 80,589 2.70% 100.00%CP-4
BUD2 Materials & Services CAPITAL PROJECTS - OPERATING PROJECTSActual Actual <strong>Budget</strong> Estimate <strong>Budget</strong> % Change % ofExpense Category 10/11 11/12 12/13 12/13 13/14 FY13-<strong>FY14</strong> Projects TotalAll Facilities Maintenance Environmental $ 55,069 $ 54,5750.00%Lake Oswego DEIS IGA 1,154,345 512,973 $ 32,2380.00%Eastside MAX Projects $ 1,578,008 252,507 $ 1,325,501 -16.00% 23.24%Mall Shelters Maintenance 5,778 0.00%Bus Transit Centers and Park & Rides Maint 10,362 74,579 0.00%Morrison/Yamhill Intersection Repairs 2,527,289 0.00%Pedestrian Network 35,882 0.00%Eastside Streetcar 43,388 0.00%Columbia River Crossing 1,446 86 914 0.00%Commuter Rail Operations Project 44,658 0.00%Gresham Central Station Access 338,936 0.00%Pedestrian Crossing Improvements 327,789 0.00%Milwaukie Park & Ride 466 0.00%Foster Road Layover Concrete Bus Pads 120,148 0.00%Transit Tracker On I-205 161 0.00%Neighborhood Shelters Replacement 14,409 30,000 20,548 30,000 0.00% 0.53%Neighborhood Shelters Refurbishment 63,000 63,000 100,000 58.73% 1.75%Milwaukie Bus Stop Improvements 101,607 0.00%Station Improvements (Hollywood to Gresham) 2,463,000 43.18%Bus On-Street Related Maintenance 47,365 100,000 135,138 100,000 0.00% 1.75%Moving Together Furniture 734,500 -100.00% 0.00%Willamette Shore Trolley Program 20,000 50,000 158,000 325,000 550.00% 5.70%Park & Ride Signage and Shared Use Support 4,582 11,254 25,000 10,550 25,000 0.00% 0.44%Improvements to Comply with ADA Requirements 310,000 5.44%Lloyd District Transit Hub 2,646 7,257 10,000 10,000 10,000 0.00% 0.18%Bus Stop Development 362,679 6.36%Carryover:Moving Together/New Office Space Expenses 226,330 308,343 652,487 188.29% 11.44%$ 4,758,412 $ 684,058 $ 2,816,838 $ 1,065,817 $ 5,703,667 102.48% 100.00%In FY2012-13, Bus Stop Development costs reflected in Bus Stop Development Department.CP-5
Department Summary CAPITAL PROJECTS - BUS STOP DEVELOPMENTActual <strong>Budget</strong> Estimate <strong>Budget</strong> % Change % of10/11 11/12 12/13 12/13 13/14 FY13 - <strong>FY14</strong> Dept. TotalPersonnel Services $ - $ 395,098 $ 430,441 $ 441,372 $ 736,56671.12% 74.65%Materials & Services $ 845,454 279,543 615,000 717,000 250,183 -59.32% 25.35%Total $ 845,454 $ 674,641 $ 1,045,441 $ 1,158,372 $ 986,749-5.61% 100.00%Responsibility:The Bus Stop Development Department is charged with providing safe, visibleand accessible bus stops along all <strong>TriMet</strong> bus lines.Per<strong>for</strong>mance Measures:• Install 15-20 new bus stop shelters/bus stop signs according to criteria.Activities:• Identify and promote pedestrian access improvements that complementtransit services.CP-6
BUD1 Personnel Services CAPITAL PROJECTS - BUS STOP DEVELOPMENT10/11 11/12 12/13 12/1313/14Actual Actual -----------<strong>Budget</strong>---------- Est ---------<strong>Budget</strong>----------Position Title Total Total Base Pos Total Total Base Pos TotalManager, Capital Projects $ 92,621 $ 96,695 1.00 $ 96,695 $ 100,078 $ 100,078 1.00 $ 100,078Bus Stops Comm Relations Spec. 42,465 45,623 1.00 45,623 47,398 47,398 1.00 47,398Planner III 57,880 60,782 1.00 60,782 63,016 63,016 1.00 63,016Coordinator, Operating Projects 52,802 55,123 1.00 55,123 57,086 63,966 2.00 127,932Engineer II 70,846 1.00 70,846Engineer I 60,329 2.00 120,659Transit Development Technician 39,119 49,569 1.00 49,569 49,569Fringe Benefits 115,761 122,481 124,058 206,638Workers' Compensation 168 168Capitalized Labor/Fringe (5,550)Total $ 395,0985.00 430,441 441,372 8.00 $ 736,566CP-7
BUD2 Materials & Services CAPITAL PROJECTS - BUS STOP DEVELOPMENTActual Actual <strong>Budget</strong> Estimate <strong>Budget</strong> % Change % ofExpense Category 10/11 11/12 12/13 12/13 13/14 FY13-<strong>FY14</strong> Projects TotalShelter Services $ 180,000 $ 181,26672.45%Furniture & Equipment
Department Summary CAPITAL PROJECTS - DEVELOPMENT & OPERATIONS SUPPORTActual <strong>Budget</strong> Estimate <strong>Budget</strong> % Change % of10/11 11/12 12/13 12/13 13/14 FY13- <strong>FY14</strong> Dept. TotalPersonnel Services $ 2,122,565 $ 1,437,182 $ 240,120 $ 240,703 $ 640,576 166.77% 25.11%Materials & Services 1,536,873 5,469,729 10,865,133 9,987,700 1,910,201 -82.42% 74.89%Total $ 3,659,438 $ 6,906,911 $ 11,105,253 $ 10,228,403 $ 2,550,777 -77.03% 100.00%Responsibility:The Development & Operations Support Department provides responsiveand cost-effective planning, design and construction of transit corridordevelopment of service support <strong>for</strong> facilities and related programs. Theseprojects and programs are consistent with the Regional Transportation Plan,<strong>TriMet</strong>’s Transit Investment Plan and the Capital Improvement Program.Activities:Per<strong>for</strong>mance Measures:• Execute work plan <strong>for</strong> Blue Line refurbishment.• Complete remodeling of Center Street administrative facility.• Complete design and begin construction of Maintenance of Way hubfacility.• Continue to develop elements of the Transit Investment Plan.• Prepare capital elements and corridor plans <strong>for</strong> prototype high-capacity busservice in the SE Powell and SW Barbur corridors.• Identify and advance transit-oriented development opportunities alongmajor transit corridors.• Manage renovation of existing transit facilities.*The Development & Operations Support Department moved some staff to Columbia River Crossing Department.CP-9
BUD1 Personnel Services DEVELOPMENT & OPERATIONS SUPPORT10/11 11/12 12/13 12/1313/14Actual Actual -----------<strong>Budget</strong>---------- Est ---------<strong>Budget</strong>----------Position Title Total Total Base Pos Total Total Base Pos TotalDirector, Project Planning $ 120,176Director, Program Design $ 9,385 $ 119,120 1.00 $ 119,120 $ 119,120 $ 106,467 1.00 $ 106,467Director, Community Affairs 109,015 117,517 118,452 1.00 118,452 120,707Manager, Project Development 125,325Manager, Real Property Development 88,634 3,425Manager, Project Development 120,750 120,751 121,208 1.00 121,208 126,011Manager, Civil Construction 118,674Manager, Facilities Development 102,000 8,019Manager, Transit Corridor Planning 79,341 10,584Manager, Capital Projects 3,705Manager, Corridor Design 94,235 4,093CRC Transit Manager 91,728 55,757Manager, Quality Assurance 91,590 3,523Manager, <strong>Budget</strong> 90,072 3,464Manager, Real Property Acquisition 89,942 99,857Manager, Environmental Compliance 89,553 89,553Manager, Project Communications 166,487 6,404Manager, Outreach 80,356 64,963Manager, CADD 79,601 3,062Manager, Public Arts Program 61,217 61,217Manager, Engineering 154,662 5,971Project Control Analyst 70,123 2,697Business Systems Analyst 77,077 2,964Cost Engineer 156,770 6,030Senior Cost Estimator 77,748Administrator, Program Mgmt 428,513 7,760Administrative Assistant 529,144 563,774 56,460 1.00 56,460Insurance Coordinator 77,986 77,986 78,279 1.00 78,279 81,098Safety Specialist 75,298 2,896Engineer V 513,240 164,261Engineer IV 1,427,567 60,205Engineer III 720,168 140,141 79,950 2.00 159,899Engineer I 341,258 55,484 55,342 1.00 55,342 57,462 61,603 3.00 184,809CP-10
BUD1 Personnel Services DEVELOPMENT & OPERATIONS SUPPORT10/11 11/12 12/13 12/1313/14Actual Actual -----------<strong>Budget</strong>---------- Est ---------<strong>Budget</strong>----------Position Title Total Total Base Pos Total Total Base Pos TotalPlanner III $ 166,911 $ 3,888Planner II 185,127 82,303 $ 68,758 1.00 $ 68,758 $ 70,011 $ 70,011 1.00 $ 70,011Planner I 49,379Deputy General Counsel 452,125 221,164 116,907 1.00 116,907 119,350 95,359 1.00 95,359` Paralegal I 41,912Environmental Permit Coordinator 80,373Real Estate Analyst 45,249Real Estate Analyst 69,664 70,700 1.00 70,700 72,600 72,600 1.00 72,600Community Affairs Representative 232,608 62,641Fringe Benefits 2,801,832 744,488 239,137 239,137 271,065Workers' Compensation 1,056 (224) 1,256 1,256 592Overtime 351Capitalized Grant Labor/Fringe (8,452,274) (1,432,526) (5.50) (749,039) (766,049) (3.25) (376,686)Total $ 2,122,565 $ 1,437,1822.50 $ 240,120 $ 240,7036.75 $ 640,576CP-11
BUD2 Materials & Services CAPITAL PROJECTS - DEVELOPMENT & OPERATIONS SUPPORTActual Actual <strong>Budget</strong> Estimate <strong>Budget</strong> % Change % ofExpense Category 10/11 11/12 12/13 12/13 13/14 FY13-<strong>FY14</strong> M & S TotalProfessional & Technical $ 313,837 $ 213,476 $ 201,968 $ 150,000 $ 238,756 18.21% 12.50%Milwaukie Alternatives Analysis 131 0.00%Willamette Trolley 30,774 40,135 30,000 30,000 30,000 0.00% 1.57%SOLV 5,000 -100.00% 0.00%Metro: Unified Work Program 225,000 225,000 0.00%Transit Mall Extension 14,585 8,657 15,000 15,000 0.00% 0.79%Intergovernmental Transfers 3,500,000 8,638,500 8,638,500 -100.00% 0.00%Environmental Consulting 33,963 30,394 0.00%Temporary Help 50,909 33,891 30,500 20,000 5,000 -83.61% 0.26%Contracted Maintenance - Environmental 25,194 25,341 0.00%Shelter Services 226,292 186,008 176,500 -100.00% 0.00%Environmental Services 39,796 30,599 0.00%Printing Services 6,222 930 1,500 1,000 1,000 -33.33% 0.05%Other Services 57,111 67,995 35,000 44,000 22,000 -37.14% 1.15%Waste Disposal Services 208,615 220,500 0.00%Office Supplies 15,972 27,621 25,000 11,000 12,000 -52.00% 0.63%Shelter Materials 50,387 34,309 45,500 -100.00% 0.00%PDC/LTMA Digital Display Cell Comm 6,180 6,000 6,000 -2.91% 0.31%Trash Containers 4,097 4,234 7,000 -100.00% 0.00%Other Materials 5,911 2,351 5,000 6,500 5,000 0.00% 0.26%Environmental Materials 1,094 8,521 0.00%"Green Team" Materials 300 135 0.00%Drafting Supplies 3 1,200 700 1,000 -16.67% 0.05%Telephone 24,153 18,875 13,285 21,000 21,000 58.07% 1.10%Property Taxes 2,982 5,500 5,500 5,700 3.64% 0.30%Dues & Subscriptions 12,323 288 6,000 6,000 6,000 0.00% 0.31%Local Travel & Meetings 7,802 12,169 5,500 22,000 15,000 172.73% 0.79%Bid Advertising 165,183 417 1,000 500 500 -50.00% 0.03%Leases 701,945 1,575,000 1,010,000 1,491,245 -5.32% 78.07%Special Events Expense 16,977 72,955 0.00%Rail Project Expense 35,000 15,000 35,000 0.00% 1.83%Bad Debt Expense 242 0.00%$ 1,536,873 $ 5,469,729 $ 10,865,133 $ 9,987,700 $ 1,910,201 -82.42% 100.00%CP-12
Department Summary CAPITAL PROJECTS - COLUMBIA RIVER CROSSINGActual <strong>Budget</strong> Estimate <strong>Budget</strong> % Change % of10/11 11/12 12/13 12/13 13/14 FY13 - <strong>FY14</strong> Dept. TotalPersonnel Services $ 592,272 $ 601,693 $ 1,336,413 125.64% 86.15%Materials & Services 585,539 - 214,800 -63.32% 13.85%Total $ 1,177,811 $ 601,693 $ 1,551,21331.70% 100.00%Responsibility:The Columbia River Crossing Department works with bi-state partners tosecure permits, design and construct the bridge and related transit facilities overthe Columbia River.Per<strong>for</strong>mance Measures:• Submit application to the Federal Transit Administration (FTA) <strong>for</strong> aFFGA.• Complete application to the FTA <strong>for</strong> a FFGA with the WashingtonDepartment of Transportation or federal regulations.Activities:• Provide staff to assist in key project development tasks.• Provide management and expertise required to complete application <strong>for</strong> aFull Funding Grant Agreement (FFGA).• Develop transit-related communications consistent with federal guidelines.*The Columbia River Crossing Department had some staff moved from the Development & Operations Support Department.CP-13
BUD1 Personnel Services CAPITAL PROJECTS - COLUMBIA RIVER CROSSING10/11 11/12 12/13 12/1313/14Actual Actual -----------<strong>Budget</strong>---------- Est ---------<strong>Budget</strong>----------Position Title Total Total Base Pos Total Total Base Pos TotalCRC Transit Manager $ 121,204 1.00 $ 121,204 $ 121,668 $ 121,668 1.00 $ 121,668Manager, Community Affairs 80,659 1.00 80,659 80,659 80,659 1.00 80,659Transit System Engineer 135,720 1.00 135,720Engineer IV 85,361 1.00 85,361 85,357 85,357 1.00 85,357Engineer III 73,080 3.00 219,240Engineer II 67,860 2.00 135,720Engineer I 55,342 1.00 55,342 57,462 52,816 2.00 105,632Community Affairs Representative 58,005 1.00 58,005 60,072 60,072 1.00 60,072Administrative Assistant 38,002 1.00 38,002 39,484 39,484 1.00 39,484Fringe Benefits 153,698 156,990 352,861Total 6.00 592,272 601,693 13.00 $ 1,336,413CP-14
BUD2 Materials & Services CAPITAL PROJECTS - COLUMBIA RIVER CROSSINGActual Actual <strong>Budget</strong> Estimate <strong>Budget</strong> % Change % ofExpense Category 10/11 11/12 12/13 12/13 13/14 FY13-<strong>FY14</strong> Projects TotalProfessional & Technical $ 4,0001.86%Mechanical/Structural/Program Mgmt Consultant $ 585,539200,000 -65.84% 93.11%Local Travel & Meetings 10,800 5.03%$ 585,539 $ - $ 214,800 -63.32% 100.00%CP-15
BUDGET PROGRESSION SCHEDULE - CAPITAL PROJECTSActual Actual Adopted Proposed <strong>Approved</strong> Adopted10/11 11/12 12/13 13/14 13/14 13/14Administration$ 271,615 $ 311,609 $ 313,078 Personnel Services $ 315,965 $ 320,04581,833 74,265 78,470 Materials & Services 80,589 80,589$ 353,448 $ 385,874 $ 391,548 Department Total $ 396,554 $ 400,634Operating Projects$ 4,758,412 $ 684,058 $ 2,816,838 Materials & Services $ 5,703,667 $ 5,703,667$ 4,758,412 $ 684,058 $ 2,816,838 Department Total $ 5,703,667 $ 5,703,667Bus Stop Development$ 395,098 $ 430,441 Personnel Services $ 736,566 $ 736,566$ 845,454 $ 279,543 615,000 Materials & Services 250,183 250,183$ 845,454 $ 674,641 $ 1,045,441 Department Total $ 986,749 $ 986,749Development & Operations Support$ 2,122,565 $ 1,437,182 $ 240,120 Personnel Services $ 640,576 $ 640,5761,536,873 5,469,729 10,865,133 Materials & Services 1,910,201 1,910,201$ 3,659,438 $ 6,906,911 $ 11,105,253 Department Total $ 2,550,777 $ 2,550,777Columbia River Crossing$ 592,272 Personnel Services $ 1,336,413 $ 1,336,413585,539 Materials & Services 214,800 214,800$ 1,177,811 Department Total $ 1,551,213 $ 1,551,213Division Total$ 2,394,180 $ 2,143,889 $ 1,575,912 Personnel Services $ 3,029,520 $ 3,033,600$ 7,222,572 $ 6,507,595 $ 14,960,980 Materials & Services $ 8,159,440 $ 8,159,440$ 9,616,753 $ 8,651,484 $ 16,536,891 Total Capital Projects $ 11,188,960 $ 11,193,040CP-16
EXTERNAL CAPITAL PROGRAM RESOURCESLine Actual Actual <strong>Budget</strong> Estimate <strong>Budget</strong>No. 10/11 11/12 12/13 12/13 13/141. Beginning Fund Balance $ 36,406,7112. State, local government & private contributions $ 9,725,168 $ 3,209,8853. Federal Transit Administration grants 8,652,501 2,226,918 $ 22,819,046 $ 19,559,662 8,651,1574. New money revenue bond proceeds & short term financing 6,818,953 59,928,252 34,593,289 21,145,0005. Operating resources required <strong>for</strong> capital program 3,698,901 10,967,494 22,636,193 10,034,732 25,675,7256. Total External General Fund Fund Resource $ 28,895,523 $ 16,404,297 $ 105,383,491 $ 64,187,683 $ 91,878,593Capital Program-1
CAPITAL PROGRAM REQUIREMENTSLine Actual Actual <strong>Budget</strong> Estimate <strong>Budget</strong> % of TotalNo. 10/11 11/12 12/13 12/13 13/14 Requirements1. Public Affairs Division $ 487,000 $ 487,000 $ 100,0000.11%2. Safety & Security Division 308,727 158,727 1,310,124 1.43%3. In<strong>for</strong>mation Technology Division $ 6,973,431 $ 15,914,572 29,863,945 26,784,281 6,903,899 7.51%4. Finance & Administration Division 7,347 370,000 185,000 3,769,381 4.10%5. Legal Services Division 50,000 50,000 - 0.00%6. Operations Division 8,045,601 9,194,752 62,902,494 33,328,656 64,069,311 69.73%7. Capital Projects Division 12,637,786 2,458,964 11,401,325 3,194,019 15,725,878 17.12%8. Total capital project requirements $ 27,656,818 $ 27,575,635 $ 105,383,491 $ 64,187,683 $ 91,878,593100.00%Capital Program-2
FY13-14 Capital Program DetailGrant Grant <strong>TriMet</strong> <strong>TriMet</strong> New Money FY13-14Project Share Carryover Share Carryover Revenue Bonds Total NotesPublic Affairs DivisionPlanning & PolicyBRT First Corridor (Powell-Division) $ 100,000$ 100,000Total Planning & Policy $ 100,000$ 100,000Total Public Affairs Division $ 100,000$ 100,000Safety & Security DivisionSafety, Security and Environmental ServicesCCTV Cameras (Bus) $ 664,800$ 664,800CCTV Cameras (Light Rail/P&R) 125,000 125,000E-Citation 220,324 220,324Merlo UST Replacement 150,000 150,000Storm Water UIC Permit $ 150,000150,000Total Safety, Security and Environmental Services $ 1,160,124 $ 150,000$ 1,310,124Total Safety & Security Division $ 1,160,124 $ 150,000$ 1,310,124In<strong>for</strong>mation Technology DivisionIn<strong>for</strong>mation TechnologyBus Dispatch Replacement* $ 453,447 $ 3,079,664$ 3,533,111 $68,447 Capitalized Labor/FringeCall A Bus Replacement 225,000 225,000Communication Environment Replacement 556,250 556,250Data Communications Systems Replacement 328,000 328,000Digital Sign CPU Retrofit 92,730 92,730Disaster Recovery Network Upgrades 600,000 600,000Discipline Records - Build Oracle Solution 100,000 100,000FMIS/MMIS* 40,512 40,512 $40,512 Capitalized Labor/FringeIT Security Systems Replacement 82,000 82,000ATP-LIFT MDT Dispatch & Communication System 72,000 72,000Operator Employee Service* 16,761 16,761 $16,761 Capitalized Labor/FringeOperator Self Service* 13,774 13,774 $13,774 Capitalized Labor/FringeRuby Server Room Improvements 150,000 150,000Self Service Manager* 166,761 166,761 $16,761 Capitalized Labor/FringeServers Replacement 356,000 356,000Single Sign-On 230,000 230,000TimeClock Replacement 100,000 100,000Voice Systems Replacement 241,000 241,000Total In<strong>for</strong>mation Technology $ 3,824,235 $ 3,079,664$ 6,903,899Total In<strong>for</strong>mation Technology Division $ 3,824,235 $ 3,079,664$ 6,903,899* Application developmentCapital Program-3
FY13-14 Capital Program DetailGrant Grant <strong>TriMet</strong> <strong>TriMet</strong> New Money FY13-14Project Share Carryover Share Carryover Revenue Bonds Total NotesFinance & Administration DivisionFinancial ServicesFinance & Admin Sys/ACCPAC Acc Rec Upgrade $ 40,000$ 40,000Finance & Admin Sys/Agency Copier Cap Lease 30,000 30,000Finance/Procurement Digital Imaging System $ 600,000600,000Recorder Point Planning 150,000 150,000<strong>TriMet</strong> Ticket Office Point of Sale Upgrade 49,000 49,000TVM System - Sensitive Info. Security 115,000 115,000Union Pay Rates in Oracle Payroll 170,000 170,000Total Financial Services $ 969,000 $ 185,000$ 1,154,000Fare RevenueElectronic Fare System* $ 1,587,398$ 1,587,398 $37,398 Capitalized Labor/FringeFare Pull Station 124,000 124,000Type 3 TVM System Upgrade $ 903,983903,983Total Fare Revenue $ 1,711,398 $ 903,983$ 2,615,381Total Finance & Administration Division $ 2,680,398 $ 1,088,983$ 3,769,381Operations DivisionAdministration & SupportOperator Training Equipment $ 400,000$ 400,000Total Administration & Support $ 400,000$ 400,000ATP-LIFT27 ATP Replacement Vehicles Buses+BDS Component $ 2,020,303$ 231,233$ 2,251,536Total ATP-LIFT $ 2,020,303$ 231,233$ 2,251,536Bus MaintenanceBus Shop Equip Repl/Repair > $5,000 $ 882,800$ 882,80060 Replacement Low Floor 40' Buses $ 5,150,000$ 21,145,000 26,295,00054 Replacement Low Floor 40' Buses $ 24,681,31924,681,319Non-Revenue Shop Equipment > $5,000 41,000 41,000Non-Revenue Vehicles > $5,000 1,980,000 1,980,000Total Bus Maintenance $ 5,150,000$ 2,903,800 $ 24,681,319 $ 21,145,000 $ 53,880,119* Application developmentCapital Program-4
FY13-14 Capital Program DetailGrant Grant <strong>TriMet</strong> <strong>TriMet</strong> New Money FY13-14Project Share Carryover Share Carryover Revenue Bonds Total NotesOperations Division (continued)Facilities ManagementBus Hoist Replacements $ 421,000$ 421,000Center Maint Battery Room Ventilation 44,625 44,625Elmonica - Paint Booth MAU 27,000 27,000HVAC Equipment & Systems Replacement 273,000 273,000Powell-Refurbish OPS (admin, bullpen, restrooms) 96,258 96,258REM Storage 261,038 261,038Ruby North DDC Replacement 119,351 119,351Ruby North Server Room Remodel 26,100 26,100Sunset Transit Center - Plat<strong>for</strong>m Pavers Replacement 295,452 295,452TEI & Master Plan - New Construction 60,000 60,000Vault Cover Replacements - Morrison/Yamhill Signal 310,200 310,200Washington Park - Station Finishes & Landscaping 654,032 654,032Compressor Systems Energy Upgrades $ 52,50052,500Concession Services Development - Beaverton 32,000 32,000Gresham Center/Art Work Surrounding Area Renov. 57,000 57,000Merlo Maint Fire Alarm System Upgrade 45,000 45,000Merlo Maint HVAC Exhaust Systems Eng. 32,000 32,000Permanent Operator Restrooms at Priority ERL 195,000 195,000Powell Maint Fire Alarm System Upgrade 20,000 20,000Powell Maint Mezzanine <strong>for</strong> Storage 97,500 97,500Ruby/Elmonica Mezzanine Fall Protection Retrofit 487,000 487,000Total Facilities Management $ 2,588,056 $ 1,018,000$ 3,606,056Rail Maintenance of WayKubota L Series 9 FT Backhoe $ 66,000$ 66,000Rail Safety Enhancements $ 170,000170,000Ruby Junction MOW Training Module 752,600 752,600Signals 220,000 220,000Substations 100,000 100,000Track & Structures 2,380,000 125,000 2,505,000Total Rail Maintenance of Way $ 3,518,600 $ 295,000$ 3,813,600Rail Equipment MaintenanceLight Rail Shop Equipment $ 93,000$ 93,000Rail Maintenance Equipment 25,000 25,000Total Rail Equipment Maintenance $ 118,000$ 118,000Total Operations Division $ 5,150,000 $ 2,020,303 $ 9,528,456 $ 26,225,552 $ 21,145,000 $ 64,069,311Capital Program-5
FY13-14 Capital Program DetailGrant Grant <strong>TriMet</strong> <strong>TriMet</strong> New Money FY13-14Project Share Carryover Share Carryover Revenue Bonds Total NotesCapital Projects DivisionBus Stop DevelopmentBus Stop Development-New Shelters $ 141,773 $ 139,081 $ 16,227 $ 15,919$ 313,000Total Bus Stop Development $ 141,773 $ 139,081 $ 16,227 $ 15,919$ 313,000Development & Operations SupportAutomatic Train Stop (ATS) $ 500,000$ 500,000Center Street - End of Life Maintenance Work 3,419,883 3,419,883Center Street Operations Building - First Floor 2,340,689 2,340,689Line 8 & 17 Bus Turnaround & Layover Facility 400,000 400,000On-Board Energy Storage Units $ 1,100,0001,100,000Pier Park Bus Layover/Operator Restroom $ 120,000120,000Positive Train Control 1 700,000 3,836,156 4,536,156Rail MOW Central Shop Co-Location w/Fac Maint 1 2,996,150 2,996,150Total Development & Operations Support $ 1,100,000 $ 7,360,572 $ 6,952,306$ 15,412,878Total Capital Projects Division $ 141,773 $ 1,239,081 $ 7,376,799 $ 6,968,225$ 15,725,878Total Requirements $ 5,391,773 $ 3,259,384 $ 24,570,012 $ 37,512,424 $ 21,145,000 $ 91,878,5931) <strong>TriMet</strong> Carryover portion of project - bond proceeds in restricted fund balance.Capital Program-6
EXTERNAL LIGHT RAIL PROGRAM RESOURCESLine Actual Actual <strong>Budget</strong> Estimate <strong>Budget</strong>No. 10/11 11/12 12/13 12/13 13/141. State, local government & private contributions $ 63,657,708 $ 22,738,257 $ 211,983,067 $ 207,429,939 $ 24,755,0882. Contributed ROW 19,264,1003. Revenue bond proceeds 132,371,977 40,000,000 40,000,0004. Federal Transit Administration grants 21,399,9995. Federal New Starts Grants 85,000,000 132,626,785 100,000,000 100,000,0006. Local interest 2,898,141 20,000,000 16,997,527 17,143,9277. Interim Financing 39,854,209 4,016,307 297,741,8288. Operating Resources or Bond Proceeds in Fund Balance 25,491,0889. Total Resources $ 218,191,926 $ 129,138,256 $ 444,464,061 $ 393,934,861 $ 439,640,843WILSONVILLE TO BEAVERTON COMMUTER RAIL PROJECT RESOURCESLine Actual Actual <strong>Budget</strong> Estimate <strong>Budget</strong>No. 10/11 11/12 12/13 12/13 13/141. State, local government & private contributions $ 137,4422. Total Project Resources $ 137,442PORTLAND-MILWAUKIE LIGHT RAIL PROJECT RESOURCESLine Actual Actual <strong>Budget</strong> Estimate <strong>Budget</strong>No. 10/11 11/12 12/13 12/13 13/141. State and local government contributions $ 63,657,708 $ 22,600,815 $ 211,983,067 $ 207,429,939 $ 24,755,0882. Revenue Bond Proceeds 132,371,977 40,000,000 40,000,0003. Contributed ROW 19,264,1004. Federal Transit Administration (not New Starts) Grants 21,399,9995. Federal New Starts Grants 85,000,000 132,626,785 100,000,000 100,000,0006. Local interest 2,898,141 20,000,000 16,997,527 17,143,9277. Interim Financing 39,854,209 4,016,307 297,741,8288. Total Project Resources $ 218,191,926 $ 129,000,814 $ 444,464,061 $ 368,443,773 $ 439,640,843Light Rail Program-1
LIGHT RAIL PROGRAM REQUIREMENTSLine Actual Actual <strong>Budget</strong> Estimate <strong>Budget</strong>No. 10/11 11/12 12/13 12/13 13/141. South Corridor Project $ 1,341,338 $ 2,136,194 $ 1,946,628 $ 736,0002. Portland-Milwaukie Light Rail Project 85,549,979 223,494,380 444,464,061 393,198,861 $ 439,640,8433. Total light rail program requirements $ 86,891,317 $ 225,630,574 $ 446,410,689 $ 393,934,861 $ 439,640,843Light Rail Program-2
LIGHT RAIL PROGRAM REQUIREMENTS - DETAILED BY PROJECTLine Actual Actual <strong>Budget</strong> Estimate <strong>Budget</strong> % of TotalNo. 10/11 11/12 12/13 12/13 13/14 RequirementsSouth Corridor Project1. Personnel Services $ 663,230 $ 92,7222. Stations, Stops, Terminals 37,764 446,284 $ 879,544 $ 240,0003. Support Facilities (679) 1,0004. Guideway and Track 1,4605. Sitework and Special Conditions 918,046 46,358 621,084 60,0006. Systems 242,835 132,678 88,0007. Real Property Acquisition 88,179 379,206 200,0008. Vehicles (836,298) 198,720 95,0009. Project Management 226,802 838,905 446,000 52,00010. Safety and Security 1,31911. Total South Corridor Project $ 1,341,338 $ 2,136,194 $ 1,946,628 $ 736,000Portland-Milwaukie Light Rail Project12. Personnel Services $ 7,504,975 $ 10,811,276 $ 17,255,061 $ 17,508,634 $ 19,569,916 4.45%13. Preliminary Engineering (99,549) 0.00%14. Guideway and Track 2,026,343 46,911,684 110,635,000 124,349,300 122,098,900 27.77%15. Stations, Stops, Terminals 2,576,000 53,000 11,161,900 2.54%16. Support Facilities: Yards 2,399,349 12,547,000 9,551,300 24,544,900 5.58%17. Sitework & Special Conditions 6,041,010 20,973,132 88,955,000 77,571,700 77,612,500 17.65%18. Systems 61 41,830,000 9,247,500 34,132,100 7.76%19. ROW Land Existing Improvements 43,786,491 97,219,817 62,112,000 90,041,300 31,000,000 7.05%20. Vehicles 3,953,669 29,520,000 9,393,200 54,911,200 12.49%21. Professional Services 23,293,019 35,335,243 49,034,000 37,063,400 31,200,000 7.10%22. Interim Finance Interest 24,331 10,000,000 13,397,500 3.05%23. Capital Interest 2,898,141 1,279,733 0.00%24. Local Interest Cost 4,685,634 20,000,000 16,997,527 17,143,927 3.90%25. Startup 1,422,000 2,868,000 0.65%26. Total Portland-Milwaukie Light Rail Project $ 85,549,979 $ 223,494,380 $ 444,464,061 $ 393,198,861 $ 439,640,843 100.00%27. Total Light Rail Program Requirements $ 86,891,317 $ 225,630,574 $ 446,410,689 $ 393,934,861 $ 439,640,843 100.00%Light Rail Program-3
Division Summary LIGHT RAIL PROGRAMActual <strong>Budget</strong> Estimate <strong>Budget</strong> % Change % of10/11 11/12 12/13 12/13 13/14 FY13- <strong>FY14</strong> Dept. TotalPersonnel Services $ 8,168,204 $ 10,903,998 $ 17,255,061 $ 17,508,634 $ 19,569,91613.42% 4.45%Materials & Services 78,723,113 214,726,575 429,155,628 376,426,227 420,070,927 -2.12% 95.55%Total $ 86,891,317 $ 225,630,574 $ 446,410,689 $ 393,934,861 $ 439,640,843-1.52% 100.00%PageLight Rail ProgramDivision Summary …………………………………………………………………Light Rail Program-4South Corridor Project …………………………………………………………………Light Rail Program-5Portland-Milwaukie Light Rail Project ……………………………………………Light Rail Program-8Light Rail Program-4
Department Summary LIGHT RAIL PROGRAM - SOUTH CORRIDOR PROJECTActual <strong>Budget</strong> Estimate <strong>Budget</strong> % Change % of10/11 11/12 12/13 12/13 13/14 FY13- <strong>FY14</strong> Dept. TotalPersonnel Services $ 663,230 $ 92,722 $ - $ - $-Materials & Services 678,108 2,043,471 $ 1,946,628 $ 736,000Total $ 1,341,338 $ 2,136,194 $ 1,946,628 $ 736,000Light Rail Program-5
BUD1 Personnel Services LIGHT RAIL PROGRAM - SOUTH CORRIDOR PROJECT10/11 11/12 12/13 12/1313/14Actual Actual ---------<strong>Budget</strong>---------- Est ---------<strong>Budget</strong>----------Position Title Total Total Base Pos Total Total Base Pos TotalDirector, Project Engineering $ 782Director, Program Management 10,906 $ 482Director, Operating Projects 725Director, Systems Engineering 24,630 299Manager, <strong>Budget</strong> 22,583Manager, Work<strong>for</strong>ce 150Manager, Real Property Development 4,800Manager, CADD 38Manager, Public Arts Program 353Project Control Analyst 11,226Insurance Coordinator 7,817Administrator, Program Management 268Cost Engineer 1,192 1,611Coordinator, Administration 9,017 53Contract Administrator III 248Safety Specialist 265Engineer IV 143,817 23,439Communications Engineer IV 250 5,628Engineer III 94,015 10,613Engineer II 6,799 7,622Engineering Technician II 587 153Deputy General Counsel 3,498 777Community Affairs Representative 222Public Art Coordinator 125Administrative Specialist 24,016 186Business Systems Analyst 4,002 74Real Property Specialist 8,047 469Fringe Benefits 284,090 40,075Total $ 663,230 $ 92,722Light Rail Program-6
BUD2 Materials & Services LIGHT RAIL PROGRAM - SOUTH CORRIDOR PROJECTActual Actual <strong>Budget</strong> Estimate <strong>Budget</strong> % Change % ofExpense Category 10/11 11/12 12/13 12/13 13/14 FY13-<strong>FY14</strong> M & S TotalStations, Stops, Terminals $ 37,764 $ 446,284 $ 879,544 $ 240,000Support Facilities (679) 1,000Guideway and Track 1,460Sitework and Special Conditions 918,046 46,358 621,084 60,000Systems 242,835 132,678 88,000Real Property 88,179 379,206 200,000Vehicles (836,298) 198,720 95,000Project Management 226,802 838,905 446,000 52,000Safety & Security 1,319$ 678,108 $ 2,043,471 $ 1,946,628 $ 736,000Light Rail Program-7
Department Summary LIGHT RAIL PROGRAM - PORTLAND-MILWAUKIE LIGHT RAIL PROJECTActual <strong>Budget</strong> Estimate <strong>Budget</strong> % Change % of10/11 11/12 12/13 12/13 13/14 FY13- <strong>FY14</strong> Dept. TotalPersonnel Services $ 7,504,975 $ 10,811,276 $ 17,255,061 $ 17,508,634 $ 19,569,91613.42% 4.45%Materials & Services 78,045,005 212,683,104 427,209,000 375,690,227 420,070,927 -1.67% 95.55%Total $ 85,549,979 $ 223,494,380 $ 444,464,061 $ 393,198,861 $ 439,640,843-1.09% 100.00%Light Rail Program-8
BUD1 Personnel Services LIGHT RAIL PROGRAM - PORTLAND-MILWAUKIE LIGHT RAIL PROJECT10/11 11/12 12/13 12/1313/14Actual Actual ---------<strong>Budget</strong>----------Est---------<strong>Budget</strong>----------Position Title Total Total Base Pos Total Total Base Pos TotalDirector, PMLR Project $ 132,287 $ 136,782 $ 155,201 1.00 $ 155,201 $ 160,003 $ 160,003 1.00 $ 160,003Director, Project Engineering 35,258Director, Systems Engineering 70,831 124,495 155,848 1.00 155,848 160,525 160,525 1.00 160,525Director, Real Property 67,636 99,437 107,908 1.00 107,908 109,954 109,954 1.00 109,954Director, Program Management 88,149 102,489 125,802 1.00 125,802 130,646 130,646 1.00 130,646Director, Program Design 68,751 115,395 119,120 0.75 89,340 89,340 106,467 0.25 26,617Director, PMLR East Segment 92,727 101,888 130,980 1.00 130,980 134,780 134,780 1.00 134,780Director, Community Affairs 31,918 47,811 118,452 0.75 88,839 90,530 120,707 1.00 120,707Senior Manager, Project Development 107,223 90,040 121,208 0.75 90,906 94,508 136,096 1.00 136,096Manager, Civil Construction 94,299 110,717 130,792 1.00 130,792 134,739 134,739 1.00 134,739Manager, Senior Inspection 106,885 0.80 85,508Manager, Facilities Development 84,592 86,357 102,396 1.00 102,396 106,070 106,070 1.00 106,070Manager, Transit Corridor Planning 86,031 87,823 101,477 1.00 101,477 105,298 105,298 1.00 105,298Startup Coordinator 104,400 1.00 104,400Manager, Corridor Design 74,210 14,722Manager, Program 353 58,696 95,359 1.00 95,359 112,439 112,439 1.00 112,439Manager, Project Control 92,081 1.00 92,081 92,081Manager, Quality Assurance 72,259 75,099 91,935 1.00 91,935 95,296 95,296 1.00 95,296Manager, Capital Projects 3,612 2,547Manager, <strong>Budget</strong> & Cost 41,225 45,729 90,410 1.00 90,410 90,410Manager, Real Property Acquisition 61,315 60,565 90,285 1.00 90,285 90,285Manager, Real Property Development 67,636Manager, Construction Safety & Risk 58,192 64,418 75,586 1.00 75,586 80,847 89,346 1.00 89,346Manager, Community Relations 73,393 70,793 87,571 1.00 87,571 90,724 90,724 1.00 90,724Manager, CADD 58,628 67,889 79,908 1.00 79,908 82,894 82,894 1.00 82,894Manager, Project Communications 59,333 59,311 79,574 1.00 79,574 82,560Manager, Insurance Programs 30,594 36,930 78,279 0.75 58,709 60,824 81,098 1.00 81,098Manager, Public Arts Program 20,057 50,827 76,818 0.80 61,454 63,759 79,699 0.80 63,759Real Property Specialist 70,079 74,759 74,291 2.00 148,582 148,582 71,263 1.00 71,263Real Property Specialist 180,010 183,319 70,140 4.75 333,165 342,252 72,533 4.75 344,531Administrative Specialist 116,656 130,349 46,098 4.00 184,392 188,652 45,101 2.00 90,202Administrative Specialist 94,115 147,943 41,994 10.00 419,940 426,140 42,708 12.00 512,500Administrative Specialist 39,126 33,490 44,370 1.00 44,370 46,103 46,103 1.00 46,103Document Control Clerk 25,806 41,384 1.00 41,384 42,929 42,929 1.00 42,929Senior Cost Estimator 79,773 69,980 90,076 1.00 90,076 81,829 81,829 1.00 81,829Cost Engineer 67,452 75,570 137,808 1.00 137,808 137,808 137,808 1.00 137,808Light Rail Program-9
BUD1 Personnel Services LIGHT RAIL PROGRAM - PORTLAND-MILWAUKIE LIGHT RAIL PROJECT10/11 11/12 12/13 12/1313/14Actual Actual ---------<strong>Budget</strong>----------Est---------<strong>Budget</strong>----------Position Title Total Total Base Pos Total Total Base Pos TotalCost Engineer $ 55,975 $ 57,522 $ 67,296 1.00 $ 67,296 $ 69,823 $ 69,823 1.00 69,823Program Scheduler 63,554 65,813 93,960 1.00 93,960 97,489 97,489 0.80 77,991Program Scheduler 53,821 53,624 58,798 2.00 117,596 119,892 61,095 2.00 122,190Cost Supervisor 55,207 1.00 55,207Project Control Analyst 51,092 59,536 70,386 1.00 70,386 85,337Project Control Specialist 4,400 47,263 52,200 2.00 104,400 105,986 53,787 2.00 107,574Engineer V 137,276 305,759 107,402 4.00 429,608 445,056 120,227 3.00 360,681Engineer V 96,605 95,794 94,677 3.00 284,031 288,435 96,145 3.00 288,436Engineer IV 10,435 59,982 90,525 2.00 181,050 187,858 90,744 3.00 272,233Engineer IV 52,719 69,935 91,559 1.00 91,559 94,524 94,524 1.00 94,524Engineer IV 31,371 86,328 90,812 4.00 363,248 365,924 90,457 4.00 361,830Engineer III 403,635 988,663 72,863 20.50 1,493,692 1,573,662 79,200 15.75 1,247,407Engineer II 206,002 395,085 65,594 14.00 918,316 940,086 68,826 11.00 757,088Engineer I 59,320 0.25 14,830 15,373 57,671 8.00 461,364Engineering Technician III 39,740 39,229 53,328 1.00 53,328 55,374 55,374 1.00 55,374Publications Coordinator 57,297 57,478 64,791 1.00 64,791 74,416 74,416 1.00 74,416Community Affairs Representative 101,614 131,407 58,492 3.00 175,476 180,069 61,586 4.00 246,342Communications Specialist 40,319 43,526 46,207 1.00 46,207 46,207 50,822 1.00 50,822Coordinator, Project Design 1,456 74,291 1.00 74,291 74,291 63,016 1.00 63,016Public Art Coordinator 52,541 51,586 65,146 1.00 65,146 67,442 67,442 1.00 67,442Public Art Assistant 18,378 54,288 1.00 54,288 51,052 51,052 1.00 51,052Planner II 3,409 30,971 68,758 0.75 51,569 52,508 62,611 1.75 109,569Business Systems Analyst 44,652 67,477 77,381 1.00 77,381 80,284 80,284 1.00 80,284Software Systems Engineer V 94,002 1.00 94,002 94,002 92,039 1.00 92,039Program Management Administrator 543 47,984 62,953 1.00 62,953 65,229 65,229 1.00 65,229Quality Assurance Specialist 58,605 67,303 72,882 2.00 145,764 148,290 74,145 2.00 148,290System Safety Specialist 5,659 56,617 62,577 2.00 125,154 131,586 65,793 2.00 131,586Configuration Specialist 56,376 2.00 112,752 112,752 56,376 1.00 56,376Environmental Permits Coordinator 38,545 55,989 73,205 0.50 36,603 37,657 75,314 1.00 75,314Deputy General Counsel 92,290 128,331 157,435 1.00 157,435 157,435 159,941 1.00 159,941Deputy General Counsel 249,598 279,302 106,606 2.75 293,167 297,800 101,108 2.75 278,047Paralegal I 22,729 42,073 1.00 42,073 43,723 43,723 1.00 43,723Bus Stop Planner/Analyst 1,301 6,277Bike Program Coordinator 2,788 146Director, Operations Support 6,124 11,443Manager, Contracts 451 7,946Light Rail Program-10
BUD1 Personnel Services LIGHT RAIL PROGRAM - PORTLAND-MILWAUKIE LIGHT RAIL PROJECT10/11 11/12 12/13 12/1313/14Actual Actual ---------<strong>Budget</strong>----------Est---------<strong>Budget</strong>----------Position Title Total Total Base Pos Total Total Base Pos TotalDirector, Diversity & Transit Equity $ 9,854 $ 18,346 $ 90,348 0.50 $ 45,174 $ 47,429 $ 94,858 0.50 47,429Policy Analyst 50,000 0.25 12,500 12,500 50,000 0.25 12,500Manager, Rail Operations Planning 39,163 47,328 102,082 1.00 102,082 105,047 105,047 1.00 105,047Manager, Project Communications 82,560 0.50 41,280Planner II 51,705 0.50 25,852HR Business Partner 18,376 110,423 0.75 82,817 73,022 97,363 0.75 73,023Contract Administrator III 22,914 26,868 66,482 0.50 33,241 34,296 68,591 0.50 34,295Coordinator, Administration 28,264 42,633 55,102 0.50 27,551 28,355 56,710 0.50 28,355Administrative Specialist 25,937 42,574 0.50 21,287 23,219 46,437 0.50 23,219Start Up:Transportation Training Supervisor 70,512 0.75 52,884Maintenance of Way Supervisor 74,959 1.00 74,959Training/Engineering Supervisor 74,959 1.00 74,959Active Regular Operator 55,844 8.00 446,748Track Maintainer 60,529 0.67 40,554 37,758 56,353 2.00 112,706Plant Maint Mechanic Apprentice 74,275 55,852 2.00 111,704 111,704 55,852 2.00 111,704Signal Maintainer/Apprentice 60,529 2.00 121,058 112,710 62,617 4.00 250,468Substation Maintainer/Apprentice 63,502 1.00 63,502 63,502 63,502 1.00 63,502Power Maintainer/Apprentice 63,502 3.00 190,506 196,506 63,502 3.00 190,507Vehicle Maintainer/Apprentice 57,668 8.33 480,378 480,378 57,668 12.00 692,022Fringe Benefits 3,214,701 4,694,659 7,410,871 7,664,444 8,866,535Workers' Compensation 2,673 2,673Limited Term Employment 10,140Union Insured Premium Repayment 9,110 9,110Sick & Vacation/Holiday Payoff 29,842 29,842 32,960Total $ 7,504,975 $ 10,811,276146.30 $ 17,255,061 $ 17,508,634163.40 $ 19,569,916Light Rail Program-11
BUD2 Materials & Services LIGHT RAIL PROGRAM - PORTLAND-MILWAUKIE LIGHT RAIL PROJECTActual Actual <strong>Budget</strong> Estimate <strong>Budget</strong> % Change % ofExpense Category 10/11 11/12 12/13 12/13 13/14 FY13-<strong>FY14</strong> M & S TotalPreliminary Engineering $ (99,549)Guideway and Track $ 2,026,343 46,911,684 $ 110,635,000 $ 124,349,300 $ 122,098,90010.36% 29.07%Stations, Stops, Terminals 2,576,000 53,000 11,161,900 333.30% 2.66%Support Facilities: Yards 2,399,349 12,547,000 9,551,300 24,544,900 95.62% 5.84%Sitework & Special Conditions 6,041,010 20,973,132 88,955,000 77,571,700 77,612,500 -12.75% 18.48%Systems 61 41,830,000 9,247,500 34,132,100 -18.40% 8.13%ROW Land Existing Improvements 43,786,491 97,219,817 62,112,000 90,041,300 31,000,000 -50.09% 7.38%Vehicles 3,953,669 29,520,000 9,393,200 54,911,200 86.01% 13.07%Professional Services 23,293,019 35,335,243 49,034,000 37,063,400 31,200,000 -36.37% 7.43%Interim Finance Interest 24,331 10,000,000 13,397,500 33.98% 3.19%Capital Interest 2,898,141 1,279,733 0.00%Local Interest Cost 4,685,634 20,000,000 16,997,527 17,143,927 -14.28% 4.08%Startup 1,422,000 2,868,000 0.68%Total $ 78,045,005 $ 212,683,104 $ 427,209,000 $ 375,690,227 $ 420,070,927-1.67% 100.00%Light Rail Program- 12
G. O. BOND DEBT SERVICE FUNDLine Actual Actual <strong>Budget</strong> Estimate <strong>Budget</strong>No. 10/11 11/12 12/13 12/13 13/14Resources1. Beginning Fund Balance $ 9,432,000 $ 14,288,264 $ 10,901,873 $ 11,776,763 $ 1,965,6232. Previously Levied Taxes - Estimated to be Received 438,000 481,430 225,330 225,330 234,3773. Other Resources 4,149,0004. Earnings from Temporary Investments 49,000 19,761 20,000 20,0005. Total Resources Except <strong>for</strong> Taxes $ 14,068,000 $ 14,789,455 $ 11,147,203 $ 12,022,093 $ 2,200,0006. Taxes Necessary to Balance 10,259,000 7,006,9447. Total Resources $ 24,327,000 $ 21,796,399 $ 11,147,203 $ 12,022,093 $ 2,200,000RequirementsGeneral Obligation Refunding Bonds (Light Rail Extension)1999 Series A8. Redemption of Principal $ 8,845,000 $ 9,315,000 $ 9,800,000 $ 9,800,0009. Interest Expense 1,194,000 704,636 256,470 256,47010. Unappropriated Ending Fund Balance 14,288,000 11,776,763 1,090,733 1,965,62311. Transfer to General Fund $ 2,200,00012. Total Requirements $ 24,327,000 $ 21,796,399 $ 11,147,203 $ 12,022,093 $ 2,200,000Last property tax assessment <strong>for</strong> Westside bonds was November 2011.G. O. Bond-1
[This Page Left Intentionally Blank]G. O. Bond‐2
Exhibit 1. Ridership and Service (Fixed Route)Fiscal Boarding Rides Percent Boarding Percent Originating Rides Percent Fixed Route Percent Fixed Route Veh Hrs 1 Percent Fixed Route Veh Hrs PercentYear (Bus, Rail, WES) Change Rides/Capita Change (Bus, Rail, WES) Change Vehicle Hrs Change (In Bus Equivalents) Change In Bus Equiv/Capita Change72 18,696,600 3.1% 20.40 1.7% 14,607,600 3.2% 789,000 7.3% 789,000 7.3% 0.86 5.9%73 22,080,600 18.1% 23.89 17.2% 17,258,400 18.1% 818,000 3.7% 818,000 3.7% 0.89 2.8%74 25,480,000 15.4% 27.36 14.5% 20,550,000 19.1% 887,000 8.4% 887,000 8.4% 0.95 7.6%75 28,360,000 11.3% 30.12 10.1% 22,690,000 10.4% 1,122,000 26.5% 1,122,000 26.5% 1.19 25.1%76 35,210,000 24.2% 36.88 22.5% 28,170,000 24.2% 1,287,000 14.7% 1,287,000 14.7% 1.35 13.1%77 38,080,000 8.2% 39.33 6.7% 30,460,000 8.1% 1,360,000 5.7% 1,360,000 5.7% 1.40 4.2%78 41,570,000 9.2% 41.03 4.3% 32,630,000 7.1% 1,432,000 5.3% 1,432,000 5.3% 1.41 0.6%79 42,250,000 1.6% 40.88 ‐0.4% 33,160,000 1.6% 1,443,000 0.8% 1,443,000 0.8% 1.40 ‐1.2%80 50,670,000 19.9% 48.12 17.7% 39,760,000 19.9% 1,544,000 7.0% 1,544,000 7.0% 1.47 5.0%81 48,090,000 ‐5.1% 45.28 ‐5.9% 37,740,000 ‐5.1% 1,560,000 1.0% 1,560,000 1.0% 1.47 0.2%82 46,930,000 ‐2.4% 43.89 ‐3.1% 36,960,000 ‐2.1% 1,615,000 3.5% 1,615,000 3.5% 1.51 2.8%83 49,360,000 5.2% 46.66 6.3% 36,520,000 ‐1.2% 1,747,000 8.2% 1,747,000 8.2% 1.65 9.3%84 49,680,000 0.6% 46.48 ‐0.4% 36,720,000 0.5% 1,723,000 ‐1.4% 1,723,000 ‐1.4% 1.61 ‐2.4%85 47,400,000 ‐4.6% 43.97 ‐5.4% 35,640,000 ‐2.9% 1,522,632 ‐11.6% 1,522,632 ‐11.6% 1.41 ‐12.4%86 45,120,000 ‐4.8% 41.49 ‐5.6% 33,720,000 ‐5.4% 1,515,504 ‐0.5% 1,515,504 ‐0.5% 1.39 ‐1.3%87 47,880,000 6.1% 43.64 5.2% 35,400,000 5.0% 1,529,136 0.9% 1,529,136 0.9% 1.39 0.0%88 46,560,000 ‐2.8% 41.58 ‐4.7% 35,520,000 0.3% 1,545,456 1.1% 1,545,456 1.1% 1.38 ‐1.0%89 48,600,000 4.4% 42.58 2.4% 37,440,000 5.4% 1,544,772 0.0% 1,709,741 10.6% 1.50 8.5%90 51,541,000 6.1% 43.57 2.3% 39,661,200 5.9% 1,570,078 1.6% 1,730,507 1.2% 1.46 ‐2.3%91 55,031,000 6.8% 45.20 3.7% 42,311,100 6.7% 1,602,204 2.0% 1,776,251 2.6% 1.46 ‐0.3%92 57,172,000 3.9% 45.83 1.4% 43,996,200 4.0% 1,643,218 2.6% 1,823,345 2.7% 1.46 0.2%93 57,198,000 0.0% 44.76 ‐2.3% 44,021,600 0.1% 1,700,126 3.5% 1,889,049 3.6% 1.48 1.2%94 59,148,000 3.4% 45.41 1.5% 45,612,000 3.6% 1,793,292 5.5% 1,985,216 5.1% 1.52 3.1%95 61,188,000 3.4% 46.04 1.4% 47,184,000 3.4% 1,837,836 2.5% 2,025,927 2.1% 1.52 0.0%96 63,912,000 4.5% 46.98 2.0% 49,248,000 4.4% 1,880,664 2.3% 2,076,897 2.5% 1.53 0.1%97 66,780,000 4.5% 48.13 2.4% 51,432,000 4.4% 1,879,068 ‐0.1% 2,074,515 ‐0.1% 1.50 ‐2.1%98 68,952,000 3.3% 48.90 1.6% 53,100,000 3.2% 1,936,044 3.0% 2,170,528 4.6% 1.54 3.0%99 76,309,200 10.7% 53.34 9.1% 59,647,200 12.3% 2,068,284 6.8% 2,573,776 18.6% 1.80 16.9%00 81,237,600 6.5% 55.96 4.9% 63,608,400 6.6% 2,152,248 4.1% 2,707,670 5.2% 1.87 3.7%01 84,946,800 4.6% 57.89 3.5% 66,484,800 4.5% 2,177,616 1.2% 2,739,140 1.2% 1.87 0.1%02 88,633,200 4.3% 59.72 3.2% 69,367,200 4.3% 2,232,132 2.5% 2,850,808 4.1% 1.92 2.9%03 88,863,600 0.3% 59.09 ‐1.1% 69,591,600 0.3% 2,241,672 0.4% 2,880,825 1.1% 1.92 ‐0.3%04 91,071,600 2.5% 59.82 1.2% 71,284,800 2.4% 2,249,172 0.3% 2,877,996 ‐0.1% 1.89 ‐1.3%05 95,826,000 5.2% 62.07 3.8% 75,014,400 5.2% 2,278,800 1.3% 3,033,191 5.4% 1.96 3.9%06 95,736,000 ‐0.1% 61.01 ‐1.7% 74,947,200 ‐0.1% 2,192,124 ‐3.8% 2,938,013 ‐3.1% 1.87 ‐4.7%07 96,918,000 1.2% 60.83 ‐0.3% 75,870,000 1.2% 2,206,416 0.7% 2,966,166 1.0% 1.86 ‐0.6%08 99,098,400 2.2% 61.38 0.9% 77,582,400 2.3% 2,231,064 1.1% 3,019,375 1.8% 1.87 0.5%09 101,466,746 2.4% 62.19 1.3% 79,437,580 2.4% 2,268,049 1.7% 3,110,749 3.0% 1.91 1.9%10 99,337,044 ‐2.1% 60.40 ‐2.9% 77,769,119 ‐2.1% 2,195,934 ‐3.2% 3,213,873 3.3% 1.95 2.5%11 100,002,660 0.7% 60.36 ‐0.1% 78,286,380 0.7% 2,038,392 ‐7.2% 3,064,379 ‐4.7% 1.85 ‐5.4%12 102,238,070 2.2% 61.11 1.2% 80,042,810 2.2% 2,031,908 ‐0.3% 3,080,025 0.5% 1.84 ‐0.5%1) Excludes StreetcarGeneral-1
Exhibit 2. Fares and Passenger Revenue (Fixed Route)Fiscal US City Avg Percent Passenger Rev 1 Percent Pass Rev/Veh Hr Percent Average Fare Percent Base Fare Zone 2‐Zone Pass Rev/Sys Cst PercentYear CPI‐W Change (Unadj. CPI) Change (Unadj. CPI) Change (Unadj. CPI) Change (Adj. CPI 12) Surcharge Monthly Pass (Unadj. CPI) Change72 41.39 3.6% $5,904,000 25.6% $7.48 17.0% $0.34 7.2% $1.90 $0.10 $0 62.53% 10.6%73 43.05 4.0% $6,155,000 4.3% $7.52 0.6% $0.34 0.4% $1.82 $0.10 $0 57.22% ‐8.5%74 46.90 8.9% $6,874,000 11.7% $7.75 3.0% $0.33 ‐2.8% $1.67 $0.10 $0 51.69% ‐9.7%75 52.09 11.1% $7,291,000 6.1% $6.50 ‐16.1% $0.32 ‐3.9% $1.51 $0.00 $13 39.02% ‐24.5%76 55.79 7.1% $8,191,000 12.3% $6.36 ‐2.1% $0.29 ‐9.5% $1.41 $0.00 $13 31.92% ‐18.2%77 59.01 5.8% $9,545,000 16.5% $7.02 10.3% $0.31 7.8% $1.52 $0.00 $14 30.81% ‐3.5%78 62.98 6.7% $10,315,000 8.1% $7.20 2.6% $0.32 0.9% $1.60 $0.00 $16 28.29% ‐8.2%79 68.89 9.4% $12,457,000 20.8% $8.63 19.8% $0.38 18.8% $1.46 $0.20 $16 29.44% 4.1%80 78.13 13.4% $15,538,000 24.7% $10.06 16.6% $0.39 4.0% $1.58 $0.20 $18 29.96% 1.8%81 87.17 11.6% $19,029,000 22.5% $12.20 21.2% $0.50 29.0% $1.67 $0.25 $21 32.56% 8.7%82 94.53 8.4% $18,671,000 ‐1.9% $11.56 ‐5.2% $0.51 0.2% $1.54 $0.25 $21 28.76% ‐11.7%83 98.53 4.2% $18,659,000 ‐0.1% $10.68 ‐7.6% $0.51 1.1% $1.71 $0.25 $32 26.69% ‐7.2%84 101.48 3.0% $18,011,913 ‐3.5% $10.45 ‐2.1% $0.49 ‐4.0% $1.66 $0.25 $32 24.62% ‐7.8%85 105.23 3.7% $18,088,617 0.4% $11.88 13.6% $0.51 3.5% $1.60 $0.25 $32 25.70% 4.4%86 108.00 2.6% $18,380,676 1.6% $12.13 2.1% $0.55 7.4% $1.77 $0.25 $32 27.07% 5.3%87 110.09 1.9% $19,532,670 6.3% $12.77 5.3% $0.55 1.2% $1.73 $0.25 $32 28.42% 5.0%88 114.61 4.1% $21,224,604 8.7% $13.73 7.5% $0.60 8.3% $1.66 $0.25 $36 28.65% 0.8%89 119.86 4.6% $21,420,339 0.9% $13.87 1.0% $0.57 ‐4.3% $1.59 $0.30 $27 27.00% ‐5.7%90 125.48 4.7% $22,272,167 4.0% $14.19 2.3% $0.56 ‐1.7% $1.52 $0.30 $27 26.16% ‐3.1%91 132.15 5.3% $25,591,723 14.9% $15.97 12.6% $0.61 7.7% $1.53 $0.30 $29 28.62% 9.4%92 136.13 3.0% $26,281,298 2.7% $15.99 0.1% $0.60 ‐1.3% $1.48 $0.30 $29 27.12% ‐5.2%93 140.26 3.0% $27,387,384 4.2% $16.11 0.7% $0.62 4.2% $1.52 $0.30 $31 25.45% ‐6.2%94 143.68 2.4% $27,905,335 1.9% $15.56 ‐3.4% $0.61 ‐1.8% $1.48 $0.30 $31 24.34% ‐4.4%95 147.86 2.9% $30,228,148 8.3% $16.45 5.7% $0.64 4.8% $1.52 $0.30 $33 23.90% ‐1.8%96 151.83 2.7% $31,843,133 5.3% $16.93 2.9% $0.65 0.8% $1.48 $0.30 $33 24.63% 3.1%97 156.09 2.8% $34,627,104 8.7% $18.43 8.8% $0.67 3.7% $1.51 $0.30 $36 24.10% ‐2.2%98 158.56 1.6% $35,518,635 2.6% $18.35 ‐0.4% $0.67 ‐0.2% $1.49 $0.30 $36 23.33% ‐3.2%99 161.15 1.6% $40,611,332 14.3% $19.64 7.0% $0.68 1.8% $1.53 $0.30 $39 24.31% 4.2%00 166.03 3.0% $45,907,371 13.0% $21.33 8.6% $0.72 6.0% $1.55 $0.30 $41 24.49% 0.7%01 171.71 3.4% $51,164,532 11.5% $23.50 10.2% $0.77 6.6% $1.57 $0.30 $43 25.96% 6.0%02 174.34 1.5% $52,628,203 2.9% $23.58 0.3% $0.76 ‐1.4% $1.61 $0.30 $45 25.08% ‐3.4%03 178.12 2.2% $52,093,296 ‐1.0% $23.24 ‐1.4% $0.75 ‐1.3% $1.57 $0.30 $45 23.79% ‐5.2%04 181.74 2.0% $54,978,689 5.5% $24.44 5.2% $0.77 3.0% $1.60 $0.30 $47 24.12% 1.4%05 187.26 3.0% $58,740,216 6.8% $25.78 5.5% $0.78 1.5% $1.68 $0.30 $51 23.15% ‐4.0%06 194.73 4.0% $67,542,814 15.0% $30.81 19.5% $0.90 15.1% $1.90 $0.30 $61 25.63% 10.7%07 199.551 2.5% $74,765,119 10.7% $33.89 10.0% $0.99 9.3% $1.91 $0.30 $63 27.67% 8.0%08 207.387 3.9% $79,638,881 6.5% $35.70 5.3% $1.03 4.2% $1.89 $0.30 $65 27.63% ‐0.1%09 209.840 1.2% $88,726,972 11.4% $39.12 9.6% $1.12 8.8% $2.14 $0.30 $75 28.50% 3.1%10 212.401 1.2% $92,414,344 4.2% $42.08 7.6% $1.19 6.4% $2.11 $0.30 $75 28.61% 0.4%11 217.352 2.3% $95,529,230 3.4% $46.86 11.4% $1.22 2.7% $2.12 $0.30 $77 30.28% 5.8%12 224.267 3.2% $100,587,848 5.3% $49.48 5.6% $1.26 3.0% $2.10 $0.30 $81 30.23% ‐0.2%1) Does not include ATP passenger revenue. General-2
Exhibit 3. Employer Taxes (Unadjusted CPI‐W)Fiscal Employer Tax Percent Employer Tax / 0.10% 1 Percent Employer Tax Percent Employer Tax Percent Self‐Employment Percent State‐In‐Lieu PercentYear Rate Change Change (Municipal & Private) Change Per Capita Change Tax Change Tax Change72 0.3000% $2,028,131 $6,084,394 $6.6473 0.3000% 0.00% $2,173,029 7.1% $6,519,087 7.1% $7.05 6.3%74 0.3000% 0.00% $2,444,577 12.5% $7,333,731 12.5% $7.88 11.6%75 0.3500% 0.05% $2,573,909 5.3% $9,008,681 22.8% $9.57 21.5%76 0.4500% 0.10% $2,759,626 7.2% $12,418,315 37.8% $13.01 36.0%77 0.5000% 0.05% $3,409,760 23.6% $17,048,800 37.3% $17.61 35.4%78 0.5000% 0.00% $3,996,941 17.2% $19,984,707 17.2% $19.73 12.0%79 0.6000% 0.10% $4,546,086 13.7% $27,276,514 36.5% $26.39 33.8%80 0.6000% 0.00% $5,479,011 20.5% $32,874,065 20.5% $31.22 18.3%81 0.6000% 0.00% $5,827,542 6.4% $34,965,250 6.4% $32.92 5.5%82 0.6000% 0.00% $6,262,419 7.5% $37,574,511 7.5% $35.14 6.7% $906,00083 0.6000% 0.00% $6,297,167 0.6% $36,123,000 ‐3.9% $34.15 ‐2.8% $1,660,000 $1,000,000 10.4%84 0.6000% 0.00% $6,687,850 6.2% $38,052,838 5.3% $35.60 4.3% $2,074,264 25.0% $1,478,000 47.8%85 0.6000% 0.00% $7,364,778 10.1% $41,654,862 9.5% $38.64 8.5% $2,533,807 22.2% $1,403,573 ‐5.0%86 0.6000% 0.00% $7,789,362 5.8% $44,022,185 5.7% $40.48 4.8% $2,713,989 7.1% $1,169,561 ‐16.7%87 0.6000% 0.00% $8,179,553 5.0% $46,176,152 4.9% $42.09 4.0% $2,901,166 6.9% $1,479,073 26.5%88 0.6000% 0.00% $8,811,772 7.7% $49,542,391 7.3% $44.25 5.1% $3,328,239 14.7% $1,481,419 0.2%89 0.6125% 0.01% $9,606,641 9.0% $54,818,707 10.7% $48.02 8.5% $4,021,969 20.8% $1,556,562 5.1%90 0.6176% 0.01% $10,538,980 9.7% $60,452,960 10.3% $51.10 6.4% $4,635,782 15.3% $1,698,887 9.1%91 0.6176% 0.00% $11,504,067 9.2% $66,181,424 9.5% $54.36 6.4% $4,867,695 5.0% $1,923,287 13.2%92 0.6176% 0.00% $12,108,364 5.3% $69,780,185 5.4% $55.93 2.9% $5,001,074 2.7% $2,068,403 7.5%93 0.6176% 0.00% $13,232,123 9.3% $76,438,757 9.5% $59.82 7.0% $5,282,833 5.6% $2,226,765 7.7%94 0.6176% 0.00% $14,135,693 6.8% $81,948,251 7.2% $62.92 5.2% $5,353,787 1.3% $2,233,274 0.3%95 0.6176% 0.00% $15,487,585 9.6% $90,006,140 9.8% $67.72 7.6% $5,645,185 5.4% $2,342,733 4.9%96 0.6176% 0.00% $17,209,840 11.1% $100,477,571 11.6% $73.85 9.1% $5,810,399 2.9% $1,968,097 ‐16.0%97 0.6176% 0.00% $19,444,683 13.0% $113,734,961 13.2% $81.97 11.0% $6,355,404 9.4% $1,390,597 ‐29.3%98 0.6176% 0.00% $20,979,186 7.9% $122,866,495 8.0% $87.14 6.3% $6,700,960 5.4% $1,407,539 1.2%99 0.6176% 0.00% $22,141,171 5.5% $130,309,622 6.1% $91.08 4.5% $6,434,248 ‐4.0% $1,470,637 4.5%00 0.6176% 0.00% $23,315,527 5.3% $137,859,468 5.8% $94.97 4.3% $6,137,228 ‐4.6% $1,513,914 2.9%01 0.6195% 0.00% $25,546,971 9.6% $151,015,559 9.5% $102.92 8.4% $7,247,929 18.1% $1,548,939 2.3%02 0.6218% 0.00% $24,753,592 ‐3.1% $146,531,906 ‐3.0% $98.73 ‐4.1% $7,385,930 1.9% $1,924,266 24.2%03 0.6218% 0.00% $24,562,627 ‐0.8% $145,478,005 ‐0.7% $96.73 ‐2.0% $7,252,407 ‐1.8% $1,869,316 ‐2.9%04 0.6218% 0.00% $24,713,167 0.6% $146,124,768 0.4% $95.98 ‐0.8% $7,541,705 4.0% $1,855,350 ‐0.7%05 0.6243% 0.00% $26,254,190 6.2% $155,987,324 6.7% $101.03 5.3% $7,917,586 5.0% $1,970,868 6.2%06 0.6343% 0.01% $28,893,633 10.1% $173,786,460 11.4% $110.75 9.6% $9,485,857 19.8% $1,990,090 1.0%07 0.6443% 0.01% $30,892,774 6.9% $187,531,204 7.9% $117.69 6.3% $11,510,937 21.3% $2,259,404 13.5%08 0.6543% 0.01% $32,286,213 4.5% $200,048,477 6.7% $123.91 5.3% $11,200,216 ‐2.7% $2,254,669 ‐0.2%09 0.6643% 0.01% $31,690,073 ‐1.8% $200,176,901 0.1% $122.68 ‐1.0% $10,340,256 ‐7.7% $2,482,251 10.1%10 0.6743% 0.01% $30,479,770 ‐3.8% $195,006,681 ‐2.6% $118.57 ‐3.4% $10,518,411 1.7% $2,676,196 7.8%11 0.6843% 0.01% $31,905,358 4.7% $207,882,398 6.6% $125.47 5.8% $10,445,965 ‐0.7% $2,659,117 ‐0.6%12 0.6943% 0.01% $34,300,301 7.5% $226,832,349 9.1% $135.69 8.1% $11,314,638 8.3% $2,871,517 8.0%1) Includes Self‐Employment Tax, effective FY00 based on cash receipts. General-3
Exhibit 4. Expenses (Fixed Route)Fiscal Operations Costs 1 Percent Ops Costs/Veh Hr Percent Bus Ops Costs/Veh Hr Percent Rail Ops Costs/Veh Hr Percent WES Ops Costs/Veh Hr PercentYear (Adj. CPI 12) Change (Unadj. CPI) Change (Unadj. CPI) Change (Unadj. CPI) Change (Unadj. CPI) Change72 $40,275,427 8.0% $9.42 4.3%73 $43,814,458 8.8% $10.28 9.1%74 $48,767,160 11.3% $11.50 11.8%75 $61,266,709 25.6% $12.68 10.3%76 $87,057,644 42.1% $16.83 32.7%77 $99,830,416 14.7% $19.31 14.8%78 $110,480,359 10.7% $21.67 12.2%79 $115,958,585 5.0% $24.68 13.9%80 $122,933,553 6.0% $27.74 12.4%81 $129,477,495 5.3% $32.26 16.3%82 $129,733,297 0.2% $33.86 5.0%83 $131,146,006 1.1% $32.98 ‐2.6%84 $134,530,202 2.6% $35.33 7.1%85 $127,350,509 ‐5.3% $39.24 11.1%86 $121,101,736 ‐4.9% $38.48 ‐1.9%87 $119,015,547 ‐1.7% $38.21 ‐0.7% $36.41 $100.6988 $122,323,207 2.8% $40.45 5.9% $38.30 5.2% $98.17 ‐2.5%89 $124,115,624 1.5% $42.94 6.2% $40.59 6.0% $105.53 7.5%90 $124,283,172 0.1% $44.29 3.1% $41.40 2.0% $120.72 14.4%91 $124,643,982 0.3% $45.84 3.5% $42.61 2.9% $133.39 10.5%92 $129,444,733 3.9% $47.82 4.3% $44.27 3.9% $143.79 7.8%93 $136,665,999 5.6% $50.27 5.1% $46.45 4.9% $156.58 8.9%94 $141,777,230 3.7% $50.65 0.7% $46.66 0.5% $167.78 7.2%95 $150,733,964 6.3% $54.07 6.8% $50.13 7.4% $172.55 2.8%96 $151,871,985 0.8% $54.67 1.1% $50.13 0.0% $193.43 12.1%97 $156,970,755 3.4% $58.14 6.3% $53.44 6.6% $201.38 4.1%98 $161,400,007 2.8% $58.94 1.4% $53.09 ‐0.6% $222.89 10.7%99 $196,961,567 22.0% $68.43 16.1% $55.76 5.0% $256.91 15.3%00 $214,783,722 9.0% $73.88 8.0% $60.80 9.0% $257.60 0.3%01 $218,043,973 1.5% $76.66 3.8% $62.83 3.3% $271.04 5.2%02 $223,137,877 2.3% $77.71 1.4% $63.63 1.3% $234.75 ‐13.4%03 $230,288,743 3.2% $81.59 5.0% $67.42 5.9% $232.47 ‐1.0%04 $234,431,679 1.8% $84.47 3.5% $70.07 3.9% $230.93 ‐0.7%05 $255,789,910 9.1% $93.73 11.0% $77.66 10.8% $226.96 ‐1.7%06 $254,467,130 ‐0.5% $100.79 7.5% $84.47 8.8% $234.35 3.3%07 $254,466,527 0.0% $102.62 1.8% $86.35 2.2% $236.33 0.8%08 $260,581,460 2.4% $108.01 5.2% $90.25 4.5% $250.97 6.2%09 $260,422,500 ‐0.1% $107.44 ‐0.5% $88.20 ‐2.3% $248.15 ‐1.1%10 $263,495,249 1.2% $113.64 5.8% $92.20 4.5% $245.91 ‐0.9% $1,091.4511 $246,884,306 ‐6.3% $117.38 3.3% $94.41 2.4% $251.36 2.2% $1,068.95 ‐2.1%12 $251,220,834 1.8% $123.58 5.3% $98.27 4.1% $269.25 7.1% $1,113.20 4.1%1) Does not include General Admin, DMAP, ATP, Streetcar cost, Intergovernmental Transfers, and Medical Plans‐Retired/Disabled.General-4
Exhibit 5. Fixed Route Financial IndicatorsOperation Percent Operation Percent System Percent SystemFiscal Costs 1 /Boarding Ride Change Costs/Boarding Ride Change Costs 2 /Boarding ride Change Costs/Boarding RideYear (Adj. CPI 12) (Adj. CPI 12)72 $0.40 8.5% $2.15 4.7% $0.50 10.2% $2.7473 $0.38 ‐4.2% $1.98 ‐7.9% $0.49 ‐3.5% $2.5474 $0.40 5.1% $1.91 ‐3.5% $0.52 7.1% $2.5075 $0.50 25.4% $2.16 12.9% $0.66 26.2% $2.8476 $0.62 22.6% $2.47 14.5% $0.73 10.6% $2.9377 $0.69 12.1% $2.62 6.0% $0.81 11.6% $3.0978 $0.75 8.2% $2.66 1.4% $0.88 7.8% $3.1279 $0.84 13.0% $2.74 3.3% $1.00 14.2% $3.2680 $0.85 0.3% $2.43 ‐11.6% $1.02 2.2% $2.9481 $1.05 23.8% $2.69 11.0% $1.22 18.8% $3.1382 $1.17 11.3% $2.76 2.7% $1.38 13.8% $3.2883 $1.17 0.2% $2.66 ‐3.9% $1.42 2.4% $3.2284 $1.23 5.0% $2.71 1.9% $1.47 4.0% $3.2685 $1.26 2.9% $2.69 ‐0.8% $1.48 0.8% $3.1686 $1.29 2.5% $2.68 ‐0.1% $1.50 1.3% $3.1287 $1.22 ‐5.6% $2.49 ‐7.4% $1.44 ‐4.6% $2.9288 $1.34 10.0% $2.63 5.7% $1.59 10.9% $3.1189 $1.36 1.7% $2.55 ‐2.8% $1.63 2.6% $3.0590 $1.35 ‐1.2% $2.41 ‐5.6% $1.65 1.2% $2.9591 $1.33 ‐1.1% $2.26 ‐6.1% $1.62 ‐1.6% $2.7692 $1.37 3.0% $2.26 0.0% $1.69 4.3% $2.7993 $1.49 8.7% $2.39 5.5% $1.88 11.0% $3.0194 $1.54 2.8% $2.40 0.3% $1.94 3.0% $3.0395 $1.62 5.8% $2.46 2.8% $2.07 6.6% $3.1496 $1.61 ‐0.9% $2.38 ‐3.5% $2.02 ‐2.1% $2.9997 $1.64 1.7% $2.35 ‐1.1% $2.15 6.4% $3.0998 $1.65 1.2% $2.34 ‐0.4% $2.21 2.6% $3.1299 $1.85 12.1% $2.58 10.3% $2.19 ‐0.9% $3.0500 $1.96 5.5% $2.64 2.4% $2.31 5.4% $3.1201 $1.97 0.4% $2.57 ‐2.9% $2.32 0.5% $3.0302 $1.96 ‐0.4% $2.52 ‐1.9% $2.37 2.0% $3.0503 $2.06 5.2% $2.59 2.9% $2.46 4.1% $3.1004 $2.09 1.3% $2.57 ‐0.7% $2.50 1.6% $3.0905 $2.23 6.8% $2.67 3.7% $2.65 5.8% $3.1706 $2.31 3.5% $2.66 ‐0.4% $2.75 3.9% $3.1707 $2.34 1.2% $2.63 ‐1.2% $2.79 1.3% $3.1308 $2.43 4.1% $2.63 0.1% $2.91 4.3% $3.1409 $2.40 ‐1.2% $2.57 ‐2.4% $3.07 5.5% $3.2810 $2.51 4.6% $2.65 3.3% $3.25 6.0% $3.4311 $2.39 ‐4.8% $2.47 ‐6.9% $3.15 ‐3.0% $3.2612 $2.46 2.7% $2.46 ‐0.5% $3.25 3.2% $3.251) Does not includes G&A, ATP, DMAP, Streetcar, Intergovernmental Transfers costs and Medical Plans‐Retired/Disabled2) Does not includes ATP, DMAP, Streetcar, and Intergorvernmental Transfers costs.General-5
Exhibit 6. LIFT Revenue, Ridership, and Service*Fiscal LIFT and Cab Percent LIFT and Cab Percent LIFT and Cab Percent LIFT and Cab Operating Percent LIFT and Cab PercentYear Vehicle Hours Change Ridership Change Operating Costs Change Costs per Ride Change Revenue Change80818283848586878889909192 150,474 400,963 $5,639,847 $14.07 $78,41593 180,569 20.00% 415,814 3.70% $6,391,020 13.32% $15.37 9.27% $81,751 4.25%94 210,003 16.30% 462,053 11.12% $7,322,590 14.58% $15.85 3.11% $83,526 2.17%95 236,986 12.85% 501,894 8.62% $8,486,412 15.89% $16.91 6.69% $125,322 50.04%96 274,201 15.70% 553,874 10.36% $8,778,547 3.44% $15.85 ‐6.27% $141,085 12.58%97 308,798 12.62% 613,755 10.81% $9,655,316 9.99% $15.73 ‐0.74% $215,607 52.82%98 335,754 8.73% 649,996 5.90% $11,050,808 14.45% $17.00 8.07% $272,025 26.17%99 366,902 9.28% 680,374 4.67% $11,913,345 7.81% $17.51 2.99% $380,257 39.79%00 397,216 8.26% 735,792 8.15% $15,573,346 30.72% $21.17 20.88% $447,156 17.59%01 422,812 6.44% 781,956 6.27% $14,979,168 ‐3.82% $19.16 ‐9.49% $541,761 21.16%02 456,389 7.94% 845,496 8.13% $16,481,644 10.03% $19.49 1.76% $564,327 4.17%03 485,659 6.41% 918,948 8.69% $17,797,497 7.98% $19.37 ‐0.65% $653,846 15.86%04 513,625 5.76% 958,248 4.28% $21,395,262 20.22% $22.33 15.28% $686,825 5.04%05 554,507 7.96% 1,026,156 7.09% $24,050,336 12.41% $23.44 4.97% $747,073 8.77%06 578,184 4.27% 1,050,144 2.34% $26,236,840 9.09% $24.98 6.60% $971,326 30.02%07 601,674 4.06% 1,084,056 3.23% $28,257,625 7.70% $26.07 4.33% $1,090,835 12.30%08 623,150 3.57% 1,122,036 3.50% $30,890,457 9.32% $27.53 5.62% $1,171,184 7.37%09 619,204 ‐0.63% 1,088,446 ‐2.99% $31,020,152 0.42% $28.50 3.52% $1,289,801 10.13%10 593,030 ‐4.23% 1,072,704 ‐1.45% $30,700,651 ‐1.03% $28.62 0.42% $1,314,673 1.93%11 582,804 ‐1.72% 1,063,942 ‐0.82% $30,887,658 0.61% $29.03 1.44% $1,360,396 3.48%12 577,709 ‐0.87% 1,062,874 ‐0.10% $31,744,160 2.77% $29.87 2.88% $1,652,790 21.49%* Service provided prior to 1992 not included.General-6
Exhibit 7. Local Economic TrendsFiscal Tri‐County Percent Tri‐County Percent Tri‐County Avg Pay Wage Tri‐County Property Value Percent Private Tri‐County PercentYear Population Change Employment 1 Change (Earn/Employee) Inflation Real Market Value (RMV) Change Payroll 1 Change72 916,700 1.4% 306,931 4.4% $8,263 6.2% $7,504,891,116 $2,536,279,969 10.9%73 924,100 0.8% 325,963 6.2% $8,817 6.7% $8,313,206,506 10.8% $2,874,079,275 13.3%74 931,200 0.8% 333,393 2.3% $9,572 8.6% $9,196,563,014 10.6% $3,191,334,388 11.0%75 941,700 1.1% 328,245 ‐1.5% $10,256 7.1% $10,205,290,497 11.0% $3,366,613,990 5.5%76 954,800 1.4% 341,909 4.2% $11,111 8.3% $11,419,557,678 11.9% $3,798,781,214 12.8%77 968,200 1.4% 362,973 6.2% $11,859 6.7% $12,612,056,645 10.4% $4,304,633,028 13.3%78 1,013,050 4.6% 398,591 9.8% $12,791 7.9% $14,027,212,577 11.2% $5,098,305,257 18.4%79 1,033,550 2.0% 422,956 6.1% $13,959 9.1% $15,897,003,000 13.3% $5,904,152,731 15.8%80 1,053,100 1.9% 425,451 0.6% $15,302 9.6% $18,620,927,000 17.1% $6,510,203,094 10.3%81 1,062,000 0.8% 415,451 ‐2.4% $16,488 7.8% $23,637,223,000 26.9% $6,850,078,234 5.2%82 1,069,300 0.7% 392,771 ‐5.5% $17,413 5.6% $26,136,442,000 10.6% $6,839,449,188 ‐0.2%83 1,057,900 ‐1.1% 390,499 ‐0.6% $18,001 3.4% $28,624,740,000 9.5% $7,029,388,727 2.8%84 1,068,800 1.0% 411,798 5.5% $18,687 3.8% $30,559,105,000 6.8% $7,695,130,126 9.5%85 1,078,000 0.9% 422,852 2.7% $19,193 2.7% $32,953,204,000 7.8% $8,115,896,617 5.5%86 1,087,500 0.9% 434,908 2.9% $19,876 3.6% $34,835,587,000 5.7% $8,644,381,696 6.5%87 1,097,100 0.9% 450,699 3.6% $20,541 3.3% $36,354,973,000 4.4% $9,258,031,450 7.1%88 1,119,700 2.1% 479,317 6.3% $21,469 4.5% $36,811,010,000 1.3% $10,290,273,686 11.1%89 1,141,500 1.9% 506,533 5.7% $22,301 3.9% $37,535,437,000 2.0% $11,296,147,453 9.8%90 1,183,000 3.6% 524,279 3.5% $23,642 6.0% $38,864,890,000 3.5% $12,394,797,852 9.7%91 1,217,560 2.9% 523,498 ‐0.1% $24,815 5.0% $42,338,116,000 8.9% $12,990,643,800 4.8%92 1,247,610 2.5% 528,286 0.9% $26,310 6.0% $50,366,176,000 19.0% $13,899,105,282 7.0%93 1,277,820 2.4% 547,625 3.7% $26,968 2.5% $54,907,907,000 9.0% $14,768,176,686 6.3%94 1,302,460 1.9% 574,868 5.0% $27,809 3.1% $59,984,969,000 9.2% $15,986,609,610 8.3%95 1,329,090 2.0% 605,542 5.3% $29,200 5.0% $67,435,101,000 12.4% $17,681,895,017 10.6%96 1,360,530 2.4% 625,313 3.3% $30,965 6.0% $76,091,671,000 12.8% $19,362,980,399 9.5%97 1,387,590 2.0% 658,099 5.2% $32,752 5.8% $86,216,900,000 13.3% $21,553,852,346 11.3%98 1,409,930 1.6% 668,091 1.5% $34,140 4.2% $96,630,942,000 12.1% $22,808,631,870 5.8%99 1,430,650 1.5% 675,109 1.1% $35,939 5.3% $106,703,310,000 10.4% $24,262,566,598 6.4%00 1,451,650 1.5% 691,551 2.4% $39,169 9.0% $115,941,283,000 8.7% $27,087,525,558 11.6%01 1,467,300 1.1% 685,125 ‐0.9% $39,217 0.1% $124,350,639,000 7.3% $26,868,806,752 ‐0.8%02 1,484,150 1.1% 675,208 ‐1.4% $38,856 ‐0.9% $134,835,692,000 8.4% $26,236,081,103 ‐2.4%03 1,503,900 1.3% 662,175 ‐1.9% $39,216 0.9% $140,814,040,000 4.4% $25,967,644,770 ‐1.0%04 1,522,400 1.2% 657,585 ‐0.7% $40,887 4.3% $151,236,678,000 7.4% $26,886,371,724 3.5%05 1,543,910 1.4% 678,527 3.2% $42,023 2.8% $160,154,351,000 5.9% $28,514,060,498 6.1%06 1,569,170 1.6% 704,116 3.8% $43,762 4.1% $171,753,908,000 7.2% $30,813,829,928 8.1%07 1,593,370 1.5% 722,409 2.6% $45,092 3.0% $199,710,358,000 16.3% $32,574,995,021 5.7%08 1,614,465 1.3% 729,416 1.0% $46,938 4.1% $228,449,246,000 14.4% $34,237,622,643 5.1%09 1,631,665 1.1% 696,879 ‐4.5% $46,961 0.0% $229,798,303,000 0.6% $32,725,984,271 ‐4.4%10 1,644,635 0.8% 661,375 ‐5.1% $47,760 1.7% $228,377,751,000 ‐0.6% $31,586,944,751 ‐3.5%11 1,656,775 0.7% 675,633 2.2% $49,968 4.6% $215,824,787,000 ‐5.5% $33,760,095,046 6.9%12 1,672,970 1.0% 695,275 2.9% $52,042 4.1% $203,907,401,000 ‐5.5% $36,183,167,936 7.2%1) Excludes: social services, membership of organization, federal and local governments.General-7
Exhibit 8. Debt and Capital InvestmentFiscal Debt Service Percent Debt Service Percent Capital and PercentYear (Senior Lien)/Capita Change (Senior Lien) Change Operating Projects 1 Change727374757677787980818283 $3.23 $3,416,00084 $3.49 8.0% $3,728,000 9.1%85 $3.58 2.6% $3,859,000 3.5%86 $2.03 ‐43.3% $2,206,000 ‐42.8%87 $2.53 24.7% $2,775,000 25.8%88 $2.25 ‐11.0% $2,522,000 ‐9.1%89 $2.20 ‐2.1% $2,517,000 ‐0.2%90 $2.09 ‐5.2% $2,473,000 ‐1.7%91 $2.14 2.5% $2,610,000 5.5% $18,801,93992 $2.07 ‐3.3% $2,586,000 ‐0.9% $18,390,434 ‐2.2%93 $1.90 ‐8.5% $2,424,000 ‐6.3% $23,499,396 27.8%94 $2.40 26.6% $3,127,000 29.0% $27,258,006 16.0%95 $2.32 ‐3.4% $3,084,000 ‐1.4% $44,485,453 63.2%96 $3.33 43.6% $4,534,000 47.0% $34,362,130 ‐22.8%97 $3.77 13.2% $5,235,000 15.5% $16,660,115 ‐51.5%98 $3.65 ‐3.2% $5,150,000 ‐1.6% $45,786,810 174.8%99 $5.91 61.7% $8,450,000 64.1% $53,210,726 16.2%00 $4.72 ‐20.1% $6,850,000 ‐18.9% $21,380,647 ‐59.8%01 $6.42 36.0% $9,417,000 37.5% $37,185,338 73.9%02 $7.06 10.0% $10,479,000 11.3% $20,221,624 ‐45.6%03 $6.22 ‐11.9% $9,357,000 ‐10.7% $33,139,524 63.9%04 $6.82 9.7% $10,389,000 11.0% $14,912,151 ‐55.0%05 $9.86 44.5% $15,228,859 46.6% $6,305,572 ‐57.7%06 $8.45 ‐14.4% $13,254,132 ‐13.0% $25,516,713 304.7%07 $8.47 0.2% $13,489,360 1.8% $9,917,641 ‐61.1%08 $8.03 ‐5.2% $12,960,050 ‐3.9% $14,294,793 44.1%09 $7.94 ‐1.1% $12,947,650 ‐0.1% $35,353,851 147.3%10 $8.32 4.8% $13,682,137 5.7% $37,178,882 5.2%11 $9.90 19.0% $16,402,664 19.9% $37,179,659 0.0%12 $9.26 ‐6.4% $15,499,620 ‐5.5% $30,950,289 ‐16.8%1) Excludes Rail, and Construction Projects.General-8
Local Economic TrendsTri‐County Population and EmploymentMillions2.01.61.20.80.40.0FY72 FY76 FY80 FY84 FY88 FY92 FY96 FY00 FY04 FY08 FY12Population Employment$65,000Tri‐County Average Yearly Earnings$55,000$45,000$35,000$25,000$15,000$5,000FY72 FY76 FY80 FY84 FY88 FY92 FY96 FY00 FY04 FY08 FY12Millions$40,000$30,000Tri‐County Private Payrolls$20,000$10,000$0FY72 FY76 FY80 FY84 FY88 FY92 FY96 FY00 FY04 FY08 FY12General-9
RidershipMillions12090Fixed Route Boarding Rides60300FY72 FY76 FY80 FY84 FY88 FY92 FY96 FY00 FY04 FY08 FY12120Fixed Route Boarding Rides per Capita9060300FY72 FY76 FY80 FY84 FY88 FY92 FY96 FY00 FY04 FY08 FY12Millions1.61.2LIFT and Cab Boarding Rides0.80.40.0FY92 FY94 FY96 FY98 FY00 FY02 FY04 FY06 FY08 FY10 FY12General-10
ServiceMillions5.04.0Total Fixed Route Service Hours in Bus Equivalents and TotalFixed Route Service Hours3.02.01.00.0FY72 FY76 FY80 FY84 FY88 FY92 FY96 FY00 FY04 FY08 FY12Fixed Route Service Hrs in Bus EquivalentFixed Route Service Hours800,000LIFT and Cab Service Vehicle Hours650,000500,000350,000200,00050,000FY92 FY94 FY96 FY98 FY00 FY02 FY04 FY06 FY08 FY10 FY12General-11
ExpenseMillions$300$250$200$150$100$500.2%1.1%Fixed Route Operations Cost2.6%(5.3%)(4.9%)(1.7%)2.8%1.5%0.1%0.3%3.9%5.6%3.7%6.3%0.8%3.4%2.8%22%9%1.5%2.3%3.2%1.8%9.1%(0.5%)0%2.4%(0.1%)1.2%(6.3%)1.8%Millions$35$30$25$20$15$10$5LIFT and Cab Operations Costs8%9%12%20%31% (4%) 10% 8%15% 16% 3% 10% 14% 8%9% 0.4% (1%) 0.6% 3%$0FY82 FY85 FY88 FY91 FY94 FY97 FY00 FY03 FY06 FY09 FY12$0FY94 FY96 FY98 FY00 FY02 FY04 FY06 FY08 FY10 FY12$3.0Fixed Route Operations Cost per Ride$35.0LIFT and Cab Operations Costs per Ride$2.5$2.0$1.511%0.2%5%3%3%(6%)10%2%(1%)%(1%)3%9%3%6%1%)6(12%1%212%6%0.4%(0.4%)5%1%7%4%1%4%(1%)5%(5%)3%$30.0$25.0$20.00$15.03% 7% (6%) (0.7%)8% 3% (9%) 2% (1%)21%(9%) 2% (1%)15% 5% 7% 4% 6% 4% 0.4% 1%3%$1.0$10.0$0.5$5.0$0.0FY82 FY85 FY88 FY91 FY94 FY97 FY00 FY03 FY06 FY09 FY12$0.0FY94 FY97 FY00 FY03 FY06 FY09 FY12General-12
RevenueMillions$300$250Total Payroll Tax Revenues(Includes Payroll, Self‐Employment, and State‐In‐Lieu)Millions$120$100Fixed Route Passenger Revenue$200$80$150$60$100$40$50$20$0FY84 FY88 FY92 FY96 FY00 FY04 FY08 FY12$0FY82 FY85 FY88 FY91 FY94 FY97 FY00 FY03 FY06 FY09 FY12$200Employer Tax per Capita40.0%Fixed Route Fare Recovery Ratio$15030.0%$10020.0%$5010.0%$0FY82 FY85 FY88 FY91 FY94 FY97 FY00 FY03 FY06 FY09 FY120.0%FY82 FY85 FY88 FY91 FY94 FY97 FY00 FY03 FY06 FY09 FY12Millions$1.8$1.5LIFT/Cab Passenger Revenue6.0%4.5%LIFT/Cab Fare Recovery Ratio$1.2$0.93.0%$0.61.5%$0.3$0.0FY92 FY94 FY96 FY98 FY00 FY02 FY04 FY06 FY08 FY10 FY120.0%FY92 FY94 FY96 FY98 FY00 FY02 FY04 FY06 FY08 FY10 FY12General-13
[This Page Left Intentionally Blank]General‐14
<strong>Approved</strong> <strong>Budget</strong>2013—2014Tri-County Metropolitan Transportation District of Oregon