caldwell county regional water and wastewater planning study
caldwell county regional water and wastewater planning study
caldwell county regional water and wastewater planning study

Create successful ePaper yourself
Turn your PDF publications into a flip-book with our unique Google optimized e-Paper software.
CALDWELL COUNTY REGIONAL WATERAND WASTEWATER PLANNING STUDYPrepared forGUADALUPE-BLANCO RIVER AUTHORITYJanuary 2010C O N S U L T I N G E N G I N E E R S7 5 5 0 I H 1 0 W E S T , S U I T E 3 0 0S A N A N T O N I O , T E X A S 7 8 2 2 9T e x a s P . E . F i r m R e g i s t r a t i o n N o . F - 9 2 9P r o j e c t N o . 0 9 7 2 . 0 0 0 . 0 0 0
C O N S U L T I N G E N G I N E E R STABLE OF CONTENTSEXECUTIVE SUMMARY …………………………………………………SECTION 1 INTRODUCTION1.1 Background ………………………………………………..…1.2 Purpose <strong>and</strong> Scope ……….……….……………………….…1.3 Project Task ……..…………………………………………..1.4 Participants <strong>and</strong> Sponsors ……………………………………...SECTION 2 CALDWELL COUNTY CHARACTERISTICS2.1 City Limits <strong>and</strong> ETJ Boundaries ………….………………..…2.2 L<strong>and</strong> Use …..……………………………………………….…2.3 Watersheds ……….……………………………………………2.4 Certificates of Convenience <strong>and</strong> Necessity (CCN) ……………2.4.1 Water CCN Utilities …………………………………...2.4.2 Waste<strong>water</strong> CCN Utilities ……………………………..2.5 Climate ………………………………………………………..2.6 Topography ……………………………………………………2.7 Transmission System ………………………………………….2.8 Impervious Cover ……………………………………………..SECTION 3 DATA COLLECTION3.1 General …..…………………………………………………..3.2 Survey ……………………………………………………….3.3 Regional Coordination ……………………………………….SECTION 4 GROUNDWATER4.1 Ground<strong>water</strong> Sources ………….……………………………..4.1.1 Leona Formation ……………………………………..4.1.2 Wilcox Formation ……………………………………4.1.3 Carrizo Formation ……………………………………4.1.4 Recklaw Formation ………………………………….4.1.5 Queen City S<strong>and</strong>s Outcrop …………………………….4.2 Ground<strong>water</strong> Quality ………….……………………………..4.3 Ground<strong>water</strong> Conservation Districts ……..……….……………4.3.1 Plum Creek Conservation District (PCCD) ….………..4.3.2 Gonzales County Underground Water ConservationDistrict (GCUWCD) ………………………………...SECTION 5 SURFACE WATER5.1 General …..…………………………………………………..5.2 Surface Water Supply Sources …………..…………………..5.2.1 Guadalupe River Basin ………………………………PageES-11-11-31-41-52-12-32-32-72-72-72-102-122-122-123-13-13-34-14-14-34-34-54-54-54-74-74-115-15-15-1Klotz Associates Project No. 0972.000.000January 2010TOC-1Caldwell County Regional Water <strong>and</strong> Waste<strong>water</strong> Planning StudyFinal Report
C O N S U L T I N G E N G I N E E R STABLE OF CONTENTS CONTINUEDSECTION 9 WASTEWATER FLOWS9.1 General …………………………………………………………9.2 Waste<strong>water</strong> Flow …………..……….......................................9.3 Waste<strong>water</strong> Loads ……………………………………………SECTION 10 WATER QUALITY10.1 General ….…………………………………………………….10.2 City Ordinances ………………………………………………10.3 United States Environmental Protection Agency (USEPA) …..10.3.1 The National Pollutant Discharge Elimination System(NPDES) ………………………………………………10.4 Texas Commission on Environmental Quality (TCEQ) ………10.4.1 The Texas 303(d) List …………………………………10.4.2 Texas Pollutant Discharge Elimination System (TPDES)10.4.3 Source Water Protection ……………………………..10.5 Total Maximum Daily Loads (TMDL) Program ……………..10.6 Plum Creek Watershed Protection Plan …….………………..10.6.1 E.coli Potential ……………………………………….10.7 Seasonal Loading Impacts ………..…………………………..SECTION 11 WATER SUPPLY OPTIONS11.1 Regional Water Plans …………………………………………11.1.1 GBRA Mid-Basin Project ………………………………11.1.2 Hays Caldwell Public Utility Agency Supply Project(HCPUA) …………………………………………….11.1.3 Lower Guadalupe Water Supply Project for GBRANeeds ………………………………………………….11.1.4 Lockhart Reservoir ……………………………………11.1.5 Recycled Water Programs …………………………….11.1.6 Surface Water Rights ………………………………….11.1.7 Local Carrizo …………………………………………..11.1.8 Local Storage …………………………………………..11.1.9 The Simsboro Aquifer …………………………………11.1.10 Weather Modification ………………………………11.1.11 Rain<strong>water</strong> Harvesting ………………………………...11.1.12 Water Conservation Strategy ………………………...11.1.13 Desalination …………………………………………..11.2 Conclusions ………….………………………………………..SECTION 12 REGIONAL WATER PLANNING12.1 General ……………………………. ………………………….12.2 Water Supply Sources ...…………………………...………......Page9-19-19-310-110-110-210-210-210-310-310-410-410-410-610-611-111-311-411-611-611-611-711-711-811-1011-1011-1111-1111-1211-1212-112-2Klotz Associates Project No. 0972.000.000January 2010TOC-3Caldwell County Regional Water <strong>and</strong> Waste<strong>water</strong> Planning StudyFinal Report
C O N S U L T I N G E N G I N E E R STABLE OF CONTENTS CONTINUED12.3 Conceptual Planning …..………………………………………12.3.1 Source Development ………………………………….12.3.2 Distribution ……………………………………………12.4 Water System Cost Estimates …………………………………SECTION 13 REGIONAL WASTEWATER PLANNING13.1 Introduction ………………………..…………………………..13.2 Existing Waste<strong>water</strong> Collection Systems ………………………13.3 Waste<strong>water</strong> System Planning ………………………………….13.4 Waste<strong>water</strong> Collection System Service Areas …………………13.5 Waste<strong>water</strong> Collection System Options ……………………….13.5.1 On-Site Sewage Facilities (OSSF)/ Septic Systems …….13.5.2 Regional Treatment Facilities ………………………….13.5.3 Decentralized Treatment Facilities …………………….13.5.4 Package Treatment Facilities ………………………….13.6 Proposed Waste<strong>water</strong> Collection Facilities ……………………13.6.1 Option 1 – Regional Facilities …………………………13.6.2 Option 2 – Decentralized/ Package Treatment Systems13.6.3 Option 3 – Combined Facilities ……………………….13.7 Proposed Regional Waste<strong>water</strong> Facilities ……………………..SECTION 14 REGIONAL WATER QUALITY PROTECTION PLAN14.1 Introduction ………………………………………………...….14.2 Caldwell County Watersheds …….……………………………14.3 Water Quality Concerns <strong>and</strong> Sources of Impairment …….……14.4 Water Quality St<strong>and</strong>ards ………………………………………14.5 Impairment Locations ………………………………………….14.6 Recommended Load Reductions ………………………………14.7 Proposed Management Measures ……………………………..14.7.1 Urban Storm<strong>water</strong> Management Measures ……………14.7.2 Water Quality Development Ordinances <strong>and</strong> Policy ….14.8 Structural BMPs for Discharges from Developed L<strong>and</strong> ………14.8.1 Infiltration Systems …………………………………….14.8.2 Detention Sedimentation Basins ……………………….14.8.3 Vegetative Filter Strips ………………………………..14.8.4 Vegetative Swales ……………………………………..14.8.5 Riparian Buffers ………………………………………14.8.6 Rain Gardens ………………………………………….14.9 Agricultural Best Management Practices ……………………..14.10 Public Education/ Outreach ….………………………… ……Page12-412-412-712-913-113-113-313-313-613-613-713-713-813-1013-1113-1113-1213-1214-114-114-214-314-514-614-614-714-814-914-914-914-1014-1014-1014-1014-1114-13Klotz Associates Project No. 0972.000.000January 2010TOC-4Caldwell County Regional Water <strong>and</strong> Waste<strong>water</strong> Planning StudyFinal Report
C O N S U L T I N G E N G I N E E R STABLE OF CONTENTS CONTINUED14.11 Municipal Practices <strong>and</strong> Good Housekeeping ……………………….14.12 Implementation Recommendations for the CCRWQPP …………….14.12.1 Point Discharge Load Reductions …………………………14.12.2 Storm<strong>water</strong> Filter Strips Along Streams ………………….14.12.3 Water Quality Remediation Associated with ImperviousCover …………………………………………………….14.12.4 OSSF Annual Inspection <strong>and</strong> Certification ……………..SECTION 15 REGIONAL WATER QUALITY IMPLEMENTATION15.1 General ………………………………………………………..15.2 Storm<strong>water</strong> Management Implementation ……………………15.3 Development of Ordinances …………………………………..15.4 Regional Agreement …………………………………………..15.5 Funding …………………………………………………………Page14-1314-1414-1414-2014-2114-2215-115-115-315-315-3SECTION 16 SUMMARY OF RECOMMENDATIONS FOR WATERAND WASTEWATER FACILITIES16.1 Introduction ………………………..…………………………..16.2 Recommended Regional Water Supply Facilities ……………16.3 Recommended Regional Waste<strong>water</strong> Treatment Facilities ….16-116-116-4Klotz Associates Project No. 0972.000.000January 2010TOC-5Caldwell County Regional Water <strong>and</strong> Waste<strong>water</strong> Planning StudyFinal Report
C O N S U L T I N G E N G I N E E R STABLESTable 2-1Table 4-1Table 4-2Table 4-3Table 6-1Table 6-2Table 7-1Table 7-2Table 7-3Table 7-4Table 8-1Table 8-2Table 8-3Table 8-4Table 8-5Table 8-6Table 8-7Table 8-8Table 8-9Table 9-1Table 9-2Table 9-3Table 9-4Table 9-5Table 9-6Table 10-1Lockhart, Texas Monthly Average Temperatures <strong>and</strong> PrecipitationCaldwell County StratigraphyPlum Creek Conservation District Ground<strong>water</strong> PermitsPCCD Classification, Spacing, <strong>and</strong> Production ProvisionsPopulation Projection EstimatesPlanning Study Population ProjectionsWater CCN UtilitiesTCEQ Water CCN Database InventoryWaste<strong>water</strong> CCNTCEQ Permitted Waste<strong>water</strong> Treatment FacilitiesCaldwell County – TWDB Historical Water Use Summary2006 Region L – Caldwell County Water Dem<strong>and</strong> Projections2006 Region L – Caldwell County Municipal Water Dem<strong>and</strong>s inAcre-Feet2006 Region L – Caldwell County Water User Group (WUG)Population ProjectionsTWDB – Water User Group Population PercentagesTSDC Population Scenario 1.0 - ModifiedDeveloped Water User Group Population Projections for CaldwellCountyMunicipal Average – Yearly Water Dem<strong>and</strong>sMunicipal Average – Yearly Water Dem<strong>and</strong>s (Acft/yr)Waste<strong>water</strong> ConnectionsWaste<strong>water</strong> Peak Day Flow FactorsWaste<strong>water</strong> Return RateCaldwell County Projected Waste<strong>water</strong> FlowsCaldwell County Projected Waste<strong>water</strong> Loads, (lbs/day)Caldwell County Projected Waste<strong>water</strong> Loads, (lbs/year)Potential Pollution SourcesKlotz Associates Project No. 0972.000.000January 2010TOC-6Caldwell County Regional Water <strong>and</strong> Waste<strong>water</strong> Planning StudyFinal Report
C O N S U L T I N G E N G I N E E R STABLES CONTINUEDTable 10-2Table 10-3Table 10-4Table 12-1Table 12-2Table 12-3Table 12-4Table 12-5Table 13-1Table 13-2Table 13-3Table 14-1Table 14-2Table 14-3Table 14-4Table 14-5Table 14-6Table 14-7Table 14-8Table 14-9Estimated Loadings from Lockhart Monitoring StationEstimated Loadings from Luling Monitoring StationEstimated Loadings from Uhl<strong>and</strong> Monitoring StationCaldwell County 2006 SCTRWP Projected ShortagesCaldwell County Water SuppliesTWDB – County Water Dem<strong>and</strong> Projections Based on RevisedMunicipal Dem<strong>and</strong>sCaldwell County Additional Water NeedProject Cost SummaryCaldwell County On-Site Sewage Facilities (OSSF)Certificates of CompletionService Areas Projected Waste<strong>water</strong> FlowsRegional Waste<strong>water</strong> Collection <strong>and</strong> Treatment Plant CostEstimatesPollution Reduction NeededWaste<strong>water</strong> Treatment Plant Permit ParametersReclaimed Water Quality ParametersAnnual Pollutant Load to Streams for Upgraded ExistingWaste<strong>water</strong> Treatment PlantsAnnual Pollutant Load to Streams for Upgraded ExistingWaste<strong>water</strong> Treatment Plants with 50 Percent Reuse of ReclaimedWaterComparison of Future Changes to Annual Pollutant Load toStreamsVegetated Filter Strip Width RequirementsImpervious Cover Filtration RequirementsFrequency of OSSF Inspection <strong>and</strong> Recertification ProgramKlotz Associates Project No. 0972.000.000January 2010TOC-7Caldwell County Regional Water <strong>and</strong> Waste<strong>water</strong> Planning StudyFinal Report
C O N S U L T I N G E N G I N E E R SEXHIBITSExhibit 1-1Exhibit 2-1Exhibit 2-2Exhibit 2-3Exhibit 2-4Exhibit 2-5Exhibit 2-6Exhibit 2-7Exhibit 2-8Exhibit 4-1Exhibit 4-2Exhibit 4-3Exhibit 4-4Exhibit 5-1Exhibit 5-2Exhibit 7-1Exhibit 7-2Exhibit 11-1Exhibit 11-2Exhibit 12-1Exhibit 12-2Exhibit 12-3Exhibit 13-1Exhibit 13-2Exhibit 13-3Exhibit 13-4Exhibit 14-1Caldwell County Location MapLocal GovernmentsL<strong>and</strong> Use MapWatershed MapWater CCN Utility MapWaste<strong>water</strong> CCN Utility MapElevation Range MapApproximate Transmission Line LocationsImpervious CoverSurface GeologyThickness GeologyTexas Ground<strong>water</strong> Conservation DistrictsGround<strong>water</strong> Conservation DistrictsTexas Precipitation MapRiver Basin BoundaryWater Production FacilitiesWaste<strong>water</strong> Treatment FacilitiesSouth Central Texas Region LPotential ASR LocationsRegional Water DistributionWater Source LocationsSCTRWP Proposed ProjectsWaste<strong>water</strong> Planning AreasRegional Facility LocationsDecentralized SystemsRecommended Regional Waste<strong>water</strong> FacilitiesTotal Average Daily Potential E.coli LoadsKlotz Associates Project No. 0972.000.000January 2010TOC-8Caldwell County Regional Water <strong>and</strong> Waste<strong>water</strong> Planning StudyFinal Report
C O N S U L T I N G E N G I N E E R SEXHIBITS CONTINUEDExhibit 16-1Exhibit 16-2Recommended Regional Water FacilitiesRecommended Regional Waste<strong>water</strong> FacilitiesKlotz Associates Project No. 0972.000.000January 2010TOC-9Caldwell County Regional Water <strong>and</strong> Waste<strong>water</strong> Planning StudyFinal Report
C O N S U L T I N G E N G I N E E R SGRAPHSGraph 2-1Graph 2-2Graph 5-1Graph 5-2Graph 5-3Graph 6-1Graph 6-2Graph 6-3Graph 6-4Graph 8-1Graph 8-2Graph 8-3Graph 8-4Graph 13-1Lockhart, Texas Monthly Average TemperaturesLockhart, Texas Monthly Average PrecipitationTWDB - Caldwell County Total Surface Water Use SummaryTWDB - Caldwell County Historic Water Use Summary by RiverDrainage BasinCaldwell County Yearly Surface Water Use PercentagesTWDB Population Projections for Caldwell CountyCaldwell County Population by DecadeTexas State Data Center Population Scenarios for Caldwell CountyCaldwell County Population Projection ComparisonCaldwell County Historic Water UseCaldwell County Water Dem<strong>and</strong>s by Use CategoryCaldwell County Survey Results of Per Capita ValuesCaldwell County Yearly Water Dem<strong>and</strong>s with 10% WaterConservationCaldwell County OSSF Certificates of CompletionKlotz Associates Project No. 0972.000.000January 2010TOC-10Caldwell County Regional Water <strong>and</strong> Waste<strong>water</strong> Planning StudyFinal Report
C O N S U L T I N G E N G I N E E R SAPPENDICESAppendix AAppendix BAppendix CAppendix DAppendix EAppendix FAppendix GAppendix HAppendix IAppendix JAppendix KAppendix LAppendix MAppendix NCaldwell County Utility SurveyStakeholder Sign In SheetsWater Quality St<strong>and</strong>ardsTWDB Ground<strong>water</strong> Quality ReportGround<strong>water</strong> Conservation Districts RulesTWDB Water Use Summary ReportsCaldwell County Water Rights <strong>and</strong> Database DictionaryWater Conservation MeasuresPlum Creek Watershed Protection Plan BMPsPlum Creek Watershed Protection Plan Management Measures <strong>and</strong>Outreach ActivitiesRegional CompactComments on Report <strong>and</strong> Responses to CommentsRegional Water Cost EstimatesTexas Water Development Board Comment Letter RegardingDraft Report <strong>and</strong> Response to CommentsKlotz Associates Project No. 0972.000.000January 2010TOC-11Caldwell County Regional Water <strong>and</strong> Waste<strong>water</strong> Planning StudyFinal Report
C O N S U L T I N G E N G I N E E R SLIST OF ABBREVIATIONSASRBODBMPCCEFNCCWQCSCWACAPCOGCCNEPAERCOTESTETJGBRAGCUWCDGCDGAMGSTHCPUAHBLDCLLCMUDNRCSNPDESOSSFO&MPCCDPUAAquifer Storage <strong>and</strong> RecoveryBiochemical Oxygen Dem<strong>and</strong>best management practicesConsensus Criteria for Environmental Flow NeedsCentral Carrizo-Wilcox, Queen City <strong>and</strong> SpartaClean Water ActCapital Area Council of GovernmentsCertificate of Convenience <strong>and</strong> NecessityEnvironmental Protection AgencyElectric Reliability Council of Texaselevated storage tanksExtra Territorial JurisdictionGuadalupe-Blanco River AuthorityGonzales Ground Water Conservation DistrictGround<strong>water</strong> Conservation DistrictGeneralized Additive Modelsground storage tankHays Caldwell Public Utility AgencyHouse BillLoad Duration CurveLimited Liability CompanyMunicipal Utility DistrictNational Resource Conservation ServiceNational Pollutant Discharge Elimination SystemOn-site sewage facilityOperation <strong>and</strong> MaintenancePlum Creek Conservation DistrictPublic Utility AgencyKlotz Associates Project No. 0972.000.000January 2010TOC-12Caldwell County Regional Water <strong>and</strong> Waste<strong>water</strong> Planning StudyFinal Report
C O N S U L T I N G E N G I N E E R SLIST OF ABBREVIATIONS CONTINUEDSAWSSCTRWPSBSELECTSSLGCSUDTCEQTMDLTxDOTTSDCTSSTWDBUSUSGSUSDAWWTPWWTFWUDSan Antonio Water SystemSouth Central Texas Regional Water PlanSenate BillSpatially Explicit Load Enrichment Calculation ToolSchertz-Seguin Local Government CorporationSpecial Utility DistrictTexas Commission on Environmental QualityTotal Maximum Daily LoadsTexas Department of TransportationTexas State Data CenterTotal Suspended SolidsTexas Water Development BoardUnited StatesUnited States Geologic SurveyUnited States Department of AgricultureWaste<strong>water</strong> Treatment PlantWaste<strong>water</strong> Treatment FacilityWater Utility DistrictUNITS OF MEASUREMENTgpmppmMGDac-ftgpcdmg/lgallons per minuteparts per millionmillion gallons per dayacre – feetgallons per capita per daymilligrams per literKlotz Associates Project No. 0972.000.000January 2010TOC-13Caldwell County Regional Water <strong>and</strong> Waste<strong>water</strong> Planning StudyFinal Report
EXECUTIVE SUMMARYMeeting the challenges of developing, managing, conserving <strong>and</strong> protectingprecious <strong>water</strong> resources requires proactive leadership that underst<strong>and</strong>s theproblems, identifies the solutions <strong>and</strong> empowers implementation. Completion of a<strong>regional</strong> <strong>water</strong> <strong>and</strong> waste<strong>water</strong> <strong>planning</strong> <strong>study</strong> is one of the first steps to meet thechallenges.The <strong>study</strong> examines population projections, projected <strong>water</strong> supply needs,existing <strong>water</strong> resources, proposed <strong>water</strong> plans, <strong>and</strong> proposed cost estimates. The<strong>study</strong> also examines the current availability <strong>and</strong> viability of the proposed projectsin the 2006 South Central Texas Regional Water Plan (Region L Plan) developedunder guidance from the Texas Water Development Board (TWDB) to meet the<strong>water</strong> supply needs of Caldwell County. Potential <strong>regional</strong> <strong>water</strong> <strong>and</strong> waste<strong>water</strong>projects were identified for consideration to meet the needs of the <strong>county</strong>.In addition, management strategies are identified that could be considered forimplementation to reduce potential non-point pollution loads into the surface<strong>water</strong> <strong>and</strong> ground<strong>water</strong> resources of Caldwell CountyCaldwell County, located in South Central Texas, is poised to grow at anincreasing rate with a population estimate of 35,843 in 2008 to over 100,000 bythe year 2040. The addition of over 64,000 citizens to Caldwell County will posenew dem<strong>and</strong>s on local resources for basic services including potable <strong>water</strong> forconsumption. In addition, new strategies will be needed to protect the quality ofsurface <strong>water</strong> <strong>and</strong> ground<strong>water</strong>.These increased dem<strong>and</strong>s are occurring at a time when the availability of surface<strong>water</strong> <strong>and</strong> ground<strong>water</strong> to serve new growth is limited. Surface <strong>water</strong>s in CaldwellCounty have been appropriated <strong>and</strong> only innovative strategies that scalp floodKlotz Associates Project No. 0972.000.000January 2010ES-1Caldwell County Regional Water <strong>and</strong> Waste<strong>water</strong> Planning StudyFinal Report
flows without impacting environmental stream flows can be considered todevelop additional surface <strong>water</strong> supplies. There is no additional “run-of-theriver”surface <strong>water</strong> available for permitting in Caldwell County.Ground<strong>water</strong> that is suitable for use with minimal treatment is available inCaldwell County from the Carrizo-Wilcox Aquifer. Studies completed by thePlum Creek Conservation District (PCCD) estimate that about 23,000 acre-feet(ac-ft) of <strong>water</strong> per year is the sustainable yield from the Carrizo-Wilcox Aquiferfor Caldwell County. However, ground<strong>water</strong> laws, developing ground<strong>water</strong>regulations <strong>and</strong> a limited amount of ground<strong>water</strong> are creating a permitting frenzyas potential users try to secure <strong>water</strong> for their needs. Water suppliers from outsidethe <strong>county</strong> <strong>and</strong> river basin have come to the Carrizo-Wilcox Aquifer in Caldwell<strong>and</strong> Gonzales Counties as a source for inexpensive high quality <strong>water</strong>. There maybe little ground<strong>water</strong> remaining to be permitted for increasing local dem<strong>and</strong>sbecause the <strong>water</strong> has been permitted to others for use out of the <strong>county</strong> or riverbasin. According to PCCD, as of February 2009, 16,514 ac-ft per year ofground<strong>water</strong> withdrawals have been permitted in Caldwell County. Other largepermits are pending.Ground<strong>water</strong> in the Carrizo/Wilcox Aquifer in Gonzales County is also subject tointense permitting pressure. Water modeling studies in Gonzales County indicatethat a sustainable yield of about 13,600 ac-ft per year of <strong>water</strong> can be withdrawnon the east side of the <strong>county</strong> with a 100-foot drawdown <strong>and</strong> a sustainable yield ofabout 15,400 ac-ft of <strong>water</strong> can be withdrawn on the western side of the <strong>county</strong>.Permits totals of more than 15,400 ac-ft per year have been applied for on thewestern side of Gonzales County. The Gonzales County Underground WaterConservation District (GCUWCD) is refining its ground<strong>water</strong> management planfor Gonzales County <strong>and</strong> it appears that permits will be granted with terms <strong>and</strong>conditions that curtail use when drawdown limits are reached. Pending permitapplications are for the Hays/Caldwell Public Utility Agency <strong>and</strong> the San AntonioWater System.Klotz Associates Project No. 0972.000.000January 2010ES-2Caldwell County Regional Water <strong>and</strong> Waste<strong>water</strong> Planning StudyFinal Report
The <strong>planning</strong> horizon for this <strong>study</strong> was selected as the period through the year2040. Based on input from the Stakeholders <strong>and</strong> the State Demographer, duringthe approximate 30 year period, the population is projected to increaseapproximately 180% from 35,843 in 2008 to 100,000 in the year 2040. When aper capita dem<strong>and</strong> of 150 gallons per day per person is applied, the yearly dem<strong>and</strong>for municipal <strong>water</strong> will increase from 6,164 ac-ft to 16,803 ac-ft. Addingdem<strong>and</strong>s identified for mining, manufacturing, irrigation <strong>and</strong> livestock indicate atotal current dem<strong>and</strong> of 8,155 ac-ft per year in 2008 increasing to 18,495 ac-ft inthe year 2040.The population <strong>and</strong> <strong>water</strong> dem<strong>and</strong> projections developed <strong>and</strong> adopted for this<strong>study</strong> are higher than the population <strong>and</strong> <strong>water</strong> dem<strong>and</strong> values adopted for the2006 Region L Plan. The 2006 Region L Plan estimated that the year 2040population of Caldwell County would be 83,250 (compared to 100,000 adoptedfor this plan). The 2006 Region L Plan estimated the year 2040 total <strong>water</strong>dem<strong>and</strong> for all uses would be 12,247 acre-feet per year (compared to 18,695 acrefeetdeveloped for this plan). The larger population projections result from ahigher migration rate to the <strong>county</strong> for this plan compared to the Region Lpopulation projections. The larger future <strong>water</strong> dem<strong>and</strong>s result from largerpopulation projections <strong>and</strong> the adoption of larger per capita consumption rates forthis plan than those adopted for the 2006 Region L Plan.Over the <strong>planning</strong> horizon, a total of 8,432 ac-ft of <strong>water</strong> supply must bedeveloped to meet projected <strong>water</strong> needs. Other types of <strong>water</strong> uses willcollectively diminish <strong>and</strong> result in no need for additional <strong>water</strong> to supply mining,manufacturing, livestock or irrigation needs.The proposed <strong>water</strong> management strategies contained in the 2006 South CentralTexas Regional Water Plan were reviewed for applicability to meet the needs ofCaldwell County. The only strategies identified in the 2006 Plan that are stillKlotz Associates Project No. 0972.000.000January 2010ES-3Caldwell County Regional Water <strong>and</strong> Waste<strong>water</strong> Planning StudyFinal Report
viable for Caldwell County are <strong>water</strong> conservation, additional development of theCarrizo/Wilcox, the Hays/Caldwell PUA <strong>and</strong> purchase from other wholesale<strong>water</strong> providers such as GBRA <strong>and</strong> CRWA.Water conservation is a viable option. Public education, <strong>water</strong> use restrictions <strong>and</strong>inverse <strong>water</strong> rates are tools to implement <strong>water</strong> conservation. An aggressive<strong>water</strong> conservation program could reduce municipal <strong>water</strong> consumption from 150gallons per capita per day to as low as 120 gallons per capita per day. The amountconserved would be 3,361 ac-ft on an annual basis <strong>and</strong> the new <strong>water</strong> requiredwould be 5,071 ac-ft per year.Carrizo/Wilcox ground<strong>water</strong> can be developed in southeast Caldwell County or inGonzales County. This is the approach taken by the Hays/ Caldwell PUA.However, uncertainty regarding the long-term availability of this <strong>water</strong> isquestionable as ground<strong>water</strong> conservation districts adopt policies that will grantpermits for all requests for <strong>water</strong> <strong>and</strong> limit future drawdown conditions. A<strong>regional</strong> <strong>water</strong> supply project yielding 8,432 ac-ft of <strong>water</strong> per year could bedeveloped from the Carrizo/Wilcox aquifer. However, the possibility of futurecurtailment exists if ground<strong>water</strong> district rules require reducing consumptionwhen <strong>water</strong> table drawdown limits are reached.Purchase of <strong>water</strong> from wholesale <strong>water</strong> providers is a viable option if there is<strong>water</strong> available. All surface <strong>water</strong> rights are currently appropriated <strong>and</strong> there areno viable strategies in the 2006 Water Plan that bring <strong>water</strong> to Caldwell County.Thus, <strong>regional</strong> development of a new conjunctive use ground<strong>water</strong>/surface <strong>water</strong>project would appear to be a possible solution to meet future needs.A conjunctive use project that combines storing <strong>water</strong> ordinarily lost in excessiveflood flows with ground<strong>water</strong> for firming up the project yield appears to be anoption for developing a <strong>water</strong> supply project to serve a region larger thanCaldwell County. It has been estimated by the Guadalupe-Blanco River AuthorityKlotz Associates Project No. 0972.000.000January 2010ES-4Caldwell County Regional Water <strong>and</strong> Waste<strong>water</strong> Planning StudyFinal Report
that 20,000 ac-ft - 25,000 ac-ft per year could be developed out of a conjunctiveuse project with surface <strong>water</strong> diversions occurring on the Guadalupe River atGonzales (Mid-Basin Project). This <strong>water</strong> could be diverted, treated <strong>and</strong> pipedthrough Caldwell County up to Comal <strong>and</strong> Hays County. The <strong>water</strong> providers inCaldwell, Hays <strong>and</strong> Comal Counties could benefit from this project.The cost of development of <strong>water</strong> from the local Carrizo/Wilcox Aquifer to serveCaldwell County using a <strong>regional</strong> approach is estimated as $34 million includingcollection, treatment <strong>and</strong> transmission to a <strong>regional</strong> distribution point. If a total of8,432 ac-ft of <strong>water</strong> is developed by the project, the cost per ac-ft is estimated as$4,032. The estimated unit cost of treated <strong>water</strong> at the <strong>regional</strong> <strong>water</strong> deliverypoint is estimated as $3.46 per 1,000 gallons.A main distribution system to disperse treated <strong>water</strong> from the <strong>regional</strong> distributionpoint near Lockhart along US Highway 183 <strong>and</strong> State Highway 130 is estimatedas $29 million.Development cost for the Gonzales Mid-Basin Project has not been published butthe total project cost will be spread over a larger annual <strong>water</strong> yield.These <strong>water</strong> supply projects appear to be most reasonable to meet the long termneeds of Caldwell County. Other opportunities may occur in the future butmoving forward with these projects is a reasonable course of action.Waste<strong>water</strong> treatment in Caldwell County is currently accomplished with twocentralized systems <strong>and</strong> numerous on-site sewage facilities (OSSF). As growth<strong>and</strong> densification occurs <strong>and</strong> subdivisions are constructed in the northern part ofthe <strong>county</strong>, the entities providing waste<strong>water</strong> treatment <strong>and</strong> disposal will be facedwith using a centralized, <strong>regional</strong> approach with a limited number of plants or ade-centralized approach with numerous plants each plant having its own operatingKlotz Associates Project No. 0972.000.000January 2010ES-5Caldwell County Regional Water <strong>and</strong> Waste<strong>water</strong> Planning StudyFinal Report
parameters <strong>and</strong> needs. For purposes of this plan, the centralized treatment plantapproach was analyzed with plants located in the Martindale area, the Lockhartarea <strong>and</strong> the Luling area. A fourth plant would be placed in the Peach Creek Basinonce sufficient development has occurred in this area. These plants will provideservice generally within topographic basins <strong>and</strong> be managed by public utilities toensure proper operation <strong>and</strong> maintenance.The total waste<strong>water</strong> flow estimated for 2040 is 10.2 million gallons per day withtotal project development cost of the plants estimated as $39 million. The cost isonly associated with developing the treatment facilities <strong>and</strong> the network forcollecting the sewage is not included in this number.The new waste<strong>water</strong> treatment plants would be permitted <strong>and</strong> constructed toenable reuse of the plant effluent for non-potable purposes. The reuse <strong>water</strong>would offset a portion of the need for development of new <strong>water</strong>. Water reusesystems generally require extensive piping networks to take the <strong>water</strong> to its pointof use. For this reason, it is not cost-effective to retrofit current facilities, butrather incorporate into new systems.Growth often results in degradation of surface <strong>water</strong> quality <strong>and</strong> can result inpollution of ground<strong>water</strong>. Return waste<strong>water</strong> plant discharges to streams c<strong>and</strong>egrade <strong>water</strong> quality. Pollutant wash-off from impervious cover is a largecontributor to increased pollution of streams but recent studies have shown thatrunoff from fields, pastures <strong>and</strong> lawns can add significant non-point pollutantloads. Inefficient <strong>and</strong> failing OSSF systems can add to pollutant loads in streams.The Plum Creek Watershed Protection Plan has identified point-source <strong>and</strong> nonpointpollutant contributors which have impaired Plum Creek.The following measures are recommended for consideration to assist in protecting<strong>water</strong> quality in streams:Klotz Associates Project No. 0972.000.000January 2010ES-6Caldwell County Regional Water <strong>and</strong> Waste<strong>water</strong> Planning StudyFinal Report
• Reuse <strong>water</strong> from treatment plants without discharge to streams• Implement <strong>water</strong> quality protection requirements for new imperviouscover• Review <strong>and</strong> if warranted, revise the OSSF permitting rules for setbacksfrom <strong>water</strong> bodies <strong>and</strong> increase separation distance• Require periodic inspections <strong>and</strong> reports for all OSSF systems• Develop <strong>and</strong> carry out an urban-oriented <strong>water</strong> quality protectioneducation program that targets pollutants normally generated in urbanareas• Develop <strong>and</strong> carry out an agriculture-based <strong>water</strong> quality educationprogram that targets pollutants ordinarily generated in rural areas• Work with leaders in the <strong>county</strong> to make <strong>water</strong> quality protection aneveryday concernThe limited depth of the <strong>study</strong> results in many generalizations <strong>and</strong> assumptions. Someopportunities have been identified for further consideration as additional <strong>planning</strong> <strong>and</strong>implementation work is done.In the course of the <strong>study</strong>, the energy <strong>and</strong> interest of the leaders <strong>and</strong> citizens of CaldwellCounty were clearly identified. Water <strong>and</strong> <strong>water</strong> quality is important to Caldwell County<strong>and</strong> its citizens. Working together as a group, <strong>water</strong> needs can be met <strong>and</strong> long term, costeffectivesolutions can be developed. Lack of <strong>water</strong> should not be the limiting factor thatprevents the citizens of Caldwell County from realizing their potential.Klotz Associates Project No. 0972.000.000January 2010ES-7Caldwell County Regional Water <strong>and</strong> Waste<strong>water</strong> Planning StudyFinal Report
SECTION 1INTRODUCTION1.1 BackgroundCaldwell County, located in South Central Texas, was established by the TexasLegislature in 1848 by partitioning l<strong>and</strong> from Gonzales County. Subsequent l<strong>and</strong>additions to Caldwell County in 1850 from Bastrop <strong>and</strong> Gonzales Countiesresulted in a total area of 545 square miles.Caldwell County, as shown in Exhibit 1-1, is bordered on the northwest by someof the fastest growing counties in the United States. Travis <strong>and</strong> Hays Counties areto the northwest with Guadalupe County on the southwest side. Gonzales Countyis on the southeast side of Caldwell County while Bastrop County is on thenortheast side. Fayette County just touches the eastern corner of Caldwell County.Located adjacent to fast-growing counties <strong>and</strong> with significant growth <strong>and</strong>development pressure from within its own boundaries, Caldwell County willalmost triple its current population within 30 years while the availability of <strong>water</strong>is diminishing. The volume of waste<strong>water</strong> produced in the <strong>county</strong> will grow withthe population <strong>and</strong> new treatment facilities will be required to serve anincreasingly dense population. Without controls, storm<strong>water</strong> discharges willincrease in volume as impervious cover increases <strong>and</strong> <strong>water</strong> quality degradationwill occur with more non-point pollutants washed into streams <strong>and</strong> rivers.Meeting the challenges of developing, managing, conserving <strong>and</strong> protectingprecious <strong>water</strong> resources requires proactive leadership that has the vision <strong>and</strong> willto underst<strong>and</strong> the problems, identify the solutions <strong>and</strong> empower implementation.Completion of a <strong>regional</strong> <strong>water</strong> <strong>and</strong> waste<strong>water</strong> <strong>planning</strong> <strong>study</strong> is one of the firststeps to meet the challenge.Klotz Associates Project No. 0972.000.000January 20101-1Caldwell County Regional Water <strong>and</strong> Waste<strong>water</strong> Planning StudyFinal Report
Klotz Associates Project No. 0972.000.000January 20101-2Caldwell County Regional Water <strong>and</strong> Waste<strong>water</strong> Planning StudyFinal Report
A Grant Application for a Regional Water Supply <strong>and</strong> Waste<strong>water</strong> PlanningStudy for Caldwell County, Texas, was submitted to the Texas WaterDevelopment Board (TWDB) in December 2007 by the Guadalupe-Blanco RiverAuthority (GBRA) <strong>and</strong> Caldwell County. The request for a <strong>study</strong> was influencedby continued development along the Interstate Highway 35 (I-35) corridor <strong>and</strong> theanticipated growth upon completion of State Highway (SH) 130 in 2012. The SH130 corridor will provide easy <strong>and</strong> fast access to both Austin <strong>and</strong> San Antonio,two of the fastest growing cities in Texas. Caldwell County is included in thefive-<strong>county</strong> region that the Austin Chamber of Commerce advertises for living<strong>and</strong> working.Planning was considered important for this region not only to GBRA <strong>and</strong>Caldwell County but also the TWDB. The TWDB agreed that <strong>planning</strong> wasnecessary by participating in the funding of the “Caldwell County Water &Waste<strong>water</strong> Regional Planning Study.” After grant approval in October of 2008,GBRA awarded Klotz Associates, Inc. (Klotz Associates) a contract to provideprofessional services for the Caldwell County Regional Water <strong>and</strong> Waste<strong>water</strong>Planning Study.1.2 Purpose <strong>and</strong> ScopeThe Caldwell County Regional Water <strong>and</strong> Waste<strong>water</strong> Planning Study will serveas a guide <strong>and</strong> living document to assist in the <strong>planning</strong> <strong>and</strong> development of theregion. Regional <strong>planning</strong> is an efficient <strong>and</strong> cost effective way to meet future<strong>water</strong> <strong>and</strong> waste<strong>water</strong> needs. The Regional Water <strong>and</strong> Waste<strong>water</strong> Planning Studyjoined the <strong>county</strong>, cities, towns, <strong>water</strong> supply corporations, ground<strong>water</strong> districts,local departments <strong>and</strong> agencies, governmental entities, environmental groups,planners, developers, <strong>and</strong> other interested individuals together to participate,interact, <strong>and</strong> develop ideas. The <strong>regional</strong> approach for Caldwell County creates asynergy that captures the resources of numerous entities, focuses them onproblems to be mutually solved <strong>and</strong> enables efficient <strong>and</strong> cost-effective solutions.Klotz Associates Project No. 0972.000.000January 20101-3Caldwell County Regional Water <strong>and</strong> Waste<strong>water</strong> Planning StudyFinal Report
The energy spent when communities compete for resources is focused on mutualsolutions for the benefit of all.The <strong>study</strong> examines population projections, projected <strong>water</strong> supply needs,existing <strong>water</strong> resources, proposed <strong>water</strong> plans, <strong>and</strong> proposed cost estimates. The<strong>study</strong> also examined the current availability <strong>and</strong> viability of the proposed projectsin the Region L plan to meet the <strong>water</strong> supply needs of Caldwell County. RegionL is one of the 16 <strong>regional</strong> <strong>water</strong> <strong>planning</strong> groups in Texas.In addition, management strategies were identified that could be considered forimplementation to reduce potential non-point pollution loads into the surface<strong>water</strong> <strong>and</strong> ground<strong>water</strong> resources of Caldwell County1.3 Project TaskThe tasks included in the Caldwell County Regional Water <strong>and</strong> Waste<strong>water</strong>Planning Study were as follows:TaskTitleI. Development of Baseline InformationII.III.IV.Public ParticipationDeveloping Consensus on ObjectivesFormulation of Development ScenariosV. Analyze Water Quality OptionsVI.VII.VIII.IX.Develop Regional Water Supply <strong>and</strong> Quality ProtectionPlanRecommendations for Watershed Management PracticesReportsPublic MeetingsKlotz Associates Project No. 0972.000.000January 20101-4Caldwell County Regional Water <strong>and</strong> Waste<strong>water</strong> Planning StudyFinal Report
1.4 Participants <strong>and</strong> SponsorsThe Caldwell County Regional Water <strong>and</strong> Waste<strong>water</strong> Planning <strong>study</strong> wassponsored by the following entities:Guadalupe Blanco-River AuthorityCaldwell CountyTexas Water Development BoardThe following individuals served as an Advisory Group to assist in guiding the<strong>study</strong> <strong>and</strong> providing feedback as the <strong>study</strong> progressed.Members:The Honorable H.T. Wright, County Judge, Caldwell County, TexasMr. Vance Rodgers, City Manager, City of Lockhart, TexasMr. Bobby Berger, City Manager, City of Luling, TexasMr. Johnie Halliburton, Executive Manager, Plum Creek ConservationDistrictMr. Bob Richards, Project Director, Cooper L<strong>and</strong> DevelopmentMs. Nikki Dictson, Extension Program Specialist, Texas AgriLifeExtension ServiceMr. Paul Pitman, Manager, Polonia Water Supply CorporationMs. Joyce Buckner, Community Representative for Lockhart, BluebonnetElectric CooperativeEx-Officio:Mr. Matt Nelson, Manager, Regional Water Planning, Texas WaterDevelopment BoardMs. Debbie Magin, Director of Water Quality Services, Guadalupe-Blanco River AuthorityThree Stakeholder Meetings were held as an important part of collecting data,receiving input from the community <strong>and</strong> developing solutions for <strong>regional</strong> <strong>water</strong>supply, waste<strong>water</strong> treatment, <strong>and</strong> non-point pollution controls.Klotz Associates Project No. 0972.000.000January 20101-5Caldwell County Regional Water <strong>and</strong> Waste<strong>water</strong> Planning StudyFinal Report
The stakeholder meetings were held on the dates listed below <strong>and</strong> sign-in sheetsare included in Appendix A.Stakeholder Meeting 1: September 25, 2008Stakeholder Meeting 2: January 8, 2009Stakeholder Meeting 3: August 3, 2009 (Public Meeting)GBRA staff provided valuable oversight <strong>and</strong> assistance as the <strong>study</strong> progressed<strong>and</strong> their contribution is hereby acknowledged:Ms. Debbie Magin, Director of Water Quality Services, Guadalupe-Blanco River AuthorityMs. Liz Sedlacek, Administrative Assistant, Guadalupe-Blanco RiverAuthorityKlotz Associates Project No. 0972.000.000January 20101-6Caldwell County Regional Water <strong>and</strong> Waste<strong>water</strong> Planning StudyFinal Report
SECTION 2CALDWELLL COUNTY CHARACTERISTICS2.1 City Limits <strong>and</strong> ETJ BoundariesThe name Caldwell was given to the <strong>county</strong> in recognition of an Indian Fighternamed Matthew Caldwell, who led a group of militia against the Comanches atPlum Creek in 1840. The <strong>county</strong> seat was named for Byrd Lockhart who ownedthe l<strong>and</strong> over which the town of Lockhart would be established. Lockhart wasincorporated in 1852. Luling, the other large city in Caldwell County, wasincorporated in 1884 <strong>and</strong> is a significant center for railroads, cattle, cotton <strong>and</strong> oil.Martindale is an incorporated city within Caldwell County. Mustang Ridge,Niederwald, <strong>and</strong> Uhl<strong>and</strong> are incorporated cities that straddle the Caldwell Countyline with either Hays or Travis Counties.Dale, Fentress, Lytton Springs, McMahan <strong>and</strong> Prairie Lea are some of the largerunincorporated communities in Caldwell County. Exhibit 2-1 illustrates thelocation of the cities <strong>and</strong> more populated communities in Caldwell County.There are numerous other settlements in the County that are recognizedgeographically <strong>and</strong> include Brownsboro, Delhi, Elm Grove, Joilet, Maxwell,McNeil, Mendoza, Pettytown, Reedville, Saint Johns Colony, Seawillow, SodaSprings, Stairtown, Taylorsville, Tilman <strong>and</strong> Watts.Major roadways that cross the <strong>county</strong> include United States (US) Highway 90(east-west), US Highway 183 (north-south), SH 21, SH 80 <strong>and</strong> future SH 130(northeast-southwest). Numerous other state <strong>and</strong> <strong>county</strong> roadways exist in the<strong>county</strong> that will provide easy connection to SH 130 <strong>and</strong> enable easy <strong>and</strong> fasttravel to San Antonio, Austin <strong>and</strong> other destinations along the central Texas “I-35corridor”.Klotz Associates Project No. 0972.000.000January 20102-1Caldwell County Regional Water <strong>and</strong> Waste<strong>water</strong> Planning StudyFinal Report
Klotz Associates Project No. 0972.000.000January 20102-2Caldwell County Regional Water <strong>and</strong> Waste<strong>water</strong> Planning StudyFinal Report
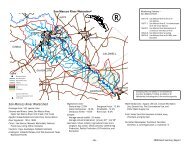
Construction for segments 5 <strong>and</strong> 6 of SH 130 is underway <strong>and</strong> completion isscheduled for the year 2012. Segment 5 will begin in Mustang Ridge <strong>and</strong> continueto north of Lockhart while Segment 6 will pick up at the southern end of Segment5 <strong>and</strong> exit Caldwell County between Martindale <strong>and</strong> Fentress on the way to theintersection of SH 130 with I-10 near the City of Seguin in Guadalupe County.Approximately 40 miles of roadway will be constructed for these segments of SH130.SH 130 will be a four lane divided highway. It will have direct connection tointerchanges <strong>and</strong> provide ramps for access to non-toll lanes. SH 130 will be a tollroad <strong>and</strong> it is anticipated that tolls may remain to fund maintenance <strong>and</strong> futurelocal transportation projects.2.2 L<strong>and</strong> UseCurrent l<strong>and</strong> use within Caldwell County is illustrated by Exhibit 2-2 <strong>and</strong> wasobtained from the United States Department of Agriculture (USDA). L<strong>and</strong> inCaldwell County is mostly undeveloped <strong>and</strong> is used as pasturel<strong>and</strong>, grassl<strong>and</strong>,forestl<strong>and</strong> or cropl<strong>and</strong>. The developed areas are primarily located along USHighway 183, SH 21 <strong>and</strong> SH 80. Current population density is greatest in thenorthwest <strong>and</strong> north central portions of the <strong>county</strong> because of the area’s proximityto San Marcos, Austin <strong>and</strong> the I-35 corridor.The southern <strong>and</strong> southeast portions of the <strong>county</strong>, with the exception of Luling,remain largely rural in character in nature. The oil <strong>and</strong> gas industry has been animportant part of the economy in Caldwell County but its footprint <strong>and</strong> impact onl<strong>and</strong> use is relatively small.2.3 WatershedsL<strong>and</strong> in Caldwell County drains primarily to the Guadalupe River Basin. Regional<strong>water</strong>sheds in the basin include the San Marcos Watershed, Plum Creek2-3Klotz Associates Project No. 0972.000.000Caldwell County Regional Water <strong>and</strong> Waste<strong>water</strong> Planning StudyJanuary 2010Final Report
Klotz Associates Project No. 0972.000.000January 20102-4Caldwell County Regional Water <strong>and</strong> Waste<strong>water</strong> Planning StudyFinal Report
Watershed <strong>and</strong> Peach Creek Watershed. Exhibit 2-3 illustrates the major <strong>water</strong>shedboundaries in the <strong>county</strong>.A 58 square mile area in the northeastern corner of the <strong>county</strong> drains to the ColoradoRiver Basin. The 58 square miles represents about 11 percent of the area of CaldwellCounty with the remaining 487 square miles draining to the Guadalupe River Basin.Plum Creek is the largest <strong>water</strong>shed in Caldwell County. Plum Creek rises in HaysCounty <strong>and</strong> enters Caldwell County near Niederwald. It then flows from north to souththrough the heart of Caldwell County <strong>and</strong> enters the San Marcos River at theCaldwell/Gonzales County line. At its mouth, Plum Creek has a drainage area of 397square miles <strong>and</strong> a stream length of 52 river miles. Approximately 80 percent (319 squaremiles) of the Plum Creek Watershed is in Caldwell County. The 319 square miles of thePlum Creek Watershed in Caldwell County comprises about 59 percent of the total areawithin Caldwell County. Plum Creek is an important surface <strong>water</strong> feature in CaldwellCounty <strong>and</strong> the citizens of the <strong>county</strong> have a vested interest in protecting the character<strong>and</strong> health of this historic <strong>and</strong> highly-valued <strong>water</strong> course.The area within Caldwell County draining to the San Marcos River Watershed is 88square miles or about 16 percent of the <strong>county</strong>. The San Marcos River flows south fromthe San Marcos city limits until it joins the Guadalupe River approximately 75 milesdownstream near Gonzales, Texas. At its confluence with the Guadalupe River, the SanMarcos River Basin has a total drainage area of 522 square miles. The San Marcos Riveris the western boundary of Caldwell County with a length along this boundary of 43stream miles.The Peach Creek Watershed has a total drainage area of 480 square miles at its mouthwith approximately 81 square miles (about 14 percent of the <strong>county</strong>) of the <strong>water</strong>shed inCaldwell County. Peach Creek joins the Guadalupe River near the community of Harmonin Gonzales County.Klotz Associates Project No. 0972.000.000January 20102-5Caldwell County Regional Water <strong>and</strong> Waste<strong>water</strong> Planning StudyFinal Report
Klotz Associates Project No. 0972.000.000January 20102-6Caldwell County Regional Water <strong>and</strong> Waste<strong>water</strong> Planning StudyFinal Report
2.4 Certificates of Convenience <strong>and</strong> Necessity (CCN)In Caldwell County, there are twelve (12) <strong>water</strong> <strong>and</strong> four (4) waste<strong>water</strong> utilitiesthat hold a Certificate of Convenience <strong>and</strong> Necessity (CCN). A CCN is obtainedby utilities for the purpose of defining a service area for municipal <strong>and</strong> publicutility providers. A municipal utility defines a city, village or township <strong>and</strong> apublic utility or <strong>water</strong> supply corporation (WSC) identifies a corporation orindividual has ownership <strong>and</strong> responsibility.2.4.1 Water CCN UtilitiesCaldwell County has twelve (12) <strong>water</strong> providers that serve portions of CaldwellCounty. Exhibit 2-4 outlines the areas within the CCN in Caldwell County that isheld by the <strong>water</strong> service providers. The Texas Commission on EnvironmentalQuality (TCEQ) provided the geographic information system (GIS) data throughthe Water Utility District (WUD) database. Luling <strong>and</strong> Lockhart are municipalutilities <strong>and</strong> the other providers are <strong>water</strong> supply corporations <strong>and</strong> special utilitydistricts.2.4.2 Waste<strong>water</strong> CCN UtilitiesWaste<strong>water</strong> utilities in the <strong>county</strong> are limited due to the largely rural l<strong>and</strong> use inthe <strong>county</strong>. Undeveloped areas rely on on-site sewage facilities (OSSF) fortreatment <strong>and</strong> disposal of sewage. The TCEQ discharge permits that wereidentified are shown in Exhibit 2-5.Although Turner Crest Village LLC has obtained a waste<strong>water</strong> discharge permit,the waste<strong>water</strong> facilities have not been constructed. The intended service area is alarge subdivision that will be developed based on dem<strong>and</strong> for residential lotsgrows.Klotz Associates Project No. 0972.000.000January 20102-7Caldwell County Regional Water <strong>and</strong> Waste<strong>water</strong> Planning StudyFinal Report
Klotz Associates Project No. 0972.000.000January 20102-8Caldwell County Regional Water <strong>and</strong> Waste<strong>water</strong> Planning StudyFinal Report
Klotz Associates Project No. 0972.000.000January 20102-9Caldwell County Regional Water <strong>and</strong> Waste<strong>water</strong> Planning StudyFinal Report
The City of Lockhart has two waste<strong>water</strong> treatment plants that are operated <strong>and</strong>maintained by GBRA to serve the city residents. The facilities are located to theeast of Lockhart.The City of Luling also has two municipal facilities each to serve the city. Thefacilities in Luling are located to the northeast <strong>and</strong> southwest of the city limits.2.5 ClimateThe climate in Caldwell County is sub-tropical <strong>and</strong> humid. Low temperatures (40degrees Fahrenheit (ºF)) occur in the months of January <strong>and</strong> December <strong>and</strong> hightemperatures (95 ºF) occur in July <strong>and</strong> August. Average annual rainfall isapproximately 37 inches per year <strong>and</strong> average the monthly precipitation variesfrom 1.8 inches in July to 4.4 inches in May. Table 2-1 presents the averagetemperatures, precipitation with record lows <strong>and</strong> highs as measured in the <strong>county</strong>at Lockhart, Texas. Graph 2-1 <strong>and</strong> Graph 2-2 graphically presents theinformation provided in the tables.TABLE 2-1Lockhart, Texas Monthly Average Temperatures <strong>and</strong> PrecipitationAverage Average Average Record RecordMonthMeanHigh LowPrecipitation High LowJanuary 61°F 37°F 49 2.27 89°F (1975) -3°F (1949)February 66°F 41°F 54 2.2 99°F (1996) 4°F (1951)March 74°F 48°F 61 2.22 100°F (1971) 17°F (2002)April 80°F 55°F 67 3.06 100°F (1939) 26°F (1971)May 86°F 64°F 75 5.44 105°F (1967) 40°F (1903)June 92°F 70°F 81 4.29 108°F (1934) 50°F (1919)July 96°F 72°F 84 1.7 110°F (1954) 58°F (1967)August 96°F 71°F 84 2.32 109°F (1943) 56°F (1992)September 91°F 66°F 79 3.7 110°F (2000) 41°F (1981)October 83°F 56°F 70 4.36 99°F (1937) 26°F (1993)November 72°F 47°F 59 3 92°F (1969) 19°F (1911)December 64°F 39°F 51 2.3 88°F (1955) 4°F (1989)Klotz Associates Project No. 0972.000.000January 20102-10Caldwell County Regional Water <strong>and</strong> Waste<strong>water</strong> Planning StudyFinal Report
GRAPH 2-1Lockhart, Texas Monthly Average Temperatures908070Temperature (Farenheit)6050403020100JanuaryFebruaryMarchAprilMayJuneJulyAugustSeptemberOctoberNovemberDecemberMonthGRAPH 2-2Lockhart, Texas Monthly Average Precipitation654Precipitation3210JanuaryFebruaryMarchAprilMayJuneJulyAugustSeptemberOctoberNovemberDecemberMonthKlotz Associates Project No. 0972.000.000January 20102-11Caldwell County Regional Water <strong>and</strong> Waste<strong>water</strong> Planning StudyFinal Report
2.6 TopographyThe topography of Caldwell County is comprised of flat to rolling terrain withelevations ranging from 310 feet to approximately 750 feet above sea level. Thehighest elevations are in the northern part of the <strong>county</strong> <strong>and</strong> are in the range of750 feet above mean sea level along the ridges that divide the San Marcos <strong>and</strong>Plum Creek <strong>water</strong>sheds. The lowest elevations are found in the southern portionof the <strong>county</strong> at the confluence of the San Marcos River <strong>and</strong> Plum Creek. Thelowest elevation at the confluence is approximately 310 feet. Exhibit 2-6illustrates elevation variances in the <strong>county</strong>. The elevation at Lockhart is about515 feet <strong>and</strong> the elevation at Luling approximately 410 feet.2.7 Transmission SystemThe Transmission System in Caldwell County consist of a 345 KV transmissionline with one Substation North of Lockhart, some138 KV transmission lines with4 substations <strong>and</strong> several 69 KV transmission lines with 9 substations. Exhibit 2-7illustrates the approximate line locations <strong>and</strong> identifies the northern area of the<strong>county</strong> with the most activity. The map was prepared using the ERCOT 2008Texas Transmission Map.2.8 Impervious CoverImpervious cover data obtained for Caldwell County indicates that the overallimpervious cover percentage is approximately 0.6%. High impervious coverpercentages are found in cities <strong>and</strong> near state roadways. Exhibit 2-8 illustratesimpervious cover locations in the <strong>county</strong>. The red color in the map identifies theareas with a high value of impervious cover while the predominantly blue colorsymbolizes the most pervious areas. The impervious cover data was obtainedfrom USGS spatial data.Klotz Associates Project No. 0972.000.000January 20102-12Caldwell County Regional Water <strong>and</strong> Waste<strong>water</strong> Planning StudyFinal Report
Klotz Associates Project No. 0972.000.000January 20102-13Caldwell County Regional Water <strong>and</strong> Waste<strong>water</strong> Planning StudyFinal Report
Klotz Associates Project No. 0972.000.000January 20102-14Caldwell County Regional Water <strong>and</strong> Waste<strong>water</strong> Planning StudyFinal Report
Klotz Associates Project No. 0972.000.000January 20102-15Caldwell County Regional Water <strong>and</strong> Waste<strong>water</strong> Planning StudyFinal Report
SECTION 3DATA COLLECTION3.1 GeneralInformation for the <strong>study</strong> was obtained through interviews, meetings, surveys, <strong>and</strong>existing reports <strong>and</strong> studies. The data collected was specific to <strong>water</strong> use,population estimates, <strong>water</strong> quality issues <strong>and</strong> concerns. The information obtainedfrom surveys regarding existing facilities was used to analyze current systems <strong>and</strong>develop recommendations for future systems.3.2 SurveyThe survey for this <strong>study</strong> was prepared in January 2009 <strong>and</strong> sent by fax <strong>and</strong> emailto participants. The questionnaire was prepared for <strong>water</strong> <strong>and</strong> waste<strong>water</strong> utilitiesthat held CCNs in Caldwell County. The information requested in the survey wasclassified as general information, population information, <strong>water</strong> quality, <strong>water</strong>conservation <strong>and</strong> plans to meet future needs. The survey provided an opportunityfor respondents to provide additional information the respondent believed to bepertinent to the <strong>study</strong>. A copy of the survey can be found in Appendix B.The information requested from <strong>water</strong> utilities related to the ground<strong>water</strong> sources,usage <strong>and</strong> <strong>water</strong> quality. Questions included; source of the <strong>water</strong> supply, CCNnumber <strong>and</strong> year granted, average daily <strong>water</strong> use, historic peak volume for <strong>water</strong>delivery <strong>and</strong> year, volume of <strong>water</strong> pumped into the system, volume of <strong>water</strong>billed, customer data on type of meters, future <strong>planning</strong> projections on meters use,description of <strong>water</strong> production facilities, population estimates for past five years<strong>and</strong> projections for next 30 years, <strong>and</strong> a list of top <strong>water</strong> users <strong>and</strong> amount.National Pollutant Discharge Elimination System (NPDES) permit informationwas also requested as well as any issues with <strong>water</strong> sources <strong>and</strong> concernsregarding point source discharges <strong>and</strong> non-point source pollution that may impactKlotz Associates Project No. 0972.000.000January 20103-1Caldwell County Regional Water <strong>and</strong> Waste<strong>water</strong> Planning StudyFinal Report
<strong>water</strong> quality in the <strong>county</strong>. Finally, <strong>water</strong> conservation measures <strong>and</strong> futureefforts were listed.Waste<strong>water</strong> collection utilities were requested to indicate whether they owned <strong>and</strong>operated a waste<strong>water</strong> collection system, treatment plant, or if others operated thefacility. Information requested included CCN number(s) <strong>and</strong> date granted,average daily waste<strong>water</strong> flow for plants, historic peak day volume for waste<strong>water</strong>treatment, volume of <strong>water</strong> treated, volume of <strong>water</strong> billed, sewer connectiontypes, future projections for sewer connections, type of treatment plant <strong>and</strong> ratedcapacity, top waste<strong>water</strong> producers, <strong>and</strong> a list of NPDES permits held by facility.Lastly, inquiries were also made about re-use of treated waste<strong>water</strong>, plans tosupport future growth, <strong>and</strong> description of changes/upgrades for treatmentfacilities. The survey requested additional comments that the respondents believedto be pertinent to the <strong>study</strong>.The survey was completed by eleven (11) of the twelve (12) <strong>water</strong> providers <strong>and</strong>three (3) of the four (4) waste<strong>water</strong> CCN permit holders. The task of gathering theinformation requested in the survey did require time <strong>and</strong> effort from therespondents <strong>and</strong> the information provided was valuable in underst<strong>and</strong>ing thecurrent conditions in the <strong>county</strong> <strong>and</strong> developing potential solutions.The entities participating in the survey were contacted by phone to scheduletimes, if preferred, to visit with <strong>and</strong> clarify any questions about the survey <strong>and</strong> theinformation being requested. These surveyed participants included:Aqua Water Supply CorporationCity of LockhartCreedmoor MahaGonzales County WSCMaxwell WSCTri Community WSCKlotz Associates Project No. 0972.000.000January 2010County Line WSCCity of LulingGoforth WSCMartindale WSCPolonia WSCTurner Crest Village3-2Caldwell County Regional Water <strong>and</strong> Waste<strong>water</strong> Planning StudyFinal Report
Throughout the <strong>planning</strong> <strong>study</strong> three meetings were held at the Caldwell CountyAnnex in Lockhart, Texas to gather input from the community. Updates <strong>and</strong>presentations were held on the progress of the <strong>study</strong> <strong>and</strong> input was received on thedraft report. Sign in sheets for the stakeholder meetings have been included inAppendix A.3.3 Regional CoordinationExchanging information with local government entities, ground<strong>water</strong> districts,<strong>water</strong> authorities, <strong>and</strong> state agencies was considered necessary as a part of the<strong>study</strong>. Interviews were conducted with Canyon Regional Water Authority,Gonzales County Ground<strong>water</strong> Conservation District, Hays/Caldwell PublicUtility Agency (PUA), San Antonio River Authority, <strong>and</strong> the Texas State DataCenter (TSDC). Other information was obtained from Capital Area Council ofGovernments, TWDB, TCEQ, the Texas Department of Transportation (TxDOT),Caldwell County Appraisal District (CCAD), <strong>and</strong> the Electric Reliability Councilof Texas (ERCOT).The following participants were represented in the Stakeholder Meetings for this<strong>study</strong>:Bluebonnet Electric CooperativeTexas Water Development BoardCrystal Clear Water Supply Corporation Envision Central TexasCaldwell CountyHays Caldwell Public Utility AgencyCanyon Regional Water Authority City of LockhartLuling FoundationLockhart I.S.DEdwards Aquifer AuthorityPlum Creek Conservation DistrictGuadalupe-Blanco River Authority County L<strong>and</strong>ownerPlum Creek Watershed PartnershipGonzales County Ground<strong>water</strong> Conservation DistrictTexas State Soil & Water Conservation BoardKlotz Associates Project No. 0972.000.000January 20103-3Caldwell County Regional Water <strong>and</strong> Waste<strong>water</strong> Planning StudyFinal Report
SECTION 4GROUNDWATER4.1 Ground<strong>water</strong> SourcesGround<strong>water</strong> in Caldwell County remains the primary source of potable <strong>water</strong>.Most <strong>water</strong> utilities have wells that pump <strong>water</strong> from local aquifers. Ground<strong>water</strong>in the region is produced by aquifer formations that include the Leona, Carrizo,<strong>and</strong> Wilcox Aquifers. The formations vary from the Cretaceous to Quaternarytime period as listed in Table 4-1. The table <strong>and</strong> Exhibit 4-1 were provided byFeathergail Wilson, Professional Geologist. Mr. Wilson also provided valuabledetails <strong>and</strong> information regarding the ground<strong>water</strong> resources in the region.TABLE 4-1Caldwell County StratigraphyPERIOD EPOCH FORMATION/GROUP MAP SYMBOL LITHOLOGYQuaternary Holocene Undesignated Qal, Qt alluvium s<strong>and</strong>, silt,clayPleistocene Leona Qle gravelWeches Ew glauconiticfossiliferous clayPaleogene Eocene Queen City Eqc s<strong>and</strong> <strong>and</strong> clayReklaw Er clay <strong>and</strong> s<strong>and</strong>Carrizo Ec s<strong>and</strong>Wilcox Ewi s<strong>and</strong> <strong>and</strong> clayPaleocene Midway Emi clayCretaceous Late Navarro Kknm exp<strong>and</strong>ing clayPecan Gap kpg chalk4.1.1 Leona FormationThe Leona Formation is an alluvial outcrop formation that extends from Kyle toabout 10 miles southeast of Lockhart. It is primarily gravel stratified with somes<strong>and</strong>s, clay <strong>and</strong> silt. “In some locations the gravel is so well cemented that the endresult is a hard compact conglomerate resembling concrete.” (Follet, 1966)Lockhart’s <strong>water</strong> supply was completely provided for by the Leona FormationKlotz Associates Project No. 0972.000.000January 20104-1Caldwell County Regional Water <strong>and</strong> Waste<strong>water</strong> Planning StudyFinal Report
Klotz Associates Project No. 0972.000.000January 20104-2Caldwell County Regional Water <strong>and</strong> Waste<strong>water</strong> Planning StudyFinal Report
efore 1953. Deterioration in <strong>water</strong> quality from the Leona Formation has madethis source of <strong>water</strong> unsuitable for potable <strong>water</strong> use unless the <strong>water</strong> is treated.The extensive use of chemicals in agricultural production is a likely reason forhigh nitrate levels in the Leona Formation. The <strong>water</strong> from this shallow formationis used primarily used for irrigation.The Leona aquifer has an approximate thickness of about 40 feet <strong>and</strong> can yieldsmall to large quantities of <strong>water</strong>. It has a gradient that averages 10 feet per mile.The hydraulic conductivity, which describes the movement of <strong>water</strong> throughpores spaces, is expected to range from 10 0 to 10 -7 centimeters per second(cm/sec). Flow is generally to the southeast <strong>and</strong> is believed to recharge theunderlying Wilcox.4.1.2 Wilcox FormationThe Wilcox Formation is another <strong>water</strong> bearing unit in Caldwell County. Theformation outcrops in the central part of the <strong>county</strong>, as shown in the CaldwellCounty Surface Geology Map, Exhibit 4-1. The Wilcox Group, from youngest tooldest formations, includes the Hooper, Simsboro, <strong>and</strong> Calvert Bluff. Thegeological label for the Wilcox outcrop label, Ewi, is shown in Table 4-1.The outcrop width range is approximately 8 to 10 miles. It then slopes steeplydownward at about 150 feet per mile. The thickness of the formation increases asthe depth increases <strong>and</strong> is mostly composed of s<strong>and</strong> <strong>and</strong> clay. Maximum thicknessin the <strong>study</strong> area is approximately 2,000 feet <strong>and</strong> occurs in the southeasternportion of the <strong>county</strong> as shown in Exhibit 4-2. Fresh to saline <strong>water</strong> can be foundat depths of 50 feet to 2,800 feet in the southeastern area.4.1.3 Carrizo FormationThe overlying formation on the Wilcox Formation is the Carrizo Formation. InCaldwell County, the Carrizo Formation is generally white, coarser-grained <strong>and</strong>4-3Klotz Associates Project No. 0972.000.000Caldwell County Regional Water <strong>and</strong> Waste<strong>water</strong> Planning StudyJanuary 2010Final Report
Klotz Associates Project No. 0972.000.000January 20104-4Caldwell County Regional Water <strong>and</strong> Waste<strong>water</strong> Planning StudyFinal Report
loose s<strong>and</strong>. The s<strong>and</strong> tends to be free of finer clays. The Carrizo outcrop is locatedin the southeastern part of the <strong>county</strong>. The cement-like characteristics of theCarrizo at the outcrop cause a rise in elevation. The stratum of the Carrizo dipsdownward from the outcrop at about 140 feet per mile with a general thickness ofabout 400 feet. The overlying s<strong>and</strong>s have a higher hydraulic conductivity than theWilcox. In some parts of the <strong>county</strong> a clay liner acts as a seal to separate the two<strong>water</strong>-bearing units.4.1.4 Recklaw FormationThe Recklaw Formation overlays the Carrizo <strong>and</strong> crops out at the southeast cornerof the <strong>county</strong>. It is about 2 to 3 miles wide <strong>and</strong> with a maximum thickness atapproximately 400 feet. It dips downward at about 140 feet every mile. S<strong>and</strong> <strong>and</strong>silt define the lower portion of the formation <strong>and</strong> clay with thin beds of s<strong>and</strong>stoneclassifies the upper portion.4.1.5 Queen City S<strong>and</strong>s OutcropThe Queen City S<strong>and</strong>s outcrop is approximately 3 to 4 miles in width. Theformation dips southeast at about 120 feet per mile. The thickness increases toapproximately 500 feet. The formation includes fine to medium s<strong>and</strong>s <strong>and</strong> clay.The <strong>water</strong> in this formation was reported to have total dissolved solids that rangedfrom about 500 parts per million (ppm) near Bastrop <strong>and</strong> Fayette Counties to3,000 ppm near the Gonzales <strong>county</strong> line.4.2 Ground<strong>water</strong> QualityThe <strong>water</strong> quality of the region varies depending on the aquifer <strong>and</strong> the depth atwhich it is found. The chemical constituents in ground <strong>water</strong> originate primarilyfrom the soil <strong>and</strong> rocks it seeps through. As depth increases so does the chemicalKlotz Associates Project No. 0972.000.000January 20104-5Caldwell County Regional Water <strong>and</strong> Waste<strong>water</strong> Planning StudyFinal Report
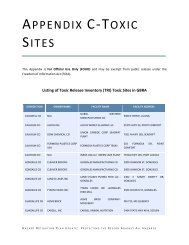
<strong>and</strong> sodium content while hardness decreases.depends largely on the chemical quality.The suitability of the <strong>water</strong>Chemical constituents found in <strong>water</strong> are compared to <strong>water</strong> quality st<strong>and</strong>ardsdeveloped by states. The state st<strong>and</strong>ards have to be approved by theEnvironmental Protection Agency (EPA) for implementation. Current drinking<strong>water</strong> st<strong>and</strong>ards for Texas are listed in the Texas Administrative Code (TAC) 209Subchapter F. A list of the <strong>water</strong> quality st<strong>and</strong>ards has been placed in AppendixC. Various requirements have been imposed to regulate maximum contaminantlevels in drinking <strong>water</strong>. Some of the most common contaminants include totaldissolved solids (TDS), chloride (Cl), fluoride (F), iron (Fe), manganese (Mn),nitrate (NO 3 ), <strong>and</strong> sulfate (SO 4 ).A Water Quality Publication Report prepared by the TWDB lists wells <strong>and</strong> the<strong>water</strong> quality testing results in Caldwell County. A page of the report has beenincluded in Appendix D for review. The report list the constituents found <strong>and</strong>their respective contaminant levels.Due to the high quality of ground<strong>water</strong> in the Wilcox-Carrizo formation, it is themost desired source for developing wells. TDS in the southeast <strong>and</strong> southwestcorner of the <strong>county</strong> are less than 500 ppm. However, TDS increase significantlyin between these corners. Well monitoring <strong>and</strong> observations indicate an arch inthe formation which degrades the <strong>water</strong> quality in this area.There are few areas in the Wilcox-Carrizo formation near Caldwell County thatexceed the sulfate <strong>and</strong> chloride drinking <strong>water</strong> st<strong>and</strong>ards of 300 ppm. In thesoutheast corner of the <strong>county</strong> sulfate was found to exceed 300 ppm in areaswhere total dissolved solids were under 1000 ppm. Chloride constituents were notreported to exceed the st<strong>and</strong>ards.Klotz Associates Project No. 0972.000.000January 20104-6Caldwell County Regional Water <strong>and</strong> Waste<strong>water</strong> Planning StudyFinal Report
4.3 Ground<strong>water</strong> Conservation DistrictsGround<strong>water</strong> conservation districts (GCD) were first created by the TexasLegislature in 1949. They are charged with developing <strong>and</strong> implementingcomprehensive management plans that conserve <strong>and</strong> protect ground<strong>water</strong>resources. Exhibit 4-3 illustrates the GCD that have been established in Texas.The districts plan for the future, work to collect data, educate consumers about<strong>water</strong> conservation, <strong>and</strong> prevent waste of <strong>water</strong>. A board of directors oversees thedistricts with guidance from the TWDB.In Caldwell County the management districts are the Plum Creek ConservationDistrict (PCCD), the Gonzales County Underground Water Conservation District(GCUWCD), <strong>and</strong> the Edwards Aquifer Authority (EAA). These boundaries ofthese districts are illustrated in Exhibit 4-4. The PCCD <strong>and</strong> the GCUWCDcurrently have some overlapping areas that have created uncertainty about therules that apply for the l<strong>and</strong> owners in the overlapping area.Rules for developing wells <strong>and</strong> issuing permits by the PCCD <strong>and</strong> the GCUWCDare similar at times but generally defined <strong>and</strong> managed differently. In general, theapproach to manage ground<strong>water</strong> are established in Management Plans <strong>and</strong> Rulesestablished by each district.4.3.1 Plum Creek Conservation DistrictPCCD is currently working with other districts within ground<strong>water</strong> managementarea (GMA) 13 develop <strong>and</strong> adopt a desired future condition (DFC) for theaquifers within the management area. Once adopted, the DFC of the aquifers willestablish quantified conditions of available ground<strong>water</strong> resources based onhydrological studies <strong>and</strong> modeling. Due to the current status of the DFC not beingestablished, PCCD has potentially issued more permits for ground<strong>water</strong> than iscurrently available. Current laws require GCD to permit to the extent possible of4-7Klotz Associates Project No. 0972.000.000Caldwell County Regional Water <strong>and</strong> Waste<strong>water</strong> Planning StudyJanuary 2010Final Report
Klotz Associates Project No. 0972.000.000January 20104-8Caldwell County Regional Water <strong>and</strong> Waste<strong>water</strong> Planning StudyFinal Report
Klotz Associates Project No. 0972.000.000January 20104-9Caldwell County Regional Water <strong>and</strong> Waste<strong>water</strong> Planning StudyFinal Report
the managed available ground<strong>water</strong>. The ground<strong>water</strong> permits that have beenapproved by PCCD are shown in Table 4-2. In addition to the listed permits inTable 4-2, PCCD received an application from the Plum Creek Group (preparedby Murfee Engineering Company) requesting 15,000 acre feet per year from the4,384 acres that PCCD annexed on March 25, 2008 in the Southeastern part ofCaldwell County.Type of PermitTABLE 4-2Plum Creek Conservation District Ground<strong>water</strong> PermitsNameNumber ofWellsQuantity(acft/year)DatePermittedAgriculture- IrrigationPermits Joe Smith 2 400 2/21/06Agriculture- IrrigationPermits Brenda Horton 1 43 6/21/07Agriculture- IrrigationPermits Ben Tidwell 1 168 12/18/07Agriculture-Irrigation Permits Giacomel 1 22 9/12/07Agriculture-Irrigation Permits Joe Wells 1 31 6/2004Agriculture-Irrigation Permits Martin Pratka 1 43 9/12/06Agriculture-Irrigation Permits A.E. Nicholson 4 4,000 2/17/09Public Supply PermitsCity ofLockhart 7 5,475 7/15/08Public Supply Permits Dale WSC 1 269 6/17/08Public Supply Permits Polonia WSC 5 2,283 6/17/08*Public SupplyPermits Polonia WSC 1 1,343 -*Public Supply Permits Hazelette 1 200 -Public SupplyPermits Luling 4 1,612 8/19/08Public Supply Permits Aqua Water 3 625 11/20/07Total 16,514PCCD has established a Ground<strong>water</strong> Management Plan & Protection Rules(adopted December 16, 2003) in effort to protect, preserve, enhance, <strong>and</strong> insurethe beneficial resources within its jurisdiction. A Ground<strong>water</strong> Management Plan,which is a separate document, has also been prepared <strong>and</strong> was adopted in 2007 toKlotz Associates Project No. 0972.000.000January 20104-10Caldwell County Regional Water <strong>and</strong> Waste<strong>water</strong> Planning StudyFinal Report
support the efforts of PCCD. The district rules attempt to regulate ground<strong>water</strong> bymeans of well spacing based on production rates. Table 4-3 provides a list of thespacing production provisions.TABLE 4-3PCCD Classification, Spacing, <strong>and</strong> Production ProvisionsActual PumpingCapacity of ProposedWell (GPM)Classification ofProposed WellMinimum Distance fromNewest Existing Well onAuthorized Well SiteLess than 25 GPM Domestic None25 - 100 A 600 Feet101 - 250 B 1,500 Feet251 - 500 C 3,000 Feet501 - 1,000 D 6,000 Feet1,001 GPM <strong>and</strong> over E 12,000 FeetNote:Wells drilled after December 31, 2003 shall either perform ahydrologic <strong>study</strong> approved by the District designed to demonstratethe impact of the permitted well on wells located within a one-halfmile radius, or comply with the District's spacing requirements. Wellsare classified according to actual pumping capacity in gallons perminute (GPM) under normal operating conditions.4.3.2 Gonzales County Underground Water Conservation DistrictThe GCUWCD was created on an order of the Texas Natural Resourceconservation Commission number 101692-Do4 <strong>and</strong> is charged specifically withmanaging the Sparta, Queen City, <strong>and</strong> the Carrizo-Wilcox aquifers in GonzalesCounty. The goals of the Management Plan <strong>and</strong> Rules established by the districtare to conserve, preserve, protect <strong>and</strong> prevent waste for the future of GonzalesCounty.The goals of the district are carried out through the GCUWCD Rules <strong>and</strong>Management Plan. The plan defines spacing requirements <strong>and</strong> pumpingproduction limitation to manage the ground<strong>water</strong>. Although the DFC has not been4-11Klotz Associates Project No. 0972.000.000Caldwell County Regional Water <strong>and</strong> Waste<strong>water</strong> Planning StudyJanuary 2010Final Report
developed, a drawdown of 100 feet in the Carrizo will curtail pumping. A list oftables <strong>and</strong> rules from the PCCD <strong>and</strong> the GCUWCD has been included inAppendix E.The GCUWCD is also working with other districts in GMA 13 to develop DFCwhich will revise the current Management Plan to reflect the managed availableground<strong>water</strong> (MAG). The GCUWCD is in the same situation as PCCD withpossible over permitting of the Carrizo-Wilcox Aquifer.In February 2009, the GCUWCD stated that the only permitted public transporterwas the Schertz-Seguin Local Government Corporation (SSLGC) for 12,900 acrefeetper year. The length of the transport permit is 30 years. The SSLGC supplies<strong>water</strong> to the cities of Schertz <strong>and</strong> Seguin. Permits under review were submitted byCRWA <strong>and</strong> SAWS. Aqua WSC also has wells that were established before thecreation of the GCUWCD <strong>and</strong> have been gr<strong>and</strong>fathered on the east side ofGonzales County. Those existing wells remain operational under the gr<strong>and</strong>fatherprovision <strong>and</strong> do not need to adhere to the current rules of the district.Klotz Associates Project No. 0972.000.000January 20104-12Caldwell County Regional Water <strong>and</strong> Waste<strong>water</strong> Planning StudyFinal Report
SECTION 5SURFACE WATER5.1 GeneralSurface <strong>water</strong> in Texas is owned by the state <strong>and</strong> permission to use the <strong>water</strong> isgranted through a “<strong>water</strong> right”. When a <strong>water</strong> right is acquired, <strong>water</strong> may thenbe diverted from its natural channel for use. However, a <strong>water</strong> right does notguarantee that <strong>water</strong> will be available. Water availability is determined by manyfactors but the most important are precipitation <strong>and</strong> subsequent <strong>water</strong> recharge.Average annual precipitation in Texas is illustrated in Exhibit 5-1 with averageannual precipitation in Caldwell County ranging from about 32 inches to 38inches. Water rights permit allow the holder to divert stream flow for municipal,industrial, irrigation, mining, hydropower, <strong>and</strong> recreational use provided <strong>water</strong> isavailable <strong>and</strong> the use is not wasteful.5.2 Surface Water Supply SourcesSurface <strong>water</strong> use for Caldwell County has ranged annually depending onavailability from the Guadalupe <strong>and</strong> Colorado River Basins. Data obtained fromthe TWDB indicates that historic annual surface <strong>water</strong> use for Caldwell Countyranged from 2,500 ac-ft to about 3,500 ac-ft. The surface <strong>water</strong> use illustrated inGraph 5-1 depicts the total of the Guadalupe <strong>and</strong> Colorado River Basins from1974 to 2004. The TWDB reports that provided the data are in Appendix F.5.2.1 Guadalupe River BasinThe Guadalupe River Basin serves as the primary source of surface <strong>water</strong> forCaldwell County. The Guadalupe River Basin is entirely in Texas <strong>and</strong> is largelywithin the statutory district of the GBRA as shown in Exhibit 5-2. TheGuadalupe River Basin is a valued source of <strong>water</strong> to local <strong>and</strong> <strong>regional</strong> suppliers.Klotz Associates Project No. 0972.000.000January 20105-1Caldwell County Regional Water <strong>and</strong> Waste<strong>water</strong> Planning StudyFinal Report
Klotz Associates Project No. 0972.000.000January 20105-2Caldwell County Regional Water <strong>and</strong> Waste<strong>water</strong> Planning StudyFinal Report
GRAPH 5-1Caldwell County Total Surface Water Use Summary4,5004,000SW3,5003,000Acre Feet2,5002,0001,5001,0005000197419801984198519861987198819891990199119921993Year19941995199619971998199920002001200220032004Approximately 66% of the <strong>water</strong> vendors surveyed indicated that they use surface<strong>water</strong> purchased from GBRA.Water (surface <strong>water</strong> <strong>and</strong> ground<strong>water</strong>) used in Caldwell County from within theboundaries of the Guadalupe River Basin has historically averaged about 6,500ac-ft per year. The Guadalupe Basin remains the primary source of <strong>water</strong> for the<strong>county</strong>. Graph 5-2 illustrates the historical <strong>water</strong> in Caldwell County by basin oforigin.5.2.2 Colorado River BasinThe Colorado River Drainage basin has reportedly provided less than 6.5% of thereported <strong>water</strong> use in Caldwell County. The portion of the drainage basin in theKlotz Associates Project No. 0972.000.000January 20105-3Caldwell County Regional Water <strong>and</strong> Waste<strong>water</strong> Planning StudyFinal Report
Klotz Associates Project No. 0972.000.000January 20105-4Caldwell County Regional Water <strong>and</strong> Waste<strong>water</strong> Planning StudyFinal Report
GRAPH 5-2TWDB- Caldwell County Historic Water Use Summary by River Drainage Basin9,0008,000Colorado River BasinGuadalupe River Basin7,0006,000Year5,0004,0003,0002,0001,0000197419801984198519861987198819891990199119921993Acre Feet19941995199619971998199920002001200220032004<strong>county</strong> has yielded an average of 350 ac-ft annually. The Colorado River Basin ismanaged by the Lower Colorado River Authority (LCRA).5.3 Surface Water Supply UsesMunicipal use is the <strong>county</strong>’s major use of surface <strong>water</strong>. Based on historical datafrom 1990 to 2004, municipal <strong>water</strong> use has accounted for between 65% <strong>and</strong> 80%of the total <strong>water</strong> used in the <strong>county</strong>. Graph 5-3 illustrates historical percentagesof surface <strong>water</strong> use for typical categories. Although irrigation <strong>and</strong> livestock <strong>water</strong>use have decreased, they still account for about 20%. Mining, steam electric <strong>and</strong>manufacturing account for less than 0.5% of the <strong>water</strong> used in the County.5.4 Surface Water RightsCurrently, surface <strong>water</strong> is accessed <strong>and</strong> obtained through a <strong>water</strong> rightspermitting process prescribed by the TCEQ. Anyone desiring to use surface <strong>water</strong>5-5Klotz Associates Project No. 0972.000.000Caldwell County Regional Water <strong>and</strong> Waste<strong>water</strong> Planning StudyJanuary 2010Final Report
needs a permit from the State of Texas. Exemptions from this requirement areavailable for (1) domestic <strong>and</strong> livestock use, (2) wildlife management, (3)emergency use, <strong>and</strong> (4) other specified uses listed in the Texas Water Code.Through these appropriated rights users are allowed to divert <strong>and</strong> store <strong>water</strong> foruse. However, a priority date is assigned to each right granted. The priority datedetermines the order of <strong>water</strong> to be used. It is a pecking order for <strong>water</strong> use. Indrought conditions <strong>and</strong> when stream flows are lowered <strong>and</strong> reduced, the TCEQadministers <strong>water</strong> rights on a priority basis known as “first in time, first in right.”A list of <strong>water</strong> rights for Caldwell County can be found in Appendix G. This datawas obtained from a TCEQ <strong>water</strong> rights database. Most of the <strong>water</strong> rights listedfor Caldwell County are associated with the San Marcos River. The largestpermitted volumes are owned by GBRA <strong>and</strong> Hydraco Power, Inc.Klotz Associates Project No. 0972.000.000January 20105-6Caldwell County Regional Water <strong>and</strong> Waste<strong>water</strong> Planning StudyFinal Report
SECTION 6POPULATION6.1 Population ProjectionsPopulation projections are necessary <strong>planning</strong> tools to prepare for future growth<strong>and</strong> development. Preparing for future growth can prevent overburdening currentinfrastructure <strong>and</strong> help identify systems <strong>and</strong> resources that are necessary tosuccessfully h<strong>and</strong>le an increase in population.The science of predicting future population is at best, an estimate. Projections useexisting data estimate available for births, deaths, migration, age/sex, <strong>and</strong>ethnicity to develop rates <strong>and</strong> run population scenarios that are plausible for futuregrowth patterns. The US Census Bureau <strong>and</strong> the Texas State Data Center (TSDC)are two agencies that provide these estimates to be used or further analyzed bylocal communities for <strong>planning</strong> purposes.The US Census Bureau <strong>and</strong> TSDC estimates vary due to accessible, updated, <strong>and</strong>available information. For example, the US Census Bureau uses the income taxdata that is not available to other agencies to do the estimates. The TSDC usescurrent birth <strong>and</strong> death data not readily accessible to the US Census Bureau. TheUS Census Bureau also performs analysis at a national level with no regard toannexation <strong>and</strong> boundary changes that the TSDC considers.6.2 Texas State Data CenterPopulation projection estimates developed by the TSDC incorporate migrationpatterns of ethnic groups by sex, age, st<strong>and</strong>ard birth <strong>and</strong> death rates to producefour scenarios of expected growth. The four common migration scenariosconsidered for Caldwell County are as follows:Klotz Associates Project No. 0972.000.000January 20106-1Caldwell County Regional Water <strong>and</strong> Waste<strong>water</strong> Planning StudyFinal Report
1. Zero Net Migration (0) – Assumes immigration <strong>and</strong> migrationrates are equal2. Net Migration Equals One-Half 1990-2000 (0.5) – Average ofZero <strong>and</strong> 1990-2000 Net Migration rates. Assumes rates of onehalfof the 1990’s.3. Net Migration Equal to 1990-2000 (1.0) – High growth alternativebased on high growth rates on 1990’s.4. Net Migration Equal to 2000-2007 (200-2007) – Post 2000population trends with reduced levels of migration.According to the State Demographer, who develops the projections at the TSDC,the recommendation for most cases is the 0.5 scenario, where Net Migration isequal to one-half 1990-2000. The 0.5 scenario predicts the most practical growthscenario. However, after further review <strong>and</strong> consideration of SH 130, the StateDemographer suggested that Caldwell County consider Scenario 1.0 for <strong>planning</strong>purposes.Population projections for scenario 1.0 may be more practical with the change SH130 will bring in connecting two of fastest growing cities. A populationprojection estimate at a micro-level can reveal that factors such as transportation,l<strong>and</strong> use, development <strong>planning</strong>, density in adjacent counties <strong>and</strong> other local leveldata would cause a wave of growth for Caldwell County. The limitation offorecasting for projected population estimates at a micro-level is acknowledgedby the TWDB.6.3 Texas Water Development BoardThe population projections that were developed by the TWDB <strong>and</strong> adopted intothe State Water Plan on September 13, 2003 are presented in Graph 6-1. Theprojection for Caldwell County assumes that the population growth rate will bethe same in the future as it was in 1990 <strong>and</strong> 2000. The growth rate estimates wereKlotz Associates Project No. 0972.000.000January 20106-2Caldwell County Regional Water <strong>and</strong> Waste<strong>water</strong> Planning StudyFinal Report
GRAPH 6-1TWDB Population Projections for Caldwell County120,000Population106,575100,00095,10380,00083,25071,459Population60,00059,72240,00045,95820,0000201020202030204020502060Yearcalculated using the most probable scenario from the Texas State Data Center(Scenario 0.5) for migration. The information from the Texas State Data Centerwas used as a baseline in establishing population projections.The projections established by the TWDB are limited at forecasting the microlevelgrowth. The estimates do not account for events <strong>and</strong> moments that alter thedemographics of a <strong>county</strong>. An event such as the completion of SH 130 can not bemeasured. The result in population change due to this event is considered to beunderestimated. Historic patterns have not described the implications of newroutes to population growth waves.The population projections are presented in Volume II, Appendix 4.1, of Waterfor Texas dated January 2007.Klotz Associates Project No. 0972.000.000January 20106-3Caldwell County Regional Water <strong>and</strong> Waste<strong>water</strong> Planning StudyFinal Report
6.4 Population History <strong>and</strong> Growth EstimatesHistorically, a change in population due to events is noticeable in the acquisitionof data. For example, in 1922 a man by the name of Edgar B. Davis discovered oilin what is now Luling, Texas. The “oil boom” was an event that impacted <strong>and</strong>changed Caldwell County. Only historic data, shown in Graph 6-2, can accuratelyillustrate the change.35,000GRAPH 6-2Caldwell County Population by DecadePopulationOil boom30,00025,000Population20,00015,00010,0005,00001850186018701880189019001910192019301940195019601970198019902000Census YearAs the future of Caldwell County is being planned, it is recommended to plan forthe most conservative scenario as stated by the State Demographer. As shown inGraph 6-3, the fastest growth case scenario from the data available is provided bythe Texas State Data Center, scenario 1.0.Klotz Associates Project No. 0972.000.000January 20106-4Caldwell County Regional Water <strong>and</strong> Waste<strong>water</strong> Planning StudyFinal Report
GRAPH 6-3Texas State Data Center Population Scenarios for Caldwell County120,000100,000Scenario 0Scenario 0.5Scenario 1.0Scenario 2000-2007Year: 2030Pop: 86,902Year: 2040Pop: 111,21080,000Year: 2020Pop: 65,05760,000Year: 2010Pop: 46,30840,00020,00032,19402000200520102015Population20202025203020352040YearThe TWDB estimates the population to be at 83,250 by the year 2040 <strong>and</strong> theTexas State Data Center estimates the population at 111,210 by the year 2040, asshown Graph 6-4. The individuals that will populate Caldwell County vary inopinion by as much as 25%. The TWDB does project population estimates in thehundred thous<strong>and</strong>ths but it is not until the year 2060.6.5 Population ConsensusThe population projections were presented to the Caldwell County TechnicalAdvisory Committee <strong>and</strong> Stakeholders in meetings. Although Caldwell Countydid not dispute the population projections developed by the TWDB in theSCTRWP, there was disagreement about the estimate. Through a consensus it wasagreed to proceed with the estimates from the TSDC (Scenario 1.0) with arevision. The revision was to decrease the population projection in the year 2040Klotz Associates Project No. 0972.000.000January 20106-5Caldwell County Regional Water <strong>and</strong> Waste<strong>water</strong> Planning StudyFinal Report
to a value that was within the values of the TSDC <strong>and</strong> the TWDB. Table 6-1 hasbeen prepared to list the estimated population values developed by the TSDC <strong>and</strong>the TWDB. It was agreed to proceed with an estimate of 100,000 in 2040 for thepurpose of this <strong>study</strong>. Accordingly, population projections used for this <strong>study</strong> arelisted in Table 6-2.GRAPH 6-4Caldwell County Population Projection Comparison120,000100,000HistoricalTWDBTSDC - Scenario 3P: 111,210Y: 204080,000P: 83,250Y: 204060,00040,00020,00001850186018701880189019001910192019301940195019601970198019902000201020202030204020502060PopulationCensus YearTABLE 6-1Population Projection EstimatesYearTexas State Data Center Population ScenariosTWDB0.0 0.5 1 2000-20072010 34,844 40,289 46,308 38,724 45,9582020 37,355 49,975 65,057 45,622 59,7222030 39,258 60,127 86,902 51,469 71,4592040 40,677 70,593 111,210 55,752 83,250Klotz Associates Project No. 0972.000.000January 20106-6Caldwell County Regional Water <strong>and</strong> Waste<strong>water</strong> Planning StudyFinal Report
TABLE 6-2Planning Study Population ProjectionsYearPopulation2010 46,3082020 65,0572030 86,9022040 100,000Klotz Associates Project No. 0972.000.000January 20106-7Caldwell County Regional Water <strong>and</strong> Waste<strong>water</strong> Planning StudyFinal Report
SECTION 7FACILITIES INVENTORY7.1 Water Facilities InventoryCaldwell County is supplied <strong>water</strong> by 12 CCN <strong>and</strong> numerous private wells. Theinformation provided below is a compilation of data obtained from the TCEQdatabase <strong>and</strong> surveys. Table 7-1 provides a list of the CCNs for <strong>water</strong>. The 12CCN holders, production wells, <strong>and</strong> <strong>water</strong> treatment plants are shown in Exhibit7-1. Although <strong>water</strong> is primarily produced through the allocation of ground<strong>water</strong>well permits, 66% of the <strong>water</strong> providers obtain additional <strong>water</strong> through surface<strong>water</strong> rights. The CCN holders in the <strong>county</strong> are Municipal, Water SupplyCorporations (WSC), <strong>and</strong> Special Utility Districts (SUD).TABLE 7-1Water Supply CCNUtility Name Ownership Type Primary County Serving CountiesAqua WSC Bastrop Caldwell, Lee, TravisCity of Lockhart Municipality Caldwell NoneCity of Luling Municipality Caldwell NoneCounty Line WSC Hays CaldwellCreedmoor Maha WSC Travis Caldwell, Bastrop, HaysGoforth WSC Hays Caldwell, TravisCaldwell, Dewitt,Gonzales County WSC Gonzales GuadalupeMartindale WSC Caldwell Guadalupe, HaysMaxwell WSC Caldwell HaysPolonia WSC Caldwell BastropCaldwell, Comal,San Marcos Municipal Hays GuadalupeTri-Community WSC Caldwell GuadalupeKlotz Associates Project No. 0972.000.000January 20107-1Caldwell County Regional Water <strong>and</strong> Waste<strong>water</strong> Planning StudyFinal Report
Klotz Associates Project No. 0972.000.000January 20107-2Caldwell County Regional Water <strong>and</strong> Waste<strong>water</strong> Planning StudyFinal Report
An inventory of the information to be presented in this section below has beenprepared in Table 7-2.Water User GroupTABLE 7-2TCEQ Water CCN Database InventoryTotalStorage(MG)ElevatedStorage(MG)TotalProduction(MGD)Average DailyConsumption(MGD)Aqua WSC 12.12 5.64 24.71 4.97City of Lockhart WSC 3.65 1.05 8.298 1.8City of Luling 1.65 0.9 2.5 1.99Creedmoor Maha 1.511 1.325 5.083 0.61Martindale WSC 0.344 0.28 0.378 0.205Maxwell WSC 1.238 1.238 2.67 0.431Polonia WSC 0.961 0.475 1.845 0.367TriCommunity WSC 0.338 0.12 0.713 0.125County Line WSC 1.5 1.37 0.864 0.47Goforth WSC 1.992 1.068 6.192 0.936San Marcos 6.941 3.161 36.850 6.507Gonzales County WSC 1.44 0.459 3.37 1.2297.1.1 Aqua Water Supply CorporationAqua Water Supply Corporation (CCN# 10294 est. 1969) produces ground<strong>water</strong>from the Carrizo Aquifer. The service area includes Bastrop, Caldwell, Lee <strong>and</strong>Travis Counties. Aqua WSC currently services the southeast area of CaldwellCounty.It is reported to have a total storage capacity of 12.12 million gallons (MG) withan elevated storage capacity of 5.640 MG. Production of Aqua WCS is 24.71million gallons per day (MGD) with an average daily consumption of 4.970 MGDfor the service area. In Caldwell County, the uses are primarily for residential.Klotz Associates Project No. 0972.000.000January 20107-3Caldwell County Regional Water <strong>and</strong> Waste<strong>water</strong> Planning StudyFinal Report
7.1.2 City of LockhartThe City of Lockhart (CCN# 10295 est. 1952) is a municipality that providesground<strong>water</strong> from the Carrizo Aquifer. Surface <strong>water</strong> is supplied by GBRAthrough run-of-river rights. Surface <strong>water</strong> currently accounts for more than half ofthe <strong>water</strong> supply. The service area for Lockhart is entirely in Caldwell County.The total storage capacity is 3.650 MG with an elevated storage capacity of 1.050MG. The total production is 8.298 MGD with a maximum purchase capacitynoted to be 4.0 MGD <strong>and</strong> a service pump capacity of 4.896 MGD. Average dailyconsumption is 1.818 MGD. The meter count was 3,865 <strong>and</strong> uses in CaldwellCounty were classified as residential, commercial/industrial <strong>and</strong> other.7.1.3 Creedmoor Maha Water Supply CorporationCreedmoor Maha (CCN# 11029 est. 1965) produces ground<strong>water</strong> from theEdwards (Barton Springs) Aquifer <strong>and</strong> purchases ground<strong>water</strong> from Aqua WSC.Creedmoor Maha obtains treated <strong>and</strong> raw surface <strong>water</strong> from Austin. The servicearea extends into Bastrop, Caldwell, Hays, <strong>and</strong> Travis with the latter being theprimary <strong>county</strong>. Creedmoor Maha services Mustang Ridge which has city limitsinside Caldwell County.The total storage capacity is 1.511 MG with an elevated storage capacity of 1.325MG <strong>and</strong> pressure tank capacity of 0.01420 MG. The total production is 5.083MGD with a service pump capacity of 3.154 MGD <strong>and</strong> an average dailyconsumption of 0.610 MGD. A total meter count was listed to be 2,244 in 2008.Customer base in Caldwell County is presently residential <strong>and</strong> commercial.7.1.4 City of LulingThe City of Luling (CCN# 10291) is a municipality that provides surface <strong>water</strong>from run-of-river rights from GBRA. In addition, the City has one well that can, ifKlotz Associates Project No. 0972.000.000January 20107-4Caldwell County Regional Water <strong>and</strong> Waste<strong>water</strong> Planning StudyFinal Report
needed, supply ground<strong>water</strong> from the Carrizo Aquifer. Caldwell is the only<strong>county</strong> listed in the service area of the City of Luling.The total storage capacity is 1.650 MG with an elevated storage capacity of 0.900MG. The total production was not listed but a maximum purchase capacity wasnoted at 2.50 MGD <strong>and</strong> a service pump capacity at 2.304 MGD. Average dailyconsumption is 1.990 MGD. The meter count was 2,169 <strong>and</strong> uses were classifiedas residential, commercial/industrial, <strong>and</strong> other.7.1.5 County Line Water Supply CorporationCounty Line Water Supply Corporation (CCN# 10292) produces ground<strong>water</strong>from the Edwards Aquifer <strong>and</strong> obtains surface <strong>water</strong> from GBRA <strong>and</strong> CRWA.The service area is in Hays <strong>and</strong> Caldwell County with Hays County listed as theprimary <strong>county</strong>. County Line WSC services Uhl<strong>and</strong>, which has city limits innorthwest Caldwell County. Uhl<strong>and</strong> is southwest of Neiderwald <strong>and</strong> northeast ofMaxwell WSC.The total storage capacity is 1.500 MG with an elevated storage capacity of 1.370MG. It has a total production capacity of 0.864 MGD with a maximum purchasecapacity of 2.040 MGD. The average daily consumption is 0.470 MGD with1,977 meters in service. Residential meters are the primary use in CaldwellCounty.7.1.6 Goforth Special Utility DistrictGoforth Special Utility District (CCN# 11356) produces ground<strong>water</strong> from theEdwards (Barton Springs) Aquifer <strong>and</strong> purchases surface from CRWA <strong>and</strong>GBRA. Surface <strong>water</strong>, approximately 90%, is the primary source of <strong>water</strong> supply.The counties this utility serves include Caldwell, Hays, <strong>and</strong> Travis. The primary<strong>county</strong> for the utility is Hays. Goforth Special Utility District supplies <strong>water</strong> toKlotz Associates Project No. 0972.000.000January 20107-5Caldwell County Regional Water <strong>and</strong> Waste<strong>water</strong> Planning StudyFinal Report
Neiderwald. The service area in Caldwell County is located northwest ofLockhart. The area borders Polonia WSC to the north <strong>and</strong> west.The total storage capacity is 1.992 MG with an elevated storage capacity of 1.068MG <strong>and</strong> pressure tank capacity of 0.01 MG. The total production is 6.192 MGDwith a maximum purchase capacity noted to be 0.90 MGD <strong>and</strong> a service pumpcapacity of 9.446 MGD. Average daily consumption is 0.936 MGD. The metercount was 4,002 <strong>and</strong> uses in Caldwell County were classified as residential <strong>and</strong>commercial/industrial.7.1.7 Gonzales County Water Supply CorporationGonzales County Water Supply Corporation (CCN# 10704) producesground<strong>water</strong> from the Carrizo Aquifer <strong>and</strong> surface <strong>water</strong> is supplied from theCanyon Reservoir. The service area includes the counties of Caldwell, Dewitt,Gonzales, <strong>and</strong> Guadalupe. Gonzales County is the primary <strong>county</strong> of service.The total storage capacity is listed to be 1.440 MG with an elevated storagecapacity of 0.459 MG <strong>and</strong> pressure tank capacity of 0.06580 MG. Totalproduction is 3.370 MGD with a maximum purchased capacity of 0.666 MGD.The service pump capacity is 16.013 MGD. Average daily consumption is 1.229MGD with 2,293 meters in service. Caldwell County meters currently obtain<strong>water</strong> for residential use.7.1.8 TriCommunity Water Supply CorporationTri Community Water Supply Corporation (CCN# 10313) produces ground<strong>water</strong>from the Carrizo Aquifer. The service area includes the counties of Caldwell <strong>and</strong>Gonzales. Caldwell County is listed as the primary <strong>county</strong>. Tri Community WSCis located to the southwest of Lockhart <strong>and</strong> services the unincorporated areas ofFentress <strong>and</strong> Prairie Lea in Caldwell County.Klotz Associates Project No. 0972.000.000January 20107-6Caldwell County Regional Water <strong>and</strong> Waste<strong>water</strong> Planning StudyFinal Report
The total storage capacity is listed to be 0.338 MG with an elevated storagecapacity of 0.120 MG. Total production is 0.713 MGD with a service pumpcapacity of 1.872 MGD. Average daily consumption of 0.125 MGD is provided to536 meters in service. Caldwell County meters primarily obtain <strong>water</strong> forresidential use.7.1.9 Martindale Water Supply CorporationMartindale Water Supply Corporation (CCN#10312 est. 1965) producesground<strong>water</strong> from alluvial wells <strong>and</strong> obtains surface <strong>water</strong> from CRWA <strong>and</strong>GBRA. The Martindale WSC service area extends into Hays, <strong>and</strong> GuadalupeCounty. Caldwell County is listed as the primary service area. Martindale WSCprovides <strong>water</strong> for all types of uses to the city of Martindale.The total storage capacity is listed to be 0.344 MG with an elevated storagecapacity of 0.280 MG <strong>and</strong> pressure tank capacity of 0.00200 MG. Totalproduction is 0.648 MGD with a maximum purchased capacity of 0.378 MGD.The service pump has a capacity of 0.864 MGD. Average daily consumption is0.205 MGD. Total service meter count is 838. Caldwell County meters currentlyobtain <strong>water</strong> for residential <strong>and</strong> commercial/industrial use.7.1.10 Maxwell Water Supply CorporationMaxwell Water Supply Corporation (CCN#10293 est. 1979) producesground<strong>water</strong> from the Edwards Aquifer <strong>and</strong> obtains surface <strong>water</strong> from GBRA<strong>and</strong> CRWA. The service area for Maxwell WSC lies in Hays <strong>and</strong> Caldwellcounties. Caldwell County is listed as the primary service area. Maxwell WSCservices the unincorporated area of Maxwell <strong>and</strong> Reedville. The service area liesin between the Martindale WSC area <strong>and</strong> the Lockhart Municipality territory.The total storage capacity is 1.238 MG with an elevated storage capacity of 1.238MGD. It has a total production capacity of 2.670 MGD with a maximum7-7Klotz Associates Project No. 0972.000.000Caldwell County Regional Water <strong>and</strong> Waste<strong>water</strong> Planning StudyJanuary 2010Final Report
purchase capacity of 6.0 MGD. The average daily consumption is 0.431 MGDwith 1,437 meters in service. The majority of use is for residential use <strong>and</strong> somein commercial/industrial.7.1.11 Polonia Water Supply CorporationPolonia Water Supply Corporation (CCN#10420) produces ground<strong>water</strong> from theCarrizo Aquifer <strong>and</strong> can purchase <strong>water</strong> from the City of Lockhart when needed.The Polonia WSC service area is primarily in Caldwell County with a portionextending into Bastrop County.The total storage capacity is listed to be 0.961 MG with an elevated storagecapacity of 0.475 MG <strong>and</strong> pressure tank capacity of 0.00400 MG. Totalproduction is 1.845 MGD with a service pump capacity of 3.686 MGD. Averagedaily consumption is 0.367 MGD with a total of 1,884 meters in service forresidential use.7.1.12 City of San MarcosThe City of San Marcos Municipality (CCN # 10298) has the smallest servicearea extending into Caldwell County. Out of the 9,500 plus meters, only about 24are located in Caldwell County for commercial use at the airport.7.2 Regional Water WholesalersRegional <strong>water</strong> wholesalers for the <strong>county</strong> include Canyon Regional WaterAuthority (CRWA) <strong>and</strong> the Guadalupe-Blanco River Authority (GBRA).7.2.1 Canyon Regional Water AuthorityCanyon Regional Water Authority was created by the Texas Legislature in 1989to supply cities <strong>and</strong> districts with potable <strong>water</strong>. The <strong>water</strong> they distribute isKlotz Associates Project No. 0972.000.000January 20107-8Caldwell County Regional Water <strong>and</strong> Waste<strong>water</strong> Planning StudyFinal Report
treated before being routed to <strong>water</strong> supply corporations. CRWA currently servesBexar, Wilson, Guadalupe, Comal, Hays <strong>and</strong> Caldwell Counties.CRWA has operational responsibilities for two <strong>water</strong> treatment plants, LakeDunlap Water Treatment Plant (WTP) <strong>and</strong> the Hays Caldwell WTP. The LakeDunlap Water Treatment Plant is rated at 16.4 MGD <strong>and</strong> receives <strong>water</strong> fromCanyon Lake. The Hays Caldwell WTP receives <strong>water</strong> from the San MarcosRiver <strong>and</strong> Guadalupe River (Lake Dunlap) <strong>and</strong> is rated at 6 MGD.The <strong>water</strong> supply corporations that currently receive <strong>water</strong> from CRWA areMartindale WSC, Maxwell WSC, <strong>and</strong> County Line WSC.7.2.2 Guadalupe Blanco River AuthorityThe GBRA (CCN# 20892, 12977) was established by the Texas Legislature in1933 <strong>and</strong> reauthorized in 1935 as the Guadalupe-Blanco River Authority. GBRAserves the counties of Kendall, Comal, Hays, Caldwell, Guadalupe, Gonzales,DeWitt, Victoria, Calhoun <strong>and</strong> Refugio. The m<strong>and</strong>ate of the GBRA is to conserve<strong>and</strong> protect the resources of the Guadalupe River Basin.The services provided by GBRA include hydroelectric generation, <strong>water</strong> <strong>and</strong>waste<strong>water</strong> treatment <strong>and</strong> raw <strong>water</strong> supply for municipal, industrial, <strong>and</strong>agricultural use.In 2001 GBRA assumed operations as the contract operator for the LockhartWater Treatment Plant. The well systems <strong>and</strong> <strong>water</strong> treatment plant are managedby the GBRA.In 1978, GBRA constructed a <strong>water</strong> treatment plant in Luling with a capacity of2.5 MG. Surface <strong>water</strong> from the San Marcos River is treated at the GBRA LulingWater Treatment Plant <strong>and</strong> delivered to the City of Luling <strong>and</strong> the City ofKlotz Associates Project No. 0972.000.000January 20107-9Caldwell County Regional Water <strong>and</strong> Waste<strong>water</strong> Planning StudyFinal Report
Lockhart. The plant is capable of diverting up to 4,422 acre-feet annually from theSan Marcos River under a <strong>water</strong> rights permit issued by the State of Texas. Peakrated capacity is 2.779 MGD. Performance of the plant has earned staterecognition through of the EPA with “The Environmental Excellence Award forPublic Water Supply”.7.3 Waste<strong>water</strong> Facilities InventoryThere are currently five waste<strong>water</strong> facilities that are listed in the TCEQ database.Information regarding the facilities has been summarized in the following sections<strong>and</strong> an inventory of the data listed in Table 7-3. The location of these facilitiescan bee seen in Exhibit 7-2.TABLE 7-3Waste<strong>water</strong> CCNUtility NameOwnershipTypePrimaryCountyTotal PermittedDischarge (gpd)City of Lockhart Municipality Caldwell 2,600,000City of Luling (North/South) Municipality Caldwell 1,400,000Mustang Plaza Private Caldwell 99,000Sweet<strong>water</strong> Utility LLC Private Hays N/ATurner Crest Private Caldwell 300,0007.3.1 The City of Lockhart/ GBRAThe City of Lockhart (CCN# 20114) has two operational waste<strong>water</strong> plants. Theplants have a total combined discharge amount of 2.6 MGD. GBRA operates theLockhart plants under state permit numbers WQ0010210-001 <strong>and</strong> WQ0010210-002.Klotz Associates Project No. 0972.000.000January 20107-10Caldwell County Regional Water <strong>and</strong> Waste<strong>water</strong> Planning StudyFinal Report
Klotz Associates Project No. 0972.000.000January 20107-11Caldwell County Regional Water <strong>and</strong> Waste<strong>water</strong> Planning StudyFinal Report
In 1994 GBRA began operating the City of Lockhart’s 1.1 MGD waste<strong>water</strong>treatment plant on Larremore Street. The treated effluent is discharged through apipeline to Town Branch <strong>and</strong> then into Plum Creek, Segment No. 1810 of theGuadalupe River Basin.In 1999 an additional 1.5 MGD plant on F.M. 20 became operational in Lockhart.Septic tank waste is accepted <strong>and</strong> treated at the F.M. 20 Plant. A carouselactivated sludge process is implemented at the plant along with ultraviolet (UV)light disinfection instead of chlorine. To ensure the effluent will not impairaquatic <strong>and</strong> other environments, daily sample tests are conducted to confirm theeffluent meets all state <strong>and</strong> federal st<strong>and</strong>ards. The effluent is discharged into PlumCreek Segment No. 1810 of the Guadalupe River Basin.7.3.2 The City of LulingThe City of Luling (CCN# 20113) has a North <strong>and</strong> South plant in operation. Theplants have a combined discharge permit of 1.4 MGD. The waste<strong>water</strong> treatmentplants <strong>and</strong> collection systems are owned <strong>and</strong> operated by the City. The facilitiesare permitted under state permit numbers WQ0010582-001 <strong>and</strong> WQ0010582-002.The North Plant has an operational permit that authorizes the discharge of treatedwaste<strong>water</strong> at a volume not to exceed a daily average flow of 900,000 gallons perday. The discharge route is from the plant to Salt Branch then to Plum Creek.The South Plant has an operational permit that authorizes the discharge of treatedwaste<strong>water</strong> at a volume not to exceed a daily average flow of 500,000 gallons perday. The discharge from the site is routed to the Lower San Marcos River.Waste<strong>water</strong> is treated through the contact stabilization method <strong>and</strong> thendischarged. The “sequence of operations in this process is aeration of rawKlotz Associates Project No. 0972.000.000January 20107-12Caldwell County Regional Water <strong>and</strong> Waste<strong>water</strong> Planning StudyFinal Report
waste<strong>water</strong> with return activated sludge, sedimentation to yield a clarifiedeffluent, <strong>and</strong> re-aeration of the clarifier underflow with a portion wasted to anaerobic digester. Supernatant drawn from the digester is returned to the processinfluent. The raw waste<strong>water</strong> aeration chamber, also referred to as the contactzone, is approximately one third of the total aeration volume.” (Hammer, 1986)Because system inefficiencies may develop with increases in population toprocess larger flows, the systems may not be as economical as conventionalmethods with larger dem<strong>and</strong>s.7.3.3 Turner Crest Village Waste<strong>water</strong> Company, LLCTurner Crest Village WW CO (CCN# 21004) submitted an application for afacility that would be authorized to discharge treated waste<strong>water</strong> at a volume nogreater than 300,000 gallons per day. Under state permit no. WQ0014831-001 thedischarge would be routed to an unnamed tributary of Morrison Creek, then to theLower San Marcos River.Turner Crest Village WW has not yet constructed the facility due to theconditions of the economy. The development of the subdivision has beenpostponed, perhaps indefinitely. No other information is available at this time.7.3.4 Mustang PlazaMustang Plaza (CCN# 20953) affiliated with Aus-Tex Parts & Services, Ltd, isauthorized to discharge treated waste<strong>water</strong> at a volume not to exceed a dailyaverage flow of 99,000 gallons per day. The discharge route is to an unnamedtributary of Cedar Creek <strong>and</strong> then to the Colorado River above La Grange.Limited information was available <strong>and</strong> obtained. Although the discharge point islocated within Caldwell County the facility services Mustang Ridge.Klotz Associates Project No. 0972.000.000January 20107-13Caldwell County Regional Water <strong>and</strong> Waste<strong>water</strong> Planning StudyFinal Report
7.3.5 Sweet<strong>water</strong> Utility, LLCSweet<strong>water</strong> Utility LLC (CCN# 20887) was listed to have a service area inCaldwell County for Neiderwald. The CCN boundaries extend into CaldwellCounty but the service area is primarily in Hays. Limited information wasavailable <strong>and</strong> obtained. Unsuccessful attempts were made to contact <strong>and</strong> locatethe CCN owners for more information on the utility.7.3.6 Additional State Waste<strong>water</strong> PermitsIn addition to performing a CCN query on the TCEQ Database for CaldwellCounty, permitted waste<strong>water</strong> facilities were also investigated. A list of the resultshas been presented in Table 7-4.Additional active waste<strong>water</strong> treatment facilities not located within a CCNinclude City of Martindale. The City of Martindale has been approved to treatdomestic waste<strong>water</strong> at a volume not to exceed a daily average flow of 57,000gallons per day via surface irrigation of 32 acres of non-public access agriculturall<strong>and</strong>. The permit submitted September 9, 2004 does not authorize discharge ofpollutants into State <strong>water</strong>s. A few of the facilities are listed as inactive due toinactivity on the permit.State PermitNo.TABLE 7-4TCEQ Permitted Waste<strong>water</strong> Treatment FacilitiesApplicantStreamSegmentStatusTreatmentWQ0010273-003 City of San Marcos <strong>and</strong> GBRA 1808 Inactive InactiveWQ0011233-001Texas Parks <strong>and</strong> WildlifeDepartment 1810 Inactive InactiveWQ0013450-001 City of Martindale 1808 ActiveGroundApplicationWQ0014033-001 Polonia WSC 1810 ActiveFilter BackwashEffluentWQ0014033-002 Polonia WSC 1810 ActiveFilter BackwashEffluentWQ0014104-001 AUS-TEX Parts & Services LLC 1434 Inactive InactiveWQ0014439-001 Caldwell/Uhl<strong>and</strong> 405 L P 1810 Inactive InactiveKlotz Associates Project No. 0972.000.000January 20107-14Caldwell County Regional Water <strong>and</strong> Waste<strong>water</strong> Planning StudyFinal Report
SECTION 8WATER DEMANDS8.1 Historical Water UseCaldwell County currently has 14 <strong>water</strong> user groups (WUG) that supply <strong>water</strong> forvarious types of uses. There are twelve (12) entities that hold CCN <strong>and</strong> are listedas Municipal, Specialty Utility Districts, <strong>and</strong> Water Supply Corporations. The two(2) remaining user groups are state agencies. Several of the WUG supply <strong>water</strong> toother counties in addition to Caldwell.Caldwell County <strong>water</strong> use has been primarily for municipal purposes. It appearedthat prior to 1980 municipal <strong>water</strong> use accounted for about half of the <strong>water</strong>consumed, with livestock <strong>and</strong> irrigation representing the remainder. Historical<strong>water</strong> use data made available through the TWDB website is shown in Table 8-1<strong>and</strong> illustrated in Graph 8-1. The <strong>water</strong> consumption for the <strong>county</strong>, at an averageof 4,800 ac-ft, has historically been used to meet municipal dem<strong>and</strong>s, <strong>and</strong> theremainder to meet dem<strong>and</strong>s for mining, manufacturing, livestock, <strong>and</strong> irrigation.Water utilization for livestock has remained, for the most part, within the range of800-950 ac-ft annually with an average of 850 ac-ft. Water consumptionaveraged about 220 ac-ft per year for manufacturing before 1986, after whichthere is none recorded for a few years. In 1993, manufacturing <strong>water</strong> use startedup again with fluctuation of use typically less than 20 ac-ft. Irrigation use varies<strong>and</strong> ranges with minimum use of 182 ac-ft to a maximum of 1742 ac-ft annually.Mining <strong>water</strong> use has historically been limited to less than 70 ac-ft with a gradualdecline in use. There is no record of <strong>water</strong> consumption for steam electric.Klotz Associates Project No. 0972.000.000January 20108-1Caldwell County Regional Water <strong>and</strong> Waste<strong>water</strong> Planning StudyFinal Report
TABLE 8-1Caldwell County - TWDB Historical Water Use SummaryUnit: Acre Feet (ac-ft)Year Municipal ManufacturingSteamElectricIrrigation Mining Livestock Total1974 3,069 206 0 1,660 70 1,149 6,1541980 4,033 219 0 1,600 0 1,036 6,8881984 5,092 240 0 694 27 834 6,8871985 4,430 224 0 499 27 747 5,9271986 4,483 223 0 500 0 817 6,0231987 4,617 0 0 500 28 803 5,9481988 4,904 0 0 500 25 841 6,2701989 4,855 0 0 1,198 27 827 6,9071990 4,931 0 0 1,375 27 816 7,1491991 4,320 0 0 954 13 836 6,1231992 4,456 0 0 1,513 13 835 6,8171993 4,825 2 0 1,127 12 769 6,7351994 4,718 11 0 1,361 12 890 6,9921995 4,755 10 0 1,696 12 907 7,3801996 5,186 12 0 1,742 12 801 7,7531997 4,584 10 0 1,560 12 869 7,0351998 4,813 8 0 1,705 12 816 7,3541999 4,818 8 0 1,621 12 910 7,3692000 4,929 11 0 989 12 917 6,8582001 4,534 200 0 1,590 6 888 7,2182002 4,311 6 0 1,590 6 958 6,8712003 4,978 0 0 1,065 6 965 7,0142004 4,770 1 0 183 6 1,051 6,011222.4 852Data Source: Texas Water Development BoardKlotz Associates Project No. 0972.000.000January 20108-2Caldwell County Regional Water <strong>and</strong> Waste<strong>water</strong> Planning StudyFinal Report
GRAPH 8-1Caldwell County Historic Water Use9,0008,0007,0006,000Acre Feet5,0004,0003,0002,0001,00001974198019841985198619871988198919901991199219938.2 TWDB Water Use ProjectionsYear19941995199619971998199920002001MiningManufacturingLivestockIrrigationMunicipal200220032004The future <strong>water</strong> dem<strong>and</strong>s in Table 8-2 <strong>and</strong> Graph 8-2 were developed by theTWDB for Caldwell County. The dem<strong>and</strong>s have been estimated up to 2060. Theyears beyond 2040 have been shaded in the table since this <strong>study</strong> is notconsidering the same <strong>planning</strong> horizon.The municipal <strong>water</strong> dem<strong>and</strong> projections show a consistent linear increase from6,306 ac-ft in 2010 to 10,555 ac-ft in 2040. According to the TWDB, themunicipal <strong>water</strong> dem<strong>and</strong> is based on population <strong>and</strong> expected <strong>water</strong> consumptionfor each person with a reduction to account for conservation. The GPCD varied inthe <strong>county</strong> for each <strong>water</strong> user group.Klotz Associates Project No. 0972.000.000January 20108-3Caldwell County Regional Water <strong>and</strong> Waste<strong>water</strong> Planning StudyFinal Report
Municipal <strong>water</strong> dem<strong>and</strong> projections in the 2006 Region L Plan for CaldwellCounty were based on 122.5 gallons per capita per day (gpcpd) for year 2010 <strong>and</strong>113.2 gpcpd for the year 2040. These dem<strong>and</strong>s are lower than the dem<strong>and</strong>sestimated for the whole of the South Central Region in the 2006 Region L Plan of143 gpcpd in the year 2010 <strong>and</strong> 135 gpcpd in the year 2040.The Caldwell County Study reported on herein used 150 gpcpd for the <strong>planning</strong>horizon of 2010 to 2040. These values were adopted based on surveys completedfor <strong>water</strong> supply entities in Caldwell County. Water conservation practices couldreduce the per capita dem<strong>and</strong> by 10 to 20 percent. The larger per capita use ratesin the Caldwell County <strong>study</strong> increase the volume of future <strong>water</strong> that must bedeveloped to meet future needs when compared to the 2006 Region L Plan.Water dem<strong>and</strong>s for mining are also expected to gradually increase about 1 ac-ft adecade from 14 ac-ft in 2010 to 17 ac-ft in 2040. Manufacturing increases about 316,000GRAPH 8-2Caldwell County Water Dem<strong>and</strong>s by Use Category14,00012,000MiningManugacturingLivestockIrrigationMunicipal10,000Acre - Feet8,0006,0004,0002,00002000 2010 2020 2030 2040 2050 2060YearKlotz Associates Project No. 0972.000.000January 20108-4Caldwell County Regional Water <strong>and</strong> Waste<strong>water</strong> Planning StudyFinal Report
ac-ft a decade from 15 ac-ft in 2010 to 24 ac-ft in 2040. The livestock <strong>water</strong>dem<strong>and</strong>s are projected to remain constant at 918 ac-ft. The constant dem<strong>and</strong>implies no increase to the number or type of livestock in Caldwell County. Asteady decrease is projected in irrigation from 1044 ac-ft in 2010 to 733 ac-ft in2040. The decrease could signify a decrease in the acreage of crop l<strong>and</strong> or croptype that requires less <strong>water</strong> application. The steam electric consumption isexpected to remain zero as historical use has indicated.TABLE 8-22006 Regional L - Caldwell County Water Dem<strong>and</strong> ProjectionsCountyName Category 2000 2010 2020 2030 2040 2050 2060CALDWELL Irrigation 989 1,044 928 824 733 651 578CALDWELL Livestock 918 918 918 918 918 918 918CALDWELL Manufacturing 11 15 18 21 24 27 29CALDWELL Mining 12 14 15 16 17 18 18CALDWELL Municipal 4,643 6,306 7,898 9,222 10,555 11,926 13,328CALDWELL Steam Electric 0 0 0 0 0 0 0Total 6,573 8,297 9,777 11,001 12,247 13,540 14,871Source: Texas Water Development Board 2006 Regional Water Plan1) Projections for years 2000 - 2060 in ac-ft 1 . An ac-ft is an amount of <strong>water</strong> to coverone acre with one foot of <strong>water</strong> <strong>and</strong> equals 325,851 gallons.In addition to projecting <strong>water</strong> dem<strong>and</strong>s by use, the TWDB also determined<strong>county</strong> municipal <strong>water</strong> dem<strong>and</strong>s for each WUG in Caldwell County. Thedem<strong>and</strong>s are shown in Table 8-3. According to the TWDB, the municipal <strong>water</strong>dem<strong>and</strong>s increase steadily with an amount no greater than 1,500 ac-ft for everydecade after 2020. The dem<strong>and</strong>s are based on projections of their populationestimates that were discussed in Section 6 of this report.The <strong>water</strong> user groups presented by the TWDB were developed using thepopulation projections for the WUG in Caldwell County. The populationprojection estimates up to the year 2060 have been included in Table 8-4. The<strong>water</strong> dem<strong>and</strong> <strong>and</strong> population projections according to the TWDB were lastupdated September 17, 2004. The tables indicate a split in region or <strong>county</strong> whenKlotz Associates Project No. 0972.000.000January 20108-5Caldwell County Regional Water <strong>and</strong> Waste<strong>water</strong> Planning StudyFinal Report
applicable. A “P” in the Region Split indicates that the WUG is located in morethan one region. The values determined represent only the WUG population’sprojections within that particular region. A “P” in the County Split columnindicates the WUG is located in more than one <strong>county</strong>. The projections listed willbe representative of the WUG’s population projections within Caldwell Countyonly.TABLE 8-32006 Region L – Caldwell County Municipal Water Dem<strong>and</strong> Projections in Acre-FeetWater User Group 2010 2020 2030 2040RegionSplit 1)Aqua WSC 267 339 396 458 P PCounty Line WSC 204 308 405 501 PCounty-Other 237 223 199 176Creedmoor Maha WSC 234 304 367 431 P PGoforth WSC 184 269 342 417 P PGonzales County WSC 63 79 94 108 PLockhart 2,451 3,094 3,629 4,180Luling 1,067 1,210 1,299 1,384Martindale 125 134 139 143Martindale WSC 142 153 158 162 PMaxwell WSC 503 678 844 996 PMustang Ridge 135 178 215 253 P PNiederwald 26 43 61 78 PPolonia WSC 668 886 1,074 1,268 P PCountySplit 2)Caldwell Total 6,306 7,898 9,222 10,555Source: Texas Water Development Board 2006 Regional Water Plan1) If “P” is present in this column, the Water User Group (WUG) is located in more thanone Region <strong>and</strong> the projections listed in the row represent only the WUG’s populationprojections within that particular Region, not the WUG’s total population projections. Ifthe “P” is present for a <strong>county</strong> total entry, then the <strong>county</strong> has been split by Regionalboundaries <strong>and</strong> the projections listed in the row represent only the <strong>county</strong>’s populationswithin the particular Region, not the <strong>county</strong>’s total population projections.2) If “P” is present in this column, the Water User Group (WUG) is located in more thanone <strong>county</strong> <strong>and</strong> the projections listed in the row represent only the WUG’s populationprojections within that particular <strong>county</strong>, not the WUG’s total population projections.Klotz Associates Project No. 0972.000.000January 20108-6Caldwell County Regional Water <strong>and</strong> Waste<strong>water</strong> Planning StudyFinal Report
TABLE 8-42006 Region L – Caldwell County Water User Group Population ProjectionsWater User Group 2010 2020 2030 2040RegionSplit 1)CountySplit 2)Aqua WSC 1,782 2,313 2,764 3,217 P PCounty Line WSC 1,262 1,939 2,565 3,193 PCounty-Other 1,229 1,172 1,066 968Creedmoor Maha WSC 2,217 3,015 3,717 4,423 P PGoforth WSC 1,770 2,636 3,429 4,226 P PGonzales County WSC 215 277 329 381 PLockhart 16,328 21,083 25,111 29,154Luling 6,309 7,301 7,998 8,700Martindale 1,150 1,291 1,378 1,465Martindale WSC 1,307 1,468 1,566 1,666 PMaxwell WSC 4,356 6,113 7,685 9,260 PMustang Ridge 555 746 911 1,077 P PNiederwald 203 349 489 629 PPolonia WSC 7,275 10,019 12,451 14,891 P PCaldwell Total 45,958 59,722 71,459 83,250Source: Texas Water Development Board 2006 Regional Water Plan1) If “P” is present in this column, the Water User Group (WUG) is located in more than oneRegion <strong>and</strong> the projections listed in the row represent only the WUG’s population projectionswithin that particular Region, not the WUG’s total population projections. If the “P” is presentfor a <strong>county</strong> total entry, then the <strong>county</strong> has been split by Regional boundaries <strong>and</strong> the projectionslisted in the row represent only the <strong>county</strong>’s populations within the particular Region, not the<strong>county</strong>’s total population projections2) If “P” is present in this column, the Water User Group (WUG) is located in more than one<strong>county</strong> <strong>and</strong> the projections listed in the row represent only the WUG’s population projectionswithin that particular <strong>county</strong>, not the WUG’s total population projections.8.3 Development of Water Dem<strong>and</strong>sMunicipal <strong>water</strong> dem<strong>and</strong>s for this <strong>study</strong> were based on information obtained fromthe TWDB, input from the Study Advisory Group <strong>and</strong> the State Demographer.The TWDB population projections for each WUG in Table 8-4 were furtheranalyzed to determine percentages of the total population. The percentagescalculated for each WUG, as shown in Table 8-5, indicated that Luling, Lockhart,<strong>and</strong> Polonia were the greatest <strong>water</strong> users in the <strong>county</strong> <strong>and</strong> accounted for over50% of the population. The TWDB percentages of the WUG were multiplied by8-7Klotz Associates Project No. 0972.000.000Caldwell County Regional Water <strong>and</strong> Waste<strong>water</strong> Planning StudyJanuary 2010Final Report
the modified TSDC Scenario 1.0, shown in Table 8-6, to compare the growthestimates. The modification, as mentioned in Section 6, was to adjust thepopulation projection in 2040 to 100,000. The product of Table 8-5 <strong>and</strong> Table 8-6is given in Table 8-7.TABLE 8-5TWDB - Water User Groups Population PercentagesWater User Group 2010 2020 2030 2040Aqua WSC 0.039 0.039 0.039 0.039County Line WSC 0.027 0.032 0.036 0.038County - Other 0.027 0.020 0.015 0.012Creedmoor Maha WSC 0.048 0.050 0.052 0.053Goforth WSC 0.039 0.044 0.048 0.051Gonzales County WSC 0.005 0.005 0.005 0.005Lockhart 0.355 0.353 0.351 0.350Luling 0.137 0.122 0.112 0.105Martindale 0.025 0.022 0.019 0.018Martindale WSC 0.028 0.025 0.022 0.020Maxwell WSC 0.095 0.102 0.108 0.111Mustang Ridge 0.012 0.012 0.013 0.013Niederwald 0.004 0.006 0.007 0.008Polonia WSC 0.158 0.168 0.174 0.179Total 1.000 1.000 1.000 1.000TABLE 8-6TSDC Population Scenario 1.0 – ModifiedTSDC Scenario 1.0 Population 2010 2020 2030 *2040Projected Population 46,308 65,057 86,902 100,000Table 8-7 presents the <strong>water</strong> user group population projections used in this <strong>study</strong>based on the modified TSDC Population Scenario 1.0.In addition to calculating population projections for each WUG based on theTSDC Scenario 1.0, a per capita value was also determined to develop the <strong>water</strong>dem<strong>and</strong>s for this <strong>study</strong>. The per capita value has units of gallons per capita perday (gpcd). The value represents the average rate of <strong>water</strong> dem<strong>and</strong> used perperson per day for a given population within a distribution system.Klotz Associates Project No. 0972.000.000January 20108-8Caldwell County Regional Water <strong>and</strong> Waste<strong>water</strong> Planning StudyFinal Report
TABLE 8-7Developed Water User Group Populations for Caldwell CountyWater User Group 2010 2020 2030 2040Aqua WSC 1,796 2,520 3,361 3,864County Line WSC 1,272 2,112 3,119 3,835County - Other 1,238 1,277 1,296 1,163Creedmoor Maha WSC 2,234 3,284 4,520 5,313Goforth WSC 1,783 2,871 4,170 5,076Gonzales County WSC 217 302 400 458Lockhart 16,452 22,966 30,538 35,020Luling 6,357 7,953 9,726 10,450Martindale 1,159 1,406 1,676 1,760Martindale WSC 1,317 1,599 1,904 2,001Maxwell WSC 4,389 6,659 9,346 11,123Mustang Ridge 559 813 1,108 1,294Niederwald 205 380 595 756Polonia WSC 7,330 10,914 15,142 17,887Total 46,308 65,057 86,902 100,000The <strong>water</strong> use <strong>and</strong> population data obtained from the surveys were factors indetermining the per capita values for each utility. The per capita valuesdetermined from the surveys varied from about 84 gpcd in any one year to 160gpcd. As shown in Graph 8-3 the average <strong>water</strong> consumption per person hasgradually increased since 2005. In 2005, the average for the utilities surveyed was113 gpcd <strong>and</strong> increased in 2006 to 116 gpcd. There was a slight decrease in 2007with an increase again 2008 to an average of 135 gpcd.The compiled data was presented to the Technical Advisory Committee for aconsensus on the daily per capita value to be used for the <strong>study</strong>. The TechnicalAdvisory Committee, after discussion, agreed to proceed with a value of 150 gpcdto determine <strong>water</strong> dem<strong>and</strong> projections for the <strong>county</strong>. The 150 gpcd rate wasapplied to the projected population figures to estimate average daily <strong>water</strong>dem<strong>and</strong>s. The estimated dem<strong>and</strong>s are shown in MGD <strong>and</strong> ac-ft respectively inTable 8-8 <strong>and</strong> Table 8-9.Klotz Associates Project No. 0972.000.000January 20108-9Caldwell County Regional Water <strong>and</strong> Waste<strong>water</strong> Planning StudyFinal Report
GRAPH 8-3Caldwell County Survey Results of Per Capita Values140135135130gallons per capita per day (gpcd)1251201151101131161141051002005 2006 2007 2008YearTABLE 8-8Municipal Average - Yearly Water Dem<strong>and</strong>sMillion Gallons Per DayWater User Group 2010 2020 2030 2040Aqua WSC 0.269 0.378 0.504 0.580County Line WSC 0.191 0.317 0.468 0.575County - Other 0.186 0.192 0.194 0.174Creedmoor Maha WSC 0.335 0.493 0.678 0.797Goforth WSC 0.268 0.431 0.626 0.761Gonzales County WSC 0.032 0.045 0.060 0.069Lockhart 2.468 3.445 4.581 5.253Luling 0.954 1.193 1.459 1.568Martindale 0.174 0.211 0.251 0.264Martindale WSC 0.198 0.240 0.286 0.300Maxwell WSC 0.658 0.999 1.402 1.668Mustang Ridge 0.084 0.122 0.166 0.194Niederwald 0.031 0.057 0.089 0.113Polonia WSC 1.100 1.637 2.271 2.683Total 6.946 9.759 13.035 15.000Klotz Associates Project No. 0972.000.000January 20108-10Caldwell County Regional Water <strong>and</strong> Waste<strong>water</strong> Planning StudyFinal Report
TABLE 8-9Municipal Average - Yearly Water Dem<strong>and</strong>sAcre-Feet Per YearWater User Group 2010 2020 2030 2040Aqua WSC 302 423 565 649County Line WSC 214 355 524 644County – Other 208 215 218 195Creedmoor Maha WSC 375 552 760 893Goforth WSC 300 483 701 853Gonzales County WSC 36 51 67 77Lockhart 2,765 3,859 5,131 5,884Luling 1,068 1,336 1,634 1,756Martindale 195 236 282 296Martindale WSC 221 269 320 336Maxwell WSC 738 1,119 1,570 1,869Mustang Ridge 94 137 186 217Niederwald 34 64 100 127Polonia WSC 1,232 1,834 2,544 3,006Total 7,781 10,932 14,602 16,803The municipal <strong>water</strong> dem<strong>and</strong>s based on population in Caldwell County areexpected to increase from 7,781 ac-ft in 2010 to 16,803 ac-ft in 2040. Thesemunicipal <strong>water</strong> dem<strong>and</strong>s will need to be met through surface <strong>and</strong> ground<strong>water</strong>resources. The dem<strong>and</strong>s can also be reduced through various conservationmeasures.8.4 Conservation MeasuresConservation measures will be required from all WUG to reduce the expected<strong>water</strong> dem<strong>and</strong>s. A conservation measure of 10%, illustrated in Graph 8-4, willdecrease expected <strong>water</strong> dem<strong>and</strong>s <strong>and</strong> is a recommended goal for all WUGs.Many <strong>water</strong> saving strategies to achieve this goal have been added in AppendixH. Several of the WUG have indicated that they are already implementing someconservation measures to reduce dem<strong>and</strong>s <strong>and</strong> will continue to develop newstrategies. The strategies developed by the WUG are also discussed in theappendix.Klotz Associates Project No. 0972.000.000January 20108-11Caldwell County Regional Water <strong>and</strong> Waste<strong>water</strong> Planning StudyFinal Report
GRAPH 8-4Caldwell County Yearly Water Dem<strong>and</strong> with 10% Water Conservation29.024.019.0MGD14.09.04.02010 2020 2030 2040Average 12.445 17.484 23.355 26.875Conservation 11.201 15.736 21.019 24.188YearKlotz Associates Project No. 0972.000.000January 20108-12Caldwell County Regional Water <strong>and</strong> Waste<strong>water</strong> Planning StudyFinal Report
SECTION 9WASTEWATER FLOWS9.1 GeneralWaste<strong>water</strong> flows are generated from domestic, industrial, <strong>and</strong> commercial uses.Inflow <strong>and</strong> infiltration are terms used to describe the ground<strong>water</strong> <strong>and</strong> storm<strong>water</strong>seepage. Inflow enters the system at direct connection points while infiltration isthe ground<strong>water</strong> that seeps in through cracks <strong>and</strong> leaks in the system.The domestic <strong>water</strong> that is returned to the treatment facility comes from sinks,showers, tubs, lavatories <strong>and</strong> toilets. In an average system, 60% - 90% of thepotable <strong>water</strong> is directed to a waste<strong>water</strong> treatment facility or an on-site septicsystem. Water not returned to the waste<strong>water</strong> treatment plant is typically used forirrigation <strong>and</strong> industrial applications.The rate of return flow determined for the <strong>study</strong> was developed by comparing theaverage daily <strong>water</strong> use <strong>and</strong> average daily waste<strong>water</strong> flow. Lockhart <strong>and</strong> Lulingwere the only systems that had data available to evaluate.9.2 Waste<strong>water</strong> FlowsLimited waste<strong>water</strong> flow data exists for Caldwell County. Large portions of the<strong>county</strong> are served by OSSF systems that are regulated by the County or city.Lockhart <strong>and</strong> Luling provided the only data in the survey to determine averagedaily waste<strong>water</strong> flows <strong>and</strong> peak flow factors. The average daily waste<strong>water</strong> flowranged from 0.4 MGD to 1.2 MGD with an average of 0.8 MGD. The averageflow was considered to be the base flow <strong>and</strong> the peak flows considered asinfiltration <strong>and</strong> inflow.Given the sewer base flow <strong>and</strong> population, a per capita value was determined. Thesewer populations for Lockhart <strong>and</strong> Luling were estimated to be 13,464 <strong>and</strong> 4,9789-1Klotz Associates Project No. 0972.000.000Caldwell County Regional Water <strong>and</strong> Waste<strong>water</strong> Planning StudyJanuary 2010Final Report
espectively from the information provided in the survey. Table 9-1 provides thesurvey data used to determine waste<strong>water</strong> flows. The average daily waste<strong>water</strong>flow for the <strong>county</strong> was 85 gpcd. The peak day waste<strong>water</strong> flow factors for Luling<strong>and</strong> Lockhart, as shown in Table 9-2, were 3.75 <strong>and</strong> 1.25 respectively.TABLE 9-1Waste<strong>water</strong> ConnectionsSystemTotal WaterConnectionsTotal SewerConnectionsPercent ofSewerConnectionsPopulationSewerPopulationAverageDailyWaste<strong>water</strong>Flow (MGD)AverageDailyWaste<strong>water</strong>Flow PerCapita (gpd)Lockhart 4,095 4,085 0.998 13,600 13,464 1.2 89Luling 2,152 2,122 0.986 5,080 4,978 0.4 80Average 0.8 85TABLE 9-2Waste<strong>water</strong> Peak Day Flow FactorsSystemPeak Day Flow FactorLockhart 1.25Luling 3.75As seen from Table 9-2, the <strong>water</strong> to waste<strong>water</strong> return rates varied from 56% to79%. The lower return rate can indicate greater outdoor <strong>water</strong> use or loss <strong>and</strong> thehigher return rates can imply <strong>water</strong> inflow <strong>and</strong> infiltration. Normally, averagereturn rates vary from about 60% - 80%. The return rate determined from thesurvey information provided was an average of 68%. The return rate was used toestimate return flows from the projected <strong>water</strong> dem<strong>and</strong>s.TABLE 9-3Waste<strong>water</strong> Return RateSystemWaste<strong>water</strong>per capitaWater percapitaReturn RateLockhart 89 113 79%Luling 80 143 56%Average 68%Klotz Associates Project No. 0972.000.000January 20109-2Caldwell County Regional Water <strong>and</strong> Waste<strong>water</strong> Planning StudyFinal Report
The projected waste<strong>water</strong> flows for Caldwell County are presented in Table 9-3.The waste<strong>water</strong> flows are based on 150 gpcd at a 68% return rate. The projectedwaste<strong>water</strong> flows will increase along with population as shown in the table below.The waste<strong>water</strong> flow is expected to increase approximately 5.5 MGD from 2010to 2040.TABLE 9-4Caldwell County Projected Waste<strong>water</strong> Flows2010 2020 2030 2040Projected Population46,308 65,057 86,902 100,000Total Projected Waste<strong>water</strong>4.723 6.636 8.864 10.200Flows (MGD)Caldwell County will be required to increase or develop new treatment facilitiesas limits are reached on facilities that treat 4.9 MGD.9.3 Waste<strong>water</strong> LoadsLoads produced from the expected waste<strong>water</strong> flows are shown in Table 9-5 <strong>and</strong>Table 9-6 assumes the adoption of stringent discharge parameters. The BOD,TSS, Ammonia, <strong>and</strong> Phosphorus loading values are based on existing <strong>water</strong>quality conditions <strong>and</strong> the need for remediation in Plum Creek, where waste<strong>water</strong>is discharged.TABLE 9-5Caldwell County Projected Waste<strong>water</strong> Loads, (lbs/day)BOD 5 mg/ L Ammonia 2 mg/LTSS 5 mg/ L Phosphorous 1 mg/LYear of Projected 2010 2020 2030 2040Waste<strong>water</strong> Flows(MGD) 4.723 6.636 8.864 10.200BOD 197 277 370 425TSS 197 277 370 425Ammonia 79 111 148 170Phosphorous 39 55 74 85Klotz Associates Project No. 0972.000.000January 20109-3Caldwell County Regional Water <strong>and</strong> Waste<strong>water</strong> Planning StudyFinal Report
TABLE 9-6Caldwell County Projected Waste<strong>water</strong> Loads, (lbs/year)Year 2010 2020 2030 2040BOD 71,893 101,000 134,915 155,249TSS 71,893 101,000 134,915 155,249Ammonia 28,757 40,400 53,966 62,100Phosphorous 14,379 20,200 26,983 31,050Klotz Associates Project No. 0972.000.000January 20109-4Caldwell County Regional Water <strong>and</strong> Waste<strong>water</strong> Planning StudyFinal Report
SECTION 10WATER QUALITY10.1 GeneralLocal ordinances in the Caldwell County political subdivisions regarding <strong>water</strong>quality <strong>and</strong> quantity issues are minimal. The <strong>county</strong> does not have authority tocreate, implement <strong>and</strong> enforce regulations related to <strong>water</strong> quality <strong>and</strong> quantity.Incorporated cities do have that authority <strong>and</strong> can exercise that right under localcharter rules to adopt new ordinances. The US Environmental Protection Agency(USEPA) <strong>and</strong> the Texas Commission on Environmental Quality (TCEQ) are thenational <strong>and</strong> state agencies that provide st<strong>and</strong>ards <strong>and</strong> regulate <strong>water</strong> quality.10.2 City OrdinancesA search conducted on www.municode.com provided some detail of existingregulations for the cities of Lockhart <strong>and</strong> Luling. These two cities were the onlylocal governments listed for Caldwell County. The city of Martindale’s websiteprovided minimal city code information <strong>and</strong> a phone number to call for inquires.Searches for Mustang Ridge, Uhl<strong>and</strong>, <strong>and</strong> Neiderwald were unsuccessful.In reviewing the local code for Lockhart <strong>and</strong> Luling, only ordinances regulating<strong>water</strong> quantity <strong>and</strong> not <strong>water</strong> quality are discussed briefly. Water quantity iscontrolled by limiting or preventing an increase in run-off from a site. The qualityof the run-off from a site however is not discussed.Water quality issues arise from uncontrolled <strong>and</strong> unregulated point source <strong>and</strong>non-point source pollution. The uncontrolled quality of discharges into streams<strong>and</strong> rivers has resulted in subst<strong>and</strong>ard <strong>water</strong> quality in rivers <strong>and</strong> streams that isnot acceptable at the State <strong>and</strong> National level.Klotz Associates Project No. 0972.000.000January 201010-1Caldwell County Regional Water <strong>and</strong> Waste<strong>water</strong> Planning StudyFinal Report
10.3 United States Environmental Protection Agency (USEPA)The USEPA is a federal agency that was established in 1970 to regulate <strong>and</strong>monitor various aspects of the environment. The USEPA creates <strong>and</strong> enforcesregulations such as the Clean Water Act (CWA). The CWA was passed in 1972<strong>and</strong> intended to restore <strong>and</strong> maintain the chemical, physical, <strong>and</strong> biologicalintegrity of the nation's <strong>water</strong>s. This task was to be accomplished by preventingpoint <strong>and</strong> nonpoint pollution sources, providing assistance to publicly-ownedfacilities for the improvement of waste<strong>water</strong> treatment, <strong>and</strong> maintaining theintegrity of wetl<strong>and</strong>s. The USEPA provides partnerships, educational programs,<strong>and</strong> grants to protect the environment.10.3.1 The National Pollutant Discharge Elimination System (NPDES)Section 402 of the CWA controls direct discharges or "point source" dischargesinto navigable <strong>water</strong>s. These are from sources such as pipes <strong>and</strong> sewers. NPDESpermits are issued by either the EPA or an authorized state/tribe. Water qualitycriteria <strong>and</strong> st<strong>and</strong>ards vary from state to state <strong>and</strong> site to site, depending on the useclassification of the receiving body of <strong>water</strong>. Most states follow USEPAguidelines that define aquatic life <strong>and</strong> human health criteria for many of the 126priority pollutants.10.4 Texas Commission on Environmental Quality (TCEQ)The TCEQ is the environmental regulating agency for the state. The TCEQ wascommissioned to “protect our state's human <strong>and</strong> natural resources consistent withsustainable economic development.” The “goal is clean air, clean <strong>water</strong>, <strong>and</strong> thesafe management of waste.” All activities relating to <strong>water</strong> quality requirepermits, registrations, <strong>and</strong> conformance to st<strong>and</strong>ards. The regulated <strong>water</strong> qualityactivities include but are not limited to: Storm<strong>water</strong> Waste<strong>water</strong>Klotz Associates Project No. 0972.000.000January 201010-2Caldwell County Regional Water <strong>and</strong> Waste<strong>water</strong> Planning StudyFinal Report
General activities Agricultural operations City MS4s Industrial facilities10.4.1 The Texas 303(d) ListAs m<strong>and</strong>ated by the CWA, the Texas 303(d) List is a management tool to identifystreams that fail to have <strong>water</strong> quality that supports aquatic life <strong>and</strong> recreationaluse. In order to fulfill the requirements of the Section 303(d) of the federal CWAthe state requires Total Maximum Daily Loads be established for the impaired<strong>water</strong>shed. The Plum Creek Watershed Partnership was developed in an effort toinitiate remediation on a voluntary basis <strong>and</strong> in effort to mitigate sources ofpollution within the <strong>water</strong>shed <strong>and</strong> restore full use of the <strong>water</strong> body.Due to the unhealthy condition of the largest <strong>water</strong>shed in Caldwell County, PlumCreek was put on the Texas 303(d) List in 2002. The Texas Water QualityInventory <strong>and</strong> 303(d) List reports on the status of the state’s <strong>water</strong>s.10.4.2 Texas Pollutant Discharge Elimination System (TPDES)The state of Texas in 1998 assumed the authority to administer the NationalPollutant Discharge Elimination System (NPDES) program for the USEPA. TheTexas Commission on Environmental Quality (TCEQ) Texas Pollutant DischargeElimination System (TPDES) program now has regulatory authority overdischarges of pollutants to Texas surface <strong>water</strong>, with the exception of dischargesassociated with oil, gas, <strong>and</strong> geothermal exploration <strong>and</strong> development activities,which are regulated by the Railroad Commission of Texas.Klotz Associates Project No. 0972.000.000January 201010-3Caldwell County Regional Water <strong>and</strong> Waste<strong>water</strong> Planning StudyFinal Report
10.4.3 Source Water ProtectionSource Water Protection is not a regulated activity but a voluntary program thathelps public <strong>water</strong> systems protect their drinking <strong>water</strong> sources. The programrequires only time from the <strong>water</strong> utility staff to participate.10.5 Total Maximum Daily Loads Program (TMDL)A TMDL program works to improve <strong>water</strong> quality in impaired or threatened<strong>water</strong> bodies. The program is intended to control <strong>and</strong> monitor pollution bytargeting pollutants <strong>and</strong> their respective levels. The development of TMDL’s is ascientifically rigorous process of intensive data collection <strong>and</strong> analysis. The loadsare established after adoption by the TCEQ <strong>and</strong> review <strong>and</strong> approval by theUSEPA.With established TMDL, waste<strong>water</strong> permit holders are required to adhere tohigher levels of tertiary treatment to reduce the loadings on the stream. This willinclude implementation of new technologies <strong>and</strong> requirements to treat run-offfrom streets. Livestock <strong>and</strong> agricultural practices will need to implement bettermethods in order to reduce non-point source loadings.At this time TMDL have not been established for any stream segments inCaldwell County. Enforcement by the USEPA has not been implemented <strong>and</strong>only voluntary monitoring has been established.10.6 Plum Creek Watershed Protection PlanThe Plum Creek Watershed Protection Plan was developed in response to beingposted on the 303d list. Efforts of the Plum Creek Watershed Protection Plan werevoluntary <strong>and</strong> not m<strong>and</strong>ated by the USEPA. Efforts to remediate Plum Creek areunderway with recommended strategies to mitigate <strong>and</strong> eliminate pollutioncontributions.Klotz Associates Project No. 0972.000.000January 201010-4Caldwell County Regional Water <strong>and</strong> Waste<strong>water</strong> Planning StudyFinal Report
Pollution sources listed in the Plum Creek Watershed Protection Plan includedpets, sheep, goats, horses, cattle, deer, hogs, cropl<strong>and</strong>s, urban run-off, septicsystems, WWTF, <strong>and</strong> oil production facilities. Pollution contributions includebacteria, nutrients, <strong>and</strong> other constituents such as E.coli. Voluntary monitoring ofthese constituents in Plum Creek will continue until recommended st<strong>and</strong>ards aremet.Estimated loading sources of pollution in the Plum Creek Watershed are listed inTable 10-1. The Plum Creek Watershed Protection Plan monitored the streamlevels <strong>and</strong> collected data at monitoring stations to estimate pollutant loads <strong>and</strong>required reductions. A Load Duration Curve (LDC) to predict point <strong>and</strong> nonpointsource pollution was used with the SELECT approach to identify sources <strong>and</strong>contributions. SELECT is a Spatially Explicit Load Enrichment Calculation Tooldeveloped by the Spatial Sciences Laboratory <strong>and</strong> the Biological <strong>and</strong> AgriculturalEngineering Department at Texas A&M University.URBANWASTEWATERAGRICULTUREWILDLIFEOTHERTABLE 10-1Potential Pollution SourcesSource Bacteria Nutrients OtherRun-off x x xPets x xSeptic Systems x x xWWTF x x xSheep <strong>and</strong> Goats x xHorses x xCattle x xCropl<strong>and</strong> x x xDeer x xFeral Hogs x xOil <strong>and</strong>ProductionsxKlotz Associates Project No. 0972.000.000January 201010-5Caldwell County Regional Water <strong>and</strong> Waste<strong>water</strong> Planning StudyFinal Report
10.6.1 E.coli PotentialIt is estimated that the sub-<strong>water</strong>sheds with the most impervious cover have thegreatest potential to load the stream with the most average daily E.coli. InCaldwell County the cities of Lockhart <strong>and</strong> Luling have the greatest imperviouscover. The impervious cover creates a mode of transporting more constituents <strong>and</strong>bacteria found in pet waste to streams <strong>and</strong> rivers. Densities of pets are greater inurban areas yielding an increase in the concentrations <strong>and</strong> contribution from thecities.Estimated waste<strong>water</strong> <strong>and</strong> septic systems loads for Caldwell County were alsogreatest in Lockhart <strong>and</strong> Luling. Permitted discharges for waste<strong>water</strong> treatmentfacilities have the potential to release concentrated amounts of bacterial largerthan what is allowed by the Texas Water Quality St<strong>and</strong>ard criterion of 126cfu/100 mL.The potential impacts of agricultural contributions varied depending on thesource. For example, the E.coli from horse <strong>and</strong> cattle had the most significantloading impacts in the <strong>water</strong>shed, whereas sheep <strong>and</strong> goats only appeared tocontaminate the south <strong>and</strong> northwest portions of the basin. Deer <strong>and</strong> feral hogsalso have significant loading potential in Caldwell County.Oil <strong>and</strong> gas contributions were not assessed for E.coli in the Plum CreekWatershed Protection Plan. The loads contributed by oil <strong>and</strong> gas include othercompounds. Although, other pollutants such as trash <strong>and</strong> solid waste materials inthe <strong>water</strong>shed are not believed to contribute E.coli loadings, they do contribute tothe deterioration of the stream.10.7 Seasonal Loading ImpactsSignificant nonpoint source pollution loading contributions that degrade <strong>water</strong>quality are made during rainfall events. Storm<strong>water</strong> runoff contains high TSS,10-6Klotz Associates Project No. 0972.000.000Caldwell County Regional Water <strong>and</strong> Waste<strong>water</strong> Planning StudyJanuary 2010Final Report
VSS, COD, Bacteria, Nutrients, <strong>and</strong> Lead concentrations that are transported tothe streams. The continuous additions of constituents further concentrate thecontaminant levels in the <strong>water</strong>. The concentration levels are also increased whenrunoff disturbs once settled sediment. The agitation of the <strong>water</strong> reloads the oncesettled constituents back into the system. The concentrations of sampled data atmonitoring stations during dry <strong>and</strong> wet conditions help correlate loadings withhigh, mid-range, <strong>and</strong> low flow levels.Monitoring stations in Lockhart, Luling <strong>and</strong> Uhl<strong>and</strong> sampled constituents <strong>and</strong>plotted the results on a LDC. The LDC plots the condition of the stream flow withthe percent of days the flow exceeds the <strong>water</strong> quality st<strong>and</strong>ards. The LDC <strong>and</strong>monitored data provide a means to calculate the load reduction required to meet<strong>water</strong> quality st<strong>and</strong>ards. Tables 10-2, 10-3 <strong>and</strong> 10-4 list the load reductionscalculated to meet <strong>water</strong> quality st<strong>and</strong>ards. E.coli, Nitrate, Phosphorus, <strong>and</strong>Orthophosphorus were the constituents monitored.TABLE 10-2Estimated Loadings from Lockhart Monitoring StationLoadRequired % Reduction in FlowHigh- Moist Mid Range Dry - Low TargetE.coli 15 15Nitrate 18 66 80 80Orthophosphorus 49 49Total Phosphorus 5 5TABLE 10-3Estimated Loadings from Luling Monitoring StationLoadRequired % Reduction in FlowHigh- Moist Mid Range Dry - Low TargetE.coli 41 11 8 41Nitrate 1 1Phosphorus -Klotz Associates Project No. 0972.000.000January 201010-7Caldwell County Regional Water <strong>and</strong> Waste<strong>water</strong> Planning StudyFinal Report
TABLE 10-4Estimated Loadings from Uhl<strong>and</strong> Monitoring StationLoadRequired % Reduction in FlowHigh- Moist Mid Range Dry - Low TargetE.coli 65 51 26 65Nitrate 0.3 43 43Phosphorus 27 27E.coli was the consistent load that exceeded the st<strong>and</strong>ard in most flow conditionsat all monitoring sites. Nitrate was consistent in Dry-Low flow conditions as wasphosphorous. Phosphorus <strong>and</strong> Orthophosphorus also exceeded the st<strong>and</strong>ards inDry-Low flow conditions. The results correlate with the l<strong>and</strong> use. The monitorednutrients are found in fertilizers <strong>and</strong> pesticides commonly used in agriculture.The initiatives in the Plum Creek Watershed Protection Plan to control thecontaminant levels <strong>and</strong> restore Plum Creek to a healthy stream segment arediscussed in Section 14. The BMP recommendations in the Plum CreekWatershed Protection Plan can be implemented in any <strong>water</strong>shed as a proactiveapproach to maintaining healthy streams <strong>and</strong> rivers.Klotz Associates Project No. 0972.000.000January 201010-8Caldwell County Regional Water <strong>and</strong> Waste<strong>water</strong> Planning StudyFinal Report
SECTION 11WATER SUPPLY OPTIONS11.1 Regional Water PlansThe “2006 South Central Texas Regional Water Plan” (SCTRWP) represents 66<strong>water</strong> user groups that have identified <strong>water</strong> needs. The <strong>water</strong> plan details thestrategies to develop <strong>water</strong> resources to meet the needs <strong>and</strong> reduce dem<strong>and</strong>sthrough conservation. The South Central Texas Region, also know as Region L, isshown in Exhibit 11-1. The exhibit illustrates the represented counties in RegionL. In this section, a closer look is given at the plans <strong>and</strong> viability of the projectsmentioned. For the purpose of this <strong>study</strong>, only the proposed plans that influencethe supply for Caldwell County are discussed.The plans <strong>and</strong> strategies in the 2006 SCTRWP that are reviewed include:• Hays Caldwell Public Utility Agency (Plumbing Plan) supply project• Lower Guadalupe Water Supply Project• Lockhart Reservoir• Recycled Water Programs• Surface <strong>water</strong> rights• Local Carrizo• Local Storage (Aquifer Storage <strong>and</strong> Recovery)• Simsboro Aquifer• Weather Modification• Rain<strong>water</strong> Harvesting• Water Conservation.Additionally, the GBRA Mid-Basin Project, which is currently not in the 2006SCTRWP, will be discussed. The work effort to review the Mid-Basin project forthis <strong>study</strong> was sponsored by funds solely from the GBRA.Klotz Associates Project No. 0972.000.000January 201011-1Caldwell County Regional Water <strong>and</strong> Waste<strong>water</strong> Planning StudyFinal Report
Klotz Associates Project No. 0972.000.000January 201011-2Caldwell County Regional Water <strong>and</strong> Waste<strong>water</strong> Planning StudyFinal Report
11.1.1 GBRA Mid-Basin ProjectThe Guadalupe-Blanco River Authority (GBRA) is proposing a project that willprovide 25,000 ac-ft to customers of Caldwell, Comal, Gonzales, Guadalupe, <strong>and</strong>Hays Counties. The source of <strong>water</strong> will be primarily surface <strong>water</strong> from theGuadalupe River with a point of diversion below the confluence of the SanMarcos River. The <strong>water</strong> in the river at the proposed diversion point is notconsidered firm yield unless it is backed up with off channel storage or aground<strong>water</strong> source. Off-channel storage in Guadalupe County is beingconsidered for the Mid-Basin Project as well as a secondary source of supplyfrom the Carrizo <strong>and</strong>/or Wilcox Aquifers in west-central or northeast GonzalesCounty.A feasibility report has been prepared by HDR to assess the use of ground<strong>water</strong> tosupplement surface <strong>water</strong> during dry periods. During dry periods, <strong>water</strong> would besupplemented with ground<strong>water</strong> from the Carrizo/ Wilcox Aquifer to provide aconstant supply of 25,000 ac-ft/ yr.Ground<strong>water</strong> availability from the <strong>study</strong> was determined using the CCWQCSGAM model. The pumping simulation model was run over a period of 55 yearsfrom 2010 to 2065. Pumping <strong>and</strong> well distribution from the proposed field wasanalyzed in three scenarios. Two pumping scenarios were capable of producingup to 25,000 ac-ft/ yr alone from the Carrizo. The other alternative utilized theCarrizo-Wilcox wells with river <strong>water</strong>. The layout of the well field was assessedusing current GCUWCD rules for well spacing <strong>and</strong> requirements of 1 ac-ft peracre.The <strong>study</strong> used a baseline scenario for comparative purposes <strong>and</strong> to illustrate theground<strong>water</strong> level <strong>and</strong> projected draw down. Instream flow restrictions in thepumping simulations were based on the historical period from 1934 to 1989.Klotz Associates Project No. 0972.000.000January 201011-3Caldwell County Regional Water <strong>and</strong> Waste<strong>water</strong> Planning StudyFinal Report
The proposed GBRA Mid-Basin Project is a viable solution to meet the <strong>water</strong>needs of Caldwell County. The permits for this project have not been issued bypermitting agencies. Although it is a feasible solution, some concerns havedeveloped regarding environmental flows. Preservation of fresh <strong>water</strong> in streamsto maintain healthy ecosystems has caused some concern. Maintaining base flowsof fresh <strong>water</strong> are necessary for rivers <strong>and</strong> streams to remain healthy <strong>and</strong>balanced. The TCEQ, Texas Parks & Wildlife <strong>and</strong> the TWDB are working toestablish environmental flows <strong>and</strong> these flows will probably need to beestablished before permits will be issued.Other issues that the project must resolve include: Carrizo-Wilcox ground<strong>water</strong> availability (if needed for the project) Well spacing according to GCUWCD may require more l<strong>and</strong> leases oracquisitions (if ground<strong>water</strong> is needed) Obtaining ground<strong>water</strong> leases from l<strong>and</strong>owners if ground<strong>water</strong> is a part ofthe project11.1.2 Hays Caldwell Public Utility Agency Supply Project (HCPUA)The HCPUA was initially formed with the Canyon Regional Water Authority,Buda, Kyle, <strong>and</strong> San Marcos for the purpose of sharing <strong>water</strong> supplies <strong>and</strong> cost ofinfrastructure development. The HCPUA was created under Chapter 422 of theLocal Government Code General Law in January 2007. The role of the HCPUAis to provide wholesale <strong>water</strong> through the participants. The participants, who arepart owners in percentage distribution, could take a role of wholesale <strong>water</strong>distributors.The participants have been working together for approximately five years <strong>and</strong>initially had several interested entities. Many who were invited to participatechose not to pursue the project as a <strong>water</strong> supply strategy.Klotz Associates Project No. 0972.000.000January 201011-4Caldwell County Regional Water <strong>and</strong> Waste<strong>water</strong> Planning StudyFinal Report
The <strong>water</strong> supply strategies developed by the HCPUA are described in ThePlumbing Plan Report prepared by Lockwood, Andrews, <strong>and</strong> Newnam, Inc. Theplan outlines the purpose, approach, timeline, <strong>and</strong> cost of the projects the HCPUAproposes. An evaluation is given of the <strong>water</strong> supply options in the report <strong>and</strong>then makes recommendations on infrastructure improvements <strong>and</strong> build-outphases.The plan also developed scenarios based on a 50 year projection of <strong>water</strong> need. Itwas determined in the Plumbing Plan that <strong>water</strong> dem<strong>and</strong> will surpass supply2018. Some participants have been identified to need <strong>water</strong> before 2018. The planprojects a minimum <strong>water</strong> dem<strong>and</strong> of 27,000 ac-ft/ yr in 2060 based oninformation they received from participants. The projected dem<strong>and</strong> with highgrowth estimates from the State Data Center is approximately 142,000 ac-ft/ yr.The project proposes to pump from wells in the southeast corner of CaldwellCounty adjacent to Bastrop, Fayette <strong>and</strong> Gonzales Counties. Available yield inthis region of the Carrizo is expected to reach 15,000 ac-ft.The HCPUA is a viable project but will not meet all the needs for CaldwellCounty. The project would need to consider additional WUG to meet thedem<strong>and</strong>s of the <strong>county</strong>. Other issues that the project must resolve include: Carrizo-Wilcox ground<strong>water</strong> availability Well spacing according to GCUWCD may require more l<strong>and</strong> lease/acquisitions Obtaining leases from l<strong>and</strong>owners (at the time of this <strong>study</strong> no leases havebeen obtained)Klotz Associates Project No. 0972.000.000January 201011-5Caldwell County Regional Water <strong>and</strong> Waste<strong>water</strong> Planning StudyFinal Report
11.1.3 Lower Guadalupe Water Supply Project for GBRA NeedsThe Lower Guadalupe Water Supply Project (LGWSP) for GBRA was introducedinto the 2006 South Central Texas Regional Water Plan (SCTRWP) to meet <strong>water</strong>supply needs for customers in Caldwell, Comal, Guadalupe, Hays, <strong>and</strong> KendallCounties. The strategy would deliver 36,710 ac-ft/ yr of available <strong>water</strong> throughunderutilized GBRA <strong>and</strong> Union Carbide Corporation <strong>water</strong> rights from theGuadalupe River.The original LGWSP is no longer considered a viable strategy <strong>and</strong> has beenremoved from the SCTRWP. However, a smaller scale project using the conceptsof the original LGWSP is considered a viable strategy for <strong>water</strong> supplydevelopment. The smaller project appears to have fewer potential participantsthan the original LGWSP.11.1.4 Lockhart ReservoirThe Lockhart Dam <strong>and</strong> Reservoir project as described in the 2006 Region LWater Plan would be located upstream from Lockhart on Plum Creek as a meansof meeting projected <strong>water</strong> needs. The Lockhart Reservoir was recommended tobe included <strong>and</strong> considered as an important economic development. However, theoriginal Lockhart Reservoir Project is no longer viable because the area where thedam was proposed is being used to mitigate loss of wetl<strong>and</strong>s associated with theconstruction of SH 130. A reconfigured Lockhart Reservoir Project may be viablebut this strategy is not currently being actively pursued.11.1.5 Recycled Water ProgramsThe Recycled Waters Program involves the expansion or development ofprograms that reclaim municipal <strong>water</strong> for non-potable uses. Recycled <strong>water</strong> canbe used in to irrigate parks, cemeteries, golf courses, athletic fields, open spaces,Klotz Associates Project No. 0972.000.000January 201011-6Caldwell County Regional Water <strong>and</strong> Waste<strong>water</strong> Planning StudyFinal Report
<strong>and</strong> l<strong>and</strong>scape <strong>water</strong>ing. The <strong>water</strong> can also be used to cool building <strong>and</strong> forindustrial processes.This strategy is a feasible solution with the development of new treatmentfacilities. It may not be cost-effective to retrofit <strong>and</strong> modify existing systems toprovide this alternative.11.1.6 Surface Water RightsThe Surface Water Rights management strategy refers to the recognition ofexisting <strong>water</strong> rights available for purchase or lease under agreements from sellers<strong>and</strong> buyers. Additional diversion points consistent with TCEQ rules <strong>and</strong>applicable laws are consistent with the 2006 Regional Water Plan.In Caldwell County run-of-the-river surface <strong>water</strong> rights are not viable. The <strong>water</strong>rights for the San Marcos River have all been appropriated. There are no <strong>water</strong>rights available.11.1.7 Local CarrizoThe Local Carrizo management strategy involves the development <strong>and</strong> expansionof well fields in the Carrizo-Wilcox Aquifer. Local municipal <strong>and</strong> steam-electricalneeds would be met in Atascosa, Caldwell, Gonzales, Guadalupe, <strong>and</strong> WilsonCounties. The planned implementation of this strategy as listed in the 2006SCTRWP would provide new supplies totaling approximately 20,279 acft/ yr. Thecost would range from about $114 acft/yr to $443 acft/yr.This strategy is viable <strong>and</strong> utilized by the HCPUA (Plumbing Plan) <strong>and</strong> theGBRA Mid-Basin Project. However, ground<strong>water</strong> withdrawal permits <strong>and</strong> ifrequired, export permits, are currently being granted by ground<strong>water</strong> districts onalmost a “first come first serve basis” without a limitation on the total permittedvolume. In the future, the process to establish desired future conditions (DFC) <strong>and</strong>11-7Klotz Associates Project No. 0972.000.000Caldwell County Regional Water <strong>and</strong> Waste<strong>water</strong> Planning StudyJanuary 2010Final Report
the maximum available ground<strong>water</strong> from the aquifer may result in ground<strong>water</strong>management rules that restrict or curtail ground<strong>water</strong> production.11.1.8 Local StorageAccording to the SCTRWP, local storage involves implementing large, <strong>regional</strong>scale Aquifer Storage <strong>and</strong> Recovery (ASR) Projects <strong>and</strong>/or surface storagefacilities adequate in size to store surplus flows of surface <strong>water</strong> during periods ofhigh stream flows, including flood flows, to be available during extended periodsof drought. Present management strategies of the South Central Texas RegionalWater Plan are sized <strong>and</strong> scheduled to meet seasonal <strong>and</strong> daily variations ofdem<strong>and</strong>, but some current supplies may not be fully reliable during extended ormulti-year droughts. The lack of reliability creates the need for surface reservoirs,large scale ASR systems or multipurpose reservoirs. If the <strong>water</strong> managementneed is for a <strong>water</strong> source that could be made available for emergencies or usedduring drought, surplus <strong>water</strong> available during wet periods could be stored in theCarrizo or Gulf Coast Aquifers for future use or stored in surface <strong>water</strong> reservoirs.Surface <strong>water</strong> would generally require treatment prior to storing it in an ASRproject. Water treatment capacity necessary to meet peak day dem<strong>and</strong>s may beavailable at non-peak times (fall, winter, spring) to treat <strong>water</strong> for aquifer storage<strong>and</strong> subsequent recovery.At this time, no ASR has been formally proposed for Caldwell County. The PlumCreek Conservation District has taken the initiative to investigate the availabilityof an ASR in the <strong>county</strong>. Some potential sites have been located <strong>and</strong> will bestudied further to determine the characteristics <strong>and</strong> storage capacity of theformation. Exhibit 11-2 illustrates the potential ASR location as described by Mr.Feather Wilson.Klotz Associates Project No. 0972.000.000January 201011-8Caldwell County Regional Water <strong>and</strong> Waste<strong>water</strong> Planning StudyFinal Report
Klotz Associates Project No. 0972.000.000January 201011-9Caldwell County Regional Water <strong>and</strong> Waste<strong>water</strong> Planning StudyFinal Report
An ASR is a viable solution. Ground<strong>water</strong> rights can be fully exhausted on a<strong>regional</strong> basis <strong>and</strong> stored in an ASR. Diverted flows from rivers that exceed baseflood flows could also be stored with some treatment. The costs associated withan ASR would be dependent on the size of the void. The pipe network,transmission lines, <strong>and</strong> <strong>water</strong> treatment would also be cost to consider.11.1.9 The Simsboro AquiferThe Simsboro Aquifer <strong>water</strong> supply strategy involved the development of wellfields over the Simsboro Aquifer. The project was reportedly headed by the SanAntonio Water System (SAWS). SAWS <strong>and</strong> GBRA in 2008 were approached bya group of l<strong>and</strong>owners, known as the Brazos Valley Water Alliance, to develop aproject that would supply 200,000 ac-ft/ yr to participants.The Brazos Valley Water Alliance was formed in 2002 to represent l<strong>and</strong>ownersover the Simsboro Aquifer. The Alliance has approximately 180,000 acres of l<strong>and</strong><strong>and</strong> more than 1,200 l<strong>and</strong>owners. The Simsboro Aquifer is a member of theCarrizo/ Wilcox Aquifer which is capable of producing high quality <strong>water</strong>. Afterfurther investigation with SAWS no formal announcement or decision has beenreached to continue evaluating this strategy. Additional studies are needed to fullyevaluate this option.11.1.10 Weather ModificationThe weather modification strategy involves the practice of seeding clouds toincrease precipitation. Licensed professionals within the <strong>planning</strong> region wouldseed clouds with iodide. The practice does not guarantee precipitation <strong>and</strong> <strong>water</strong>quantity estimates can not be measured. The strategy would be intended forcropl<strong>and</strong>, livestock, <strong>and</strong> aquifer recharge. The strategy is still being studied <strong>and</strong>has been practiced since 2005 in some Texas counties.Klotz Associates Project No. 0972.000.000January 201011-10Caldwell County Regional Water <strong>and</strong> Waste<strong>water</strong> Planning StudyFinal Report
Weather modification is a good strategy but is not considered an applicable orviable solution to meet the future <strong>water</strong> needs of Caldwell County. Withoutconsistent results it can not be relied on to yield definite amounts of rainfall.11.1.11 Rain<strong>water</strong> HarvestingThe rain<strong>water</strong> harvesting management strategy captures <strong>and</strong> stores runoff fromrooftops for potable <strong>and</strong> non-potable use. In some instances this approach canadequately supply the needs of households <strong>and</strong> businesses.Rain<strong>water</strong> harvesting is a strategy that can assist in the dem<strong>and</strong>s projected byreducing per capita consumption. The effects of rain<strong>water</strong> harvesting if consumersparticipated on a city wide basis could have great results. Reducing dem<strong>and</strong> on a<strong>regional</strong> level would decrease the cost associated with developing new <strong>water</strong>sources or delay the timing. The Region L Water Plan estimated the cost of <strong>water</strong>developed by rain<strong>water</strong> harvesting as $2,000 per ac-ft. This cost is consideredhigh. The cost associated with this strategy could be shared cities <strong>and</strong>homeowners for existing homes. New development could be given incentives forinstalling systems on homes <strong>and</strong> buildings. Changes in city developmentst<strong>and</strong>ards could also require such systems.11.1.12 Water Conservation StrategyThe <strong>water</strong> conservation strategy is suggested to be part of every <strong>water</strong>management plan. It involves implementing programs <strong>and</strong> practices that willdecrease <strong>water</strong> use per capita.Municipally this approach is done by the use of low flow plumbing fixtures,selection of <strong>water</strong> efficient appliances, modifying l<strong>and</strong>scaping or xeriscaping,addressing plumbing repairs, <strong>and</strong> modifying personal behavior.Agricultural conservation methods include installing low energy precisionapplication (LEPA) irrigation systems <strong>and</strong> furrow dikes.11-11Klotz Associates Project No. 0972.000.000Caldwell County Regional Water <strong>and</strong> Waste<strong>water</strong> Planning StudyJanuary 2010Final Report
The <strong>water</strong> conservation strategy is feasible <strong>and</strong> recommended to be employedwith any other viable solution.11.1.13 DesalinationDesalination is a <strong>water</strong> management strategy that involves treating brackishground<strong>water</strong> or sea<strong>water</strong>. The desalination strategy lead to developing facilitiesadjacent to well fields in the Carrizo or intake <strong>and</strong> treatment facilities on the shoreof the San Antonio Bay.Although desalination could meet the <strong>water</strong> needs of Caldwell County, at thistime this strategy is not a feasible solution. This strategy requires support frommany local, state, <strong>and</strong> governmental participants to be considered a viablesolution in meeting <strong>water</strong> needs for Caldwell County.11.2 ConclusionsThe strategies reviewed for use in meeting the future <strong>water</strong> needs of Caldwell Countyindicate that there are potential solutions but the implementation of any of theprojects will be costly <strong>and</strong> will require a dedicated effort to implement on a schedulethat does not limit growth or development within the <strong>county</strong>. Multiple strategies maybe implemented to ensure the “<strong>water</strong> future” of Caldwell County.The most viable near term strategies appear to be the development of the GBRA Mid-Basin Project <strong>and</strong>/or the HCPUA Project. Each of these projects will rely onwithdrawal of <strong>water</strong> from the Carrizo Aquifer. The GBRA Mid-Basin project has theadded advantage of ground<strong>water</strong> plus surface <strong>water</strong> supplies.The use of a local ASR project to store surplus <strong>water</strong> in wetter years for futurewithdrawal is a strategy that merits further investigation. The ASR Project could becombined with the Mid-Basin Project or HCPUA to increase available <strong>water</strong> suppliesduring times of drought.Klotz Associates Project No. 0972.000.000January 201011-12Caldwell County Regional Water <strong>and</strong> Waste<strong>water</strong> Planning StudyFinal Report
Developing <strong>water</strong> from the Simsboro Aquifer appears to be a strategy that could yieldsignificant amounts of <strong>water</strong> for use in the central Texas region including CaldwellCounty. Development of this project will depend on a large number of potential userswith significant needs coming together <strong>and</strong> jointly developing the project. Theschedule for development of his project appears to be beyond the time when <strong>water</strong>will be needed in Caldwell County.Desalination is a strategy that can meet the future <strong>water</strong> of the central Texas region.However, the cost <strong>and</strong> challenges associated with this project indicate thatdesalination will probably not be implemented within the <strong>planning</strong> horizon of this<strong>study</strong>.Klotz Associates Project No. 0972.000.000January 201011-13Caldwell County Regional Water <strong>and</strong> Waste<strong>water</strong> Planning StudyFinal Report
SECTION 12REGIONAL WATER PLANNING12.1 GeneralAccording to the 2006 SCTRWP, several of the <strong>water</strong> providers in CaldwellCounty are expected to have shortages in the coming years. Table 12-1 lists theentities in Caldwell County <strong>and</strong> their respective shortage, as determined by theSCTRWP. The expansion <strong>and</strong>/or creation of new <strong>water</strong> management strategieswill be necessary to meet the needs in Caldwell County. Proposed <strong>water</strong>management strategies in the SCTRWP will be exp<strong>and</strong>ed on <strong>and</strong> a <strong>regional</strong>network will be developed in this section.Regional cooperation is necessary not only to mitigate cost but also to jointly findsolutions that will benefit all participants. Communication <strong>and</strong> collaboration areefforts that are required to plan <strong>and</strong> implement a <strong>regional</strong> <strong>water</strong> plan.TABLE 12-1Caldwell County 2006 SCTRWP Projected Shortages (ac-ft)Water SupplierProjected Shortage2010 2020 2030 2040 2050 2060Aqua WSC 49 121 178 240 300 362City of Lockhart WSC 341 984 1,519 2,070 2,615 3,175City of Luling 168 311 400 485 587 695Creedmoor Maha 0 0 0 0 0Martindale WSC 2 19 41Maxwell WSC 73 249 479 692Polonia WSC 137 331 520 719Tri Community WSCCounty Line WSC 44 1,096 1,416 1,582 1,900 2,365Goforth WSC 79 532 969 1,415 1,963 2,408San Marcos 79 532 969 1,415 1,963 2,408Gonzales County 0 14 75 208 254 255Klotz Associates Project No. 0972.000.000January 201012-1Caldwell County Regional Water <strong>and</strong> Waste<strong>water</strong> Planning StudyFinal Report
12.2 Water Supply SourcesWater supplies vary for the local <strong>water</strong> utilities. Surface <strong>water</strong> is supplied fromGBRA <strong>and</strong> CRWA through river-run-of-rights. Ground<strong>water</strong> is supplied throughwell permits in the Edwards (Barton Springs) Aquifer, Wilcox-Carrizo Aquifer,<strong>and</strong> Alluvial Wells. Future <strong>water</strong> supplies from these sources are expected todevelop further to meet dem<strong>and</strong>s. Water supplies that are available to CaldwellCounty have been listed in Table 12-2. The information presented is from a queryperformed on the TWDB website on available <strong>water</strong> by source. The <strong>water</strong> sourceslisted in the survey by the WUG’s were searched to provide information on the<strong>water</strong> available.The accessible <strong>water</strong> supplies from the named sources in Table 12-2 decrease foreach decade. The available supplies in 2010 are 10,878 ac-ft, 2020 has 10,838 acft,2030 has 10,071 ac-ft, <strong>and</strong> 2040 has 10,063 ac-ft.Given the listed supplies <strong>and</strong> calculated <strong>water</strong> dem<strong>and</strong>s discussed in Section 8, theexpected shortages are slightly greater that the SCTRWPG. The difference islikely based on greater population estimates <strong>and</strong> different per capita values. Arevised municipal dem<strong>and</strong> for the “TWDB County Water Dem<strong>and</strong> Projections” ispresented in Table 12-3. The municipal dem<strong>and</strong> revision reflects the <strong>water</strong>dem<strong>and</strong>s determined in this <strong>study</strong>. Table 12-4 presents the expected shortagesbased on these revisions <strong>and</strong> <strong>study</strong> determinations.Klotz Associates Project No. 0972.000.000January 201012-2Caldwell County Regional Water <strong>and</strong> Waste<strong>water</strong> Planning StudyFinal Report
TABLE 12-2Caldwell County Water Supplies (ac-ft)Supply Supply Supply SupplyWUG NameSource Name2010 2020 2030 2040CARRIZO-WILCOX AQUIFER Mining 16 10 4 0CARRIZO-WILCOX AQUIFER Manufacturing 84 84 84 84CARRIZO-WILCOX AQUIFER Irrigation 1,037 916 809 714CARRIZO-WILCOX AQUIFER Lockhart 2,310 2,310 2,310 2,310CARRIZO-WILCOX AQUIFER Luling 2,730 2,730 2,730 2,730CARRIZO-WILCOX AQUIFER County-Other 3,173 3,264 2,604 2,698Sub-Total 9,350 9,314 8,541 8,536GUADALUPE RUN-OF-RIVER Luling 99 99 99 99GUADALUPE RUN-OF-RIVER Martindale 198 198 198 198GUADALUPE RUN-OF-RIVER County-Other 613 613 613 613Sub-Total 910 910 910 910CANYON LAKE/RESERVOIR Martindale 50 50 50 50CANYON LAKE/RESERVOIR County-Other 258 258 258 258Sub-Total 308 308 308 308EDWARDS-BFZ AQUIFER County Other 161 161 161 161Sub-Total 161 161 161 161QUEEN CITY AQUIFER Mining 0 0 0 0QUEEN CITY AQUIFER Manufacturing 3 3 3 3QUEEN CITY AQUIFER Irrigation 36 32 28 25QUEEN CITY AQUIFER County-Other 110 110 120 120Sub-Total 149 145 151 148Total Supply 10,878 10,838 10,071 10,063Data obtained from TWDB WUG Supplies at http://www.twdb.state.tx.us/assistance/rwpg/DB02/index.aspTABLE 12-3TWDB County Water Dem<strong>and</strong> ProjectionsBased on Revised Municipal Dem<strong>and</strong>s2010-2040 in ac-ftCategory 2010 2020 2030 2040Irrigation 1,044 928 824 733Livestock 918 918 918 918Manufacturing 15 18 21 24Mining 14 15 16 17Municipal 7,781 10,932 14,602 16,803Steam Electric 0 0 0 0Total Dem<strong>and</strong> 9,772 12,811 16,381 18,495TABLE 12-4Caldwell County Additional Water Need (ac-ft)Year 2010 2020 2030 2040Expected Need (1,106) 1,973 6,310 8,432Klotz Associates Project No. 0972.000.000January 201012-3Caldwell County Regional Water <strong>and</strong> Waste<strong>water</strong> Planning StudyFinal Report
Regional facilities in this <strong>study</strong> will be developed to meet the approximateadditional need of 8,500 ac-ft. Facilities <strong>and</strong> transmission lines will be sized toprovide the determined need.12.3 Conceptual PlanningIn the evaluation of the population projections it was stated earlier that most of thedevelopment <strong>and</strong> growth is expected to occur to the north <strong>and</strong> west between the I-35 <strong>and</strong> SH 130 Highways. Planning for Caldwell County will develop with theunderst<strong>and</strong>ing that growth will begin from the north <strong>and</strong> west <strong>and</strong> then south toLuling. Water systems will be planned to accommodate the growth <strong>and</strong> allow forfurther <strong>regional</strong> expansion. This approach will also consider both the HCPUA<strong>and</strong> the GBRA Mid-Basin Project strategies.12.3.1 Source DevelopmentUtilizing the viable strategies of the HCPUA <strong>and</strong> the Mid-Basin Project, <strong>water</strong>sources from the Carrizo-Wilcox <strong>and</strong> Guadalupe River Basin will be developed.As shown in Exhibit 12-1, the initial delivery of the raw surface <strong>water</strong> will be toLuling <strong>and</strong> the delivery of ground<strong>water</strong> will be to Lockhart. Luling currentlyoperates a <strong>water</strong> treatment plant that is capable of diverting up to 4,422 ac-ft/ yr of<strong>water</strong> with a peak rate treatment capacity of 2.779 MGD. The plant delivers the<strong>water</strong> to the city of Luling <strong>and</strong> Lockhart. The transmission line that would route<strong>water</strong> to Luling for treatment is shown in a dashed blue line <strong>and</strong> the existing linethat delivers the <strong>water</strong> to Lockhart is solid red. The dashed red line indicates theground<strong>water</strong> route delivered to Lockhart. Another route to consider forground<strong>water</strong> is taken from a well field south of Caldwell County <strong>and</strong> delivered toLuling. Well fields that have been located for ground<strong>water</strong> development are notedas “Well Area” in Exhibit 12-2. Surface <strong>water</strong> diversions at the confluence of theSan Marcos <strong>and</strong> Guadalupe River are noted as “Surface Water Area” in theexhibit.Klotz Associates Project No. 0972.000.000January 201012-4Caldwell County Regional Water <strong>and</strong> Waste<strong>water</strong> Planning StudyFinal Report
Klotz Associates Project No. 0972.000.000January 201012-5Caldwell County Regional Water <strong>and</strong> Waste<strong>water</strong> Planning StudyFinal Report
Klotz Associates Project No. 0972.000.000January 201012-6Caldwell County Regional Water <strong>and</strong> Waste<strong>water</strong> Planning StudyFinal Report
12.3.2 DistributionThe <strong>water</strong> will be delivered through a 24” transmission line flowing at 5 fps. Once<strong>water</strong> is delivered to designation delivery points it is recommended to develop a<strong>regional</strong> <strong>water</strong> distribution system as shown in Exhibit 12-2. The development ofthe Luling-Lockhart <strong>water</strong> transmission was a project that formed the beginningof a <strong>regional</strong> <strong>water</strong> distribution system. The following actions are recommendedto further develop a <strong>regional</strong> <strong>water</strong> distribution system:Develop <strong>water</strong> sources to initial delivery point (Lockhart/ Luling)Develop a route to Uhl<strong>and</strong> where population growth is expected tobe the greatestDevelop a transmission line route along SH 130 toward I-35 NDevelop a transmission line route along SH-130 WestDevelop a transmission line route to loop the systemDevelopment of the transmission lines would create a <strong>regional</strong> <strong>water</strong> distributionsystem that would not only aid Caldwell County, but also the neighboringcounties in need of <strong>water</strong>. The benefit of including adjacent counties to participateis cost related. Sharing cost provides an incentive for many participants to pooltogether resources to develop the <strong>water</strong> sources needed for future <strong>water</strong> dem<strong>and</strong>s.Current plans in the SCTRWP that detail the same routes are the Plumbing Pl<strong>and</strong>eveloped by the Hays/Caldwell PUA <strong>and</strong> the GBRA Mid-Basin Project. Exhibit12-3 provides an illustration of approximate line locations. The Plumbing Reportlists three options of delivery points that include the San Marcos WTP, the City ofKyle elevated storage tank (EST) <strong>and</strong> the City of Buda well site #3 where theyhave a ground storage tank (GST) that can be utilized. The Mid-Basin Projecttransmission main would in all scenarios deliver 4,000 acft of surface <strong>water</strong> to theSan Marcos WTP.Klotz Associates Project No. 0972.000.000January 201012-7Caldwell County Regional Water <strong>and</strong> Waste<strong>water</strong> Planning StudyFinal Report
Klotz Associates Project No. 0972.000.000January 201012-8Caldwell County Regional Water <strong>and</strong> Waste<strong>water</strong> Planning StudyFinal Report
12.4 Water System Cost EstimatesVarious studies, reports, <strong>and</strong> recent bids were used to develop cost estimates.Table 12-5 presents a summary of the estimated associated project cost for theproposed transmission lines. Current economic conditions may cause moderatefluctuations in construction costs <strong>and</strong> estimates. Appendix M provides a basis forthe proposed cost estimate.TABLE 12-5Project Summary CostITEMNO. ITEM DESCRIPTION AMOUNT1 Line 1A - Ground<strong>water</strong> Source Route to Lockhart $33,800,0002 Line 1B - Ground<strong>water</strong> Source Route to Luling $30,000,0003 Line 1C - Surface Water Source Route to Luling $51,500,0004 Line 2 - SH 130 North Route $12,000,0005 Line 3 - Northwest Route to Uhl<strong>and</strong> $7,000,0006 Line 4 - SH 130 West $10,000,000It is recommended first to develop wells in the Carrizo/ Wilcox Aquifer initiallywith either Transmission Line 1A or 1B <strong>and</strong> begin to branch out before theexpected growth. As growth occurs, a network of pipelines can begin to beestablished <strong>regional</strong>ly to provide for a <strong>regional</strong> supply. The construction of SH130 presents an opportunity to develop two of the branch network lines to supply<strong>water</strong> in the areas of expected growth. Transmission Line 2 <strong>and</strong> Line 4 arerecommended to parallel SH 130.Klotz Associates Project No. 0972.000.000January 201012-9Caldwell County Regional Water <strong>and</strong> Waste<strong>water</strong> Planning StudyFinal Report
SECTION 13REGIONAL WASTEWATER PLANNING13.1 IntroductionRegional waste<strong>water</strong> <strong>planning</strong> is needed with the expected growth in CaldwellCounty. Evaluation of several options regarding collection treatment systems wasnecessary to provide recommendations for <strong>planning</strong> <strong>and</strong> implementation.Identifying the existing facilities in the <strong>county</strong> was a task necessary to underst<strong>and</strong>the current systems <strong>and</strong> identify needed improvements or changes.13.2 Existing Waste<strong>water</strong> Collection SystemsLockhart <strong>and</strong> Luling are the two municipalities that currently provide waste<strong>water</strong>collection services. The remainder of the <strong>county</strong> is rural with septic systems inuse. As previously mentioned, Lockhart has two facilities that treat a combinedflow of 2.6 MGD <strong>and</strong> Luling also has two plants that treat a combined flow of 1.1MGD. Three of the four treatment plants discharge into Plum Creek. One plantfrom Luling discharges into the San Marcos River.Areas outside city limits <strong>and</strong> in unincorporated areas utilize on-site sewagefacilities (OSSF) also known as septic systems. Septic system use in CaldwellCounty for urban regions <strong>and</strong> undeveloped portions of the <strong>county</strong> is typical <strong>and</strong>has steadily risen since 2005. The Director of Sanitation for Caldwell Countyprovided the data shown in Table 13-1 <strong>and</strong> Graph 13-1. The numbers of SepticSystem Certificates of Completion are listed for the last ten years.Klotz Associates Project No. 0972.000.000January 201013-1Caldwell County Regional Water <strong>and</strong> Waste<strong>water</strong> Planning StudyFinal Report
300272GRAPH 13-1Caldwell County OSSF Certificates of Completion274250248278200172Permits150174130155153163100120OSSF Permits5001998 1999 2000 2001 2002 2003 2004 2005 2006 2007 2008YearTABLE 13-1Caldwell County On-Site Sewage Facilities (OSSF)Certificates of Completion 1998 2481999 2722000 2782001 2742002 1742003 1722004 1302005 1202006 1552007 1532008 163Klotz Associates Project No. 0972.000.000January 201013-2Caldwell County Regional Water <strong>and</strong> Waste<strong>water</strong> Planning StudyFinal Report
13.3 Waste<strong>water</strong> System PlanningThe development of waste<strong>water</strong> facilities will be based on growth <strong>and</strong> l<strong>and</strong>topography. A gravity flow systems is the expected design. Assumptions of l<strong>and</strong>development are made based on typical patterns that occur along corridors.Exhibit 13-1 illustrates the general areas that were considered in the evaluation offuture growth. Steep elevation zones, floodplains, <strong>and</strong> drainage basins were thegoverning factors for determining the locations of the <strong>regional</strong> facilities <strong>and</strong> thedecentralized systems.It will be expected that as the population grows, the areas between San Marcos,Luling, Lockhart, <strong>and</strong> Mustang Ridge will become densely populated. Area 2 asshown in the exhibit is expected to show the initial growth with developmentfollowing in areas 1 <strong>and</strong> 3. Areas 4 <strong>and</strong> 5 are not expected to grow as rapidly <strong>and</strong>become as densely populated. The construction of SH 130 will bring about achange in the l<strong>and</strong> development for the area.13.4 Waste<strong>water</strong> Collection System Service AreasThe location of collection systems were based on the naturally occurring drainagebasins. There are three major drainage basins in the <strong>county</strong> which can be utilizedto develop systems transported by gravity. Gravity systems require very littleenergy <strong>and</strong> are typically less costly to develop <strong>and</strong> maintain than systems thatrequire pumping. Evaluations of the service areas, as shown in Exhibit 13-2, weredefined as follows:1. The Lockhart Regional Facility Area - This service area willinclude Lockhart <strong>and</strong> the northern area of the <strong>county</strong> that willdevelop as SH 130 develops from Mustang Ridge.Klotz Associates Project No. 0972.000.000January 201013-3Caldwell County Regional Water <strong>and</strong> Waste<strong>water</strong> Planning StudyFinal Report
Klotz Associates Project No. 0972.000.000January 201013-4Caldwell County Regional Water <strong>and</strong> Waste<strong>water</strong> Planning StudyFinal Report
Klotz Associates Project No. 0972.000.000January 201013-5Caldwell County Regional Water <strong>and</strong> Waste<strong>water</strong> Planning StudyFinal Report
2. The Martindale Regional Facility Area – This service area willinclude Martindale <strong>and</strong> the area west of Lockhart. It is expectedthat this segment of SH 130 will bring development <strong>and</strong> growth.3. The Luling Regional Facility Area – This service area will includeLuling <strong>and</strong> the area north of Luling. This service area will alsoinclude the portion of Caldwell County that is in the San MarcosDrainage Basin.4. The Peach Creek Regional Facility Area – This service willinclude the Peach Creek Drainage Basin areas in Caldwell County.This area is not expected to develop at significant rates. This areawas established in this <strong>study</strong> for the purpose of providing a facilityin every drainage basin represented.13.5 Waste<strong>water</strong> Collection System OptionsRegional facilities <strong>and</strong> decentralized systems, which include package treatmentfacilities <strong>and</strong> OSSF’s, were considered in the evaluation of waste<strong>water</strong> treatmentfacilities. The recommended facilities were based on:1. Population projections developed in this <strong>study</strong>2. Waste<strong>water</strong> return flows were based on 150 gpcd of <strong>water</strong>3. 68% return flow rate4. Waste<strong>water</strong> treatment would be provided for 100% of population5. Service plan does not include individual connections (lateral)13.5.1 On-Site Sewage Facilities (OSSF) / Septic SystemsUpon evaluation of septic systems use in the <strong>county</strong>, septic systems were notconsidered to be an appropriate alternative to serve a growing community.Installation of these systems in an already impaired <strong>water</strong>shed could prove to beKlotz Associates Project No. 0972.000.000January 201013-6Caldwell County Regional Water <strong>and</strong> Waste<strong>water</strong> Planning StudyFinal Report
more costly financially <strong>and</strong> environmentally in long-term <strong>planning</strong>. Discharge ofthese systems cannot be monitored <strong>and</strong> evaluated on a regular basis to ensure thedischarge meets st<strong>and</strong>ard requirements. Homeowners, in most cases, are notconcerned or aware of problems until the issues become visible. Remediationefforts due to the contribution of failing OSSF’s are unnecessary if appropriate<strong>planning</strong> measures are implemented to limit these systems. Larger lot sizes <strong>and</strong>buffer zones can decrease the loads imposed by OSSF.Development of more stringent ordinances <strong>and</strong> preferences should be establishedto regulate private sewage facilities. The <strong>county</strong> has a position to take on thesesystems in areas expected to develop. Provisions need to be made for privateowners in isolated rural areas that are not <strong>planning</strong> to develop the property <strong>and</strong> arenot within 300 feet of a sewer line.13.5.2 Regional Treatment FacilitiesRegional treatment facilities have traditionally been implemented in <strong>regional</strong><strong>planning</strong> efforts. Economies of scale have been the motivating factor for the“bigger is better” selection rationale. Larger treatment facilities do provide costeffective solutions for waste<strong>water</strong> treatment. Communities typically have anexpectation of safer <strong>and</strong> better quality st<strong>and</strong>ards due to the municipal oversight.Federal regulations <strong>and</strong> funding have also been oriented toward centralizedcollection <strong>and</strong> delivery of point source discharges.The <strong>regional</strong>ization of waste<strong>water</strong> systems for the <strong>county</strong> does provides thebenefit of minimizing the number of decentralized systems, including OSSF.Minimizing the number of point source discharges have the additional benefit ofensuring regulation <strong>and</strong> monitoring by municipalities or river authorities.13.5.3 Decentralized Treatment FacilitiesMultiple treatment facilities within a service area can be described asdecentralized systems. The Turner Crest WW treatment facility is an example of aKlotz Associates Project No. 0972.000.000January 201013-7Caldwell County Regional Water <strong>and</strong> Waste<strong>water</strong> Planning StudyFinal Report
decentralized system providing sewer services to the subdivision it woulddevelop.A shift in paradigm is occurring where decentralized systems are beingconsidered more feasible, environmentally friendly, <strong>and</strong> aesthetically pleasing ifdesigned, constructed, <strong>and</strong> operated properly.As permanent components of infrastructure, it would be in the best interest of thepublic for the facilities to be managed by a public utility.The smaller footprint of a decentralized system impacts the environmentminimally. The system would require less l<strong>and</strong> <strong>and</strong> minimize or eliminate effluentdischarges. Recycling 100% of the discharge can also provide monetary benefits<strong>and</strong> reduce per capita <strong>water</strong> dem<strong>and</strong>s. The systems in the communities can bel<strong>and</strong>scaped to be appealing <strong>and</strong> provide an aesthetic value to the area. Thesystems can also allow for development in rural areas where sewer service is notavailable. Energy use of a decentralized system can be substantially lower than a<strong>regional</strong> facility. Lastly, air quality issues are minimized.The decentralized systems would be sized <strong>and</strong> located to serve smaller <strong>water</strong>sheds<strong>and</strong> communities. Placement of these facilities would require analysis of smallerregions. An example of these system locations at the <strong>regional</strong> level are shown inExhibit 13-3.13.5.4 Package Treatment FacilitiesPackage treatment plants are pre-assembled <strong>and</strong> factory installed treatmentfacilities that effectively utilize energy <strong>and</strong> mechanical, biological, chemical orphysical treatments processes. They offer minimal on-site construction cost, fastplant start-up <strong>and</strong> cost efficient operation <strong>and</strong> maintenance (O&M). O&M issimple <strong>and</strong> requires minimal supervision.Klotz Associates Project No. 0972.000.000January 201013-8Caldwell County Regional Water <strong>and</strong> Waste<strong>water</strong> Planning StudyFinal Report
Klotz Associates Project No. 0972.000.000January 201013-9Caldwell County Regional Water <strong>and</strong> Waste<strong>water</strong> Planning StudyFinal Report
Unfortunately, the simplicity of O&M has reportedly caused some plants to be outof compliance. The results of these facilities being managed incorrectly can causedetriment <strong>and</strong> degradation to the surrounding environment. For this reason, it willbe recommended for these facilities to be operated by trained personnel.Typical applications are in l<strong>and</strong> development subdivisions, small cities, mobilehome parks, <strong>and</strong> recreational areas. These package treatment facilities may bebeneficial to apply as growth develops in urban areas <strong>and</strong> then to replace as thelife of the system expires. These systems would act as decentralized systems <strong>and</strong>are recommended to be operated by public utilities to provide a service for thepublic health.13.6 Proposed Waste<strong>water</strong> Collection FacilitiesThe proposed <strong>regional</strong> <strong>and</strong> decentralized facilities are recommended to reuse100% of the effluent. With stringent treatment levels for all collection facilities,the treated waste<strong>water</strong> can be reused within the community it is serving. There isopportunity for reuse in both centralized <strong>and</strong> decentralized systems. The reuse<strong>water</strong> can serve to irrigate developments in nearby communities. Hospitals,schools, theaters, manufacturers, industries, <strong>and</strong> other facilities that require largeamounts of <strong>water</strong> for irrigation <strong>and</strong> cooling of buildings are target customers ofreclaimed <strong>water</strong>.Although the recommendation is to reuse 100% of the waste<strong>water</strong>, it may notentirely feasible for utilities to provide this service in existing facilities. The costmay exceed the benefits. Also, development <strong>and</strong> design of new facilities shouldemploy this strategy with further investigation into the effects of instream flows<strong>and</strong> current laws.The proposed <strong>regional</strong> collection facilities are to provide sewer services to theLockhart, Martindale, Luling, <strong>and</strong> Peach Creek service areas as discussed earlier.Klotz Associates Project No. 0972.000.000January 201013-10Caldwell County Regional Water <strong>and</strong> Waste<strong>water</strong> Planning StudyFinal Report
The projected flows developed in Section 9 <strong>and</strong> found in Table 9-3 were furtherevaluated to determine waste<strong>water</strong> flows for the service areas mentioned. Apercentage of the expected population was assigned to each service area toestimate a waste<strong>water</strong> flow for that service area. The percentages <strong>and</strong> expectedwaste<strong>water</strong> flows are shown in Table 13-2. Lockhart was expected to produce40%, Luling 35%, Martindale 20% <strong>and</strong> Peach Creek 5% of the projectedwaste<strong>water</strong> flows.Table 13-2Service Areas Projected Waste<strong>water</strong> FlowsTotal Projected Waste<strong>water</strong> Flows 2010 2020 2030 2040(MGD) in given Year 4.723 6.636 8.864 10.200Service Area Percentage Waste<strong>water</strong> Flows for Service AreasLockhart 40% 1.889 2.654 3.546 4.080Luling 35% 1.653 2.323 3.102 3.570Martindale 20% 0.945 1.327 1.773 2.040Peach Creek 5% 0.236 0.332 0.443 0.51013.6.1 Option 1 - Regional FacilitiesThe <strong>regional</strong> facilities option is to develop one <strong>regional</strong> facility in the fourdetermined service areas. This option reduces the number of treatment systemswith an anticipated lower unit cost of treatment. However, with a 100% reusedistribution system, this may prove to be more costly than other options. Reuselines in a <strong>regional</strong> facility may be limited.13.6.2 Option 2 - Decentralized/ Package Treatment SystemsIt is suggested by other industry professionals to consider implementing systemsdelineated by smaller drainage basins to serve local subdivisions <strong>and</strong>commercial/industrial sites. Having a smaller community collection <strong>and</strong> reusedistribution system can provide environmental benefits that outweigh otherKlotz Associates Project No. 0972.000.000January 201013-11Caldwell County Regional Water <strong>and</strong> Waste<strong>water</strong> Planning StudyFinal Report
associated costs. Efficient <strong>and</strong> functional <strong>planning</strong> of these facilities with plannedcommunity development is necessary to be cost-effective.This alternative also considers phasing out ineffective systems that are notfunctional. The collections systems can be removed <strong>and</strong> lines extended to connectto a network in place. Connection to a sewer main will route the waste<strong>water</strong> to a<strong>regional</strong> facility. These systems should be strategically placed in locations thatallow for the option to be phased out.13.6.3 Option 3 - Combined FacilitiesDecentralized systems, in combination with <strong>regional</strong> facilities, can work togetherto provide load reductions in streams <strong>and</strong> rivers. Decentralized systems cancollect, treat the waste<strong>water</strong> <strong>and</strong> enable local reuse of the <strong>water</strong>. This approachpromotes reuse of treated waste<strong>water</strong>. The unusable sludge slurry can be piped toa <strong>regional</strong> treatment plant <strong>and</strong> treated at that plant prior to disposal.13.7 Proposed Regional Waste<strong>water</strong> FacilitiesThe recommended <strong>regional</strong> waste<strong>water</strong> facilities for Caldwell County arepresented in Exhibit 13-4 <strong>and</strong> include:• Lockhart Regional Waste<strong>water</strong> Treatment Plant in 2040 is expected to treat4.1 million gallons per day receiving 40% of the total waste<strong>water</strong> produced inthe <strong>county</strong>. Approximately 32 miles of main waste<strong>water</strong> collection lines areproposed for this treatment plant.• Luling Regional Waste<strong>water</strong> Treatment Plant in 2040 is expected to treat 3.6million gallons per day receiving 35% of the total waste<strong>water</strong> produced in the<strong>county</strong>. Approximately 33 miles of main waste<strong>water</strong> collection lines areproposed to service this treatment plant.Klotz Associates Project No. 0972.000.000January 201013-12Caldwell County Regional Water <strong>and</strong> Waste<strong>water</strong> Planning StudyFinal Report
• Martindale Regional Waste<strong>water</strong> Treatment Plant in 2040 is expected to treat2.1 million gallons per day receiving 20% of the total waste<strong>water</strong> produced inthe <strong>county</strong>. Approximately 11 miles of main waste<strong>water</strong> collection lines areproposed to service this treatment plant.• Peach Creek Regional Waste<strong>water</strong> Treatment Plant in 2040 is expected totreat 0.6 million gallons per day receiving 5% of the total waste<strong>water</strong>produced. Approximately 9 miles of main waste<strong>water</strong> collection lines areproposed to service this treatment plant.Table 13-3 presents estimated cost for each <strong>regional</strong> treatment plant based on aplant cost of $3.75 per gallon of treatment capacity <strong>and</strong> in-place waste<strong>water</strong> maincost of $125 per linear foot of pipeline. Appendix M presents additionalinformation on the waste<strong>water</strong> cost estimatesTABLE 13-3Regional Waste<strong>water</strong> Collection <strong>and</strong> Treatment Plant Cost EstimatesLockhart PlantEstimated Cost in Millions of DollarsLuling PlantMartindalePlantPeach CreekPlantItem 4.1 mgd 3.6 mgd 2.1 mgd 0.6 mgdPlant Cost $15.3 $13.4 $7.7 $1.9Main Collection Lines $21.1 $20.1 $7.0 $5.7Total $36.4 $33.5 $14.7 $7.6Klotz Associates Project No. 0972.000.000January 201013-13Caldwell County Regional Water <strong>and</strong> Waste<strong>water</strong> Planning StudyFinal Report
Klotz Associates Project No. 0972.000.000January 201013-14Caldwell County Regional Water <strong>and</strong> Waste<strong>water</strong> Planning StudyFinal Report
SECTION 14REGIONAL WATER QUALITY PROTECTION PLAN14.1 IntroductionThe Caldwell County Regional Water Quality Protection Plan (CCRWQPP)identifies actions that will assist in preventing continuing degradation ofground<strong>water</strong> <strong>and</strong> surface <strong>water</strong> quality within Caldwell County. Regional <strong>water</strong>quality measures are necessary to assist in maintaining healthy streams,preventing contamination of ground<strong>water</strong> from surface sources <strong>and</strong> in support ofefforts to improve the quality of <strong>water</strong> flowing in streams within the <strong>county</strong>.Segments of Plum Creek, the major drainage Basin within Caldwell County, haveexperienced declining <strong>water</strong> quality with increasing nutrient concentrations,sediment loads <strong>and</strong> bacterial contamination. Stream segment 1810 of Plum Creekwas listed in 2002 as an impaired stream segment in accordance the requirementsof the Federal Clean Water Act, Section 303(d).Measures presented in the CCRWQPP include structural <strong>and</strong> non-structural bestmanagement practices (BMPs) that can assist in reducing pollutant loads tostreams in the <strong>county</strong>, assist in improving <strong>water</strong> quality in streams <strong>and</strong> assist inguarding against ground<strong>water</strong> degradation.14.2 Caldwell County WatershedsAs discussed in Section 2 of this Report, the streams that are included in the<strong>planning</strong> region receive discharge from the Guadalupe <strong>and</strong> Colorado RiverBasins. The Colorado River Basin receives approximately 11 percent of thedrainage <strong>and</strong> the Guadalupe River Basin receives the remaining 89 percent. Thesub-<strong>water</strong>sheds of the Guadalupe River Basin in the <strong>county</strong> include Plum Creek(59%), the San Marcos River (16%), <strong>and</strong> Peach Creek (14%).14-1Klotz Associates Project No. 0972.000.000Caldwell County Regional Water <strong>and</strong> Waste<strong>water</strong> Planning StudyJanuary 2010Final Report
14.3 Water Quality Concerns <strong>and</strong> Sources of ImpairmentThe constituents that threaten stream <strong>water</strong> quality in Caldwell County originatefrom several sources <strong>and</strong> have resulted in streams being classified as impairedbecause of the presence of excessive bacteria, concern with dissolved oxygenlevels (DO), <strong>and</strong> high concentrations of total phosphorus, ortho-phosphate, <strong>and</strong>ammonia-nitrogen. Sources of these pollutants are as follows: Urbanization <strong>and</strong> Runoff – Urbanization almost always results inremoval of vegetation that in turn reduces the natural filterprocesses performed by vegetation <strong>and</strong> increases soil erosion fromcaused by larger peak runoff rates <strong>and</strong> volumes. Pollutants fromhuman activity, pet waste <strong>and</strong> natural processes reach drains, stormsewers <strong>and</strong> streams without the benefit of vegetative filtering.Livestock <strong>and</strong> Wildlife – Animal waste deposited in or near<strong>water</strong>ways can contribute significant pollutant loading to streams.Feral hogs, deer, sheep, goats, horses, cattle, chickens, turkeys <strong>and</strong>ducks are potential significant pollutant sources in CaldwellCounty.On-Site Sewage Facilities (OSSF) – Improperly designed orinstalled, leaking <strong>and</strong>/or failing OSSF facilities can add significantpollutant loading to streams <strong>and</strong> ground<strong>water</strong>. Bacteria fromOSSF systems can reach drinking <strong>water</strong> sources <strong>and</strong> have severe<strong>and</strong> life-threatening impacts to human health. Waste<strong>water</strong> Treatment Facilities – Improperly designed,constructed <strong>and</strong>/or operated waste<strong>water</strong> collection <strong>and</strong> treatmentfacilities can result in leaks, overflows <strong>and</strong>/or discharges to drains,storm sewers <strong>and</strong> streams that can add significant pollutant loads tonatural <strong>water</strong> bodies.Klotz Associates Project No. 0972.000.000January 201014-2Caldwell County Regional Water <strong>and</strong> Waste<strong>water</strong> Planning StudyFinal Report
Agricultural Practices – Improper <strong>and</strong> poor agricultural practicescan significantly increase sediment, nutrient, organic, bacterial<strong>and</strong>/or chemical loading to streams. Over-fertilization is anexample of a poor practice that can increase nutrient loads <strong>and</strong>increase production cost without a commensurate return oninvestment.Oil <strong>and</strong> Gas Production – Brine leakage, nitrogen compounds,salts, <strong>and</strong> hydrocarbons (petroleum byproducts) can leak to<strong>water</strong>ways <strong>and</strong> result in diminished <strong>water</strong> quality <strong>and</strong> decrease thequality of the aquatic habitat.Solid Waste Sources – Solid waste (such as used tires, homeappliances <strong>and</strong> construction debris) that is improperly disposed ofin drainageways <strong>and</strong> streams add to pollutant loads <strong>and</strong> c<strong>and</strong>egrade aquatic habitat, stream functions <strong>and</strong> visual appearance. Natural Geological Characteristics – Naturally occurringgeological formations can contribute nutrients <strong>and</strong> other pollutantsto <strong>water</strong> passing through the formation. The nutrient <strong>and</strong> pollutantloads can impair ground<strong>water</strong> quality <strong>and</strong> surface <strong>water</strong> qualitywhere ground<strong>water</strong> discharges to streams.The CCRWQPP addresses the potential pollutant sources <strong>and</strong> recommends BMPsthat will reduce the impact of the various pollutant sources. Deployment of theBMPs may be an iterative process to meet pollutant goal removal. Monitoringwill be necessary to determine the effectiveness of the management measures.14.4 Water Quality St<strong>and</strong>ardsWater quality st<strong>and</strong>ards established by TCEQ <strong>and</strong> Environmental ProtectionAgency (EPA) are used to define the acceptability <strong>and</strong> suitability of <strong>water</strong> forvarious uses including such uses as drinking <strong>water</strong>, <strong>water</strong> in streams <strong>and</strong>Klotz Associates Project No. 0972.000.000January 201014-3Caldwell County Regional Water <strong>and</strong> Waste<strong>water</strong> Planning StudyFinal Report
waste<strong>water</strong> plant return flows. The st<strong>and</strong>ards are defined using chemical,biological <strong>and</strong> physical parameters.The stream <strong>water</strong> quality st<strong>and</strong>ards for contact recreational <strong>water</strong>s in Texasinclude the following provisions for bacteria:• the geometric mean of samples tested for E.coli should not exceed126 colony-forming units per 100 milliliters (CFU/100mL)• the geometric mean of samples tested for fecal coliform should notexceed 200 CFU/100ml fecal coliform• For grab samples, not more than 25% of the samples tested forE.coli can exceed 394 CFU/100ml• For grab samples, not more than 25% of the samples tested forfecal coliform can exceed 400 CFU/100mlIf a tested <strong>water</strong> body does not meet these st<strong>and</strong>ards, it can be classified as animpaired <strong>water</strong> body for bacteria.For segments of stream where a high level of aquatic life is desired, the following<strong>water</strong> quality parameters are recommended: DO equal to or more than 5.0 mg/L pH in the range of 6.5 to 9.0 Temperature not greater than 90º FWater quality parameters used to evaluate drinking <strong>water</strong> for public <strong>water</strong>supplies include the following secondary criteria:Chloride not more than 300 mg/LSulfate not more than 300 mg/LTotal Dissolved Solids not more than 1000 mg/LKlotz Associates Project No. 0972.000.000January 201014-4Caldwell County Regional Water <strong>and</strong> Waste<strong>water</strong> Planning StudyFinal Report
14.5 Impairment LocationsThrough SELECT modeling in the Plum Creek WPP, sub<strong>water</strong>sheds wereidentified that have the greatest potential to contribute specific pollutantparameters. For example, in Exhibit 14-1 E.coli was identified to have thepotential to contribute the specified amounts in Billions of CFUs in the delineated<strong>water</strong>sheds. The E.coli loads were based on average bacteria production rates <strong>and</strong>the concentration of a source within a sub<strong>water</strong>shed. The exhibit is taken from thePlum Creek WPP <strong>and</strong> illustrates one of many parameters analyzed for DailyPotential Loads.Exhibit 14-1Total Average Daily Potential E.coli LoadSource: Plum Creek Watershed Protection PlanKlotz Associates Project No. 0972.000.000January 201014-5Caldwell County Regional Water <strong>and</strong> Waste<strong>water</strong> Planning StudyFinal Report
14.6 Recommended Load ReductionsLoad Duration Curves in the Plum Creek WPP, prepared by the Texas AgriLifeExtension Service, indicate both point <strong>and</strong> non-point pollution sources should bereduced. Water quantity <strong>and</strong> quality monitoring stations at Lockhart <strong>and</strong> Lulingprovided flows <strong>and</strong> <strong>water</strong> quality data used to compute existing pollutant loads.The recommended allowable pollutant loads were subtracted from the existingloads to determine the load reduction required. The recommended pollutant loadreductions as a percentage of existing loads are shown in Table 14-1.TABLE 14-1Pollution Reduction NeededLocationParameterE.coli Bacteria Phosphorus NitrateLockhart 65% 27% 43%Luling 15% 49% 80%14.7 Proposed Management MeasuresThe proposed management measures identified in the Plum Creek WPP arespecific to Plum Creek but can be implemented in parts of the <strong>county</strong> that are notwithin the Plum Creek Watershed. The measures are intended to reduce bacterialloads but will also influence the reduction in nutrient loads. Nutrient loadsassociated from urban l<strong>and</strong>scaping <strong>and</strong> cropl<strong>and</strong> will also be addressed.Additionally, management measures will also focus on the reduction ofphosphorus loads.Naturally occurring nitrate in ground<strong>water</strong> has been reported to discharge intoPlum Creek <strong>and</strong> create impaired <strong>water</strong> quality conditions (nitrate concentrationsexceed desired limits). Management efforts directed at nitrates should be focusedon ensuring that additional nitrates from non-ground<strong>water</strong> sources are not addedto streams <strong>and</strong> measures are implemented to prevent further increases in nitrateconcentrations in ground<strong>water</strong>.Klotz Associates Project No. 0972.000.000January 201014-6Caldwell County Regional Water <strong>and</strong> Waste<strong>water</strong> Planning StudyFinal Report
14.7.1 Urban Storm<strong>water</strong> Management MeasuresA workgroup from the Plum Creek WPP specified implementation goals <strong>and</strong>placed emphasis on programs consistent with Municipal Separate Storm SewerSystem (MS4) requirements. Appendix I lists the city specific measures to beimplemented in Lockhart <strong>and</strong> Luling.A <strong>study</strong>, “Predicting Effect of Urban Development on Water Quality in the Citiesof New Braunfels, San Marcos, Seguin <strong>and</strong> Victoria” was completed inNovember 2000 by PBSJ. The <strong>study</strong> developed a series of equations to predict theimpact of impervious cover on concentrations of four <strong>water</strong> quality parameters instorm<strong>water</strong> runoff. These formulas may be useful in predicting <strong>water</strong> qualityimpacts from the construction of impervious cover in <strong>water</strong>sheds <strong>and</strong> assist indetermining pollutant removal required as part of a construction permit.The formulas are:Total Suspended Solids in mg/L, TSS: TSS = 10^(2.41+(0.0149 IC))Total Nitrogen in mg/L, TN: TN = 1.08+(0.0564* IC)Total Phosphorus in mg/L, TP: TP = 0.0231*ICFecal Coliform, FC in CFU/100mL: FC = 10^(4.0+(0.0229* IC))Where IC is impervious cover expressed as a percentage, ^ is the symbol forexponential <strong>and</strong> * is the symbol for multiplication.It should be noted that the calculated concentration is an “Event MeanConcentration” (EMC) which is defined as a flow-weighted average. The EMC isused because the concentration of any parameter varies greatly in a storm event asthe hydrograph rises (the first flush event), crests <strong>and</strong> falls in the trailing limb ofthe hydrograph.Klotz Associates Project No. 0972.000.000January 201014-7Caldwell County Regional Water <strong>and</strong> Waste<strong>water</strong> Planning StudyFinal Report
14.7.2 Water Quality Development Ordinances <strong>and</strong> PolicySeveral <strong>water</strong> quality guidelines can be implemented at the local level toeffectively control non-point source pollution <strong>and</strong> point source pollution. Localgovernments have a responsibility to the community to develop sound <strong>and</strong>practical policies that will improve the quality of life. The uneducated,uninformed, <strong>and</strong> unwilling require nudges to comply. Growing <strong>and</strong> developingcities have an opportunity to guide, plan, <strong>and</strong> manage growth. Policies <strong>and</strong>procedures recommended to provide <strong>water</strong> quality protection <strong>and</strong> are not limitedto: Buffer Ordinances Open/ Natural Space Conservation Tree Ordinance Zoning Ordinances BMP Ordinances Stringent OSSF OrdinancesThese <strong>water</strong> quality ordinances <strong>and</strong> policy practices can be accomplished throughthe development <strong>and</strong> implementation of a Master Plan for the City that clearlydefines buffer areas <strong>and</strong> open space conservation that protects natural areas.Widths of buffers can be based on contributing drainage areas <strong>and</strong> their locationrelative to a stream centerline. The plan should also define development practicesthrough zoning requirements <strong>and</strong> provide guidance on tree protection <strong>and</strong>preservation.Providing comprehensive site <strong>planning</strong> <strong>and</strong> pre-development reviews can ensurecompliance <strong>and</strong> the review of <strong>water</strong> quality measures being incorporated into thedesign of the site. The preliminary reviews should demonstrate the technicalelements that support the operation <strong>and</strong> maintenance of the <strong>water</strong> qualitymeasures.Klotz Associates Project No. 0972.000.000January 201014-8Caldwell County Regional Water <strong>and</strong> Waste<strong>water</strong> Planning StudyFinal Report
14.8 Structural BMPs for Discharges from Developed L<strong>and</strong>Discharges from developed l<strong>and</strong> can be managed through the implementation ofstructural BMPs. Structural BMPs that can offset the impact of development on<strong>water</strong> quality can include:Infiltration SystemsDetention/ Sedimentation BasinsVegetative Filter StripsVegetative SwalesRiparian BuffersRain GardensA long term operation <strong>and</strong> maintenance plan should be included in the design <strong>and</strong>construction of the BMPs. Funding <strong>and</strong> maintenance schedules should also beincluded prior to approval of construction.14.8.1 Infiltration SystemsInfiltration systems are designed to filter out particulates as <strong>water</strong> percolatesthrough the soil, infiltrating the ground over some area <strong>and</strong> period of time.Infiltration systems include porous pavement, infiltration basins <strong>and</strong> trenches.Due to the removal efficiency <strong>and</strong> potential for migration, this system may not beappropriate over ground <strong>water</strong> sources.14.8.2 Detention/ Sedimentation BasinsDetention/Sedimentation Basins are utilized to capture storm <strong>water</strong> <strong>and</strong> areeffective at removing suspended constituents such as sediment. They can removeup to approximately 80% of suspended solids.Klotz Associates Project No. 0972.000.000January 201014-9Caldwell County Regional Water <strong>and</strong> Waste<strong>water</strong> Planning StudyFinal Report
14.8.3 Vegetative Filter StripsVegetative filter strips are l<strong>and</strong> areas that are designed to treat storm<strong>water</strong> for thepurpose of removing sediment <strong>and</strong> other pollutants. The strips are effective inshallow sheet flow. For concentrated flow, design measures should be taken todistribute the flow <strong>and</strong> dissipate energy <strong>and</strong> reduce flow velocity. Vegetative filterstrips generally remove suspended particulates <strong>and</strong> limited dissolved constituents.Vegetated filter strips should be used in series with other BMPs14.8.4 Vegetative SwalesGrassy swales are vegetated channels that convey storm<strong>water</strong> <strong>and</strong> removepollutants by filtering, settlement <strong>and</strong> infiltration through soil. They requireshallow slopes <strong>and</strong> soils that drain well <strong>and</strong> are limited to light <strong>and</strong> moderateflows. The swales can be easily integrated into l<strong>and</strong>scaping plans. The placementof these swales along roadside ditches has proven to be effective.14.8.5 Riparian BuffersRiparian forest buffers combine trees, shrubs, <strong>and</strong> native grasses to removesediment <strong>and</strong> chemicals from runoff before they reach a <strong>water</strong>way. The width ofthe buffer strips can vary from 35-100 feet depending on slope, soil type, adjacentl<strong>and</strong> use, floodplain, <strong>and</strong> type of vegetation. The buffers, once established need tobe maintained <strong>and</strong> monitored yearly to remain effective.14.8.6 Rain GardensRain gardens are man-made depressions in the ground that forms a smallbioretention area. The l<strong>and</strong>scaping of the area improves the <strong>water</strong> quality byfiltering the <strong>water</strong> that is slowly absorbed by the soil. These gardens arefunctional when placed strategically to intercept <strong>water</strong> runoff. Placement of thesegardens in new proposed development can be accomplished cost-effectively. TheKlotz Associates Project No. 0972.000.000January 201014-10Caldwell County Regional Water <strong>and</strong> Waste<strong>water</strong> Planning StudyFinal Report
ain garden will add value to the home as well as providing a <strong>water</strong> qualitymeasure.14.9 Agricultural Best Management PracticesIn 1998, the national <strong>water</strong> quality inventory indicated that 59% of the impairedriver miles were a result of agriculture that included crop production, animaloperations, <strong>and</strong> pastures <strong>and</strong> rangel<strong>and</strong>. Many agricultural producers are unawareof the practices that may cause impairment to <strong>water</strong> quality <strong>and</strong> may requireassistance to implement the recommended practices. The followingrecommendations are presented to assist in reducing the impacts of livestockoperations on <strong>water</strong> quality:Utilize rotational grazing – assists in reducing soil erosionDevelop off-stream <strong>water</strong> sources for livestock – helps develop<strong>and</strong> maintain healthy riparian vegetation that filters nutrients <strong>and</strong>sedimentComposting of solids – use methods that prevent leaching of fluidsor produce runoff to streamsAccumulate <strong>and</strong> store manure appropriately – store away fromditches <strong>and</strong> streams; kept covered to prevent leaching of bacteria<strong>and</strong> nutrientsProtect <strong>water</strong> supply sources - locate wells upgradient fromconfinement areasPlant <strong>and</strong> maintain buffer zone vegetation - use buffer areas aroundmanure storage <strong>and</strong> along drainageways <strong>and</strong> streamsArmor heavy use areas - use armoring materials to prevent soilerosion in heavily used areasUse livestock fences– prevent overgrazing <strong>and</strong> protect riparianbuffersUse anaerobic digestion of waste to recover energyKlotz Associates Project No. 0972.000.000January 201014-11Caldwell County Regional Water <strong>and</strong> Waste<strong>water</strong> Planning StudyFinal Report
Use constructed wetl<strong>and</strong>s to capture <strong>and</strong> treat runoffUse bio-filtration to control odor, gas, <strong>and</strong> dust emissions fromfacilitiesUse sequencing batch reactor for nitrogen management – nitrogenremovalProtect ground<strong>water</strong> sources from contaminated <strong>water</strong> sources byinstalling liners to protect ground<strong>water</strong> <strong>and</strong> allow <strong>water</strong> toevaporateRecommendations for crop operations to improve <strong>water</strong> quality include:Use crop rotation to reduce soil loss <strong>and</strong> prevent nutrient depletionControl sediment using straw mulch to reduce erosion <strong>and</strong> preventnutrient lossPlant streamside buffers to reduces nutrient pollution into streamsManage manure <strong>and</strong> nutrient applications so they are evenlyapplied as needed by crop typeApply fertilizers <strong>and</strong> chemicals in accordance with soil <strong>and</strong> plantneeds to prevent excess nutrients <strong>and</strong> chemicals being washed intostreams or percolating to ground<strong>water</strong>Test manure to assist in establishing appropriate levels of manureapplication <strong>and</strong> guide fertilizer applicationsTest soils to prevent over application of nutrientsSchedule irrigation based on crop needs, soil type, climate,topography, <strong>and</strong> infiltration rates to reduce run-off caused by over<strong>water</strong>ingAssessments of the current practices in the <strong>county</strong> should be identified throughsurvey mailings <strong>and</strong> questionnaires. Identification of the agricultural practices willdetermine the needs of the area <strong>and</strong> assist in developing guides to assist farmers<strong>and</strong> crop producers.Klotz Associates Project No. 0972.000.000January 201014-12Caldwell County Regional Water <strong>and</strong> Waste<strong>water</strong> Planning StudyFinal Report
14.10 Public Education/ OutreachPublic involvement facilitates interest <strong>and</strong> education while spreading the word. Ascitizens become informed <strong>and</strong> educated about the community initiatives they aremore likely to participate <strong>and</strong> volunteer in programs. Public awareness <strong>and</strong>acceptance are crucial for the political <strong>and</strong> financial sustainability of <strong>water</strong> qualityprograms <strong>and</strong> efforts by local governments. Specific public education effortsinclude:TV CommercialsFlyersBrochuresEssay ContestWorkshopsAdopt-a-StreamNewspaper printsPoster ContestPhoto ContestBillboard AnnouncementsHOA NewslettersStream Plantings14.11 Municipal Practices <strong>and</strong> Good HousekeepingActivities <strong>and</strong> efforts by municipalities to participate in pollution prevention <strong>and</strong>good housekeeping are:Municipal Training <strong>and</strong> EducationParking Lot <strong>and</strong> Street CleaningMunicipal L<strong>and</strong>scapingRoadway MaintenanceSpill Response <strong>and</strong> PreventionHazardous Waste Pick-up <strong>and</strong> Drop-off daysThe proactive efforts in establishing good housekeeping policies contribute tomaintaining healthy streams <strong>and</strong> rivers by preventing pollution that wouldotherwise reach our <strong>water</strong>s.Klotz Associates Project No. 0972.000.000January 201014-13Caldwell County Regional Water <strong>and</strong> Waste<strong>water</strong> Planning StudyFinal Report
14.12 Implementation Recommendations for the CCRWQPPThe following elements are recommended for implementation in Caldwell Countyto assist in improvement of existing <strong>water</strong> quality in degraded streams <strong>and</strong> prevent<strong>water</strong> quality degradation of streams in the future:• Point Discharge Load Reductions• Storm<strong>water</strong> Filter Strips Along Streams• Water Quality Remediation Associated with Impervious CoverInstallation• OSSF Inspection <strong>and</strong> Certification14.12.1 Point Discharge Load ReductionsWaste<strong>water</strong> treatment plant discharges represent a continuous point source ofpollutants discharging into streams. Two practices can materially impact thepollutant discharge loading to streams. Producing “higher” quality of <strong>water</strong> fordischarge will reduce loading <strong>and</strong> implementing reuse of reclaimed <strong>water</strong> canreduce loading.Higher quality of discharge <strong>water</strong> refers to improving the treatment processeswithin a treatment plant to remove additional pollutants before the treated <strong>water</strong> isdischarged to the stream. The effluent pollutant limits for waste<strong>water</strong> treatmentplants are established in permits issued by the TCEQ <strong>and</strong> based on the quality ofthe discharge <strong>and</strong> its impact on the receiving <strong>water</strong>s. The permits consider theability of the stream to assimilate the pollutants discharged into it withoutlowering the <strong>water</strong> quality in the stream below the st<strong>and</strong>ards established for thereaches of stream below the outfall.The larger waste<strong>water</strong> treatment plants in the <strong>county</strong> are operated by the City ofLockhart <strong>and</strong> the City of Luling. The total existing plant capacity for Lockhart is2.6 mgd <strong>and</strong> for Luling it is 1.4 mgd.Klotz Associates Project No. 0972.000.000January 201014-14Caldwell County Regional Water <strong>and</strong> Waste<strong>water</strong> Planning StudyFinal Report
The existing waste<strong>water</strong> treatment plant discharge parameters for these plants areshown in Table 14-2:Table 14-2Waste<strong>water</strong> Treatment Plant Permit ParametersParameter LockhartPlant 1LockhartPlant 2LulingPlant 1LulingPlant 2Permitted Flow Capacity, mgd 1.1 1.5 0.5 0.9BOD 5, mg/l - - 20 -CBOD 5, mg/l 10 10 - 10NH 3 as N, mg/l 3 3 - 3Dissolved Oxygen, mg/l 4 5 2 5Total Suspended Solids, mg/l 15 15 20 15As the quality of discharge from waste<strong>water</strong> treatment plants is raised to a higherst<strong>and</strong>ard, it becomes cost effective to implement <strong>water</strong> reclamation <strong>and</strong> a <strong>water</strong>reuse program. The following explanations provide information regardingimplementation of a <strong>water</strong> use program.Water reuse is the beneficial use of reclaimed <strong>water</strong>. Examples of <strong>water</strong> reuseinclude irrigation, cooling, or washing.Reclaimed <strong>water</strong> is domestic or municipal waste<strong>water</strong> which has been treated to aquality suitable for beneficial use.Reclaimed <strong>water</strong> is not the same as grey<strong>water</strong> which is untreated, non-toilet, <strong>and</strong>household <strong>water</strong> including <strong>water</strong> from sinks, showers, <strong>and</strong> baths.Type I reclaimed <strong>water</strong> is defined as use of reclaimed <strong>water</strong> where contactbetween humans <strong>and</strong> the reclaimed <strong>water</strong> is likely. Examples include l<strong>and</strong>scapeirrigation at individual homes or on public golf courses, fire protection, toilet orurinal flushing, <strong>and</strong> irrigation of pastures for milking animals.Klotz Associates Project No. 0972.000.000January 201014-15Caldwell County Regional Water <strong>and</strong> Waste<strong>water</strong> Planning StudyFinal Report
Type II reclaimed <strong>water</strong> is defined as reclaimed <strong>water</strong> where contact betweenhumans <strong>and</strong> the <strong>water</strong> is unlikely. Examples of Type II use include dust control,cooling tower applications, irrigation of food crops where the reclaimed <strong>water</strong> isnot expected to come in direct contact with the edible part of the crop, <strong>and</strong>maintenance of impoundments or natural <strong>water</strong> bodies where direct humancontact is not likely.Direct use means the beneficial use of reclaimed <strong>water</strong> that has been transportedfrom the point of production to the point of use without intervening discharge to<strong>water</strong>s of the state.Indirect use means the beneficial use of reclaimed <strong>water</strong> that has been transportedfrom the point of production to the point of use with an intervening discharge to<strong>water</strong>s of the state.Bed <strong>and</strong> Banks Permit refers to authorization from the State of Texas todischarge <strong>water</strong> to <strong>water</strong>s of the state <strong>and</strong> subsequently recover that <strong>water</strong> at adownstream point. Water moved under a bed <strong>and</strong> banks permit cannot degrade thequality of <strong>water</strong> in the state <strong>water</strong>s, must not impact existing <strong>water</strong> rights, mustnot negatively impact instream uses, aquatic or riparian habitats or fresh<strong>water</strong>flows to bays <strong>and</strong> estuaries.The use of reclaimed <strong>water</strong> in Texas is governed by TCEQ Chapter 210 (Use ofReclaimed Water) which provides for the quality criteria, design, <strong>and</strong> operationalrequirements for the beneficial use of reclaimed <strong>water</strong>.Benefits of using reclaimed <strong>water</strong> include:• The <strong>water</strong> is less expensive to use or to treat <strong>and</strong> users benefit fromthe savings• It is a drought-proof source of <strong>water</strong>Klotz Associates Project No. 0972.000.000January 201014-16Caldwell County Regional Water <strong>and</strong> Waste<strong>water</strong> Planning StudyFinal Report
• It is a source of <strong>water</strong> that automatically increases with increasedeconomic activity <strong>and</strong> population growth• It conserves traditional sources of <strong>water</strong> such as ground<strong>water</strong> <strong>and</strong>surface <strong>water</strong>.Disadvantages of using reclaimed <strong>water</strong> include:• Water reuse may be seasonal in nature <strong>and</strong> can result in theoverloading of treatment <strong>and</strong> disposal facilities during off seasons• Reclaiming waste<strong>water</strong> for reuse requires a treatment systemwhich could result in higher initial costs• Public acceptance of what some may consider as "dirty <strong>water</strong>" maybe hard to overcome• The end use for the reclaimed <strong>water</strong> can be located at a distancefrom the source <strong>and</strong> require a conveyance <strong>and</strong> distribution systemthat adds to the cost of the reclaimed <strong>water</strong>If the waste<strong>water</strong> plants produce Type I reclaimed <strong>water</strong> for reuse, the dischargeparameters would be as follows in Table 14-3:Table 14-3Reclaimed Water Quality ParametersType I Reclaimed Type II ReclaimedParameterWaterWaterBOD 5 5 mg/l 20 mg/lCBOD 5 5 mg/l 15 mg/lTurbidity 3 NTU No RequirementFecal Coliform 20 CFU/100 ml* 200 CFU/100 ml*Fecal Coliform (not toexceed)75 CFU/100 ml** 800 CFU/100 ml*** geometric mean** single grab sampleKlotz Associates Project No. 0972.000.000January 201014-17Caldwell County Regional Water <strong>and</strong> Waste<strong>water</strong> Planning StudyFinal Report
Pollutant loading to streams from existing <strong>and</strong> future waste<strong>water</strong> treatment plantscan be meaningfully reduced <strong>and</strong> minimized by implementing two practices.These are:Renovate existing waste<strong>water</strong> treatment plants <strong>and</strong> construct futurewaste<strong>water</strong> treatment plants to produce <strong>and</strong> discharge effluent thathas less pollutant loadProduce reclaimed <strong>water</strong> that can be diverted for reuse away fromstreamsRenovating existing treatment plants to produce higher quality effluent can reducepollutant loading for organic loading, nutrient loading <strong>and</strong> bacterial loading. If agoal is established for treatment plants to produce Type I reclaimed <strong>water</strong>,pollutants loads can be reduced as illustrated in Table 14-4. If reuse of reclaimed<strong>water</strong> is implemented, there will be additional reductions in pollutant loading tostreams. Table 14-5 illustrates the load reductions if the existing treatment plantsare upgraded <strong>and</strong> 50 percent of the reclaimed <strong>water</strong> is reused <strong>and</strong> the remaining50 percent is discharged to streams.PlantTable 14-4Annual Pollutant Load to Streams for Upgraded Existing Waste<strong>water</strong> Treatment PlantsPermitted FlowCapacity, mgdExistingUpgradedCBOD 5,pounds per yearExisting10 mg/lUpgraded5 mg/lTotal SuspendedSolids, pounds peryearExisting15 mg/lUpgraded5 mg/lNH 3 as N, poundsper yearExisting3 mg/lUpgraded2 mg/lLockhart 1 1.1 1.1 33,503 16,751 50,254 16,751 10,051 6,701Lockhart 2 1.5 1.5 45,685 22,843 68,528 22,843 13,706 9,137Luling 1 0.5 0.5 30,457* 7,614 30,457** 7,614 4,569*** 3,046Luling 2 0.9 0.9 27,411 13,706 41,117 13,706 8,223 5,482Total 4 4 137,056 60,914 190,356 60,914 36,549 24,366**Based on 20 mg/l for BOD 5** Based on 20 mg/l for Total Suspended Solids*** Based on 3 mg/l for NH 3 as N, permit has no limitKlotz Associates Project No. 0972.000.000January 201014-18Caldwell County Regional Water <strong>and</strong> Waste<strong>water</strong> Planning StudyFinal Report
The pollutant load reduction from the upgrade of existing treatment plants for theshown parameters would be:CBOD 5 or BOD5 (with 5 mg/l as limit): 76,412 pounds per yearTotal Suspended Solids (with 5 mg/l as limit): 129,442 pounds peryearNH 3 as N (with 2 mg/l as limit): 12,183 pounds per yearTable 14-5Annual Pollutant Load to Streams for Upgraded Existing Waste<strong>water</strong> Treatment Plantswith 50 Percent Reuse of Reclaimed WaterPlantPermitted FlowCapacity, mgdExistingUpgradedwithReuseCBOD 5,pounds per yearExisting10 mg/lUpgraded5 mg/lwithReuseTotal SuspendedSolids, poundsper yearExisting15 mg/lUpgraded5 mg/lwithReuseNH 3 as N, poundsper yearExisting3 mg/lUpgraded2 mg/lwithReuseLockhart 1 1.1 0.55 33,503 8,376 50,254 8,376 10,051 3,350Lockhart 2 1.5 0.75 45,685 11,421 68,528 11,421 13,706 4,569Luling 1 0.5 0.25 30,457* 3,807 30,457** 3,807 4,569*** 1,523Luling 2 0.45 0.9 27,411 6,853 41,117 6,853 8,223 2,741Total 4 2 137,056 30,457 190,356 30,457 36,549 12,183**Based on 20 mg/l for BOD 5** Based on 20 mg/l for Total Suspended Solids*** Based on 3 mg/l for NH 3 as N, permit has no limitThe pollutant load reduction from the upgrade of existing treatment plants <strong>and</strong>implementing reuse of 50 percent of the reclaimed <strong>water</strong> for the shownparameters would be:CBOD 5 or BOD5 (with 5 mg/l as limit): 106,599 pounds per yearTotal Suspended Solids (with 5 mg/l as limit): 159,899 pounds peryearNH 3 as N (with 2 mg/l as limit): 24,366 pounds per yearKlotz Associates Project No. 0972.000.000January 201014-19Caldwell County Regional Water <strong>and</strong> Waste<strong>water</strong> Planning StudyFinal Report
Future growth in Caldwell County will increase waste<strong>water</strong> production to anestimated 10.2 mgd. If 70 percent of the waste<strong>water</strong> is treated by <strong>regional</strong>waste<strong>water</strong> treatment plants, the volume of waste<strong>water</strong> produced will be 7.1 mgd.If 50 percent of the reclaimed <strong>water</strong> is reused, the waste<strong>water</strong> to be discharged tostreams will be 3.6 mgd. If Type I reclaimed <strong>water</strong> is produced, the futurepollutant loading will be less than the current loading. Table 14-6 illustrates thiscomparison.YearTable 14-6Comparison of Future Changes to Annual Pollutant Load to StreamsPortion ofPermitted FlowCBOD 5,Total SuspendedDischarged to pounds per year Solids, pounds peryearStreams, mgdNH 3 as N,pounds peryear2010* 4 137,056 190,356 36,5492040** 3.6 54,822 54,822 21,929Difference 0.4 82,234 135,534 14,620* Based on existing discharge pollutant limits** Based on Type I Reclaimed Water <strong>and</strong> 50 % reuse of reclaimed <strong>water</strong>14.12.2 Storm<strong>water</strong> Filter Strips Along StreamsStorm<strong>water</strong> runoff produces significant pollutant loading for streams in CaldwellCounty. Vegetated filter strips adjacent to streams can provide significantstorm<strong>water</strong> treatment as overl<strong>and</strong> flow passes through the filter strips.It is recommended that entities in Caldwell County that have regulatory authorityimplement requirements for filter strips adjacent to streams. The filter stripsshould be on each side of the stream with the width of the filter strip beingmeasured from the top of bank for the stream. The recommended filter stripswidths are presented in Table 14-7.Klotz Associates Project No. 0972.000.000January 201014-20Caldwell County Regional Water <strong>and</strong> Waste<strong>water</strong> Planning StudyFinal Report
Table 14-7Vegetated Filter Strip Width RequirementsDrainage Area ofStream at DesignPoint, AcresFilter Strip Width,Feet0 to 10 10>10 to 100 25>100 5014.12.3 Water Quality Remediation Associated with Impervious CoverInstallationIncreased storm<strong>water</strong> runoff associated with installation of impervious coverresults in increased pollutant loading associated with the storm<strong>water</strong>. Capturing<strong>and</strong> filtering the “first-flush” runoff can significantly reduce pollutant loads. Inaddition, development rules that encourage limited impervious cover on tractsshould be utilized.It is recommended that entities in Caldwell County (those that have regulatoryauthority) implement requirements for limited impervious cover on tracts <strong>and</strong>requirements to capture <strong>and</strong> filter first flush runoff. The recommended imperviouscover limits <strong>and</strong> filter requirements are presented in Table 14-8.Table 14-8Impervious Cover FiltrationRequirementsVolume ofImpervious Cover Water to BePercentageFiltered,Inches0 to 20 0.00>20 to 50 0.50>50 to 80 0.75>80 to 100 1.00Klotz Associates Project No. 0972.000.000January 201014-21Caldwell County Regional Water <strong>and</strong> Waste<strong>water</strong> Planning StudyFinal Report
14.12.4 OSSF Annual Inspection <strong>and</strong> CertificationFailed OSSFs can be significant sources of bacteria <strong>and</strong> other pollutants forstreams. In addition, improperly constructed, operated <strong>and</strong>/or maintained OSSFscan be contributors to bacteria <strong>and</strong> pollutants in streams.Each entity responsible for permitting OSSFs should implement inspection <strong>and</strong>recertification programs. The frequency of inspection <strong>and</strong> recertification shouldbe based the type of facility being served by each OSSF. Table 14-9 presents therecommended program.Table 14-9Frequency of OSSF Inspection <strong>and</strong> Recertification ProgramType of SystemFrequency of Self Inspectionwith Report to RegulatoryEntity, yearsRecertification by RegulatoryEntity, yearsSingle Family Residential 2 5Multiple Family Units 1 3Commercial 1 3Other Established at Permitting Established at PermittingKlotz Associates Project No. 0972.000.000January 201014-22Caldwell County Regional Water <strong>and</strong> Waste<strong>water</strong> Planning StudyFinal Report
SECTION 15REGIONAL WATER QUALITY IMPLEMENTAION15.1 GeneralRegional implementation will require <strong>county</strong>, city, district, <strong>and</strong> local officials tobe engaged <strong>and</strong> committed to the success of the <strong>planning</strong> strategies. CaldwellCounty has an opportunity to create new development st<strong>and</strong>ards that includestorm<strong>water</strong>, l<strong>and</strong>scaping, <strong>and</strong> natural resource protection before developmentgrowth escalates. Unmanaged development <strong>and</strong> lack of natural resourcesprotection will permit further deterioration of <strong>water</strong>ways.Preservation of the natural resources will be accomplished by developingstorm<strong>water</strong> management policies, development ordinances, <strong>regional</strong> cooperation,<strong>and</strong> funding.15.2 Storm<strong>water</strong> Management ImplementationTraining <strong>and</strong> education of personnel at the management <strong>and</strong> staff level of theEPA’s <strong>water</strong> quality <strong>and</strong> TMDL st<strong>and</strong>ards is necessary for underst<strong>and</strong>ingstorm<strong>water</strong> pollution. Technical staff reviewing <strong>and</strong> approving developmentpermits need to have some knowledge of nonpoint source pollution <strong>and</strong> the effectsif uncontrolled.Development of a Storm<strong>water</strong> Management Manual – policy manual thatcovers principles in design <strong>and</strong> construction of permanent structuralcontrols for storm<strong>water</strong> runoff. Instruction to staff on policies <strong>and</strong>procedures to improve plan review. Having staff underst<strong>and</strong> the design oflow-impact <strong>and</strong> smart-growth developments can benefit developers <strong>and</strong>investors in <strong>planning</strong>.Klotz Associates Project No. 0972.000.000January 201015-1Caldwell County Regional Water <strong>and</strong> Waste<strong>water</strong> Planning StudyFinal Report
Water Quality Monitoring Program – test <strong>and</strong> monitor storm<strong>water</strong> runoff<strong>and</strong> establish a database with results. The establishment of a database <strong>and</strong>mapping system can track <strong>and</strong> monitor development contributions to <strong>water</strong>quality.Water Quality Technical Committee – the committee role could be todevelop st<strong>and</strong>ards for local governments such as:ooooSampling methodsMonitoring of data collectedEstablishment of databaseData managementStorm<strong>water</strong> Operations <strong>and</strong> Maintenance – management program toensure proper drainage <strong>and</strong> pollutant removal efficiency. Inspection <strong>and</strong>maintenance of drainage structures <strong>and</strong> conveyance systems. Developmentof a plan for routine <strong>and</strong> remedial maintenance with an emergencycontainment plan in the event of a hazardous spill.Hazardous Household Waste Collection Program – provide accessiblerecycling centers or drop off locations for the disposal of hazardoushousehold items.Agricultural Management Programs – provide tools for agriculturalproducers to remain profitable while protecting natural resources. Suchtools could be:oooooOn farm research <strong>and</strong> demonstration of BMP’sPilot projects that evaluate or transfer technologyConduct interviews <strong>and</strong> collect dataEducate <strong>and</strong> increase awareness of local practicesWorkshops on new technologyKlotz Associates Project No. 0972.000.000January 201015-2Caldwell County Regional Water <strong>and</strong> Waste<strong>water</strong> Planning StudyFinal Report
Additional management measures recommended for implementation in the PlumCreek Watershed Protection Plan have been included in Appendix J.15.3 Development of OrdinancesMany cities currently have ordinances that monitor <strong>and</strong> control storm<strong>water</strong> quality<strong>and</strong> quantity. Ordinances include:Storm<strong>water</strong> Development Ordinance – management of runoff quality <strong>and</strong>quantityIllegal Storm<strong>water</strong> Connection Ordinance – prevents illegal connections tostorm<strong>water</strong> systemsFloodplain Development Ordinance – management of flood prevention<strong>and</strong> mitigationBuffer Ordinance – control of runoff near streams by listing the type ofdevelopments allowed near floodplains/streams/creeks <strong>and</strong> give bufferwidth recommendations for each type of development or l<strong>and</strong> useGreenspace Conservation Ordinance – control of impervious coverdevelopmentTree Ordinance – control of tree canopy reduction for developments15.4 Regional AgreementAn agreement established by local governments in Caldwell County will ensurethat all entities are informed about the proposed <strong>regional</strong> practices <strong>and</strong>development of facilities. A Regional Compact has been included in AppendixK.15.5 FundingFunding to implement the recommended strategies requires community leaders toactively <strong>and</strong> rigorously apply for grants <strong>and</strong> search for monies available to15-3Klotz Associates Project No. 0972.000.000Caldwell County Regional Water <strong>and</strong> Waste<strong>water</strong> Planning StudyJanuary 2010Final Report
execute strategies. Local, state, <strong>and</strong> federal sources are expected to fully fundprograms. The EPA, TCEQ, TWDB, the Natural Resources Conservation Service(NRCS) <strong>and</strong> additional Foundations <strong>and</strong> Partnerships offer possible fundingsources.Agriculture Best Management Practices (BMP) LoansDevelop low to no interest loans to producers for BMP implementation<strong>and</strong> new technology that enhances animal agriculture. This option willneed to be developed for Texas. Currently, the Virginia Department ofEnvironmental Quality <strong>and</strong> Minnesota Department of Agriculture providethese funding services. Further investigation to develop this program isrequired at the state or <strong>county</strong>.Agriculture Water Conservation Grants <strong>and</strong> LoansState agencies <strong>and</strong> political subdivisions of the state are eligible for thegrants <strong>and</strong> loans made available to political subdivisions of the state,institutions of higher education, interstate compact commissions, <strong>and</strong>nonprofit <strong>water</strong> supply corporations (Chapter 69 of Water Code). Banks<strong>and</strong> farm credit system may apply for link deposit funds to make loansavailable to individuals.Clean Water State Revolving Fund (CWSRF)The CWSRF provides funding for <strong>water</strong> quality projects that areassociated with waste<strong>water</strong> treatment, nonpoint source pollution control,<strong>and</strong> <strong>water</strong>shed <strong>and</strong> estuary management. Funds are available through fullgrants <strong>and</strong> low-interest loans with flexible terms for <strong>planning</strong>, acquisition<strong>and</strong> construction, waste<strong>water</strong> treatment, storm<strong>water</strong> <strong>and</strong> nonpoint sourcepollution control, <strong>and</strong> reclamation/reuse projects.Klotz Associates Project No. 0972.000.000January 201015-4Caldwell County Regional Water <strong>and</strong> Waste<strong>water</strong> Planning StudyFinal Report
Economically Distressed Area ProgramThe TWDB provides grants, loans or a combination for <strong>water</strong> <strong>and</strong>waste<strong>water</strong> services in areas of economic distress where current facilitiesare inadequate to meet residents’ minimum st<strong>and</strong>ards.Environmental Quality Incentives Program (EQIP)The Environmental Quality Incentives Program (EQIP), implemented bythe NRCS, offers financial <strong>and</strong> technical assistance for application ofstructural <strong>and</strong> management BMP’s on agricultural l<strong>and</strong>.Drinking Water State Revolving FundThe Drinking Water State Revolving Fund (DWSRF) program awardscapitalization grants to states to provide low-cost loans to public <strong>water</strong>supply systems for infrastructure needed to achieve or maintain SDWAcompliance. These loans <strong>and</strong> additional subsidies are available fordisadvantaged communities only. Community <strong>water</strong> system owners,political subdivisions of the state <strong>and</strong> private individuals are eligible toapply for the funding.Environmental Educational GrantsThe Environmental Educational Grants provide funding for educationalprojects that enhance the public’s awareness, knowledge, <strong>and</strong> skills to helppeople make informed decisions that affect environmental quality.EPA Smart Growth GrantsLimited grants are occasionally offered by the EPA to support activitiesthat improve the quality of developments <strong>and</strong> protect human health <strong>and</strong>Klotz Associates Project No. 0972.000.000January 201015-5Caldwell County Regional Water <strong>and</strong> Waste<strong>water</strong> Planning StudyFinal Report
the environment. Funding for the program ranges between $2 <strong>and</strong> $3million with average grants in the $15,000 to $25,000 range.Foundations <strong>and</strong> PartnershipsOver 200 Foundations <strong>and</strong> Partnerships are listed in the National Councilfor Science <strong>and</strong> the Environment that can provide an additional source offunding. Numerous funding opportunities were also listed at the NationalScience Foundation.Federal Clean Water Act Grant Program (Section 319(h))Under the Federal Act Grant Program, the USEPA appropriates funds toTCEQ to fund nonpoint source pollution management. Administeredfunds are used to assess nonpoint sources of pollution, provide education<strong>and</strong> outreach, develop <strong>and</strong> implementing <strong>water</strong>shed protection plans,implement nonpoint source portions of TMDL Implementation Plans, <strong>and</strong>implement both the technology-based <strong>and</strong> <strong>water</strong>-quality-basedmanagement measures contained in the coastal nonpoint pollution controlprograms.General RevenuesA fee based on the amount of runoff to tie into the local MS4 can beallocated through a development permit. Bond sales, development impactfees <strong>and</strong> storm<strong>water</strong> user fee are other alternatives <strong>and</strong> options. Propertytaxes <strong>and</strong> sales taxes can also be a source of contribution.Several bond types are currently available to provide financing.Depending on goals, tax situation <strong>and</strong> risk tolerance, the options availableare: municipal, government, corporate, asset-backed, securities <strong>and</strong>international bonds.Klotz Associates Project No. 0972.000.000January 201015-6Caldwell County Regional Water <strong>and</strong> Waste<strong>water</strong> Planning StudyFinal Report
Development impact fees can be applied at the application stage ofdevelopment. Fees can be based on site acreage, location, <strong>and</strong> type ofdevelopment.Storm<strong>water</strong> user fees can be assessed on a one time basis or annuallydepending on discharge rate <strong>and</strong> quality of runoff. Fees can beappropriated to fund O&M programs.The general tax revenue fund may have available monies for to develop<strong>and</strong>/or maintain programs.PrivatizationPrivatization involves partnering with the private sector to plan, finance<strong>and</strong> develop, operate <strong>and</strong> maintain facilities for the public sector.Contracts outline the obligations <strong>and</strong> agreements of the responsible party.Supplemental Environmental Project ProgramThe Supplemental Environmental Project Program (SEP) provides fundscollected through penalties <strong>and</strong> fines. Instead of applying monies to theState’s General Revenue Fund, TCEQ will apply them toward remediation<strong>and</strong> improvements in the environmental quality of the region where thefines were collected.Targeted Watersheds Grants ProgramThe Targeted Watershed Grants Program funds are designed to encouragesuccessful community-based approaches <strong>and</strong> management techniques toprotect <strong>and</strong> restore <strong>water</strong>sheds. The awarded funds have been given on acompetitive basis for <strong>water</strong> quality trading, agricultural best managementpractices, wetl<strong>and</strong> <strong>and</strong> riparian restoration, nutrient management, fishhabitat restoration <strong>and</strong> public outreach <strong>and</strong> education. The stakeholders ofKlotz Associates Project No. 0972.000.000January 201015-7Caldwell County Regional Water <strong>and</strong> Waste<strong>water</strong> Planning StudyFinal Report
the <strong>water</strong>shed organizations should include various types of communityleaders from educational to political <strong>and</strong> non-profit affiliations.Water Quality Management Plan ProgramThe Water Quality Management (WQMP) Plan program is implementedby the Texas State Soil <strong>and</strong> Water Conservation Board (TSSWCB) for thedevelopment of a site specific plan. The TSSWCB determines the level ofpollution prevention or abatement that is consistent with the state’s <strong>water</strong>quality st<strong>and</strong>ards. The methods for meeting these st<strong>and</strong>ards includeappropriate l<strong>and</strong> treatment practices, production practices, managementmeasures, technologies or combinations thereof. Water Pollution Control Program Grants (Section 106)The Water Pollution Control Program funds ongoing <strong>water</strong> pollutioncontrol programs that include permitting, pollution control activities,surveillance, monitoring, <strong>and</strong> enforcement; advice <strong>and</strong> assistance to localagencies, <strong>and</strong> the provision of training <strong>and</strong> public information.Klotz Associates Project No. 0972.000.000January 201015-8Caldwell County Regional Water <strong>and</strong> Waste<strong>water</strong> Planning StudyFinal Report
SECTION 16SUMMARY OF RECOMMENDATIONS FOR WATER ANDWASTEWATER FACILITIES16.1 IntroductionThe following paragraphs summarize the general facilities plans for <strong>water</strong> <strong>and</strong>waste<strong>water</strong> treatment that resulted from the Caldwell County Regional Water <strong>and</strong>Waste<strong>water</strong> Planning Study.16.2 Recommended Regional Water Supply FacilitiesThe recommended <strong>regional</strong> <strong>water</strong> supply facilities are those that will bedeveloped to utilize <strong>water</strong> made available under a proposed conjunctive-useground<strong>water</strong>-surface <strong>water</strong> project to be developed by the GBRA. This project,known as the Mid-Basin Project, was not included in the 2006 Region L Plan <strong>and</strong>a request has been made by GBRA to add the project to the 2011 Region L Plan.The proposed Mid-Basin Project will provide 25,000 ac-ft to customers ofCaldwell, Comal, Gonzales, Guadalupe, <strong>and</strong> Hays Counties. The source of <strong>water</strong>will be primarily surface <strong>water</strong> from the Guadalupe River with a point ofdiversion below the confluence of the San Marcos River. The <strong>water</strong> in the river atthe proposed diversion point is not considered firm yield unless it is backed upwith off channel storage or a ground<strong>water</strong> source. Off-channel storage inGuadalupe County is being considered for the Mid-Basin Project as well as asecondary source of supply from the Carrizo <strong>and</strong>/or Wilcox Aquifers in westcentralor northeast Gonzales County.The advantage of the Mid-Basin Project compared to the proposed Hays-CaldwellPUA Project is the ability of the Mid-Basin Project to draw on either surfaceKlotz Associates Project No. 0972.000.000January 201016-1Caldwell County Regional Water <strong>and</strong> Waste<strong>water</strong> Planning StudyFinal Report
<strong>water</strong> or ground<strong>water</strong> to meet future <strong>water</strong> supply needs. Redundancy in <strong>water</strong>sources is an important part of a long-term <strong>water</strong> supply plan to buffer impactsfrom droughts, aquifer management rules <strong>and</strong> potential pollutant contamination of<strong>water</strong> sources.Exhibit 16-1 presents the features of the recommended <strong>regional</strong> <strong>water</strong> supplyplan. The primary features include:• River pumping plant with dam to create pumping pool in GuadalupeRiver for scalping flood flows• Off-channel storage reservoir near river pumping plant to provide <strong>water</strong>delivery system <strong>water</strong> balance• Carrizo Aquifer Well Field in southern Caldwell/northeastern GonzalesCounties• Pipeline (approximately 18 miles) to convey raw surface <strong>water</strong> from offchannelstorage reservoir to Luling• New surface <strong>water</strong> treatment plant at Luling• Pipeline (approximately 21 miles) to convey unchlorinated ground<strong>water</strong>from Carrizo well field to Lockhart• New ground<strong>water</strong> treatment plant at Lockhart• Pipeline (approximately 12 miles) to convey treated <strong>water</strong> north fromLockhart along SH 130• Pipeline (approximately 10 miles) to convey treated <strong>water</strong> west fromLockhart along SH 130• Pipeline (approximately 7 miles) to convey treated <strong>water</strong> north fromLockhart along FM 2720• Use existing pipeline from Lockhart to Luling to move <strong>water</strong> in eitherdirection as dem<strong>and</strong>s <strong>and</strong> supplies are balancedThe majority of the stakeholders attending the <strong>regional</strong> <strong>planning</strong> meetingssupported either the proposed Mid-Basin Project or the HCPUA Project. The16-2Klotz Associates Project No. 0972.000.000Caldwell County Regional Water <strong>and</strong> Waste<strong>water</strong> Planning StudyJanuary 2010Final Report
Klotz Associates Project No. 0972.000.000January 201016-3Caldwell County Regional Water <strong>and</strong> Waste<strong>water</strong> Planning StudyFinal Report
Mid-Basin Project <strong>and</strong> associated facilities were recommended forimplementation. There was no voiced or written opposition to the Mid-BasinProject but the owners of the HCPUA project have expressed that they willcontinue to move the HCPUA project forward.16.3 Recommended Regional Waste<strong>water</strong> Treatment FacilitiesThe recommended <strong>regional</strong> waste<strong>water</strong> treatment facilities are based on a<strong>regional</strong>ization concept that will ultimately provide four <strong>regional</strong> waste<strong>water</strong>facilities in the <strong>county</strong>. These facilities will be sized <strong>and</strong> phased to accommodategrowth <strong>and</strong> enable reuse of reclaimed <strong>water</strong>.Exhibit 16-2 presents the features of the recommended <strong>regional</strong> waste<strong>water</strong>treatment plan. The primary features include:• Waste<strong>water</strong> treatment plant at Lockhart• Waste<strong>water</strong> treatment plant at Martindale• Waste<strong>water</strong> treatment plant at Luling• Waste<strong>water</strong> treatment plant in Peach Creek Basin• Regional waste<strong>water</strong> collection pipelines with downstream connectivityThe majority of the stakeholders attending the <strong>regional</strong> <strong>planning</strong> meetingssupported either the proposed <strong>regional</strong> plan or a decentralized plan of multiplesmaller treatment plants throughout the County. The large plant <strong>regional</strong>izationplan was recommended for implementation. There was no voiced opposition tothe large plant <strong>regional</strong>ization plan but there is growing interest in thedecentralized treatment plant concepts.Klotz Associates Project No. 0972.000.000January 201016-4Caldwell County Regional Water <strong>and</strong> Waste<strong>water</strong> Planning StudyFinal Report
Klotz Associates Project No. 0972.000.000January 201016-5Caldwell County Regional Water <strong>and</strong> Waste<strong>water</strong> Planning StudyFinal Report
C O N S U L T I N G E N G I N E E R SAppendix ACaldwell County Stakeholder Sign-In SheetsKlotz Associates Project No. 0972.000.000January 2010APPENDIX-ACaldwell County Regional Water <strong>and</strong> Waste<strong>water</strong> Planning StudyFinal Report
C O N S U L T I N G E N G I N E E R SAppendix BCaldwell County Regional Water <strong>and</strong> Waste<strong>water</strong> PlanningStudy Utility SurveyKlotz Associates Project No. 0972.000.000January 2010APPENDIX-BCaldwell County Regional Water <strong>and</strong> Waste<strong>water</strong> Planning StudyFinal Report
APPENDIX B !" #$ # % & '( " $# $ ( " $ # $ ( # $ )# $*( # $ # )# $*( # $ # +*(, % '( - ##%' # . " Page 1 of 10T:\0972.000.000\06.00 Work Products\Report\TOC-Appendix\APPENDIX A - CC UTILITY SURVEY\Survey.doc
APPENDIX B/012234 ! &# ! % 44' # (0 5# 5# 1223 6" 6"1227 6" 6"1228 6" 6"1229 6" 6"122: 6" 6" # (0 ;6 ) , 6 6
APPENDIX B0 / ?% '(0 ;6 ) , 6 6
APPENDIX B#$ # 4(0 A
APPENDIX B ) ) ) B C * ( C ! + C. !Page 5 of 10T:\0972.000.000\06.00 Work Products\Report\TOC-Appendix\APPENDIX A - CC UTILITY SURVEY\Survey.doc
APPENDIX B # !6 . 0.# # / %' # . 4 4)# #. # 4 !% & ' , , , , % '( - ##%' # . " /012234 # %#4&'!Page 6 of 10T:\0972.000.000\06.00 Work Products\Report\TOC-Appendix\APPENDIX A - CC UTILITY SURVEY\Survey.doc
APPENDIX B &# ! % 44' # (0 5# 5# 1223 6" 6"1227 6" 6"1228 6" 6"1229 6" 6"122: 6" 6" # (0 ; ) ,
APPENDIX B # ;4 Page 8 of 10T:\0972.000.000\06.00 Work Products\Report\TOC-Appendix\APPENDIX A - CC UTILITY SURVEY\Survey.doc
APPENDIX B # %# '(=. )1. )@. ):. )9. )A # #( " 5 ) ) ) ) + ) ! %' # !Page 9 of 10T:\0972.000.000\06.00 Work Products\Report\TOC-Appendix\APPENDIX A - CC UTILITY SURVEY\Survey.doc
APPENDIX B 4 4)# #. , ( Page 10 of 10T:\0972.000.000\06.00 Work Products\Report\TOC-Appendix\APPENDIX A - CC UTILITY SURVEY\Survey.doc
C O N S U L T I N G E N G I N E E R SAppendix CWater Quality St<strong>and</strong>ardsKlotz Associates Project No. 0972.000.000January 2010APPENDIX-CCaldwell County Regional Water <strong>and</strong> Waste<strong>water</strong> Planning StudyFinal Report
APPENDIX CThe following tables are found in 30 TAC 290 Subchapter F: Drinking Water St<strong>and</strong>ards.Refer to this section of the Texas Administrative Code (TAC) for further details ondrinking <strong>water</strong> st<strong>and</strong>ards.Secondary ConstituentsSummary of Secondary St<strong>and</strong>ardsCONTAMINANTLEVEL(mg/l except whereotherwise stated)Chloride 300Flouride 2.0Iron 0.3Manganese 0.05Sulfate 300Total Dissolved Solids 1,000Inorganic ContaminantsInorganic ContaminantsCONTAMINANTMCL (mg/l)Nitrate10 (as Nitrogen)Nitrate1 (as Nitrogen)Nitrate & Nitrate (Total)10 (as Nitrogen)
C O N S U L T I N G E N G I N E E R SAppendix DTWDB Ground<strong>water</strong> Quality ReportKlotz Associates Project No. 0972.000.000January 2010APPENDIX-DCaldwell County Regional Water <strong>and</strong> Waste<strong>water</strong> Planning StudyFinal Report
Texas Water Development BoardGround<strong>water</strong> Database ReportsWater Quality Publication ReportCaldwellCounty:State WellNumber5860703586070458607055860706586070758607096702503670250767026016702602670260367027026702703670270467027056702706670270767027086702801Aquifer Depth Date B/U pH Silica Calcium Magnesium Sodium Potassium Carbonate Bicarb. Sulfate Chloride Fluoride Nitrate124WLCX 49 2 / 27 / 1946 U 0 65.9 28 41 62DissolvedSolidsSpec. CondumhosHardnessas CaCO3% Sodium SAR RSC124WLCX 18 2 / 27 / 1946 B 7.2 35 46 6.7 36 4.6 0 152.54 20 51 0.2 9.8 284 470 142 35 1.29 0124WLCX 44 6 / 11 / 1946 U 0 84 13 102 41124WLCX 26 6 / 11 / 1946 U 0 328 16 84 2.2124WLCX 150 1 / 9 / 1964 B 7.6 16 24 7.8 c 150 0 334.09 37 74 0.6 0 473 795 92 78 6.77 3.64124WLCX 180 7 / 19 / 1977 B 7.6 29 50.6 9.97 103 0 219.66 44 115 0.3 2.4 462 846 167 57 3.45 0.25110AVML 29 6 / 13 / 1946 U 0 270 16 16 30110AVML 21 6 / 12 / 1946 U 7.9 230 20 16 41110AVML 19 6 / 12 / 1946 U 12 202 32 26 34110AVML 21 6 / 12 / 1946 U 9.8 144 13 28 60110AVML 35 6 / 13 / 1946 U 11 231 25 27 55100ALVM 27 2 / 26 / 1968 B 7.3 19 98 7 30 0 339.26 20 22 0.3 7 370 680 273 19 0.79 0.09100ALVM 31 2 / 26 / 1968 B 7.2 20 130.2 8.5 57.3 0 345.36 58 55 0.4 72 571 1038 359 25 1.3 0110AVML 31 3 / 28 / 1946 U 0 294 65 71 59110AVML 22 3 / 28 / 1946 U 0 286 34 64 47110AVML 25 3 / 28 / 1946 U 0 356 65 141 176100ALVM 26 2 / 26 / 1968 B 7.3 18 106.4 7.66 27.8 0 356.34 27 18 0.5 13 393 716 297 16 0.71 0100ALVM 29 2 / 28 / 1968 B 7.1 18 201 21 180 0 339.26 211 334 0.5 16.5 1148 2272 587 39 3.23 0* Depth value here reflects the bottom of the SAMPLED INT ERVAL which was different from the completed well depthMonday, March 02, 2009 created by the Texas Water Development BoardPage 1 of 16
State WellNumber67029026702905670290867033016703303670330467034016703402670360167036026703603670370367037046703705670370667037076703708670370967037116703712Aquifer Depth Date B/U pH Silica Calcium Magnesium Sodium Potassium Carbonate Bicarb. Sulfate Chloride Fluoride NitrateDissolvedSolidsSpec. CondumhosHardnessas CaCO3% Sodium SAR RSC100ALVM 22 2 / 14 / 1946 B 122 5.1 c 38 0 268.07 40 81 40 457 891 325 20 0.92 0112LEON 25 3 / 28 / 1946 U 0 264 110 358 58112LEON 24 3 / 29 / 1946 U 0 248 65 239 38112LEON 20 7 / 18 / 1976 B 7.2 17 133.6 5.5 44.4 0 405.15 35 57 0.4 5.8 497 924 356 21 1.02 0124WLCX 20 6 / 11 / 1946 U 0 340 1150 1240124WLCX 20 7 / 19 / 1977 B 7.8 24 514 215 660 0 817.63 1788 808 1.5 1.3 4413 8344 2167 39 6.17 0124WLCX 67 6 / 11 / 1946 U 0 298 24 54 0124WLCX 72 2 / 27 / 1946 U 0 336 85 560 1.5110AVML 14 6 / 12 / 1946 U 0 308 65 32 25110AVML 30 6 / 12 / 1946 U 0 284 54 70 33124WLCX 49 4 / 12 / 1946 U 0 412 80 94 0.5124WLCX 35 6 / 11 / 1946 U 0 340 765 148124WLCX 26 6 / 11 / 1946 U 0 338 430 800112LEON 29 1 / 24 / 1946 U 0 326 46 22 26218EDRDA 3367 2 / 20 / 1964 B 6.9 17 894 433 c 2480 0 547.15 2130 4770 10993 15800 4012 57 17.03 0112LEON 23 1 / 25 / 1946 U 0 278 45 27112LEON 23 7 / 14 / 1943 U 195112LEON 23 8 / 23 / 1943 U 209112LEON 23 1 / 25 / 1946 U 0 274 60 42 16112LEON 23 1 / 24 / 1946 U 0 272 26 20 20112LEON 16 1 / 24 / 1946 U 0 253 35 26112LEON 17 1 / 24 / 1946 U 0 282 26 38 39112LEON 31 1 / 24 / 1946 U 0 316 45 37 26112LEON 22 1 / 24 / 1946 U 0 298 45 30* Depth value here reflects the bottom of the SAMPLED INT ERVAL which was different from the completed well depthMonday, March 02, 2009 created by the Texas Water Development BoardPage 2 of 16
State WellNumber670371367037156703717670371867037196703720670372167037226703723670380167038026703803Aquifer Depth Date B/U pH Silica Calcium Magnesium Sodium Potassium Carbonate Bicarb. Sulfate Chloride Fluoride Nitrate112LEON 17 1 / 24 / 1946 U 0 303 90 100112LEON 12 3 / 28 / 1946 U 0 310 34 32 30112LEON 25 7 / 14 / 1943 U 370112LEON 25 8 / 23 / 1943 U 390112LEON 25 1 / 25 / 1946 U 0 251 70 191112LEON 21 1 / 25 / 1946 U 0 276 32 45112LEON 21 1 / 25 / 1946 U 0 260 22 30112LEON 25 8 / 23 / 1943 U 30112LEON 25 1 / 25 / 1946 U 0 274 28 32 48DissolvedSolidsSpec. CondumhosHardnessas CaCO3% Sodium SAR RSC112LEON 28 7 / 2 / 1943 B 158 12 c 121 0 299.08 127 215 32 812 1380 443 37 2.5 0112LEON 28 7 / 14 / 1943 U 210112LEON 28 8 / 23 / 1943 U 197112LEON 28 1 / 25 / 1946 U 0 320 70 155112LEON 28 6 / 20 / 1964 B 6.8 21 119 9 c 80 0 314.09 54 112 0.4 45 594 986 334 34 1.9 0112LEON 15 1 / 25 / 1946 U 0 277 40 29112LEON 21 7 / 14 / 1943 B 252 9 c 112 0 226.07 108 402 55 1049 665 26 1.89 0112LEON 21 1 / 25 / 1946 U 26 306 60 102112LEON 15 3 / 16 / 1943 B 7.2 17 142 7.05 c 75 0 273.08 49 160 0.4 53 637 383 29 1.67 0112LEON 15 3 / 31 / 1944 B 7.2 20 142 7 c 70 0 292.88 69 128 < 0.4 55 635 383 28 1.56 0112LEON 15 4 / 3 / 1945 B 7.5 21 125 8 c 86 0 298.98 70 91 0.4 106 654 344 35 2.01 0112LEON 15 2 / 8 / 1946 B 7.3 14 126 6.1 54 12 0 322.09 47 82 < 0.4 54 553 941 339 25 1.28 0112LEON 15 8 / 12 / 1947 B 7.2 19 122 14 c 25 0 336.1 47 43 0.2 40 475 362 13 0.57 0112LEON 15 5 / 4 / 1951 B 7.4 21 107 7 c 50 0 336.1 49 43 0.2 23 465 295 26 1.26 0112LEON 25 3 / 16 / 1943 B 7.1 25 420 29 c 304 0 223.07 187 1030 < 0.4 20 2125 1167 36 3.87 0112LEON 25 4 / 2 / 1944 B 7.2 32 343 21 c 276 0 241.07 292 724 < 0.4 27 1833 942 38 3.91 0112LEON 25 4 / 3 / 1945 B 7.2 32 346 25 c 359 0 250.07 370 781 0.5 71 2107 966 44 5.02 0112LEON 25 2 / 8 / 1946 B 7.4 12 246 15 269 15 0 293.08 321 465 0.6 60 1547 2560 675 46 4.5 0112LEON 25 8 / 12 / 1947 B 7.5 25 158 11 c 212 0 342.1 263 224 0.2 38 1099 439 51 4.4 0112LEON 25 7 / 16 / 1951 B 7.5 20 109 7 c 116 0 329.09 141 85 0.3 22 662 300 45 2.91 0112LEON 15 11 / 29 / 1938 B 7.7 27 168 15 c 99 0 290.08 86 211 0.4 89 838 480 30 1.96 0112LEON 15 3 / 16 / 1943 B 7.1 24 286 19 c 167 0 183.05 121 604 0.4 35 1346 791 31 2.58 0112LEON 15 3 / 31 / 1944 B 7.2 30 285 18 c 204 0 250.07 220 540 < 0.4 44 1464 785 36 3.17 0* Depth value here reflects the bottom of the SAMPLED INT ERVAL which was different from the completed well depthMonday, March 02, 2009 created by the Texas Water Development BoardPage 3 of 16
State WellNumber670380467038056703806670380767038086703809670381067038116704202670440167045016704502Aquifer Depth Date B/U pH Silica Calcium Magnesium Sodium Potassium Carbonate Bicarb. Sulfate Chloride Fluoride NitrateDissolvedSolidsSpec. CondumhosHardnessas CaCO3% Sodium SAR RSC112LEON 15 4 / 3 / 1945 B 7.2 23 207 14 c 199 0 281.08 200 355 0.4 84 1220 574 42 3.61 0112LEON 15 2 / 8 / 1946 B 7.4 15 166 10 147 11 0 308.09 174 218 0 60 952 1600 455 41 3 0112LEON 15 8 / 12 / 1947 B 7.4 21 133 13 c 121 0 329.09 141 142 0.2 40 773 385 40 2.68 0112LEON 15 5 / 4 / 1951 B 7.6 24 104 8 c 116 0 323.09 109 103 0.5 27 650 292 46 2.95 0112LEON 15 1 / 7 / 1963 B 7.5 114 9 85 0 311.09 72 101 0.3 54 588 1140 321 36 2.06 0112LEON 15 1 / 12 / 1965 B 7.5 120 9 89 0 330.71 80 104 0.6 48 613 1145 336 36 2.11 0112LEON 15 2 / 22 / 1966 B 7.6 112 7 77 0 295.32 69 84 0.6 39 533 1020 308 35 1.91 0112LEON 15 5 / 12 / 1967 B 7.4 115 6 78 0 294.1 66 97 0.6 33 540 1050 311 35 1.92 0112LEON 15 2 / 15 / 1968 B 7.5 116 9 83 0 322.17 89 98 0.5 32 585 1113 326 35 2 0112LEON 15 2 / 17 / 1969 B 7.4 114 10 66 0 297.76 66 84 0.6 39.5 526 996 325 30 1.59 0112LEON 15 4 / 13 / 1970 B 7.2 122 8 71 0 298.98 73 100 0.5 31 552 1057 337 31 1.68 0112LEON 15 2 / 15 / 1971 B 7.3 131 11 71 0 286.78 65 131 0.4 39 589 1141 372 29 1.6 0112LEON 15 2 / 17 / 1972 B 7.4 122 9 78 0 292.08 73 111 0.5 40 577 1120 341 33 1.84 0112LEON 15 7 / 19 / 1977 B 7.5 21 130 7.9 54 0 352.68 48 79 0.4 20.9 534 987 357 24 1.24 0112LEON 25 5 / 4 / 1951 B 7.6 21 88 9 c 106 0 311.19 96 78 0.4 26 577 256 47 2.88 0112LEON 25 2 / 22 / 1966 B 7.4 102 11 63 0 285.56 65 66 0.5 42 489 930 299 31 1.58 0112LEON 21 7 / 14 / 1943 U 262112LEON 21 8 / 23 / 1943 U 315112LEON 21 1 / 29 / 1946 U 0 361 60 162112LEON 29 7 / 14 / 1943 U 88112LEON 29 8 / 23 / 1943 U 84112LEON 29 1 / 29 / 1946 U 0 278 34 43 61112LEON 24 1 / 24 / 1946 U 0 381 90 72112LEON 18 1 / 29 / 1946 U 0 268 95 93 165112LEON 28 1 / 29 / 1946 U 0 332 105 292112LEON 30 1 / 24 / 1946 U 0 340 230 327112LEON 35 1 / 25 / 1946 U 0 330 40 46124WLCX 27 8 / 7 / 1946 U 0 317 46 38 0124WLCX 128 4 / 12 / 1946 U 24 460.07 90 408 2.5124WLCX 120 7 / 27 / 1953 U 47 0 159 137 119 0.1 0.2 653 1090124WLCX 120 2 / 12 / 1962 B 7 49 194 20 c 81 0 264.07 332 128 0.2 0 934 1330 566 23 1.48 0124WLCX 110 3 / 14 / 1946 B 7.4 36 132 18 36 17 0 376 72 85 0 0.8 581 961 403 16 0.78 0* Depth value here reflects the bottom of the SAMPLED INT ERVAL which was different from the completed well depthMonday, March 02, 2009 created by the Texas Water Development BoardPage 4 of 16
State WellNumber67045036704504670450667045116704512670460167046026704605670470167047096704710670480167048036704901670490267049046704905670490667054026705701Aquifer Depth Date B/U pH Silica Calcium Magnesium Sodium Potassium Carbonate Bicarb. Sulfate Chloride Fluoride Nitrate124WLCX 70 4 / 12 / 1946 U 0 100 75 374 5.5DissolvedSolidsSpec. CondumhosHardnessas CaCO3% Sodium SAR RSC124WLCX 70 1 / 13 / 1970 B 7 43 73 13.5 65 5 0 112.27 28 189 0.1 4.5 476 903 237 37 1.83 0124WLCX 70 7 / 19 / 1977 B 7.1 49 83 15.7 73 0 137.9 27 196 0.1 10.9 522 1008 271 36 1.92 0124WLCX 150 8 / 7 / 1946 U 0 339 60 44 0124WLCX 97 8 / 7 / 1946 U 0 332 45 101124WLCX 323 4 / 29 / 1978 B 7.8 120.1 27.2 108 0 285.56 151.5 181 0.4 0 728 1150 411 36 2.32 0124WLCX 323 10 / 21 / 1992 B 7.19 31 87 22 92 7.3 0 285.56 125 107 0.58 < 0.04 612 963 308 39 2.28 0124WLCX 336 6 / 5 / 1998 B 6.95 42.6 107 20.8 73.8 3.79 0 258.71 113 121 0.11 < 0.22 610 1114 353 31 1.71 0124WLCX 336 3 / 25 / 2002 B 7.08 38.2 96.6 19 72.8 3.41 0 262.37 102 115 0.25 0.18 577 970 319 33 1.77 0124WLCX 336 6 / 14 / 2006 B 7.2 33.5 103 20.5 72.4 3.3 0 268.47 108 113 0.3 < 0.44 587 843 342 32 1.7 0124WLCX 185 8 / 5 / 1946 U 0 416 220 372 0124WLCX 174 8 / 5 / 1946 U 0 622 200 141 0124WLCX 100 6 / 12 / 1978 B 7.7 46 68 15 90 0 250.17 50 128 0.3 < 0.4 520 959 231 45 2.57 0124WLCX 82 4 / 4 / 1947 B 118 23 c 43 0 236.06 120 116 2 538 909 389 19 0.95 0124WLCX 136 9 / 26 / 1963 B 7.1 172 45 545 16 0 305.09 725 650 2303 4044 614 65 9.57 0124WLCX 445 2 / 4 / 1952 B 7.38 22 67.2 13.5 c 65.5 0 158.6 108.6 86 440 223 38 1.91 0124WLCX 206 8 / 2 / 1946 U 0 370 26 35124WLCX 494 10 / 11 / 1995 B 7.9 30 13 109 0 279.46 43 61 0.6 < 0.04 394 748 128 64 4.19 2.01124WLCX 327 8 / 3 / 1946 U 0 266 25 152124WLCX 216 4 / 17 / 1946 U 12 568 480 180124WLCX 270 11 / 6 / 1969 B 7.6 31 92 36 54 4 0 261.15 23 186 0.5 < 0.4 555 1106 377 23 1.21 0124WLCX 200 8 / 3 / 1946 U 0 352 20 76124WLCX 295 6 / 24 / 1964 B 7.3 19 108 88 c 451 0 604.17 244 610 0.1 2 1819 3000 631 60 7.81 0124WLCX 200 8 / 5 / 1946 U 0 517 70 308* Depth value here reflects the bottom of the SAMPLED INT ERVAL which was different from the completed well depthMonday, March 02, 2009 created by the Texas Water Development BoardPage 5 of 16
State WellNumber670570267057036705801670580267101016710103671010467102016710202671020367103016710501671050267105046710801671080267109016710907671090867111016711104Aquifer Depth Date B/U pH Silica Calcium Magnesium Sodium Potassium Carbonate Bicarb. Sulfate Chloride Fluoride Nitrate124WLCX 165 8 / 3 / 1946 U 0 662 95 332124WLCX 350 8 / 5 / 1946 U 0 364 130 205DissolvedSolidsSpec. CondumhosHardnessas CaCO3% Sodium SAR RSC124WLCX 160 6 / 24 / 1964 B 7 15 178 88 c 474 0 636.18 216 770 0.3 3 2057 3410 806 56 7.26 0124CRRZ 27 6 / 24 / 1964 B 6 95 26 13 c 60 0 32.01 17 96 1.1 83 406 565 118 52 2.4 0124WLCX 419 6 / 24 / 1964 B 7.4 38 80 16 c 99 0 236.06 4.8 200 0.2 0.2 554 1010 265 44 2.64 0112LEON 26 2 / 0 / 1943 B 7.6 14 90 23 c 18 3.4 0 325.09 19 21 0.2 57 405 737 319 10 0.44 0112LEON 29 6 / 13 / 1946 U 9.8 245 60 102 60100ALVM 23 3 / 4 / 1986 B 8.1 15 96 5.2 12 2 0 251.39 43 9 0.3 44.57 350 625 260 9 0.32 0112LEON 25 2 / 14 / 1946 B 7.2 14 244 28 155 22 0 265.07 183 426 0.6 99 1301 2250 724 31 2.51 0112LEON 34 4 / 9 / 1946 U 0 244 170 450 52100ALVM 30 6 / 20 / 1964 B 6.8 22 178 19 c 189 0 268.07 273 268 0.7 62 1143 1780 522 44 3.6 0100ALVM 30 8 / 18 / 1977 B 8 25 315 31 250 0 264.82 291 637 0.6 78.8 1758 3562 913 37 3.6 0112LEON 3 / 28 / 1946 U 0 306 240 248 81100ALVM 35 8 / 9 / 1946 U 0 268 65 126 108112LEON 21 5 / 9 / 1946 U 0 420 210 443 168112LEON 24 4 / 8 / 1946 U 0 296 55 30 38100ALVM 34 2 / 13 / 1962 B 6.7 12 78 16 11 0.7 0 275.08 26 22 0.3 3.8 305 538 260 8 0.3 0100ALVM 30 4 / 8 / 1946 U 0 391 24 28 0.5124WLCX 27 2 / 0 / 1943 B 8 15 67 19 c 12 3.4 0 257.08 26 20 0.6 10 299 245 9 0.33 0124WLCX 18 4 / 3 / 1946 U 17 275 1460 467124WLCX 30 4 / 3 / 1946 U 0 638 340 308 231112LEON 20 4 / 19 / 1946 U 0 308 75 98 86112LEON 3 / 29 / 1946 U 0 300 36 27 19* Depth value here reflects the bottom of the SAMPLED INT ERVAL which was different from the completed well depthMonday, March 02, 2009 created by the Texas Water Development BoardPage 6 of 16
State WellNumber6711105671120267112036711204671130167113066711307671130867113096711310671131167113126711501671150267116016711606671160767116086711618671161967116206711623Aquifer Depth Date B/U pH Silica Calcium Magnesium Sodium Potassium Carbonate Bicarb. Sulfate Chloride Fluoride Nitrate112LEON 1 / 30 / 1946 U 0 261 36 36 49112LEON 28 4 / 19 / 1946 U 0 304 40 72 62112LEON 74 3 / 20 / 1946 U 0 346 100 770 260112LEON 29 3 / 20 / 1946 U 0 357 20 157 150DissolvedSolidsSpec. CondumhosHardnessas CaCO3% Sodium SAR RSC124WLCX 324 2 / 14 / 1952 B 7.35 16 85.8 9.6 c 81.2 0 373.3 27.7 67 470 253 41 2.2 1.05124WLCX 138 3 / 3 / 1964 B 7.4 33 155 22 c 177 0 486.14 66 265 0.2 24 981 1680 477 44 3.52 0124WLCX 76 4 / 16 / 1946 U 0 292 12 80 118124WLCX 52 4 / 16 / 1946 U 0 292 15 20 20124WLCX 100 4 / 2 / 1964 B 7 20 92 2.6 c 17 0 272.08 15 20 0.3 13 313 532 240 13 0.48 0124WLCX 100 7 / 20 / 1977 B 7.6 9 63 17 151 0 124.48 121 229 0.2 < 0.4 651 1305 226 59 4.36 0124WLCX 50 1 / 30 / 1946 U 0 309 16 36 32124WLCX 110 4 / 2 / 1964 B 7.1 28 168 29 c 165 0 308.09 181 322 0.5 1.2 1046 1780 538 39 3.09 0124WLCX 2500 1 / 30 / 1946 B 66 19 c 279 0 356.1 50 358 1.2 948 242 71 7.79 0.98124WLCX 168 3 / 20 / 1946 U 0 344 140 156 0.5124WLCX 94 3 / 20 / 1946 U 0 300 650 430 30124WLCX 125 5 / 9 / 1958 B 7.8 32 82 5.8 c 49 0 358.1 15 17 0.4 0 377 611 228 31 1.41 1.3124WLCX 97 5 / 3 / 1946 U 15 222 14 30 85112LEON 68 5 / 3 / 1946 U 22 214 22 35 126112LEON 86 5 / 3 / 1946 U 29 207 16 33 130124WLCX 35 2 / 2 / 1946 B 364 67 c 172 0 432.12 613 400 1.5 1829 1183 24 2.17 0124WLCX 168 5 / 19 / 1971 B 7.4 32 121 14 29 0 367.32 41 54 0.2 < 0.4 472 852 359 14 0.67 0124WLCX 5 / 20 / 1971 B 7.2 34 284 22 118 0 311.19 49 530 0.4 4.5 1194 2496 799 24 1.82 0* Depth value here reflects the bottom of the SAMPLED INT ERVAL which was different from the completed well depthMonday, March 02, 2009 created by the Texas Water Development BoardPage 7 of 16
State WellNumber671170167117026711703671170467117056711801671190267119056711912671210167121026712103671210467121056712106671210767121106712111Aquifer Depth Date B/U pH Silica Calcium Magnesium Sodium Potassium Carbonate Bicarb. Sulfate Chloride Fluoride NitrateDissolvedSolidsSpec. CondumhosHardnessas CaCO3% Sodium SAR RSC124WLCX 400 10 / 21 / 1992 B 6.72 37 158 17 63 4 0 322.17 66 178 0.19 < 0.04 682 1122 465 22 1.27 0124WLCX 400 6 / 5 / 1998 B 6.57 41.8 163 18.5 69 3.44 0 314.85 79 223 0.06 < 0.22 754 1450 484 23 1.37 0124WLCX 400 3 / 25 / 2002 B 6.68 37.8 164 18.2 71.9 3.41 0 317.29 78.9 223 0.15 0.14 754 1323 485 24 1.42 0124WLCX 400 6 / 14 / 2006 B 6.78 33.6 186 19.7 74.8 3.3 0 317.28 87 235 0.2 < 0.44 797 1149 547 23 1.39 0124WLCX 30 4 / 3 / 1946 U 0 478 300 480 540124WLCX 42 4 / 3 / 1946 U 0 542 55 104 0124WLCX 56 4 / 3 / 1946 U 0 408 44 42 1124WLCX 65 4 / 3 / 1946 U 0 38 850 190124WLCX 130 11 / 14 / 1963 B 7.6 28 280 61 c 290 0 360.1 240 730 6.7 1812 3130 949 39 4.09 0124WLCX 14 3 / 20 / 1946 U 0 106 100 49 110124WLCX 44 5 / 7 / 1946 U 20 262 360 184 8.7124WLCX 203 1 / 8 / 1964 B 7.6 23 54 16 138 3.6 0 370 68 97 0.3 0 581 972 200 59 4.24 2.05124WLCX 220 5 / 4 / 1978 B 7.4 51 141 33 136 0 319.73 330 110 0.6 < 0.4 959 1690 487 37 2.68 0124WLCX 368 * 2 / 18 / 1952 B 7.3 11 98.4 10 c 85.9 0 395.3 31.5 82 513 286 39 2.19 0.75124WLCX 240 8 / 11 / 1952 B 7.7 38 98 12 61 1.2 0 367.1 28 71 0.2 0 489 878 293 31 1.55 0.14124WLCX 140 * 4 / 24 / 1952 B 7.8 15 34.4 6.8 c 197 0 339.1 44.3 154 618 113 79 8.19 3.28124WLCX 276 * 5 / 22 / 1952 B 8.12 21 15.7 5 c 206.4 0 375.11 33.4 116 581 59 88 11.62 4.95124WLCX 283 8 / 6 / 1952 B 7.8 22 19 6.6 201 0.4 0 354.1 39 124 1 2 589 1030 74 85 10.02 4.31124WLCX 342 2 / 9 / 1952 B 7.25 26.8 88.6 18.4 c 69.7 0 363.6 27.3 86 495 296 33 1.77 0.02124WLCX 484 2 / 22 / 1952 B 7.9 8 24.6 7.8 c 159.1 0 293.08 81.5 80 505 93 78 7.09 2.93124WLCX 364 5 / 17 / 1952 B 8 14 13 3.2 c 226.1 0 423 0 136 600 45 91 14.69 6.02124WLCX 91 6 / 17 / 1946 U 0 57 140 179 34218EDRD 2539 8 / 23 / 1943 B 7.8 37 87 20 c 104 0 369.11 26 139 0 0.2 594 986 299 43 2.61 0.06218EDRD 2539 1 / 30 / 1946 U 0 374 26 126124WLCX 39 6 / 27 / 1946 U 0 294 90 209 1124WLCX 175 1 / 13 / 1970 B 8 33 70 17 66 7 0 90.31 133 136 0.2 3 509 952 244 36 1.84 0* Depth value here reflects the bottom of the SAMPLED INT ERVAL which was different from the completed well depthMonday, March 02, 2009 created by the Texas Water Development BoardPage 8 of 16
State WellNumber671211267121136712114671211567121166712117671211967122026712203671230167123026712303671230567123066712307671231267124066712407671240867124126712413Aquifer Depth Date B/U pH Silica Calcium Magnesium Sodium Potassium Carbonate Bicarb. Sulfate Chloride Fluoride NitrateDissolvedSolidsSpec. CondumhosHardnessas CaCO3% Sodium SAR RSC124WLCX 300 6 / 7 / 1964 B 7.6 22 35 12 c 154 0 214.06 168 85 0.3 0 581 921 136 71 5.73 0.77124WLCX 213 6 / 23 / 1952 B 7.22 51 43.2 6.2 c 40.1 0 124.4 35.2 58 294 133 39 1.51 0124WLCX 201 6 / 24 / 1952 B 7.25 28 74.8 5.5 c 44.3 0 209.8 35.8 68 359 209 31 1.33 0124WLCX 552 10 / 29 / 1952 B 8.4 15 9.6 3.5 c 221.3 0 398 26.2 116 587 38 92 15.54 5.76124WLCX 240 11 / 10 / 1969 B 6.9 17 50 16 61 5 0 93.97 80 115 0.3 < 0.4 390 750 190 41 1.92 0124WLCX 200 5 / 20 / 1971 B 7.2 34 99 7 42 0 250 36 91 0.7 1 433 798 276 24 1.1 0124WLCX 302 9 / 17 / 1970 B 7.83 13 9 3 c 228 0 394.17 13 138 597 1040 34 93 16.81 5.76124WLCX 153 6 / 17 / 1946 U 0 322 120 158 1.8124WLCX 87 6 / 19 / 1946 U 0 164 50 206 0124WLCX 300 3 / 14 / 1946 B 7.5 22 96 59 134 16 0 430.12 96 229 0.6 22 886 1580 482 37 2.65 0124WLCX 126 7 / 16 / 1946 U 0 358 60 230 0124WLCX 66 6 / 20 / 1946 U 22 316 250 550 6.5124WLCX 335 6 / 20 / 1946 U 24 248 150 375124WLCX 100 8 / 2 / 1946 U 0 302 40 80 0.5124WLCX 140 8 / 2 / 1946 U 0 446 45 181 22 467124WLCX 520 3 / 22 / 1971 B 8 40 15 105 0 298.98 45 60 0.4 5 417 161 58 3.59 1.67124WLCX 520 6 / 5 / 1998 B 7.52 26.4 24.7 9.99 128 3.19 0 319.73 41.1 50.4 0.35 < 0.22 442 896 103 73 5.49 3.19124WLCX 520 3 / 25 / 2002 B 7.53 25.6 25.6 10.2 112 2.9 0 318.51 35.7 46.7 0.46 0.26 416 698 106 69 4.74 3.1124WLCX 47 4 / 16 / 1946 U 5.9 318 16 22 45124WLCX 88 5 / 3 / 1946 U 0 549 65 755 125124WLCX 113 5 / 3 / 1946 U 0 307 17 25 0.8124WLCX 300 5 / 19 / 1971 B 7.5 29 66 27 62 0 314.85 58 69 0.3 < 0.4 466 852 275 32 1.62 0112LWCX 80 5 / 19 / 1971 B 7 42 156 21 47 0 335.6 54 173 0.4 < 0.4 658 1260 475 17 0.94 0* Depth value here reflects the bottom of the SAMPLED INT ERVAL which was different from the completed well depthMonday, March 02, 2009 created by the Texas Water Development BoardPage 9 of 16
State WellNumber6712414671241567124166712417671241867124196712421671242367125016712502671250367125166712517Aquifer Depth Date B/U pH Silica Calcium Magnesium Sodium Potassium Carbonate Bicarb. Sulfate Chloride Fluoride NitrateDissolvedSolidsSpec. CondumhosHardnessas CaCO3% Sodium SAR RSC124WLCX 120 5 / 20 / 1971 B 7 32 550 28 258 0 453.97 93 920 0.3 315 2419 4805 1487 27 2.91 0112LWCX 110 5 / 19 / 1971 B 7.3 21 93 3.2 15 0 273.36 12 14 < 0.1 17 309 544 245 11 0.42 0124WLCX 120 5 / 19 / 1971 B 7.7 25 49 19 86 0 335.6 24 63 0.1 < 0.4 431 786 200 48 2.64 1.49112LWCX 90 5 / 19 / 1971 B 7.5 23 93 2.67 8.3 0 253.83 14 13 0.2 12 290 508 242 6 0.23 0112LWCX 90 5 / 20 / 1971 B 7.3 31 118 2.4 25.1 0 378.31 9 24 0.2 < 0.4 396 720 304 15 0.63 0.11112LWCX 80 5 / 20 / 1971 B 7.2 22 151 12 64 0 305.09 56 179 0.5 2.5 637 1242 425 24 1.35 0124WLCX 99 4 / 12 / 1981 B 8.2 29 103 4 9 0 303.87 6 14 0.2 22 336 580 273 6 0.24 0124WLCX 273 5 / 20 / 1971 B 7.2 32 106 9.7 37 0 366.1 24 41 0.3 < 0.4 430 750 304 20 0.92 0124WLCX 340 3 / 25 / 1953 B 7.5 45 55 14 c 51 0 241.07 21 60 0.1 0 364 619 194 36 1.59 0.06124WLCX 340 4 / 14 / 1964 B 6.8 43 62 17 57 3.1 0 232 44 85 0.3 0 425 708 224 35 1.65 0124WLCX 340 3 / 3 / 1986 B 8 39 79 20.3 105 4 0 270.92 71 158 0.3 0.04 609 1168 280 44 2.73 0124WLCX 320 4 / 28 / 1953 B 7.97 20 56 9.6 c 60.2 0 212.06 30 74 354 179 42 1.96 0124WLCX 320 5 / 23 / 1953 B 7.4 65 60 14 c 63 0 208.06 44 89 0.4 0.2 437 701 207 39 1.9 0124WLCX 320 5 / 26 / 1961 B 7.2 53 15 61 0 203.05 53 70 0.2 < 0.4 352 650 193 40 1.91 0124WLCX 320 1 / 7 / 1963 B 7.2 58 11 55 0 210.06 43 74 0.1 < 0.4 344 702 189 38 1.74 0124WLCX 320 4 / 15 / 1964 B 6.8 48 55 14 56 4.2 0 212 43 75 0.2 0 399 654 194 37 1.75 0124WLCX 320 2 / 22 / 1966 B 7.4 59 12 56 0 207.06 40 78 0.3 < 0.4 347 700 196 38 1.74 0124WLCX 320 5 / 12 / 1967 B 7.2 60 13 59 0 212.06 40 82 0.4 < 0.4 359 720 202 38 1.8 0124WLCX 320 2 / 15 / 1968 B 7.2 58 14 58 0 212.34 40 82 0.4 < 0.4 357 730 202 38 1.77 0124WLCX 320 2 / 17 / 1969 B 7.1 61 13 56 0 211.12 42 82 0.3 < 0.4 358 704 205 37 1.7 0124WLCX 320 4 / 13 / 1970 B 7.1 59 17 56 0 209.9 53 80 0.4 < 0.4 369 720 216 35 1.65 0124WLCX 320 2 / 12 / 1971 B 7.1 63 13 54 0 211.12 43 85 0.3 < 0.4 362 725 210 35 1.62 0124WLCX 320 2 / 16 / 1972 B 7.3 62 14 59 0 209.9 44 86 0.4 < 0.4 369 735 212 37 1.76 0124WLCX 320 2 / 26 / 1973 B 7.1 63 14 58 0 211.12 47 89 0.3 < 0.4 375 750 214 37 1.72 0124WLCX 320 7 / 29 / 1977 B 7.9 50 68 13 62 0 212.34 50 91 0.3 < 0.4 439 770 222 37 1.81 0124WLCX 320 3 / 3 / 1986 B 8 44 92 18 81 4 0 242.85 64 164 < 0.1 0.04 586 1120 303 36 2.02 0124WLCX 290 2 / 15 / 1946 U 0 82 70 104124WLCX 482 * 11 / 10 / 1952 B 8 14 58.8 13.8 c 50.8 0 251.3 20.6 54 335 203 35 1.55 0.04124WLCX 482 * 11 / 13 / 1952 B 7.3 36 66 14.4 c 59 0 246.4 26 86 408 223 36 1.72 0124WLCX 482 * 11 / 14 / 1952 B 7.85 12 28 6.3 c 155 0 327.09 37 88 487 95 77 6.89 3.45124WLCX 456 4 / 22 / 1953 B 8.3 8 51 12.8 c 154.6 0 336 31.8 146 569 179 65 5.02 1.91* Depth value here reflects the bottom of the SAMPLED INT ERVAL which was different from the completed well depthMonday, March 02, 2009 created by the Texas Water Development BoardPage 10 of 16
State WellNumber6712518671251967125206712522671260167126036712607671270167127036712801671280367131016713102671310367132016713303671350267136016713602Aquifer Depth Date B/U pH Silica Calcium Magnesium Sodium Potassium Carbonate Bicarb. Sulfate Chloride Fluoride Nitrate124WLCX 50 5 / 17 / 1946 U 0 312 56 286 0.5DissolvedSolidsSpec. CondumhosHardnessas CaCO3% Sodium SAR RSC124WLCX 160 11 / 17 / 1969 B 7.6 44 80 19 65 4 0 211.12 60 130 0.3 < 0.4 506 930 277 33 1.7 0124WLCX 368 5 / 11 / 1967 B 6.98 39 52 9 c 61 0 234.31 34 51 361 578 166 44 2.05 0.5124WLCX 368 11 / 12 / 1969 B 7.3 40 66 13 54 4 0 230.65 40 77 0.4 < 0.4 408 740 217 34 1.59 0124WLCX 403 3 / 21 / 1977 B 7.1 32 89 23 93 0 248.95 75 162 0.4 596 316 38 2.27 0124WLCX 403 10 / 21 / 1992 B 6.98 45 103 24 80 4.7 0 247.73 69 179 0.26 < 0.04 627 1038 356 32 1.85 0124WLCX 352 6 / 20 / 1946 U 0 390 30 106124WLCX 171 2 / 15 / 1946 U 0 101 7 101 0.8124WLCX 71 6 / 19 / 1946 U 0 50 764 338 1.5124WLCX 49 6 / 14 / 1946 U 0 394 80 224 0112LEON 19 6 / 14 / 1946 U 17 196 16 6 3.2124WLCX 34 5 / 17 / 1946 U 11 100 40 57 9.6124WLCX 31 5 / 17 / 1946 U 0 170 848 658124WLCX 620 3 / 5 / 1964 B 7.9 4.6 12 1.5 102 4.5 0 122.03 78 60 0.2 1.2 324 566 36 86 7.18 1.28124WLCX 620 11 / 17 / 1969 B 7.6 12 23 6.6 272 3 0 261.15 220 174 0.4 < 0.4 839 1573 84 87 12.74 2.59124WLCX 620 7 / 20 / 1977 B 7.8 14 27 6 282 0 270.92 233 177 0.2 < 0.4 872 1617 92 86 12.79 2.6124WLCX 620 3 / 3 / 1986 B 8.1 13 20.6 5.6 291 3 0 261.15 232 182 0.2 0.13 875 1650 74 89 14.42 2.79124WLCX 450 3 / 5 / 1964 B 7.9 19 67 17 81 7.9 0 209.06 103 106 0.2 0 503 846 236 42 2.29 0124WLCX 450 11 / 17 / 1969 B 7.6 15 39 10 143 5 0 305.09 102 75 0.6 < 0.4 540 1001 138 69 5.29 2.23124WLCX 302 2 / 0 / 1964 B 7.4 30 535 120 c 190 0 374.11 802 780 0 1 2641 3850 1828 18 1.93 0124CRRZ 198 1 / 12 / 1970 B 6.5 19 4.2 1.7 9 4 0 14.64 7 17 < 0.1 < 0.4 69 96 17 52 0.92 0124RKLW 14 4 / 18 / 1946 U 0 16 200 154 40124CRRZ 240 1 / 10 / 1964 U 4 53 5.5 4.4 30 8.4 0 0 80 53 0.2 0.2 234 424 31 67 2.31 0124QNCT 65 4 / 18 / 1946 U 0 72 90 96 76124RKLW 77 3 / 1 / 1946 U 6.3 0 0 738 300 1* Depth value here reflects the bottom of the SAMPLED INT ERVAL which was different from the completed well depthMonday, March 02, 2009 created by the Texas Water Development BoardPage 11 of 16
State WellNumber671360367136056713613671370267138016713802671390167144016714403671440667147016714704671480167148036719108671920167192026719301Aquifer Depth Date B/U pH Silica Calcium Magnesium Sodium Potassium Carbonate Bicarb. Sulfate Chloride Fluoride Nitrate124CRRZ 171 4 / 26 / 1946 U 0 0 700 1100DissolvedSolidsSpec. CondumhosHardnessas CaCO3% Sodium SAR RSC124CRRZ 470 2 / 20 / 1964 B 6.8 37 14 1.2 c 55 0 95.03 33 32 0.4 0 219 326 39 74 3.83 0.76124CRRZ 470 1 / 12 / 1970 B 7.8 19 305 58 72 16 0 173.29 620 269 0.5 < 0.4 1445 2704 999 13 0.99 0124RKLW 100 6 / 20 / 1964 B 6.1 25 118 57 c 131 0 94.03 99 448 0.2 1.8 926 1730 529 35 2.48 0124CRRZ 270 6 / 20 / 1964 B 6.1 25 6 9.5 c 20 0 65.02 15 20 0 0 127 206 54 44 1.16 0124CRRZ 250 5 / 17 / 1946 U 0 0 240 114 0124CRRZ 270 2 / 19 / 1964 B 6.9 37 195 41 c 104 0 225.07 356 230 0.2 0.2 1074 1660 655 25 1.77 0124QNCT 16 4 / 26 / 1946 U 16 206 35 102 110124RKLW 120 1 / 14 / 1964 B 6.1 76 39 19 c 114 0 48.01 186 135 0.1 0.2 592 912 175 58 3.74 0124CRRZ 500 10 / 3 / 1963 B 4.3 48 9 90 0 0 270 50 467 157 55 3.13 0124CRRZ 500 2 / 19 / 1964 B 7.1 27 0.2 0.1 c 174 0 90.02 240 39 0.2 0 524 808 0 99 79.33 1.46124CRRZ 500 5 / 5 / 1992 U 1.02124CRRZ 550 6 / 20 / 1964 B 7.3 10 105 26 c 41 0 268.07 199 22 0 0 534 868 368 19 0.93 0124QNCT 97 5 / 2 / 1946 U 0 65 45 256 3.5124QNCT 110 2 / 6 / 1964 B 6.9 49 6 2 c 66 0 70.02 88 12 0.2 0.2 257 338 23 86 5.96 0.68124QNCT 59 2 / 19 / 1964 B 6.7 45 74 20 78 0 66.02 6 261 0.3 9.6 526 997 266 38 2.08 0124QNCT 59 8 / 12 / 1970 B 6.9 46 52 10 54 4 0 106.17 13 128 0.3 5 364 660 170 40 1.8 0124QNCT 59 8 / 17 / 1977 B 7.4 52 47 7 48 0 125.7 23 89 0.4 7.1 335 592 146 41 1.73 0124QNCT 59 3 / 3 / 1986 B 7.7 45 34 7 51 2 0 92.75 26 88 0.4 6.56 305 544 113 49 2.08 0124QNCT 59 9 / 22 / 1993 B 6.4 48 47 8.5 64 2.7 0 115.93 35 107 0.38 10.54 380 583 152 47 4.07 0124QNCT 475 10 / 26 / 1998 B 7.08 26.31 264 62 87.1 22.3 0 179.39 866 104 0.08 < 0.22 1521 915 17 1.25 0124QNCT 475 3 / 25 / 2002 B 6.95 24.3 263 62.8 86.4 22 0 180.61 800 101 < 0.1 0.28 1449 1948 915 17 1.24 0124WLCX 99 4 / 3 / 1946 U 0 308 260 845 1.5124WLCX 182 3 / 20 / 1946 U 0 226 500 231 0.5124WLCX 123 8 / 9 / 1946 U 0 242 1110 468 0124WLCX 370 3 / 0 / 1946 U 6.95 80 170 0 198 120 200 768* Depth value here reflects the bottom of the SAMPLED INT ERVAL which was different from the completed well depthMonday, March 02, 2009 created by the Texas Water Development BoardPage 12 of 16
State WellNumber671930267193046719306671930867194016719402671950667195076719601671960267196036719605Aquifer Depth Date B/U pH Silica Calcium Magnesium Sodium Potassium Carbonate Bicarb. Sulfate Chloride Fluoride Nitrate124WLCX 370 5 / 17 / 1946 U 0 198 120 196 2124WLCX 190 8 / 9 / 1946 U 0 118 13 70 0DissolvedSolidsSpec. CondumhosHardnessas CaCO3% Sodium SAR RSC124WLCX 406 1 / 8 / 1964 B 8.1 11 13 8.1 c 846 0 720.2 16 920 1.8 2170 3840 65 96 45.52 10.49124WLCX 330 1 / 8 / 1964 B 6.7 43 142 31 92 5.3 0 240 190 212 0.8 0 834 1370 482 29 1.82 0124WLCX 330 1 / 14 / 1970 B 7.6 35 126 30 106 4 0 290.44 180 177 0.6 < 0.4 801 1503 437 34 2.2 0124WLCX 330 8 / 17 / 1977 B 7.9 32 87 24 135 7 0 318.51 194 117 0.2 < 0.4 753 1395 315 48 3.3 0124WLCX 72 1 / 8 / 1964 B 6.6 45 75 21 117 4.3 0 190 172 146 0.6 0 674 1080 274 47 3.08 0100ALVM 27 6 / 25 / 1946 U 0 538 140 164 24124WLCX 120 8 / 6 / 1946 U 0 407 50 83 0124WLCX 36 6 / 25 / 1946 U 0 360 8 18 9.6124WLCX 315 2 / 12 / 1946 U 0 366 3 84 0124WLCX 259 10 / 22 / 1942 B 8.5 16 12 5 409 0 653 163 167 < 0.4 < 0.4 1093 50 94 25.03 9.69124WLCX 259 2 / 0 / 1943 B 8.4 6 2.7 1.7 c 419 5 46 534 178 163 0.2 0 1084 13 98 45.98 10.01124WLCX 259 8 / 19 / 1943 B 8.3 21 29 7 c 385 0 628 180 168 0.5 < 0.4 1099 101 89 16.65 8.27124WLCX 259 5 / 8 / 1945 B 8.4 14 5 1 430 0 609 196 176 0.9 0.9 1123 16 98 45.92 9.65124WLCX 259 7 / 23 / 1947 B 8.5 16 10 4 444 0 732 161 170 0.2 1.3 1166 41 95 30.01 11.17124WLCX 259 1 / 25 / 1951 B 8.6 12 11 6 430 0 652 183 185 0.1 < 0.4 1148 52 94 25.91 9.64124WLCX 259 6 / 21 / 1954 B 8.7 10 2 4 451 0 634 211 185 0.3 0.9 1175 21 97 42.36 9.96124WLCX 259 12 / 12 / 1955 B 8.8 12 2 1 440 0 591 221 178 0.2 < 0.4 1145 9 99 63.43 9.5124WLCX 259 6 / 6 / 1960 B 8.5 3 1 405 0 597 215 183 0.2 < 0.4 1101 1916 11 98 51.73 9.55124WLCX 259 6 / 24 / 1964 B 8.3 14 2 1 433 1.6 14 542 227 175 0.5 0.2 1134 1840 9 99 62.42 9.17124WLCX 259 12 / 2 / 1969 B 8.5 11 1.8 2.06 433 1 10.8 527.19 240 170 0.5 < 0.4 1129 2025 12 98 52.31 8.74124WLCX 259 2 / 27 / 1986 B 8.4 10 79 17 21 2 2.4 252.61 35 46 0.8 5.36 342 675 267 14 0.56 0124WLCX 304 10 / 22 / 1942 B 8.7 17 15 6 405 0 560 223 174 0.6 0.7 1116 62 93 22.35 7.94124WLCX 304 2 / 0 / 1943 B 8.4 8 2 1.4 c 416 5.2 43 457 227 170 0 0 1097 10 98 55.19 8.71124WLCX 304 8 / 19 / 1943 B 8.5 23 27 6 c 393 0 569 226 173 0.5 < 0.4 1128 92 90 17.82 7.48124WLCX 304 5 / 8 / 1945 B 8.4 15 7 1 c 404 0 546 218 174 0.8 < 0.4 1088 21 97 37.83 8.52124WLCX 304 6 / 23 / 1947 B 9 19 7 4 c 441 0 629 222 174 0.2 1.3 1177 33 96 32.94 9.63124WLCX 312 6 / 22 / 1954 B 8.6 13 7 5 c 813 24 647 91 809 0.3 < 0.4 2080 38 97 57.34 10.64124WLCX 307 1 / 25 / 1951 B 8.6 11 9 4 c 419 18 677.29 133 160 0.1 < 0.4 1087 38 95 29.22 10.92124WLCX 307 6 / 22 / 1954 B 8.7 12 3 4 c 437 24 671.19 158 156 0.3 1.3 1125 23 97 38.85 11.32124WLCX 307 12 / 12 / 1955 B 9 12 12 3 c 450 30 646.78 157 174 0.2 < 0.4 1156 42 95 30.1 10.75* Depth value here reflects the bottom of the SAMPLED INT ERVAL which was different from the completed well depthMonday, March 02, 2009 created by the Texas Water Development BoardPage 13 of 16
State WellNumber671960667196076719608671960967196126719613671961467196156719628671962967196436719644671964567196476720101Aquifer Depth Date B/U pH Silica Calcium Magnesium Sodium Potassium Carbonate Bicarb. Sulfate Chloride Fluoride NitrateDissolvedSolidsSpec. CondumhosHardnessas CaCO3% Sodium SAR RSC124WLCX 307 6 / 6 / 1960 B 8.4 6 2 500 4.8 656.55 170 343 0.2 < 0.4 1349 2575 23 97 45.16 10.46124WLCX 307 6 / 20 / 1964 B 8.2 14 5.8 3.8 575 2.2 0 686.2 171 385 0.4 0.8 1495 2500 30 97 45.59 10.64124WLCX 307 12 / 2 / 1969 B 8.5 12 9 5 610 3 8.4 629.7 195 462 0.5 < 0.4 1614 3042 43 96 40.45 9.74124WLCX 307 9 / 12 / 1972 B 7.8 11 7 770 0 646.78 225 710 0.5 < 0.4 2041 3875 56 96 44.66 9.48124WLCX 447 4 / 16 / 1957 B 8.5 2 1 470 14.4 721.22 135 170 0.5 < 0.4 1147 9 99 67.76 12.12124WLCX 447 10 / 15 / 1962 B 8.2 2 3 518 0 673.63 248 239 0.2 < 0.4 1341 2475 17 98 54.12 10.69124WLCX 447 6 / 24 / 1964 B 8.3 14 1.5 1.8 505 2.3 37 642 202 220 0.6 2.5 1302 2100 10 98 65.79 11.53124WLCX 447 9 / 12 / 1972 B 8.6 1 2 482 18 744.41 140 198 0.7 < 0.4 1208 2240 10 98 64.03 12.59124WLCX 331 12 / 12 / 1955 B 9 15 2 1 c 441 0 731 123 170 0.4 < 0.4 1112 9 99 63.58 11.8124WLCX 331 6 / 7 / 1960 B 8.5 2 < 0.5 c 425 0 732 138 200 0.3 < 0.4 1126 1956 7 99 61.27 11.86124WLCX 331 6 / 20 / 1964 B 8.2 14 1.2 1.7 488 3.4 0 716.21 155 229 0.4 1 1245 2040 9 99 67.17 11.54124WLCX 331 12 / 2 / 1969 B 8.6 8 5.4 3.65 630 2 15.6 688.28 145 479 0.6 < 0.4 1628 3068 28 97 51.34 11.23124WLCX 519 2 / 7 / 1946 B 8.3 15 2.2 1.3 525 22 51 682 212 222 0.4 1.2 1387 2310 10 99 69.37 12.66124WLCX 284 8 / 6 / 1946 U 0 803 3 1410124WLCX 300 2 / 7 / 1946 B 7.4 26 122 6.1 78 9.9 0 427.12 63 68 0 0.5 583 981 329 33 1.87 0.41124WLCX 150 2 / 7 / 1946 B 7.7 21 90 23 65 6.5 0 419.12 23 72 0 0.2 506 923 319 30 1.58 0.49124WLCX 150 12 / 4 / 1969 B 7.7 18 49 18 115 3 0 394.17 19 77 0.3 < 0.4 493 912 196 56 3.57 2.53124WLCX 260 2 / 11 / 1949 B 8.05 8 77 26 c 101 0 215.06 76 188 581 298 42 2.54 0124WLCX 230 12 / 9 / 1969 B 7.3 17 123 39 97 0 231.87 129 252 0.2 < 0.4 771 1551 467 31 1.95 0124WLCX 230 12 / 9 / 1969 B 7.4 17 117 41 98 3 0 246.51 122 251 0.2 < 0.4 770 1540 460 31 1.99 0124WLCX 232 * 5 / 8 / 1968 B 8.58 12 7 3 c 326 13.2 435.66 135 181 891 1560 29 95 25.97 6.98124WLCX 339 * 5 / 9 / 1968 B 8.77 11 3 1 c 308 21.6 569.9 < 4 127 755 1280 11 98 39.34 9.83124WLCX 435 5 / 22 / 1968 B 8.37 13 6 3 c 379 0 512 95 235 982 1680 27 96 31.55 7.85124WLCX 525 12 / 8 / 1969 B 8.7 11 3 2 520 20.4 727.33 197 217 0.4 < 0.4 1328 2400 15 98 57.06 12.29124WLCX 525 12 / 8 / 1969 B 8.7 12 3 2 520 1 25.2 727.33 197 214 0.6 < 0.4 1332 2400 15 98 57.06 12.45124WLCX 340 5 / 4 / 1978 B 7.9 12 11 11 1296 0 710.24 7 1692 0.4 < 0.4 3379 6804 72 97 66.12 10.19124WLCX 180 2 / 12 / 1962 B 7.4 33 58 27 72 4.1 0 290.08 42 98 0.3 1.8 478 826 255 37 1.96 0124WLCX 149 4 / 22 / 1946 U 20 218 55 158 0.8124WLCX 150 7 / 26 / 1946 U 0 1114 2 498 0* Depth value here reflects the bottom of the SAMPLED INT ERVAL which was different from the completed well depthMonday, March 02, 2009 created by the Texas Water Development BoardPage 14 of 16
State WellNumber672010267201046720108672010967202026720203672020467202056720402672040367204086720501672060167206026720604672070367207046720706672070767207086720801Aquifer Depth Date B/U pH Silica Calcium Magnesium Sodium Potassium Carbonate Bicarb. Sulfate Chloride Fluoride Nitrate124WLCX 300 5 / 7 / 1946 U 20 252 120 153 3.5DissolvedSolidsSpec. CondumhosHardnessas CaCO3% Sodium SAR RSC124WLCX 300 3 / 27 / 1979 B 8.1 23 39 13 182 0 268.48 100 164 0.4 < 0.1 653 1240 150 72 6.45 1.38124WLCX 2 / 2 / 1946 B 4.6 1.9 c 786 30 1082 2 558 2 1916 19 98 77.84 18.35124WLCX 580 3 / 4 / 1964 B 8.6 12 3 1.3 c 756 83 924 0 540 0.2 1849 3140 12 99 96.56 17.65124WLCX 263 3 / 27 / 1979 B 8.5 16 16 6 530 12 915.26 2 320 1.3 < 0.1 1353 2560 64 94 28.68 14.11124WLCX 185 3 / 27 / 1979 B 8.7 13 4 2 648 30 839.6 95 433 1.6 0.3 1639 3045 18 98 66.06 14.4124WLCX 14 7 / 16 / 1946 U 0 62 190 83 76124WLCX 46 7 / 16 / 1946 U 0 410 17 146 9.4124WLCX 360 6 / 11 / 1956 B 24 32 690 0 1020.29 17 599 1863 191 88 21.69 12.89124WLCX 190 6 / 24 / 1964 B 6.6 44 320 88 c 127 0 296.08 467 500 0.5 2 1694 2540 1160 19 1.62 0124WLCX 24 7 / 16 / 1946 U 12 257 60 39 7.6124WLCX 321 11 / 29 / 1963 B 8 15 1 2.3 c 713 0 1010.29 0 520 1.8 1749 3020 11 99 89.69 16.32124WLCX 172 3 / 27 / 1979 B 8.8 13 2.8 1.7 656 37.2 835.94 100 431 1.6 < 0.1 1654 3129 13 99 76.32 14.66124WLCX 19 7 / 3 / 1946 U 0 76 32 78 100124CRRZ 91 4 / 4 / 1947 B 23 10 c 70 0 20 55 116 16 299 547 98 60 3.07 0124CRRZ 80 5 / 7 / 1946 U 0 0 85 69 0124CRRZ 97 4 / 4 / 1947 B 32 22 c 118 0 8.01 185 154 15 529 934 170 60 3.93 0124WLCX 285 5 / 7 / 1946 U 0 837 1 1210 0124WLCX 285 12 / 6 / 1963 B 7.7 13 14 14 c 1510 0 2080.59 0 1180 0 3754 6130 92 97 68.28 32.25124WLCX 19 5 / 7 / 1946 U 0 145 280 246 3124WLCX 200 1 / 23 / 1964 B 8.1 14 1.8 0.4 c 517 0 876.25 125 198 0.7 0.2 1287 2130 6 99 90.78 14.24124WLCX 240 1 / 23 / 1964 B 7.8 13 6 3.2 c 1100 0 1940.55 0.2 590 0.5 2667 4270 28 98 90.21 31.24124WLCX 81 5 / 7 / 1946 U 0 944 55 215 0* Depth value here reflects the bottom of the SAMPLED INT ERVAL which was different from the completed well depthMonday, March 02, 2009 created by the Texas Water Development BoardPage 15 of 16
State WellNumber6720802672110467212026721203672130267213036721401Aquifer Depth Date B/U pH Silica Calcium Magnesium Sodium Potassium Carbonate Bicarb. Sulfate Chloride Fluoride Nitrate124CRRZ 120 5 / 3 / 1946 U 0 29 14 57 0DissolvedSolidsSpec. CondumhosHardnessas CaCO3% Sodium SAR RSC124WLCX 200 1 / 23 / 1964 B 6.2 30 16 14 c 41 0 80.02 23 68 0.1 0.2 231 399 97 47 1.81 0124WLCX 200 7 / 29 / 1977 B 7.1 66 132 29 52 0 141.56 315 88 0.7 < 0.4 752 1290 448 20 1.07 0124CRRZ 300 6 / 20 / 1964 B 4.3 50 13 5.2 23 9.5 0 0 59 44 0 0 203 303 53 48 1.37 0124CRRZ 300 7 / 29 / 1977 B 6.7 48 35 7 26 10 0 23.19 105 39 0.2 < 0.4 282 438 116 32 1.05 0124CRRZ 157 5 / 17 / 1946 U 0 109 360 165 0124CRRZ 381 5 / 2 / 1978 B 7.2 41 138 22 74 0 128.14 308 112 0.2 < 0.4 758 1352 435 27 1.54 0124CRRZ 334 1 / 10 / 1964 B 7.6 17 48 30 c 78 0 334.09 18 85 0.3 0 440 771 243 41 2.18 0.61124QNCT 148 1 / 10 / 1964 B 6.4 33 430 148 137 23 0 100.03 1440 365 2 2627 3250 1681 15 1.45 0124WLCX 440 12 / 31 / 1963 B 4.8 47 6.2 2.6 c 27 0 0 32 37 0.1 0.2 152 224 26 69 2.25 0* Depth value here reflects the bottom of the SAMPLED INT ERVAL which was different from the completed well depthMonday, March 02, 2009 created by the Texas Water Development BoardPage 16 of 16
C O N S U L T I N G E N G I N E E R SAppendix EGround<strong>water</strong> Conservation Districts RulesKlotz Associates Project No. 0972.000.000January 2010APPENDIX-ECaldwell County Regional Water <strong>and</strong> Waste<strong>water</strong> Planning StudyFinal Report
APPENDIX EThe tables presented in this appendix are taken from the Gonzales County UndergroundWater Conservation District Management Plan <strong>and</strong> the Rules of the Gonzales CountyUnderground Water Conservation District. They are presented to provide additionalinformation on the conditions of the aquifers that provide ground<strong>water</strong> to CaldwellCounty. Tables are listed as they are presented.Gonzales County Underground Water Conservation District Management PlanTABLE 5GROUNDWATER RECHARGE/ DISCHARGE/ FLOW GONZALES ANDCALDWELL COUNTIESAquifer orConfining UnitGround<strong>water</strong> Recharge/Discharge/FlowGonzales <strong>and</strong> Caldwell CountiesGonzales County Underground Water Conservation DistrictAnnual RechargefromPrecipitation(acre-feet/yr)Annual Dischargefrom Aquifer toSurface Water(acre-feet/yr)Annual FlowInto District(acre-feet/yr)Annual FlowOut ofDistrict (acrefeet/yr)Sparta 3,105 2,127 386 70Weches 808 521 117 35Queen City 7,291 3,583 1,172 126Reklaw 2,168 1,935 170 156Carrizo 6,927 6,896 8,897 5,732Wilcox (upper) 0 0 30 48Wilcox (middle) 921 31 2,031 3,488Wilcox (lower) 0 0 4,052 2,506Data from GAM 08-22 RevisedTable 5 describes the following as listed in the GCUWCD:1. Precipitation Recharge – this is the aerially distributed recharge sourced fromprecipitation falling on the outcrop areas of the aquifers (where the aquifer isexposed at the l<strong>and</strong> surface) within the District.2. Surface Water Outflow – this is the total <strong>water</strong> existing the aquifer (outflow) tosurface <strong>water</strong> features such as streams, reservoirs, <strong>and</strong> drains (springs).3. Flow Into <strong>and</strong> Out of District – this component describes lateral flow within theaquifer between the districts <strong>and</strong> adjacent counties.
APPENDIX E4. Flow Between Aquifers – this describes the vertical flow, or leakage, betweenaquifers or confining units. Inflow to an aquifer from as overlaying aquifer willalways equal the outflow from the other aquifer.TABLE 6GROUNDWATER NET FLOW BETWEEN AQUIFERSGONZALES & CALDWELL COUNTIESGround<strong>water</strong> Net Flow Between AquifersGonzales <strong>and</strong> Caldwell CountiesGonzales County Underground Water Conservation DistrictAquifer or Confining Unit Annual Net Flow Between Aquifers(acre-feet/yr)Weches into Sparta 4,511Queen City into Weches 4,183Reklaw into Queen City 3,190Carrizo into Reklaw 1,945Carrizo into Wilcox (upper) 649Wilcox (upper) into Wilcox (middle) 194Wilcox (lower) into Wilcox (middle) 190Data from GAM 08-22 Revised
APPENDIX EWaterUserGroupTABLE 7PROJECTED SURFACE WATER SUPPLYGONZALES COUNTY UNDERGROUND WATER CONSERVATIONDISTRICTCountyProjected Surface Water SupplyGonzales County Underground Water Conservation DistrictRiverBasinSource Name 2000acft/yrGonzales Gonzales Guadalupe GuadalupeRun-of-RiverGonzalesCO WSCGonzales Guadalupe Canyon Lake/ReservoirIrrigation Gonzales Guadalupe Canyon Lake/Reservoir2010acft/yr2020acft/yr2030acft/yr2040acft/yr2050acft/yr2060acft/yr1,892 1,892 1,892 1,892 1,892 1,892 1,8920 532 532 532 532 532 5320 6 6 6 6 6 6Irrigation Gonzales Guadalupe GuadalupeRiverCombinedRun-of-RiverIrr.Livestock Gonzales Lavaca LivestockLocal SupplyLivestock Gonzales Guadalupe LivestockLocal Supply0 1,730 1,730 1,730 1,730 1,730 1,73046 62 62 62 62 62 625,022 2,366 2,366 2,366 2,366 2,366 2,366CountyOtherTotal Gonzales 6,960 6,588 6,588 6,588 6,588 6,588 6,588Caldwell Guadalupe Guadalupe 0 110 110 110 110 110 110Run-of-RiverIrrigation Caldwell Guadalupe GuadalupeRun-of-RiverLivestock Caldwell Guadalupe LivestockLocal SupplyLivestock Caldwell Guadalupe LivestockLocal SupplyGonzalesCO WSCCaldwell Guadalupe CanyonLake/Reservoir0 73 73 73 73 73 7331 17 17 17 17 17 17153 84 84 84 84 84 840 5 5 5 5 5 5Total Caldwell 184 289 289 289 289 289 289Total Projected Surface Water Supply 7,144 6,877 6,877 6,877 6,877 6,877 6,877Data from the TWDB 207 State Water Plan, Volume 3, Regional Water PlanningGroup. Apportioned values are presented in italics.Section 8.1 of the GCUWCD Management Plan indicates that in 2010 <strong>water</strong> isexpected to decrease by 267 acre-feet per year from the 2000 surface <strong>water</strong> supplyestimates (Table 7). The years 2010-2060 are expected to remain stable.
APPENDIX ESection 8.2 describes the pumping capacity of a well field <strong>and</strong> states that theprojected ground<strong>water</strong> supplies of a <strong>water</strong> user group may significantly exceed theamount of <strong>water</strong> actually used by the user because the well fields supplying the usergroups have additional or redundant capacity. Overall the district is expected todecrease by 244 acre-feet/ year from 2010 to 2060 (Table 8).Water UserGroupTABLE 8PROJECTED GROUNDWATER SUPPLYProjected Ground<strong>water</strong> SupplyGonzales County Underground Water Conservation DistrictCounty Source Name 2010 2020 2030 2040acft/yft/yft/yrac-ac-acft/yr2050acft/yr2060acft/yrGonzales Gonzales Carrizo-Wilcox 403 403 403 403 403 403Nixon Gonzales Carrizo-Wilcox 600 600 600 600 600 600Waelder Gonzales Queen City 665 665 665 665 665 665County Other Gonzales Carrizo-Wilcox 13 13 13 13 13 13County Other Gonzales Carrizo-Wilcox 559 559 559 559 559 559Manufacturing Gonzales Sparta 1,632 1,632 1,632 1,632 1,632 1,632Manufacturing Gonzales Carrizo-Wilcox 1,786 1,786 1,786 1,786 1,786 1,786Mining Gonzales Carrizo-Wilcox 3 2 2 2 2 2Mining Gonzales Queen City 6 6 6 6 5 5Mining Gonzales Sparta 5 5 5 5 5 5Mining Gonzales Carrizo-Wilcox 14 14 13 12 12 12Irrigation Gonzales Queen City 47 40 35 30 26 22Irrigation Gonzales Sparta 51 44 38 33 28 24Irrigation Gonzales Carrizo-Wilcox 210 181 156 134 116 100Livestock Gonzales Carrizo-Wilcox 26 26 26 26 26 26Livestock Gonzales Queen City 805 805 805 805 805 805Livestock Gonzales Sparta 329 329 329 329 329 329Livestock Gonzales Carrizo-Wilcox 1,419 1,419 1,419 1,419 1,419 1,419Gonzales CO WSC Gonzales Carrizo-Wilcox 1,103 1,103 1,103 1,103 1,103 1,103Total Gonzales 9,676 9,632 9,595 9,562 9,534 9,510County Other Caldwell Carrizo-Wilcox 6 6 6 6 6 6County Other Caldwell Carrizo-Wilcox 19 19 19 19 19 19County Other Caldwell Queen City 121 125 129 132 135 138Manufacturing Caldwell Carrizo-Wilcox 7 7 7 7 7 7Mining Caldwell Carrizo-Wilcox 2 2 2 2 2 2Mining Caldwell Carrizo-Wilcox 1 1 2 2 2 2Irrigation Caldwell Carrizo-Wilcox 4 3 3 2 2 2Irrigation Caldwell Carrizo-Wilcox 138 123 109 97 86 77Irrigation Caldwell Queen City 89 81 74 68 62 56Livestock Caldwell Carrizo-Wilcox 17 17 17 17 17 17Livestock Caldwell Carrizo-Wilcox 84 84 84 84 84 84Aqua WSC Caldwell Carrizo-Wilcox 48 48 48 48 48 48Gonzales CO WSC Caldwell Carrizo-Wilcox 10 10 10 10 10 10Total Caldwell 546 526 510 494 480 468Total Projected Ground<strong>water</strong> Supply 10,222 10,158 10,105 10,056 10,014 9,978
APPENDIX ERules of the Gonzales County Underground Water Conservation DistrictTABLE 1WELL CLASSIFICATIONActual pumpingCapacity of ProposedWell (GPM)ClassificationMinimum Distance From NearestExisting Well or Authorized Well SiteCarrizo/Wilcox Queen City/SpartaLess than 17.5 GPM Domestic None None17.5-100 GPM A 600 Feet 2000 Feet101-250 GPM B 1500 Feet 4850 Feet251-500 GPM C 3000 Feet 8400 Feet501-1000 GPM Domestic 6000 Feet 9600 Feet1001 GPM <strong>and</strong> over E 12000 Feet >18,000 FeetE. Production provision:The maximum permitted production for a tract of l<strong>and</strong> shall not exceed a total of one(1) acre/foot f <strong>water</strong> per acre of l<strong>and</strong> owner per year form the Carrizo aquifer orcombination of the allowable production from the Queen City <strong>and</strong> Sparta <strong>and</strong> Carrizoaquifers. Production from the Queen City Aquifer shall be one (1) acre/foot per year<strong>and</strong> shall be considered part of the one (1) acre/foot total production allowed on anytract of l<strong>and</strong>. Production from the Sparta aquifer shall be on half (1/2) acre/foot peryear <strong>and</strong> shall be considered part of the one (1) acre/foot total production allowed onany tract of l<strong>and</strong>. Production from the Wilcox aquifer shall be one (1) acre/foot peryear <strong>and</strong> may in addition to any other production permitted for any tract of l<strong>and</strong>.Production is allowed to exceed the permitted capacity by 25% in any averagemonthly reporting period. The actual calendar year production beginning on January1 st <strong>and</strong> ending on December 31 st may not exceed the permitted pumping capacity forthat year. Wells previously permitted to produce at a higher rate shall be reduced tothe rate stated in this rule beginning with permits scheduled to be reissued in 2010<strong>and</strong> all permits therein after shall be reissued at this rate.Rule 10 – The Rate of Decline in the confined Portion or Outcrop or any Aquifer
APPENDIX EReductions in the allowable permitted production when levels in artesian wellsexceed the levels of drawdown indicated:TABLE 2CARRIZO OR WILCOX AVERAGE ARTESIAN DECLINECarrizo or Wilcox Average Artesian DeclineAnnual MonthlyAverage DrawdownReduction in current permitted pumpage80 feet 5% Reduction of current Ac/ft per Acre85 feet 10% Reduction of current Ac/ft per Acre90 feet 15% Reduction of current Ac/ft per Acre95 feet 20% Reduction of current Ac/ft per Acre100 feet Reduce original permitted pumpage 10%105 feet Reduce original permitted pumpage 20%110 feet Reduce original permitted pumpage 30%>115 feetThe Board shall apply additional 10% reductions to thepermitted pumpage in addition to the 30% reductionannually.TABLE 3CARRIZO OUTCROP AVERAGE WATER LEVEL DECLINECarrizo Outcrop Average Water Level DeclineAnnual Monthly Average WaterLevel Decline in the Outcrop AreaReduction in current permitted pumpage10% of saturated thickness Reduce original permitted pumpage 5%15% of saturated thickness Reduce permitted pumpage 10%20% of saturated thickness Reduce permitted pumpage 15%25% of saturated thickness Reduce permitted pumpage 20%30% of saturated thickness Reduce permitted pumpage 25%35% of saturated thickness Reduce permitted pumpage 30%40% of saturated thickness Reduce permitted pumpage 35%45% of saturated thickness Reduce permitted pumpage 40%>50% of saturated thicknessThe Board shall apply additional 10% reductions to thepermitted pumpage in addition to the 40% reduction annually.TABLE 4
APPENDIX EAVERAGE QUEEN CITY OR SPARTA AVERAGE ARTESIAN DECLINEQueen City or Sparta Average Artesian DeclineAnnual Monthly AverageDrawdownReduction in current permitted pumpage40 feet 10% Reduction of current Ac/ft per Acre45 feet 20% Reduction of current Ac/ft per Acre50 feet Reduce original permitted pumpage 10%55 feet Reduce original permitted pumpage 20%60 feet Reduce original permitted pumpage 30%The Board shall apply additional 10% reductions to thepermitted pumpage in addition to the 30% reduction>65 feetannually.TABLE 5QUEEN CITY OR SPARTA OUTCROP AVERAGE WATER LEVEL DECLINEQueen City or Sparta Outcrop Average Water Level DeclineAnnual Monthly Average WaterLevel Decline in the Outcrop AreaReduction in current permitted pumpage5% of saturated thickness Reduce original permitted pumpage 10%10% of saturated thickness Reduce permitted pumpage 20%15% of saturated thickness Reduce permitted pumpage 30%20% of saturated thickness Reduce permitted pumpage 40%25% of saturated thickness Reduce permitted pumpage 50%The Board shall apply additional 10% reductions to thepermitted pumpage in addition to the 50% reduction>30% of saturated thicknessannually.
C O N S U L T I N G E N G I N E E R SAppendix FTWDB Water Use Summary ReportsKlotz Associates Project No. 0972.000.000January 2010APPENDIX-FCaldwell County Regional Water <strong>and</strong> Waste<strong>water</strong> Planning StudyFinal Report
Historical Water Use Summary by County/BasinUnit: Acre Feet (ACFT)CALDWELL COUNTYYear Basin Municipal Manufacturing Steam Electric Irrigation Mining Livestock Total1974 COLORADO 34 0 0 0 16 207 2571974 GUADALUPE 3,035 206 0 1,660 54 942 5,8973,069 206 0 1,660 70 1,149 6,1541980 COLORADO 69 0 0 0 0 172 2411980 GUADALUPE 3,964 219 0 1,600 0 864 6,6474,033 219 0 1,600 0 1,036 6,8881984 COLORADO 265 0 0 6 0 138 4091984 GUADALUPE 4,827 240 0 688 27 696 6,4785,092 240 0 694 27 834 6,8871985 COLORADO 162 0 0 4 0 124 2901985 GUADALUPE 4,268 224 0 495 27 623 5,6374,430 224 0 499 27 747 5,9271986 COLORADO 71 0 0 4 0 136 2111986 GUADALUPE 4,412 223 0 496 0 681 5,8124,483 223 0 500 0 817 6,0231987 COLORADO 99 0 0 4 0 133 2361987 GUADALUPE 4,518 0 0 496 28 670 5,7124,617 0 0 500 28 803 5,9481988 COLORADO 108 0 0 4 0 140 2521988 GUADALUPE 4,796 0 0 496 25 701 6,0184,904 0 0 500 25 841 6,2701989 COLORADO 226 0 0 10 0 137 3731989 GUADALUPE 4,629 0 0 1,188 27 690 6,5344,855 0 0 1,198 27 827 6,9071990 COLORADO 216 0 0 20 0 135 3711990 GUADALUPE 4,715 0 0 1,355 27 681 6,7784,931 0 0 1,375 27 816 7,1491991 COLORADO 188 0 0 0 6 140 3341991 GUADALUPE 4,132 0 0 954 7 696 5,7894,320 0 0 954 13 836 6,1231992 COLORADO 192 0 0 22 6 139 3591992 GUADALUPE 4,264 0 0 1,491 7 696 6,4584,456 0 0 1,513 13 835 6,8171993 COLORADO 211 0 0 9 6 129 3551993 GUADALUPE 4,614 2 0 1,118 6 640 6,3804,825 2 0 1,127 12 769 6,7351994 COLORADO 213 0 0 10 6 149 378Disclaimer: The Water Use estimates posted are subject to revision as additional data <strong>and</strong> corrections are made available to the TWDB.Page 1 of 2 Wednesday, March 18, 2009
CALDWELL COUNTYYear Basin Municipal Manufacturing Steam Electric Irrigation Mining Livestock Total1994 GUADALUPE 4,505 11 0 1,351 6 741 6,6144,718 11 0 1,361 12 890 6,9921995 COLORADO 255 0 0 13 6 151 4251995 GUADALUPE 4,500 10 0 1,683 6 756 6,9554,755 10 0 1,696 12 907 7,3801996 COLORADO 282 0 0 14 6 133 4351996 GUADALUPE 4,904 12 0 1,728 6 668 7,3185,186 12 0 1,742 12 801 7,7531997 COLORADO 254 0 0 12 6 146 4181997 GUADALUPE 4,330 10 0 1,548 6 723 6,6174,584 10 0 1,560 12 869 7,0351998 COLORADO 270 0 0 42 6 137 4551998 GUADALUPE 4,543 8 0 1,663 6 679 6,8994,813 8 0 1,705 12 816 7,3541999 COLORADO 268 0 0 36 6 153 4631999 GUADALUPE 4,550 8 0 1,585 6 757 6,9064,818 8 0 1,621 12 910 7,3692000 COLORADO 268 0 0 4 6 154 4322000 GUADALUPE 4,661 11 0 985 6 763 6,4264,929 11 0 989 12 917 6,8582001 COLORADO 31 0 0 7 3 149 1902001 GUADALUPE 4,503 200 0 1,583 3 739 7,0284,534 200 0 1,590 6 888 7,2182002 COLORADO 30 0 0 7 3 161 2012002 GUADALUPE 4,281 6 0 1,583 3 797 6,6704,311 6 0 1,590 6 958 6,8712003 COLORADO 34 0 0 4 3 162 2032003 GUADALUPE 4,944 0 0 1,061 3 803 6,8114,978 0 0 1,065 6 965 7,0142004 COLORADO 34 0 0 5 3 176 2182004 GUADALUPE 4,736 1 0 178 3 875 5,7934,770 1 0 183 6 1,051 6,011Disclaimer: The Water Use estimates posted are subject to revision as additional data <strong>and</strong> corrections are made available to the TWDB.Page 2 of 2 Wednesday, March 18, 2009
Historical Water Use Summary by Ground<strong>water</strong> (GW) <strong>and</strong> Surface Water (SW)Unit: Acre Feet (ACFT)CALDWELL COUNTYYear Source Municipal Manufacturing Steam Electric Irrigation Mining Livestock Total1974 GW 3,069 206 0 97 70 253 3,6951974 SW 0 0 0 1,563 0 896 2,459Total 3,069 206 0 1,660 70 1,149 6,1541980 GW 2,679 34 0 100 0 169 2,9821980 SW 1,354 185 0 1,500 0 867 3,906Total 4,033 219 0 1,600 0 1,036 6,8881984 GW 3,662 37 0 205 3 82 3,9891984 SW 1,430 203 0 489 24 752 2,898Total 5,092 240 0 694 27 834 6,8871985 GW 3,252 38 0 144 27 74 3,5351985 SW 1,178 186 0 355 0 673 2,392Total 4,430 224 0 499 27 747 5,9271986 GW 3,392 38 0 145 0 81 3,6561986 SW 1,091 185 0 355 0 736 2,367Total 4,483 223 0 500 0 817 6,0231987 GW 3,298 0 0 145 28 80 3,5511987 SW 1,319 0 0 355 0 723 2,397Total 4,617 0 0 500 28 803 5,9481988 GW 3,345 0 0 145 25 84 3,5991988 SW 1,559 0 0 355 0 757 2,671Total 4,904 0 0 500 25 841 6,2701989 GW 3,406 0 0 147 27 82 3,6621989 SW 1,449 0 0 1,051 0 745 3,245Total 4,855 0 0 1,198 27 827 6,9071990 GW 3,589 0 0 674 27 81 4,3711990 SW 1,342 0 0 701 0 735 2,778Total 4,931 0 0 1,375 27 816 7,1491991 GW 3,106 0 0 0 13 84 3,2031991 SW 1,214 0 0 954 0 752 2,920Total 4,320 0 0 954 13 836 6,1231992 GW 3,205 0 0 741 13 84 4,0431992 SW 1,251 0 0 772 0 751 2,774Total 4,456 0 0 1,513 13 835 6,8171993 GW 3,491 2 0 147 12 77 3,7291993 SW 1,334 0 0 980 0 692 3,006Total 4,825 2 0 1,127 12 769 6,7351994 GW 3,441 11 0 147 12 89 3,700Disclaimer: The Water Use estimates posted are subject to revision as additional data <strong>and</strong> corrections are made available to the TWDB.Page 1 of 2 Wednesday, March 18, 2009
CALDWELL COUNTYYear Source Municipal Manufacturing Steam Electric Irrigation Mining Livestock Total1994 SW 1,277 0 0 1,214 0 801 3,292Total 4,718 11 0 1,361 12 890 6,9921995 GW 3,408 10 0 220 12 91 3,7411995 SW 1,347 0 0 1,476 0 816 3,639Total 4,755 10 0 1,696 12 907 7,3801996 GW 3,970 12 0 227 12 80 4,3011996 SW 1,216 0 0 1,515 0 721 3,452Total 5,186 12 0 1,742 12 801 7,7531997 GW 3,561 10 0 203 12 87 3,8731997 SW 1,023 0 0 1,357 0 782 3,162Total 4,584 10 0 1,560 12 869 7,0351998 GW 3,794 8 0 716 12 82 4,6121998 SW 1,019 0 0 989 0 734 2,742Total 4,813 8 0 1,705 12 816 7,3541999 GW 3,768 8 0 616 12 91 4,4951999 SW 1,050 0 0 1,005 0 819 2,874Total 4,818 8 0 1,621 12 910 7,3692000 GW 3,743 11 0 137 12 91 3,9942000 SW 1,186 0 0 852 0 826 2,864Total 4,929 11 0 989 12 917 6,8582001 GW 3,224 200 0 223 6 64 3,7172001 SW 1,310 0 0 1,367 0 824 3,501Total 4,534 200 0 1,590 6 888 7,2182002 GW 3,065 6 0 223 6 69 3,3692002 SW 1,246 0 0 1,367 0 889 3,502Total 4,311 6 0 1,590 6 958 6,8712003 GW 3,540 0 0 129 6 69 3,7442003 SW 1,438 0 0 936 0 896 3,270Total 4,978 0 0 1,065 6 965 7,0142004 GW 3,391 1 0 159 6 75 3,6322004 SW 1,379 0 0 24 0 976 2,379Total 4,770 1 0 183 6 1,051 6,011Disclaimer: The Water Use estimates posted are subject to revision as additional data <strong>and</strong> corrections are made available to the TWDB.Page 2 of 2 Wednesday, March 18, 2009
C O N S U L T I N G E N G I N E E R SAppendix GCaldwell County Water Rights <strong>and</strong> Database DictionaryKlotz Associates Project No. 0972.000.000January 2010APPENDIX-GCaldwell County Regional Water <strong>and</strong> Waste<strong>water</strong> Planning StudyFinal Report
Data Dictionary - Water Rights Database(last updated: July 14, 2008)Field NameWRNoWRTypeWRSeqAppNoWRIssueDateAmendmentLetterCancelledStatusCodeOwner NameOwnerTypeCodeDescriptionWater Right Number; identifier for <strong>water</strong> rights.Water Right Type; any of the following:1 = Application/Permit2 = Claim3 = Certified Filing4 = Returned or Withdrawn5 = Dismissed/Rejected6 = Certificate of Adjudication8 = Temporary Permit9 = Contract/Contractual Permit/AgreementWater Right Sequence Number; numbers the lines of data in each <strong>water</strong> right.Indicates the Application number associated with the Permit number (<strong>water</strong> rightnumber). Use this number to request a Central Records Permit file.Indicates the date the <strong>water</strong> right was issued by the TCEQ or predecessors.Unique identifier for amendments to <strong>water</strong> rights.Indicates <strong>water</strong> right status; any of the following:R = Dismissed/Rejected/CombinedT = Totally CancelledA = AdjudicatedP = Partially CancelledBlank = CurrentIndicates the <strong>water</strong> right owner name.Indicates type of owner; any of the following:1 = Individual 7 = Individual Unverified2 = Organization 8 = Organization Unverified3 = Et Ux 9 = Estate or Trust Unverified4 = Et Al 10 = Archive5 = Estate or Trust 11 = Et Ux Unverified6 = Et Vir 12 = Et Al UnverifiedDivAmountValueWMCodeIndicates the amount of <strong>water</strong> authorized for diversion per year, in acre-feet.Indicates the Watermaster Area in which the <strong>water</strong> right is located, as follows:CR = Concho RiverST = South TexasRG = Rio Gr<strong>and</strong>eblank = not in a Watermaster Area
UseCodePriority DatePriority Month, PriorityDay, Priority Year(three fields)PriorityClassCodeDateCancelledExpireRemarksAcreageResName, ResCap(two fields)SiteNameBasinCodeRiverOrderNoIndicates the appropriated use of the <strong>water</strong> right; any of the following:1 = Municipal/Domestic 7 = Recreation2 = Industrial 8 = Other3 = Irrigation 9 = Recharge4 = Mining 11 = Domestic & Livestock Only5 = Hydroelectric 13 = Storage6 = NavigationIndicates the original date of the original use of the <strong>water</strong> allocated under that<strong>water</strong> right. In the Rio Gr<strong>and</strong>e basin, priority is instead indicated by class(Priority Class Code).Priority date parsed into three columns. Use these columns to sort.Indicates the priority of the <strong>water</strong> right in the Rio Gr<strong>and</strong>e basin. In order ofhighest to lowest priority:M or D (municipal or domestic <strong>and</strong> livestock)ABIndicates the date the <strong>water</strong> right was cancelled, per order of the TCEQ.Indicates the date the <strong>water</strong> right or contract is scheduled to expire.With use 3 (irrigation) data, indicates the number of acres authorized forirrigation.Reservoir Name <strong>and</strong> Reservoir Capacity in Acre-Feet: Indicates the name of thereservoir <strong>and</strong> the amount of impoundment authorized by the <strong>water</strong> right.Indicates the facility/plant name associated with the <strong>water</strong> right.Indicates river basin where the base right is located; any of the following:1 = Canadian 13 = Brazos-Colorado2 = Red 14 = Colorado3 = Sulphur 15 = Colorado-Lavaca4 = Cypress 16 = Lavaca5 = Sabine 17 = Lavaca-Guadalupe6 = Neches 18 = Guadalupe7 = Neches-Trinity 19 = San Antonio8 = Trinity 20 = San Antonio-Nueces9 = Trinity-San Jacinto 21 = Nueces10 = San Jacinto 22 = Nueces-Rio Gr<strong>and</strong>e11 = San Jacinto-Brazos 23 = Rio Gr<strong>and</strong>e12 = BrazosRiver Order Number: Indicates 10 digit number assigned by the ApplicationUnit of Water Rights Permitting <strong>and</strong> locates the diversion point in relation toother diversion points on the stream.
RegionCodeIndicates the Regional Water Planning Group region(s) where the <strong>water</strong> right islocated, or to which the <strong>water</strong> right is related.SWRACodeA = Panh<strong>and</strong>leB = Region BC = Region CD = North East TexasE = Far West TexasF = Region FG = BrazosH = Region HIndicates the Special WaterResource Area where the <strong>water</strong>right is located, or to which a <strong>water</strong>supply contract is related; any ofthe following:I = East TexasJ = PlateauK = Lower ColoradoL = South CentralM = Rio Gr<strong>and</strong>eN = Coastal BendO = Llano-EstacadoP = LavacaUnnamedTribStreamNameOtherStreamName1 = Meredith2 = Alan Henry3 = Chapman (Cooper)4 = Tawakoni5 = Lake Fork6 = Athens7 = Palestine8 = Cherokee9 = Oak Creek10 = Ivie11 = Travis12 = Amistad13 = Medina14 = Canyon15 = Texana16 = Greenbelt17 = Possum Kingdom18 = Granbury19 = Whitney20 = Aquilla21 = Proctor22 = Belton23 = Stillhouse Hollow24 = Georgetown25 = Granger26 = Somerville27 = LimestoneWhen Y (Yes), indicates that the Diversion point is located on an unnamedtributary of ‘stream name’, the next field in the database; for example: UnnamedTributary of the Trinity River.When N (No) or blank, indicates that the Diversion point is located directly on‘stream name’, the next field in the database; for example: Trinity River.Indicates the stream where the diversion point for the <strong>water</strong> right is located.Indicates the stream where the additional diversion point for the <strong>water</strong> right islocated.
CountyName1 = Anderson 52 = Crane 103 = Hartley 154 = McCulloch 205 = San Patricio2 = Andrews 53 = Crockett 104 = Haskell 155 = McLennan 206 = San Saba3 = Angelina 54 = Crosby 105 = Hays 156 = McMullen 207 = Schleicher4 = Aransas 55 = Culberson 106 = Hemphill 157 = Madison 208 = Scurry5 = Archer 56 = Dallam 107 = Henderson 158 = Marion 209 = Shackelford6 = Armstrong 57 = Dallas 108 = Hidalgo 159 = Martin 210 = Shelby7 = Atascosa 58 = Dawson 109 = Hill 160 = Mason 211 = Sherman8 = Austin 59 = Deaf Smith 110 = Hockley 161 = Matagorda 212 = Smith9 = Bailey 60 = Delta 111 = Hood 162 = Maverick 213 = Somervell10 = B<strong>and</strong>era 61 = Denton 112 = Hopkins 163 = Medina 214 = Starr11 = Bastrop 62 = De Witt 113 = Houston 164 = Menard 215 = Stephens12 = Baylor 63 = Dickens 114 = Howard 165 = Midl<strong>and</strong> 216 = Sterling13 = Bee 64 = Dimmit 115 = Hudspeth 166 = Milam 217 = Stonewall14 = Bell 65 = Donley 116 = Hunt 167 = Mills 218 = Sutton15 = Bexar 66 = Duval 117 = Hutchinson 168 = Mitchell 219 = Swisher16 = Blanco 67 = Eastl<strong>and</strong> 118 = Irion 169 = Montague 220 = Tarrant17 = Borden 68 = Ector 119 = Jack 170 = Montgomery 221 = Taylor18 = Bosque 69 = Edwards 120 = Jackson 171 = Moore 222 = Terrell19 = Bowie 70 = Ellis 121 = Jasper 172 = Morris 223 = Terry20 = Brazoria 71 = El Paso 122 = Jeff Davis 173 = Motley 224 = Throckmorton21 = Brazos 72 = Erath 123 = Jefferson 174 = Nacogdoches 225 = Titus22 = Brewster 73 = Falls 124 = Jim Hogg 175 = Navarro 226 = Tom Green23 = Briscoe 74 = Fannin 125 = Jim Wells 176 = Newton 227 = Travis24 = Brooks 75 = Fayette 126 = Johnson 177 = Nolan 228 = Trinity25 = Brown 76 = Fisher 127 = Jones 178 = Nueces 229 = Tyler26 = Burleson 77 = Floyd 128 = Karnes 179 = Ochiltree 230 = Upshur27 = Burnet 78 = Foard 129 = Kaufman 180 = Oldham 231 = Upton28 = Caldwell 79 = Fort Bend 130 = Kendall 181 = Orange 232 = Uvalde29 = Calhoun 80 = Franklin 131 = Kenedy 182 = Palo Pinto 233 = Val Verde30 = Callahan 81 = Freestone 132 = Kent 183 = Panola 234 = Van Z<strong>and</strong>t31 = Cameron 82 = Frio 133 = Kerr 184 = Parker 235 = Victoria32 = Camp 83 = Gaines 134 = Kimble 185 = Parmer 236 = Walker33 = Carson 84 = Galveston 135 = King 186 = Pecos 237 = Waller34 = Cass 85 = Garza 136 = Kinney 187 = Polk 238 = Ward35 = Castro 86 = Gillespie 137 = Kleberg 188 = Potter 239 = Washington36 = Chambers 87 = Glasscock 138 = Knox 189 = Presidio 240 = Webb37 = Cherokee 88 = Goliad 139 = Lamar 190 = Rains 241 = Wharton38 = Childress 89 = Gonzales 140 = Lamb 191 = R<strong>and</strong>all 242 = Wheeler39 = Clay 90 = Gray 141 = Lampasas 192 = Reagan 243 = Wichita40 = Cochran 91 = Grayson 142 = La Salle 193 = Real 244 = Wilbarger41 = Coke 92 = Gregg 143 = Lavaca 194 = Red River 245 = Willacy42 = Coleman 93 = Grimes 144 = Lee 195 = Reeves 246 = Williamson43 = Collin 94 = Guadalupe 145 = Leon 196 = Refugio 247 = Wilson44 = Collingsworth 95 = Hale 146 = Liberty 197 = Roberts 248 = Winkler45 = Colorado 96 = Hall 147 = Limestone 198 = Robertson 249 = Wise46 = Comal 97 = Hamilton 148 = Lipscomb 199 = Rockwall 250 = Wood47 = Comanche 98 = Hansford 149 = Live Oak 200 = Runnels 251 = Yoakum48 = Concho 99 = Hardeman 150 = Llano 201 = Rusk 252 = Young49 = Cooke 100 =Hardin 151 = Loving 202 = Sabine 253 = Zapata50 = Coryell 101 = Harris 152 = Lubbock 203 = San Augustine 254 = Zavala51 = Cottle 102 = Harrison 153 = Lynn 204 = San JacintoRemarksBaseWRNo <strong>and</strong> Type(two fields)Indicates any additional information necessary to explain or define the <strong>water</strong>right. Once used for displaying amendment dates. SC=Special Condition,SCs=Special Conditions. SCS SITE=Soil Conservation Service Site.For a Contract (type 9), indicates the supplier’s <strong>water</strong> right number <strong>and</strong> type.Example: For Contract No. 000088-9, City of San Angelo, the Base Water Right<strong>and</strong> Type is 001008-6, Colorado River MWD.
WRNoWRTypeWRSeqAPPENDIX GTCEQ SURFACE WATER RIGHTS DATABASE FOR CALDWELL COUNTYOwner NameOwnerTypeCodeDivAmtValuePriorityDateBasinCodeRegionCodeStreamName3906 6 1 TEXAS PARKS & WILDLIFE DEPT 2 12 2/22/1972 18 L CLEAR FRK PLUM CRK3906 6 2 TEXAS PARKS & WILDLIFE DEPT 2 63 11/26/1979 18 L CLEAR FRK PLUM CRK3906 6 3 TEXAS PARKS & WILDLIFE DEPT 2 11/26/1979 18 L CLEAR FRK PLUM CRK3905 6 1 ALLAN C ASHCRAFT ET AL 4 9/28/1964 18 L DRY CRK3904 6 1 SPENCEWOOD INC 2 28 12/31/1951 18 L ELM CRK4213 1 1 BEN B TWIDWELL ET UX 3 120 11/20/1984 18 L PLUM CRK3719 1 1 MIGUEL CALZADA URQUIZA ET UX 3 45 7/30/1979 18 L SALT CRK3719 1 2 SCHMIDT RANCH LLC 2 623 7/30/1979 18 L SALT CRK3594 1 1 ROBERT M KIEHN 1 144 1/30/1978 18 L SAN MARCOS RIVER3724 1 1 ROBERT GLASS LANGFORD 1 149 1/28/1980 18 L SAN MARCOS RIVER3742 1 1 GEORGE PARTNERSHIP LTD 2 300 3/17/1980 18 L SAN MARCOS RIVER3787 1 1 BEN O CORPORATION 2 104 10/6/1980 18 L SAN MARCOS RIVER3812 1 1 VNS & CLS PARTNERS LTD 2 240 3/30/1981 18 L SAN MARCOS RIVER4057 1 1 CHRISTOPHER G SEEKER ET UX 2 300 6/13/1983 18 L SAN MARCOS RIVER4242 1 1 ROBERT L BOOTHE 1 240 5/29/1985 18 L SAN MARCOS RIVER4253 1 1 HYDRACO POWER INC 2 15,000 9/25/1984 18 L SAN MARCOS RIVER4287 1 1 JOHN T O'BANION JR ET AL 4 320 7/30/1985 18 L SAN MARCOS RIVER5092 1 1 CITY OF SAN MARCOS 2 150 9/2/1986 18 L SAN MARCOS RIVER5234 1 1 GUADALUPE-BLANCO RIVER AUTHORITY 2 1,022 5/12/1989 18 L SAN MARCOS RIVER5857 1 1 GENE MILLIGAN 1 1 10/18/2004 18 L SAN MARCOS RIVER3724 1 2 GAYLE LANGFORD TURNER 1 106 1/28/1980 18 L SAN MARCOS RIVER3787 1 2 BEN O CORPORATION 2 250 9/6/1985 18 L SAN MARCOS RIVER4057 1 2 CHRISTOPHER G SEEKER ET UX 2 300 3/4/1986 18 L SAN MARCOS RIVER4242 1 2 DON B MORGAN ET UX 3 5/29/1985 18 L SAN MARCOS RIVER5234 1 2 GUADALUPE-BLANCO RIVER AUTHORITY 2 8/6/2003 18 L SAN MARCOS RIVER5857 1 2 GENE MILLIGAN 1 10/18/2004 18 L SAN MARCOS RIVER3724 1 3 JEARL LEDBETTER ET UX 3 194 1/28/1980 18 L SAN MARCOS RIVER3787 1 3 MICHAEL W OHLENDORF ET UX 3 21 10/6/1980 18 L SAN MARCOS RIVER5234 1 3 GUADALUPE-BLANCO RIVER AUTHORITY 2 8/6/2003 18 L SAN MARCOS RIVER3724 1 4 JEROME V MILLER ET UX 3 1 1/28/1980 18 L SAN MARCOS RIVER
WRNoWRTypeWRSeqAPPENDIX GTCEQ SURFACE WATER RIGHTS DATABASE FOR CALDWELL COUNTYOwner NameOwnerTypeCodeDivAmtValuePriorityDateBasinCodeRegionCodeStreamName3787 1 4 MICHAEL W OHLENDORF ET UX 3 50 9/6/1985 18 L SAN MARCOS RIVER3889 6 1 CANYON REGIONAL WATER AUTHORITY 2 24 6/23/1914 18 L SAN MARCOS RIVER3890 6 1 GEORGE PARTNERSHIP LTD 2 50 8/9/1971 18 L SAN MARCOS RIVER3891 6 1 TRI-COMMUNITY WSC 2 500 12/29/1922 18 L SAN MARCOS RIVER3895 6 1 EBL INC DEF BEN PENSION PLAN & TRUST 5 580 3/21/1977 18 L SAN MARCOS RIVER3896 6 1 GUADALUPE-BLANCO RIVER AUTHORITY 2 1,500 10/12/1976 18 L SAN MARCOS RIVER3897 6 1 LULING ECONOMIC DEVELOPMENT CORP 4 6/22/1914 18 L SAN MARCOS RIVER3898 6 1 CITY OF LULING 2 20 8/16/1976 18 L SAN MARCOS RIVER3899 6 1 SCHMIDT RANCH LLC 2 1,180 3/21/1977 18 L SAN MARCOS RIVER3900 6 1 DAVID NEAL PAPE ET AL 4 2/12/1973 18 L SAN MARCOS RIVER3895 6 2 EBL INC DEF BEN PENSION PLAN & TRUST 5 3/21/1977 18 L SAN MARCOS RIVER3896 6 2 GUADALUPE-BLANCO RIVER AUTHORITY 2 1/7/1980 18 L SAN MARCOS RIVER3900 6 2 ESTATE OF JAMES D JAMISON 5 750 2/12/1973 18 L SAN MARCOS RIVER3895 6 3 EBL INC DEF BEN PENSION PLAN & TRUST 5 3/21/1977 18 L SAN MARCOS RIVER3896 6 3 GUADALUPE-BLANCO RIVER AUTHORITY 2 1,300 1/31/1983 18 L SAN MARCOS RIVER
C O N S U L T I N G E N G I N E E R SAppendix HWater Conservation MeasuresKlotz Associates Project No. 0972.000.000January 2010APPENDIX-HCaldwell County Regional Water <strong>and</strong> Waste<strong>water</strong> Planning StudyFinal Report
APPENDIX HWATER CONSERVATION MEASURESIntroductionWater conservation will provide benefits not only to customers in cost but to society bypreserving the environment <strong>and</strong> our resources by reducing dem<strong>and</strong>s on <strong>water</strong> <strong>and</strong>waste<strong>water</strong> systems. The objective of the Caldwell County Conservation Plan will be toprovide on brief overview of current measures undertaken by <strong>water</strong> utilities <strong>and</strong> topromote <strong>and</strong> implement <strong>water</strong> conservation.Water conservation has been identified by Region L as a measure to meet future <strong>water</strong>dem<strong>and</strong>s. As growth occurs <strong>and</strong> new developments flourish, it will be helpful to considerhaving a list of action items to be implemented to accommodate the increase in customerswithout a substantial increase in <strong>water</strong> dem<strong>and</strong>s.Water Supply System Conservation MeasuresThe <strong>water</strong> supply systems that currently serve Caldwell County responded in a survey ashaving implemented the following measures to encourage <strong>water</strong> conservation:Increasing <strong>water</strong> ratesProhibit l<strong>and</strong>scaping between the hours of 10 am to 8 pmBiannual newsletters with conservation tipsIncreasing rate blocksInstall accurate metering devicesUniversal meteringMeter testing <strong>and</strong> replacement programsRecord management systemWater auditsPublic EducationNon-promotional <strong>water</strong> ratesLeak detection <strong>and</strong> replacement
APPENDIX HAnnual presentationsConservation <strong>water</strong> rateStrict Plumbing code enforcementMail updates <strong>and</strong> conservation mail from ground<strong>water</strong> districtsMeasures under consideration by <strong>water</strong> supply systems to encourage <strong>water</strong> conservation: Education Reducing per capita consumption by 3% Joined SWAP Replace meters on schedule to reduce <strong>water</strong> loss Leak monitoring program to identify <strong>and</strong> repair leaks Encourage xeriscaping Implement year round <strong>water</strong> restriction Mail out information on a percent basisAs conservation measures are implemented, communicating the benefits of the strategy isone of the best ways to encourage other <strong>water</strong> suppliers to do likewise. Not only willConservation Programs slow ground<strong>water</strong> drawdown but also reduce cost of <strong>water</strong>treatment plants by eliminating or delaying expansion resulting in considerable financialsavings.Record Management SystemMaintaining accurate <strong>and</strong> updated records of <strong>water</strong> distribution <strong>and</strong> sales are essentialrecord keeping tools needed for operation <strong>and</strong> management of a profitable <strong>water</strong>business. Establishing a central system which is able to segregate <strong>water</strong> sales <strong>and</strong> <strong>water</strong>uses for various user classes can provide data quickly <strong>and</strong> efficiently for review ofsystems. User classes can include; single-family, multifamily, commercial, industrial,schools, <strong>and</strong> irrigation.
APPENDIX HWater Rate StructureAn increasing <strong>water</strong> rate structure can motivate customers to reduce <strong>water</strong> use <strong>and</strong>practice conservation measures. Establishing an average monthly consumption rate for allclasses of users <strong>and</strong> gradually increasing charge will encourage limits on <strong>water</strong>ing <strong>and</strong>use. Peak seasonal rates <strong>and</strong> City Limit boundary considerations should also be includedin the rate structure.Water AuditsAlthough it is impractical to attain 0% loss in <strong>water</strong> systems, it can be substantiallyminimized with monthly, quarterly, semi-annual, or annual audits. Audits requireaccountability <strong>and</strong> responsibility for substantial loss is a system. Improvements arerequired <strong>and</strong> goals should be established to decrease the losses in a system <strong>and</strong> kept to aminimum. Larger cities than those in Caldwell have recorded <strong>water</strong> loss under 10%.Long-term <strong>planning</strong> at the city level should develop goals of minimum <strong>and</strong> maximum<strong>water</strong> loss with action plans ready to be implemented in the event goals are not met.HB 3338 Water Auditing Reporting Information was enacted in the 78 th Legislature in2003. The bill requires “each retail public utility that provides potable <strong>water</strong> to conduct a<strong>water</strong> loss audit once every five years <strong>and</strong> to report the results of the audit to the TexasWater Development Board (TWDB). The <strong>water</strong> audit addresses four main points of<strong>water</strong> loss: loss from distribution lines; inaccuracies in meters; deficiencies in accountingpractices; <strong>and</strong>, theft of service.” Submission of the 2006 deadline for the report hasresulted in a response rate under 50%.MeteringMetering all the customer base is the only tool available that can account for <strong>water</strong> use.Proper calibration <strong>and</strong> routine testing can increase accuracy of measurements. It would be
APPENDIX Hbeneficial to test every meter before installation <strong>and</strong> develop a frequent routine to testinstalled meters. Proper metering for use is important to reduce cost <strong>and</strong> errors in billings.ReuseReuse/ reclaimed waste <strong>water</strong> can be utilized for non-potable <strong>water</strong> uses. Severalcustomers from residential to commercial can utilize the <strong>water</strong>. Reuse can be consideredfor the following:SchoolsAthletic fieldsManufacturing businessesGold coursesParksApartment/ various housing complexesComponents of the <strong>water</strong> system to consider would include transmission mains, storagetanks, <strong>and</strong> pump stations. These systems need to be reviewed further to consider a benefit<strong>and</strong> costPlumbing FixturesRebate Programs <strong>and</strong> Replacement Programs for single family homes to include toilets,sinks, <strong>and</strong> shower heads. Eligible fixtures should demonstrate a 20% or more efficiencyin <strong>water</strong> use. Water efficient clothes washers can also be included in the program.
APPENDIX HLeak Detection <strong>and</strong> RepairSound detection of leaks is the most common practice to locate faulty joints <strong>and</strong> brokensections of pipe. Once located, a log should be maintained for repair <strong>and</strong> a databaseestablished <strong>and</strong> utilized.Water Efficient L<strong>and</strong>scapingAs <strong>water</strong> resources become scarce <strong>and</strong>rates continue increase other viablesolutions for customers include rain <strong>water</strong>harvesting. The TWDB has published aseries of technical guides on rain<strong>water</strong>harvesting to promote use. Participation inworkshops, seminars, <strong>and</strong> conference canfurther the education of local customers.Soil CompositionDepth of soilDepth of mulchRain<strong>water</strong> Harvesting SystemsRain<strong>water</strong> harvesting has gained popularity asdifferent sizes <strong>and</strong> shapes of tanks are emerging.Below ground rain<strong>water</strong> tanks <strong>and</strong> smallercisterns are available to offset municipal <strong>water</strong>use. The <strong>water</strong> from the cisterns can be forpotable <strong>and</strong> non-potable use.The TWDB presented a report to the Legislaturein 2006 to on recommendations for minimum <strong>water</strong> quality st<strong>and</strong>ards for indoor potable<strong>and</strong> non-potable use, treatment methods, conjunctive use with municipal <strong>water</strong> systems,
APPENDIX H<strong>and</strong> ways in which the state can further promote rain<strong>water</strong> harvesting. Additionalinformation can be obtained at http://www.twdb.state.tx.us/iwt/rain<strong>water</strong>.asp.Agricultural IrrigationIrrigation of agriculture is one the greatest <strong>water</strong> consumers <strong>and</strong> currently accounts for asignificant amount of the <strong>water</strong> use in Texas. Surface, sprinkler <strong>and</strong> drip irrigation art thebasic types of irrigation. Drip irrigation has been found to be the most efficient for certaincrops.Establishing schedules based on the crop’s needs <strong>and</strong> monitoring soil moisture <strong>and</strong>weather help determine the amount of <strong>water</strong> to apply. Proper grading of the l<strong>and</strong> for use<strong>and</strong> irrigation practice can be a natural way to reduce <strong>water</strong> use. Additional conservationmethods include:Furrow DinkingConservation TillageTail <strong>water</strong> ReuseSurge FlowLow Elevation Spray Application Systems (LESA)Canal <strong>and</strong> Conveyance System ManagementPublic EducationThere are several modes of informing <strong>and</strong> educating the public that can be utilized. Waterconservation education can be transmitted through the following:Public Service AnnouncementsWorkshops <strong>and</strong> SeminarsPamphletsOutreach programsSchoolsAwards <strong>and</strong> RecognitionCreative Competitions (Drawing, Photo, <strong>and</strong> Essay)
C O N S U L T I N G E N G I N E E R SAppendix IPlum Creek Watershed Protection Plan Best ManagementPracticesKlotz Associates Project No. 0972.000.000January 2010APPENDIX-ICaldwell County Regional Water <strong>and</strong> Waste<strong>water</strong> Planning StudyFinal Report
APPENDIX IBEST MANAGEMENT PRACTICESBest Management Practices listed in the Plum Creek Watershed Protection Plan to beimplemented.Urban Storm<strong>water</strong> MeasuresCommon Goals• Implement non-structural components of MS4 permits on a voluntary basis inadvance of program requirements• Conduct storm<strong>water</strong> engineering analyses <strong>and</strong> city-wide assessments to determineplacement of structural management measures in individual cities• Pet waste management, including passage or modification of ordinances <strong>and</strong>installation <strong>and</strong> management of pet waste stationsLockhart• Enact a pet waste ordinance• Install 10 pet waste stations <strong>and</strong> signage• Nutrient/irrigation <strong>water</strong> management in park areas• Manage/periodically relocate duck population at City Park• Continue/exp<strong>and</strong> existing street sweeping programLuling• Reconstruct Cottonwood Creek storm<strong>water</strong> retention pond• Enact a pet waste ordinance• Install 6 pet waste stations <strong>and</strong> signage• Continue/exp<strong>and</strong> existing street sweeping programWaste<strong>water</strong> Management MeasuresWaste<strong>water</strong> Treatment Facilities• Promote signing of the East Hays County Waste<strong>water</strong> Compact, a key interlocalagreement between multiple entities in the region.• All WWTFs agree to work toward treatment levels of 5-5-2-1(BOD/TSS/NH 3 /TP) by way of permits for new facilities <strong>and</strong> voluntary action byexisting plants.• All WWTFs will begin monthly self-monitoring of effluent for bacteria <strong>and</strong>nutrients.• All WWTF operators will demonstrate the appropriate licenses <strong>and</strong> certifications<strong>and</strong> be current on continuing education opportunities.
APPENDIX I• The cities of Kyle, Lockhart, <strong>and</strong> Luling will evaluate costs <strong>and</strong> feasibility in aneffort to implement phosphorous removal techniques for all effluent enteringPlum Creek.Waste<strong>water</strong> Infrastructure• Cities will continue or initiate daily inspections of lift stations <strong>and</strong> equip allstations with dialers <strong>and</strong>/or Supervisory Control <strong>and</strong> Data Acquisition (SCADA)systems.• Cities will continue to apply for grants to replace old clay pipe sewer lines, <strong>and</strong>clean <strong>and</strong> maintain existing sewer lines.• Cities will work to locate any septic systems that may still be within the citylimits <strong>and</strong> connect those residences to central waste<strong>water</strong> treatment.Cropl<strong>and</strong> Operations Management MeasuresTo focus management plan development <strong>and</strong> implementation, management measures,addressing bacteria <strong>and</strong> nutrient issues will be encouraged <strong>and</strong> given top priority. Basedon site-specific characteristics, plans should include one or more of the followingmanagement practices to reduce pollutant loads from agricultural l<strong>and</strong>s:• Prescribed Grazing: Manages the controlled harvest of vegetation with grazinganimals to improve or maintain the desired species composition <strong>and</strong> vigor of plantcommunities, which improves surface <strong>and</strong> subsurface <strong>water</strong> quality <strong>and</strong> quantity.• Riparian Herbaceous Buffers: Establishes an area of grasses, glasslike plants, <strong>and</strong>forbs along <strong>water</strong> courses to improve <strong>and</strong> protect <strong>water</strong> quality by reducingsediment <strong>and</strong> other pollutants in runoff as well as nutrients <strong>and</strong> chemicals inshallow ground<strong>water</strong>.• Grasses Waterways: Natural or constructed channel-shaped or graded <strong>and</strong>established with suitable vegetation to protect <strong>and</strong> improve <strong>water</strong> quality.• Riparian Forest Buffers: Establishes area dominated by trees <strong>and</strong> shrubs locatedadjacent to <strong>and</strong> up-gradient from <strong>water</strong>courses to reduce excess amounts ofsediment, organic material, nutrients, <strong>and</strong> pesticides in surface runoff <strong>and</strong> excessnutrients <strong>and</strong> other chemicals in shallow ground<strong>water</strong> flow.• Watering Facilities: Places a device (tank, trough, or other <strong>water</strong>tight container)that provides animal access to <strong>water</strong> <strong>and</strong> protects streams, ponds, <strong>and</strong> <strong>water</strong>supplies from contamination through alternative access to <strong>water</strong>.• Field Borders: Establishes a strip of permanent vegetation at the edge or aroundthe perimeter of a field to protect soil <strong>and</strong> <strong>water</strong> quality.
APPENDIX I• Filter Strips: Establishes a strip or area of herbaceous vegetation betweenagricultural l<strong>and</strong>s <strong>and</strong> environmentally sensitive areas to reduce pollutant loadingin runoff.• Nutrient Management: Manages the amount, source, placement, form, <strong>and</strong> timingof the application of plant nutrients <strong>and</strong> soil amendments to minimize agriculturalnonpoint source pollution of surface <strong>and</strong> ground<strong>water</strong> resources.• Conservation Cover: Establishes permanent vegetative cover to protect soil <strong>and</strong><strong>water</strong>.• Stream Crossings: Creates a stabilized area or structure constructed across astream to provide a travel way for people, livestock, equipment, or vehicles,improving <strong>water</strong> quality by reducing sediment, nutrient, organic, <strong>and</strong> inorganicloading of the stream.• Alternative Shade: Although not currently an approved cost-share practice,creation of shade reduces time spent loafing in streams <strong>and</strong> riparian areas, thusreducing pollutant loading. Efforts will be made to include this practice as acomponent of livestock management plans.
C O N S U L T I N G E N G I N E E R SAppendix JPlum Creek Watershed Protection Plan ManagementMeasures <strong>and</strong> Outreach ActivitiesKlotz Associates Project No. 0972.000.000January 2010APPENDIX-JCaldwell County Regional Water <strong>and</strong> Waste<strong>water</strong> Planning StudyFinal Report
Management Measuresas described in thePlum Creek Watershed Protection PlanManagement MeasureResponsiblePartyUrban Storm<strong>water</strong> Management MeasuresUnit CostNumber ImplementedYear1-3 4-6 7-10Total CostPet Waste CollectionStationsCity of Lockhart$620/station installation$85 annual/station10 4 4 $22,040Pet Waste CollectionStationsCity of Luling$620/station installation$85 annual/station6 2 2 $12,475Comprehensive UrbanStorm<strong>water</strong> AssessmentManage Urban WaterfowlPopulationsComprehensive UrbanStorm<strong>water</strong> AssessmentRehabilitate Storm<strong>water</strong>Retention PondCity of Lockhart $25,000/survey 1 --- --- $25,000City of Lockhart --- --- --- --- N/ACity of Luling $20,000/survey 1 --- --- $20,000City of Luling $500,000/pond 1 --- $500,000Waste<strong>water</strong> Management MeasuresWaste<strong>water</strong> Upgrade(TSS Reduction)Waste<strong>water</strong> Upgrade(Phosphorous Removal)Voluntary MonthlyE. coli MonitoringWWTFOperatorsWWTFOperatorsWWTFOperators$500,000/1 MGD facility$60,000/facility(includes materialcosts)3 7 $6,0003 7 $600,000$22/monthly/facility --- --- --- $31,000Voluntary MonthlyPhosphorous MonitoringWWTFOperators$25/monthly/facility --- --- --- $35,000Waste<strong>water</strong> Management Measures (continued)Sanitary Sewer PipeReplacementInitiate Sanitary SewerInspection ProgramSanitary Sewer PipeReplacementLift StationSCADA InstallationCity of Lockhart $320,000/year 1,800 ft 1,800 ft 2,400 ft $3,200,00 3City of Luling $17,000/camera 1 --- --- $17,000 2City of Luling $100,000/year 2,400 ft 2,400 ft 3,200 ft $10,000,000 3City of Luling $12,000/station 4 1 $60,000Page 1 of 2
Management MeasureSeptic System Inspection/Enforcement (NewPosition)Management Measuresas described in thePlum Creek Watershed Protection PlanResponsiblePartyUnit CostNumber ImplementedYear1-3 4-6 7-10Total CostCaldwell County $50,000/year 2$1,000,000Septic System Caldwell/RepairHays Cos.$5,000/system 300 300 400 $5,000,000Septic System Caldwell/Replacement Hays Cos.$10,000/system 150 150 200 $5,000,000Septic SystemConnection to SewerCity of Uhl<strong>and</strong> $2,000/system 100 100 150 $700,000Agricultural Management MeasuresWQMP Technician(New Position)SWCD $75,000/year 1$750,000Livestock Water QualityManagement PlansSWCD $10,000/plan 65 70 100 $2,350,000Cropl<strong>and</strong> Water QualityManagement PlansSWCD $10,000/plan 6 9 9 $240,000Non-Domestic Animal <strong>and</strong> Wildlife Management MeasuresFeral Hog Control(New Position)TWDMS $90,000/year 1$900,000Feral Hog Control(Equipment)TWDMS --- --- --- --- $5,000Monitoring ComponentTargetedWater Quality MonitoringComprehensive StreamAssessmentBacterialSource TrackingGBRA --- 1 --- --- $142,000 4GBRA $1,500/assessment 12 12 16 $60,000TAMU --- 1 --- --- $200,000Page 2 of 2
Outreach Activitiesas described in thePlum Creek Watershed Protection PlanOutreach ActivityBroad-Based ProgramsResponsible PartyYear1-3 4-6 7-10Total CostTexas Watershed StewardTraining SessionsExtension 3 2 1 N/AElementary School WaterQuality ProjectGBRA --- --- --- $25,000Plum Creek WatershedProtection BrochureGBRA --- --- --- $15,000 1Tributary <strong>and</strong> WatershedRoadway SignagePCW Partnership 60 --- --- $6,000Displays at Local Events Extension/TSSWCB 9 9 9 $5,400Watershed Billboards PCW Partnership 1 sign biennially $30,000Urban ProgramsPet Waste ProgramsCities/TCEQ/Extension--- --- --- $35,000NEMOWorkshops2 --- ---Fats, Oils, <strong>and</strong> Grease GBRA/TCEQ/WorkshopExtension2 --- --- $20,000 1Municipal Site AssessmentVisits4 --- ---Urban Sector NutrientEducationExtension 3 3 3 N/ASports <strong>and</strong> Athletic FieldEducation (SAFE)Extension 3 3 3 N/AWaste<strong>water</strong> ProgramsDevelop Septic SystemOnline Training ModulesGBRA 4 --- --- $30,000 1Septic System Workshops<strong>and</strong> AssistanceAgricultural ProgramsSoil <strong>and</strong> Water TestingCampaignsAgricultural NutrientManagement EducationCrop ManagementSeminarsAgricultural WastePesticide Collection DaysExtension/ GBRA 4 3 3 $25,000 1Extension 3 3 3 N/AExtension 3 3 3 N/AExtension 3 3 3 N/ATCEQ 1 1 1 $75,000Page 1 of 2
Outreach ActivityAgricultural Programs (continued)Outreach Activitiesas described in thePlum Creek Watershed Protection PlanResponsible PartyYear1-3 4-6 7-10Total CostLivestock GrazingManagement EducationExtension 3 3 3 N/ANon-Domestic Animal <strong>and</strong> Wildlife ProgramsFeral Hog ManagementWorkshopExtension 2 1 2 N/AStream <strong>and</strong> RparianWorkshopsExtension 2 1 2 N/AAdditional ProgramsIllegal Dumping Site3 3 3Targeted CleanupGBRACommunity Stream2 3 3Cleanup Events$40,000 1Rain<strong>water</strong> HarvestingEducation/DemonstrationExtension 2 1 2 $25,000Page 2 of 2
C O N S U L T I N G E N G I N E E R SAppendix KRegional CompactKlotz Associates Project No. 0972.000.000January 2010APPENDIX-KCaldwell County Regional Water <strong>and</strong> Waste<strong>water</strong> Planning StudyFinal Report
APPENDIX KWhereas the parties to this compact, the cities of Lockhart, Luling, Martindale,Niederwald, Uhl<strong>and</strong> <strong>and</strong> the Guadalupe-Blanco River Authority (GBRA) all function inCaldwell County <strong>and</strong>Whereas all parties share the responsibility to:1. To promote the development, use, <strong>and</strong> conservation of the <strong>water</strong> resources inthe <strong>county</strong>2. To plan for the welfare of all local governments <strong>and</strong> make it possible for allcommunities to utilize public works services3. To promote <strong>and</strong> implement feasible conservation measures established4. To balance development in the region <strong>and</strong> promote sustainable designs5. To develop <strong>water</strong> quality management measures that will ensure the future use<strong>and</strong> quality of ground<strong>water</strong> <strong>and</strong> surface <strong>water</strong>6. To minimizing reliance on On-Site Sewage Facilities (OSSFs)7. To develop inter local agreements <strong>and</strong> cooperation for the purpose ofdeveloping <strong>water</strong> <strong>and</strong> waste<strong>water</strong> facilities to serve the future population ofCaldwell<strong>and</strong> whereas all parties recognize that much of the future <strong>water</strong> <strong>and</strong> waste<strong>water</strong>infrastructure in Caldwell will have to be provided initially by the private sector in newdevelopments, <strong>and</strong> whereas all parties underst<strong>and</strong> that the common interests will beserved by adopting a uniform approach, the parties jointly enter into this compact. Thekey elements to the compact are:1. The parties recognize that protection of the <strong>water</strong> resources in Caldwell willrequire a <strong>regional</strong> cooperative effort. The overutilization of natural resources isnot a sustainable practice <strong>and</strong> conservation <strong>and</strong> reuse measures practices will beimplemented.2. The parties agree jointly to participate, to the extent desired, in the review of newproposed projects <strong>and</strong> plans, <strong>and</strong> in special studies involving rates or other issues.Development of a Good Neighbor Policy to share ideas <strong>and</strong> plan conservation ofresources on a <strong>regional</strong> basis will provide benefits to the region as a whole.3. The parties will develop <strong>and</strong> agree on specific conditions that will determine thenumber of housing units needed for a central waste<strong>water</strong> system, but as an initialtarget agree that OSSFs would not be appropriate for developments of 10 or morehomes.4. The parties believe that domestic waste<strong>water</strong> treatment is an important publicservice, with the potential to affect citizens outside of the immediate project area.The parties also recognize that proper operation <strong>and</strong> maintenance of waste<strong>water</strong>infrastructure is essential to the public welfare. Because it is important to thepublic, the parties agree that central waste<strong>water</strong> facility operations should be apublic function, <strong>and</strong> that future waste<strong>water</strong> facilities in Caldwell County should
APPENDIX Kbe operated by a public rather than a private entity. The parties recognize that theprivate sector must be involved in the design, permitting <strong>and</strong> construction ofwaste<strong>water</strong> facilities to serve new developments, but the parties anticipate thatthese new developments will at some future time become a part of a municipality.As such, the parties agree that central waste<strong>water</strong> facilities associated with newdevelopments should be jointly permitted (e.g. private developer <strong>and</strong> publicentity) <strong>and</strong> operated by the public entity.5. An important aspect of waste<strong>water</strong> operations is the quality of the <strong>water</strong>produced. The parties agree that a high quality effluent that is discharged tosurface <strong>water</strong>s is important <strong>and</strong> will encourage the level represented by the TexasCommission on Environmental Quality’s (TCEQ) 5-5-2-1 effluent set will be thegoal for all new facilities. That is operating at full flow with a monthly averageeffluent quality of BOD5 OF 5MG/l, tss OF 5 MG/l, AMMONIA-Nitrogen of 2mg/L <strong>and</strong> total Phosphorus of 1 mg/L. The parties recognize that this goal can bemet in several ways including direct treatment, treating to a different level, <strong>and</strong>meeting the goal by use of an offsetting amount of effluent for irrigation, orthrough wetl<strong>and</strong> polishing.6. The parties recognize that Caldwell County has limited <strong>water</strong> resources supplies<strong>and</strong> that providing good quality <strong>water</strong> to serve future growth will be a challenge.To conserve <strong>water</strong> supplies to the extent practical, the parties jointly desire newdevelopments to include provisions to minimize potable <strong>water</strong> use in irrigation.This can include a purple pipe system for irrigation <strong>and</strong>/or cisterns for providing<strong>water</strong> for toilet flushing <strong>and</strong> lawn irrigation.7. All parties agree to participate in supporting the core provisions of the Compact.For examples, this could include opposing a private permit applicant in the TCEQhearing process that refused to follow the central treatment, effluent quality, orreuse provisions of the Compact.
C O N S U L T I N G E N G I N E E R SAppendix LPublic Meeting Comments on Report <strong>and</strong> Responses toCommentsKlotz Associates Project No. 0972.000.000January 2010APPENDIX-LCaldwell County Regional Water <strong>and</strong> Waste<strong>water</strong> Planning StudyFinal Report
RESPONSE TO WRITTEN COMMENT BY GRAHAM MOOREWe agree that the ground<strong>water</strong> portions of the GBRA Mid-Basin Project will facethe same challenges as the HCPUA Project <strong>and</strong> have modified the report to reflectthat information.Klotz Associates Project No. 0972.000.000August 2009Appendix LCaldwell County Regional Water <strong>and</strong> Waste<strong>water</strong> Planning StudyDraft Report
RESPONSE TO WRITTEN COMMENT BY JOHNIE HALLIBURTONThe report recommends the GBRA Mid-Basin Project as one of the strategies tobe pursued. No changes were made to the report.Klotz Associates Project No. 0972.000.000August 2009Appendix LCaldwell County Regional Water <strong>and</strong> Waste<strong>water</strong> Planning StudyDraft Report
C O N S U L T I N G E N G I N E E R SAppendix MWater Treatment Facilities Cost EstimateWaste<strong>water</strong> Treatment Facilities Cost EstimatesKlotz Associates Project No. 0972.000.000January 2010APPENDIX-MCaldwell County Regional Water <strong>and</strong> Waste<strong>water</strong> Planning StudyFinal Report
APPENDIX MCaldwell County Regional Water <strong>and</strong> Waste<strong>water</strong> Planning StudyRegional Water PlanningWater Transmission Line OptionsPrepared June 2009PROJECT COST SUMMARY WITH 12" DISTRIBUTION SYSTEMITEM NO.ITEM DESCRIPTIONAMOUNT1 Line 1A - Ground<strong>water</strong> Source Route to Lockhart$33,800,0002 Line 1B - Ground<strong>water</strong> Source Route to Luling$30,200,0003 Line 1C - Surface Water Source Route to Luling$51,300,0004 Line 2 - SH 130 North Route$10,221,1285 Line 3 - Northwest Route to Uhl<strong>and</strong>$6,282,9226 Line 4 - SH 130 West$8,608,917Level of Cost Projection: The engineer has no control over the cost of labor, materials, or equipment, or over the Contractor’s methods ofdetermining prices, or over competitive bidding or market conditions. As a result, this opinion of probable constructioncost is based on thePage 1 of 1
APPENDIX MCaldwell County Regional Water <strong>and</strong> Waste<strong>water</strong> Planning StudyRegional Water PlanningWater Transmission Line OptionsPrepared June 2009Transmission Line 1AGENERAL DEVELOPMENTITEMUNITNO. ITEM DESCRIPTIONUNIT QTY PRICE AMOUNT1 MOBILIZATION (10%)LS 1 $2,152,524.28 $2,152,5242 SITE PREPARATION (7%)LS 1 $1,506,767.00 $1,506,7673 SEDIMENTATION AND EROSION CONTROL (5%) LS 1 $1,076,262.14 $1,076,2624 TRAFFIC MAINTENANCE (1.0%)LS 1 $215,252.43 $215,2525 REPLACING ASPHALT PAVEMENTSY 93 $90.00 $8,4006 DRIVEWAY REPLACEMENT (AVG)SY 1,667 $60.00 $100,0007 REMOVE AND REPLACE FENCING (5%)LF 5,500 $50.00 $275,0008 FILTER FABRICLF 109,869 $1.20 $131,8439 INSTALLATION OF CATHODIC TEST STATIONS LS 1 $10,000.00 $10,000ESTIMATED SUB TOTAL$5,500,000WELL DEVELOPMENTITEMUNITNO. ITEM DESCRIPTIONUNIT QTY PRICE AMOUNT1 PUMPS (1,000 GPM) & INSTALLATIONEA 6 $15,000.00 $90,0002 FIELD WELL DEVELOPMENTLS 1 $5,000,000.00 $5,000,0003 LAND PURCHASE COSTLS 1 $75,000.00 $75,000ESTIMATED SUB TOTAL $5,200,000WATER FACILITIESITEMUNITNO. ITEM DESCRIPTIONUNIT QTY PRICE AMOUNT1 STORAGE TANKGAL 1,000,000 $0.50 $500,0002 WATER TREATMENT PLANTGPD 8,000,000 $0.50 $4,000,000$0ESTIMATED SUB TOTAL $4,500,00030-INCH TRANSMISSION MAIN COSTITEMUNITNO. ITEM DESCRIPTIONUNIT QTY PRICE AMOUNT1 MOBILIZATIONLS 1 $84,000.00 $84,0002 30-INCH D.I. WATER MAIN (OPEN CUT)LF 109,701 $95.00 $10,421,5953 30-INCH D.I. WATER MAIN (BORE)LF 168 $150.00 $25,2004 4 INCH COMBINATION AIR VALVE WITH MANHOLE EA 10 $12,000.00 $120,0005 30-INCH BUTTERFLY VALVE WITH MANHOLEEA 10 $13,000.00 $130,0006 FILTER FABRICLF 109,869 $1.00 $109,8697 CATHODE ROTECTIONLS 1 $250,000.00 $250,0008 DISINFECT WATER TRANSMISSION MAIN LF 109,869 $0.50 $54,9359 INSTALLATION CATHODIC TEST STATIONSLS 1 $15,000.00 $15,00010 TRENCH SAFETYLF 109,701 $1.25 $137,126ESTIMATED SUB TOTAL $11,300,000MISCITEMUNITNO. ITEM DESCRIPTIONUNIT QTY. PRICE AMOUNT1 SURVEY (1.0 %)LS 1 $265,000.00 $265,0002 ENGINEERING (10%)LS 1 $2,650,000.00 $2,650,000ESTIMATED SUB TOTAL$2,915,000Level of Cost Projection: TOTAL CONSTRUCTION COST = $26,500,000.00 TOTAL ENGINEERING COST = $2,900,000 TOTAL= $29,400,000 15% CONTINGENCY=GRAND TOTAL =$4,400,000$33,800,000The engineer has no control over the cost of labor, materials, or equipment, or over the Contractor’s methods ofdetermining prices, or over competitive bidding or market conditions. As a result, this opinion of probable construction costis based on the engineer’s experience <strong>and</strong> qualifications <strong>and</strong> represents our best judgment as design professionals familiarwith the construction industry. The engineer cannot <strong>and</strong> does not guarantee the proposals, bids, or the construction costwill not vary from this opinion of probable cost.Page 1 of 1
APPENDIX MCaldwell County Regional Water <strong>and</strong> Waste<strong>water</strong> Planning StudyRegional Water PlanningWater Transmission Line OptionsPrepared June 2009Transmission Line 1BGENERAL DEVELOPMENTITEMUNITNO. ITEM DESCRIPTIONUNIT QTY PRICE AMOUNT1 MOBILIZATION (10%)LS 1 $1,923,971.00 $1,923,9712 SITE PREPARATION (7%)LS 1 $1,346,779.70 $1,346,7803 SEDIMENTATION AND EROSION CONTROL (5%) LS 1 $961,985.50 $961,9864 TRAFFIC MAINTENANCE (1.0%)LS 1 $192,397.10 $192,3975 REPLACING ASPHALT PAVEMENTSY 31 $90.00 $2,8006 DRIVEWAY REPLACEMENT (AVG)SY 250 $60.00 $15,0007 REMOVE AND REPLACE FENCING (5%)LF 5,500 $50.00 $275,0008 INSTALLATION OF CATHODIC TEST STATIONS LS 1 $10,000.00 $10,000ESTIMATED SUB TOTAL$4,727,933WELL DEVELOPMENTITEMUNITNO. ITEM DESCRIPTIONUNIT QTY PRICE AMOUNT1 PUMPS (1,000 GPM) & INSTALLATIONEA 6 $15,000.00 $90,0002 FIELD WELL DEVELOPMENTLS 1 $5,000,000.00 $5,000,0003 LAND PURCHASE COSTLS 1 $45,000.00 $45,000ESTIMATED SUB TOTAL $5,135,000WATER FACILITIESITEMUNITNO. ITEM DESCRIPTIONUNIT QTY PRICE AMOUNT1 STORAGE TANKGAL 1,000,000 $0.50 $500,0002 WATER TREATMENT PLANTGPD 8,000,000 $0.50 $4,000,000$0ESTIMATED SUB TOTAL $4,500,00030-INCH TRANSMISSION MAIN COSTITEMUNITNO. ITEM DESCRIPTIONUNIT QTY PRICE AMOUNT1 MOBILIZATIONLS 1 $84,000.00 $84,0002 30-INCH D.I. WATER MAIN (OPEN CUT)LF 89,688 $95.00 $8,520,3603 30-INCH D.I. WATER MAIN (BORE)LF 72 $150.00 $10,8004 4 INCH COMBINATION AIR VALVE WITH MANHOLE EA 7 $12,000.00 $84,0005 30 INCH BUTTERFLY VALVE WITH MANHOLE EA 7 $13,000.00 $91,0006 FILTER FABRICLF 89,760 $1.00 $89,7607 CATHODE PROTECTIONLS 1 $250,000.00 $250,0008 DISINFECT WATER TRANSMISSION MAIN LF 89,760 $0.50 $44,8809 INSTALLATION CATHODE TEST STATIONSLS 1 $15,000.00 $15,00010 TRENCH SAFETYLF 89,688 $1.25 $112,110ESTIMATED SUB TOTAL $9,301,910MISCITEMUNITNO. ITEM DESCRIPTIONUNIT QTY. PRICE AMOUNT1 SURVEY (1.0 %)LS 1 $236,648.43 $236,6482 ENGINEERING (10%)LS 1 $2,366,484.33 $2,366,484ESTIMATED SUB TOTAL$2,603,133Level of Cost Projection: TOTAL CONSTRUCTION COST = $23,664,843.30 TOTAL ENGINEERING COST = $2,603,133 TOTAL= $26,267,976 15% CONTINGENCY=GRAND TOTAL =$3,940,196$30,200,000The engineer has no control over the cost of labor, materials, or equipment, or over the Contractor’s methods ofdetermining prices, or over competitive bidding or market conditions. As a result, this opinion of probableconstruction cost is based on the engineer’s experience <strong>and</strong> qualifications <strong>and</strong> represents our best judgment asdesign professionals familiar with the construction industry. The engineer cannot <strong>and</strong> does not guarantee theproposals, bids, or the construction cost will not vary from this opinion of probable cost.Page 1 of 1
APPENDIX MCaldwell County Regional Water <strong>and</strong> Waste<strong>water</strong> Planning StudyRegional Water PlanningWater Transmission Line OptionsPrepared June 2009Transmission Line 1CGENERAL DEVELOPMENTITEMUNITNO. ITEM DESCRIPTIONUNIT QTY PRICE AMOUNT1 MOBILIZATION (10%)LS 1 $3,266,540.00 $3,266,5402 SITE PREPARATION (7%)LS 1 $2,286,578.00 $2,286,5783 SEDIMENTATION AND EROSION CONTROL (5%) LS 1 $1,633,270.00 $1,633,2704 TRAFFIC MAINTENANCE (1.0%)LS 1 $326,654.00 $326,6545 REPLACING ASPHALT PAVEMENTSY 31 $90.00 $2,8006 DRIVEWAY REPLACEMENT (AVG)SY 250 $60.00 $15,0007 REMOVE AND REPLACE FENCINGLF 4,752 $50.00 $237,6008 INSTALLATION OF CATHODIC TEST STATIONS LS 1 $10,000.00 $10,000ESTIMATED SUB TOTAL$7,800,000WATER FACILITIESITEMUNITNO. ITEM DESCRIPTIONUNIT QTY PRICE AMOUNT1 STORAGE TANKGAL 1,000,000 $0.50 $500,0002 WATER TREATMENT PLANTGPD 8,000,000 $2.75 $22,000,0003 PUMPS (1,000 GPM) & INSTALLATIONEA 6 $12,000.00 $72,0004 LAND PURCHASE COSTLS 1 $30,000.00 $30,000ESTIMATED SUB TOTAL $22,600,00030-INCH TRANSMISSION MAIN COSTITEMUNITNO. ITEM DESCRIPTIONUNIT QTY PRICE AMOUNT1 MOBILIZATIONLS 1 $84,000.00 $84,0002 30-INCH D.I. WATER MAIN (OPEN CUT)LF 94,956 $95.00 $9,020,8203 30-INCH D.I. WATER MAIN (BORE)LF 84 $150.00 $12,6004 4 INCH COMBINATION AIR VALVE WITH MANHOLE EA 7 $12,000.00 $84,0005 30 INCH BUTTERFLY VALVE WITH MANHOLE EA 7 $13,000.00 $91,0006 FILTER FABRICLF 95,040 $1.00 $95,0407 CATHODE PROTECTIONLS 1 $250,000.00 $250,0008 DISINFECT WATER TRANSMISSION MAIN LF 95,040 $0.50 $47,5209 INSTALLATION CATHODIC TEST STATIONSLS 1 $15,000.00 $15,00010 TRENCH SAFETYLF 94,956 $1.25 $118,695ESTIMATED SUB TOTAL $9,800,000MISCITEMUNITNO. ITEM DESCRIPTIONUNIT QTY. PRICE AMOUNT1 SURVEY (1.0 %)LS 1 $402,000.00 $402,0002 ENGINEERING (10%)LS 1 $4,020,000.00 $4,020,000ESTIMATED SUB TOTAL$4,400,000Level of Cost Projection: TOTAL CONSTRUCTION COST = $40,200,000.00 TOTAL ENGINEERING COST = $4,400,000 TOTAL= $44,600,000 15% CONTINGENCY=GRAND TOTAL =$6,700,000$51,300,000The engineer has no control over the cost of labor, materials, or equipment, or over the Contractor’s methods ofdetermining prices, or over competitive bidding or market conditions. As a result, this opinion of probable constructioncost is based on the engineer’s experience <strong>and</strong> qualifications <strong>and</strong> represents our best judgment as design professionalsfamiliar with the construction industry. The engineer cannot <strong>and</strong> does not guarantee the proposals, bids, or theconstruction cost will not vary from this opinion of probable cost.Page 1 of 1
APPENDIX MCaldwell County Regional Water <strong>and</strong> Waste<strong>water</strong> Planning StudyRegional Water PlanningWater Transmission Line OptionsPrepared June 2009Transmission Line 2GENERAL DEVELOPMENTITEMUNITNO. ITEM DESCRIPTIONUNIT QTY PRICE AMOUNT1 MOBILIZATION (10%)LS 1 $650,987.90 $650,9882 SITE PREPARATION (7%)LS 1 $455,691.53 $455,6923 SEDIMENTATION AND EROSION CONTROL (5%) LS 1 $325,493.95 $325,4944 TRAFFIC MAINTENANCE (1.0%)LS 1 $65,098.79 $65,0995 REPLACING ASPHALT PAVEMENTSY 202 $90.00 $18,2006 DRIVEWAY REPLACEMENT (AVG)SY 1,000 $60.00 $60,0007 REMOVE AND REPLACE FENCINGLF 3,168 $50.00 $158,4008 INSTALLATION OF CATHODIC TEST STATIONS LS 1 $10,000.00 $10,000ESTIMATED SUB TOTAL$1,743,87230-INCH TRANSMISSION MAIN COSTITEMUNITNO. ITEM DESCRIPTIONUNIT QTY PRICE AMOUNT1 MOBILIZATIONLS 1 $569,389.00 $569,3892 12-INCH D.I. WATER MAIN (OPEN CUT)LF 63,080 $80.00 $5,046,4003 12-INCH D.I. WATER MAIN (BORE)LF 280 $120.00 $33,6004 4 INCH COMBINATION AIR VALVE WITH MANHOLE EA 7 $12,000.00 $84,0005 12 INCH BUTTERFLY VALVE WITH MANHOLE EA 7 $13,000.00 $91,0006 FILTER FABRICLF 63,360 $1.00 $63,3607 CATHODE PROTECTIONLS 1 $250,000.00 $250,0008 DISINFECT WATER TRANSMISSION MAIN LF 63,360 $0.50 $31,6809 INSTALLATION CATHODIC TEST STATIONSLS 1 $15,000.00 $15,00010 TRENCH SAFETYLF 63,080 $1.25 $78,850ESTIMATED SUB TOTAL $6,263,279MISCITEMUNITNO. ITEM DESCRIPTIONUNIT QTY. PRICE AMOUNT1 SURVEY (1.0 %)LS 1 $80,071.51 $80,0722 ENGINEERING (10%)LS 1 $800,715.12 $800,715ESTIMATED SUB TOTAL$880,787Level of Cost Projection: TOTAL CONSTRUCTION COST = $8,007,151.17 TOTAL ENGINEERING COST = $880,787 TOTAL= $8,887,938 15% CONTINGENCY=GRAND TOTAL =$1,333,191$10,221,128The engineer has no control over the cost of labor, materials, or equipment, or over the Contractor’s methods ofdetermining prices, or over competitive bidding or market conditions. As a result, this opinion of probable construction costis based on thePage 1 of 1
APPENDIX MCaldwell County Regional Water <strong>and</strong> Waste<strong>water</strong> Planning StudyRegional Water PlanningWater Transmission Line OptionsPrepared June 2009Transmission Line 3GENERAL DEVELOPMENTITEMUNITNO. ITEM DESCRIPTIONUNIT QTY PRICE AMOUNT1 MOBILIZATION (10%)LS 1 $400,161.90 $400,1622 SITE PREPARATION (7%)LS 1 $280,113.33 $280,1133 SEDIMENTATION AND EROSION CONTROL (5%) LS 1 $200,080.95 $200,0814 TRAFFIC MAINTENANCE (1.0%)LS 1 $40,016.19 $40,0165 REPLACING ASPHALT PAVEMENTSY 156 $90.00 $14,0006 DRIVEWAY REPLACEMENT (AVG)SY 417 $60.00 $25,0007 REMOVE AND REPLACE FENCINGLF 1,848 $50.00 $92,4008 INSTALLATION OF CATHODIC TEST STATIONS LS 1 $10,000.00 $10,000ESTIMATED SUB TOTAL$1,061,77230-INCH TRANSMISSION MAIN COSTITEMUNITNO. ITEM DESCRIPTIONUNIT QTY PRICE AMOUNT1 MOBILIZATIONLS 1 $350,929.00 $350,9292 12-INCH D.I. WATER MAIN (OPEN CUT)LF 36,680 $80.00 $2,934,4003 12-INCH D.I. WATER MAIN (BORE)LF 280 $120.00 $33,6004 4 INCH COMBINATION AIR VALVE WITH MANHOLE EA 7 $12,000.00 $84,0005 12 INCH BUTTERFLY VALVE WITH MANHOLE EA 7 $13,000.00 $91,0006 FILTER FABRICLF 36,960 $1.00 $36,9607 CATHODE PROTECTIONLS 1 $250,000.00 $250,0008 DISINFECT WATER TRANSMISSION MAIN LF 36,960 $0.50 $18,4809 INSTALLATION CATHODIC TEST STATIONSLS 1 $15,000.00 $15,00010 TRENCH SAFETYLF 36,680 $1.25 $45,850ESTIMATED SUB TOTAL $3,860,219MISCITEMUNITNO. ITEM DESCRIPTIONUNIT QTY. PRICE AMOUNT1 SURVEY (1.0 %)LS 1 $49,219.91 $49,2202 ENGINEERING (10%)LS 1 $492,199.14 $492,199ESTIMATED SUB TOTAL$541,419Level of Cost Projection: TOTAL CONSTRUCTION COST = $4,921,991.37 TOTAL ENGINEERING COST = $541,419 TOTAL= $5,463,410 15% CONTINGENCY=GRAND TOTAL =$819,512$6,282,922The engineer has no control over the cost of labor, materials, or equipment, or over the Contractor’s methods ofdetermining prices, or over competitive bidding or market conditions. As a result, this opinion of probable construction costis based on thePage 1 of 1
APPENDIX MCaldwell County Regional Water <strong>and</strong> Waste<strong>water</strong> Planning StudyRegional Water PlanningWater Transmission Line OptionsPrepared June 2009Transmission Line 4GENERAL DEVELOPMENTITEMUNITNO. ITEM DESCRIPTIONUNIT QTY PRICE AMOUNT1 MOBILIZATION (10%)LS 1 $548,305.50 $548,3062 SITE PREPARATION (7%)LS 1 $383,813.85 $383,8143 SEDIMENTATION AND EROSION CONTROL (5%) LS 1 $274,152.75 $274,1534 TRAFFIC MAINTENANCE (1.0%)LS 1 $54,830.55 $54,8315 REPLACING ASPHALT PAVEMENTSY 156 $90.00 $14,0006 DRIVEWAY REPLACEMENT (AVG)SY 417 $60.00 $25,0007 REMOVE AND REPLACE FENCINGLF 2,640 $50.00 $132,0008 INSTALLATION OF CATHODIC TEST STATIONS LS 1 $10,000.00 $10,000ESTIMATED SUB TOTAL$1,442,10330-INCH TRANSMISSION MAIN COSTITEMUNITNO. ITEM DESCRIPTIONUNIT QTY PRICE AMOUNT1 MOBILIZATIONLS 1 $482,005.00 $482,0052 12-INCH D.I. WATER MAIN (OPEN CUT)LF 52,520 $80.00 $4,201,6003 12-INCH D.I. WATER MAIN (BORE)LF 280 $120.00 $33,6004 4 INCH COMBINATION AIR VALVE WITH MANHOLE EA 7 $12,000.00 $84,0005 12 INCH BUTTERFLY VALVE WITH MANHOLE EA 7 $13,000.00 $91,0006 FILTER FABRICLF 52,800 $1.00 $52,8007 CATHODE PROTECTIONLS 1 $250,000.00 $250,0008 DISINFECT WATER TRANSMISSION MAIN LF 52,800 $0.50 $26,4009 INSTALLATION CATHODIC TEST STATIONSLS 1 $15,000.00 $15,00010 TRENCH SAFETYLF 52,520 $1.25 $65,650ESTIMATED SUB TOTAL $5,302,055MISCITEMUNITNO. ITEM DESCRIPTIONUNIT QTY. PRICE AMOUNT1 SURVEY (1.0 %)LS 1 $67,441.58 $67,4422 ENGINEERING (10%)LS 1 $674,415.77 $674,416ESTIMATED SUB TOTAL$741,857Level of Cost Projection: TOTAL CONSTRUCTION COST = $6,744,157.65 TOTAL ENGINEERING COST = $741,857 TOTAL= $7,486,015 15% CONTINGENCY=GRAND TOTAL =$1,122,902$8,608,917The engineer has no control over the cost of labor, materials, or equipment, or over the Contractor’s methods ofdetermining prices, or over competitive bidding or market conditions. As a result, this opinion of probable construction costis based on thePage 1 of 1
APPENDIX MPopulation ProjectionsWaste<strong>water</strong> FlowsProposed Plant Size0.015MGDCaldwell County Regional Water <strong>and</strong> Waste<strong>water</strong> Planning StudyRegional Waste<strong>water</strong> PlanningPackage Treatment PlantsExtended Aeration Package Treatment Plant Planning Cost Estimatein Millions of Dollars201046,3084.7230.04MGD1.0MGD0.015MGD0.04MGDEstimated Cost Per Gallon $10.0 $7.0 $1.3 $10.0 $7.0 $1.3 $10.0 $7.0 $1.3 $10.0 $7.0 $1.3Estimated Number of Plants 315 94 5 442 133 7 591 177 9 680 204 10Estimated Total Cost 47.23 33.06 6.14 66.36 46.45 8.63 88.64 62.05 11.52 102.00 71.40 13.26202065,0576.6361.0MGD0.015MGD203086,9028.8640.04MGD1.0MGD0.015MGD2040100,00010.2000.04MGD1.0MGDPopulation ProjectionsWaste<strong>water</strong> FlowsProposed Plant SizeSequencing Batch Reactor (SBR) Package Treatment Plant Planning Cost Estimatein Millions of Dollars0.01MGD2010 2020 2030 204046,308 65,057 86,902100,0004.723 6.636 8.864 10.2000.20MGD1.0MGD0.01MGD0.20MGD1.0MGD0.01MGD0.20MGD1.0MGD0.01MGD0.20MGD1.0MGDEstimated Cost Per Gallon $4.50 $0.70 $0.25 $4.50 $0.70 $0.25 $4.50 $0.70 $0.25 $4.50 $0.70 $0.25Estimated Number of Plants 3149 945 47 4424 1327 66 5909 1773 89 6800 2040 102Estimated Total Cost 21.26 3.31 1.18 29.86 4.65 1.66 39.89 6.20 2.22 45.90 7.14 2.55Notes:Population estimates based on this <strong>study</strong>Estimated cost per gallon based on EPA Waste<strong>water</strong> Technology Fact Sheet Package Plants
APPENDIX MCaldwell County Regional Water <strong>and</strong> Waste<strong>water</strong> Planning StudyRegional Waste<strong>water</strong> PlanningMultiple Regional Treatment FacilitiesMultiple Regional Treatment Facility Planning Cost EstimateServiceAreaLockhartLulingMartindalePeachCreekYearPopulationTotalWaste<strong>water</strong> Flow(MGD)Percent ofFlowTotalTreatedFlow(MGD)Cost PerGallon ($)Plant CostLineLength(ft)PipelineCost ($/ft)Total LineCostTotal PlantCost2010 46,308 4.723 40% 1.89 $3.75 $7,084,500 168,289 $125 $21,036,125 $28,120,6252020 65,057 6.636 40% 2.65 $3.75 $9,954,000 168,289 $125 $21,036,125 $30,990,1252030 86,902 8.864 40% 3.55 $3.75 $13,296,000 168,289 $125 $21,036,125 $34,332,1252040 100,000 10.200 40% 4.08 $3.75 $15,300,000 168,289 $125 $21,036,125 $36,336,1252010 46,308 4.723 35% 1.65 $3.75 $6,198,938 160,972 $125 $20,121,500 $26,320,4382020 65,057 6.636 35% 2.32 $3.75 $8,709,750 160,972 $125 $20,121,500 $28,831,2502030 86,902 8.864 35% 3.10 $3.75 $11,634,000 160,972 $125 $20,121,500 $31,755,5002040 100,000 10.200 35% 3.57 $3.75 $13,387,500 160,972 $125 $20,121,500 $33,509,0002010 46,308 4.723 20% 0.94 $3.75 $3,542,250 56,173 $125 $7,021,625 $10,563,8752020 65,057 6.636 20% 1.33 $3.75 $4,977,000 56,173 $125 $7,021,625 $11,998,6252030 86,902 8.864 20% 1.77 $3.75 $6,648,000 56,173 $125 $7,021,625 $13,669,6252040 100,000 10.200 20% 2.04 $3.75 $7,650,000 56,173 $125 $7,021,625 $14,671,6252010 46,308 4.723 5% 0.24 $3.75 $885,563 45,676 $125 $5,709,500 $6,595,0632020 65,057 6.636 5% 0.33 $3.75 $1,244,250 45,676 $125 $5,709,500 $6,953,7502030 86,902 8.864 5% 0.44 $3.75 $1,662,000 45,676 $125 $5,709,500 $7,371,5002040 100,000 10.200 5% 0.51 $3.75 $1,912,500 45,676 $125 $5,709,500 $7,622,000Notes:Population estimates based on this <strong>study</strong>Estimated cost per gallon based on EPA Waste<strong>water</strong> Technology Fact Sheet Package Plants
C O N S U L T I N G E N G I N E E R SAppendix NTexas Water Development Board Comment LetterRegarding Draft Report <strong>and</strong> Response to CommentsKlotz Associates Project No. 0972.000.000January 2010APPENDIX-NCaldwell County Regional Water <strong>and</strong> Waste<strong>water</strong> Planning StudyFinal Report
APPENDIX NTEXAS WATER DEVELOPMENT BOARD COMMENT LETTERDATED SEPTEMBER 28, 2009AND KLOTZ ASSOCIATES RESPONSES TO COMMENTS
APPENDIX NKLOTZ ASSOCIATES RESPONSES TO COMMENTSFROMTEXAS WATER DEVELOPMENT BOARD COMMENT LETTERDATED SEPTEMBER 28, 2009
APPENDIX NKlotz Associates, Inc.Responses to Texas Water Development Board Comments Dated September 28,2009TWDB Comments on Draft Final Report:1. Pages with figures/exhibits are missing page numbers while the numbering of theremaining pages overlooks the exhibit pages (e.g. exhibit 11-2). Please numbereach report page, including figures, consecutively.Klotz Associates Response:All Figures <strong>and</strong> Exhibits have been assigned page numbers.2. Report does not include information on existing impervious cover in the <strong>county</strong> orshow the locations of existing WTPs <strong>and</strong> proposed WTPs & WWTPs as requiredby contract scope of work Task 1.a. Please include this information in report.Klotz Associates Response:The following items have been added to the Report:a. Impervious Cover Exhibit 2-8b. Exhibit 7-1 has been revised to illustrate the locations of existing WTPc. Exhibit 7-2 has been added to illustrate the locations of existing WWTPd. Exhibit 12-1 has been revised to illustrate the locations of the proposedWTPe. Exhibit 13-2 has been revised to illustrate the locations of the proposedWWTF3. Report does not include information regarding the locations of major power linesas required by contract scope of work Task 1.c. Please include this information inreport.Klotz Associates Response:Exhibit 2-7 has been added to include the approximate location of the majorpower lines.4. Page ES-3: Please note within the Executive Summary that the population <strong>and</strong><strong>water</strong> dem<strong>and</strong> projections used in the <strong>study</strong> were higher than those approved byTWDB for <strong>regional</strong> <strong>water</strong> <strong>planning</strong> purposes.
APPENDIX NKlotz Associates Response:We have noted in the Executive Summary that the population <strong>and</strong> <strong>water</strong> dem<strong>and</strong>sfor our <strong>study</strong> are higher than the approved values used in TWDB <strong>planning</strong>studies.5. Section 7: The Caldwell County Water CNN Utility Map should be labeled 7-1,not 2-4.Klotz Associates Response:The Caldwell County Water CCN Map has been labeled Exhibit 7-1, WaterProduction Facilities.6. Page 8-7: Report does not appear to specify whether <strong>and</strong>/or how per capita <strong>water</strong>dem<strong>and</strong>s varied from <strong>regional</strong> <strong>and</strong> state <strong>water</strong> <strong>planning</strong> per capita <strong>water</strong> dem<strong>and</strong>estimates. Please discuss whether <strong>and</strong>/or how per capita <strong>water</strong> dem<strong>and</strong>s variedfrom TWDB approved per capita dem<strong>and</strong>s <strong>and</strong> whether <strong>and</strong>/or how this may havefurther amplified the total <strong>water</strong> dem<strong>and</strong> projections used in the <strong>study</strong> consideringthat higher population projections (due to a higher migration rate) were also beingused.Klotz Associates Response:We have added a discussion to the report explaining the source of our per capita<strong>water</strong> dem<strong>and</strong>s <strong>and</strong> why <strong>and</strong> how they differ from TWDB values.7. Page 12-6, Table 12-5: Please provide the basis for the costs estimates presentedin the table.Klotz Associates Response:Basis for cost estimates presented in Table 12-5 have been added in Appendix M.8. Exhibit 12-1 (no page): The key to the figure is missing. Please include a key thatalso indicates which are planned projects.Klotz Associates Response:A legend has been added to Exhibit 12-1 that includes planned projects.9. Page 13-9, Table 13-3: Please provide the basis for the costs estimates presentedin the table.
APPENDIX NKlotz Associates Response:A paragraph has been added to Section 13.7 to elaborate on the basis for the costestimates presented in the Table 13-3.10. Exhibit 13-4: Figure Legend does not explain what the black-outlined orangelines indicate. Please include this symbol in the legend.Klotz Associates Response:Exhibit 13-4 Legend has been revised to address the black-outlined orange lines.11. Page 14-1: The 5-page Regional Water Quality Protection Plan appears to be ast<strong>and</strong>ard list of common practices. Please prepare a <strong>water</strong> quality protection planspecific to Caldwell County’s existing characteristics <strong>and</strong> needs.Klotz Associates Response:A Water Quality Protection Plan for Caldwell County has been added. The Planincludes upgrading of waste<strong>water</strong> treatment plant facilities to produce higherquality effluent; reuse of reclaimed <strong>water</strong>, use of vegetated filter strips along<strong>water</strong>ways, <strong>water</strong> quality basins to treat runoff from areas with impervious cover<strong>and</strong> periodic inspection <strong>and</strong> recertification of OSSF systems.12. Report does not clearly present in one place the preferred general facilities planfor <strong>regional</strong>ization of <strong>water</strong> <strong>and</strong> waste<strong>water</strong> treatment that is required by contractscope of work, Task 6. Please present the preferred <strong>water</strong> <strong>and</strong> waste<strong>water</strong> plan(s),more clearly in one place in the report including associated map(s), <strong>and</strong> indicatewhether consensus was achieved on its selection per contract scope of work Task6.Klotz Associates Response:Section 16 has been added to the Report to illustrate in one place the preferredfacilities plan with a discussion on consensus.
C O N S U L T I N G E N G I N E E R SREFERENCESTexas Water Development Board. (2007). Water for Texas 2007 (Document No. GP-8-1)Texas Water Development Board. (2006). 2006 South Central Texas Regional WaterPlan. Volume I & II.Matt Berg, Mark McFarl<strong>and</strong> <strong>and</strong> Nikki Dictson. (2008). Plum Creek WatershedProtection Plan. College Station, Texas: Plum Creek Watershed Partnership.Follet, C.R. (1975) Ground<strong>water</strong> Resources of Caldwell County, Texas. (Report 12, 3 rdPrinting). Austin, Texas: Texas Water Development Board.Thorkildsen David & Price, Robert D. (1991). Ground-Water Resources of the Carrizo-Wilcox Aquifer in the Central Texas Region. (Report 332). Texas Water DevelopmentBoard.Guadalupe Blanco River Authority. (2008). The 2008 Comprehensive Annual FinancialReportDistribution System Requirements for fire Protection. American Water WorksAssociation. 1990.Steven M. Haubner. Implementation of Watershed management requirements <strong>and</strong> ModelOrdinancesGraham M. Moore. Plumbing Plan Prepared for: Hays Caldwell Public Utility Agency.Lockwood, Andrews, & Newnam, Inc. September 2007Rules of the Gonzales County Underground Water Conservation DistrictManagement Plan of the Gonzales County Underground Water Conservation DistrictPlum Creek Conservation District Ground<strong>water</strong> Management & Protection Rules.Adopted December 16, 2003.Canyon Regional Water Authority websitehttp://www.crwa.com/index.htmlGuadalupe-Blanco River Authority websitehttp://www.gbra.org/About/Default.aspxThe Portal to Texas HistoryInventory of the <strong>county</strong> archives of Texas; Caldwell County, No. 28http://texashistory.unt.edu/data/UNT/County_Inventory/meta-pth-25254.tklKlotz Associates Project No. 0972.000.000January 2010REF-1Caldwell County Regional Water <strong>and</strong> Waste<strong>water</strong> Planning StudyFinal Report
C O N S U L T I N G E N G I N E E R SREFERENCESFinal Report Predicting Effects of Urban Development on Water Quality in the Cities ofNew Braunfels, San Marcos, Seguin <strong>and</strong> Victoria. Prepared by PBSJ. November 2000Klotz Associates Project No. 0972.000.000January 2010REF-2Caldwell County Regional Water <strong>and</strong> Waste<strong>water</strong> Planning StudyFinal Report