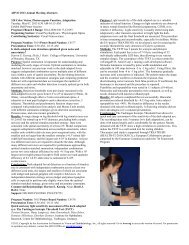
<strong>ARVO</strong> 2013 Annual Meeting Abstracts by Scientific Section/Group – <strong>Visual</strong> <strong>Psychophysics</strong> / <strong>Physiological</strong> <strong>Optics</strong>Photograph of examiner testing an adolescent participant with vernieracuity cards.Commercial Relationships: Huizi Kelly Yin, None; Barry S.Kran, None; Darick Wright, None; Donna D. Bent, None; LiDeng, None; Dale L. Mayer, NoneSupport: New England College of Optometry internal research grantProgram Number: 2771 Poster Board Number: B0025Presentation Time: 8:30 AM - 10:15 AMEvaluating the Effectiveness of Low Vision Rehabilitation inChildrenVijaya K. Gothwal, Rebecca Sumalini, Seelam Bharani. Meera and LB Deshpande Centre for Sight Enhancement, L V Prasad EyeInstitute, Hyderabad, India.Purpose: Approximately 90% of patients with visual impairment(VI) have adequate residual vision to benefit from low visionrehabilitation (LVR). However, good evidence on LVR outcomes isrequired to guide service development and improve the lives ofpeople with VI. Studies in adults with VI have demonstrated animprovement in the overall visual functioning (VF) and quality of lifeafter LVR. Nonetheless, such effects are yet to be demonstrated inchildren with VI. The aim of this study was to evaluate theeffectiveness of a multidisciplinary LVR program on VF using theLV Prasad-Functional Vision Questionnaire II (LVP-FVQ II).Methods: First-time referrals to the Centre for Sight Enhancementwere assessed before and after LVR (3-4 months). Children wereadministered the LVP-FVQ II before low vision assessment and at 3-4 months follow-up to assess the outcomes of LVR. Recently, asecond version of the LVP-FVQ (LVP-FVQ II) was developed andwas demonstrated to be a reliable and valid measure of VF usingRasch analysis. Rasch analysis was used to estimate the LVP-FVQ IIscores on an interval scale. Cohen d values were used to estimate themagnitude of the change and the standardized response mean (SRM)was selected to determine the clinical change of the LVR inducedchanges.Results: Sixty-three participants completed the rehabilitation (meanage, 11.9 years; male, 62%). Approximately one-half had retinaldisorders (48%, 30) and most were moderately visually impaired(
<strong>ARVO</strong> 2013 Annual Meeting Abstracts by Scientific Section/Group – <strong>Visual</strong> <strong>Psychophysics</strong> / <strong>Physiological</strong> <strong>Optics</strong>Purpose: To compare fixation stability in diabetic patients measuredby the laser scanning digital camera (LSDC) and the digital lightprojector camera (DLP-Cam), using standard deviation of Euclideandistance (ED) and bivariate contour ellipse area (BCEA) as metrics.Methods: Eight diabetic patients (5 male, 3 females, age 48±12 yr)were imaged at the Eastmont Wellness Center, a diabetic retinopathyscreening site within the EyePACS telemedicine network, with boththe LSDC and the DLP-Cam. LSDC and DLP-Cam have 36 and 33deg fields, respectively. Light levels at the cornea were 2 mW @ 850nm, which appeared quite dim, for the LSDC and 42 uW from thegreen LED, which was bright, for the DLP-Cam. Image buffers of 20@ 11 fps (LSDC) and 16 @ 17 fps (DLPC) frames were acquired onthe same day by the same camera operator. One eye was chosen atrandom for this analysis. Fixation stability was assessed using thecoordinates determined for image registration by the same alignmentalgorithm. The measurements in pixels were converted to minArcbefore comparing the LSDC and DLPC results by paired t-tests.Results: The standard deviation of ED for this group of patients was5.09±3.42 and 5.69±3.25 minArc for LSDC and DLP-Cam,respectively. The BCEA, which typically decreases the effect ofoutliers, was 2.43±0.41 and 2.43±0.44 log(minArc^2), for LSDC andDLP-Cam, respectively. The differences in fixation stability were notstatistically significant by either metric.Conclusions: Both imaging systems provide comparable fixationstability measures, suggesting that the brighter fundus illumination ofthe DLP-Cam compared to the LSDC does not affect fixation ability.Our alignment algorithms are able to process images taken witheither visible or near infrared fundus illumination which are known toemphasize different retinal structures.Commercial Relationships: Benno L. Petrig, Aeon Imaging LLC(E), Aeon Imaging LLC (P); Jeff Clendenon, Aeon Imaging, LLC(E); Lisa Ensman, None; Matthew S. Muller, Aeon Imaging, LLC(I), Aeon Imaging, LLC (P), Aeon Imaging, LLC (R), Aeon Imaging,LLC (S), Indiana University Research and Technology Corporation(P); Ann E. Elsner, Aeon Imaging, LLC (I), Aeon Imaging, LLC(F), Aeon Imaging, LLC (P); Glen Y. Ozawa, None; Taras V.Litvin, None; Jorge A. Cuadros, EyePACS LLC (I); Tuhin Roy,None; Danny Li, NoneSupport: R44EY018772(BLP), R44EY020017(MSM)Program Number: 2774 Poster Board Number: B0028Presentation Time: 8:30 AM - 10:15 AMDo visually impaired participants hear better? An evaluation ofself report using a modified version of Speech, Spatial andQualities of Hearing ScaleShahina Pardhan 1 , Silvia Cirstea 1 , Andrew Kolarik 2, 1 , Brian Moore 2 .1 Vision and Eye Research Unit (VERU), Anglia Ruskin University,Cambridge, United Kingdom; 2 Department of Psychology, Universityof Cambridge, Cambridge, United Kingdom.Purpose: Literature suggests that visually impaired participants mayperform better than sighted participants on auditory tasks. This ismore apparent in participants with severe visual impairment.However, it is not known whether these participants perceive theirhearing to be better than normally sighted participants. We modifiedthe Speech, Spatial and Qualities of Hearing questionnaire for use byvisually impaired participants. <strong>Visual</strong> aspects were removed from tenitems, but modifications were kept minimal, so as to maintain themeaning of the original items. The modified questionnaire addressesa large variety of auditory scenarios and assesses situations whichvisually-impaired participants find most demanding, and those whichpresent little difficulty.Methods: The modified SSQ was administered to 8 participants withsevere visual impairment but who had normal hearing. Age-matchedsighted participants with normal hearing acted as controls. Itemsassessed self report for speech comprehension in the presence orabsence of competing speech or noise, and spatial aspects of hearingincluding judgements of direction and distance. Qualities of thelistening experience such as perceived effort and sound identificationwere also assessed.Results: In the speech domain, Mann-Whitney U tests showed thatparticipants with severe visual impairment reported significantlymore difficulties (p