Visual Psychophysics / Physiological Optics - ARVO
Visual Psychophysics / Physiological Optics - ARVO
Visual Psychophysics / Physiological Optics - ARVO

You also want an ePaper? Increase the reach of your titles
YUMPU automatically turns print PDFs into web optimized ePapers that Google loves.
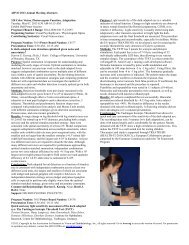
<strong>ARVO</strong> 2013 Annual Meeting Abstracts by Scientific Section/Group – <strong>Visual</strong> <strong>Psychophysics</strong> / <strong>Physiological</strong> <strong>Optics</strong>Conclusions: Zonular Capture Haptic based accommodativedisaccommodativeIOL’s demonstrate a useful range ofaccommodation and significant axial shift in a first prototype, proofof concept IOL model.Conclusions: A significant difference in the number of patients withhigh scattered light measurements were observed in the patients withfloaters and no PVD. The exact nature of this difference needs to befurther evaluated. It is possible that only floaters close to the retinalsurface are able to induce a measureable light scattering and beresponsible for the clinical manifestations.Axial ShiftCommercial Relationships: Paul M. Beer, Z Lens LLC (I), Z LensLLC (P); Paul L. Kaufman, Alcon (C), Allergan (C), Altheos, Inc(C), Bausch & Lomb (C), Amakem Therapeutics (C), Johnson &Johnson (C), Lens AR, Inc (F), Merck (C), Pfizer (C), Santen (C),WARF (F), Z Lens, LLC (F), Alcon (R), Allergan (R), Altheos, Inc(R), Bausch & Lomb (R), Amakam Therapeutics (R), Merck (R),Pfizer (R), Santen (F), Santen (R); Mary Ann Croft, Seros Medical(R), Z-Lens LLC (R); Gregg A. Heatley, None; Jared P.McDonald, None; Alex Katz, None128 Spatial Vision, <strong>Visual</strong> <strong>Psychophysics</strong> and Aging ISunday, May 05, 2013 10:30 AM-12:15 PMExhibit Hall Poster SessionProgram #/Board # Range: 568-586/C0179-C0197Organizing Section: <strong>Visual</strong> <strong>Psychophysics</strong> / <strong>Physiological</strong> <strong>Optics</strong>Contributing Section(s): Eye Movements / Strabismus / Amblyopia/ Neuro-OphthalmologyProgram Number: 568 Poster Board Number: C0179Presentation Time: 10:30 AM - 12:15 PMThe effect of posterior vitreous detachment or vitreous opacities(floaters) on straylight measurementsMiguel Castilla, Marc D. de Smet. MIOS, Lausanne, Switzerland.Purpose: To evaluate if straylight measures taken in patients withcomplaints of floaters (and no posterior vitreous detachment [PVD])are different from patients presenting with a PVD.Methods: A retrospective review of patients having undergone astraylight measurement with a C-Quant (Oculus, Germany) whopresented with a complaint of floaters or observed to have a PVDwhen examined but who did not complain of floaters. Data wascollected on age, status of the lens, and only the initial C-Quantmeasurement was analyzed if several were taken. Only patients withintact vitreous were considered in the study. Straylight measurementswere considered significant if they were above 2 standard deviations[SD] from a normative database, controlled for age.Results: The mean age for both groups was 58.58 years with an SDof 12.75 years. Thrity one eyes from 29 patients were included, 11eyes with a diagnosis of PVD, and 20 eyes with floaters. In the PVDgroup, only 5 eyes had measures above the 2 SD cutoff, while 14 of20 eyes in the floaters group met this criterion. The mean straylightvalue for the floaters group was 1.88 with an SD of 1.42 and for thePVD group of 1.24 with an SD of 0.25. The differences between bothgroups did not reach statistical significance (p=0.087).Commercial Relationships: Miguel Castilla, None; Marc D. deSmet, Thrombogenics (P), Thrombogenics (C), Sanofi (C), Bayer(C), Regeneron (C), Preceyes (R), Allergan (C), Janssens (R), GSK(C), CRL (C)Program Number: 569 Poster Board Number: C0180Presentation Time: 10:30 AM - 12:15 PM<strong>Visual</strong> findings in children with Autistic Spectrum DisorderPamela M. Anketell 1 , Kathryn J. Saunders 1 , Stephen M. Gallagher 2 ,Clare Bailey 3 , Julie-Anne Little 1 . 1 School of Biomedical Sciences,University Of Ulster, Coleraine, United Kingdom; 2 School ofPsychology, University of Ulster, Coleraine, United Kingdom;3 Community Child Health, Northern Health & Social Care Trust,Newtownabbey, United Kingdom.Purpose: Anomalous visual findings have been described in AutisticSpectrum Disorder (ASD) including both superior and reduced visualacuity (VA) (Ashwin et al. 2009, Milne et al. 2009), an increasedprevalence of strabismus (Denis et al. 1997) and reduced near pointof convergence (NPC) (Milne et al. 2009). The aim of this study wasto investigate visual findings in a large population of children withASD.Methods: Children with ASD (n=88, mean age 10.7 years ±3.1years, range 5-16 years) were recruited from a regional populationbasedregister (n=67) and special education schools (n=21). ASDdiagnosis was available from the register and classified as; Autism(AU) n=50, Asperger’s syndrome (AS) n=33, unspecified n=5. Agematchedcontrols were recruited from mainstream schools (n=204,mean age 11.5 years ±3.1 years).Monocular recognition crowded VA, presence of strabismus, NPC,fusional reserves (FR) and Frisby stereoacuity scores were assessed.Results: Table 1 presents success rates and summary statistics for alldata.Controls demonstrated slightly but significantly better VA than theASD group (Mann Whitney z=-2.49, p
<strong>ARVO</strong> 2013 Annual Meeting Abstracts by Scientific Section/Group – <strong>Visual</strong> <strong>Psychophysics</strong> / <strong>Physiological</strong> <strong>Optics</strong>for the ASD group (6.8%) [AU; 4%, AS; 12.1%] compared with thecontrol group (1.4%) (Chi-squared χ 2 (2, 287)=10.76, p
<strong>ARVO</strong> 2013 Annual Meeting Abstracts by Scientific Section/Group – <strong>Visual</strong> <strong>Psychophysics</strong> / <strong>Physiological</strong> <strong>Optics</strong>to 2.0 degrees/second in 0.2 degrees/second steps.Results: Results showed an overall improvement in the subjects’performance for all velocities. There was a significant difference inthe percentage of correct responses between static stimuluspresentation and for velocities of between 0.4 to 1.2 degrees/second(p < 0.05, One-way repeated measures ANOVA with Bonferroni posthoc tests). The average “correct response” for static stimuluspresentation was 76 ± 2 %, improving to at least 85 % for velocitiesbetween 0.4 to 1.2 degrees/second. At velocities greater than 1.2degrees/second performance was still better than for static stimuluspresentation, but showed a gradual decline with increasing speed.Conclusions: In line with previous studies stimulus motion has apositive effect on peripheral high-contrast resolution acuity.Presenting moving stimuli may benefit patients who rely onperipheral visual function, such as those with central visual field losssubsequent to AMD.Commercial Relationships: Peter R. Lewis, None; Victoria Holm,None; Karthikeyan Baskaran, None; Jorgen Gustafsson, NoneProgram Number: 575 Poster Board Number: C0186Presentation Time: 10:30 AM - 12:15 PMDistance <strong>Visual</strong> Acuity Screening of Preschoolers with HyperopiaMarjean T. Kulp 1 , Gui-Shuang Ying 2 , Jiayan Huang 2 , Maureen G.Maguire 2 , Graham E. Quinn 3 , Elise Ciner 4 , Deborah A. Orel-Bixler 5 ,Lynn A. Cyert 6 , Bruce Moore 7 . 1 College of Optometry, Ohio StateUniversity, Columbus, OH; 2 University of Pennsylvania,Philadelphia, PA; 3 Children’s Hospital of Philadelphia, Philadelphia,PA; 4 Pennsylvania College of Optometry, Salus University, ElkinsPark, PA; 5 School of Optometry, University of California, Berkeley,CA; 6 College of Optometry, Northeastern State University,Tahlequah, OK; 7 New England College of Optometry, Boston, MA.Purpose: Hyperopia has been shown to be associated with anincreased risk of amblyopia and strabismus among preschoolers. Thepurpose of this study is to compare uncorrected distance visual acuity(VA) measured with the VIP Crowded Single LEA Symbols® VATest at 5 feet (VIP 5ft Lea) in 3- to 5-year-old Head Start childrenwith versus without hyperopia.Methods: In VIP (Phase II), 1452 preschoolers were screened withthe VIP 5ft Lea test by lay screeners. All children underwentcomprehensive vision examination including threshold VA using theATS single-surround HOTV letter protocol, cover testing, andcycloplegic retinoscopy by masked examiners. Hyperopia wasdefined as >+3.25D in the most positive meridian in one or both eyes.Uncorrected distance VA in the worse eye as measured by the VIP 5ft Lea was compared for 1) children with hyperopia and thosewithout and 2) children with hyperopia plus other visual conditions(amblyopia, strabismus, astigmatism, and/or anisometropia), thosewith hyperopia alone, and those without hyperopia.Results: Uncorrected distance VA measured with the VIP 5ft Leatest was significantly different between children with hyperopia(n=182, median VA 20/50) as compared to those without hyperopia(n= 1270, median VA 20/40)(p
<strong>ARVO</strong> 2013 Annual Meeting Abstracts by Scientific Section/Group – <strong>Visual</strong> <strong>Psychophysics</strong> / <strong>Physiological</strong> <strong>Optics</strong>(sensitivity=2). It has been demonstrated that CSF acuity estimatescorrelate well with logMAR acuity (Lesmes LA, et al. IOVS2012;52:<strong>ARVO</strong> E-Abstract 4358).Because acuity is an important criterion for choosing opticalcorrection, we investigated how dioptric blur affects CSF acuityestimates obtained with the quick CSF, implemented on an iPad forconvenience.Methods: Six observers (21-46 yrs old; mean 27.5) were tested at aviewing distance of 40cm. Tests were run at self-reported correctionand additional blur conditions (+1,+2,+3,+4D). Gratings of differentfrequencies (.29-18.5cpd) and contrasts (.2-100%) were presented for250ms at 3.4deg either left or right of fixation (spatial 2AFC) andsubjects used the touch screen to respond. Each test (120 trials) lasted3-4 min. To estimate repeatability, all conditions were run again thefollowing day.Results: As expected, dioptric blur primarily affected the CSF's highfrequencyregion, and not its peak height (Fig 1). When normalizedto the lens condition with maximum acuity, CSF acuities exhibited asharp decrease across lens conditions that was not demonstrated bypeak sensitivity (Fig 2). Although contrast thresholds measured ondigital displays often exhibit ceiling effects, we reliably obtainedpeak thresholds
<strong>ARVO</strong> 2013 Annual Meeting Abstracts by Scientific Section/Group – <strong>Visual</strong> <strong>Psychophysics</strong> / <strong>Physiological</strong> <strong>Optics</strong>Presentation Time: 10:30 AM - 12:15 PMThe Effect of Exposure Duration on <strong>Visual</strong> Acuity for LetterOptotypes Depends On How <strong>Visual</strong> Acuity is DefinedJ Jason McAnany, Philip R. Nolan, Aimee Beluch. Ophthalmologyand <strong>Visual</strong> Sciences, University of Illinois at Chicago, Chicago, IL.Purpose: Increasing exposure duration improves visual acuity (VA)for letter optotypes, as defined by the standard logarithm of theminimum angle of resolution (log MAR) scale. This studydetermined the extent to which VA, expressed in terms of retinalfrequency (cycles per degree; cpd), improves with increasingduration after accounting for the object frequency informationmediating performance (cycles per letter; cpl).Methods: Log MAR VA of four visually-normal individuals (ages25 to 35) was measured for a set of tumbling E optotypes presentedon a CRT display for presentation durations ranging from 0.02 to 1.0s. The Es were either unblurred or blurred through convolution withGaussian functions of different widths (σ stim ), which permitted objectfrequency to be derived. Log MAR values were plotted as a functionof log σ stim and fit with the function: MAR = MAR 0 [1 + (σ stim /σ int ) 2 ] 0.5 , where MAR 0 and σ int set the vertical and horizontalpositions of the function, respectively. The object frequenciesmediating VA were derived from MAR 0 and σ int as: cpl =5*MAR 0 *1/(2π*σ int ). The retinal frequencies mediating VA werederived from MAR 0 and cpl as: cpd = 12*cpl/ MAR 0 .Results: Log MAR for the unblurred E decreased (VA improved)significantly (p < 0.05) by a factor of 1.6 as duration was increasedfrom 0.02 to 0.50 s, but log MAR was constant for durations longerthan approximately 0.50 s. These findings are consistent withprevious reports. Increasing the exposure duration had similar effectson log cpl, a relationship that has not been reported previously. Thatis, from 0.02 to 0.50 s, cpl decreased significantly (p < 0.05) by afactor of approximately 1.6, and was constant for longer durations.However, VA expressed in cpd was independent of exposureduration. This constancy is due to the offsetting effects of thedecrease in letter size (increase in cpd) and the decrease in cpl(decrease in cpd), as indicated in the definition of retinal frequency.Conclusions: The extent to which VA for broadband optotypesimproves with increasing exposure duration depends on how VA isdefined. If it is assumed that object frequency is independent ofduration (i.e. the log MAR scale), then VA improves as duration isincreased up to approximately 0.50 s. However, if both size andobject frequency are included in the definition of VA (i.e. cpd), thenVA is approximately independent of duration.Commercial Relationships: J Jason McAnany, None; Philip R.Nolan, None; Aimee Beluch, NoneSupport: NIH research grant R00EY019510 (JM), NIH core grantP30EY001792, and an unrestricted departmental grant from Researchto Prevent Blindness.Program Number: 580 Poster Board Number: C0191Presentation Time: 10:30 AM - 12:15 PMAssessing the Quality of Functional Vision through AdSpecsNadine Solaka 1 , Hilary Gaiser 1 , Joshua Silver 2 , Bruce Moore 1 . 1 NewEngland College of Optometry, Boston, MA; 2 Center for Vision inthe Developing World, Oxford University, Oxford, United Kingdom.Purpose: According to the RESC Studies, at least 10% of children inthe developing world could benefit from refractive correction. Lackof professional eyecare limits access to refractive correction.Adjustable glasses (AdSpecs) both measure and correct refractiveerror. A previously published study showed that AdSpecs provideclear vision when adjusted by myopic children. However, it remaineduncertain whether this complex lens system may adversely effectvisual function, especially at near. The purpose of this study was toassess near visual function through AdSpecs.Methods: 30 myopic adults 21-41 years of age were recruited fromNew England College of Optometry. Near VA was measured in M-units using a Good-Lite (#251000) near card at 40 cm. Contrastsensitivity (CS) was measured using a Mars Test (mars perceptrix) at50 cm. Lateral and vertical phoria were measured with ModifiedThorington at 40 cm. All tests were done in down gaze (45° fromprimary gaze) with both AdSpecs and habitual correction (HC).Inclusion criteria were: Hyperopia +1.50 to +4.50 D, Myopia -0.75 to-6.00 D, Astigmatism
<strong>ARVO</strong> 2013 Annual Meeting Abstracts by Scientific Section/Group – <strong>Visual</strong> <strong>Psychophysics</strong> / <strong>Physiological</strong> <strong>Optics</strong>fragment-perception was distinct from the topography of the P2elicited by probes during fragment perception, suggesting that neuralprocessing of probes differed as a function of perceptual state. Twosource localization algorithms estimated the neural generator of thedifference positivity to lie in the lateral occipital cortex (LOC), aregion associated with object perception.Conclusions: These data suggest that objects attract attention andmodulate the processing of individual elements occurring within theirboundaries, perhaps reflecting the perceptual binding of the elementsinto a unified object. Importantly, these effects were observed whenthe perceived "object" in this case emerged as a function of thefluctuating perceptual state of the viewer.Commercial Relationships: Anastasia V. Flevaris, None;Antigona Martinez, None; Steven Hillyard, NoneSupport: T32 MH 020002-11A1Program Number: 582 Poster Board Number: C0193Presentation Time: 10:30 AM - 12:15 PMDigital precise remote near visual acuity evaluation using mobiledevicesOren Yehezkel, Anna Sterkin, Maria Lev, Uri Polat. Ucansi Inc., NewYork, NY.Purpose: Our aim was to develop a tool for precise remote selfassessmentof near visual acuity in order to accurately and remotelyestimate the functional reading acuity.Methods: We used an application by Ucansi Inc., developed for iOSbasedmobile devices (iPhone, iPad, iPod), based on the technologytested both on mobile devices and PCs (electronic visual acuity,eVA). Here we present part of the data, collected on 73 volunteersthat were tested on iPhone 4, operating the application by themselves.The minimal measurable acuity is -0.18 logMAR, as determined bythe pixel size of 0.078 mm. The stimuli were matrices composed of25 letters "E" (5×5), each with a randomly chosen orientation out of 4possibilities (left, right, up or down). Two variations of inter-letterspacing within the matrix were used (0.4 and 1 letter size). The taskwas to report the orientation of the central letter. The evaluation wasperformed using a staircase measuring the minimal detectable targetsize. For each staircase, the duration of target presentation (rangingbetween 240 to 30 msec) and the inter-letter spacing were changed.The results were compared to the standard clinical near visual acuitychart (ETDRS chart-based visual acuity, cVA) and to the requiredreading addition (measured using the fused cross-cylinder test, FCC).Results: There was a significant correlation between the eVA and thecVA. Best correlation was found between monocular eVA and cVA(R=0.85, p
<strong>ARVO</strong> 2013 Annual Meeting Abstracts by Scientific Section/Group – <strong>Visual</strong> <strong>Psychophysics</strong> / <strong>Physiological</strong> <strong>Optics</strong>Isolated optotypes presented with crowding barsThe Handy Eye ChartTMCommercial Relationships: Amy K. Hutchinson, EmoryUniversity (P); Keri Stalun, None; Michael J. Lynn, None; T R.Candy, NoneSupport: Atlanta Pediatric Device ConsortiumProgram Number: 584 Poster Board Number: C0195Presentation Time: 10:30 AM - 12:15 PMInfluence of glare light on contrast sensitivity through absorptivelensesHiroshi Uozato 1, 2 , Masatsugu Kanazawa 1 . 1 Ophthalmology/<strong>Visual</strong>Science, Kitasato Univ Grad Sch of Med Sci, Sagamihara, Japan;2 Orthoptics and <strong>Visual</strong> Science, Kitasato University School of AlliedHealth Sciences, Sagamihara, Japan.Purpose: To investigate the influence of glare light in peripheralvisual field on the contrast sensitivity (CS) through absorptive lensesunder photopic and mesopic vision.Methods: The subjects were 13 healthy volunteers and accepted CSmeasurement. Its measurement was performed to use a contrast glaretester, CGT-2000 (TAKAGI SEIKO), under photopic (backgroundbrightness: 100 cd/m2) and mesopic vision (background brightness:10 cd/m2). Intensities of glare light which was indicated on 12° wereglare M (brightness: 40,000 cd/m2) or glare H (brightness: 100,000cd/m2). Binocular CS without glare light was compared with glare Mand glare H. The effect of absorptive lenses was analyzed forwavelength component: cone’s peak wavelength value throughabsorptive lenses. We defined S-, M- and L- cone’s peak wavelengthvalue as S-, M- and L- wavelength components and calculatedcorrelation coefficients between contrast sensitivity and wavelengthcomponents. Absorptive lenses were RETINEX (HOYA, CO.,JAPAN) with 5 colors: Orange - Brown (OB: luminous transmittance(LT), 12%), Orange (OR: LT, 49%), Red (RE: LT, 33%), Yellow(YE: LT, 77%), Yellow - Brown (YB: LT, 29%).Results: Compared with CS without glare light, there was no changebetween CS with glare light under photopic vision. CS, however,decreased with glare H under mesopic vision (ANOVA, Scheffé, p
<strong>ARVO</strong> 2013 Annual Meeting Abstracts by Scientific Section/Group – <strong>Visual</strong> <strong>Psychophysics</strong> / <strong>Physiological</strong> <strong>Optics</strong>Erica L. Towle 1, 2 , Michelle T. Aaron 1 , Leon N. McLin 1 , Benjamin A.Rockwell 1 . 1 711 HPW/RHDO, Air Force Research Laboratory, FortSam Houston, TX; 2 Research Apprenticeship Program, NationalResearch Council, Washington, DC.Purpose: It has been hypothesized that slight heating (1 - 3°C) ofocular tissue with a near-infrared (NIR) laser could induce temporarychanges in visual function through an effect known as thermallensing. If these visual distortions could be safely induced andcontrolled, this technology would have potential as a new form ofdevice that can temporarily alter the visual field of the observer. Apreviously completed study concluded that it was possible to safelyand temporarily interrupt visual function using the thermal lensingeffect; however, little effort was made to measure the extent of theblurring in terms of changes to a subject’s visual acuity and contrastthreshold.Methods: Ten subjects were asked to identify the orientation of a50% contrast Landolt ring while being exposed to various lasersources co-aligned with the stimulus. Each exposure lasted 0.5seconds and was within the safety limits set by the AmericanConference of Government Industrial Hygienists. With eachexposure, the size of the target was increased (from 0 logMAR) untilthe subject was able to correctly identify the location direction of theLandolt ring. Once the target was correctly identified, the current andprevious acuity levels were repeated three times to refine thethreshold of acuity. This threshold under each laser condition (none,visible only, NIR only, combined visible and NIR) was then averagedacross three sessions (days) to account for any subject variability.Results: Results show that effects of a visible only exposuressignificantly alter the subject’s ability to see targets smaller than 0.25logMAR. NIR only exposures did not significantly change thesubject’s acuity. By combining two sources, the influence of the NIRon the visible obscuration was also observed to be negligible. Severalsubjects, however, were able to correctly identify when the NIR lightwas included in the exposure by a distinct “graying” or “loss ofcontrast” of the target.Conclusions: While the blurring effect of the thermal lens was notable to obscure the target on its own, evidence suggests that a distinctloss of contrast was induced during the experiments as a result of thethermal lens introduced in the eye. This loss of contrast has thepotential to reduce visual acuity of much finer targets (high resolutionGabors), and therefore, future experiments are planned to investigatethe change in an individual’s contrast acuity in the presence of athermal lens.Commercial Relationships: Erica L. Towle, None; Michelle T.Aaron, None; Leon N. McLin, None; Benjamin A. Rockwell, None136 IOL and Crystalline lensSunday, May 05, 2013 1:00 PM-2:45 PMExhibit Hall Poster SessionProgram #/Board # Range: 826-856/B0050-B0080Organizing Section: <strong>Visual</strong> <strong>Psychophysics</strong> / <strong>Physiological</strong> <strong>Optics</strong>Program Number: 826 Poster Board Number: B0050Presentation Time: 1:00 PM - 2:45 PMStraylight in Pseudophakes for Different Intraocular Lens TypesLuuk Franssen 1 , Marrie Van der Mooren 1 , Burkhard H. Dick 2 , UlrichMester 3 , Patricia A. Piers 1 . 1 R&D, AMO Groningen BV, Groningen,Netherlands; 2 Universitätsklinikum KnappschaftskrankenhausBochum, Bochum, Germany; 3 Augenzentrum im Medizeum,Saarbrücken, Germany.Purpose: To investigate the influence of intraocular lens (IOL)design and material on straylight in pseudophakes, and to investigatestraylight in cataract patients and pseudophakes at different scatterangles.Methods: Seventy-one eyes diagnosed for cataract were implantedwith either a monofocal (spherical acrylic (N=16), aspheric acrylic(N=17), aspheric silicone (N=13)) or multifocal (silicone diffractive(N=13), acrylic diffractive (N=12)) IOL. Intraocular straylight wasmeasured preoperatively and 1 week and 3 months postoperativelywith the C-Quant (Oculus), which measures at an average straylightangle of 7 degrees. In 29 eyes, straylight was also measured with anadapted C-Quant, which measures at an average angle of 3.5 degrees.Results: The average 3-month postoperative straylight values for the3 monofocal groups were not statistically significantly different(log(s) between 1.26 and 1.37 for 7 degrees, log(s) between 1.41 and1.45 for 3.5 degrees). For 7 degrees, the average value for themultifocal group (log(s)=1.32) was almost the same as for themonofocal group (log(s)=1.31). Also for 7 degrees, 80% of thepatients had a lower straylight value at 3 months postoperativelycompared to preoperatively. The 3.5 degree average results werehigher than the 7 degree results postoperatively (pseudophakes), butnot preoperatively (cataract patients).Conclusions: For the patients implanted with monofocal IOLs,design and material did not influence the average straylight valuepostoperatively. There was also no difference found between themultifocal and monofocal groups. Cataract patients tend to have adifferent angular straylight dependence than pseudophakes.Commercial Relationships: Luuk Franssen, AMO Groningen BV(E); Marrie Van der Mooren, AMO Groningen BV (E); BurkhardH. Dick, None; Ulrich Mester, None; Patricia A. Piers, AbbottMedical <strong>Optics</strong> (E)Program Number: 827 Poster Board Number: B0051Presentation Time: 1:00 PM - 2:45 PMBinocular through-focus image quality with variouscombinations of modified monovisionGuillaume Van Der Meer 1 , Pierre-Jean Pisella 1 , Richard Legras 2 .1 Univ Hospital of Tours, France, Tours, France; 2 CNRS, Orsay,France.Purpose: To evaluate the binocular through-focus (TF) subjectivevision with various combinations of modified monovision (iedifferent profile of spherical (SA4) and secondary spherical (SA6)aberration on each eye).Methods: We used a numerical eye model to calculate theappearance of an image (ie three 0.4 logMAR size high contrastletters) viewed thought an eye taking into account of the variation ofpupil size as a function of proximity (ie 4.7mm at distance vision to3.3mm at near vision). Images were calculated for variouscombinations of SA4 and SA6 (ie SA4-0.4μm, SA4+0.4μm, SA4-0.4μm and SA6+0.2μm, SA4+0.4μm and SA6-0.2μm) and for allproximities from -5-D to 5-D with a 0.125-D step. A 3D-NVIDIAvideo device was used to simulated binocular vision by projecting adifferent image on each eye with a 120Hz frequency. TF subjectivevision was evaluated by using a grading scale (ITU-R 500recommendation) by three subjects under monocular and binocularcondition for each tested conditions (ie various combination of thefive multifocal profiles).Results: Binocular TF curves followed the best monocular curve butthere was no binocular summation of quality of vision. Binocularinhibition was greater when the difference in subjective visionbetween each eye was important. Ocular dominance affected the levelof inhibition. We calculated area under the binocular curve (AUC) toevaluate subjective quality of vision and depth-of-focus. AUCincreased when adding spherical aberrations and can even bedoubled, compared to naked eye, with reverse profile of SA4 and©2013, Copyright by the Association for Research in Vision and Ophthalmology, Inc., all rights reserved. Go to iovs.org to access the version of record. For permissionto reproduce any abstract, contact the <strong>ARVO</strong> Office at arvo@arvo.org.
<strong>ARVO</strong> 2013 Annual Meeting Abstracts by Scientific Section/Group – <strong>Visual</strong> <strong>Psychophysics</strong> / <strong>Physiological</strong> <strong>Optics</strong>SA6 between each eye (ie SA4-0.4μm and SA6+0.2μm on one eyeand SA4+0.4μm and SA6-0.2μm on the other eye). Pupil diametervariations had to be taken into account when using simulated images.The decrease of pupil size in near vision led to a better TF subjectivevision especially with combination of SA4 and SA6. Although wedistinguished two different optical performance profiles (ie (i) gooddistance vision/acceptable intermediate vision/poor near vision, and(ii) good distance vision/poor intermediate vision/good near vision)there was a good correlation (r2=0.89) between AUC and meanquality of vision at distance/intermediate and near vision.Conclusions: There is no binocular summation of quality of vision.However the use of different SA profiles on each eye especiallyreverse profile of SA4 and SA6 profile involved a better binocular TFsubjective vision.Commercial Relationships: Guillaume Van Der Meer, None;Pierre-Jean Pisella, None; Richard Legras, NoneProgram Number: 828 Poster Board Number: B0052Presentation Time: 1:00 PM - 2:45 PMInfluence of Pupil Diameter on Intraocular ScatteringMeasurements Based on Double Pass Images in Patients withDifferent Types of CataractsJaume Pujol 1 , Juan Carlos Ondategui Parra 2 , Joan A. Martinez-Roda 2 , Meritxell Vilaseca 1 , Mouafk Asaad Ammaar 3 . 1 Centre forSensors, Instruments and Systems Development (CD6),, UniversitatPolitecnica Catalunya, Terrassa, Spain; 2 University Vision Center(CUV), Universitat Politècnica Catalunya (UPC), Terrassa, Spain;3 Ophthalmology, Hospital de Terrassa, Terrassa, Spain.Purpose: To assess the influence of pupil diameter size onintraocular scattering measurements obtained from double passimages in patients with different type of cataracts.Methods: Intraocular scattering was measured using a comercialdouble-pass system (Optical Quality Analysis System, OQAS,Visiometrics, Spain) (Güell et al. J Cataract Refr Surg 2004) andquantified using Objective Scattering Index (OSI)(Artal et al. Plosone 2011; Vilaseca et al Br. J. Ophthalmol. 2012) in four groups ofpatients with cataracts (nuclear (NC), cortical (CC), posteriorsubcapsular (PSC) and cortical-nuclear mixed (CNMC)). Cataractswere classified using a LOCS III system. Measurements wereperformed using two different pupil diameters: 4mm (with andwithout cycloplegic drops) and 7mm (with cycloplegic drops), whichwere obtained using the artificial pupil of OQAS system.Results: 56,5% of the subjects were female where 48 eyes (of 55patients with cataracts). Cataract classification showed: 29 NC, 12PSC; 18 SPC and 26 CNMC). Mean ages (± SD [range]) were of68.3±8.20 (47 to 85 yr.) There are not differences in OSI valuesobtained for a pupil diameter of 4 mm either with or withoutcyclopegia. The correlations between OSI (4mm) and OSI (7mm)using cyclopegia were: NC r=0.804 (p=0.00); PSC r=0.608 (p=0.07);CC r=0.957 (p=0.00) and CNMC r=0.769 (p=0.00). OSI parametershowed a high correlation between both pupil diameters. Mean± SDOSI results for 4mm and 7mm pupil were: NC 3.7±2.2 / 6.0±3.4;PSC 3.1±1.7 / 4.8±2.0; CC 3.5±2.3 / 6.3±3.8 and CNMC 5.0±3.4 /7.4±3.5. All OSI values presented a proportional increase for eachtype of cataracts. Similar changes were obtained considering theclassification according LOCSIII system. The increase in OSI values(lower in PSC and higher in CC) probably can be due to theperipherical distribution of cataract in CC and to the central lensopacity on PSC.Conclusions: OSI results increase when pupil diameter is higher, butwe have not found difference to classify different types of cataracts.We can conclude that OSI parameter provides useful information toclassify cataracts regardless of pupil diameter. Future work will befocused on a larger number of patients with cortical and subcapsularcataracts.Commercial Relationships: Jaume Pujol, Visiometrics (P); JuanCarlos Ondategui Parra, None; Joan A. Martinez-Roda, None;Meritxell Vilaseca, None; Mouafk Asaad Ammaar, NoneSupport: “Ministerio de Educación y Ciencia”, Spain (grant n0DPI2011-30090-C02-01 and European UnionProgram Number: 829 Poster Board Number: B0053Presentation Time: 1:00 PM - 2:45 PMCapsular Adhesion to Intraocular Lens Evaluated In Vivo UsingUltralong-scan-depth Optical Coherence TomographyYinying Zhao, Jin Li, Weilin Lu, Xiaoying Xing, Fan Lu, Yune Zhao.wenzhou medical college, Wenzhou, China.Purpose: A firm capsular apposition to the intraocular lens (IOL)could inhibit lens epithelial cell proliferation and migration. Manyresearchers have focused on the design and material of the IOL.However, we found few studies evaluating the capsule-IOLinteraction in highly myopic eyes. This study was to evaluate the invivo capsular apposition to IOL in patients by ultralong-scan-depthoptical coherence tomography (OCT).Methods: It is an observational case series research. Thirty eyes from30 cataract patients were recruited at the Affiliated Eye Hospital,Wenzhou Medical College, of which 15 eyes were highly myopic(axial length >26 mm) and 15 eyes were emmetropic (22 mm
<strong>ARVO</strong> 2013 Annual Meeting Abstracts by Scientific Section/Group – <strong>Visual</strong> <strong>Psychophysics</strong> / <strong>Physiological</strong> <strong>Optics</strong>Makoto Inoue 1 , Jiro Hidaka 2 , Akito Hirakata 1 . 1 Ophthalmology,Kyorin Eye Center, Mitaka, Japan; 2 HOYA Corp., Tokyo, Japan.Purpose: To evaluate the effect of temperature in restoration ofacrylic intraocular lenses (IOLs) after injection through a cartridge.Methods: Acrylic IOLs (SA60AT; Alcon, 251; HOYA, YA-65BB;HOYA, W-60, Santen, NX-70; Santen) were loaded or preloaded in acartridge with viscoelastic material and injected into a water chamberunder temperature control at 24 or 34 C°. Wavefront analyzer(LAMBDA-X, NIMO TR0815) was used to measure the form ofIOLs. Time to restore the form of the IOLs was defined as Δcylinderpower (difference from the baseline) < 0.2 diopter.Results: All IOLs restored within 2 minutes at 34 C°. At 24 C°,SA60AT and 251 restored within 3 minutes but YA-65BB and W-60(single-piece) required 3.5 minutes and NX-70 (three piece IOL withsame material of W-60) up to 6 minutes. The central optical thicknessof NX-70 (7.0 mm diameter) was 0.865 mm and was thicker than thatof W-60 (6.0 mm diameter) at 0.640 mm. The cross section of thecartridge for NX-70 was round shape with mean diameter of 2.17 mmand that for W-60 was oval shape with 1.65 mm of mean diameter.Conclusions: Restoration of IOL was dependent on temperature.However it may depend on the thickness of IOL and inner shape ofthe cartridge.with respect to PI to the solutions of a damped harmonic oscillator.Four parameters are used to characterize the wobbling effect, i) theamplitude (i.e., the overshooting effect with respect to the stableposition of PIV), ii) the oscillation frequency, iii) the damping ratioand iv) the stationary time (the time constant of the wobbling effect).Videos were recorded in eight subjects during a series of 15 saccadicmovements performed horizontally (center-temporal) and vertically(center-up).Results: The mean value of the oscillation frequency after a saccadicwas 19 Hz (standard deviation 6 Hz) and the mean damping ratio was0.45 (SD 0.10). The average stationary time was 57 msec (SD 20msec). Given that the mean post-saccadic suppression time is around50 msec (Diamond et al, Journal of Neuroscience, 2000) the visualeffect of the lens wobbling in normal subjects will not be noticeable.Comparing vertical and horizontal movement, we only observeddifferences in the amplitude, larger in the case of the horizontalmovement (252 microns) than in the vertical upwards movement(194 microns), which perhaps reveals some gravity effects or anasymmetric distribution of tension on the lens zonule.Conclusions: A new instrument to measure crystalline lens stabilityhas been developed and successfully tested in normal subjects. It maybe useful for a wide range of future studies involving lens stability.Commercial Relationships: Juan Tabernero, None; AntonioFernández, None; Pablo Artal, AMO (C), Voptica SL (P), VopticaSL (I), AMO (F), Calhoun Vision (F), Calhoun Vision (C), AcuFocus(C)Support: Ministerio de Ciencia e Innovación, Spain (grantsFIS2010-14926 and CSD2007-00013) and Fundación Séneca(Region de Murcia, Spain), grant 4524/GERM/06Commercial Relationships: Makoto Inoue, None; Jiro Hidaka,HOYA Corporation Medical Division (E); Akito Hirakata, NoneProgram Number: 831 Poster Board Number: B0055Presentation Time: 1:00 PM - 2:45 PMStability of the human crystalline lens measured with a hightemporal resolution dynamic Purkinje-meter systemJuan Tabernero, Antonio Fernández, Pablo Artal. Laboratorio deOptica, Universidad de Murcia, Murcia, Spain.Purpose: To measure the dynamic stability of the human crystallinelens by using a custom-made new instrument that tracks the lensoscillations following a controlled saccadic eye movement (lenswobbling effect)Methods: We developed a modified prototype of a Purkinje-meterthat uses a high temporal resolution CMOS camera attached to atelecentric lens and a semicircular ring of IR LEDs placed on the lensaperture‘s rim. Saccadic eye movements of 9‘ amplitude wereinduced by two flickering visible LEDs (1 Hz) placed in a central anda peripheral position with respect to the objective-camera axis. Fourflickering orientations were possible (nasal, temporal, inferior andsuperior). The wobbling effect is a quick oscillation of Purkinjeimage PIV (posterior lens surface reflection) with respect to PI(corneal reflection) that follows immediately after a change in thedirection of gaze and is captured at high speed (400 frames perProgram Number: 832 Poster Board Number: B0056Presentation Time: 1:00 PM - 2:45 PMRotational stability of two single-piece toric acrylic intraocularlensesGernot Steinwender, Navid Ardjomand. Dept of Ophthalmology,Medical University Graz, Graz, Austria.Purpose: To assess the rotational stability of two single-piece toricacrylic intraocular lenses (IOL) during the first postoperative month.Methods: This retrospective case series included 15 eyes (14patients) with age-related cataract and corneal astigmatism ≥1.50diopters [D]. Corneal astigmatism was measured using the PentacamScheimpflug system (Oculus) and IOL biometry was performed withlaser interferometry (IOL Master). All eyes were analyzed afteruncomplicated phacoemulsification with in-the-bag implantation oftoric IOL (Hoya iSert 351; Rayner T-flex). Rotational stability of theIOL was assessed by comparison of images taken by the microscopevideo camera intraoperatively with retroillumination photographs at 1month postoperatively.Results: The overall mean absolute IOL rotation was 7.67 degrees ±5.54 (SD). The mean absolute IOL rotation was 5.60 degrees ± 3.21(SD) for Rayner T-flex IOL and 6.11 degrees ± 4.53 (SD) for HoyaiSert 351 respectively.Conclusions: Both investigated acrylic toric IOL seem to berotationally stable with just mild IOL rotation in the firstpostoperative month and can be recommended for the correction ofastigmatism during cataract surgery.Commercial Relationships: Gernot Steinwender, None; NavidArdjomand, NoneProgram Number: 833 Poster Board Number: B0057Presentation Time: 1:00 PM - 2:45 PMMulticenter clinical evaluation of an aspheric diffractivemultifocal one-piece IOLsecond).Stability is assessed by fitting the relative movement of PIV©2013, Copyright by the Association for Research in Vision and Ophthalmology, Inc., all rights reserved. Go to iovs.org to access the version of record. For permissionto reproduce any abstract, contact the <strong>ARVO</strong> Office at arvo@arvo.org.
<strong>ARVO</strong> 2013 Annual Meeting Abstracts by Scientific Section/Group – <strong>Visual</strong> <strong>Psychophysics</strong> / <strong>Physiological</strong> <strong>Optics</strong>Daniel H. Chang 1 , Elizabeth A. Davis 2 . 1 Empire Eye and LaserCenter, Bakersfield, CA; 2 Minnesota Eye Consultants, Bloomington,MN.Purpose: To evaluate clinical outcomes, patient satisfaction, andsurgeon satisfaction following bilateral implantation of theTECNIS® Multifocal 1-Piece IOL (ZMB00).Methods: On-going, prospective, open-label observational trial fromsurgeons performing cataract surgery and bilateral TECNIS®Multifocal (TMF) 1-Piece IOL implantation in qualified subjectsaged 21 years or older. All eyes had preoperative corneal astigmatismof < 1.0 D. <strong>Visual</strong> acuity (distance, intermediate, near) and patientsatisfaction questionnaires were collected at the 3-4 monthpostoperative visit. Surgeon assessment questionnaires were taken at3 months and at one year.Results: Interim data were collected on 106 subjects with a mean ageof 66.0 ± 8.1 years. Mean postoperative sphere was 0.07 ± 0.47 Dwith 0.40 ± 0.39 D of cylinder and a spherical equivalent of +0.05 ±0.47 D. Mean binocular UCVA was 20/23 at distance, 20/30 atintermediate and 20/22 at near. Mean binocular DCVA was 20/20 atdistance, 20/28 at intermediate, and 20/21 at near. The percentage ofsubjects with UCVAs of 20/32 or better was 91.8% for distance,67.7% for intermediate, and 93.8% for near. The percentage ofsubjects with DCVAs of 20/32 or better was 98.8% for distance,70.9% for intermediate, and 96.6% for near. At 3-4 monthspostoperative, 86.9% of subjects never or hardly ever use glasses,87.9% of subjects were either satisfied or very satisfied with theiroverall vision without glasses, and 81.3% of subjects would mostlikely choose this lens again. At the 3 months, 78.5% of surgeons feltcomfortable with the TMF after implanting ≤ 6 lenses, and 92.9% ofsurgeons would recommend the TMF to family, friends, andcolleagues. At one year, 86% of top enrollers were still using theTMF.Conclusions: Subjects receiving the TECNIS® Multifocal 1-PieceIOL showed high levels of satisfaction with good visual outcomes atall distances and minimal postoperative refractive error. Surgeonreportedexperience and perception of the TMF were highly positive.This experiential data further corroborates the U.S. FDA clinicalstudy results.Commercial Relationships: Daniel H. Chang, Abbott Medical<strong>Optics</strong>, Inc. (F), Abbott Medical <strong>Optics</strong>, Inc. (C), Abbott Medical<strong>Optics</strong>, Inc. (R); Elizabeth A. Davis, NoneSupport: Abbott Medical <strong>Optics</strong>, Inc.Program Number: 834 Poster Board Number: B0058Presentation Time: 1:00 PM - 2:45 PMLight Transmittance of Explanted Hydrophobic AcrylicIntraocular Lenses with Surface Light ScatteringLiliana Werner 1 , Caleb Morris 1 , Shannon Stallings 1 , Erica Liu 1 , AnneM. Floyd 1 , Andrew Ollerton 1 , Lisa Leishman 1 , Zachary Bodnar 1 ,Marcia Ong 2 , Ali Akinay 2 . 1 Ophthalmology, John A. Moran EyeCenter, University of Utah, Salt Lake City, UT; 2 Alcon Laboratories,Fort Worth, TX.Purpose: Surface light scattering on hydrophobic intraocular lenses(IOLs) is caused by hydration-related subsurface nanoglisteningswithin the acrylic IOL material. The aim of this study was toinvestigate the potential effect of surface light scattering on the lighttransmittance of single-piece hydrophobic acrylic IOLs made ofAcrySof material (Alcon) with or without blue light filter (BLF).Methods: IOLs were obtained from human cadavers (49 lenses total;36 with BLF), and from finished-goods inventory (controls). TheIOLs were explanted from the cadaver eyes and power/modelmatched to unused control IOLs. After removing proteins, the IOLswere allowed to hydrate for 24 hours at room temperature. Surfacelight scattering was then measured with a Scheimpflug camera (EAS-1000 Anterior Segment Analysis System, Nidek Ltd). Lighttransmittance was measured with a Perkin Elmer Lambda 35 UV/Visspectrophotometer (single-beam configuration with RSA-PE-20integrating sphere).Results: Hydrated scatter values ranged from 4.8 to 202.5 CCT forexplanted IOLs with BLF and 1.5 to 11.8 CCT for controls; valuesranged from 6.0 to 137.5 CCT for explanted IOLs without BLF and3.5 to 9.7 CCT for controls. In both groups, there was a tendency forincreasing scatter values with increasing postoperative time. Nodifferences in light transmittance were observed between explantedIOLs and controls for both groups of lenses (BLF IOLs: P=0.407,Paired T-Test; Non BLF IOLs: P=0.216, Wilcoxon Signed Rank Testfor Paired Data).Conclusions: Although surface light scattering of explanted lenseswas significantly higher than that of controls and appeared to increasewith time, no effect was observed on the light transmittance of singlepiecehydrophobic acrylic lenses with or without blue light filter.Commercial Relationships: Liliana Werner, Aaren Scientific (F),Abbott Medical <strong>Optics</strong> (F), Advanced Vision Science (F), AlconLaboratories (F), Anew <strong>Optics</strong> (F), Bausch & Lomb Surgical (F),Calhoun Vision (F), Innovia (F), MRI Research (C), Powervision(C), Rayner Intraocular Lenses (F), Visiogen (C); Caleb Morris,None; Shannon Stallings, None; Erica Liu, None; Anne M. Floyd,None; Andrew Ollerton, None; Lisa Leishman, None; ZacharyBodnar, None; Marcia Ong, Alcon Research (E); Ali Akinay,Alcon Researh, Ltd (E)Program Number: 835 Poster Board Number: B0059Presentation Time: 1:00 PM - 2:45 PM<strong>Visual</strong> Simulation of Retinal Images through a New AsymmetricRefractive Multifocal Intraocular Lens with Two SphericalSurfacesYuki Hidaka 1 , Kazuno Negishi 1 , Kazuhiko Ohnuma 2 , KazuhiroWatanabe 1 , Hidemasa Torii 1 , Megumi Saiki 1 , Kazuo Tsubota 1 .1 Ophthalmology, Keio University School of Medicine, Shinjuku-ku,Japan; 2 Graduate School of Engineering, Chiba University, Chiba,Japan.Purpose: To evaluate optical performance of an asymmetricrefractive multifocal intraocular lens (MIOL) using a visualsimulation system.Methods: The system consists of a lens that corresponds to a cornea,an IOL in a water cell, and a charge-coupled device (CCD) camera.The images formed by the lens can be detected by the CCD cameraand observed on the monitor of a personal computer. The aperturediameter is exchangeable in the water cell. Using this system, visualsimulations of Landolt visual acuity (VA) charts at various distanceswere performed using the MIOL (LENTIS® Mplus, Oculentis)through a 3.5-mm aperture corresponding to photopic conditions or a4.5-mm aperture corresponding to mesopic conditions. The contrastsof the gaps of large (logarithm of the minimum angle of resolution[logMAR] 0.7), medium (logMAR 0.4), and small (logMAR 0.0)Landolt VA charts in the simulated images were analyzed usingPhotoshop graphics editing software (Adobe).Results: Using the 3.5-mm aperture, the contrasts of the gaps of thelarge, medium, and small charts were 0.22, 0.1, and 0.08 at 5 meters(m) and 0.08, 0.04, and 0.02 at 0.34 m, which was the best nearfocus, respectively. Using the 4.5-mm aperture, the contrasts of thegaps of the large, medium, and small charts were 0.14, 0.07, and 0.03at 5 m and 0.07, 0.04, and 0.01 at 0.34 m, respectively. The largecharts maintained good contrast at all distances through the 3.5-mmaperture. The contrast decreased with decreasing sizes of the Landoltrings, especially at the intermediate distance (from 1-0.5 m). Through©2013, Copyright by the Association for Research in Vision and Ophthalmology, Inc., all rights reserved. Go to iovs.org to access the version of record. For permissionto reproduce any abstract, contact the <strong>ARVO</strong> Office at arvo@arvo.org.
<strong>ARVO</strong> 2013 Annual Meeting Abstracts by Scientific Section/Group – <strong>Visual</strong> <strong>Psychophysics</strong> / <strong>Physiological</strong> <strong>Optics</strong>the 4.5-mm aperture, the results showed a similar trend with degradedcontrasts compared to the 3.5-mm aperture. The typical simulatedimage had an asymmetric blur probably due to the asymmetric MIOLdesign.Conclusions: The asymmetric refractive MIOL provides goodoptical performance at all distances for large charts under photopicconditions, although the optical performance degrades especially atintermediate distance with medium and small charts or undermesopic conditions.Commercial Relationships: Yuki Hidaka, None; Kazuno Negishi,Oculentis (F); Kazuhiko Ohnuma, None; Kazuhiro Watanabe,None; Hidemasa Torii, None; Megumi Saiki, None; KazuoTsubota, AcuFocus, Inc (C), Allergan (F), Bausch Lomb Surgical(C), Functional visual acuity meter (P), JiNS (P), Kissei (F), Kowa(F), Santen, Inc. (F), Otsuka (F), Pfizer (C), Thea (C), Echo Denki(P), Nidek (F), Ophtecs (F), Wakasa Seikatsu (F), CEPT Company(P)Program Number: 836 Poster Board Number: B0060Presentation Time: 1:00 PM - 2:45 PMA novel hydrophilic intraocular lens with lateral walls to preventposterior capsular bag opacificationHiroyuki Matsushima 1 , Koichiro Mukai 1 , Satoshi Watabiki 1 , YokoKatsuki 1 , Jiro Hidaka 2 , Senoo Tadashi 1 . 1 Ophthalmology, DokkyoMedical University, Shimotsuga-Gun, Japan; 2 Hoya Surgical <strong>Optics</strong>,Tokyo, Japan.Purpose: Previous studies show that equator ring and peripheral ringprevented capsular bag opacification. And another study shows theaqueous humor inhibit lens epithelial cells development. In thisstudy, we made a novel hydrophilic intraocular lense (IOL) withlateral walls. And we evaluated the prevention of posterior capsularbag opacification (PCO) by circulating aqueous humor inexperimental rabbit studies.Methods: NY-60 (HOYA) was remodeled that having 4 lateral walls(2.8mm height, Fig. 1) to expand posterior capsule after implantinginto the lens capsule. And 8 holes around the peripheral of intraocularlens (IOL) optic and 1 each hole in center of the walls were made forrole of aqueous humor circulate into a capsular bag (aqueous humorcirculate IOL; AHC IOL). Eight weeks 6 albino rabbits weighting 2kg were prepared and phacoemulsification in 2.65mm cornealinsertion were performed. Control IOL (NY-60, HOYA) wasimplanted one eye and the AHC IOL was implanted another eye.After 1, 2 and 4 weeks, the IOL and PCO were observed using slitlump and tissue section was stained with hematoxylin-eosin andobserved under light microscope. The PCO was quantified on thebasis of the thickness of the lens epithelial cell layer on the centralsubcapsular area and compared among two groups.Results: After 2 weeks, partial PCO was observed using slit lump incontrol group; however, no significant PCO was observed in AHCgroup. The thickness of developed lens epithelial cells in center ofIOL was 59.4±67.9μm in control group and 8.3±3.2μm in AHCgroup at 4 weeks postoperatively. There is statistically significance(unpaired t-test).Conclusions: Novel AHC IOL prevents PCO in experimental rabbitstudy. A device of IOL shape without well known sharp edge mayprevent PCO.Commercial Relationships: Hiroyuki Matsushima, HOYA (C);Koichiro Mukai, None; Satoshi Watabiki, None; Yoko Katsuki,None; Jiro Hidaka, HOYA Corporation Medical Division (E);Senoo Tadashi, NoneProgram Number: 837 Poster Board Number: B0061Presentation Time: 1:00 PM - 2:45 PMCurvature Changing Accommodating IOLJim Schwiegerling, Sean J. McCafferty, William Duncan. OpticalSciences, University of Arizona, Tucson, AZ.Purpose: To demonstrate the accommodative capabilities of acurvature changing intraocular lens.Methods: We previous demonstrated a concept for anaccommodating IOL in which an elastic material is sandwichedbetween two rigid plates. One of the plates has a small aperturethrough which the soft material can be partially extruded when theplates are compressed. The extruded material takes on a roughlyparabolic shape and consequently imparts optical power to thesystem. Here, we have fabricated a prototype lens consisting of asilicone gel with refractive index of 1.38 and a durometer value of 12units on the “00” scale. The rigid portion of the IOL is fabricatedfrom PMMA. To make the IOL increase in power in response toconstriction of the ciliary muscle, the soft material needs to extrudeinto a higher index fluid. We evaluate a series of liquids, indexedmatched to the PMMA, as well as lower index fluids in the indexrange of 1.44 to 1.48.Results: Compression of 100 microns of the silicone gel over a 3 mmaperture leads to a potential accommodative amplitude of 5.3 to 9.7 Dfor the fluids examined. There is concern of the fluid diffusing intothe silicone gel and a membrane may be needed at this interface.Conclusions: he feasibility of an accommodating IOL based oncurvature change of interface between a low index silicone gel and ahigh index fluid is demonstrated. The power change of the lens modelworks with the accommodation mechanism of the eye.Commercial Relationships: Jim Schwiegerling, Alcon Research(F), Wavetec (F), Visioneering (C); Sean J. McCafferty, None;William Duncan, NoneSupport: NIH Grant EY021847Program Number: 838 Poster Board Number: B0062Presentation Time: 1:00 PM - 2:45 PMA triplet optical design for a wide range accommodative IOLEnrique-Josua Fernandez, Pablo Artal. Laboratorio de Optica,Instituto Universitario de investigación en Óptica y Nanofísica(IUiOyN), Universidad de Murcia, Murcia, Spain.Purpose: Standard intraocular lenses (IOLs) are mostly designed forfar distance vision. Although accommodative IOLs have been©2013, Copyright by the Association for Research in Vision and Ophthalmology, Inc., all rights reserved. Go to iovs.org to access the version of record. For permissionto reproduce any abstract, contact the <strong>ARVO</strong> Office at arvo@arvo.org.
<strong>ARVO</strong> 2013 Annual Meeting Abstracts by Scientific Section/Group – <strong>Visual</strong> <strong>Psychophysics</strong> / <strong>Physiological</strong> <strong>Optics</strong>proposed, the current designs only provide a modest range ofaccommodation in the best-case scenario. We describe here a newoptical design providing a wide-range of potential accommodationchange that could be incorporated in an IOL.Methods: The mechanical properties of the capsule and the zonulaare known to solely slightly change as the eye ages. The ciliarymuscle essentially maintains its function during the life span.Consequently, there is a possibility to use the accommodationapparatus to eventually transmit the subtle mechanical changes intoan IOL able for modulating its optical power. A family of opticaldesigns with a variable power, sensitive to small compression forceshas been devised. If incorporated within an IOL, power would changein response to small variations in their equatorial diameter. Regularmaterials available for standard IOL have been employed, as acrylicsand silicones.Results: The proposed design is a triplet-like optical structure thatproduces unprecedented gains between the equatorial compressionand the subsequent change in lens power. Some of the generated IOLmodels exhibit an increase in their power of up to 10 D onceimplanted in the eye. The gain is approximately 1 D/µm of equatorialcompression. The proposed IOL also permits the incorporation ofaspheric or toric surfaces for optimizing ocular spherical aberrationor correcting astigmatism. Chromatic aberration and ghost imagesanalysis have been also accomplished showing a similar performanceto monofocal standard IOLs currently available. The typical centralthickness of the triplet is 1 mm, showing an optical zone of 6 mm ofdiameter. These dimensions and the structure of the proposed hapticsmight allow the implantation of the IOL through a corneal incision of2-3 mm of diameter. The accurate control of the equatorial diameterof the accommodative IOL and its changes during accommodativeefforts can be solved by using a special intracapsular ring. Thedistribution of radial forces of the implanted IOL combined with thering showed an efficient mechanism to transmit the changes from theciliary muscle to the lens.Conclusions: A new triplet-type optical design in combination with acapsular ring for the precise control of its equatorial diameter mayhave the potential to restore accommodation after cataract surgery.Commercial Relationships: Enrique-Josua Fernandez, EP-101193(P), VOPTICA SL (P), VOPTICA SL (P), VOPTICAL SL (I),VOPTICAL SL (I); Pablo Artal, AMO (C), Voptica SL (P), VopticaSL (I), AMO (F), Calhoun Vision (F), Calhoun Vision (C), AcuFocus(C)Support: Ministerio de Ciencia e Innovación, Spain (grantsFIS2010-14926 and CSD2007-00013) and Fundación Séneca(Region de Murcia, Spain), grant 4524/GERM/06Program Number: 839 Poster Board Number: B0063Presentation Time: 1:00 PM - 2:45 PMOptical Ensemble Analysis of the Potential Optical Performanceof Aspheric Multifocal Toric IOLsHuawei Zhao. R & D, Abbott Medical <strong>Optics</strong>, Santa Ana, CA.Purpose: Contrast transfer is an important link betweenpseudophakic visual performance and intraocular lens (IOL) opticalperformance. This study uses previously validated optical ensembleanalysis (OEA, Zhao, <strong>Optics</strong> Letters) to compute pseudophakicoptical performance for acrylic aspheric IOLs with diffractivemultifocal anterior or posterior and toric on the accordingly oppositesurfaces.Methods: OEA is a Monte Carlo simulation using ZEMAX(ZEMAX Corporation, Bellevue, WA, USA) and a clinically-orientedeye model. MTF values are computed with different astigmatism,asphericity, pupil size, and IOL decentration, tilt and astigmaticorientation error. 600 eyes were simulated for two groups of asphericmultifocal toric IOLs: Group1 [aspheric-toric anterior and 4D-adddiffractive multifocal posterior surface; low refractive index (1.47)and chromatic dispersion (Abbe# = 55); full aspheric correction] andGroup 2 [aspheric apodized diffractive 3D-add anterior and toricposterior surface; high refractive index (1.55) and chromaticdispersion (Abbe# = 37); partial aspheric correction]. Three cylinderpowers were studied for each group (1.5, 2.25 and 3.0 D).Results: Ocular parameters in Groups1 and 2 agreed well withpublished clinical data and there were no statistically significantdifferences between groups (p>0.05). Ocular spherical aberration forGroup1 was statistically significantly lower than Group2.Pseudophakic optical performance declined consistently withincreasing astigmatic power in each of the two groups. Both IOLssignificantly reduced the ocular astigmatism (p0.05) and MTFs of far vision (p>0.05). MTFs of nearvision for Group1 were statistically significantly better than Group2(p
<strong>ARVO</strong> 2013 Annual Meeting Abstracts by Scientific Section/Group – <strong>Visual</strong> <strong>Psychophysics</strong> / <strong>Physiological</strong> <strong>Optics</strong>Madrid, Spain; 2 Facultad de Óptica y Optometría, Madrid, Spain;3 Hospital Universitario Miguel Servet, Zaragoza, Spain.Purpose: To assess the visual and refractive outcomes afterimplantation of the FineVision trifocal IOL (PhysIOL, Belgium).Methods: Fifty eyes of twenty five patients were implantedconsecutively with the FineVision trifocal IOL. This IOL combine 2diffractive profiles to achieve far, intermediate, and near correction.Outcome measures recorded 3 months postoperatively wereuncorrected and distance-corrected (far, near, intermediate) visualacuities, defocus curve, contrast sensitivity, reading speed (radnervissum reading chart) and patients' quality of life (visual functionquestionnaire VFQ-25, halos and glare presence, overall satisfaction).Results: At the 3-month postoperative visit, the mean sphere was -0.16 ± 0.45 D and the mean cylinder -0.50 ± 0.55. Binocularuncorrected and best corrected distance acuity were 0,10 ± 0.11 and0.03 ± 0.07 logMAR respectively. The mean binocular uncorrectedbest distance-corrected near acuity 0.11 ± 0.12 logMAR. Thephotopic defocus curve showed similar performance in intermediateand near distance with visual acuity around 0.1 logMAR. The speedreading improved from 69,7 ± 13.8 words per minute preoperativelyto 94,7 ± 43,9 in the postoperative period. The photopic contrastsensitivity was within the standard normal range. The rate ofspectacle independence for all the distances was higher than 85%. Alow percentage of patients referred significative halos or ghostimages.Conclusions: The FineVision trifocal IOL provided a satisfactoryfull range of vision with high optical quality and patient satisfaction.Commercial Relationships: Javier García Bella, None; JoseVazquez-Molinin, None; Laura Valcarce, None; Jesus Carballo,None; Juan Velez, None; Juan Carlos Sanz, None; Vicente Polo,None; Jose M. Martinez de la Casa, NoneSupport: None in the Support field belowProgram Number: 842 Poster Board Number: B0066Presentation Time: 1:00 PM - 2:45 PMMonochromatic Higher Order Aberrations in PatientsUndergoing Cataract Surgery with an Aspheric Intraocular LensDouglas A. Lyall 1, 2 , Sathish Srinivasan 2 , Lyle Gray 1 . 1 GlasgowCaledonian University, Glasgow, United Kingdom; 2 Ophthalmology,University Hospital Ayr, Ayr, United Kingdom.Purpose: To evaluate the effectiveness of an aspheric intraocularlens (IOL) in reducing monochromatic higher order aberrations(MHOA) following routine phacoemulsification and IOLimplantation.Methods: Prospective, observational study of 50 patients withvisually significant cataract who underwent uncomplicated cataractextraction and aspheric IOL implantation. Whole eye, corneal andinternal MHOA were measured before, and four weeks after, surgery.Pre and post-operative data was compared to 300 eyes of 167 agematchedpatients with no visually significant cataract. MHOAs weremeasured over a 5 mm dilated pupil diameter using the iTraceaberrometer (Tracey Technologies, Houston, TX). Zernikecoefficients were obtained to the 6th order.Results: There was a significant reduction in total root mean square(RMS) MHOA following cataract surgery (p
<strong>ARVO</strong> 2013 Annual Meeting Abstracts by Scientific Section/Group – <strong>Visual</strong> <strong>Psychophysics</strong> / <strong>Physiological</strong> <strong>Optics</strong>Commercial Relationships: Patricia A. Piers, Abbott Medical<strong>Optics</strong> (E); Sanjeev Kasthurirangan, Abbott Medical <strong>Optics</strong> (E);Basilios Sideris, AMO Groningen BV (R)Support: SNN Eoropean fund for Regional Development and theMinistry of Economic Affairs, Peaks in the Delta grants 086 and 087Program Number: 844 Poster Board Number: B0068Presentation Time: 1:00 PM - 2:45 PMPredicted changes in the cut surface and weight of colored acrylicintraocular lenses in 20 yearsKenji Kawai. Ophthalmology, Tokai Univ School of Medicine,Isehara, Japan.Purpose: We previously reported that long-term immersion ofintraocular lenses (IOLs) in water at high temperature leads to theiropacification and deterioration, depending on differences inmaterials. This study aimed to examine predicted changes in the cutsurface and weight of colored acrylic IOLs (colored IOLs) in 20years.Methods: Colored IOLs manufactured by various companies wereimmersed in 50-mL screw-tube bottles containing ultrapure water at100 degrees for 115 days (equivalent to 20 years). Externalappearance and cut surfaces were observed before and after drying ofthe IOLs, and then percent changes in weight before and aftertreatment were determined.IOLs used: We used 3 colored IOLs of each of the following 5 typesmanufactured by different companies - SN60WF (Alcon) and AN6K(KOWA) by the cast-molding method and NY-60 (HOYA), NX-60(Santen), and NS-60YG (NIDEK) by the lathe-cut method.Results: External appearance: Opacification was observed to avarying degree in all IOLs except AN6K and NX-60. After drying ata room temperature of 25 degrees for 48 hours, opacificationdisappeared in all IOLs except SN60WF.Cut surfaces: Opacification was observed to a varying degree for allIOLs. After drying, opacification was observed in all except NS-60YG.Percent changes in weight: Percent changes in weight before dryingwere unmeasurable for SN60WF, -3% for AN6K, -0.9% for NY-60,+2.3% for NX-60, and +0.6% for NS-60YG. The changes afterdrying were -1.5% for SN60WF, -9.8% for AN6K, -2.7% for NY-60,-3.7% for NX-60, and -1.5% for NS-60YG.Conclusions: There were differences in opacification among cutsurfaces of IOLs. Percent changes in weight before and after dryingdiffered by approximately 6% for AN6K and NX-60. Thesedifferences may be attributable to different methods of manufacturingacrylic resin.Commercial Relationships: Kenji Kawai, Alcon (F), KOWA (F),HOYA (F), Santen (F), NIDEK (F)The implanted ICL size and vault at 6 months follow-up werecompared with a calculated ICL size and expected vault using aregression formula reported by the same author previously.Pneumatic tonometer, specular microscopy, and ultrasoundbiomicroscopy (UBM) were performed before and after surgery toevaluate the safety by measuring intraocular pressure (IOP),endothelial cell count (ECC), ICL vault, angle opening distance at500 μm from the scleral spur (AOD 500) and trabecular-iris angle(TIA).Results: The mean follow-up period of 16 eyes of 9 patients was28.00 ± 15.03 months and preoperative ACD was 2.70 ± 0.08 mm.Preoperative and postoperative spherical equivalent (SE) were -10.27± 2.38 and -0.11 ± 0.51 diopters, respectively. Postoperativeuncorrected and best corrected visual acuity were 0.89 ± 0.24 and0.98 ± 0.19, respectively.The implanted ICL size revealed no significant difference withcalculated ICL size (independent t-test, p=.356). However,postoperative vault was 0.346 ± 0.179 mm, which was lower thanexpected vault of 0.531 ± 0.173 mm calculated by a regressionformula (independent t-test, p=.000).The pre- and postoperative mean AOD 500 were 0.379 ± 0.088 and0.267 ± 0.111 mm, and mean TIA were 33.68 ± 5.37 and 23.67 ±8.33 degrees, respectively. There were significant differencesbetween preoperative and postoperative AOD500 and TIA(independent t-test, p=.000). However, there was no severecomplication such as elevated IOP, ECC reduction, cataractformation or angle closure glaucoma.Conclusions: ICL implantation performed in the eyes with shallowACD showed good visual outcomes without severe complicationduring relatively long follow-up period. The size of ICL which wascalculated to get ideal vault of 500 to 750 μm, but it resulted in lowervault than expected. It suggests the necessity for modulation of ICLsizing method in patients with low anterior chamber depth.Program Number: 845 Poster Board Number: B0069Presentation Time: 1:00 PM - 2:45 PMSafety and clinical results of posterior chamber phakicintraocular lens implantation in low anterior chamber depthMin gyu Lee, Dong Hui Lim, Eui Sang Chung, Tae-Young Chung.Ophthalmology, Samsung medical center, Seoul, Republic of Korea.Purpose: To investigate the safety and present clinical experiences ofthe Visian implantable Collamer lens (ICL) implantation in patientswith shallow anterior chamber.Methods: This retrospective study included patients with anteriorchamber depth (ACD) lower than 2.8 mm who underwent ICLimplantation. Implanted ICL size, pre- and postoperative visualacuity, refractive errors, postoperative central vault, intra- andpostoperative complications were recorded through a medical chartreview.Commercial Relationships: Min gyu Lee, None; Dong Hui Lim,None; Eui Sang Chung, None; Tae-Young Chung, NoneProgram Number: 846 Poster Board Number: B0070Presentation Time: 1:00 PM - 2:45 PMComparative study of visual performance of two multifocalintraocular lens : two-year follow-upBalmitgère Thomas 1, 2 , Burillon Carole 2, 1 . 1 Ophthalmology, HôpitalLyon Sud, Pierre-Bénite, France; 2 Ophthalmology, Hôpital EdouardHerriot, Lyon, France.Purpose: To compare visual performance and functional tolerance oftwo multifocal diffractive intraocular lens, AcrySof ReSTOR©2013, Copyright by the Association for Research in Vision and Ophthalmology, Inc., all rights reserved. Go to iovs.org to access the version of record. For permissionto reproduce any abstract, contact the <strong>ARVO</strong> Office at arvo@arvo.org.
<strong>ARVO</strong> 2013 Annual Meeting Abstracts by Scientific Section/Group – <strong>Visual</strong> <strong>Psychophysics</strong> / <strong>Physiological</strong> <strong>Optics</strong>SN60D3 (Alcon, Inc.) and Acri.LISA 376D (Carl Zeiss Meditec),two years after cataract surgery.Methods: This monocentric, prospective, comparative study wasconducted between March 2009 and September 2011. Inclusioncriteria were patients between 50 and 80 years, no longer willing towear glasses or contact lenses for distance and near vision, andwanting a cataract surgery with bilateral implantation. Cataractsurgery was performed by the same surgeon using the samephacoemulsification technique . The parameters analyzed werebiomicroscopic examination; monocular and binocular visual acuitywith and without spectacle correction using ETDRS charts, at adistance of 4 meters for far vision, 66 centimeters for intermediatevision, 33 centimeters for near vision; monocular contrast sensitivityin photopic conditions ; glare sensitivity ; a quality of lifequestionnaire, assessing visual disturbances and dependence onglasses ; a macular OCT (Optical Coherence Tomography) analysisto exclude a maculopathy.Results: 20 eyes (10 patients) received the ReSTOR intraocular lens(IOL) and 24 eyes (12 patients) received the Acri.LISA IOL in theEdouard Herriot Hospital, Lyon. There was no statistically significantdifference (α=5%) between the two lens in terms of visual acuity forfar and near vision, for monocular and binocular vision, for contrastsensitivity and glare test . There was a statistically significantdifference in favor of Acri.LISA group for intermediate visual acuityspecially for monocular uncorrected visual acuity (p = 0.03),binocular uncorrected visual acuity(p = 0.041) and binocularcorrected visual acuity (p = 0.004) . The analysis of quality of lifequestionnaire did not find any statistically significant differencebetween the two groups and any correlation between visualdiscomfort during night driving and glare test.Conclusions: This study shows that both IOL have similar visualperformance (good level of satisfaction without eye glasses).Intermediate vision is better in the Acri. LISA group. It could beexplained by the asphericity of the lens increasing the depth of field.This study (2 years of follow-up) confirms the results of previousstudies reported in the literature (6 months and 1 year follow-up).Commercial Relationships: Balmitgère Thomas, None; BurillonCarole, NoneProgram Number: 847 Poster Board Number: B0071Presentation Time: 1:00 PM - 2:45 PMProposed novel schematic eye model for testing intraocular lensperformanceCristina Mendoza 1, 3 , Anabel S. Sanchez-Sanchez 2 , Omar Teran-Jimenez 2 , David Rivera 4 , Claudia Palacio 1 , Laura Leticia Arroyo-Muñoz 1 , Oscar Guerrero-Berger 1 , Ernesto Suaste Gomez 2 .1 Fundacion Hospital Nuestra Senora de la Luz, Mexico, Mexico;2 Centro de Investigación y de Estudios Avanzados del InstitutoPolitécnico Nacional, Mexico, Mexico; 3 Hospital General ManuelGea González, Mexico, Mexico; 4 IDISA Instituto para el DesarrolloIntegral de la Salud, Mexico City, Mexico.Purpose: How does a patient actually sees once he has been placedan intraocular lens (IOL) is a subjective evaluation sometimesdifficult to understand by the clinicians. An objective way to knowhow an IOL is performing would be to create a schematic eye thatcould show us with real images how the patient is perceiving thoseimages. Here we present a proposed novel schematic eye wheredifferent IOLs can be placed, and images of different targets can betaken in order to objectively analyze them.Methods: A schematic eye consisting of a optical microscope with acamera, a platform holding the IOL, a diaphragm that simulates thepupil with a range of aperture of 2-5mm, a pattern target (simulatingan optotype) and a light source (See figure 1) were arranged so theimages taken by the camera could be in focus with the target. In thisschematic eye, the target can be lowered, elevated or in a fixedposition, in the latter the images stay in focus while opening andclosing the diaphragm simulating a pupil, like that, the differencesfrom the same image taken with different diaphragm diameters canbe analyzed. Also at the lens position any kind of IOL can be placed.For this study parallel or concentric line targets were used, and arefractive - diffractive - apodized IOL was placed in the schematiceye and images were recorded.Results: ubjectively with 2 and 3 mm diaphragm diameters, theimages were clear in the central and peripheral areas of the image.When the diaphragm was opened wider, the central image lost qualityand the peripheral image increased its sharpness. When elevating orlowering the target a similar effect was found, with the peripheral andcentral image changing in sharpness.Conclusions: This novel schematic eye is an alternative to study theimages produced by different IOLs at variable diaphragm diameters.Images can be analyzed qualitatively and in the future with theappropriate software quantitatively. This schematic eye will helpclinicians and researchers to make better analysis of the behavior andperformance of optics systems related to cataract surgery, intraocularlenses either focal or multifocal and it variations with pupil size.Figure 1. Schematic eye and its components.Figure 2. Same image taken with different diaphragm diameters.Commercial Relationships: Cristina Mendoza, None; Anabel S.Sanchez-Sanchez, None; Omar Teran-Jimenez, None; DavidRivera, None; Claudia Palacio, None; Laura Leticia Arroyo-Muñoz, None; Oscar Guerrero-Berger, None; Ernesto SuasteGomez, NoneProgram Number: 848 Poster Board Number: B0072Presentation Time: 1:00 PM - 2:45 PM©2013, Copyright by the Association for Research in Vision and Ophthalmology, Inc., all rights reserved. Go to iovs.org to access the version of record. For permissionto reproduce any abstract, contact the <strong>ARVO</strong> Office at arvo@arvo.org.
<strong>ARVO</strong> 2013 Annual Meeting Abstracts by Scientific Section/Group – <strong>Visual</strong> <strong>Psychophysics</strong> / <strong>Physiological</strong> <strong>Optics</strong>Schematic eye model based on the regression of age-dependentchanges of the crystalline lensTakushi Kawamorita 1, 2 , Hiroshi Uozato 1, 2 , Hiroshi Sasaki 3 , YukoShibata 2 , Masatsugu Kanazawa 2 , Masakazu Hirota 2 , yoona jang 2 ,Shinji Arai 2 , Kimiya Shimizu 4, 2 . 1 Orthoptics and <strong>Visual</strong> Science,Kitasato University School, Sagamihara-shi, Japan; 2 Ophthalmologyand <strong>Visual</strong> Science, Kitasato University Graduate School of MedicalSciences, Sagamihara, Japan; 3 Ophthalmology, Kanazawa MedicalUniversity, Kahokugun, Japan; 4 Ophthalmology, Kitasato UniversitySchool of Medicine, Sagamihara, Japan.Purpose: To construct a schematic eye model based on theregression of age-dependent changes of the crystalline lens anddetermine the effects on retinal image quality of refractive index,transmittance, scattering, and lens shape.Methods: Optical simulation was performed using the optical designsoftware CodeV. Three-dimensional eye models based on a modifiedNavarro model eye were used for the simulation. We used a numberof published regression models in relation to the shape and opticalcharacteristics of crystalline lens used. Refractive error andmodulation transfer function (MTF) were calculated.Results: With increasing refractive index of the lens nucleus (from 0to +0.02), refractive errors showed a myopic shift (from 0 to -8.50D). The amount of change increased in as the lens nucleus becamesteeper. However, with increasing refractive index of the lens cortex,refractive errors showed a hyperopic shift (from 0 to +2.33 D). Asscattering angle increased (from 0 to 30 min arc), MTF decreasedoverall and the lens nucleus was affected the most. As transmittanceat the center of the lens decreased (from 100 to 10%), MTF wasincreased at 250 c/mm and decreased at 100 c/mm, indicating theeffect of apodization.Conclusions: This schematic eye model based on regression of agedependentchanges of the crystalline lens should prove useful for thecomparative evaluation of refractive correction methods and thedevelopment of new ophthalmic instruments.Commercial Relationships: Takushi Kawamorita, None; HiroshiUozato, None; Hiroshi Sasaki, None; Yuko Shibata, None;Masatsugu Kanazawa, None; Masakazu Hirota, None; yoonajang, None; Shinji Arai, None; Kimiya Shimizu, NoneSupport: JSPS KAKENHI Grant Number 24791872; KitasatoUniversity Research Grant for Young Researchers 2012Program Number: 849 Poster Board Number: B0073Presentation Time: 1:00 PM - 2:45 PMComparative Analysis of Residual Astigmatism Induced by aSingle-piece or Three-piece Intraocular Lens after CataractSurgeryJin Kwon Chung 1 , Mee Kum Kim 2 , Won Ryang Wee 2 . 1 Department ofOphthalmology, Soonchunhyang University College of Medicine,Seoul, Republic of Korea; 2 Department of Ophthalmology, SeoulNational University College of Medicine, Seoul, Republic of Korea.Purpose: To analyze comparatively lenticular astigmatism of singleandthree-piece intraocular lenses (IOLs) after cataract surgery.Methods: The medical records of the 397 patients who underwentcataract surgery with IOL implantation were retrospectivelyreviewed. Patients were divided into 4 groups depending on theimplanted IOLs (SN60WF, SN60AT, MA60BM, or AR40e). IOLinduced lenticular astigmatism was measured by differences betweenrefractive astigmatism and total corneal astigmatism as determined byFourier transformation. Vertical and horizontal astigmatic vectors(J0), oblique astigmatic vectors (J45), and overall IOL inducedastigmatic strengths were compared. Coefficients of determination ofIOL J0 and J45 values were assessed using linear regression models.Results: Mean (J0, J45) vectors were -0.19 diopters (D) and 0.06 D, -0.20 D and 0.06 D, -0.17 D and 0.09D, and -0.22D and 0.06 D in theSN60WF, SN60AT, MA60BM, and AR40e groups, respectively. Nosignificant intergroup differences were found for J0 or J45. OverallIOL induced astigmatic strengths were 0.35 D, 0.37 D, 0.42 D, and0.39 D in the SN60WF, SN60AT, MA60BM, and AR40e groups,respectively, which were without statistical significance. Linearregression analysis showed a highest R2 value for SN60AT and alowest R2 value for AR40e for the determination of refractiveastigmatism. The residual astigmatism induced by IOLs contributedto refractive astigmatism by an average of 23.8%.Conclusions: Single-piece IOLs with an aspheric optic seemed to becomparable in terms of functional stability with three-piece IOLs interms of inducible residual astigmatism.Commercial Relationships: Jin Kwon Chung, None; Mee KumKim, None; Won Ryang Wee, NoneProgram Number: 850 Poster Board Number: B0074Presentation Time: 1:00 PM - 2:45 PMImpact of Ultrasound Biomicroscopy (UBM) versus White-to-White (WTW) measurement on sizing of Visian ImplantableCollamer Lens (ICL) and Residual Postoperative RefractionPuneet Panda 1 , Ann Ostrovsky 2 , Scott E. Brodie 1 , Mark Speaker 2 .1 Ophthalmology, Mount Sinai Medical Center, New York, NY;2 Laser and Corneal Surgery Associates, PC, New York, NY.Purpose: The aim of this work is to compare residual postoperativerefractive error after implantation of Visian Implantable CollamerLens (ICL) in patients having the lenses sized with either UltrasoundBiomicroscopy (UBM) or white-to-white (WTW) measurements, andto determine if the residual refraction correlates with amount ofpostoperative lens vault.Methods: This cohort study included 33 eyes that underwent VisianICL implantation. Sulcus-to-sulcus (STS) distances were determinedusing Ultrasound UBM in 23 eyes and with caliper assisted white-towhite(WTW) measurements in 10 eyes. Manifest refractions(spherical equivalents) and central lens vaults were comparedbetween the two groups at the postoperative month 1 visit, using twosamplet-tests.Results: The pre-operative mean spherical equivalent (MSE) for all33 patients was -10.97 diopters (D) (range: -5.37 D to -17.13 D). Thepre-operative MSE was -10.18D for the UBM group, and -12.78D forthe WTW group, respectively. The postoperative MSE was -0.43+/-0.43D for the UBM group and -0.85 +/-0.53D for the WTW group(p=0.02). Postoperative mean central vault height was 495 +/- 167umin the UBM group and 710 +/- 250um in the WTW group (p>0.05).Conclusions: This study suggests that UBM valuation of STSdistance results in more precise sizing of the ICL implant andconsequently in more accurate refractive outcomes. Effective lensposition, reflected by postoperative lens vault may be a factor inpostoperative refractive outcome. Residual refractive error was oftenthe result of astigmatism in some patients.Commercial Relationships: Puneet Panda, None; Ann Ostrovsky,None; Scott E. Brodie, None; Mark Speaker, NoneProgram Number: 851 Poster Board Number: B0075Presentation Time: 1:00 PM - 2:45 PMMeasurement of the intraocular scattering in cataractouspatients, using different instruments and parameters.Comparative studyJuan Carlos Ondategui Parra 1, 2 , Lorena Mateos-Pena 1, 3 , Joan A.Martinez-Roda 1, 2 , Montserrat Arjona 1, 3 . 1 <strong>Optics</strong> and Optometry,Politechnical Univ of Catalonia, Terrassa, Spain; 2 University VisionCenter (CUV), Terrassa, Spain; 3 Center for Sensors, Instruments andSystems Development (CD6), Terrassa, Spain.©2013, Copyright by the Association for Research in Vision and Ophthalmology, Inc., all rights reserved. Go to iovs.org to access the version of record. For permissionto reproduce any abstract, contact the <strong>ARVO</strong> Office at arvo@arvo.org.
<strong>ARVO</strong> 2013 Annual Meeting Abstracts by Scientific Section/Group – <strong>Visual</strong> <strong>Psychophysics</strong> / <strong>Physiological</strong> <strong>Optics</strong>Purpose: To perform clinical measurements of intraocular scatteringin cataractous patients bymeans of different available commercial instruments that havebecome common in clinical practiceMethods: Intraocular scattered light was measured by means of twodifferent available commercial instruments: the CQuant system(Oculus), which provides an absolute intraocular scattering value(log(s)) (Van der Berg et al Ophthal. Physiol Opt. 2009), and theOQAS (Visiometrics), which uses the Objective Scatter Index (OSI)parameter (Artal el al. Plos One 2011) obtained from the double-passretinal image.78 cataractous eyes of 52 patients were included in the study (37 righteyes, and 41 left eyes), 41 female and 37 male with a mean ± SD inage of 68.24 ± 8.3 years (range: 47 to 85 years), spherical manifestrefraction ranged from -8.00 to +5.75D and the cylinder from 0.00 to3.00D, best spectacle-corrected visual acuity in the logMAR scale of0.17±0.27 (1.25 to -0.20). The grade and type of cataract was: 24eyes of nuclear cataract (30.4%), 27 of mixed nuclear (34.2%), 9 eyesof cortical (11.4%) and 18 of posterior subcapsular (24.1%). CSF wasalso measured using CSV-1000 (Vector VisionResults: Considering all types of cataract, the Pearson correlationbetween log(s) and OSI is statistically significant (r=0.339 andp=0.002). For high degree of cataract and high OSI values (OSI>8)inconsistencies appear (normally low values of log(s)). Removingthis values a better correlation (r=0.559 and p
<strong>ARVO</strong> 2013 Annual Meeting Abstracts by Scientific Section/Group – <strong>Visual</strong> <strong>Psychophysics</strong> / <strong>Physiological</strong> <strong>Optics</strong>George Beiko, AMO (C); Patricia A. Piers, Abbott Medical <strong>Optics</strong>(E)Program Number: 854 Poster Board Number: B0078Presentation Time: 1:00 PM - 2:45 PMEvaluation of the Impact of Scatter in Pseudophakic Eyes withGlisteningsAnand Doraiswamy 1 , Edward DeHoog 2 . 1 Research andDevelopment, Advanced Vision Science Inc, Santa Barbara, CA;2 Optical Engineering & Analysis LLC, Grants Pass, OR.Purpose: To evaluate the impact of light scatter from glistenings inpseudophakic eye modelsMethods: A pseudophakic eye model is constructed in ZEMAXusing established eye models. The lens is optimized for apolychromatic MTF for field angles 0, 1.4 and 2 Degreescorresponding with Foveal vision. The modeling and evaluation ofscatter and image resolution (MTF) are performed for variousmaterials (hydrophobic acrylic, PMMA) for various size and grades(density) of glistenings, all under scotopic and photopic conditions.Results: Results from the evaluation demonstrate that light scatterincreases and MTF decreases with increase in glistening density forboth materials. The difference in index of refraction between thecavitations filled with water and the IOL material causes the scatter.As predicted by Mie theory as the relative difference between thescatterer and media increases the amount of scatter will increase. Sizeof glistenings/cavitations also plays a crucial role in the extent oflight scatter and loss of MTF. 2 micron sized glistenings were foundto more significant than 200 micron sized glistenings in influencingresolution of image.Conclusions: Incorporation of scatter metrics into a model eyeallows us to learn more about the impact of various phenomena onquality of vision. Mathematical modeling demonstrated thatglistening can have a significant effect on scatter and resolution ofimage. Smaller cavitations and larger density have a morepronounced effect on the MTF than larger cavitations and smallerdensity. The effect is more pronounce in higher index materials withglistenings. Further evaluation will focus on the effect of surfacehaze, and more importantly the role of neuroadaptation that maydepress the predicted outcomes in-vivo.Purpose: The purpose of the study is to combine the straylight levelsof IOLs measured with a method for small and a method for largeforward scatter position angles. The straylight levels were determinedfor intraocular lenses (IOLs) with different designs and materials.Methods: IOLs were measured on two different lab-based set-ups: 1)for forward scatter positions between 0.6 and 2 degrees 2) forforward scatter positions up to 30 degrees. In both cases the IOL wasplaced in a saline filled cuvette on an optical bench set-up. A CCDcamera was used to measure the line spread functions from which theangular dependent straylight parameters were then calculated. Thestraylight measured using the two methods were then combined inorder to determine the magnitude over the entire angular range.Using this method IOLs made from 4 different materials (2hydrophobic and 2 hydrophilic acrylics) and 3 different designs(spherical monofocal, aspheric monofocal and diffractive multifocal)were measured and compared. Additionally, the measured straylightlevels were compared to the levels published for a 20 and 70 year oldhuman crystalline lens.Results: All monofocal IOLs with the same type of optical designshow comparable straylight parameters, both for small and largeforward scatter angles.At a forward scatter angle of 2° the average value for the straylightparameter of diffractive multifocal lenses is 4.5. For an angle of 7.5°the average value for the same type of lenses is 1.2.Irrespective of material or design, the amount of straylight is reducedfor larger forward scatter angles. All IOLs have a straylightparameter of approximately 1.0 for angles of 10° and larger. For anangle larger than 7.5° all IOLs have a straylight level below that of a20-year old human crystalline lens.Conclusions: Straylight parameter results from both set-ups can becombined to determine the straylight profile of an IOL over anangular range from 0.6 to 30 degrees. IOL design has more influenceon the height of the straylight parameter than the IOL material does.IOL straylight parameters get smaller as the measurement anglesincrease. The straylight parameter of all IOLs measured isindependent of design parameters for angles larger than 10°.Commercial Relationships: Michelle Langeslag, AMO GroningenB.V. (E); Marrie Van der Mooren, AMO Groningen BV (E);Patricia A. Piers, Abbott Medical <strong>Optics</strong> (E); Luuk Franssen,AMO Groningen BV (E)Commercial Relationships: Anand Doraiswamy, Advanced VisionScience Inc. (E); Edward DeHoog, Advanced Vision Science (C)Program Number: 855 Poster Board Number: B0079Presentation Time: 1:00 PM - 2:45 PMIn vitro straylight levels for IOLs across forward scatter positionsup to 30 degreesMichelle Langeslag, Marrie Van der Mooren, Patricia A. Piers, LuukFranssen. Research, AMO Groningen BV, Groningen, Netherlands.Program Number: 856 Poster Board Number: B0080Presentation Time: 1:00 PM - 2:45 PMOptical simulation for sub-surface nano glisteningYoriko Takahashi 1 , Takushi Kawamorita 2 , Norihiro Mita 1 , NatsukoHatsusaka 1 , Eri Shibuya 1 , Eri Kubo 1 , Hiroshi Sasaki 1 .1 ophthalmology, Kanazawa Medical University, Ishikawa, Japan;2 Orthoptics and <strong>Visual</strong> Science, University School of Allied HealthSciences, Sagamihara, Japan.Purpose: To investigate the effect of sub-surface nanoglistening(SSNG)in hydrophobic acrylic intraocular lens (IOL) onirradiance, forward light scattering and imaging characteristics ofretina by optical simulation.Methods: To simulate the effect of SSNG we used optical designsoftware LightTools and CODE V (Synopsis) to evaluate the peakvalue of irradiance on retina, forward light scattering, and themodulation transfer function (MTF) with Liou-Brenann model eye(JOSA, 1997). The physicality and shape of IOL was set as acrylicIOL (SN60AT, Alcon). Ong et al (JCRS, 2012) found in explantedacrylic IOLs with severe SSNG, particles of diameter 150 nm locatedup to 60μm from the surface of the anterior and posterior side of theIOL at a volume ratio of SSNG particle, which corresponds to thedensity, of 0.05%. In the present optical simulation, particle diameter©2013, Copyright by the Association for Research in Vision and Ophthalmology, Inc., all rights reserved. Go to iovs.org to access the version of record. For permissionto reproduce any abstract, contact the <strong>ARVO</strong> Office at arvo@arvo.org.
<strong>ARVO</strong> 2013 Annual Meeting Abstracts by Scientific Section/Group – <strong>Visual</strong> <strong>Psychophysics</strong> / <strong>Physiological</strong> <strong>Optics</strong>and volume ratios were set at 100 nm, 150 nm and 200 nm and 0%,0.05%, 0.1%, 0.2%, 0.5%,1.0%, 2.0%, 5.0% and 10.0%.Results: Peak value irradiance reduced with increased volume ratioand particle size of SSNG. At volume ratio 0.05%, peak values ofirradiance for SSNG particle diameters 100nm, 150nm and 200nmreduced by 0.7%, 1.8% and 2.9%, respectively, compared with thoseat volume ratio 0% (no SSNG). At volume ratio 0.1%, peak values ofirradiance for SSNG particle diameters 100nm, 150nm and 200nmreduced by 1.5%, 3.6% and 5.7%, respectively. Forward lightscattering increased with increased size of SSNG particle and volumeratio. MTF did not change with increased size of SSNG particle andvolume ratio.Conclusions: Although SSNG in this condition setting slightlyincreased forward scattering and reduced irradiance, there was noeffect on the characteristics of retinal imaging. These results suggestthat the effect of SSNG on visual function is very slight in eyeswithout severe retinal diseases.Commercial Relationships: Yoriko Takahashi, None; TakushiKawamorita, None; Norihiro Mita, None; Natsuko Hatsusaka,None; Eri Shibuya, None; Eri Kubo, None; Hiroshi Sasaki, Nonepredicted vs. measured change of acuity did not differ significantlyfrom 1 (α=0.05) for 2 of the 3 metrics: logNS (p=0.28, Fig.2) andlogVSX (p=0.13, Fig.3).Conclusions: One can confidently use logNS or logVSX to designwavefront guided corrections that minimize the impact of registrationuncertainty on visual acuity.218 Aberrations, Image Quality and <strong>Visual</strong> PerformanceMonday, May 06, 2013 8:30 AM-10:15 AMTCC LL 4/5 Paper SessionProgram #/Board # Range: 1279-1285Organizing Section: <strong>Visual</strong> <strong>Psychophysics</strong> / <strong>Physiological</strong> <strong>Optics</strong>Program Number: 1279Presentation Time: 8:30 AM - 8:45 AMOptical quality metrics predictive of visual acuity for the designof wavefront guided corrections in the presence of dynamicregistration uncertaintyYue Shi, Raymond A. Applegate, Ayeswarya Ravikumar, Harold E.Bedell. College of Optometry, University of Houston, Houston, TX.Purpose: When building a wavefront guided contact lens correctionfor highly aberrated eyes we would like to achieve the best visualacuity given dynamic registration uncertainty. To optimize the designof such a lens correction, it is useful to have optical quality metricsthat are highly correlated with and predictive of visual acuity. Thepurpose here is to find optical quality metrics that are highlycorrelated with and predictive of acuity given the unusual aberrationstructures generated by misalignment of wavefront guidedcorrections.Methods: Residual aberrations were generated by allowing 4correction designs (3 wavefront guided and 1 sphero-cylinder foreach eye) to undergo horizontal, vertical and rotary motion withrespect to 3 keratoconic eyes (KC) for 2 pupil sizes (4 and 5mm).Then 77 aberrations were selected based on their log visual Strehlwith the expectation that they would induce up to at least 5 lines lossof acuity [JOV, 12:1-13, 2012]. The point spread functions of theselected aberrations were convolved with unaberrated logMARacuity charts to generate blurred charts, which were presentedmonocularly to 3 normal chart-readers with 20/15 best correctedacuity. For each chart, visual acuity was measured up to 5th lettermissed through a 3 mm pupil placed conjugate and centered with thechart-reader’s dilated pupil. The measured change of acuity withrespect to the unaberrated chart was regressed against the changes ofacuity predicted by 29 optical quality metrics [JOV, 12:1-13, 2012].Results: Regression analysis revealed that only 3 of the 29 metrics(Fig.1) predicted change of measured logMAR acuity with acoefficient of determination (R 2 ) of at least 0.9: logNS (R 2 =0.96),logVSX (R 2 =0.96), and logVSMTF (R 2 =0.90). The slopes ofFig. 1: R 2 values of 29 metrics in the regressions.Fig. 2&3: Regressions of measured and predicted change of acuity bylogNS or logVSX. 3 data symbols: aberrations generated in 3 KCeyes. Error bars: 1 standard deviaiton of measeured change of acuityby 3 chart-readers.©2013, Copyright by the Association for Research in Vision and Ophthalmology, Inc., all rights reserved. Go to iovs.org to access the version of record. For permissionto reproduce any abstract, contact the <strong>ARVO</strong> Office at arvo@arvo.org.
<strong>ARVO</strong> 2013 Annual Meeting Abstracts by Scientific Section/Group – <strong>Visual</strong> <strong>Psychophysics</strong> / <strong>Physiological</strong> <strong>Optics</strong>Commercial Relationships: Yue Shi, None; Raymond A.Applegate, University of Houston (P); Ayeswarya Ravikumar,None; Harold E. Bedell, NoneSupport: NEI 5R01EY008520; NIH/NEI 5R01EY019105; NIH/NEIP30 EY 07551Program Number: 1280Presentation Time: 8:45 AM - 9:00 AMInfluence of aberration-induced blur on contrast sensitivity:comparison of different optotype sizesJens Buehren 1 , Hendrik Jungnickel 2, 3 , Wolfgang Raab 1 , DanielWeigel 3 , Michael Gebhardt 2 , Richard Kowarschik 3 , Thomas Kohnen 1 .1 Dept of Ophthalmology, Goethe University Frankfurt, Frankfurt amMain, Germany; 2 SciTec Department, Ernst Abbe University ofApplied Sciences, Jena, Germany; 3 Institute for Apllied <strong>Optics</strong>,Schiller University Jena, Jena, Germany.Purpose: To compare the decrease of contrast sensitivity (CS) due todefocus and higher-order aberration (HOA) blur measured withoptotypes of different size.Methods: Thirty-three emmetropic healty volunteers were included.In a first experiment (defocus blur), CS was measured in 31 eyes.Experimental fogging was performed with spherical trial lenses of 0,+0.25, +0.5 and +0.75 diopters (D). In a second experiment (HOAblur), CS was measured in 3 eyes at an adaptive optics (AO) visualsimulator. Besides the correction of lower-order aberrations (LOA)and full correction, subjects were presented 6 wavefront errors ofdifferent blur strength and characteristics (3 keratoconus eyes, 3 post-LASIK eyes). In total, 8 different wavefront errors with a VSOTF(visual Strehl ratio based on the optical transfer function) range of -0.05 to -1.70 log units were presented. In both experiments, CS wasmeasured with Landolt rings of 1.3 and 0.3 logMAR using FrACTsoftware. The impact of defocus blur (D) or HOA blur (VSOTF) onCS was assessed using linear regression analysis. The regressioncoefficient b and the coefficient of determination R 2 reflect thesensitivity of the CS contrast test to aberration-induced blur.Results: Experiment 1: Unfogged photopic CS was 1.93±0.06 logCS(1.3 logMAR) and 1.56±0.05 logCS (0.3 logMAR). Regressioncoefficients were higher for the 0.3 logMAR (b=-0.88, R 2 =0.70) thanfor the 1.3 logMAR Landolt ring (b=-0.39, R 2 =0.28). Experiment 2:CS was 1.98±0.17 (0.3 logMAR optotype: 0.95±0.14) log units withfull AO correction. Also in this experiment, CS was more sensitive tooptical blur if measured Landolt rings of 0.3 logMAR (b=0.63,R 2 =0.74) compared to those of 1.3 logMAR (b=0.34, R 2 =0.34).Conclusions: CS tests with large optotypes such as the Pelli-Robsontest may not pick up subtle, yet notable aberration-induced changes inretinal image quality. Therefore, for the assessment of effects ofoptical aberrations, CS testing should be performed at higher spatialfrequencies (e.g., 0.3 logMAR Landolt ring).Commercial Relationships: Jens Buehren, None; HendrikJungnickel, None; Wolfgang Raab, None; Daniel Weigel, None;Michael Gebhardt, None; Richard Kowarschik, None; ThomasKohnen, NoneSupport: Federal Ministry for Education and Research (BMBF)01EZ0608Program Number: 1281Presentation Time: 9:00 AM - 9:15 AM<strong>Visual</strong> performance under natural, corrected and Adaptive<strong>Optics</strong> induced astigmatism: meridional and adaptational effectsMaria Vinas 1 , Pablo De Gracia 1 , Carlos Dorronsoro 1 , LucieSawides 1 , Gildas Marin 2 , Martha Hernandez 2 , Susana Marcos 1 .1 <strong>Visual</strong> <strong>Optics</strong> & Biophotonics Lab, Instituto de Optica, CSIC,Madrid, Spain; 2 R&D, Vision Science Department, EssilorInternational, Saint-Maur, France.Purpose: To study the extent to what prior adaptation to astigmatismaffects visual performance, whether this effect is axis-dependent, andthe time-scale effect of potential changes in visual performance in thepresence of astigmatism following its correction. To study whetherthe effect of possible positive interactions of aberrations (astigmatism& coma) on visual performance might be altered after long-termadaptation to correction of astigmatism.Methods: Measurements of visual acuity (VA) were performedunder induction of astigmatism and a combination of astigmatism andcoma, while controlling the low and high order aberrations (HOA) ofthe subject with an Adaptive <strong>Optics</strong> (AO) system, in 25 subjectsclassified in 3 groups: non-astigmats, habitually-corrected anduncorrected astigmats. Astigmatism (1.00D) was induced at 3different orientations: at the natural axis, at the perpendicularorientation, and at 45deg for astigmats, and at 0, 90 and 45deg fornon-astigmats. Experiments were also performed with coma (0.41µmat a relative angle of 45deg) combined with the mentionedamount/orientations of astigmatism. VA was measured in a total of14 different conditions, using an 8-Alternative Forced Choice(8AFC) procedure with tumbling E letters and a QUEST algorithm.Uncorrected astigmats were provided with proper astigmaticcorrection immediately after the first session. Measurements wereperformed during 6 months following correction.Results: In non-astigmats, inducing astigmatism at 90deg, under fullAO correction, produced a statistically (p
<strong>ARVO</strong> 2013 Annual Meeting Abstracts by Scientific Section/Group – <strong>Visual</strong> <strong>Psychophysics</strong> / <strong>Physiological</strong> <strong>Optics</strong>neural plasticity in these eyes, improving their visual benefit.Methods: A large-stroke AO vision simulator was employed to trainthe worse eye of 2 KC subjects in a contrast detection test undercomplete aberration correction with AO. Prior to training, visualacuity (VA) and contrast sensitivity (CS) at 4, 8, 12, 16, 20, 24 and28 c/deg were measured in both eyes of subjects with AO correctionfor a 6mm pupil. The spatial frequency requiring 50% contrast fordetection with AO correction was picked as the training frequency.Subjects were required to train on a contrast threshold task with AOcorrection for 1 hour each for 5 consecutive days. During eachtraining session, 800 trials of threshold CS measurement at thetraining frequency with AO were conducted. The same pre-trainingmeasurements were repeated after the 5 training sessions.Results: Optical quality with AO was confirmed to be similar preand post-training and across training sessions. After training, CS withAO improved by a factor of 1.91 (range: 1.77-2.04) and 1.75 (range:1.22-2.34) on average over spatial frequencies in the two subjects. Inboth subjects, the benefit in CS was measured across a broad range ofspatial frequencies, i.e. at frequencies lower and higher than the oneemployed during training. In both subjects, this perceptual learningeffect with gratings transferred to letter VA, improving it by 1.5 lines(0.04 to -0.1 logMAR) and 1.3 lines (-0.02 to -0.15 logMAR)respectively. Inter-ocular transfer of training was also observed. Theuntrained eye’s CS was improved by a factor of 1.57 on averageacross spatial frequencies and VA by 0.8 lines (-0.01 to -0.09logMAR) in one of the two subjects with AO.Conclusions: The improvements in visual performance after trainingwith AO denote an improvement in neural sensitivity. Perceptuallearning with AO thus has the potential to enhance neural function inabnormal corneal patients leading to improved visual benefit after acustomized correction.Commercial Relationships: Ramkumar Sabesan, None;Geunyoung Yoon, Bausch & Lomb (F), Johnson & Johnson (F),Allergan (C), Staar Surgical (C), CIBA Vision (F), Acufocus (C)Support: NIH/NEI grant RO1EY 014999, Research to PreventBlindnessProgram Number: 1283Presentation Time: 9:30 AM - 9:45 AMWhat is the smallest change in visual acuity that is correlatedwith a change in image quality?Ayeswarya Ravikumar, Jason D. Marsack, Yue Shi, Raymond A.Applegate. College of Optometry, University of Houston, Houston,TX.Purpose: The 95% confidence interval for logMAR acuity testing is~ ±5 letters (±1 line)[ Optom Vis Sci, 1998. 75(5): 342]. Metrics ofimage quality (IQ) can quantify 6 just noticeable differences in blurbefore 1 line of acuity is lost [J Cataract Refract Surg, 2011. 37(8):1523] and visual acuity (VA) is highly correlated (R 2 > 0.8) to changein metrics of image quality when inducing several lines of change inacuity. However, the correlation between acuity and metric values isnot known as the change in acuity approaches the test re-testreliability of acuity. The purpose here is to determine how thecoefficient of determination (R 2 ) between change in VA and changein IQ metric/s value changes as the range is decreased from 8 lines tothe test re-test reliability of acuity measurement (1 line).Methods: The Thibos virtual eye generator [Opththalmic Physiolopt, 2009;29(3):288-291] was used to generate 60 WFEs whose logvisual Strehl ratio varied between 0.0 and -1.8 in approximately equalsteps. For each of the 60 WFEs, three unique logMAR acuity chartswere generated (0.8 to -0.3 logMAR). For each chart, VA wasmeasured up to the 5th letter missed for each of 3 normal subjects.Change in visual acuity was linearly regressed against change in 29IQ metrics to determine the coefficient of determination when thechange in visual acuity was decreased in 1 line steps from 8 lines to 1line.Results: See Figure. Extrapolation from the fitted line shows that R 2goes to zero at ~3 letters (0.6 of a line), which is below the test retestreliability for acuity measurement (1 line). With a 2 line loss (or oneline above the 95% confidence level for the measurement of acuity),42% of the variance in acuity is accounted for by the metrics. Thefunction begins to asymptote between 4 and 5 lines, and littleimprovement in correlation is seen with additional lines of acuitychange.Conclusions: Image quality metrics can detect blur prior to an acuityloss (prior work), begin to be correlated with acuity below the re-testreliability for acuity testing and reach a maximum R 2 > 0.8. Thesetwo experimental observations suggest that IQ metrics can serve asan objective tool for evaluating and designing therapy intended toimprove visual performance, and that correlations are primarilylimited by the acuity task and not by the IQ metrics.Commercial Relationships: Ayeswarya Ravikumar, None; JasonD. Marsack, University of Houston (P); Yue Shi, None; RaymondA. Applegate, University of Houston (P)Support: R01 EY08520 (RAA), R01 EY019105 (RAA), P30 EY07551 (Core Grant), N0025910 P1354 (RAA)Program Number: 1284Presentation Time: 9:45 AM - 10:00 AMDetermination of Customized Aberration ThresholdsCarmen Canovas 1, 2 , Patricia A. Piers 1 , Silvestre Manzanera 2 ,Christina Schwarz 2 , Pedro M. Prieto 2 , Henk A. Weeber 1 , PabloArtal 2 . 1 R&D, AMO Groningen B.V., Groningen, Netherlands;2 Laboratorio de Optica, Unversidad de Murcia, Murcia, Spain.Purpose: Different aberration terms may have lower or higherimpact on vision. This could be used to optimize correctionstrategies. We studied the customized level of spherical aberration(SA) and vertical coma (VC) that can be induced while maintainingacceptable high contrast visual acuity (VA) and to then determinewhether these levels of aberration affect subjects’ through focusvision.Methods: An adaptive optics visual simulator (Fernández, et al. Opt.Lett. 2001) was used to correct individual aberrations up to the fifthorder and to induce a common higher order aberration baseline (0.15µm RMS for a 5mm pupil) corresponding to that of an averagepseudophakic eye, in five normal subjects. High contrast VA wasmeasured with SLOAN letters at the best focus position with a 4mmphysical pupil. Letter size was then increased to correspond to adecrease in VA by 0.1LogMAR. Thresholds for SA (positive andnegative) and positive VC were then subjectively determined by©2013, Copyright by the Association for Research in Vision and Ophthalmology, Inc., all rights reserved. Go to iovs.org to access the version of record. For permissionto reproduce any abstract, contact the <strong>ARVO</strong> Office at arvo@arvo.org.
<strong>ARVO</strong> 2013 Annual Meeting Abstracts by Scientific Section/Group – <strong>Visual</strong> <strong>Psychophysics</strong> / <strong>Physiological</strong> <strong>Optics</strong>increasing its value in steps of 0.02 µm until the letter could not beread.Results: The threshold value for negative SA was the smallest (-0.16±0.04 µm at 5mm pupil), followed by positive SA (0.25±0.05µm). The custom threshold for VC was consistently the highest(0.78±0.12 µms), ranging from 0.70 to 0.98 µms.Monocular through focus VA was measured, both for the baselineaberration level and after inducing the individual threshold for coma.In this case, VA for the best focus position decreased by0.16LogMAR with respect to the baseline, reaching an averageabsolute VA of 0.04± 0.04LogMAR. VA decreased linearly as afunction of defocus in both cases, but has a flatter slope when theindividual threshold for VC was induced (0.17LogMAR per diopterof defocus versus 0.40LogMAR, respectively).Conclusions: Customized aberration thresholds for individualZernike modes were similar for the aberrations studied for allsubjects. The high contrast VA threshold for positive VC wasconsistently higher than that for SA demonstrating the robustness ofour visual system to this aberration and indicating that disturbancesresulting in VC, such as decentration of optical surfaces that correctspherical aberration, may play a less impact on vision than originallybelieved. The induction of VC may be advantageous for extendingdepth of focus.Commercial Relationships: Carmen Canovas, AMO GroningenB.V. (E); Patricia A. Piers, Abbott Medical <strong>Optics</strong> (E); SilvestreManzanera, AMO (F), CIBA Vision (F), CALHOUN (F),VOPTICA (I); Christina Schwarz, AMO (F); Pedro M. Prieto,AMO (F), AcuFocus (F), Voptica SL (I), Voptica SL (P); Henk A.Weeber, AMO Groningen b.v. (E); Pablo Artal, AMO (C), VopticaSL (P), Voptica SL (I), AMO (F), Calhoun Vision (F), CalhounVision (C), AcuFocus (C)Support: Ministerio de Ciencia e Innovación, Spain (grantsFIS2010-14926 and CSD2007-00013) and Fundación Séneca(Region de Murcia, Spain), grant 4524/GERM/06 and AMO.Program Number: 1285Presentation Time: 10:00 AM - 10:15 AMImpact of the Retinal Reflection on the Wide-Angle Point SpreadFunction of the Human EyeHarilaos S. Ginis 1, 2 , Guillermo M. Perez 3 , Alexandros Pennos 1 , JuanM. Bueno 1 , Pablo Artal 1 . 1 Laboratorio de Optica, UNIVERSIDADDE MURCIA, Murcia, Spain; 2 Institute of Vision & <strong>Optics</strong>,University of Crete, Heraklion, Greece; 3 Voptica SL, Murcia, Spain.Purpose: Objective measurements of scattered light in the livinghuman eye require the analysis of double-pass (DP) retinal images.The inherent wavelength-dependent properties of the retinalreflection may influence these measurements. The aim of this workwas to measure the wide-angle Point Spread Function (PSF) atdifferent wavelengths to better understand the role of the fundusoptical properties and to identify the optimal conditions for visuallyrelevant scattering measurements.Methods: The instrument, based on the DP principle, used anextended-source, and allowed the recording of the wide-angle PSFfor different wavelengths. A liquid-crystal wavelength tunable filterwas used to select six different wavelengths ranging from 500 to 650nm. Series of uniformly illuminated disks with angular size up to 8.1degrees in radius were sequentially projected onto the ocular fundus.A technique previously reported (Ginis et al., J. Vision (2012)) wasemployed to analyze the DP images and reconstruct the wide-anglePSF for each wavelength. The complete series of measurements wereperformed in 10 healthy Caucasian subjects with differentpigmentation. As an indication of the amount of measured scatter, weobtained the value of the PSF for small (0.5 degrees) and large (7degrees) angles.Results: For small angles, there was a wavelength dependence thatmatches the transmittance spectrum of oxy-hemoglobin, whatsuggests that diffuse light from the fundus was part of thereconstructed PSF at longer wavelengths. This contribution of thefundus is more important for wavelengths longer than 600nm.Therewas a different behavior depending on subjects’ pigmentation withlight-colored eyes exhibiting higher intensities of scattered light andwithout dependence on wavelength. For larger angles, scatter wasnearly independent of wavelength and subjects’ pigmentation.Conclusions: The central part of the wide-angle PSF in the eye isaffected by the wavelength dependent properties of the retinalreflection, which are closely related to subject’s pigmentation. Atthose small angles, measurements using wavelengths shorter than600nm might be better correlated with scatter affecting vision.However, the impact of the retinal reflection in the values of the PSFat larger angles did not depend on the measuring wavelength.Commercial Relationships: Harilaos S. Ginis, Universidad deMurcia (P); Guillermo M. Perez, VOPTICA (E); AlexandrosPennos, None; Juan M. Bueno, None; Pablo Artal, AMO (C),Voptica SL (P), Voptica SL (I), AMO (F), Calhoun Vision (F),Calhoun Vision (C), AcuFocus (C)Support: Supported by the Ministerio de Ciencia e Innovación,Spain (grants FIS2010-14926 and CSD2007-00013), FundaciónSéneca (Region de Murcia, Spain), grant 4524/GERM/06 and EUITN OpAL (PITN-GA-2010-264605).233 Binocular Vision and Age Effects on VisionMonday, May 06, 2013 8:30 AM-10:15 AMExhibit Hall Poster SessionProgram #/Board # Range: 1517-1529/B0303-B0315Organizing Section: <strong>Visual</strong> <strong>Psychophysics</strong> / <strong>Physiological</strong> <strong>Optics</strong>Program Number: 1517 Poster Board Number: B0303Presentation Time: 8:30 AM - 10:15 AMOblique effects in V2 neurons of infant macaque monkeysXiaofeng Tao 1 , Bin Zhang 1, 2 , Guofu Shen 1 , Earl L. Smith 1 , Yuzo M.Chino 1 . 1 College of Optometry, Unitersity of Houston, Houston, TX;2 College of Optometry, NOVA Southeastern University, FortLauderdale, FL.Purpose: The neural basis of oblique effects is elusive. Wepreviously reported that the spatial matrix of facilitatory subfields(subunits) in the receptive fields of individual V2 neurons in adultmonkeys exhibits an orientation anisotropy; the homogeneity of thesubfields is greater if a neuron preferred the cardinal orientationscompared to oblique orientations (Tao et al, 2012). In this study, weasked whether a similar orientation anisotropy (an oblique effect)exists in V2 of infant monkeys shortly after birth. In addition weasked whether or not we find an oblique effect if we analyze theresponses of a large number of adult V2 neurons (> 600 units) usingsine-wave grating stimuli.Methods: Extracellular recording was made in individual V2 neuronsof anesthetized and paralyzed 4-, 8-, and 16-week-old macaquemonkeys. The results from infants were compared to those obtainedin adults. Standard sine-wave grating stimuli were initially used todetermine the preferred orientation, spatial frequency and size ofneuron’s receptive fields. Neurons were classified into vertically,horizontally, or obliquely oriented units after we determined thepreferred orientation of each neuron. This was followed by the use ofdynamic two dimensional noise stimuli and a reverse correlation(LSRC) method to obtain the spatial matrix of subfields withfacilitatory profiles.©2013, Copyright by the Association for Research in Vision and Ophthalmology, Inc., all rights reserved. Go to iovs.org to access the version of record. For permissionto reproduce any abstract, contact the <strong>ARVO</strong> Office at arvo@arvo.org.
<strong>ARVO</strong> 2013 Annual Meeting Abstracts by Scientific Section/Group – <strong>Visual</strong> <strong>Psychophysics</strong> / <strong>Physiological</strong> <strong>Optics</strong>Results: 1) Using grating stimuli, we found that V2 neurons in adultmonkeys show an oblique effect. 2) The oblique effect in the spatialmatrix of subfields was absent in V2 at 4 and 8 weeks of age butemerged sometime between 8 and 16 weeks; the average maximalorientation differences between adjacent subfields were smaller forthose neurons preferring the cardinal orientations.Conclusions: 1) Our results with grating stimuli represent the firstdemonstration of oblique effects in monkey extrastriate cortex. 2)The oblique effect in the spatial matrix of facilitatory subfields maynot be present at birth, but appears to result from experiencedependentmaturation of the connections between V1 and V2.However, the effects of optical factors including higher-orderaberrations have not been ruled out.Commercial Relationships: Xiaofeng Tao, None; Bin Zhang,None; Guofu Shen, None; Earl L. Smith, Ziess (P); Yuzo M.Chino, NoneSupport: NIH Grant R01-EY008128 (YMC), R01-EY003611 (ELS),Core Grant P-30-EY007751Program Number: 1518 Poster Board Number: B0304Presentation Time: 8:30 AM - 10:15 AMInterocular acuity differences alter the spatial frequency tuningof stereopsisAshley Craven 1 , Truyet Tran 1 , Kevin Gustafson 1 , Thomas H. Wu 1 ,Kayee So 1 , Dennis M. Levi 1, 2 , Roger W. Li 1, 2 . 1 School of Optometry,University of California-Berkeley, Berkeley, CA; 2 Helen WillsNeuroscience Institute, University of California-Berkeley, Berkeley,CA.Purpose: It is well known that interocular acuity differences result inreduced stereo acuity. However, previous studies have used tests thatare broadband in their spatial frequency content. The purpose of thepresent study was to investigate the effects of interocular differencesin acuity on the spatial frequency tuning of stereoscopic depthperception.Methods: The visual stimulus consisted of two horizontallyseparated square blocks, one presented to each eye. Each blockcontained a Gabor target patch surrounded by four Gabor referencepatches. Binocular disparity was introduced by shifting the twoGabor targets in opposite directions (controlled by 2 interleavedstaircases), and a haploscope was used to enable binocular fusion.Stimulus spatial frequency ranged from 1-20 cyc/deg. The visual taskwas to determine the stereoscopic depth of the Gabor target (crosseddisparity: in front of / uncrossed disparity: behind) relative to the fourreferences. Five adult observers with corrected-to-normal vision weretested. Bangerter foils were used to reduce visual acuity in thedominant eye. Stereothresholds were measured for a range of acuitydifference: from 1 to 8 letter-lines on a standard LogMAR letterchart.Results: The stereoacuity versus spatial frequency function isbasically the inverse of a typical contrast sensitivity function, withthe optimum spatial frequency at 5- 10 cyc/deg. Increasing theinterocular acuity difference degrades stereo thresholds selectively athigh spatial frequencies, gradually shifting the optimum frequency tolower spatial frequencies. Interestingly, stereopsis for low frequencytargets was only mildly affected even with an acuity difference of asmuch as eight letter-lines (0.8 LogMAR).Conclusions: The current study shows that interocular acuitydifferences result in spatial frequency specific losses of stereopsis.These findings have important clinical implications for understandingboth the sparing of coarse stereopsis and the deficits in fine stereopsisin anisometropic amblyopia.Commercial Relationships: Ashley Craven, None; Truyet Tran,None; Kevin Gustafson, None; Thomas H. Wu, None; Kayee So,None; Dennis M. Levi, None; Roger W. Li, NoneSupport: NIH Grant R01EY01728Program Number: 1519 Poster Board Number: B0305Presentation Time: 8:30 AM - 10:15 AMEnhancing stereoacuity through perceptual learning in normalvision: Specificity for spatial frequency and orientationTruyet Tran 1 , Kayee So 1 , Calvin Nguyen 1 , Tszwing Leung 3 , SandyChat 1 , Dennis M. Levi 1, 2 , Roger W. Li 1, 2 . 1 School of Optometry,University of California-Berkeley, Berkeley, CA; 2 Helen WillsNeuroscience Institute, University of California-Berkeley, Berkeley,CA; 3 School of Optometry, The Hong Kong Polytechnic University,Hung Hom, Hong Kong.Purpose: To investigate whether practicing a stereoscopic depthdetection task enhances stereoacuity in adults with normal vision andwhether the learning effects, if any, transfer across target spatialfrequencies and carrier orientations.Methods: The visual stimulus consisted of two horizontallyseparated square blocks, one presented to each eye. Each blockcontained a Gabor target patch surrounded by four Gabor referencepatches. A haploscope was used to enable binocular fusion. Thevisual task was to determine the stereoscopic depth of the Gabortarget (in front / behind) relative to the four references. Ten adultobservers with corrected-to-normal vision participated. The trainingprotocol consisted of three training phases (each of 13 sessions). InPhase 1 observers were trained with targets with a vertical carrier of 5cyc/deg (V5, vertical). In Phase 2 they continued to train with thesame spatial frequency, but with an orthogonal carrier orientation(H5, horizontal). They were subsequently required to practice withtargets with a vertical carrier at a higher spatial frequency (V10, 10cyc/deg) in phase 3. Thresholds for each of the three stimulusconfigurations were measured before and after each training phase.Trial-by-trial feedback was provided.Results: Our observers showed a substantial mean improvement of64% in stereo thresholds after practicing with V5 stimuli in phase 1,and the improvement transferred substantially to the other twountrained stimulus configurations (H5: 46% and V10: 56%).Additional significant improvements obtained with subsequent directtrainingin phases 2 (H5: 29%) and 3 (V10: 19%) indicate that thetransfers observed in phase 1 were not complete.Conclusions: Perceptual learning can induce functional plasticity forenhancing stereovision in the mature visual system. Our findingscharacterize the magnitude, time course and specificity of visuallearning. This technique might have important applications inrestoring impaired binocular vision in cortical visual disorders.Commercial Relationships: Truyet Tran, None; Kayee So, None;Calvin Nguyen, None; Tszwing Leung, None; Sandy Chat, None;Dennis M. Levi, None; Roger W. Li, NoneSupport: NIH Grant R01EY01728Program Number: 1520 Poster Board Number: B0306Presentation Time: 8:30 AM - 10:15 AMFactors influencing stereoacuity levels after surgery to correctunilateral developmental cataracts in childrenSoo Jung Lee 1 , Nam Eok Kim 2 , Jung Min Park 2 . 1 Haeundae PaikHospital, Busan, Republic of Korea; 2 Ophthalmology, MaryknollMedical Center, Busan, Republic of Korea.Purpose: To evaluate factors influencing stereoacuity after surgery tocorrect unilateral developmental pediatric cataracts.Methods: We retrospectively surveyed 110 patients who hadundergone removal of unilateral acquired developmental cataracts©2013, Copyright by the Association for Research in Vision and Ophthalmology, Inc., all rights reserved. Go to iovs.org to access the version of record. For permissionto reproduce any abstract, contact the <strong>ARVO</strong> Office at arvo@arvo.org.
<strong>ARVO</strong> 2013 Annual Meeting Abstracts by Scientific Section/Group – <strong>Visual</strong> <strong>Psychophysics</strong> / <strong>Physiological</strong> <strong>Optics</strong>and primary posterior chamber intraocular lens implantation betweenFebruary 1992 and December 2009. In all patients, stereoacuity wasassessed using the Titmus test at the last follow-up period ofminimum 2 years after surgery. Patients were divided into two groupsaccording to the extent of stereoacuity: Group 1 (n=42) hadstereoacuity values ≤100 sec/arc and Group 2 (n=68) values >100sec/arc. The values of ten parameters associated with stereoacuitywere measured in each group: Cataract types, preoperative bestcorrected visual acuity (BCVA) of the affected eyes, between-eyedifference in BCVA, age at cataract surgery, operative method, aftercataracts,postoperative strabismus, postoperative BCVA of theaffected eyes, between-eye difference in BCVA, and anisometropia.Results: The extent of stereoacuity was significantly associated withboth operative method and after-cataract (P=0.000 and P=0.016,respectively). All patients in whom the posterior capsule waspreserved, had poor stereoacuity >100 sec/arc. Significantcorrelations with the extent of stereoacuity were found withpostoperative strabismus (P=0.048), postoperative BCVA of theaffected eyes (P=0.002), anisometropia (P=0.034).Conclusions: Postoperative stereoacuity was better in patients whounderwent either optic capture or anterior vitrectomy after posteriorcontinuous curvilinear capsulorhexis, and who didn’t develop aftercataractsor strabismus postoperatively. Furthermore, postoperativeBCVA of the affected eyes, and anisometropia influenced thestereoacuity of the patients surgically treated for unilateraldevelopmental pediatric cataracts.Commercial Relationships: Soo Jung Lee, None; Nam Eok Kim,None; Jung Min Park, NoneProgram Number: 1521 Poster Board Number: B0307Presentation Time: 8:30 AM - 10:15 AMDo Bangerter filters promote binocular function in amblyopes?Daming Deng 1 , Jinrong LI 1, 2 , Benjamin Thompson 3 , Minbin Yu 1, 2 ,Robert F. Hess 4 . 1 State Key Laboratory of Ophthalmology,Zhongshan Ophthalmic Center, Sun Yat-sen University, Guangzhou,China; 2 Department of Optometry and Vision Science, Sun Yat-senUniversity, Guangzhou, China; 3 Department of Optometry andVision Science, University of Auckland, Auckland, New Zealand;4 Department of Ophthalmology, McGill University, Montreal, QC,Canada.Purpose: Bangerter foils have become an alternative treatmentregimen for amblyopia penalization. We have previously found thatwhile Bangerter foils can penalize the normal eye, they do so in amanner that is not graded. In this study, we investigated whetherBangerter foils promote binocular function within the amblyopicvisual system.Methods: Suppression thresholds were measured for 17 amblyopesusing our previously established “balance point” protocol combinedwith a Gabor direction discrimination task. We compared normalbinocular viewing with viewing conditions where the fellow fixingeye was penalized with 0.8, 0.6, 0.4 and 0.2 strenght Bangerter foils.In addition, the effect of Bangerter filters on suppression thresholdsfor patients was compared to results from 10 control observers.Results: The 0.8, 0.6 and 0.4 labeled foils did not influencesuppression in the amblyopic observers. The 0.2 Bangerter foilreduced suppression thresholds and a binocular balance point wasobtained in 14 out of the 17 subjects.Conclusions: Bangerter foils do not gradually induce binocularfacilitation. The 0.8 to 0.4 strength Bangerter foils did not predictablyshift the binocular status of amblyopes. Only the most extreme foiltested, labeled 0.2, reduced suppression among the amblyopicsubjects. Care should be taken when prescribing Bangerter foils inclinical practice.Commercial Relationships: Daming Deng, None; Jinrong LI,None; Benjamin Thompson, US12528934 (P), US8006372B2 (P);Minbin Yu, None; Robert F. Hess, NoneSupport: JRL was supported by The Thrasher Research Fund forEarly Career Award, the Fundamental Research Funds of State KeyLaboratory of Ophthalmology, Sun Yat-sen University and theGuangdong Province Medical Science Research Grant (B2011105).DDM was supported by the Guangdong Province InternationalCollaboration Project Grant (2010B050100014).Program Number: 1522 Poster Board Number: B0308Presentation Time: 8:30 AM - 10:15 AMOptimizing binocular vision of pseudophakes with uncorrectedastigmatismVeerendranath Pesala 1 , Prashant Garg 2 , Shrikant R. Bharadwaj 1 .1 Prof. Brien Holden Eye Research Centre, L V Prasad Eye Institute,Hyderabad, India; 2 Cornea and anterior segment services, L V PrasadEye Institute, Hyderabad, India.Purpose: Uncorrected astigmatism improves monocular near acuityof pseudophakes, but with an associated loss in distance vision. Theimpact of uncorrected astigmatism on binocularity of these eyeshowever remains unknown. This study determined combinations ofastigmatism in the two eyes that simultaneously optimize binoculardistance and near resolution acuity and stereoacuity of bilateralpseudophakes with monofocal IOL implants.Methods: Binocular distance (3m) and near (40cm) logMAR acuityand random-dot stereoacuity (40cm) was measured in 13 emmetropicpseudophakes with 10 different combinations of astigmatism inducedin random order before the two eyes. Three strategies were chosensuch that one eye had I) no astigmatism or II) 1D simple myopic orIII) 1D simple hyperopic astigmatism at 90° while the fellow eye hada) the same error or that with b) orthogonal axis (180°) or c) differentmagnitude (2.5D) or d) opposite polarity (-1D).Results: For all combinations of induced astigmatism, the mean(±1SEM) distance logMAR acuity (0.03±0.03) did not deterioratesignificantly from the best-corrected condition (-0.08±0.02) (p=0.32).Near logMAR acuity and stereoacuity were in-between theuncorrected (N VA : 0.59±0.05; Stereo: 232.9±33.9arc sec) and bestcorrected(N VA : 0.18±0.02; Stereo: 60.9±10.2arc sec) conditions forall myopic astigmatic combinations (Ib & c and IIa - c) and same orworse than the uncorrected condition for hyperopic astigmaticcombinations (Id, IId & IIIa - c) (p=0.003 to 0.36 for all). Alloutcomes variables were closest to their respective best-correctedvalues for combination IIc (OD: ±/+1.0x90°; OS: ±/+2.5x90°; D VA :0.12±0.02; N VA : 0.38±0.03; Stereo: 82.6±8.05arc sec), followed byIIa (OU: ±/+1.0x90; D VA : 0.04±0.02; N VA : 0.43±0.05; Stereo:104.5±13.5arc sec) and Ib. Stereoacuity was worse with orthogonalaxes (IIb) than with parallel axes of myopic astigmatism (IIa) in thetwo eyes (p=0.002).Conclusions: Binocular near logMAR and stereo acuity of bilateralpseudophakes can be simultaneously optimized without hinderingdistance vision using combinations of myopic astigmatism in the twoeyes. Leaving such combinations uncorrected after cataract surgerymay be a viable alternative to sphero-cylindrical bifocals inoptimizing the overall binocular visual experience of the patient.Combinations with astigmatism with orthogonal axes in the two eyesor with hyperopia deteriorate near vision of pseudophakes.Commercial Relationships: Veerendranath Pesala, None;Prashant Garg, None; Shrikant R. Bharadwaj, NoneSupport: Department of BioTechnology RamalingaswamiFellowship, Govt. of India.Program Number: 1523 Poster Board Number: B0309©2013, Copyright by the Association for Research in Vision and Ophthalmology, Inc., all rights reserved. Go to iovs.org to access the version of record. For permissionto reproduce any abstract, contact the <strong>ARVO</strong> Office at arvo@arvo.org.
<strong>ARVO</strong> 2013 Annual Meeting Abstracts by Scientific Section/Group – <strong>Visual</strong> <strong>Psychophysics</strong> / <strong>Physiological</strong> <strong>Optics</strong>Presentation Time: 8:30 AM - 10:15 AMEffects of refractive blur and clothing on night-time pedestrianvisibilityJoanne M. Wood, Ralph Marszalek, Trent Carberry, PhilippeLacherez, Sumanth Virupaksha, Michael J. Collins. School ofOptometry and Vision Science, Queensland University ofTechnology, Brisbane, QLD, Australia.Purpose: To investigate the effects of refractive blur on night-timepedestrian recognition and whether clothing that has been shown toimprove pedestrian conspicuity is robust to the effects of blur.Methods: Twenty-four visually normal participants (12 youngerM=25.6 ± 5.2 years and 12 older adults M= 77.6 ± 5.5 years) drovean instrumented vehicle around a 1.8 km closed road circuit at nightwith 3 levels of binocular blur (+0.50 D, +1.00 D, +2.00 D)compared to a baseline condition (optimal correction). A pedestrianwalked in place on the course and wore either normal clothing (graypants and top), black pants and top with a retroreflective vest, or thesame top and vest with retroreflective tape positioned on theextremities in a configuration that conveyed biological motion(known as “biomotion”). Participants pressed a vehicle-mountedresponse pad when they were first confident that a pedestrian waspresent; each participant drove around the track 13 times (4 visionconditions x 3 pedestrian clothing conditions randomized + 1 practicetrial).Results: Refractive blur and pedestrian clothing had a significanteffect on pedestrian recognition distances (p
<strong>ARVO</strong> 2013 Annual Meeting Abstracts by Scientific Section/Group – <strong>Visual</strong> <strong>Psychophysics</strong> / <strong>Physiological</strong> <strong>Optics</strong>distance vision. Mean MMSE was 24.9 ± 4.0 points (range 15-30).Good near visual acuity (J3 or lower) was found to be associated withhigh MMSE score (>24) (OR=3.74, 95% CI=1.86-7.52, p
<strong>ARVO</strong> 2013 Annual Meeting Abstracts by Scientific Section/Group – <strong>Visual</strong> <strong>Psychophysics</strong> / <strong>Physiological</strong> <strong>Optics</strong>Mary Lou Jackson 1 , Jennifer Wallis 1 , Paul Wicks 2 , Peter Bex 1 .1 Harvard Dept of Ophthalmology, Massachusetts Eye & EarInfirmary, Boston, MA; 2 PatientsLikeMe Research, Boston, MA.Purpose: To assess contrast sensitivity (CS) and visual hallucinations(VH) in individuals with Parkinson’s disease. Patients withParkinson’s disease who experience hallucinations may showimpaired CS, a relationship previously reported in people with lowvision who experience Charles Bonnet Syndrome.Methods: A total of 964 members of the online patient community‘PatientsLikeMe’ were invited via email to participate in this study.269 members completed the study; 153 of this group were patientswith Parkinson's disease, 116 were controls (other disorders).Participants completed, online, a modified version of the Universityof Miami Parkinson’s Disease Hallucinations Questionnaire (UM-PDHQ) and a test of CS similar to the Pelli Robson chart.Results: Results from the UM-PDHQ showed that 18% of people inthe Parkinson’s group currently experienced VH versus 9% in thecontrol group. Hallucinations reported by participants withParkinson’s disease included mice, cats, people, distorted faces,furniture or complex patterns.Both groups, participants with Parkinson’s disease (M: 1.85, SD: .36)and the control group (M: 1.75, SD: .35) showed relatively good CSas measured with the online letter test (F(1, 269)= 1.49, p=.22).Individuals with current VH showed relatively low CS scores (M:1.69, SD: .36) compared to individuals who had never had VH(M:1.81, SD: .35), or had previously (M: 1.80, SD: .37) experiencedVH. This difference, however, did not reach statistical significance(F(2, 263)= 1.55, p= .22). CS differences in the Parkinson’s diseasegroup between those with VH (M: 1.69, SD: .34) and those with nocurrent VH (never VH - M: 1.77, SD: .34, VH but not in past month -M: 1.74, SD: .40) were small.Conclusions: More patients with Parkinson’s disease reported visualhallucinations than the control group, however, both groups showedrelatively good CS.Interestingly, participants who reported VH, irrespective of diseasestatus, showed relatively low CS compared to participants who didnot. This difference is of clinical interest.Contacting subjects via an online health social network is a novelmethod of conducting vision research that allows large numbers ofindividuals to be contacted quickly, including those in remotecommunities.Commercial Relationships: Mary Lou Jackson, None; JenniferWallis, None; Paul Wicks, PatientsLikeMe (E), Abbott (F), Acorda(F), Avanir (F), Biogen (F), Genzyme (F), Johnson & Johnson (F),Merck (F), Novartis (F), Sanofi (F), UCB (F), PatientsLikeMe (I);Peter Bex, Adaptive Sensory Technology, LLC (S), RapidAssessment of <strong>Visual</strong> Sensitivity (P)Program Number: 1529 Poster Board Number: B0315Presentation Time: 8:30 AM - 10:15 AMContrast acuity in Lewy Body DiseaseHelene Kergoat 1, 2 , Guillaume Carcenac 1 , Mireille Parent 1 . 1 Schoolof Optometry, University of Montreal, Montreal, QC, Canada;2 Institut universitaire de gériatrie de Montréal, Montreal, QC,Canada.Purpose: Lewy Body Disease (LBD) is a neurodegenerative diseaseaffecting older individuals, that is characterized by visualhallucinations, fluctuations in cognition and parkinsonism. It isassociated with deficits in both the dopaminergic and cholinergicsystems. These neurotransmitters play a role in the processing ofvisual information. Therefore, the present study was undertaken toverify if contrast acuity was altered in LBD.Methods: Twelve participants with a confirmed diagnosis of LBD(Avg: 76.0 yrs ± SD 6.1) and 12 age-matched controls (Avg: 75.1 yrs± SD 6.5) were recruited for the study. All subjects received acomplete eye examination prior to testing to ensure that they had avisual acuity better than 20/30 and good ocular health. The eye withbest corrected visual acuity was chosen for testing. Contrastsensitivity and contrast acuity were measured at an 8 foot distancewith a retroilluminated CSV-1000 system (VectorVision) having amean luminance of 85 cd/m2. Contrast sensitivity was measured withthe CSV-1000E chart test face for 4 spatial frequencies: 3, 6, 12 and18 cycles per degree (cpd). Contrast acuity was measured with theCSV-1000CVA20/30 chart test face for 3 contrast levels: 100%, 9%and 6%. Statistics consisted of ANOVAs for an alpha level of 0.05.Results: Our results indicated that the contrast sensitivity wassignificantly reduced in subjects with LBD for the 3, 12 and 18 cpdgratings (p< 0.01). Contrast acuity was also reduced in subjects withLBD, for all contrast levels tested (p< 0.01).Conclusions: These results show that LBD is associated with areduction in contrast acuity for both gratings and letters. Thesefindings may be related to dopaminergic/cholinergic deficits, or tostructural anomalies known to occur in the retina of individuals withLBD.Commercial Relationships: Helene Kergoat, None; GuillaumeCarcenac, None; Mireille Parent, NoneSupport: Fondation Caroline-Durand, COETF246 Cone Photoreceptors in Aging and DiseaseMonday, May 06, 2013 11:00 AM-12:45 PMTCC LL 4/5 Paper SessionProgram #/Board # Range: 1740-1746Organizing Section: <strong>Visual</strong> <strong>Psychophysics</strong> / <strong>Physiological</strong> <strong>Optics</strong>Program Number: 1740Presentation Time: 11:00 AM - 11:15 AMCone Distribution Variations for Young Healthy Subjects vs.Older SubjectsAnn E. Elsner 1 , Toco Y. Chui 1 , Lei Feng 1, 2 , Colleen M. McIntyre 1 ,Hongxin Song 1, 3 , Thomas Gast 1 , Stephen A. Burns 1 . 1 Optometry,Indiana University, Bloomington, IN; 2 Second Affiliated Hospital,College of Medicine, Zhejiang University, Zhejiang, China; 3 Centerfor <strong>Visual</strong> Science, University of Rochester, Rochester, NY.Purpose: To compare the individual differences in cone distributionwith age, minimizing the effects of eye length and retinal disease. Todistinguish between cone density variations related to fovealspecialization, as opposed to more global factors or aging.Methods: Subjects who had a normal fundus and axial length < 26mm were divided into 2 groups, with age = 18 - 35 yr for the 47subjects in the younger group and 50 - 70 yr for the 17 subjects in theolder group. Cone densities were quantified using a secondgeneration Adaptive <strong>Optics</strong> Scanning Laser Ophthalmoscope. Coneswere imaged using 820 to 840 nm +/- 20 nm at approximately 100microwatts, illuminating 530 x 550 microns of the retina. Samplescollected in a + shape around the fovea were montaged. Cones werecounted at a nominal 270, 630, 1480, and 2070 microns from thefoveal center using custom software (Matlab, Mathworks). To reduceshadowing from large retinal vessels, temporal meridian data wereused. Axial length measurements were used to correct the conesampling positions and retinal area in mm2 (IOL Master, ZeissMeditec). A subset of data were refit to a 2 parameter exponentialmodel.Results: Cone density was greater on average for the younger group,but had substantial variability and overlap with the older group. Therefit data from 36 younger subjects matched the 2 parameter©2013, Copyright by the Association for Research in Vision and Ophthalmology, Inc., all rights reserved. Go to iovs.org to access the version of record. For permissionto reproduce any abstract, contact the <strong>ARVO</strong> Office at arvo@arvo.org.
<strong>ARVO</strong> 2013 Annual Meeting Abstracts by Scientific Section/Group – <strong>Visual</strong> <strong>Psychophysics</strong> / <strong>Physiological</strong> <strong>Optics</strong>exponential model sufficiently well that 97% had R2 > 0.9; but theparameters differed, and 92% of the data were slightly too steep.These cone densities averaged 43,200, 27,500, 15,000, and 12,200microns per mm2, for the 270, 630, 1440, and 2070 micron locations,with a coefficient of variation of .14, .13, .10, and .10. Cone densityat 630 microns was negatively correlated with the ratio of cones at2070: cones at 630, p < .0001 and p = .0008 for the younger andolder groups, respectively, and uncorrelated to the (unnormalized)density at 2070 microns, p = 0.71 and 0.37. The ratio of cones at2070: cones at 630 averaged 0.45 vs. 0.39, for younger vs. older eyes.Conclusions: Cone density is not characterized by a scalar factor foreither eccentricity or age, nor a model with fixed exponents. Instead,cones from outside the fovea migrate centrally to provide fovealspecialization, and aging further alters the distribution.Commercial Relationships: Ann E. Elsner, Aeon Imaging, LLC(I), Aeon Imaging, LLC (F), Aeon Imaging, LLC (P); Toco Y. Chui,None; Lei Feng, None; Colleen M. McIntyre, None; HongxinSong, Canon (F); Thomas Gast, None; Stephen A. Burns, NoneSupport: NIH Grant EY007624, EY004395, P30EY019008Program Number: 1741Presentation Time: 11:15 AM - 11:30 AMLongitudinal Cone Density Measurements using a CommerciallyAvailable Flood-Illuminated Adaptive <strong>Optics</strong> Camera inJapanese Macaque Monkeys with Dominantly Inherited DrusenMark E. Pennesi 1 , Keith V. Michaels 1 , Shu Feng 1 , Travis B. Smith 1 ,Anupam K. Garg 1 , Trevor J. McGill 2 , Laurie Renner 2 , MarvinSperling 3 , Kay D. Rittenhouse 3 , Martha Neuringer 2 . 1 Ophthalmology,Casey Eye Institute - OHSU, Portland, OR; 2 Division ofNeuroscience, Oregon National Primate Center, Beaverton, OR;3 External R&D Innovations, Pfizer Inc., San Diego, CA.Purpose: To study the longitudinal changes in cone density in a lineof adult Japanese Macaque monkeys with dominantly inheriteddrusen using a commercially available flood illuminated adaptiveoptics camera.Methods: Twenty male and female Japanese Macaques were sedatedand imaged on the RTx1 Adaptive <strong>Optics</strong> Camera (Imagine Eyes,Orsay, France) at baseline and six months later. In each animal, aseries of overlapping AO images were obtained starting at the opticnerve and extending temporally through the fovea. Individual imageswere montaged using I2k Align (DualAlignTM). Cone profiles werecounted using a Matlab algorithm (generously provided by Dr.Joseph Carroll) and axial lengths were measured to correct formagnification. Macular drusen were identified with advanced Wekasegmentation (University of Waikato).Results: Cone density plots revealed an anatomic distribution of conephotoreceptors in the macula, but cones within 1.6° of the fovealcenter could not be individually identified. The mean cone densityacross 1.6-3.1° eccentricity was 28843 ± 5284 cones/mm2 after sixmonths. When broken into parafoveal quadrants, cone density washighest in the nasal quadrant and lowest in the superior quadrant forboth time points. The mean baseline age for the animals was 10.8 ±5.5 years. Age was not significantly associated with cone density (p =0.46), nor was it associated with the change in cone density betweenthe time points (p = 0.75). The fraction of area occupied by drusenwas 8.8 ± 12.8 percent. Drusen area also was not significantlyassociated with cone density (p = 0.55), nor was it associated with thechange in cone density between the time points (p = 0.70).Conclusions: Commercially available flood illuminated adaptiveoptics allows for longitudinal measurement of cone density inmacaques with drusen. Preliminary results indicate that age anddrusen load are not associated with a significant change in conedensity over the period studied. Further collections are planned everysix months to assess long-term changes in cone density.Commercial Relationships: Mark E. Pennesi, Pfizer (F); Keith V.Michaels, Pfizer, Inc. (F); Shu Feng, None; Travis B. Smith, Pfizer,Inc. (F); Anupam K. Garg, None; Trevor J. McGill, StemCells,Inc. (C), Pfizer (F), AGTC (F); Laurie Renner, Pfizer (F), AppliedGenetic Technologies Corporation (F); Marvin Sperling, Pfizer Inc.(E); Kay D. Rittenhouse, Pfizer Inc. (E); Martha Neuringer, Pfizer(F), Applied Genetic Technologies Corporation (F)Support: Pfizer Ophthalmology External Research Unit, FFB CD-CL-0808-0469-OHSU, RPB CDA (MEP), RPB Unrestricted - CEI,NIH grant P51OD011092Program Number: 1742Presentation Time: 11:30 AM - 11:45 AMAssessing the Mosaic of Cone Photoreceptors OverlyingSubretinal Drusenoid Deposits in vivo Using Adaptive <strong>Optics</strong>Sarah Mrejen 1, 2 , Taku Sato 1, 2 , Richard F. Spaide 1, 2 . 1 vitreous retinamacula consultants of New York, New York, NY; 2 LuEsther T MertzRetinal Research Center, Manhattan Eye, Ear and Throat Hospital,New York, NY.Purpose: To investigate the cone photoreceptor mosaic in eyes withpseudodrusen as evidenced by the presence of subretinal drusenoiddeposits (SDD) using adaptive optics (AO) imaging integrated into amultimodal approach.Methods: Consecutive patients with pseudodrusen were examinedusing near-infra-red reflectance (IR) confocal scanning laserophthalmoscopy (SLO) and eye-tracked spectral-domain opticalcoherence tomography (SD-OCT) and a flood-illuminated retinal AOcamera prototype (rtx-1, Imagine Eyes, Orsay, France). The AOimages were acquired between 1 and 5 degrees of retinal eccentricityfrom the foveal center in the areas of SDD. Correlations were madebetween the IR SLO, SD-OCT and the AO images. Cone packingdensity analysis was performed on AO images within 50 x 50 µmwindows in 5 regions of interest overlying and in 5 located betweenSDD. Five patients with soft drusen were evaluated as a comparisongroup.Results: The mean age of 5 patients, all female, with SDD was 71.8years. The SDD identified by combined IR and eye-tracked SD-OCTcorresponded to well-defined areas darker than the surroundinguninvolved areas in the AO images. The mean (±SD) cone packingdensity was 1254 (± 673) cones/mm2 on SDD and 10818 (±1860)cones/mm2 between SDD. Cone density on SDD was approximately11% of cone density between SDD, whereas cone density on softdrusen varied from 60 to 90% of cone density between soft drusen.The cone density between SDD was not significantly different fromthe cone density between soft drusen at the same degree of retinaleccentricity. The lack of visualization of cones on SDD wascorrelated with the disruption of the ellipsoid zone on correspondingSD-OCT. The cone mosaic was well preserved on soft drusen whenthe ellipsoid zone was preserved on corresponding SD-OCT.Conclusions: The lack of visualization of cones on SDD in the AOimages can be due to several possible causes: a change in theirorientation, absence or shortening of their outer segments, or absenceof the cones. Whether the lack of detection of cones on SDD is due toabsent or shortened outer segment or absence of cones, all of theseexplanations imply decreased cone function is possible. Thesefindings suggest these patients with pseudodrusen may experiencedecreased retinal function independent of choroidalneovascularization or retinal pigment epithelium atrophy.Commercial Relationships: Sarah Mrejen, None; Taku Sato,Alcon Japan Ltd. (F); Richard F. Spaide, Topcon (P),Thrombogenics (C), Bausch and Lomb (C)©2013, Copyright by the Association for Research in Vision and Ophthalmology, Inc., all rights reserved. Go to iovs.org to access the version of record. For permissionto reproduce any abstract, contact the <strong>ARVO</strong> Office at arvo@arvo.org.
<strong>ARVO</strong> 2013 Annual Meeting Abstracts by Scientific Section/Group – <strong>Visual</strong> <strong>Psychophysics</strong> / <strong>Physiological</strong> <strong>Optics</strong>Program Number: 1743Presentation Time: 11:45 AM - 12:00 PMAdaptive <strong>Optics</strong> Scanning Laser Ophthalmoscopy in StargardtDisease Reveals Decreased Cone and Rod DensitiesHongxin Song 1 , Angela Pugliese 2 , Ethan A. Rossi 1 , Lisa R. Latchney 2 ,Edwin M. Stone 3 , Alfredo Dubra 4 , Jennifer J. Hunter 1, 2 , Mina M.Chung 1, 2 . 1 Center for <strong>Visual</strong> Science, University of Rochester,Rochester, NY; 2 Flaum Eye Institute, University of Rochester,Rochester, NY; 3 Ophthalmology and <strong>Visual</strong> Science, University ofIowa, Iowa City, IA; 4 Ophthalmology, University of Wisconsin,Milwaukee, WI.Purpose: Stargardt disease (SD) is defined clinically by itsophthalmoscopic features including atrophy and lipofuscin depositionin the retinal pigment epithelium (RPE). The causative ABCA4 geneencodes a protein uniquely expressed in the cone and rod outersegments. The pathologic steps by which mutations in ABCA4 leadto the clinically detectable RPE changes remain unclear. Weinvestigated whether photoreceptor changes precede RPE loss in SDusing adaptive optics scanning laser ophthalmoscopy (AOSLO).Methods: Two brothers with SD, aged 8 and 17 years, underwent acomprehensive eye examination and conventional imaging includingfundus photography and optical coherence tomography (OCT).Genetic testing was performed using a combination of allele-specifictesting and sequencing of the ABCA4 gene. AOSLO images wereobtained at the central fovea and along the inferior and temporalmeridians to generate 10x1.5 degree montages. The center of thefoveal avascular zone was used as the foveal center. Cones werecounted using custom semi-automated cone marking software.Peripheral cones and rods were counted at 100 µm intervals in100x100 µm and 50x50 µm windows respectively. At the fovealcenter, cones were counted in a 50x50 µm window.Results: Genetic testing showed the presence of three likely diseasecausingmutations: Gly863Ala, Gly1961Glu, and Arg2030Stop. Theolder brother had visual acuity 20/150 with a central scotoma andmacular RPE atrophy with no peripheral flecks. His brother hadvisual acuity 20/30 with subtle RPE stippling in the macula. In bothbrothers, OCT confirmed central retinal thinning. AOSLO revealedthat rod density was decreased to ~30% of normal in the peripheralmacula; these areas appeared normal by ophthalmoscopy and OCT.Cones in the peripheral macula showed a dark, low reflectiveappearance with density 30% of normal. No cones were detectable inthe foveal center of the older brother. In the younger brother, fovealcones were enlarged with low density.Conclusions: This study provides the first in vivo images of bothrods and cones in SD. Although the primary clinical features of SDare changes in the RPE, AOSLO reveals decreased density of bothcones and rods in areas that appear normal by conventional imagingmethods. These findings suggest that loss of cone and rodphotoreceptors precedes clinically detectable RPE disease in SD.Commercial Relationships: Hongxin Song, Canon (F); AngelaPugliese, None; Ethan A. Rossi, Canon Inc. (F); Lisa R. Latchney,None; Edwin M. Stone, None; Alfredo Dubra, US Patent No:8,226,236 (P); Jennifer J. Hunter, Polgenix, Inc. (F); Mina M.Chung, Canon (F)Support: NEI EY021786, EY014375, EY001319, Edward N. &Della L. Thome Memorial Foundation to Mina Chung, Research toPrevent Blindness Unrestricted/Challenge Grant, BurroughsWellcome Fund to Alfredo Dubra-SuarezProgram Number: 1744Presentation Time: 12:00 PM - 12:15 PMCone structure imaged with Adaptive <strong>Optics</strong> Scanning LaserOphthalmoscopy in eyes with Non-Neovascular Age-relatedMacular DegenerationShiri Zayit-Soudry 1 , Reema Syed 1 , Kavitha Ratnam 1 , MorenoMenghini 1 , Austin Roorda 2 , Jacque L. Duncan 1 .1 Ophthalmology/Retina Division, University of California, SanFrancisco, San Francisco, CA; 2 School of Optometry, University ofCalifornia, Berkeley, Berkeley, CA.Purpose: To evaluate cone structure using Adaptive <strong>Optics</strong> ScanningLaser Ophthalmoscopy (AOSLO) in eyes with non-neovascular agerelated macular degeneration (AMD), and to correlate progression ofAOSLO-derived cone measures with standard measures of macularstructure. High resolution imaging of cone photoreceptor morphologyand quantitative measures of cone structure may enhanceunderstanding of the pathophysiology of vision loss in AMD andprovide a sensitive biomarker for disease progression.Methods: AOSLO macular images were obtained over 12 to 21months from 7 patients with non-neovascular AMD including 4 eyeswith geographic atrophy (GA) and 6 eyes with drusen. AOSLOimages were precisely superimposed onto color, infrared andautofluorescence fundus photographs and spectral domain opticalcoherence tomography (SD-OCT) images to allow direct correlationof cone parameters with macular structure. Cone spacing wasmeasured for each visit in selected regions including areas overdrusen (n=29), at the margin of GA (n=14), and regions withoutevidence of drusen or GA on fundus photos or SD-OCT (n=13) andcompared to normal, age-related values.Results: AOSLO imaging revealed intact cones up to the GA edgeand overlying drusen, although subtle mosaic irregularity andreduced reflectivity often resulted in a dark signal surrounding GAmargins and drusen. At baseline, cone spacing measures were normalat all study locations but 2 GA margin locations and 4 drusenlocations. Although progression of GA was observed in most studyeyes with standard clinical measures, AOSLO longitudinal trackingshowed mild increases in cone spacing in 3 drusen locations, butstable cone spacing measures in all other drusen and GA marginlocations.Conclusions: AOSLO provides adequate resolution for quantitativemeasurement of cone structure at the margin of GA and over drusenin eyes with non-neovascular AMD, providing insight into thepathophysiology of GA progression. Despite reflectivity changesnoted over drusen and at GA margins, cone spacing was oftenpreserved at these locations and remained stable over time,suggesting changes in cone spacing may not represent a primarystructural change in AMD progression.Commercial Relationships: Shiri Zayit-Soudry, None; ReemaSyed, None; Kavitha Ratnam, None; Moreno Menghini, None;Austin Roorda, US Patent #6890076 (P), US Patent #7118216 (P),UC Berkeley (P); Jacque L. Duncan, NoneSupport: NIH EY014375, Novartis Institutes for BiomedicalResearch, NEI Core grant EY002162, American Health AssistanceFoundation (AHAF) Macular Degeneration Research Grant (MDR),Foundation Fighting Blindness, Research To Prevent Blindness, ThatMan May SeeProgram Number: 1745Presentation Time: 12:15 PM - 12:30 PMAdaptive <strong>Optics</strong> Imaging of Photoreceptors following Repair ofRhegmatogenous Retinal DetachmentsMeenakashi Gupta 1 , Michael Dubow 1, 2 , Alexander Pinhas 1, 2 , NishitShah 1 , Patricia Garcia 1 , Gennady Landa 1 , Yusufu N. Sulai 3 , AlfredoDubra 4 , Richard B. Rosen 1 . 1 New York Eye and Ear Infirmary, NewYork, NY; 2 Mount Sinai School of Medicine, Mount Sinai Hospital,©2013, Copyright by the Association for Research in Vision and Ophthalmology, Inc., all rights reserved. Go to iovs.org to access the version of record. For permissionto reproduce any abstract, contact the <strong>ARVO</strong> Office at arvo@arvo.org.
<strong>ARVO</strong> 2013 Annual Meeting Abstracts by Scientific Section/Group – <strong>Visual</strong> <strong>Psychophysics</strong> / <strong>Physiological</strong> <strong>Optics</strong>New York, NY; 3 University of Rochester, Rochester, NY; 4 MedicalCollege of Wisconsin, Madison, WI.Purpose: Patients with macula-off rhegmatogenous retinaldetachments can have poor visual recovery or metamorphopsiadespite successful retinal reattachment. Subtle changes in the fovealstructure, causing such visual disturbances, can be difficult to identifywith standard examination and imaging tools. Adaptive <strong>Optics</strong> (AO)allows in vivo imaging of individual photoreceptors. Using an AOscanning laser ophthalmoscope, we evaluated the fovealphotoreceptor appearance following repair of macula-off retinaldetachments. AO images were compared with infrared and OCTimaging. <strong>Visual</strong> acuity and microperimetry were obtained forfunctional correlation.Methods: Three patients who had previously undergoneanatomically successful repair of rhegmatogenous macula-off retinaldetachments were evaluated with AO following reattachmentsurgery. AO videos were recorded using a 790 nm light source and 1degree field of view. Motion contrast images from several videoswere used to create montages yielding a 2.5 degree field of viewcentered around the foveal depression. Montages from the affectedeye were compared with corresponding montages from the unaffectedeye. Spectralis infrared imaging (870 nm), Spectralis OCT, visualacuity and OCT/SLO microperimetry (Opko/OTI) were alsoobtained.Results: In reattached retina, the appearance of mottling of themacula with infrared imaging (Fig 1A) and hyporeflectivity of thefoveal IS/OS junction using OCT (Fig 1B) corresponded to patchydisruption of the foveal photoreceptor mosaic with AO imaging (Fig1C). These findings were associated with reduced visual acuities andthreshold sensitivities on microperimetry (Fig 2).Conclusions: AO imaging of repaired macula-off retinaldetachments demonstrated disruptions of the photoreceptor mosaic inregions of abnormal fundus infrared signal, irregular IS/OS junctionand reduced visual function. Further AO studies will help us betterunderstand microstructural and pathophysiological changes followingretinal detachment repair.Figure 1: A) Infrared imaging of a 43-year-old woman 6 weeksfollowing macula-off retinal detachment repair shows mottling of themacula. B) OCT of the fovea with hyporeflective regions in theIS/OS junction (Red). C) AO of foveal photoreceptors showing darkpatches interrupting the photoreceptor mosaic.Figure 2: Microperimetry corresponding to Figure 1 showingdepressed sensitivity within the macula.Commercial Relationships: Meenakashi Gupta, None; MichaelDubow, None; Alexander Pinhas, None; Nishit Shah, None;Patricia Garcia, None; Gennady Landa, None; Yusufu N. Sulai,None; Alfredo Dubra, US Patent No: 8,226,236 (P); Richard B.Rosen, Opko-OTI (C), Optos (C), Clarity (C), OD-OS (C), Topcon(R), Zeavision (F), Genetech (F), Optovue (C)Support: Marrus Family Foundation, Bendheim-Lowenstein FamilyFoundation, Wise Family Foundation, Chairman's Research Fund ofthe New York Eye and Ear InfirmaryProgram Number: 1746Presentation Time: 12:30 PM - 12:45 PMChanges in Cone Reflectivity and Regularity Assessed byAdaptive <strong>Optics</strong> Scanning Laser Ophthalmoscopy (AOSLO)Correlate with Presence of Diabetic RetinopathyJan Lammer 1, 2 , Amel Ahmed 5 , Sonja G. Prager 1, 2 , Michael C.Cheney 1 , Stephen A. Burns 4 , Paolo S. Silva 1, 3 , Lloyd P. Aiello 1, 3 ,Jennifer K. Sun 1, 3 . 1 Beetham Eye Institute, Joslin Diabetes Center,Boston, MA; 2 Department of Opthalmology and Optometry, MedicalUniversity of Vienna, Vienna, Austria; 3 Department ofOphthalmology, Harvard Medical School, Boston, MA; 4 School ofOptometry, Indiana University, Bloomington, IN; 5 Department ofHistology and Cell Biology, Faculty of Medicine, Assiut University,Assiut, Egypt.Purpose: To utilize high resolution AOSLO to evaluate differencesin cone density, reflectivity and regularity in eyes with and withoutdiabetes (DM) and across a range of diabetic retinopathy (DR)severity.Methods: Cone mosaics at the fovea and 4 macular quadrants(1x1.2° area, mean+SD eccentricity = 4.2±0.4°) were imaged usingAOSLO (2.5µm resolution). Contrast of aligned and averaged imageswas automatically standardized based on the 8-bit histogram. Conecounting was performed semi-automatically using ImageJ andmanual correction by 2 independent graders masked to clinical data.Count differences >20% were adjudicated. Parameters includingdensity, nearest neighbor (NN) and Voronoi tile measurements werecalculated as well as mean reflectivity of each Voronoi tile.Results: Forty eyes of 40 subjects were assessed. For subjects,mean±SD age was 44±12yrs, 57% (N=12) were male, 78% (31) hadDM, DM duration was 22±14yrs and 32% (10) had no DR, 19% (6)mild nonproliferative DR (NPDR), 29% (9) moderate NPDR, 10%©2013, Copyright by the Association for Research in Vision and Ophthalmology, Inc., all rights reserved. Go to iovs.org to access the version of record. For permissionto reproduce any abstract, contact the <strong>ARVO</strong> Office at arvo@arvo.org.
<strong>ARVO</strong> 2013 Annual Meeting Abstracts by Scientific Section/Group – <strong>Visual</strong> <strong>Psychophysics</strong> / <strong>Physiological</strong> <strong>Optics</strong>(3) severe NPDR and 10% (3) PDR. No consistent relationship forDM or DR was seen with absolute cone density, NN measurements,or reflectivity. However, the reflectivity regularity index (RI)(Voronoi tile reflectivity mean/SD) decreased in all 5 macularregions with increasing DR severity and this decrease wasstatistically significant in the inferior regions of the macula (No DR:4.6±0.9, mild NPDR: 4.5±0.8, moderate NPDR: 4.5±0.7, severeNPDR: 4.2±0.9, PDR: 3.8±0.9, p
<strong>ARVO</strong> 2013 Annual Meeting Abstracts by Scientific Section/Group – <strong>Visual</strong> <strong>Psychophysics</strong> / <strong>Physiological</strong> <strong>Optics</strong>located.Conclusions: The worse acuity found at the PRL than at otherlocations around the scotoma implies that the selection of the PRLlocation was unlikely to be based on optimizing acuity. Although ourmeasurements were made years after the development of the PRL,perceptual learning suggests that with continuous usage, acuity at thePRL should only get better and not worse, further affirming that theinitial selection of the PRL location was not based on optimizingacuity at a specific location.Commercial Relationships: Susana T. Chung, None; Jean-Baptiste Bernard, NoneSupport: NIH Grant R01-EY012810Program Number: 2184Presentation Time: 3:15 PM - 3:30 PMRetinal Fixation Locus in Patients with Bilateral CentralScotomas: Letter Targets are Better Suited for <strong>Visual</strong> Testingthan Targets that Fill inJoshua Pratt, Harold E. Bedell, Joy M. Ohara, Stanley Woo.University of Houston College of Optometry, Houston, TX.Purpose: Training eccentric viewing has been widely implementedas a regular part of low vision services for patients with centralscotomas. In this experiment we investigated whether target typeaffects the retinal fixation location and stability, and specificallywhether targets expected to perceptually fill in are imaged at thevestigial fovea. If targets expected to fill in are imaged at or near thevestigial fovea, then fixation on these targets would allow theprojected location of the vestigial fovea and the pathological scotomato be located accurately in visual space during eccentric viewingtraining, even without the use of a fundus imaging device.Methods: The retinal location and stability of fixation weremeasured using the Nidek MP-1 microperimter in twelve patientswith bilateral central scotomas for six types of fixation target, threeexpected to fill in and three that included letters. The approximateposition of the vestigial fovea was delineated either by using residualretinal landmarks or by locating the residual foveal pit in a densemacular scan, obtained with a Spectralis Optical CoherenceTomographer. Fixation location and stability were compared for thedifferent target types and referenced to the position of the vestigialfovea.Results: All of the subjects except one fixated consistently on targetsthat included a letter using peripheral retinal locations outside of thecentral scotoma. Eleven of the twelve subjects used a retinal locationcloser to the vestigial fovea to fixate targets expected to fill in,compared to letters. Although four of the subjects imaged the fill-intargets at or within a half degree of the vestigial fovea, six othersubjects imaged the fill-in targets at a retinal locus removed from thevestigial fovea. Target type produced no overall significant differencein fixation stability, specified in terms of bivariate contour ellipsearea. However, in some individual subjects fixation tended to bemore stable on letter targets than on fill-in targets.Conclusions: In patients with central field loss, letter targets generatemore consistent fixation behavior than fill-in targets and should beused for eccentric viewing training and perimetry.Commercial Relationships: Joshua Pratt, None; Harold E. Bedell,None; Joy M. Ohara, None; Stanley Woo, NoneSupport: NIH Core Grant P30 EY 07551, Beta Sigma KappaStudent Research GrantProgram Number: 2185Presentation Time: 3:30 PM - 3:45 PMQualitative and Quantitative Assessment of Metamorphopsia inRetinopathy PatientsEmily K. Wiecek 1, 2 , Kameran Lashkari 2, 3 , Steven C. Dakin 1, 4 , PeterBex 2, 3 . 1 Institute of Ophthalmology, University College London,London, United Kingdom; 2 Opthalmology, Harvard Medical, Boston,MA; 3 Opthalmology, Massachusetts Eye and Ear, Boston, MA;4 NIHR Biomedical Research Centre for Ophthalmology, MoorfieldsEye Hospital, London, United Kingdom.Purpose: Metamorphopsia (perceived distortion of visual space) iscommonly experienced by patients with retinal pathology. Althoughthis distortion is typically measured with Amsler charts, moreobjective and quantitative assessments are desirable for effectivemonitoring of the presence, progression, and remediation of visualimpairment. We compare qualitative assessments with novelquantitative methods across a range of retinal pathologies.Methods: An eleven-item questionnaire assessed metamorphopsiasymptoms in 80 patients with monocular distortion frommaculopathy. All patients completed an Amsler assessment(presented on a computer screen with fixation compliance monitoredby an eye tracker), and 35 patients additionally completed two novelobjective measures of metamorphopsia in the central five degrees ofvisual field. One task required participants to arrange dots in a square(combining spatial bisection and Vernier hyperacuities), and the otherused spatial alignment of dichoptically-presented targets. A dichoptictask was also used as a binary measure of inter-ocular suppression.Results: Monocular distortions were suppressed by undistortedvision in the better eye in 45% of patients. Questionnaire scores fromnon-suppressing patients positively correlated with distortionmeasures; however there was no relationship between subjective andquantitative assessments for patients who experienced suppression (p=.03). There was significant negative correlation in the overallvertical direction of distortion between the two novel quantitativedistortion assessments (p = .05), as well as a positive correlationbetween the directional displacement measured in the dichoptic taskand the gaze-contingent Amsler grid quantification (p = .01). Therewere no significant correlations between localized measures of visualdistortion across all three measures.Conclusions: The onset and progression of visual impairment maybe underreported in maculopathy due to the suppression of distortedvisual input from the more impaired eye. It is critical to assessmetamorphopsia monocularly, and we have introduced novel metricsto quantify such visual distortion in central vision.Commercial Relationships: Emily K. Wiecek, None; KameranLashkari, Circadian Technologies (F), Regeneron (R); Steven C.Dakin, None; Peter Bex, Adaptive Sensory Technology, LLC (S),Rapid Assessment of <strong>Visual</strong> Sensitivity (P)Support: R01EY019281, SCD is supported by NIHR BiomedicalResearch Centre for Ophthalmology at Moorfields Eye HospitalProgram Number: 2186Presentation Time: 3:45 PM - 4:00 PMThe effects of central and peripheral visual losses on reachingand graspingAachal Kotecha 1, 2 , Rachel T. Fahy 2 , Gary S. Rubin 2, 1 . 1 NIHR BRCfor Ophthalmology, UCL Institute of Ophthalmology & MoorfieldsEye Hospital, London, United Kingdom; 2 <strong>Visual</strong> Neuroscience, UCLInstitute of Ophthalmology, London, United Kingdom.Purpose: This study aims to evaluate the relative contributions ofcentral and peripheral vision to prehension in visually impairedadults.Methods: Reaching and grasping was quantified using motiondetection cameras (ProReflex, Qualisys AB, Sweden). Subjectsreached and grasped one of two cylindrical objects placed at 20cm or40cm from the hand. Measures were repeated 8 times under each testcondition and the median used in subsequent analysis. Indices of©2013, Copyright by the Association for Research in Vision and Ophthalmology, Inc., all rights reserved. Go to iovs.org to access the version of record. For permissionto reproduce any abstract, contact the <strong>ARVO</strong> Office at arvo@arvo.org.
<strong>ARVO</strong> 2013 Annual Meeting Abstracts by Scientific Section/Group – <strong>Visual</strong> <strong>Psychophysics</strong> / <strong>Physiological</strong> <strong>Optics</strong>prehension planning [movement onset (MO ms); peak speed (Vmm/s), time to peak speed (ttV ms)], execution [movement duration(MD ms); path deviation ratio (PD)] grasping [peak grip aperture(PGA, angle), grip application time (GAT, ms)] and control[deceleration time (DT ms)] were quantified. Analyses wereperformed using repeated measures ANOVA.Results: The results of 9 control (C), 11 age related maculardegeneration (AMD) and 12 glaucoma (G) patients during binocularviewing are presented. There were significant group differences inmovement planning [MO: p < 0.01, V: p = 0.03, ttV: p < 0.01] andgrasping [GAT:p < 0.01] with aspects of execution and online controlapproaching significance [MD: p = 0.06; PD, p = 0.1].AMD and G patients had longer MO ('far,large' condition mean[standard error]: C = 274 [46] ms; G = 378 [87] ms; AMD = 439[104] ms), ttV (C = 594 [79] ms; G = 719 [103] ms; AMD = 766[100] ms) and GAT (C = 411 [74] ms; G = 544 [126] ms; AMD =644 [163] ms); however AMD reaching speed V was slower,suggesting a deficiency in some aspects of movement planning (C =1032 [122] mm/s; G = 918 [150] mm/s; AMD = 854 [94] mm/s). Incontrast, glaucoma patients displayed longer DT (C = 510 [109] ms;G = 552 [79] ms; AMD = 528 [74] ms) , MD (C = 935 [113] ms; G =1078 [192] ms; AMD = 1060 [156] ms) and higher PD (C = 1.14[0.04]; G = 1.16 [0.05]; AMD = 1.12 [0.04]) suggesting difficultieswith online control.Conclusions: This preliminary analysis suggests that whilstglaucoma and AMD patients have deficits in reach to graspmovements compared with controls, they display distinct differencesin movement planning and online control. Further work will explorehow these relate to their specific visual deficiency.Commercial Relationships: Aachal Kotecha, None; Rachel T.Fahy, None; Gary S. Rubin, NoneSupport: Special Trustees of Moorfields Eye HospitalProgram Number: 2187Presentation Time: 4:00 PM - 4:15 PMEffect of central vision loss on mutual gaze perceptionAlexandra R. Bowers 1 , Sarah S. Sheldon 1 , Jessilin Quint 2 , HeikoHecht 3 . 1 Schepens Eye Res Inst, Mass Eye and Ear, Ophthalmology,Harvard Med School, Boston, MA; 2 Indiana University School ofOptometry, Bloomington, IN; 3 Psychologisches Institut, JohannesGutenberg-Universitat, Mainz, Germany.Purpose: The ability to perceive mutual gaze (knowing whethersomebody else is looking at you) is an important nonverbal visual cuethat directs conversations and social interactions. Individuals withcentral vision loss (CVL) have limited access to such cues, whichmay cause difficulties in social situations. We evaluated perceiveddifficulties with gaze perception and examined the relationship withfunctional abilities quantified using a performance-based measure.Methods: 18 persons with CVL (visual acuity 20/60 to 20/250) and18 age-similar controls completed a battery of vision tests, a shortquestionnaire rating perceived difficulties with gaze perception, facerecognition and social interactions, and a gaze perception task. Theyadjusted the positions of the eyes of a life-size virtual head on amonitor at a 1-m distance until the eyes appeared either to be lookingstraight at them or were at the extreme lateral left or right position atwhich they still appeared to be looking toward them. For each trial (n= 48), the angular deviation of the final position of the virtual eyesfrom the straight ahead gaze position was computed. The gaze conewidth was the difference between the extreme left and right positions.Results: CVL participants reported moderate difficulty with knowingwhen somebody was looking at them; moderate difficulty with seeinghow other people reacted in social situations; and a variety of copingstrategies. Controls reported no difficulties. The median gaze conewidths were not significantly different for the two groups (CVL11.5°, controls 13.2°; p = 0.9) neither were the mean judgments ofthe straight ahead gaze direction (CVL 0.1 ± 0.9°, controls 0.2 ± 1.7°;p = 0.82). However, CVL participants had significantly morevariability in their judgments (6.9 ± 2.4° and 4.6 ± 1.8°; p < 0.01).Greater judgment variability correlated with higher levels ofperceived difficulties (r = 0.78, p < 0.001) but not with visual acuity(r = 0.44, p = 0.07) or contrast sensitivity (r = -0.37, p = 0.13).Conclusions: CVL increased the variability of mutual gazejudgments suggesting that CVL participants had more difficulty withthe task than controls; however, the average estimate of gazedirection was similar in the two groups. While traditional visionmeasures did not predict the extent to which CVL affected the morecomplex gaze judgment task, perceived difficulties were predictive ofincreased judgment variability.Commercial Relationships: Alexandra R. Bowers, None; Sarah S.Sheldon, None; Jessilin Quint, None; Heiko Hecht, NoneSupport: NIH grant T35EY007149Program Number: 2188Presentation Time: 4:15 PM - 4:30 PMAssociation of Self-Reported Task Difficulty with BinocularCentral Scotoma LocationsNicole C. Ross, Judith E. Goldstein, Robert W. Massof.Ophthalmology, Johns Hopkins Univeristy, School of Medicine,Baltimore, MD.Purpose: To determine if the location of binocular central scotomasrelative to fixation, predicts the difficulty that low vision patients arelikely to have with driving, reading, and mobility tasks.Methods: This study was conducted in accordance with the tenets ofthe Declaration of Helsinki and Johns Hopkins Institutional ReviewBoard.Perimetry: Central scotomas were mapped with a video haploscopetangent screen in 284 patients. The haploscope consisted of 2 flatpanel displays, one per eye, imaged at infinity through 9mm diameterexit pupils centered on the patient’s pupils. The patient’s refractiveerror corrections were incorporated into the optical paths. Infraredvideo cameras where used to monitor ocular alignment and fixationstability. The patient fused the two 50 o h x 40 o v displays and thefixation cross was imaged at the center of both displays, therebyproviding binocular fixation, while test stimuli were presentedmonocularly at 43 locations in a 25 o square grid around fixation.Self Reported Difficulty Ratings: Patients rated difficulty of a subsetof 120 reading, 50 mobility and 22 driving tasks in the ActivityInventory on a five point scale. Rasch analysis was used to estimateself-perceived ability for driving, reading and mobility for eachpatient.Analysis: Unpaired, two tailed t-tests were performed on distributionsof each ability measure for each test location in the central fieldcomparing patients who detected the stimulus to those who did not.Results: Driving: Scotomas below and to the lower right of fixationand a single point 10 o above and to the right of fixation wereassociated with significant decreases in self-perceived driving ability.Reading: Scotomas from 7.5 o left of fixation to 12.5 o right of fixationand scotomas below and to the lower right of fixation were associatedwith significant decreases in self-perceived reading ability.Mobility: Scotomas below and to the upper right of fixation weremost strongly associated with decreases in self-perceived mobilityfunction.Conclusions: Driving difficulty is associated with scotomas that fallon the instrument panel and rear view mirror when gazing straightahead. Reading difficulty is associated with scotomas that could©2013, Copyright by the Association for Research in Vision and Ophthalmology, Inc., all rights reserved. Go to iovs.org to access the version of record. For permissionto reproduce any abstract, contact the <strong>ARVO</strong> Office at arvo@arvo.org.
<strong>ARVO</strong> 2013 Annual Meeting Abstracts by Scientific Section/Group – <strong>Visual</strong> <strong>Psychophysics</strong> / <strong>Physiological</strong> <strong>Optics</strong>interfere with text preview and navigating to the next line. Mobilitydifficulty is associated with scotomas that could interfere withidentifying information below the line of sight.Commercial Relationships: Nicole C. Ross, None; Judith E.Goldstein, None; Robert W. Massof, NoneSupport: NEI grant EY012045 and MD 22 Lions Vision ResearchFoundation Postdoctoral Fellowship288 Refractive Errors, Myopia IMonday, May 06, 2013 2:45 PM-4:30 PMExhibit Hall Poster SessionProgram #/Board # Range: 2327-2343/B0286-B0302Organizing Section: <strong>Visual</strong> <strong>Psychophysics</strong> / <strong>Physiological</strong> <strong>Optics</strong>Program Number: 2327 Poster Board Number: B0286Presentation Time: 2:45 PM - 4:30 PMDaily interruptions to hyperopic defocus can reduce induced eyegrowth in marmosetsAlexandra Benavente-Perez, Ann Nour, Luying Yan, Keisha Roden,Kathleen Abarr, David Troilo. Biological Sciences, SUNY Collegeof Optometry, New York, NY.Purpose: To assess the effect that short daily interruptions toimposed hyperopic defocus have on the eye growth of marmosets,and to measure the effective refractive state during the interruptionperiod.Methods: A total of 20 marmosets were treated with -5D contactlenses on their right eyes for 12 weeks from the age of 10 weeks ofage (left eyes wore plano controls). On-axis vitreous chamber depth(VC) was measured after four (T4), eight (T8) and twelve weeks oftreatment (T12). Fifteen marmosets wore contact lenses continuouslyfor 9hrs/day and five had both contact lenses removed for 30minstwice/day (mid morning and mid afternoon) during the first four andlast four weeks of treatment. Vision during the interruptions wascontrolled by placing the marmoset in a primate chair at the center ofa 1m radius cylinder with videos of animal scenes projected on thewall. Noncyloplegic Rx was measured at 5min intervals using aninfrared video photorefractor (Power Refractor, MultiChannelSystem) while the marmosets were in the chair. Untreated marmosets(N=25) were used as controls.Results: At T4 the interocular difference in ocular growth rates in theinterrupted lens-reared group was smaller than in the continuous lensreared group (mean±SE exp-con: -0.3±1.3 vs +3.6±1.0 µm/day,p0.05).While inside the cylinder, the marmosets experienced an overallrelative myopic defocus of -2.07±0.63D during T4 that increased to -4.08±1.63 D during T12.Conclusions: Daily brief interruptions to imposed hyperopic defocusprevent the increased rate of ocular growth triggered by -5D contactlenses in marmosets. The effects were stronger when the interruptionshappened early during treatment than when the interruptions wereapplied to eyes that were already growing faster to compensate forimposed hyperopia.Commercial Relationships: Alexandra Benavente-Perez, None;Ann Nour, None; Luying Yan, None; Keisha Roden, None;Kathleen Abarr, None; David Troilo, NoneSupport: NIH R01 EY11228Program Number: 2328 Poster Board Number: B0287Presentation Time: 2:45 PM - 4:30 PMLuminance and Color Changes with Defocus Provide DifferentialCues For EmmetropizationMolly Fellows 1 , Gagan Kaur 2 , Ashley Tang 1 , Frances J. Rucker 1 .1 Biomedical Science & Disease, New England College of Optometry,Boston, MA; 2 Southern California College of Optometry, Fullerton,CA.Purpose: Factors that interfere with lens compensation areconsidered to interfere with emmetropization. We examine the effectsof color and luminance changes on lens compensation.Methods: Exp. 1: 5-7 day old chicks were exposed daily (9am-5pm)for three days, on consecutive weeks, to 2Hz sinusoidal, in-phase(LUM), modulated white light (619 nm + 515 nm + 460 nm; Mean680 lux) or to counterphase-modulated red/green light (R/G). Chickswore either a negative or a positive 7 D lens on alternate weeks.Exp. 2: 14 day old chicks were exposed daily (9am-5pm) for threedays to 2Hz sinusoidal, in-phase, modulated white light (619 nm +515 nm + 460 nm; Mean 850 lux) either with (+B) or without bluelight (-B). Chicks wore either a negative or positive 7 D lens on oneeye. Chicks wore no lenses in a control, no flicker condition.Chicks were kept in the dark overnight after exposures and otherwisein a brooder on a 12/12 hr light cycle between experiments. Relativechanges in the ocular components were measured with ultrasound(Exp.1) or with Lenstar (Exp. 2) and with a Hartinger refractometer.Results: Exp. 1: LUM flicker, but not R/G flicker, interfered withpositive lens compensation. There was a change in refraction in R/G(wk1: 4.93 ± 2.116 D; p=0.02) but not in LUM (wk1: 2.43 ± 2.68 D),despite a reduction in eye growth in all conditions (R/G: -196 ± 30μm; LUM: - 139 ± 24 μm; p
<strong>ARVO</strong> 2013 Annual Meeting Abstracts by Scientific Section/Group – <strong>Visual</strong> <strong>Psychophysics</strong> / <strong>Physiological</strong> <strong>Optics</strong>diameters underwent a full ophthalmologic examination includingSD-OCT. The distribution of MNF in the fundus photography wascompared with the regional excavation of the scleral excavation invertical or horizontal scan and circular scan centered on the optic discof SD-OCT.Results: In all cases, SD-OCT visualized MNF as hyperreflectivethickening of retinal nerve fibers and there were no morphologicabnormalities in the photoreceptor layers in the fovea. In eyes withtemporally extended MNF, the tilting of Bruch’s membrane invertical scans of SD-OCT was significantly associated with the majordistribution of myelination (P < 0.001). The slope of Bruch’smembrane was much smaller in the adult group than in the childgroup (P = 0.008). The area of MNF in fundus photography and focalscleral excavation in the peripapillary circular SD-OCT scan imageswere significantly correlated (P
<strong>ARVO</strong> 2013 Annual Meeting Abstracts by Scientific Section/Group – <strong>Visual</strong> <strong>Psychophysics</strong> / <strong>Physiological</strong> <strong>Optics</strong>Program Number: 2331 Poster Board Number: B0290Presentation Time: 2:45 PM - 4:30 PMEffects of Eyeglass Correction on Oral Reading Fluency inElementary and Middle School ChildrenIrene Campus 1 , Mabel Crescioni 1 , Tina K. Green 1 , John D. Twelker 1,2 , Joseph M. Miller 1, 2 , Erin M. Harvey 1, 2 . 1 Ophthalmology andVision Science, University of Arizona, Tucson, AZ; 2 College ofPublic Health, University of Arizona, Tucson, AZ.Purpose: To examine the influence of eyeglass correction on oralreading fluency.Methods: Eye examinations were conducted on students in grades 2-8 who failed a vision screening test. Exams included cycloplegicrefraction and subjective refinement. Glasses were prescribed forchildren who met the following criteria: Astigmatism ≥ 1.00 D,Myopia ≥ 1.00 D on any meridian, or Hyperopia ≥ 2.50 D sphericalequivalent (SE) in either eye, or anisometropia ≥ 1.50 D SE.Eyeglasses were dispensed at a second testing session several weeksafter the exam for students meeting the criteria for eyeglasscorrection (N=21). DIBELS Oral Reading Fluency (ORF) (astandardized test of accuracy and fluency with connected text) wasmeasured at the eyeglass dispensing session, and children were testedwithout correction (3 passages read). Several weeks later (average6.31 weeks, SD 4.44), after students had adjusted to their eyeglasses,DIBELS ORF was repeated while children were wearing their bestcorrection. Students in 7th and 8th grade completed DIBELS ORFfor the 6th grade level, the highest grade level available. DIBELSORF median raw score was determined for tests conducted whileuncorrected and corrected, and scores were converted to percentilesResults: Most students were prescribed eyeglasses for astigmatism(18) and/or myopia (14), with one meeting the criteria for hyperopia.DIBELS ORF percentile scores increased significantly an average of7.14 (SD 11.49, p < 0.02) with eyeglass correction. Amount ofimprovement was not significantly correlated with time between tests(duration of new eyeglass wear).Conclusions: Students who meet common criteria for eyeglassprescription show rapid improvement in reading fluency througheyeglass wear. Due to the short follow-up interval and the fact thatimprovement was not correlated with time from first to second test, itis likely that this effect is a result of improved visual clarity, asopposed to advances in reading skills resulting from instruction(learning). There may be additional long-term effects on reading as aresult of improved visual clarity, but this study did not measure theseeffects. These results indicate the importance of vision screening inschools with follow-up to eye care professionals as needed.Commercial Relationships: Irene Campus, None; MabelCrescioni, None; Tina K. Green, None; John D. Twelker, None;Joseph M. Miller, None; Erin M. Harvey, NoneSupport: NIH/NEI 13153, Research to Prevent BlindnessProgram Number: 2332 Poster Board Number: B0291Presentation Time: 2:45 PM - 4:30 PMPeripheral photoreceptor activity during accommodation andemmetropizationBrian P. Schmidt 1 , Maureen Neitz 2 , Jay Neitz 2 . 1 Graduate Program inNeurobiology and Behavior, University of Washington, Seattle, WA;2 Ophthalmology, University of Washington, Seattle, WA.Purpose: Myopia results when the eye grows too long for its optics.The importance of the peripheral retina in emmetropization hasrecently been appreciated and our group has argued that the relativeactivity of cone photoreceptors contributes as well. However, therehas not been a systematic analysis of how peripheral photoreceptoractivity might be stimulated by natural images during nearaccommodation over the period of life which emmetropizationoccurs. The present work uses mathematical modeling to develop atheoretical framework of emmetropization based on the observationthat the peripheral retina is often exposed to distant scenes when thefovea is accommodated to near objects.Methods: The OSLO ray tracing software (Lambda Research) wasused to derive modulation transfer functions of a schematic eye(Escudero-Sanz & Navarro 1999 J. Opt. Soc. Am. A. 16:1881-91) forseveral eccentricities and accommodation states. The amplitudespectrum of calibrated natural images (Tkačik et al. 2011 PLoS One6:e20409) were computed with a fast Fourier transform and fit with a1 / f power law. The activity of photoreceptors was modeled as adifference of Gaussians. Finally, the transfer functions, amplitudespectrum and photoreceptor model were combined to obtain theresponse from the peripheral cone photoreceptor mosaic to theaverage natural scene.Results: Accommodation to near objects results in a significant lossof medium and high spatial frequencies for images of distant objectsin the peripheral retina relative to the fovea reducing the relativeactivity of photoreceptors there. This loss of frequency content ispartially ameliorated by accommodative lag that has been observed inyoung children but decreases during emmetropization.Conclusions: Considering the statistical environment and the opticaltransfer functions characteristic of common accommodation states wecompute that the amount of information the peripheral retina receivesabout the visual environment during near accommodation to smallcentrally fixated targets changes systematically duringemmetropization. This change may regulate the signals that controleye growth. The reason near work contributes to myopia may bebecause the spatial frequency content of the images produced in theperiphery during such activity simulates the normal signals producedby natural scenes in peripheral retina of a young hyperopic eye.Commercial Relationships: Brian P. Schmidt, None; MaureenNeitz, Genzyme (F), Alcon (F), Alcon (P); Jay Neitz, Alcon (F),Alcon (P)Program Number: 2333 Poster Board Number: B0292Presentation Time: 2:45 PM - 4:30 PMRelation between refractive astigmatism and change in sphericalequivalent with age in a sample of Native American children age3 to 18 years of ageErin M. Harvey 1, 2 , John D. Twelker 1, 2 , Joseph M. Miller 1, 2 .1 Ophthalmology and Vision Science, University of Arizona, Tucson,AZ; 2 College of Public Health, University of Arizona, Tucson, AZ.Purpose: To determine if presence of refractive astigmatism isassociated with change in spherical equivalent (SE) refractive error inchildren age 3 to 18 years of age.Methods: Subjects were participants one or more NIH/NEI fundedstudies of visual development in Tohono O’odham children(“Collaborative Longitudinal Evaluation of Ethnicity and RefractiveError” (CLEERE, Tucson Site), “Astigmatism and AmblyopiaAmong Native American Children”, “Amblyopia in AstigmaticChildren: Development and Treatment”). Previous research hasdocumented a high prevalence of with-the-rule astigmatism in thispopulation. A baseline exam was conducted and follow-up examswere attempted at least yearly for each study. Data was combinedacross studies. Cycloplegic autorefraction (Retinomax Autorefractor(KPlus or KPlus2, Nikon Inc., Tokyo Japan)) was conducted at eachstudy exam. Subject exams that met the following criteria wereincluded in analyses: age 3 to < 19 years, right eye autorefractionconfidence ≥ 8. Only subjects with at least two study exams and aminimum interval of 1 year between first and last exam wereincluded in analyses. Analyses included only right eye data, and onlydata from each child’s baseline and final study exams. Linear©2013, Copyright by the Association for Research in Vision and Ophthalmology, Inc., all rights reserved. Go to iovs.org to access the version of record. For permissionto reproduce any abstract, contact the <strong>ARVO</strong> Office at arvo@arvo.org.
<strong>ARVO</strong> 2013 Annual Meeting Abstracts by Scientific Section/Group – <strong>Visual</strong> <strong>Psychophysics</strong> / <strong>Physiological</strong> <strong>Optics</strong>regression analysis was conducted to determine the relation betweenbaseline refractive astigmatism and change per year in SE refractiveerror with age (change is SE/fu interval). The following variableswere also included: sex, baseline age, follow-up interval, baseline SE.Results: For the 2,043 subjects who met inclusion criteria, mean agewas 6.13 years (SD 2.90) at baseline and 10.70 years (SD 3.56) atfollow-up, with a mean follow-up interval of 4.57 years (SD 3.28).SE tended to shift towards less hyperopia/more myopia with age inmost children (Table 1). On average, there was a shift towards lesshyperopia/more myopia of 0.16 D/year (Table 2). Neither of thesetrends varied significantly with amount of baseline astigmatism.Regression analysis yielded significant effects of age, sex, length offollow-up interval, and baseline SE on change per year in SE, but nosignificant effect of baseline astigmatism magnitude.Conclusions: The results of the present study indicate that highlyastigmatic children in this population are not at increased risk fordevelopment or progression of myopia.Sensor, the Pediatric Wavefront Evaluator (PeWE). Children rangedin age from 6 mos to 9 yrs. Images were recorded while childrenwatched a cartoon at 50 cm (near, n) and 2 m (distant, d) viewingdistance. At least 7 focused and centered images were obtained atboth fixation distances, with undilated pupil diameters ranging from 3to 5 mm. Zernike decomposition to 4th order was performed. Lowerorder aberrations were converted to m, j0 and j45. Signed Zerniketerms Z(3,1) (y coma, yc), Z(3,-1) (x coma, xc) and Z(4, 0) (sphericalaberration, sa) were derived for the observed mm pupil diameter(mmpd). Three different pupil scaling methods were used: (1) allterms were scaled down to 3mmpd, (2) those greater than 4 mmpdscaled down to 4 mmpd (data with pupil < 4 mm excluded), and (3)all were scaled up to 5 mmpd. Within each subject, at least 3observations were required at 4mmpd to be averaged, while 7 werealways averaged at 5 mmpd and 3 mmpd. Paired sample (d and n) t-tests on the signed coefficients (micron) were compared at 3, 4, and 5mmpd.Results: As expected, accommodation produced a change in m fromn to d of -1.33 to -0.25D (p=0.000). A small (
<strong>ARVO</strong> 2013 Annual Meeting Abstracts by Scientific Section/Group – <strong>Visual</strong> <strong>Psychophysics</strong> / <strong>Physiological</strong> <strong>Optics</strong>Lomb, Inc., Rochester, NY) on natural pupils in a dark room. BestcorrectedlogMAR visual acuity (BCVA) was measured monocularlyin normal room illumination. Cycloplegic autorefraction wasperformed.Results: Data from 1007 right eyes were analysed. Median (IQR)BCVA and spherical equivalent were -0.06 (-0.10, 0) and +0.25 (-0.38, 0.63) diopters (D), respectively. The median (IQR) 6mm higherorder aberrations (HOA) was 0.58 (0.44, 0.79) μm. Coma-likeaberrations, third, fourth and fifth HOAs were significantly differentbetween individuals with BCVA equal to or better than 6/4.8 andworse than 6/4.8 Snellen score. Fourth order aberrations (Z4-4p=0.024, Z4-2 p=0.029) and second order aberrations (Z20
<strong>ARVO</strong> 2013 Annual Meeting Abstracts by Scientific Section/Group – <strong>Visual</strong> <strong>Psychophysics</strong> / <strong>Physiological</strong> <strong>Optics</strong>necessary to drive and can improve legally blind vision to a highlyfunctional level.Commercial Relationships: Lloyd M. Cuzzo, None; Jesse L.Berry, None; Peter A. Quiros, NoneTable 1Commercial Relationships: Julie-Anne Little, None; Pamela M.anketell, None; Stephen M. Gallagher, None; Kathryn J.Saunders, NoneSupport: HSC R&D Office Northern IrelandProgram Number: 2338 Poster Board Number: B0297Presentation Time: 2:45 PM - 4:30 PMUnmet Need for Corrective Eyeglasses: Follow-up Results from aLos Angeles County Hospital SurveyLloyd M. Cuzzo 1, 2 , Jesse L. Berry 1, 2 , Peter A. Quiros 1, 2 .1 Ophthalmology, Doheny Eye Institute, Los Angeles, CA; 2 KeckSchool of Medicine, University of Southern California, Los Angeles,CA.Purpose: To demonstrate that donated eyeglasses can be used forvision correction in settings where patients cannot afford to purchaseprescription glasses.Methods: Patients at the Los Angeles County (LAC) Ophthalmologyclinic who were identified as having refractive error were manifestrefracted and prescribed glasses over a one-month period. Those whocould not afford glasses were given glasses from a donated glassescollection in the clinic. Donated glasses with closest prescription totheir manifest refraction were given to the patients. <strong>Visual</strong> acuity(VA) was recorded without glasses, with manifest refraction (MRx),and with donated glasses. VA before and after glasses were convertedto logMAR. This study was approved by the University of SouthernCalifornia iSTAR Internal Review Board and the methods were inaccordance with the guidelines of Declaration of Helsinki.Results: The results presented in this study come from the firstmonth of dispensing glasses from a donated eyeglasses program.During the month, 7 patients (14 eyes) were refracted and thenprovided recycled glasses. Two of the eyes had a VA of no lightperception and thus were excluded from the study. Of the 12 eyesincluded in the study, the average logmar VA before glasses was 0.93which correlates to a snellen VA of 20/170 (range 20/30-20/400).The average best corrected logmar VA after MRx was 0.32,correlating to snellen VA of 20/42 (range 20/25-20/100). Withdonated glasses the average logmar was 0.41 correlating to a snellenVA of 20/50 (range 20/30-20/100). Five of the 7 patients (71%) had aVA less than the level required for driving (20/40 or better in at leastone eye) without glasses but were able to attain ‘driving’ vision withdonated glasses. Three of the 7 (43%) patients were previouslylegally blind without corrective refractive lenses (20/200 or worse inboth eyes) but with donated lenses improved on average to 20/70.Conclusions: Previously the authors have demonstrated that cost is amajor factor in preventing low-income, un- or under-insured patientsat LAC Hospital from obtaining prescription eyeglasses. Donatedeyeglasses are a functional, cost effective means for significantlycorrecting refractive error. In many patients they can restore visionProgram Number: 2339 Poster Board Number: B0298Presentation Time: 2:45 PM - 4:30 PMEpidemiological profile of ophthalmological care in the PublicService in BrazilMarisa N. Figueiredo 1 , Larissa Rossana S. Stival 1 , Marcia L.Machado 1 , Joao J. Nassaralla 2 . 1 Cornea and Refractive Surgery,Instituto de Olhos de Goiânia, Goiania, Brazil; 2 Retina and Vitreous,IOG, Goiania, Brazil.Purpose: To improve health services it is necessary to know thedemand profile. This study was carried out with the 2 objectives: toidentify the main reasons to seek an ophthalmologic public careservice in Brazil (SUS - Brazilian National Health Care System) andto analyze the frequency of the principal diagnoses, aiming to achievegoals of loss in eyesight prevention.Methods: This is an observational, retrospective, cross studyconducted from March to August 2012, at the Instituto de Olhos deGoiânia (Goiânia Eye Institute), analyzing 1670 patients, thereforerepresenting a good share of the Goiás State and Mid-WesternBrazilian region. The data were obtained through the analysis of themedical records with the ICD-10 registration. The studied variableswere age and sex of patient, origin, eye discomfort complaints,comorbidities and diagnosis (ICD-10).Results: The ages ranged from 0 to 99 years and the mean age was56.9 years. There was a predominance of females (58.1%) and themain origin of patients was Goiânia (61.5%) against 38.5% frominterior. It was detected a prevalence of 45.9% of patients with ahistory of Systemic Arterial Hypertension, 16.8% of DiabetesMellitus and 5% of glaucoma. The main reason for the consultationwas low visual acuity (70%), followed by burning (26%) anditchiness (24.4%), as shown in Figure 1. Among the abnormal teststhere was a high prevalence of refractive errors (73.4%) andpresbyopia (59.6%). The cause of refractive errors was astigmatism(70.5%), hypertrophy (58.6%) and myopia (15.1%). Table 2 showsother main diagnosis results.Conclusions: The consequences of blindness are becoming animportant issue in public health. Primary care professionals play arelevant role in prevention and control of ocular disabilities in theircommunities. Understanding the main complaints and commoneyesight health problems in a particular region can help bettermanage the public resources and make a better planning for strategicaction aiming to reduce and control visual impairment and blindness.©2013, Copyright by the Association for Research in Vision and Ophthalmology, Inc., all rights reserved. Go to iovs.org to access the version of record. For permissionto reproduce any abstract, contact the <strong>ARVO</strong> Office at arvo@arvo.org.
<strong>ARVO</strong> 2013 Annual Meeting Abstracts by Scientific Section/Group – <strong>Visual</strong> <strong>Psychophysics</strong> / <strong>Physiological</strong> <strong>Optics</strong>Commercial Relationships: Marisa N. Figueiredo, None; LarissaRossana S. Stival, None; Marcia L. Machado, None; Joao J.Nassaralla, NoneClinical Trial: NCT01740466Program Number: 2340 Poster Board Number: B0299Presentation Time: 2:45 PM - 4:30 PMComparison of a Novel Cell Phone-Based Refraction Technique(Netra-G) with Subjective RefractionHilary Gaiser 1 , Bruce Moore 1 , Vitor Pamplona 2 , Nadine Solaka 1 ,David Schafran 1 , Dennis Merrill 2 , Nathaniel Sharpe 2 , Joe R.Geringer 2 , Ramesh Raskar 2 . 1 New England College of Optometry,Boston, MA; 2 EyeNetra Inc, Somerville, MA.Purpose: To assess the performance of a cell phone based refractingdevice (NETRA-G). This study determines the accuracy of thisprototype in determining refractive error in comparison to subjectiverefraction (SR).Methods: NETRA-G (NET) retrofits a high-resolution mobile phone(Sony Xperia U) by adding a pinhole mask, a film and a lens onto thedisplay. The device is bi-ocular with the fellow eye viewing an objectat infinity. The subject aligns red and green lines with the translationon screen proportional to refractive error. 27 subjects (mean + SD age24.79 +/- 1.60) underwent SR, and NET refraction. Subjectsrefractive error ranged from plano to -6.0D (mean + SD refraction -3.34 +/- 1.46D). Exclusion criteria included amblyopia, floaters,divergent vertical deviation and any ocular pathology. The NETresult was used as a starting point for SR.Results: For all 27 subjects (54 eyes), the average absolute differencebetween NET and SR is 0.31 +/- 0.37D. The refraction determined byNET is well correlated with that of SR r=0.96 and the two measureswere not statistically significantly different from each other(p=0.36>0.05). Orthogonal linear regression fit presented a slope of0.92 and a y-intercept of -0.36D. Average difference on visual acuitybetween SR and NET 0.089 +/- 0.13 logMar and 77% received 20/25or better vision directly from NET.Conclusions: When compared to SR, NET slightly overestimated themyopic refractive errors and had a small myopic offset of -0.36D. Onaverage, the visual acuity difference between SR and NET is lessthen a line on the logMar chart. The results show that NET haspotential to be a used as an effective tool for rapidly estimatingrefractive errors by non-eyecare professionals. Accuracy of this noveltechnique is expected to increase as technology evolves.Commercial Relationships: Hilary Gaiser, None; Bruce Moore,EyeNetra Inc. (I); Vitor Pamplona, EyeNetra (E); Nadine Solaka,None; David Schafran, EyeNetra Inc (R); Dennis Merrill, None;Nathaniel Sharpe, Eyenetra (E); Joe R. Geringer, Impact ProductDevelopment., LLC (C); Ramesh Raskar, EyeNetra Inc (I)Program Number: 2341 Poster Board Number: B0300Presentation Time: 2:45 PM - 4:30 PMComparison of Cycloplegic Handheld Autorefraction withConventional Cycloplegic Retinoscopy in a Pediatric PopulationSmitha Inaganti 1 , Nisha Krishan-Dave 2 . 1 Ophthalmology, New YorkMedical College, New York, NY; 2 Ophthalmology, MetropolitanHospital, New York, NY.Purpose: Several studies have found that autorefraction undercycloplegic conditions is accurate enough to substitute forcycloplegic retinoscopy in children. The purpose of this study is toanalyze whether cycloplegic handheld autorefraction is accurate andconsistent with cycloplegic retinoscopy performed by ophthalmologyresidents in a pediatric population.Methods: A retrospective chart review was performed of pediatricpatients in an inner-city, resident eye clinic between November 2011and November 2012. We identified 200 eyes of 100 patients betweenthe ages of 3 and 17 who underwent post cycloplegic handheldautorefraction with the Righton Retinomax 3, followed by streakretinoscopy and subjective manifest refraction, all performed bysecond year ophthalmology residents. Spherical equivalence,spherical power, cylindrical power and axis measurements werecompared.Results: Spherical equivalence measured by autorefractor wassignificantly different from both retinoscopy (p
<strong>ARVO</strong> 2013 Annual Meeting Abstracts by Scientific Section/Group – <strong>Visual</strong> <strong>Psychophysics</strong> / <strong>Physiological</strong> <strong>Optics</strong>optical clarity of the +0.50D retinoscopic endpoint was alsocompared to an infinity endpoint using diverging light.Methods: A Copeland Optec 360 Streak Retinoscope (Fig. 1) wascalibrated for a 65cm retinoscopic working distance (RWD) andmarked for a +0.50D retinoscopic endpoint using +1.00D converginglight (CCR +050D ) and a infinity retinoscopic endpoint (∞) using -1.50D diverging light. Slide locks maintained the alignment of thecalibration line with the marked positions. The CCR +050D retinoscopictechnique uses the principles of conventional retinoscopy and doesn’trequire a fogging lens. With a phoropter, twenty-six normal andabnormal eyes of patients aged 11-77 with undilated pupils wereretinoscoped using the CCR +050D technique as they read the Snellenchart. The +0.50D endpoint was compared to the infinity endpoint byadding a +1.50D sphere and elevating the calibration line from the+0.50D position to the ∞ position with the thumb slide. A subjectiverefraction was performed and the results compared to the CCR +050Dmeasurements.Results: The mean differences and 95% confidence intervalsbetween the spherical equivalents (SE) and crossed cylinders (X/Cyl)of the CCR +050D endpoints and subjective refractions were: 0.03(-0.21to +0.21)D SE and 0.00(-0.21 to +0.21)D X/Cyl . The +0.50D pupillaryreflexes were brighter, sharper and easier to evaluate than the dullinfinity pupillary reflexes.Conclusions: The results indicate a high degree of accuracy for theCCR +050D technique in contrast to the accuracy/repeatability studiesof conventional retinoscopy. This is due to the calibrated visibleretinoscopic endpoint plus eliminating the fogging lens, the 0.50Dzone of doubt, the dull undetectable infinity endpoint, cycloplegicsand other disadvantages of conventional retinoscopy. Sinceretinoscopes are the only uncalibrated instruments used to measure arefractive error, they can produce different spherical measurementsand many cannot be calibrated. The clear CCR +050D endpoint shouldimprove the efficiency of the office and make retinoscopy easier toperform and teach.Ocular Refractive State In Fighting BullsJuan I Seva 1 , Manuel Sanes 1 , Francisco Martinez-Gomariz 1 , MatteoLo Sapio 2 , Juan M. Bueno 2 . 1 Facultad de Veterinaria, Universidad deMurcia, Murcia, Spain; 2 Laboratorio de Optica, Universidad deMurcia, Murcia, Spain.Purpose: Fighting bulls are bred free range on extensive farms undersimilar experimental conditions, well-defined manipulationprocedures and hardly human contact. Although they are geneticallyselected for a certain combination physical energy andaggressiveness, their behavior usually differs among animals duringbullfighting. It is believed that bulls present some lateral preferencesand sometimes they do not have a correct (near or far) vision. Weinvestigate whether differences in the ocular refractive state (RS)might be part of this lateralized visual processing.Methods: One-hundred and fifty eyes from 75 fighting bulls wereinvolved in the study. Animals were obtained from a localbullfighting arena. They were raised in different farms distributed allacross the country and ages ranged from 48 to 70 months. Enrolmentwas preceded by a veterinarian examination to rule out the presenceof any physical factor likely to interfere with the usual fighting. TheRS of each eye was assessed via streak retinoscopy with trial lensesin the horizontal meridian immediately after the regular bullfightingtook place. Before assessment we ensured the eyes kept their opticalproperties intact.Results: RS values varied between -1.25 and 2.5 D, with a mean of+0.65 D (SD=+/-0.80 D). Although both eyes were highly correlated(R=0.79), left eyes tend to be less ametropic. 8% of eyes (12/150)were myopic (refraction < -0.5 D). Anisometropia (difference in RSin a pair of eyes > 0.5 D) was detected in 35 animals (23%). RS wasnot correlated with either age or weight. No significant differences inRS among the animals coming from different farms were found.Conclusions: RS values of fighting bulls varied widely, althoughthey tend to be slightly hyperopic. This RS could explain theirbehavior when stimuli are presented at different locations, especiallyat short distances. Moreover, the existence of a certain degree ofanisometropy between pairs of eyes might be a factor contributing toa possible visual lateralization, and might help to understanddifferences in the behavior when the stimulus is presented in front ofan eye or the other.Commercial Relationships: Juan I Seva, None; Manuel Sanes,None; Francisco Martinez-Gomariz, None; Matteo Lo Sapio,None; Juan M. Bueno, NoneSupport: Ministerio de Edicación y Ciencia, Spain (grants FIS2009-06234-E)Fig. 1 Retinoscope calibrated for CCR +050D and infinity pupillaryreflexes and the RWD.Commercial Relationships: Clinton N. Sims, US 8,272,739 B2 (P),US 8,272,740 B2 (P)Program Number: 2343 Poster Board Number: B0302Presentation Time: 2:45 PM - 4:30 PM308 Binocular Vision and StereopsisTuesday, May 07, 2013 8:30 AM-10:15 AMTCC LL 4/5 Paper SessionProgram #/Board # Range: 2658-2664Organizing Section: <strong>Visual</strong> <strong>Psychophysics</strong> / <strong>Physiological</strong> <strong>Optics</strong>Program Number: 2658Presentation Time: 8:30 AM - 8:45 AMMechanisms underlying global stereopsis in fovea and peripheryRobert F. Hess, Nirel Witz. Ophthalmology, McGill University,Montreal, QC, Canada.Purpose: To better understand the mechanisms underlying globalstereopsis we examined the relationship between carrier luminancespatial frequency and modulator disparity spatial frequency.Methods: Thresholds for detecting global sinusoidal disparitycorrugations of equi-detectable spatially band-pass noise weremeasured as a function of modulator disparity spatial frequency for©2013, Copyright by the Association for Research in Vision and Ophthalmology, Inc., all rights reserved. Go to iovs.org to access the version of record. For permissionto reproduce any abstract, contact the <strong>ARVO</strong> Office at arvo@arvo.org.
<strong>ARVO</strong> 2013 Annual Meeting Abstracts by Scientific Section/Group – <strong>Visual</strong> <strong>Psychophysics</strong> / <strong>Physiological</strong> <strong>Optics</strong>both centrally and peripherally located stimuli using a standard 2-IFCtask.Results: We found a characteristic relationship that depended onmodulator disparity spatial frequency. At high modulator disparityspatial frequencies (>1 c/d), there is an optimal ratio of around 2.6,whereas at low modulator disparity spatial frequencies, there is anoptimal absolute carrier luminance spatial frequency (i.e., 3 c/d). Inthe periphery, vision is restricted to modulator disparity spatialfrequencies below 1 c/d and, as a consequence, follows the aboverule, there is an optimum absolute carrier luminance spatial frequencythat reduces in spatial frequency with increasing eccentricity.Conclusions: This finding is consistent with there being more thanone channel processing global stereo. This is subsequently confirmedusing a 2x2 AFC detection/discrimination paradigm. Furthermore,because of the different carrier/modulator relationships in central andperipheral vision, peripheral global stereo cannot be simply related tocentral global stereo by a scaling factor and thus cannot be simplydue to cortical magnification as previously proposed.Commercial Relationships: Robert F. Hess, None; Nirel Witz,NoneSupport: NSERC (#46528-11)Program Number: 2659Presentation Time: 8:45 AM - 9:00 AMEffect of inter-ocular differences in blur on spatial and stereoresolutionSowmya Ravikumar 1 , Bjorn Vlaskamp 2 , Martin S. Banks 1 . 1 VisionScience, University of California Berkeley, Berkeley, CA; 2 PhilipsResearch, Eindhoven, Netherlands.Purpose: Monovision—setting the refraction of one eye to adifferent value than the other—is a procedure for dealing withpresbyopia. The difference in refractions for the two eyes should bethe appropriate value for maximizing visual performance, but there islittle research on what the appropriate value is. We know that bothvisual acuity and stereoacuity worsen as blur increases. However,visual-acuity tasks can in principle be performed when one eye issuppressed, but stereo tasks cannot. Thus, visual acuity might belimited by image quality in the better eye while stereoacuity might belimited by the poorer eye. Some previous observations are consistentwith these expectations. Indeed, blur in one eye can be moredetrimental to stereoacuity than the same blur in both eyes (blurparadox).Methods: We compared visual acuity and stereoacuity in the sameobservers with the same blur manipulations. Stimuli were displayedbinocularly using a custom stereoscope. Accommodation wasparalyzed with cyclopentolate. An artificial pupil set the effectiveaperture to 4mm. Blur was introduced with ophthalmic lenses. Wemeasured visual acuity with a letter-identification task. We measuredstereoacuity using a random-dot stereogram that created sinusoidalcorrugations in depth oriented +/- 20 degrees about the horizontal;subjects indicated which of two corrugation orientations waspresented.Results: The results were consistent with our expectations. Forvarying amounts of blur in the two eyes, visual acuity closelyconformed to the better eye’s performance while stereoacuity waslargely limited by the worse eye’s blur. Monocular blur had almostno effect on visual acuity, with binocular visual acuity remainingclose to 20/20 with up to 1.5D blur in one eye. For the same amountof blur, stereoacuity decreased by a factor of almost two. When theblur was equal in the two eyes, stereoacuity was slightly better thanwhen the same blur was present in one eye only (e.g., In comparing1.5D in both eyes to 1.5D of blur in one eye only, in one subject,stereo-acuity was 1.98 cpd compared to 1.13 cpd and in anothersubject, stereoacuity was 1.54 cpd compared to 1.37 cpd).Conclusions: The results will help us design monovision protocols ina way that is the best compromise between visual acuity andstereoacuity for various viewing distances.Commercial Relationships: Sowmya Ravikumar, None; BjornVlaskamp, Philips (E); Martin S. Banks, NoneSupport: RO1-EY 12851 to MSBProgram Number: 2660Presentation Time: 9:00 AM - 9:15 AMBinocular combination of optically-induced asymmetricinterocular blurAixa Alarcon 1 , Len Zheleznyak 2, 1 , Martin S. Banks 3 , GeunyoungYoon 1, 2 . 1 Flaum Eye Institute, University of Rochester, Rochester,NY; 2 Institute of <strong>Optics</strong>, University of Rochester, Rochester, NY;3 Vision Science Program, University of California Berkeley,Berkeley, CA.Purpose: It has been reported that interocular mirror symmetry in theaberrations (or optical blur) is present in the normal population. Thegoal of this study was to investigate the effects of interoculardifferences of monocular blur orientation on binocular blurperception.Methods: Eight cyclopleged subjects were asked to binocularly viewa stimulus under 3 aberration conditions and to match the subjectiveblur by inducing defocus to an unaberrated stimulus in 0.05Dincrements. A binocular adaptive optics vision simulator was used tocorrect subjects’ native aberrations, induce the 3 aberrationconditions and to induce defocus for the blur matching task for a6mm pupil. A monochromatic (550nm) binary noise image withrandom edge orientation served as the stimulus. The aberrationconditions consisted of 0.5 and 1D astigmatism and 1μm coma. Theaberration orientation of the right eye was rotated 0 and 90 degrees(i.e. equivalent and orthogonal, respectively) in the case ofastigmatism and 0, 90 and 180 degrees in the case of coma while theleft eye’s aberration was held fixed at 0 degrees for all conditions. Inthe coma condition, right eye orientations of 0 and 180 degreescorrespond to a binocular mirror asymmetry and symmetry of blurorientation, respectively. Two subjects participated in the blurmatching experiment in the 0.5D astigmatism condition, and 8subjects participated in the remaining conditions.Results: Bilateral equivalent and orthogonal astigmatism of 0.5Dresulted in significantly different blur matches of 0.53±0.05 and0.36±0.09D, respectively (p
<strong>ARVO</strong> 2013 Annual Meeting Abstracts by Scientific Section/Group – <strong>Visual</strong> <strong>Psychophysics</strong> / <strong>Physiological</strong> <strong>Optics</strong>Program Number: 2661Presentation Time: 9:15 AM - 9:30 AMThe Effect of Unilateral Mean Luminance on BinocularCombination in normal and amblyopic visionChang-Bing Huang 1 , Jiawei Zhou 2 , Robert F. Hess 2 . 1 Key Laboratoryof Behavioral Science, Institute of Psychology, Chinese Academy ofSciences, Beijing, China; 2 Department of Ophthalmology, McGillVision Research, McGill University, Montreal, QC, Canada.Purpose: We investigated the role of interocular luminancedifference on supra-threshold binocular phase combination, fromwhich we wanted to derive the functional balance index between thetwo eyes, for both normals and amblyopes. We also attempted todetermine whether we can artificially simulate “amblyopic”behaviour in normal subjects and recover “normal” response patternin amblyopic subjects by inducing luminance difference in the twoeyes, and to understand the theoretical basis of such effects.Methods: Using a binocular combination paradigm developed by J.Ding and G. Sperling (2006) and neutral density (ND) filters ofvaried intensities, the effect of unilateral mean luminance onbinocular combination in 3 normal and 4 amblyopic observers werequantified.Results: In normal observers, attenuation of one eye’s stimulusluminance with ND filters produces binocular combination similar tothose of amblyopic subjects. Correspondingly, in amblyopicobservers, reduction of the fellow eye’s stimulus luminance producesbinocular combination similar to those of normal subjects. Theseresults can be well explained by a modified contrast gain-controlmodel, which suggests that decreasing the mean luminance in oneeye reduces the efficiency of gain-control from that eye to the othereye, thus lower its contribution in binocular combination.Conclusions: Our manipulation of interocular luminance differenceprovides a simple and effective way to modulate interocularimbalances in amblyopia by reducing the effectiveness of the signaloriginating from the fellow fixing eye, which might bear upon anyfuture binocular treatment of amblyopia.Commercial Relationships: Chang-Bing Huang, None; JiaweiZhou, None; Robert F. Hess, NoneSupport: CIHR (# MOP53346) to RFH, and the KnowledgeInnovation Program of the Chinese Academy of Sciences, Institute ofPsychology (Grant No. Y1CX201006 to CBH)Program Number: 2662Presentation Time: 9:30 AM - 9:45 AMThe Contribution of Perspective, Blur and Disparity to DepthPerception in Natural VisionGuido Maiello 1, 2 , Manuela Chessa 2 , Fabio Solari 2 , Peter Bex 1 .1 Department of Ophthalmology, Harvard Medical School, Boston,MA; 2 Department of Informatics, Bioengineering, Robotics andSystem Engineering, University of Genoa, Genoa, Italy.Purpose: Natural scenes contain multiple sources of depthinformation. However, the relative contribution of these alternativecues is not well understood under natural conditions. When thesecues are not accurately simulated in computer generated 3dimensional scenes, observers can experience visual fatigue, nauseaand diplopia. We examine depth perception in real images withnatural variation in perspective, blur and binocular disparity.Methods: Image patches subtending 8 degrees of visual angle wereextracted from light field photographs of natural scenes taken with aLytro camera that simultaneously captures up to 12 focal planes.When accommodation at any given plane was simulated, the correctdefocus blur and stereoscopic disparity at other depth planes wasextracted from the stack of focal plane images. Depth informationfrom geometric cues, relative blur and stereoscopic disparity wereindependently introduced into depth images. In a 2AFC paradigmwith feedback, four observers identified the closer of two stimulipresented concurrently.Results: Depth discrimination thresholds were lowest whengeometric and stereoscopic disparity cues were both present. Depthorder discrimination was not possible with defocus blur alone and theaddition of blur cues impaired geometric thresholds by reducing thecontrast of geometric information at high spatial frequencies. Whenblur cues were introduced along with geometric and disparity cues,they did not noticeably impair thresholds, and appeared tocompensate the perceptual bias towards the far plane previouslyinduced by disparity.Conclusions: Light field photographs are a useful tool to quantifyhow naturally-occurring cues contribute to depth perception. Correctdefocus blur diminishes visual fatigue while viewing stereoscopicstimuli (Hoffman, et al (2008) JoV 8(3), 33,1-33,30) and shouldtherefore not be discarded in 3D images. Here we show that defocuscues alone impair fine depth perception near the plane of fixation, butmight be beneficial if used in conjunction with stereoscopic disparity.Commercial Relationships: Guido Maiello, None; ManuelaChessa, None; Fabio Solari, None; Peter Bex, Adaptive SensoryTechnology, LLC (S), Rapid Assessment of <strong>Visual</strong> Sensitivity (P)Support: NIH Grant R01EY019281Program Number: 2663Presentation Time: 9:45 AM - 10:00 AMRapid assessment of core visual deficits in amblyopiaMiYoung Kwon 1 , Luis A. Lesmes 1 , Alexandra Miller 1 , MelanieKazlas 2 , Michael Dorr 1 , David G. Hunter 2, 1 , Zhong-Lin Lu 3 , PeterBex 1 . 1 Ophthalmology, Harvard Medical School, Boston, MA;2 Ophthalmology, Boston Children’s Hospital, Boston, MA;3 Psychology, Ohio State University, Columbus, OH.Purpose: Amblyopia is the most common cause of monocular visualloss in children, affecting approximately 3-5% of the population.Although amblyopia is associated with a wide range of visual deficitsthat include reduced visual acuity, loss of contrast sensitivity, spatialdistortion, and abnormal binocular interaction, outcomes foramblyopia treatment currently monitor only visual acuity. A majorobstacle to broad characterization of the deficits has been inefficiencyof psychophysical assessments such as long testing time. The presentstudy aims to develop novel methods for rapidly assessing correlationamong these core deficits in amblyopic vision.Methods: Contrast sensitivity, spatial distortion and binocularinteraction were assessed in subjects with strabismic amblyopia (5-46-yr-old; mean age =14.38 yrs; n=8), strabismus without amblyopia(6-84-yr-old; mean age =34.4 yrs; n=15) and normal vision (5-32-yrold;mean age =18.71 yrs; n=24). The contrast sensitivity function(CSF) was estimated in less than 30 trials with the quick CSF method(Lesmes et al., 2010) on a handheld device (iPad). Local and globalspatial distortion was measured with a dichoptic pointing task(Mcilreavy et al., 2010) in which subjects aligned a target dotpresented to their amblyopic eye with a cross-hair presented to theirfellow eye. Binocular interaction was measured with a dichopticmatching task (Ding & Sperling, 2006) in which subjects matched thephase of a binocular probe to the cyclopean percept of a dichopticpair of gratings whose ratios were systematically varied. Testing wasperformed in an ophthalmology clinic with a total testing time ofapproximately 20 minutes.Results: Compared to subjects with normal vision or strabismuswithout amblyopia, subjects with amblyopia had significantlyreduced contrast sensitivity (F(2,35) = 4.7, p = 0.015), significantlylarger spatial distortion (F(2,37) = 4.8, p = 0.014) and decreasedinterocular contrast summation.©2013, Copyright by the Association for Research in Vision and Ophthalmology, Inc., all rights reserved. Go to iovs.org to access the version of record. For permissionto reproduce any abstract, contact the <strong>ARVO</strong> Office at arvo@arvo.org.
<strong>ARVO</strong> 2013 Annual Meeting Abstracts by Scientific Section/Group – <strong>Visual</strong> <strong>Psychophysics</strong> / <strong>Physiological</strong> <strong>Optics</strong>Conclusions: Amblyopia can be characterized by pronounceddeficits in contrast sensitivity, spatial distortion, and binocularinteraction suggesting a higher contrast requirement for theamblyopic compared to the fellow eye. Despite the short testing time,our novel methods are as effective as conventional laboratoryassessments for quantifying the core deficits in amblyopia.Commercial Relationships: MiYoung Kwon, None; Luis A.Lesmes, Adaptive Sensory Technology (S), 7938538 (P); AlexandraMiller, None; Melanie Kazlas, None; Michael Dorr, AdaptiveSensory Technology, LLC (S), Rapid Measurement of <strong>Visual</strong>Sensitivity (P); David G. Hunter, REBIScan, Inc (I), BostonChildren's Hospital (P), Johns Hopkins University (P); Zhong-LinLu, US Patent 7,938,538 (P); Peter Bex, Adaptive SensoryTechnology, LLC (S), Rapid Assessment of <strong>Visual</strong> Sensitivity (P)Support: NIH Grant R01 EY021553Program Number: 2664Presentation Time: 10:00 AM - 10:15 AMBinocular <strong>Visual</strong> Acuity with Combined Correction of Sphericaland Longitudinal Chromatic AberrationsChristina Schwarz, Silvestre Manzanera, Pedro M. Prieto, PabloArtal. Laboratorio de Optica, Universidad de Murcia, Murcia, Spain.Purpose: A previous study (Artal et al., <strong>Optics</strong> Express 2010)showed that monocular visual acuity (VA) improved by correctingspherical aberration (SA) and longitudinal chromatic aberration(LCA). However, the effect of their combined correction onbinocular visual performance has not been investigated yet. Here, wemeasured both monocular and binocular VA when correcting SA andLCA separately or in combination.Methods: We used a binocular adaptive optics visual analyzer tomeasure binocular and monocular VA at an intermediate contrast ofletters (30%). The instrument (Schwarz et al., <strong>Optics</strong> Letters, 2011)allows for modifying the magnitude and phase of the eye’s complexpupil function. It incorporates two liquid-crystal spatial lightmodulators for both wavefront shaping and to create the artificialpupil. A micro-display presents letters through the controlled eye’soptics to measure monocular and binocular VA for 4 different cases:1) natural conditions (LCA and SA present), 2) LCA removed, 3) SAcorrected, 4) LCA removed and SA corrected. In the cases where SAis present, the average SA value found in pseudophakic patients wasinduced (0.149µm for a 4.8mm pupil). LCA was removed by usingmonochromatic (532nm) instead of polychromatic light. The threesubjects that took part in this study had also participated in theprevious.Results: The main tendencies of the previous monocular study werereproduced, although a different instrument was used and thetechnique to correct for LCA was different. Average monocular VAincreased gradually form condition 1) 0.68±0.05; 2) 0.75±0.05; 3)0.82±0.06 and 4) 1.2±0.2. Average binocular VA for the threesubjects increased from 0.80±0.04 for the case when LCA and SAwere present to 1.2±0.1 for the case when LCA and SA werecorrected. The average binocular summation ratio ranged between1.0±0.2 and 1.4±0.2, being the smallest in the all-corrected case.Conclusions: We studied how binocular VA is affected by correctinglongitudinal chromatic aberration and spherical aberration incombination. The best performance was attained binocularly whenboth aberrations were removed. This result may indicates thatbilateral implantation of IOLs correcting both SA and LCA couldfurther improve binocular spatial vision.Commercial Relationships: Christina Schwarz, AMO (F);Silvestre Manzanera, AMO (F), CIBA Vision (F), CALHOUN (F),VOPTICA (I); Pedro M. Prieto, AMO (F), AcuFocus (F), VopticaSL (I), Voptica SL (P); Pablo Artal, AMO (C), Voptica SL (P),Voptica SL (I), AMO (F), Calhoun Vision (F), Calhoun Vision (C),AcuFocus (C)Support: Ministerio de Ciencia e Inovación, Spain, FIS2010-14926and CSD2007-00013; Fundación Seneca, Región de Murcia, Spain4524/GERM/06; AMO313 Low Vision RehabilitationTuesday, May 07, 2013 8:30 AM-10:15 AMExhibit Hall Poster SessionProgram #/Board # Range: 2747-2784/B0001-B0038Organizing Section: <strong>Visual</strong> <strong>Psychophysics</strong> / <strong>Physiological</strong> <strong>Optics</strong>Program Number: 2747 Poster Board Number: B0001Presentation Time: 8:30 AM - 10:15 AMMeasuring reading speed: a comparison of reading paragraphsand single sentencesSusanne Trauzettel-Klosinski, Elke K. Altpeter, Tobias Marx, NhungNguyen. Centre for Ophthalmology, University of Tuebingen,Tuebingen, Germany.Purpose: For measuring reading speed, the use of standardized textsis crucial 2. Single sentences (MN-Read, Radner) are well suited forassessing critical print size. We developed paragraphs (InternationalReading Speed Texts IReST 2) for measuring reading speed, whichshowed a high agreement within and between languages (17languages, linguistically adapted). We hypothesize that paragraphsare preferable to single sentences for more precise speedmeasurement by stopwatch.Methods: Reading speeds during reading standardized paragraphs oftext ( IReST, German version, texts 3,6,10; 132 words, SD 3.2) werecompared with standardized single sentences (Radner, Germanversion, texts 1-3; 14 words each). 30 normally sighted elderly nativeGerman speakers (mean age = 64 years, SD 7 years) read the textsaloud in random order. Reading time was measured by stop watchand reading speed was calculated in correctly read words/minute(wpm).Results: Mean reading speed did not show a relevant differencebetween IReST (167 wpm, SD 30.3) and Radner (170 wpm, SD30.2), (highest mean difference: 7 WPM), when reading speeds of thetotal cohort were compared. However, individual variation duringreading 3 texts of each type showed markedly higher standarddeviations for the Radner texts (SD 18.9) than for the IReST texts(SD 5.2). A clinically relevant difference was defined as > 10 wpm 2.Conclusions: For group comparisons, the kind and length of text(IReST or Radner) did not have a relevant influence on readingspeed. For intra-individual measurement of reading speed, IReSTtexts showed lower variation between the texts. For higher accuracywe recommend to use them for repeated measurements, especially formonitoring the course of a reading disorder and for assessing effectsof interventions.References1 Radner W et al (2002) Graefe`s Arch Clin Exp Ophthalmol 240:461-462 Trauzettel-Klosinski S, Dietz K and the IReST Study Group (2012)IOVS 53:5452-5461Commercial Relationships: Susanne Trauzettel-Klosinski, None;Elke K. Altpeter, None; Tobias Marx, None; Nhung Nguyen,NoneProgram Number: 2748 Poster Board Number: B0002Presentation Time: 8:30 AM - 10:15 AMProperties of the Dutch Reading Charts©2013, Copyright by the Association for Research in Vision and Ophthalmology, Inc., all rights reserved. Go to iovs.org to access the version of record. For permissionto reproduce any abstract, contact the <strong>ARVO</strong> Office at arvo@arvo.org.
<strong>ARVO</strong> 2013 Annual Meeting Abstracts by Scientific Section/Group – <strong>Visual</strong> <strong>Psychophysics</strong> / <strong>Physiological</strong> <strong>Optics</strong>Ger V. Van Rens, Tamara Verkerk Brussee, Edwin Klerkx, Ruth V.Nispen. Ophthalmology, Free Univ Amsterdam Medical Ctr,Amsterdam, Netherlands.Purpose: To investigate some measurement properties of Dutchreading charts.Methods: 71 participants (mean age: 55 +/- 19.7 years) with normalvision read 5 reading charts available in the Dutch language(“Nederlanders”; LEO; IReST, Radner and Colenbrander). Allsentences and texts were printed at the same size and characters andwere read out loud and timed with a stopwatch. In order to comparecharts, the main outcomes were reading speed in syllables andcharacters per minute (corrected for reading mistakes) and the meannumber of mistakes per character.Results: The corrected reading speed in syllables per minute were inascending order of chartsNederlanders 237/min, Colenbrander 246/min, Leo 269/min, IReST278/min and Radner 299/min. The corrected reading speed incharacters per minute gave the same order of charts Nederlanders713/min, Colenbrander 814/min, Leo 823/min, IReST 823/min andRadner 923/min.The number of mistakes made in the reading charts per characterwere in descending order Nederlanders, Colenbrander, IReST, Leoand Radner. A one tailed Pearson correlation of the number ofmistakes per character and reading speed per character revealed asignificant correlation for the reading charts that are based on longertexts, 0.013 in Nederlanders and 0.008 in IReST. No significantcorrelation was found in the other three reading charts that are basedon separate sentences.The range of mistakes for the three reading charts with the highestreading speeds was significantly lower than that of the Colenbranderand Nederlanders. The reading speeds decreased from younger toolder age categories, aged 18-35 years (n=19) , 36-59 years (n=18)and 60-86 years (n=34). This was also true for the number ofmistakes that were made.Conclusions: Archaic language may have led to more mistakes in theNederlanders chart. The 5 Dutch reading charts revealed cleardifferences in reading speed and difficulty (number of mistakes).These findings have consequences for daily practice and for thepossibility to compare scientific outcomes. In the near future, we willalso study the charts with logarithmic progression of character size ina population of visually impaired participants.Commercial Relationships: Ger V. Van Rens, None; TamaraVerkerk Brussee, None; Edwin Klerkx, None; Ruth V. Nispen,NoneProgram Number: 2749 Poster Board Number: B0003Presentation Time: 8:30 AM - 10:15 AMiPad vs Closed Circuit Television Low Vision Reading Rates andPreferencesAlex Zemke 1, 2 , Danielle Irvine 1, 2 , John Coalter 1 , Walter M. Jay 3 .1 Spectrios Institute for Low Vision, Wheaton, IL; 2 The ChicagoLighthouse for People Who are Blind or <strong>Visual</strong>ly Impaired, Chicago,IL; 3 Loyola University Chicago, Maywood, IL.Purpose: Accessibility features of tablets such as the Apple iPadhave revolutionized reading rehabilitation for low vision patients.These features include system wide zoom and high reversiblecontrast. We compared subjective preference as well as reading rateson the Apple iPad and a closed circuit television (CCTV).Methods: After IRB approval, fourteen low vision patients, 18 yearsand older, were recruited with visual acuity ranging from 20/50 to20/200 and minimal prior experience with an iPad or CCTV.Objective data collection involved calculating reading rates from anewspaper article and a book. Patients read both media for twominutes on each device at their preferred zoom, and a third time onthe CCTV with the zoom matched to the iPad’s angle of resolution.Physical copies were provided to be used on the 24 inch OptelecClearview CCTV and electronic copies were acquired for the thirdgeneration iPad. Upon conclusion of the reading assignments,patients were surveyed with a questionnaire concerning subjectivecomfort, performance and preference. Paired t-test with Bonferroniadjustment was used to compare reading rates. A chi squared analysiswas used for preference responses.Results: The mean age of the subjects was 62.7 (Std Dev = 13.4)years and the range was 35 to 91. There were 9 different diagnoses,with proliferative diabetic retinopathy (5) and glaucoma (2) being themost common. The mean acuity was 20/108 and the range was 20/50to 20/200. Twelve of 14 subjects (85.7%) chose the iPad for overallreading preference (mean age 59.3, mean acuity 20/110). The othertwo subjects preferred the CCTV (mean age 83.5, mean acuity20/100). Faster reading rates of the newspaper with the CCTV at boththe patient's preferred zoom and constant angle of resolution to theiPad were statistically significant (p = 0.0047 and 0.0080respectively), while there was no statistical significance between theCCTV and iPad reading rates with the book.Conclusions: Despite equal or slower reading rates with the iPad,patients' subjective preference was in favor of the iPad. Patients'primary reasons for preference of the iPad were portability, ease ofnavigation, and added versatility. Considering these reasons inaddition to lower cost and improved social acceptance, tablets, suchas the iPad, should be considered in the reading rehabilitation ofvisually impaired patients.Commercial Relationships: Alex Zemke, None; Danielle Irvine,None; John Coalter, None; Walter M. Jay, NoneSupport: 2012 Illinois Society for the Prevention of BlindnessResearch GrantProgram Number: 2750 Poster Board Number: B0004Presentation Time: 8:30 AM - 10:15 AMReading performance in low-vision patients using a low-costportable reading system prototypeAdriana Berezovsky, Vagner R. dos Santos, Nívea N. Cavascan,Solange R. Salomao. Departamento de Oftalmologia, UniversidadeFederal de Sao Paulo, Sao Paulo, Brazil.Purpose: Reading performance is an important tool to evaluatepatients with impaired vision. Reading speed, reading acuity andcritical print size are factors that mainly influence readingperformance in normal and low-vision subjects. The aim of this studywas to investigate the impact of a recently developed low-costelectronic portable magnifier reading system (PRS) in the readingperformance of low-vision subjects.Methods: Ten adult subjects (ages ranging from 20 to 92 years) withlow vision and without any training for low vision devices wereincluded. Reading performance was assessed binocularly with bestoptical correction with the Minnesota Reading Speed Chart versionfor the Portuguese language (MNREAD Portuguese). PRS apparatusis composed of a system of image capturing coupled with a 5.6 inchmonochromatic monitor, providing up to 15 x standardmagnification. Parameters of reading speed (words per minute),reading acuity (logMAR), and critical print size (logMAR) weredetermined without and with the PRS prototype. Paired t-test wasused to compare results with and without PRS prototype for readingperformance parameters. When normality test failed, Wilcoxonsigned rank test was used. Statistical significance was set at p≤0.05.Results: Mean reading speed was 48.4 ± 30.5 words per minutewithout PRS, decreasing to 45.0 ± 19.6 words per minute with PRSutilization without any significance. All subjects showed©2013, Copyright by the Association for Research in Vision and Ophthalmology, Inc., all rights reserved. Go to iovs.org to access the version of record. For permissionto reproduce any abstract, contact the <strong>ARVO</strong> Office at arvo@arvo.org.
<strong>ARVO</strong> 2013 Annual Meeting Abstracts by Scientific Section/Group – <strong>Visual</strong> <strong>Psychophysics</strong> / <strong>Physiological</strong> <strong>Optics</strong>improvement in both reading acuity and critical print size with PRSprototype. Mean reading acuity without PRS prototype (1.00 ± 0.23logMAR) was statistically poorer (t=13.054, p≤0.001) than thatmeasured with it (-0.08 logMAR ± 0.25). The same trend was foundin mean critical print size, with 1.15 ± 0.18 logMAR without the PRSprototype and for values significantly better (t=16.694, p≤0.001) withprototype (0.13 ± 0.25 logMAR).Conclusions: Considerable improvement in both reading acuity andcritical print size was provided by PRS prototype use. However,reading speed results had no statistical differences with and withoutPRS prototype in this small cohort of patients. Further studies withlarge numbers of patients are recommendable to corroborate andextend the findings with this new promising technology.Commercial Relationships: Adriana Berezovsky, None; VagnerR. dos Santos, None; Nívea N. Cavascan, None; Solange R.Salomao, NoneProgram Number: 2751 Poster Board Number: B0005Presentation Time: 8:30 AM - 10:15 AMImproving reading speed in peripheral vision through a nontask-basedtrainingDeyue Yu. College of Optometry, The Ohio State University,Columbus, OH.Purpose: People with central vision loss rely on their peripheralvision for reading. Previous studies have shown that peripheralreading can be improved with practice on character-based tasks. Anoptimal training paradigm should require little effort from patients toallow self-administration while providing efficient learning andprominent improvements. Heretofore, such a paradigm has beenlacking. Here, we introduce a practical and effective training methodthat utilizes priming of stimulus identity to facilitate learning in theabsence of a task.Methods: Seven normally-sighted young adults were trained at 10°in the lower visual field in a pre/post design. In the pre-test, wemeasured reading speeds using Rapid Serial <strong>Visual</strong> Presentation,visual-span profile (letter-recognition accuracy as a function of letterposition) with trigrams (strings of three random letters), the spatialextent of crowding (letter separations yielding 80% recognitionaccuracy for the middle letters of trigrams), and isolated-letterrecognition performance. To assess transfer of learning across printsizes, reading speed was measured at two print sizes (2.5° (trained),1°). Training consisted of five sessions of viewing trigrams presentedat various letter positions, a total of 7150 trials. Each training sessionhad 26 blocks. Within each block, the middle letter of the trigram wasalways the same. The left and right letters were randomly selectedresulting in differences, across trials, in the perceived appearance ofthe middle letter. The observer had no task, but rather was asked toattend to each trial and learn the known target letter with the optionof repeating the same trigram stimulus for as many times as needed(averaged 0.4 times). The post-test was identical to the pre-test but inreversed order.Results: Averaged across observers, the five-day training reduced thespatial extent of crowding by 29% and enlarged the visual span by1.6 characters. The improvements transferred to the untrained readingtask for both the trained print size (reading speed increased from 132to 298wpm) and the untrained print size (from 68 to 171wpm), whichis beyond what is typically observed in traditional task-basedtraining.Conclusions: Our findings demonstrate the effectiveness of utilizingpriming and stimulus exposure in training to improve peripheralreading. Moreover, this non-task-based training is simple enough toallow self-training at home.Commercial Relationships: Deyue Yu, NoneProgram Number: 2752 Poster Board Number: B0006Presentation Time: 8:30 AM - 10:15 AMEffect of Decreased Lighting on <strong>Visual</strong> Acuity in NormalSubjects Donald C. Fletcher MD; California Pacific MedicalCenter Dept. of Ophthalmology and Smith-Kettlewell EyeResearch Institute. Laura Walker Renninger; Smith-KettlewellEye Research InstituteDavid T. Hamilton. 1 Low Vision Research, CPMC, San Francisco,CA; 2 Low Vision Research, Smith-Kettlewell Eye Research Institute,San Francisco, CA.Purpose: Central field loss patients anecdotally report that more lightimproves their vision. In a recent study (Fletcher, Renninger, andSchuchard, 2012), it was reported that indeed acuity declines withlower light levels. The purpose of this study is to determine the extentto which light conditions affect visual acuity in normally sightedsubjects.Methods: Binocular <strong>Visual</strong> acuity was assessed on 20 normallysighted volunteers using their habitual correction. Initially a Snellenletter chart was viewed at one meter under ambient room light.Participants were tested a second time while wearing 4%transmission gray filter glasses (NOIR U23) over their spectacles orcontact lenses. The acuity difference is reported as lines differencewith decreased light.Results: Participants ranged in age from 22-70 (with a mean of 44.85years). All patients displayed diminished visual acuity when 4%transmission glasses were worn. Lines difference ranged from 1 (31,F) to 7 (60, F) with the majority of patients falling in the 2-5 linerange (mean: 2.95 lines, median: 2.5 lines). In Dr. Fletcher's patients,he observes a mean drop of about two lines (ambient room light vs.4% transmission gray filter glasses.) My results are slightly moreexaggerated, with almost a full additional mean line drop (2 vs. 2.95lines.)Conclusions: A significant reduction in visual acuity was noted withreduced lighting in this population of normally sighted healthyindividuals. Providing adequate lighting conditions optimizes visualacuity for tasks such as reading. This is an inexpensive and easilyadministered test to evaluate visual performance under dim lightconditions. Pathological conditions are often felt to decreasefunctional performance in subdued lighting. This data can serve as abaseline for comparisons.Commercial Relationships: David T. Hamilton, NoneProgram Number: 2753 Poster Board Number: B0007Presentation Time: 8:30 AM - 10:15 AMLuminance in Acuity and Reading Performance of Low VisionPatientsDonald C. Fletcher 1, 2 , Laura Renninger 2 , Ronald A. Schuchard 3 .1 Ophthalmology, California Pacific Medical Center, San Francisco,CA; 2 Smith-Kettlewell Eye Research Institute, San Francisco, CA;3 VAPAHCS, Stanford University, Palo Alto, CA.Purpose: To assess the role of luminance in low vision patients forvisual function tests.Methods: 152 consecutive low vision patients had assessment ofvisual acuity (VA) with habitual correction and with a 4%transmission gray filter on the ETDRS chart at 1 meter. Readingacuity on the MN Read was performed in room light and then with125 (low) and 2070 Lux (high) additional lighting. Central visualfield (CCVFT) was also performed. All tests were done binocularly.Results: Patient age median (range) was 82 (13 - 101) years with63% female. All patients were referred for low vision rehabilitationwith 89% having the diagnosis of a maculopathy. <strong>Visual</strong> acuity withhabitual correction median (range) was 20/100 (20/20 - 20/1000).©2013, Copyright by the Association for Research in Vision and Ophthalmology, Inc., all rights reserved. Go to iovs.org to access the version of record. For permissionto reproduce any abstract, contact the <strong>ARVO</strong> Office at arvo@arvo.org.
<strong>ARVO</strong> 2013 Annual Meeting Abstracts by Scientific Section/Group – <strong>Visual</strong> <strong>Psychophysics</strong> / <strong>Physiological</strong> <strong>Optics</strong><strong>Visual</strong> acuity with a 4% transmission gray filter over habitualcorrection median (range) was 20/220 (20/20 - 20/2000). Change invisual acuity with the decreased luminance was median (range) 2lines decrease (plus 2 - minus 10 lines). On the MN Read test the lowadditional light gave no performance increase in 44% of patients, aone block increase in 50% and a 2 block increase in 6%; the highadditional light gave no performance increase in 12% of patients, aone block increase in 29% and a 2 block increase in 32% and agreater than 2 block increase in 27% with up to an 8 block increase inone patient. Ring scotoma patients (25) improved 1 block (range 0 -2) on the MN Read with low additional light and 4 blocks (range 1 -8) with high additional light. Non ring-scotoma patients (107)improved 0 blocks (range 0 - 2) on the MN Read with low light and 2blocks (range 0 - 5) with high light. There is a significant moderatecorrelation between the lines lost with the filters and improvementwith additional lighting - 125 Lux (r = 0.30) and 2070 Lux (r = .49).Of particular interest, patients with ring scotomas had the largestimprovements in reading with extra light.Conclusions: There is a significant tendency for acuity to drop withdecreased luminance and this had some tendency to predict responseto extra light. There was a consistent positive improvement in readingacuity with extra light and especially with very bright light. Allpatients and particularly those with ring scotomas should have trialswith very bright illumination in their rehabilitation program.Commercial Relationships: Donald C. Fletcher, Precision Vision(R); Laura Renninger, None; Ronald A. Schuchard, QLT Inc. (C)Program Number: 2754 Poster Board Number: B0008Presentation Time: 8:30 AM - 10:15 AMSK-Read performance as a predictor of handwriting difficulty inlow vision patientsKen Downes 1, 2 , Donald C. Fletcher 1, 2 , Laura Renninger 2 .1 Ophthalmology, California Pacific Medical Center, San Francisco,CA; 2 Smith-Kettlewell Eye Research Institute, San Francisco, CA.Purpose: To assess whether performance on the Smith-KettlewellReading (SK-Read) Test is a reliable predictor of handwriting in lowvision patients.Methods: We performed a prospective cohort study of 31 low visionpatients at their initial low vision rehabilitation evaluation. Thepatients completed all components of a routine low visionappointment including logMAR acuity measurement, performed theSK-Read Test (a non-conextual reading test), and performed ahandwriting task. Patients were timed while performing each task andtheir accuracy was recorded. The handwriting task was performed byhaving patients write five five-letter words into sets of boxes whereeach letter is separated by a box. The boxes were 15mm x 15mm andaccuracy was scored with 50 points possible from 25 letters - onepoint for each letter within the confines of a box and 1 point if theletter was legible. The variables reported on are SK-Read errors perblock, SK-Read time per block, logMAR acuity, and handwritingtask time-to-accuracy ratio. Correlation analysis was performed toexamine the association between each pair of variables.Results: 31 low vision patients participated in the study. Median agewas 81.5 years (range: 54-97). 27/31 patients (87%) had ARMD orsome other maculopathy while 3/31 patients (13%) had visualimpairment from media opacity or neurological impairment. MedianSnellen Acuity was 20/152 (range: 20/22-20/1000) and medianlogMAR acuity was 0.88 (range: 0.04-1.70). SK-Read errors perblock correlated with logMAR acuity (r= 0.55, p
<strong>ARVO</strong> 2013 Annual Meeting Abstracts by Scientific Section/Group – <strong>Visual</strong> <strong>Psychophysics</strong> / <strong>Physiological</strong> <strong>Optics</strong>noise found in ocular and neurological disease, as opposed to focalpathology.Methods: The 11 subjects included 4 male and 7 female, ages 22 - 50yr with visual acuity of 20/20. The stimulus was a 20/200 optotype, 2- 3 syllable word in Arial font presented centrally in the LSDC-S. A16 word list was generated from the Low Vision Training Manual(Quillman). The LSDC-S is a slit scanning imager that provides ahigh contrast, 11 Hz and 36 deg retinal image, 860 nm at 2 mW at thecornea. The visual stimuli were projected by a digital light projectorin Maxwellian view, with linked stimulus and retinal image focus.The background illuminance and the contrast for stimuli andbackground matched Goldmann perimetry, 1.5 log units. Levels ofnoise, at a fixed spatial frequency, were presented with the words,starting with 9% and then lowered by 3% over 4 levels until the wordwas recognized. The trial was stopped if recognition did not occur in6 sec, and the time to recognition was recorded for the final trial.Fixation and sample scan patterns were evaluated from the x, ycoordinates of a retinal image feature over time, plus the probabilityof accuracy.Results: Despite the large letter size, this task was difficult for allsubjects, who recognized no words with noise > 6% contrast. Theaverage jump in scanning on the x axis was 2.62X larger than for y(p
<strong>ARVO</strong> 2013 Annual Meeting Abstracts by Scientific Section/Group – <strong>Visual</strong> <strong>Psychophysics</strong> / <strong>Physiological</strong> <strong>Optics</strong>interaction p=0.070). However, the overall distribution (standarddeviation) of eye positions appeared to be narrower after training(from 12.7° to 11.2°, p=0.081) suggesting that there might be anenvironmental learning effect.Conclusions: Preliminary results from this study suggest thatperipheral-prism glasses may increase scanning toward the blind sidein patients with hemianopia; recruitment is ongoing to increase thesample size.Commercial Relationships: Matteo Tomasi, None; JeffreyChurchill, None; Jean Paul Wiegand, None; Kevin Houston,None; Eli Peli, Alcon Research , Ltd, Tx (C), Chadwick Optical (P),Emerald Events (R), Google (C), Nintendo of America (C), ReVision<strong>Optics</strong>, CA (C), SuperFocus (C), Trivisio Prototyping Gmbh (C),VisionCare Inc (C), Butler Law Group (C), Dillon & Findley, P.C.(C); Alexandra R. Bowers, None; Gang Luo, NoneSupport: NIH grant 2K12EY016335-06, DoD grant DM090420,Harvard Milton AwardProgram Number: 2759 Poster Board Number: B0013Presentation Time: 8:30 AM - 10:15 AMPerceptual-motor adaptation in hemianopes wearing peripheralprisms is possible: Preliminary resultsKevin Houston 1, 2 , Jeffrey Churchill 2 , Jean Paul Wiegand 2 , Eli Peli 2,3 , Gang Luo 2, 3 , Robert B. Goldstein 2, 3 , Russell L. Woods 2, 3 ,Alexandra R. Bowers 2, 3 . 1 Ophthalmology, Massachusetts Eye andEar, Boston, MA; 2 Schepens Eye Research Institute, MassachusettsEye and Ear, Boston, MA; 3 Ophthalmology, Harvard MedicalSchool, Cambridge, MA.Purpose: For hemianopia, peripheral prism (p-prism) glasses areused to optically shift peripheral areas of the blind hemifield 20°-30°toward the seeing side. This improves detection immediatelyhowever perceived location of prism side obstacles is incorrect. Withgeneral wear, some hemianopes make cognitive corrections for thedisplacement, but perceptual adaptation does not occur (Giorgi et al2009). We are conducting a pilot study to evaluate whether intensiveperceptual-motor training improves adaptation and generalizes toimproved collision judgments in a walking simulator.Methods: Seven hemianopes wearing 57Δ oblique p-prisms received120 minutes of computerized training over 3 weeks consisting ofreaching out to touch peripheral stimuli presented on a touch screenunder fixed gaze conditions. Training included 5 levels of difficultystarting with slow but accurate reaching to blind side stimuli (level1), reaching to stimuli in both hemifields (level 2), increasing speed(level 3), cognitive loading (level 4), and use of background visualcues (level 5). Collision judgment data under fixed gaze conditionswere collected in a video walking simulator before and after training.Results: Touch accuracy error to targets presented in prism areasimproved significantly (p=0.02) from median (x,y) (17°, 6°) to (1° ,0.5°) (equivalent to seeing-side accuracy). The median differencebetween seeing and prism side reaction times reduced significantly(p=0.04) from 880ms to 110ms. Preliminary analyses of collisionjudgment data suggest no or only modest improvements inperformance post-training.Conclusions: These pilot data suggest that hemianopes wearing p-prisms can be trained to perform similarly on the blind and seeingside during a perceptual-motor task. We suspect the mechanism ofadaptation for most participants was realignment of the felt positionof the arm (as opposed to retinotopic coordinates), and so did notgeneralize. We are developing pre- and post- test measures toinvestigating this hypothesis by looking for transfer to the untrainedhand.Commercial Relationships: Kevin Houston, None; JeffreyChurchill, None; Jean Paul Wiegand, None; Eli Peli, AlconResearch , Ltd, Tx (C), Chadwick Optical (P), Emerald Events (R),Google (C), Nintendo of America (C), ReVision <strong>Optics</strong>, CA (C),SuperFocus (C), Trivisio Prototyping Gmbh (C), VisionCare Inc (C),Butler Law Group (C), Dillon & Findley, P.C. (C); Gang Luo, None;Robert B. Goldstein, None; Russell L. Woods, None; AlexandraR. Bowers, NoneSupport: NIH grant 2K12EY016335-06, EY12890 and DoD grantDM090420, W81WXH-07-2-0038Program Number: 2760 Poster Board Number: B0014Presentation Time: 8:30 AM - 10:15 AMContrast Sensitivity (CS) test-retest reliability and consistencywith Vector Vision CSV-1000LVand CSV-1000HGT in patientswith AlbinismMaria Cucuras 1 , Susan Kelly 2 , Faheemah Saeed 3 . 1 Illinois College ofOptometry, Chicago, IL; 2 Illinois College of Optometry, Chicago, IL;3 Illinois College of Optometry, Chicago, IL.Purpose: The ability to accurately monitor the disease status orimprove the visual function of low vision patients requires reliableand repeatable vision tests. It is generally accepted that measures ofvisual function in the low vision patient population are more variablethan normally sighted individuals. This may decrease the reliabilityof standard visual tests when applied to a population such asalbinism. The purpose of our study is to determine whether one suchtest of visual function, contrast sensitivity, could reliably bemeasured in this population both in the presence of glare and without.Methods: CS was tested with Vector Vision CSV-1000 LV which isa low vision letter chart and the CSV-1000HGT (halogen glare test)which tests CS in the presence of glare.Thirteen subjects with albinism with best corrected logMAR visualacuity (VA) ranging from 0.4 to 0.9, participated in this study.LogMAR VA was tested using the EDTRS chart. Dependentvariables including CS under normal test condition and CS withglare, were tested at two different visits, 3 months apart. The CSV-1000LV chart was used to measure CS while the CSV1000HGT wasutilized to measure the effect of glare on CS. Test-retest reliabilitywas assessed with the intraclass correlation coefficient (ICC).Results: A significant test-retest reliability was determined accordingto the ICC values calculated for both CS measured without and withglare (ICC=0.864, p
<strong>ARVO</strong> 2013 Annual Meeting Abstracts by Scientific Section/Group – <strong>Visual</strong> <strong>Psychophysics</strong> / <strong>Physiological</strong> <strong>Optics</strong>from 20 to 57), we tested contrast sensitivity weekly over a 4-8-weekperiod with the novel quick CSF method (Lesmes et al, 2010) andestablished contrast sensitivity charts (Pelli-Robson and Vistech). Toassess reliability, two runs of 20 quick CSF trials were collected ateach session, and each run lasted approximately 3 minutes. Wefocused on the general contrast sensitivity assessment provided bythe area under the log CSF (AULCSF).Results: The AULCSF values demonstrated excellent test-retestreliability (r = 0.91) between runs, averaged across weeks. Thecoefficient of variation (sd/mean) for within-session difference scores
<strong>ARVO</strong> 2013 Annual Meeting Abstracts by Scientific Section/Group – <strong>Visual</strong> <strong>Psychophysics</strong> / <strong>Physiological</strong> <strong>Optics</strong>Support: NEI Grant: R41EY022545-01Program Number: 2764 Poster Board Number: B0018Presentation Time: 8:30 AM - 10:15 AMFeedback measures for a wearable visual aid designed for thevisually impairedAminat Adebiyi 1 , James D. Weiland 1, 2 , Carey Zhang 1, 3 , KaveriThakoor 4 . 1 Biomedical Engineering, University of SouthernCalifornia, Los Angeles, CA; 2 Ophthalmology, University ofSouthern California, Los Angeles, CA; 3 Electrical Engineering,University of Southern California, Los Angeles, CA; 4 NeuroscienceGraduate Program, University of Southern California, Los Angeles,CA.Purpose: To test the viability of a voice-driven feedback system toassist low-vision subjects with mobility.Methods: The audible feedback system consists of audio boneconductionheadphones worn by the user behind the ear and a customAndroid application, which delivers commands to the user when aresearcher presses a button corresponding to that command on theprogram. Two low-vision subjects were recruited from the BrailleInstitute, Los Angeles. Wearing the audible feedback system,subjects were steered around a three minute randomized course fivetimes by a researcher, who gave commands that were randomized bytrial. Commands included ‘forward’, ‘veer left’, ‘turn left’, ‘veerright’, turn right’ and ‘stop’. The course measured 17ft X17ft andwas interspersed with one foot cones every five feet. Appropriateresponse to commands, angle of turns and reaction time weremeasured. Subjects were also given an exit survey that measured theusability of the feedback system. The Android application recorded atime stamp for each command and video footage was recorded foreach trial.Results: Subject one had an average of 71.80% responses consistentwith commands, whereas subject two had an average of 53.18%responses consistent with commands; although subject two showed ahigher range in improvement over the course of the trials. Bothsubjects had an average of 95% positive compliance to the ‘forward’and ‘stop’ commands, and less than 5% compliance to the ‘veer left’and ‘veer right’ commands. Subject one had an average reaction timeof 1.5 seconds, whereas subject two had an average reaction time of2.5 seconds. Both subjects had an average turning radius ofapproximately 70 degrees for the ‘turn right and ‘turn left’commands. Based on the system usability scale, the system wasdetermined to be 90% useable in its current condition.Conclusions: Judging by the reactions times and the system usabilityscale, the audible feedback system seems to be an intuitive solutionthat will create a balanced connection between the user and thefeedback controller. However, significant training is needed tomaximize appropriate responses by its users to the commandsprovidedCommercial Relationships: Aminat Adebiyi, None; James D.Weiland, Second Sight Medical Products, Inc. (F); Carey Zhang,None; Kaveri Thakoor, NoneSupport: Research to Prevent Blindness, W.M. Keck Foundation,USAMRMC-W81XWH-10-2-0076Program Number: 2765 Poster Board Number: B0019Presentation Time: 8:30 AM - 10:15 AMLOCOMOTION IN LOW LUMINANCE WITH NONIMMERSIVE HEAD MOUNTED DEVICE FOR PATIENTSWITH NIGHT BLINDNESSCoen Cecilia 1 , Caroline Chauvire 1 , Guillaume Le Gall 2 , ArnaudKoustanai 1 , Marion Swital 2 , Laurence Bernardini 1 , PhilippeChaumet-Riffaud 1, 3 , Saddek Mohand-Said 1 , Jose A. Sahel 1 , AvinoamB. Safran 1 . 1 INSERM, U968; UPMC Univ Paris 06, UMR_S 968,Institut de la Vision; CNRS, UMR_7210; CHNO des Quinze-Vingts,INSERM-DHOS CIC 503, Paris, France; 2 Essilor R&DInternationnal, Paris, France; 3 Univ Paris Sud, AP-HP, CHU Bicêtre,EA 4046, Paris, France.Purpose: Retinitis pigmentosa (RP) is characteristically associatedwith reduced dark adaptation, which may lead to difficulties forlocomotion in dim light specially when lighting abruptly decreases.We tested a non immersive Head Mounted Display (HMD) providinga luminance-enhanced video image to determine its value for affectedindividuals in dim light condition.Methods: Nine RP patients were enrolled (age from 23 to 81 years,mean 43). All patients complained of altered dark adaptation. Weevaluted visual acuity (VA), horizontal binocular visual field (VF)and dark adaptometry (Goldmann-Weekers - GW). We tested a nonimmersiveHMD (Essilor Int., Institut de la Vision, Paris, France;Lumus, Rehovot, Israel), which provides a processed video imagedisplayed on transparent lenses. Image was a luminance-enhancedview of the surrounding environment. Patients were asked to walkalong a straight corridor (white walls and floor, 30 meters long).Five conditions were explored as follows: (1) in a clear corridor inphotopic condition (700 lux), and (2) in dim light (5 lux); (3) in acorridor with 6 obstacles (white boxes 30x35x55cm) laid out on thefloor in photopic, (4) and dim light. The last condition (5) in acorridor with 6 obstacles, in dim light, was tested using the HMD.The walking speed was measured 3 times in each condition. Spatialdisposition of obstacles was modified between consecutive trials.Patients were exposed to photopic lighting during 5 min before eachtrial to prevent dark adaptation.Results: Four of nine patients performed better using the HMD thanwithout: between-groups comparison showed that these four patientsincreased their walking speed when obstacles were laid out in dimlight (mean walking speed without HMD = 0.35 m/s; SD = 0.07,mean walking speed with HMD = 0.47 m/s; SD = 0.06) ;( F (4,152)=12.1; p
<strong>ARVO</strong> 2013 Annual Meeting Abstracts by Scientific Section/Group – <strong>Visual</strong> <strong>Psychophysics</strong> / <strong>Physiological</strong> <strong>Optics</strong>image processing using a Head Mounted Display (HMD), to locateand identify objects.Methods: We enrolled 12 patients with RP, complaining of nightblindness to various degrees, (23 to 81 years old, mean = 43; visualacuity (VA) = -0.1 to +0.5 logMAR, mean = +0.15; horizontal visualfield = 20° to 180°, mean = 52°). Dark-adaptation threshold wasassessed with Goldmann-Weekers adaptometer.We used a non-immersive HMD (Lumus, Israel; Essilor Int. andInstitut de la Vision, Paris) which provides a luminance-enhancedvideo image, displayed through transparent lenses.The experiment took place in a living room, including regularfurniture. Before starting the evaluation, the tested subject viewed thefurniture setting in photopic lighting condition (700 lux). Then, thesubject turned his back on the scene, and the experimenter placednine objects on various locations. Eventually lighting was abruptlyreduced to 3 lux, and the, subject was asked to identify all addedobjects as quickly as possible. Trials were repeated three times, withand without the HMD. Between two consecutive trials, objectlocations were changed, and the subject was exposed to photopiccondition during 5 minutes to prevent dark adaptation. The number ofobjects and the detection time were recorded.Results: To identify the presented objects, four of 12 patientsperformed better using the HMD than without it (F(1,54) = 8.05; p
<strong>ARVO</strong> 2013 Annual Meeting Abstracts by Scientific Section/Group – <strong>Visual</strong> <strong>Psychophysics</strong> / <strong>Physiological</strong> <strong>Optics</strong>/ 10.75%, p=0.06, Wilcoxon test).Conclusions: Differences in the detection of darks and light arerobust, can be demonstrated over a wide range of ages and in patientswith retinal ganglion cell disease caused by glaucoma. The findingthat patients with glaucoma show a 15% reduction in detectionaccuracy raises the question of whether a simple detection test couldbe used to monitor disease progression.Commercial Relationships: Linxi Zhao, None; Mitchell W. Dul,None; Jose M. Alonso, None; Stanley J. Komban, None; QasimZaidi, NoneSupport: EY007556, EY007716, EY013312, EY005253,T35EY020481Program Number: 2769 Poster Board Number: B0023Presentation Time: 8:30 AM - 10:15 AMIs visual exploration training beneficial in tunnel vision?Iliya V. Ivanov, Annika F. Vollmer, Nhung Nguyen, SusanneTrauzettel-Klosinski. University of Tuebingen, Tuebingen, Germany.Purpose: Tunnel vision is a severe peripheral visual field lossimpairing mobility. It has been previously shown that normallysighted subjects exhibit larger horizontal than vertical component ofeye position dispersions (standard deviations) while walking andavoiding obstacles in daily life. However, for patients with tunnelvision caused by retinitis pigmentosa (RP), horizontal and verticalcomponents were not found to be significantly different 1. In thisstudy we wanted to test whether visual exploration training isbeneficial for RP patients, as in patients with homonymoushemianopia 2. Any efficient eye movement training in RP patients,would result in change of eye-movement pattern- larger horizontalthan vertical dispersions.Methods: Patients (n=33) were randomly assigned into three traininggroups: saccadic (experimental), reading (placebo) or crossover(placebo+experimental). In saccadic training condition, computerbasedtraining extended eye-movement exploration outside of theconcentric constriction of the visual field (VF). In reading trainingcondition patients had to read a text that was presented at the centerof the screen, one word at time. To assess any effect of training,mobile eye tracker was used to record eye positions while walking instandardized environment (parkour), before and after training. Wecompared horizontal and vertical eye dispersions of patients in thedifferent experimental groups with a control group of normals (n =10).Results: Comparable with previous findings, patients who hadresidual VF < 15° (from fixation) showed equal horizontal andvertical dispersions before training. After training however, patientswho received saccadic training showed significantly larger horizontaldispersion (p 15° remained the same.Regardless of their residual VF, patients in placebo group did notshow an effect of training: horizontal and vertical dispersionsremained unchanged after training.Conclusions: These findings suggest that visual exploration trainingis highly specific and resulted in significantly increased dynamic VFfor the RP patients with VF < 15°.Commercial Relationships: Iliya V. Ivanov, None; Annika F.Vollmer, None; Nhung Nguyen, None; Susanne Trauzettel-Klosinski, NoneSupport: Kniese Foundation; Funke Foundation; Stiftung AugeProgram Number: 2770 Poster Board Number: B0024Presentation Time: 8:30 AM - 10:15 AMIs Vernier Acuity more Sensitive than Grating Acuity to <strong>Visual</strong>Impairment in Adolescents?Huizi Kelly Yin 1 , Barry S. Kran 2 , Darick Wright 3 , Donna D. Bent 3 , LiDeng 2 , Dale L. Mayer 2 . 1 Illinois College of Optometry, Chicago, IL;2 New England College of Optometry, Boston, MA; 3 Perkins School,Watertown, MA.Purpose: Vernier acuity, often referred to as a “hyperacuity”, may bemore sensitive than grating acuity in detecting visual deficits such asamblyopia in young children. Thus, we compared vernier acuity(VeA) and grating acuity (GA) tests to recognition acuity (RA) inadolescents with visual impairment, hearing loss, and cognitivedisabilities.Methods: 24 optometry students from the New England College ofOptometry and 10 adolescents (16 eyes) attending Perkins School forthe Blind were tested in each eye for RA (crowded letters), VeA(Drover et al OVS 2010) and GA (Teller Acuity Cards) in 2 sessions.Acuities were analyzed in logMAR. Test-retest reliabilities wereexamined with Bland-Altman method (bias, 95% Limits ofagreement, LOA). To directly compare VeA and GA to RA inadolescents, their raw data were normalized taking the differencefrom the normal value for age (Delta-Normal, ΔN). ΔNs wereanalyzed with correlations and means.Results: Adult mean (SD) logMAR acuities (RE, session 1) were:RA -0.11 (0.05) (20/16); VeA: -0.24 (0.15); GA: -0.09 (0.05). Testretestanalyses of the adolescent data (in logMAR) showed minimalbias and similar 95% LOA (0.66 for RA; 0.69 for VeA; 0.56 for GA).For adults, test-retest 95% LOA for RA was 0.28 logMAR.Correlations of adolescents’ ΔN for VeA and GA with RA (session1)were significant and similar (VeA with RA, r=0.78; GA with RA,r=0.83). Mean ΔNs were also similar and not significantly different(RA: -0.79±0.34; VeA: -0.89 ± 0.44; GA: -0.76±0.31).Conclusions: Test retest reliabilities are similar for RA, VeA and GAtests in a small sample of adolescents with visual impairment andother disabilities. Normalized VeA and GA acuities have a similarrelationship to normalized RA and are not significantly different onaverage. Thus, vernier acuity may not have an advantage over gratingacuity in adolescents with visual impairments due to ocular andneurological causes, who have other disabilities. However, for othercauses of visual deficits, for example, amblyopia, vernier acuity maybe more sensitive than grating acuity.Vernier acuity cards with stimuli, forming a second-order shape of asix-pointed star or a flower (Drover et al 2010). Acknowledgments:Eileen E. Birch, PhD. and Yi-Zhong Wang, PhD. who provided thestimuli.©2013, Copyright by the Association for Research in Vision and Ophthalmology, Inc., all rights reserved. Go to iovs.org to access the version of record. For permissionto reproduce any abstract, contact the <strong>ARVO</strong> Office at arvo@arvo.org.
<strong>ARVO</strong> 2013 Annual Meeting Abstracts by Scientific Section/Group – <strong>Visual</strong> <strong>Psychophysics</strong> / <strong>Physiological</strong> <strong>Optics</strong>Photograph of examiner testing an adolescent participant with vernieracuity cards.Commercial Relationships: Huizi Kelly Yin, None; Barry S.Kran, None; Darick Wright, None; Donna D. Bent, None; LiDeng, None; Dale L. Mayer, NoneSupport: New England College of Optometry internal research grantProgram Number: 2771 Poster Board Number: B0025Presentation Time: 8:30 AM - 10:15 AMEvaluating the Effectiveness of Low Vision Rehabilitation inChildrenVijaya K. Gothwal, Rebecca Sumalini, Seelam Bharani. Meera and LB Deshpande Centre for Sight Enhancement, L V Prasad EyeInstitute, Hyderabad, India.Purpose: Approximately 90% of patients with visual impairment(VI) have adequate residual vision to benefit from low visionrehabilitation (LVR). However, good evidence on LVR outcomes isrequired to guide service development and improve the lives ofpeople with VI. Studies in adults with VI have demonstrated animprovement in the overall visual functioning (VF) and quality of lifeafter LVR. Nonetheless, such effects are yet to be demonstrated inchildren with VI. The aim of this study was to evaluate theeffectiveness of a multidisciplinary LVR program on VF using theLV Prasad-Functional Vision Questionnaire II (LVP-FVQ II).Methods: First-time referrals to the Centre for Sight Enhancementwere assessed before and after LVR (3-4 months). Children wereadministered the LVP-FVQ II before low vision assessment and at 3-4 months follow-up to assess the outcomes of LVR. Recently, asecond version of the LVP-FVQ (LVP-FVQ II) was developed andwas demonstrated to be a reliable and valid measure of VF usingRasch analysis. Rasch analysis was used to estimate the LVP-FVQ IIscores on an interval scale. Cohen d values were used to estimate themagnitude of the change and the standardized response mean (SRM)was selected to determine the clinical change of the LVR inducedchanges.Results: Sixty-three participants completed the rehabilitation (meanage, 11.9 years; male, 62%). Approximately one-half had retinaldisorders (48%, 30) and most were moderately visually impaired(
<strong>ARVO</strong> 2013 Annual Meeting Abstracts by Scientific Section/Group – <strong>Visual</strong> <strong>Psychophysics</strong> / <strong>Physiological</strong> <strong>Optics</strong>Purpose: To compare fixation stability in diabetic patients measuredby the laser scanning digital camera (LSDC) and the digital lightprojector camera (DLP-Cam), using standard deviation of Euclideandistance (ED) and bivariate contour ellipse area (BCEA) as metrics.Methods: Eight diabetic patients (5 male, 3 females, age 48±12 yr)were imaged at the Eastmont Wellness Center, a diabetic retinopathyscreening site within the EyePACS telemedicine network, with boththe LSDC and the DLP-Cam. LSDC and DLP-Cam have 36 and 33deg fields, respectively. Light levels at the cornea were 2 mW @ 850nm, which appeared quite dim, for the LSDC and 42 uW from thegreen LED, which was bright, for the DLP-Cam. Image buffers of 20@ 11 fps (LSDC) and 16 @ 17 fps (DLPC) frames were acquired onthe same day by the same camera operator. One eye was chosen atrandom for this analysis. Fixation stability was assessed using thecoordinates determined for image registration by the same alignmentalgorithm. The measurements in pixels were converted to minArcbefore comparing the LSDC and DLPC results by paired t-tests.Results: The standard deviation of ED for this group of patients was5.09±3.42 and 5.69±3.25 minArc for LSDC and DLP-Cam,respectively. The BCEA, which typically decreases the effect ofoutliers, was 2.43±0.41 and 2.43±0.44 log(minArc^2), for LSDC andDLP-Cam, respectively. The differences in fixation stability were notstatistically significant by either metric.Conclusions: Both imaging systems provide comparable fixationstability measures, suggesting that the brighter fundus illumination ofthe DLP-Cam compared to the LSDC does not affect fixation ability.Our alignment algorithms are able to process images taken witheither visible or near infrared fundus illumination which are known toemphasize different retinal structures.Commercial Relationships: Benno L. Petrig, Aeon Imaging LLC(E), Aeon Imaging LLC (P); Jeff Clendenon, Aeon Imaging, LLC(E); Lisa Ensman, None; Matthew S. Muller, Aeon Imaging, LLC(I), Aeon Imaging, LLC (P), Aeon Imaging, LLC (R), Aeon Imaging,LLC (S), Indiana University Research and Technology Corporation(P); Ann E. Elsner, Aeon Imaging, LLC (I), Aeon Imaging, LLC(F), Aeon Imaging, LLC (P); Glen Y. Ozawa, None; Taras V.Litvin, None; Jorge A. Cuadros, EyePACS LLC (I); Tuhin Roy,None; Danny Li, NoneSupport: R44EY018772(BLP), R44EY020017(MSM)Program Number: 2774 Poster Board Number: B0028Presentation Time: 8:30 AM - 10:15 AMDo visually impaired participants hear better? An evaluation ofself report using a modified version of Speech, Spatial andQualities of Hearing ScaleShahina Pardhan 1 , Silvia Cirstea 1 , Andrew Kolarik 2, 1 , Brian Moore 2 .1 Vision and Eye Research Unit (VERU), Anglia Ruskin University,Cambridge, United Kingdom; 2 Department of Psychology, Universityof Cambridge, Cambridge, United Kingdom.Purpose: Literature suggests that visually impaired participants mayperform better than sighted participants on auditory tasks. This ismore apparent in participants with severe visual impairment.However, it is not known whether these participants perceive theirhearing to be better than normally sighted participants. We modifiedthe Speech, Spatial and Qualities of Hearing questionnaire for use byvisually impaired participants. <strong>Visual</strong> aspects were removed from tenitems, but modifications were kept minimal, so as to maintain themeaning of the original items. The modified questionnaire addressesa large variety of auditory scenarios and assesses situations whichvisually-impaired participants find most demanding, and those whichpresent little difficulty.Methods: The modified SSQ was administered to 8 participants withsevere visual impairment but who had normal hearing. Age-matchedsighted participants with normal hearing acted as controls. Itemsassessed self report for speech comprehension in the presence orabsence of competing speech or noise, and spatial aspects of hearingincluding judgements of direction and distance. Qualities of thelistening experience such as perceived effort and sound identificationwere also assessed.Results: In the speech domain, Mann-Whitney U tests showed thatparticipants with severe visual impairment reported significantlymore difficulties (p
<strong>ARVO</strong> 2013 Annual Meeting Abstracts by Scientific Section/Group – <strong>Visual</strong> <strong>Psychophysics</strong> / <strong>Physiological</strong> <strong>Optics</strong>object was 13.95 seconds. Both patients were given a SystemUsability Scale (SUS) test. Patients RS-2 and NM gave the OLFSsystem a score of 87.5% and 67.5%, respectively. A 100% scoresymbolizes a perfectly usable system (as judged by the subject).Object tracking path data within the FOV was also recorded for eachtest and each test subject.Conclusions: An initial system for assisting the blind in reaching andgrasping for objects was successfully designed, implemented andtested. Test subjects were able to successfully grasp the object. Futureimprovements to the system will include enhanced robustness ofvision algorithms, and new implementations of physical feedback.These two improvements will act to make the use of the system moreintuitive for the patient.Commercial Relationships: Nii Tete Mante, None; GerardMedioni, None; Armand R. Tanguay, University of SouthernCalifornia (P); Thang Dinh, None; Furkan E. Sahin, None; PatrickJ. Nasiatka, None; James D. Weiland, Second Sight MedicalProducts, Inc. (F)Support: Research to Prevent Blindness, W.M. Keck Foundation;USAMRMC-W81XWH-10-2-0076Program Number: 2776 Poster Board Number: B0030Presentation Time: 8:30 AM - 10:15 AMMagnification, Field of View and Depth of Field in Low VisionAids and Optical InstrumentsIan L. Bailey. School of Optometry, University of California,Berkeley, Berkeley, CA.Purpose: Clinicians prescribing low vision aids or using visualinstruments to examine eyes often need to understand what finedetails can be seen, how much of the object can be seen, and howvisual access depends of the viewing system. Some new simpleconcepts can allow clinicians to estimate the magnitude ofmagnification effects, fields of view and depths of field.Methods: There are several different methods used to quantifymagnification effects at near and this often leads to erroneouspredictions of optical performance. As an alternative, we useEquivalent Viewing Distance (EVD) which is the distance at whichthe object would subtend the same angle that is being subtended bythe image. The size of just-resolvable detail is simply proportional tothe EVD. For collimating systems, the EVD is equal to the equivalentfocal length. For images at finite distances, the EVD is calculated bydividing the eye-to-image distance by the enlargement ratio (ER) . Tounderstand such systems, the clinician needs to know the imagelocation and ER.The Field of View (FoV) is determined by a “field cone’ whose angleis determined by the field limiting aperture and its distance from theeye. The Image Field Aspect Ratio (IFAR) is a diameter-to-distanceratio defining this angle. The width of the FoV is equal to the productof EVD and IFAR. Slit lamps, and most other microscope systemsare analogous to Kelperian telescopes and then, IFAR = approx. 1.0,and the EVD and the FoV will be about equal.A practical estimate of the Depth of Field is given by the square ofthe EVD.Results: These methods can provide an immediate and accurateestimate of EVD, FoV and DoF in hand held magnifiers, standmagnifiers, telescopes for distance or near. It is easy for clinicianobserving a patient to mentally visualize the field cone and EVDplane, and immediately estimate the FoV. The same approach caneasily be applied to the slit lamp and most other visual inspectioninstruments. Once the geometric concepts are grasped, only minimalcalculation skills are required.Conclusions: The concept of Equivalent Viewing Distance simplifiesthe quantification of magnification effects and prediction ofresolvable detail. The image field cone concept when combined withthe EVD, directly and intuitively predicts the width of the FoV. Oncethe EVD is known, the depth of field can be estimated by squaringthe EVD.Commercial Relationships: Ian L. Bailey, NoneProgram Number: 2777 Poster Board Number: B0031Presentation Time: 8:30 AM - 10:15 AMPreference pattern of low vision aids in glaucoma-redefiningguidelinesAparna Rao, Sirajum Monira, Mahasweta Chowdhury. GlaucomaServices, LV Prasad Eye Institute, Patia, India, Bhubaneswar, India.Purpose: To evaluate preference pattern of low vision devices(LVD) in patients with glaucoma to arrive at specific guidelines forprescribing these devices with regards to specific visual disabilities.Methods: Retrospective review of records of glaucoma patientsattending low vision services. Criteria for low vision was defined asbest corrected distance visual acuity
<strong>ARVO</strong> 2013 Annual Meeting Abstracts by Scientific Section/Group – <strong>Visual</strong> <strong>Psychophysics</strong> / <strong>Physiological</strong> <strong>Optics</strong>Sustained benefits of Therapeutic Tinted Contact Lenses (CL) inpatients with AlbinismFaheemah Saeed 1 , Darrell G. Schlange 2 , Tina Najafi 3 . 1 IllinoisCollege of Optometry, Chicago, IL; 2 Illinois College of Optometry,Chicago, IL; 3 Illinois College of Optometry, Chicago, IL.Purpose: To determine whether the improvement in visual functionand nystagmus eye movements observed in patients with Albinismusing tinted CL correction is sustained after 6 months following theinitial dispense. Improved visual function and nystagmus eyemovements in 20 patients with Albinism resulting from tinted CL usewere reported last year. Results collected 6 months after the initialCL dispense are now being reported on 13 returning patients.Methods: 20 subjects were fitted with soft toric CL’s that were thencustom tinted to create an artificial iris. Dependent variablesincluding visual acuity (VA), contrast sensitivity (CS) with andwithout glare, and nystagmus eye movement recordings were testedagain while wearing tinted CLs, 6 months following the initialdispense of tinted CL. The EDTRS chart was used to measure visualacuity. The CSV-1000HGT (halogen glare test) and 1000E (ContrastSensitivity chart) were used to measure the contrast sensitivityfunction and effect of glare. Nystagmus eye movement characteristicsof intensity and foveation were recorded and analyzed with anISCAN system (RK 826PCI) that uses a video based dark pupil-tocorneareflection method.Results: The improved logMar VA observed with tinted CLs wasstill present at the 6 month follow up visit, as the difference obtainedat the two visits did not differ significantly (t= 1.72, p=0.11). MeanCS under normal testing conditions was further improved at the 6month follow up visit (t= 2.49, p=0.028) while the mean CS withglare did not differ between the two visits (t= 1.17, P=0.266). ISCANrecordings with 3 runs in each of 5 gaze positions showed that thereduced intensity of nystagmus was also maintained with tinted CLwear after 6 months (t= 0.61, p=0.557).Conclusions: We previously reported that VA, Nystagmus intensityand CS with and without glare were significantly improved withtinted CL wear in patients with albinism. The current study indicatesthat these significant improvements are maintained or even increasedfor at least six months following initial dispensing of tinted CL’s.Commercial Relationships: Faheemah Saeed, None; Darrell G.Schlange, None; Tina Najafi, NoneProgram Number: 2779 Poster Board Number: B0033Presentation Time: 8:30 AM - 10:15 AMEvaluating center of pressure (CoP) measures of posturalstability in low and normal vision using the Nintendo WiiBalance Board TM (WBB)Pamela E. Jeter 1 , Jialiang Gu 2 , Judith E. Goldstein 1 , Ava K. Bittner 1 ,Gislin Dagnelie 1 . 1 Ophthalmology, Johns Hopkins University,Baltimore, MD; 2 Electrical & Computer Engineering, CarnegieMellon University, Pittsburgh, PA.Purpose: To evaluate Center of Pressure measures obtained on acommercially available Nintendo Wii Balance Board TM (WBB) in agroup of low vision (LV) and normal participants.Methods: Subjects with low vision (visual acuity worse than 20/70and/or visual field less than 40°, in the better eye, N=7) and subjectswith corrected-to-normal vision (N=5), completed the modifiedClinical Test of Sensory Interaction on Balance (mCTSIB) whichincludes four sensory conditions: double-leg standing on a firmsurface with eyes open (EO-firm); standing on a firm surface witheyes closed (EC-firm); standing on an unstable (3” thick) surfacewith EO (EO-foam); and standing on an unstable surface with EC(EC-foam). Subjects performed each condition for 4 successive trialsfor up to 30 seconds with a one-minute rest period in between. Theconditions were randomly ordered. Center of Pressure (COP)outcomes were derived from data sent by the 4 force plate sensors inthe WBB to a laptop via Bluetooth. The COP measures include rootmean square (RMS) of the COP excursion (mm), RMS of velocity(mm/s), mean total velocity (MTV, mm/s), and area (mm2).Results: In the LV group, all COP measures differed significantlybetween firm and foam conditions with EC and EO (all p0.05) and between the EO-foam and EC-foamcondition. No significant differences were found across all variableswhen comparing LV participant COP measures to normal participantswith the exception of MTV and area in the EO-firm condition(p=0.01 and p = 0.03, respectively).Conclusions: This pilot study uses the WBB for determining posturalstability in a LV and normal group. As expected, differences werefound between the firm and foam conditions both with EO and EC inthe LV group suggesting that visual and sensorimotor challengesexist. In comparison, the normal group performed well across allconditions suggesting more stability. MTV and area measuresdiffered between the LV and normal group in the EO-firm conditionsuggesting that these variables might by predictors of balanceimpairment. A larger sample size is needed to determine test-retestreliability of each COP measure.Commercial Relationships: Pamela E. Jeter, None; Jialiang Gu,None; Judith E. Goldstein, None; Ava K. Bittner, None; GislinDagnelie, NoneSupport: Louise L. Sloan Research Grant Award, Lions VisionResearch Foundation, Wilmer Eye InstituteProgram Number: 2780 Poster Board Number: B0034Presentation Time: 8:30 AM - 10:15 AMLow vision and work opportunitiesJørn Kalleberg 1 , Irene Langeggen 2 . 1 NAV Buskerud, Drammen,Norway; 2 Buskerud University College, Kongsberg, Norway.Purpose: The aim is to enhance routines around any working lowvision patients enrolled at The Norwegian Labour and WelfareAssociation, Low vision clinic (NLW-LWC) and Kongbergcommunity, Buskerud, Norway. Data published by the NorwegianBlind Association reports 25-40 % of visual impaired are working.There is no literature referring to the role of NLW-LWC andcommunity cooperation to enhance low vision rehabilitation for thesepatients.Methods: Patients were recruited from a list of candidates given byeither the Kongsberg Community optometrist or the NLW-LWCoptometrist. The patients included were all eligible to low vision aidsaccording to Norwegian guidelines. All participants were asked andsigned the consent form.The interview of the subjects was based on aquestionnaire concerning general health, mobility, work situation, useof visual aids and their experience with visual rehabilitation.Results: Age ranged from 32 - 59 years. Of 13 participants, six malesand four females were interviewed. One of the subjects had acongenital low vision condition. All subjects have completededucation at a high school level. One has a master degree. There is noone working in health care profession. Eight of ten works daily on acomputer, but only one uses Zoomtext.<strong>Visual</strong> acuity ranged from 0,15 - 1,2 (Snellen). <strong>Visual</strong> field wasreduced in nine of ten subjects. Six of ten used filter spectacles.Magnifier (4), near and reading magnifying spectacles (7) and thecomputer (7) were the prefered low vision aids. Seven subjects have afull time position.Neither had experienced a systematic approach to their low vision©2013, Copyright by the Association for Research in Vision and Ophthalmology, Inc., all rights reserved. Go to iovs.org to access the version of record. For permissionto reproduce any abstract, contact the <strong>ARVO</strong> Office at arvo@arvo.org.
<strong>ARVO</strong> 2013 Annual Meeting Abstracts by Scientific Section/Group – <strong>Visual</strong> <strong>Psychophysics</strong> / <strong>Physiological</strong> <strong>Optics</strong>situation. Follow ups where through the local optometrist (7/10).They thought highly of the questionnaire and emphasized the needfor regular follow up of optometrists with low vision advices as ahealth speciality.Conclusions: To enhance better low vison rehabilitation and toprovide better work situationsis it necessary to look at the work andthe home situation together. There is a need for a systematic approachtowards this patient group. The optometrist is essential in optical lowvision follow up, the NLW-LWC needs to focus on technical support,illumination, legal rights and the dialog with the work place. Ourquestionnaire can be a tool of care. To improve the rehabilitation atwork you improve selfesteem and paricipation in the society.Commercial Relationships: Jørn Kalleberg, None; IreneLangeggen, NoneProgram Number: 2781 Poster Board Number: B0035Presentation Time: 8:30 AM - 10:15 AMThe effect of an Adapted Day Centre on Physical andPsychological Well-Being in Older Adults with Low VisionWalter Wittich 1, 2 , Caitlin Murphy 3, 2 , Daphne Mulrooney 1, 2 .1 Research, MAB-Mackay Rehabilitation Centre, Montreal, QC,Canada; 2 CRIR, Montreal, QC, Canada; 3 School of Optometry,University of Montreal, Montreal, QC, Canada.Purpose: Older adults with visual impairment are vulnerable tosocial isolation and associated health risks. The MAB-MackayRehabilitation Centre runs a Day Centre program whose objectivesare to maintain or improve the seniors’ biological, psychological, andsocial health, and foster a better quality of life, while delaying oravoiding institutionalization. Activities include walking groups,language courses, memory games, crafts and theme parties,supervised by an interdisciplinary team, including a nurse, socialworker and occupational therapist. Services include medical andrehabilitation follow-up and referrals to additional communityresources. The present study evaluates the impact the Day Centre hason the holistic health of older adults with visual impairment.Methods: Between September 2011 and October 2012, 16 newlyreferred clients in the Day Centre (age 71 to 98, M = 85, VA 20/50 toNLP, M = 20/126) were evaluated at intake, and after 6 months,using the <strong>Visual</strong> Function Questionnaire-14, Hearing HandicapInventory for the Elderly, Geriatric Depression Scale (GDS),Friendship Scale, Life-Space Questionnaire, Activity-specificBalance Confidence scale, Timed-Up-and- Go Test, and the adaptedMontreal Cognitive Assessment (MoCA). Acuity, visual field, andaverage decibel hearing loss were recorded.Results: All participants continued to live independently in thecommunity 6 months after entering the Day Centre. Comorbidconditions included high blood pressure, asthma, cardiac problems,diabetes, stroke, arthritis, osteoporosis, and anxiety. Participantsreported statistically unchanged scores on all the measures, except forincreased GDS scores (p < .05) and a trend towards improvement onthe MoCA (p = .06).Conclusions: Considering the fragility, vulnerability and age of thispopulation, the data indicate that the Day Centre fulfills its mandateto prevent decline in its clients’ biological, psychological, and socialhealth. We speculate that the increase in depression scores is linkedto serious life events during the follow-up period for some of theparticipants, such as loss of a spouse. Participation in adapted DayCentre activities, as an integrated part of rehabilitation services,seems to support independent living in older adults with vision loss.Commercial Relationships: Walter Wittich, None; CaitlinMurphy, None; Daphne Mulrooney, NoneProgram Number: 2782 Poster Board Number: B0036Presentation Time: 8:30 AM - 10:15 AMVision, Demographic Factors, and Motor Vehicle Collisions inBioptic DriversBradley E. Dougherty 1 , Roanne E. Flom 1 , Mark A. Bullimore 2 ,Thomas W. Raasch 1 . 1 Optometry, Ohio State University, Columbus,OH; 2 Optometry, The University of Houston, Houston, TX.Purpose: In approximately 40 US states, drivers who cannot meetvision standards with conventional optical correction are permitted touse bioptic telescopic spectacles to obtain licensure. Very few studiesof safety of bioptic driving have been conducted. This studyexamined the relationships among visual and demographic factorsand motor vehicle collisions (MVC) in bioptic drivers in Ohio.Methods: A retrospective study of patients identified as havingreceived an initial daylight bioptic examination at the College ofOptometry at the Ohio State University was conducted. Data werecollected on vision, including visual acuity (logMAR charts), contrastsensitivity (Pelli Robson or Mars charts) and visual field (arc orGoldmann perimeter). Driving records from the Ohio BMV wereobtained and demographics, ocular diagnoses, and licensure historywere also recorded. Relationships among vision, demography, andBMV data including MVC were investigated using survival analysisand the Cox proportional hazards regression model.Results: 238 drivers (65% male) were identified. Age at initial examranged from 16 to 81 years (mean = 39±15 years). Time since biopticlicensure ranged from 1 to 22 years (mean = 10±5 years). MeanlogMAR visual acuity OU was 0.76±0.12 (approximately 20/115)and mean log contrast sensitivity was 1.53±0.23. A total of 292 MVCwere documented in the BMV records for these drivers. The numberof MVC per driver ranged from 0 to 11, with 124 (52%) drivershaving had at least one MVC and 72 (30%) having had two or more.<strong>Visual</strong> acuity, contrast sensitivity, and horizontal visual field werenot significant predictors of MVC (p = 0.81, 0.18, and 0.76,respectively). Gender was not associated with MVC (p=0.28), butage was associated with fewer MVC (p < 0.001). Previous (withoutbioptic)licensure status was associated with fewer MVC (p < 0.001),with 41% of drivers with previous licensure involved in an MVCversus 67% of drivers without previous licensure.Conclusions: Age and previous non-bioptic licensure were inverselyassociated with fewer MVC in this group of bioptic drivers. VA, CS,horizontal VF, and gender did not predict MVC involvement.Commercial Relationships: Bradley E. Dougherty, None; RoanneE. Flom, None; Mark A. Bullimore, Alcon (C), Carl Zeiss Meditec(C), DigitalVision Systems (C), Ridgevue (I); Thomas W. Raasch,NoneSupport: NIH Grant 8TL1TR000091-05, Ohio Lions Eye ResearchFoundation GrantProgram Number: 2783 Poster Board Number: B0037Presentation Time: 8:30 AM - 10:15 AMEffects of patient traits on physician-predicted low visionoutcomesTiffany L. Chan, Robert W. Massof, Judith E. Goldstein.Ophthalmology, Johns Hopkins University School of Medicine,Baltimore, MD.Purpose: We reported that physicians’ ability to predict the successof low vision rehabilitation (LVR), relative to patient-reportedoutcomes, is no better than chance. This study determines if patients’traits influence ratings physicians provide and if those traits affectpatient-reported outcomes.Methods: The Activity Inventory (AI), a self-report visual functionquestionnaire, was administered pre and post-LVR to 270 low visionpatients served by 28 LVR centers that participated in a collaborativestudy. The physical component of the SF-36, GDS, and TICS also©2013, Copyright by the Association for Research in Vision and Ophthalmology, Inc., all rights reserved. Go to iovs.org to access the version of record. For permissionto reproduce any abstract, contact the <strong>ARVO</strong> Office at arvo@arvo.org.
<strong>ARVO</strong> 2013 Annual Meeting Abstracts by Scientific Section/Group – <strong>Visual</strong> <strong>Psychophysics</strong> / <strong>Physiological</strong> <strong>Optics</strong>were administered pre-LVR to measure physical capability,depression and cognitive status. Following patient evaluation, 38LVR physicians estimated the probability of outcome success (POS)on a scale of 0 to 100% for each of their patients, using their owncriteria for success.The POS ratings and change in functional ability,based on Rasch analysis of AI responses, were used to assess theeffects of patients’ baseline traits on predicted and patient-reportedoutcomes. The distributions of SF-36 physical functioning, GDS, andTICS measures were divided into quartiles and visual acuity (VA)was categorized by severity. Analysis of variance was performedwith POS and change in functional ability as the dependent variablesand the quartiles for each trait serving as factors.Results: Baseline traits with significant effects on POS are: physicalfunctioning (p=0.003), cognitive state (p=0.001), visual acuity(p
<strong>ARVO</strong> 2013 Annual Meeting Abstracts by Scientific Section/Group – <strong>Visual</strong> <strong>Psychophysics</strong> / <strong>Physiological</strong> <strong>Optics</strong>Methods: Detection thresholds were previously measured in thedark-adapted fovea for spots from 0.3' to 25' in diameter (550nm, 10-30ms), viewed through either a 2 mm (conventional optics, 4subjects) or 6 mm pupil (adaptive optics aberration correction, 5subjects). Thresholds and psychometric function slopes werecompared with predictions from analytic and Monte-Carlo modelswith different summation strategies given detection uncertainty,Poisson noise, and cone mosaic granularity.Results: Average change in log threshold with log stimulus area was0.12±0.03 for stimuli up to 4-10' diameter, precluding both a singleunit size and the optimal stimulus-matched strategy. Data wereconsistent with spatial uncertainty of at least 25'. Model comparisonsuggests suboptimal combination across multiple-sized units, wheresmaller units exhibit relatively more post-receptoral noise, with thesmallest unit no larger than the smallest stimulus (~0.5' retinal fullwidthhalf maximum), and the largest unit 4-10' in diameter. At leasttwo different unit sizes are required to describe the data. Althoughmany different unit sizes are required for performance approachingoptimal stimulus-matched summation, independent combinationacross two sizes reduces efficiency by only ~0.1 log unit. With a 10'largest unit (roughly parasol receptive field center size) and quantumefficiency of 0.11-0.35, dark noise is estimated at 9-435events/cone/s.Conclusions: Dark-adapted foveal detection as a function of stimulussize is consistent with independent combination across at least twodifferent sized units, the largest and smallest of which are consistentwith midget and parasol ganglion cell receptive field sizes. Anindependent detection strategy across midget and parasol ganglioncells is expected to perform only slightly worse than the optimalstimulus-matched strategy, given noise and uncertainty constraints.Commercial Relationships: Darren E. Koenig, None; Heidi J.Hofer, NoneSupport: NIH ROI EY019069, P30 EY07551Monocular and binocular presentation were compared, as well asresults obtained with natural or dilated pupil.Results: All subjects completed the test successfully. Binocularpresentation reduced threshold by ~0.15 log units. Intra-subjectrepeatability was >90%. We found no difference in the resultsobtained with natural or dilated pupils. A flickering stimulus did notshow advantages over a constant presentation.Conclusions: The Tuebingen Scotopic Threshold Test allows forquick and easy assessment of the sensitivity of the dark-adapted eye.The recording takes only 5 minutes (w/o dark adaptation), can bedone with natural pupils and is comfortable for the patient. Resultsobtained with the TSTT show a high correlation to similar tests. Thismakes the TSTT to a well suited tool for testing children.This project and study is supported through TREATRUSH(HEALTH-F2-2010-242013), a European Collaborative project -supported by the European Commission under the 7th FrameworkProgram.Program Number: 3015 Poster Board Number: C0178Presentation Time: 8:30 AM - 10:15 AMQuick and easy light sensitivity assessment of the dark adaptedeye: The Tuebingen Scotopic Threshold Test (TSTT)Torsten Strasser, Hana Langrová, Anne Kurtenbach, Ditta Zobor,Dominic Hillerkuss, Eberhart Zrenner. Institute for OphthalmicResearch, Centre for Ophthalmology, Tuebingen, Germany.Purpose: Light sensitivity of the dark-adapted eye is a valuableindicator of retinal function. Changes in light sensitivity are observedin many retinal disorders like Retinitis pigmentosa, CSNB, or invitamin A deficiency. Light sensitivity is usually tested using darkadaptometry: after transient exposition to bright light the darkadaptationcurve and the final threshold are measured. This procedureis time-consuming and uncomfortable, especially for children. Withinthe EU-project TREATRUSH, we developed a test for assessing thescotopic threshold for early detection of Usher's syndrome.Methods: The TSTT has 2 panels for scotopic and photopicstimulation. Each panel has a size of 7×10cm, consisting of 35individually addressable LED bars, thus allowing to use variousstimulus shapes. The centerpiece of the TTST is a microcontroller(ATmega8515, Atmel Corp.), running a self-developed software.Stimulus luminance is tuned by pulse-width modulation andadjustable in 100 steps between -3 to -1 log cd/m 2 . Using filters, thiscan be extended from -8 to -1 log cd/m 2 . The luminance graduallyincreases until a perception is indicated. The patient names the shapeand the examiner confirms or discards the response, thusdiscriminating correct answers from false-positives. If confirmed, theluminance is decreased and the procedure is repeated.Feasibility and repeatability were tested in 11 subjects (10-68yrs).Commercial Relationships: Torsten Strasser, None; HanaLangrová, None; Anne Kurtenbach, None; Ditta Zobor, None;Dominic Hillerkuss, None; Eberhart Zrenner, Retina Implant AG(F), Retina Implant AG (I), Retina Implant AG (C), Retina ImplantAG (P), QLT Inc (C), Servier, Paris (C), Steinbeis GmbH&CoKG,Stuttgart (I), Steinbeis GmbH&CoKG, Stuttgart (C), Neurotech, USA(C), Pfizer, USA (C)©2013, Copyright by the Association for Research in Vision and Ophthalmology, Inc., all rights reserved. Go to iovs.org to access the version of record. For permissionto reproduce any abstract, contact the <strong>ARVO</strong> Office at arvo@arvo.org.
<strong>ARVO</strong> 2013 Annual Meeting Abstracts by Scientific Section/Group – <strong>Visual</strong> <strong>Psychophysics</strong> / <strong>Physiological</strong> <strong>Optics</strong>Program Number: 3016 Poster Board Number: C0179Presentation Time: 8:30 AM - 10:15 AMDark Adaptation and the effect of Oxygen Inhalation in CysticFibrosisRachel Hiscox 1 , Christine Purslow 2 , Rachel V. North 1 , Ian Ketchell 3 ,Katharine Evans 1 . 1 School of Optometry and Vision Sciences,Cardiff University, Cardiff, United Kingdom; 2 School of HealthProfessions, Plymouth University, Plymouth, United Kingdom; 3 AllWales Adult Cystic Fibrosis Centre, University Hospital Wales,Cardiff, United Kingdom.Purpose: Previous research has shown impaired measures of darkadaptation in cystic fibrosis (CF), with the cause generally attributedto concomitant vitamin A deficiency. However, other factorsincluding CF-related diabetes (CFRD) may influence these results.Impaired dark adaptation in Type 1 and 2 diabetics improves uponoxygen inhalation and has therefore been attributed to retinalhypoxia. The purpose of this preliminary study was to evaluate theeffect of oxygen inhalation on dark adaptation in CF, to determine theunderlying cause of impairment.Methods: Dark adaptation was assessed in 9 CF (5 CFRD, 4 non-CFRD) and 9 age, gender and ethnicity-matched controls using acustom made computerised dark adaptometer to present an 11°achromatic stimulus centred on the fovea. All CF subjects werevitamin A sufficient. Following pupil dilation, a Maxwellian viewoptical system was used to administer an 82% cone and 75% rodphotopigment bleach. Subsequently, threshold was monitored for 25minutes whilst the patient inhaled either medical air or 100% oxygen(selected at random) through a 60% venti mask. This procedure wasrepeated for the second gas following a 15 minute wash out period.Threshold recovery parameters were modelled and the cone timeconstant of recovery (τ), final cone and final rod thresholdsdetermined. Relationships were evaluated using paired and unpairedT-tests as appropriate.Results: Final rod threshold was significantly elevated in CF subjectscompared to controls when inhaling medical air, -4.54 and -4.64 logcd/m 2 respectively (p=0.03). Oxygen inhalation had no significanteffect on any parameter for controls. Oxygen inhalation in CFsubjects caused a significant decrease in final rod threshold comparedto medical air, -4.66 and -4.54 log cd/m 2 respectively (p=0.04). Whenanalysed according to CFRD status, the CFRD group was found tohave a significantly elevated final rod threshold compared to the non-CFRD group when inhaling medical air, -4.47 and -4.64 log cd/m2respectively (p=0.03). This difference was not present when inhalingoxygen.Conclusions: This study has shown final rod threshold to besignificantly elevated in CF, particularly in those with CFRD, withrecovery to normal levels upon inhalation of oxygen. For the firsttime, this observation suggests that CFRD subjects experienceimpaired dark adaptation secondary to retinal hypoxia, indicatingsimilarities to Type 1 and 2 diabetics.Commercial Relationships: Rachel Hiscox, None; ChristinePurslow, None; Rachel V. North, None; Ian Ketchell, None;Katharine Evans, NoneSupport: School of Optometry and Vision Sciences, CardiffUniversityProgram Number: 3017 Poster Board Number: C0180Presentation Time: 8:30 AM - 10:15 AMCharacteristics of Color <strong>Visual</strong> Acuity by Step Changes ofBackground Luminance in Young Subjects of Normal EyesYoshiki Tanaka 1 , Kiyoshi Tanaka 1 , Sho Yokoyama 2 , HidekiNakamura 2 , Kazuo Ichikawa 2 , Shoko Tanabe 3 . 1 Faculty ofEngineering, Shinshu University, Nagano, Japan; 2 Ophthalmology,Social Insurance Chukyo Hosp., Nagoya, Japan; 3 Chukyo Eye Clinic,Nagoya, Japan.Purpose: Color <strong>Visual</strong> Acuity (CVA) is the visual acuity thatmeasures from colored Landolt ring on the background of achromaticcolor and that is the measure for evaluation of visual function forcolors in daily life. In our previous research, we measured CVA ofyoung normal subjects in the case of the background luminance ofthe color 30 [cd/m 2 ] (same luminance with Landolt ring’s color) and100 [cd/m 2 ]. In the result, for the background luminance of 100[cd/m 2 ], CVAs of all colors were almost the same value; and for thebackground luminance of 30 [cd/m 2 ], the CVAs of Blue-Yellow axisof color were higher than the other colors. Then, we further examinedthe changes of CVA for gradual changes of background luminance.Methods: Four normal eyes of 4 subjects (4 males) were enrolled inthis study. The mean age was 21.8 years old (range 21-22 years).They had no history of ocular disease (including color anomaly) orsurgery. All of them had best corrected visual acuity of 20/13. We setthe background color as white point of the standard light D65, andLadnolt ring was colored with four colors (“Red” and “Green” for theRed-Green axis of color, “Green-Yellow” and “Blue-Purple” for theGreen-Yellow axis of color) used in New Color Test (LuneauOphtalmologie).The luminance value of Landolt ring was 30 [cd/m 2 ]as a fixed value, and background was from 50 to 30 [cd/m 2 ] and from15 to 30 [cd/m 2 ].Results: There was significant difference for the colors of G(between 50 and 30 [cd/m 2 ]), GY (between 50 and 30, 15 and 30[cd/m 2 ]), BP (between 50 and 30, 15 and 30, 15 and 28 [cd/m 2 ])(p
<strong>ARVO</strong> 2013 Annual Meeting Abstracts by Scientific Section/Group – <strong>Visual</strong> <strong>Psychophysics</strong> / <strong>Physiological</strong> <strong>Optics</strong>A Color <strong>Visual</strong> Function Test to Evaluate the Age-RelatedChanges in Good <strong>Visual</strong> Acuity of Normal EyesSho Yokoyama 1 , Kazuo Ichikawa 1 , Hideki Nakamura 1 , ShokoTanabe 2 , Yoshiki Tanaka 3 , Kiyoshi Tanaka 3 , Rie Horai 2 .1 Ophthalmology, Social Insurance Chukyo Hosp, Nagoya, Japan;2 Chukyo Eye Clinic, nagoya, Japan; 3 Faculty of Engineering, ShinshuUniversity, Matsumoto, Japan.Purpose: Color <strong>Visual</strong> Acuity (CVA) is the visual acuity thatmeasured from colored Landolt ring on the background of achromaticcolor and that is the measure for evaluation of visual function forcolors in daily life. From <strong>ARVO</strong> of 2012, we measured the subjectsof best corrected visual acuity (BCVA) 20/20 or better of normaleyes in each generation to examine the CVA and we noticedparticularly in Red-Green axis color of CVA had negative correlationwith age. However, target group of BCVA has already accepted thenegative correlation with age, so that in comparison with theconventional Landolt ring, we were not able to fully grasp thesignificance correlation with CVA and age. Therefore, this time weintended for only BCVA 20/13 of normal eyes and again to examinethe correlation of CVA and age-related changes.Methods: One hundred thirteen normal eyes of 131 subjects wereenrolled in this study. The mean age was 39 years old (range 16-80years). They had no history of ocular disease (including coloranomaly) or surgery. All of them had the BCVA 20/13. We set thebackground color as white point of the standard light D65 andLandolt ring colors with fifteen colors using the New Color Test(Luneau Ophtalmologie, Paris). The luminance of background andLandolt Ring is both set approximately at the same value of30[cd/m2]).We measured all CVA of fifteen different colors for eachsubjects (Figure).Results: The results of the negative correlation with age are shown inthe descending orders GB, G, R, YR, YG, RY, BG, B, PR, P and RP.In contrast the results of no correlation were Y, GY, PB and BP(linear regression analysis: significance level P
<strong>ARVO</strong> 2013 Annual Meeting Abstracts by Scientific Section/Group – <strong>Visual</strong> <strong>Psychophysics</strong> / <strong>Physiological</strong> <strong>Optics</strong>range. The Farnsworth dichotomous test D-15 was taken twice foreach subject with 6 minutes in range.Results: 12.79% of subjects have color vision defect, 5 Males (8.7%)have Protan and 2 Females (3.5%) have Protan during the first test ofFarnsworth D-15; but only 2 Males (3.5%) have Protan during theretest of Farnsworth D-15.Conclusions: The prevalence of color vision defect among dentalpractitioners in this study is higher than the prevalence in a previousstudy (12.3% of 160 subjects). Color vision test should be applied todental practitioners in order to avoid any defect for shade matching ofteeth.Commercial Relationships: Hani Alarify, None; Nasser Aldossari,None; Ahmed Alharbi, None; Ali Masmali, None; TurkiAlmubrad, NoneProgram Number: 3021 Poster Board Number: C0184Presentation Time: 8:30 AM - 10:15 AMDependence of the color brown on the spatial configuration ofhigh luminance surroundsTanner DeLawyer, Ariel Frederick, Simon Kaplan, Tracy Lin, SophieShonka, Steven L. Buck. Psychology, University of Washington,Seattle, WA.Purpose: The same long-wavelength stimuli look brown when dimand yellow-orange when bright, relative to surrounding stimuli.Earlier research showed that the stimuli directly surrounding a brownstimulus were most important in the perception of brown. Weconfirmed these earlier results quantitatively and then tested thedependence of brown on brighter surrounding stimuli by varyingtheir spatial configuration, to assess necessary and sufficientconditions for perceiving brown.Methods: Observers, under room-light adaptation, adjusted theluminance of a constant-chromaticity 4°-diameter foveal test stimulusto set both upper and lower luminance thresholds for perceivingbrown under the four possible combinations of white and black near(4°x6° annulus) and far (6° and beyond) surrounds. The test stimulusappeared yellow-orange when at a high luminance and brown at alow luminance.Observers also completed a set of trials with an otherwise identical1°, 2°, 3°, 4°, 5°, 6°, or 7°-diameter foveal test stimulus with a 2°, 4°,6°, and 8° white near surround and black far surround.Results: Our results for the different combinations of near and farsurrounds indicated that the perception of brown occurred atsignificantly higher luminance thresholds in the presence of a whitenear surround regardless of far surround luminance. Subjects couldnot perceive brown with a black near and far surround.In our spatial configuration conditions we found a general trend thatas the size of the test stimulus increased, subjects had to adjust tolower luminance values in order to perceive brown. The size of theannulus did not have a significant effect on the subjects’ perceptionof brown.Conclusions: Our replication of earlier results establishedquantitative light levels that are necessary for the perception of brownunder normal lighting conditions both with and without the presenceof a high luminance near surround.Spatial results appear to indicate that as an object covers areas of theretina outside of the fovea the perception of brownness begins tofade, requiring a higher luminance contrast in order to perceive theobject as being brown. This agrees with observation that it is difficultto perceive a stimulus as brown when it is viewed extra-foveally evenin the presence of a high luminance surround. This suggests theneural mechanisms for perceiving a brown object are highlydependent on foveal input.Commercial Relationships: Tanner DeLawyer, None; ArielFrederick, None; Simon Kaplan, None; Tracy Lin, None; SophieShonka, None; Steven L. Buck, NoneProgram Number: 3022 Poster Board Number: C0185Presentation Time: 8:30 AM - 10:15 AMFrequency of atypical genotypes associated with normal anddefective color visionCandice Davidoff, Jay Neitz, Maureen Neitz. Ophthalmology,University of Washington, Seattle, WA.Purpose: The majority of red-green color vision deficiencies resultfrom gene rearrangements that cause the loss of normal L or M opsinexpression. This can be due to deletion of an L or M gene or insertionof an extra L gene between the normal L and M genes, displacing theM gene to a non-expressed position. Thus, characterizing the numberof L and M genes is a good predictor of the presence and type ofcongenital red-green color vision defects. However, two atypicaltypes of mutations, missense mutations and extra L opsin genesdownstream of the expressed positions, would result in misdiagnosesbased on L and M gene stoichiometry. This study aims to estimatethe frequency of these types of mutations in the population.Methods: For 803 males unselected for color vision deficiencies,PCR was performed to selectively amplify L or M opsin genes. Fromthese products exons 3 and 4 were sequenced. The number and typeof opsin genes on the X-chromosome were determined by SNPanalysis using Sequenom's MassARRAY system. For samples foundto have extra L genes, long range PCR was performed to amplify themost downstream gene and verify whether it encoded an L or Mopsin. For samples with missense mutations, parts of the last genewere sequenced to determine if the mutation was in a gene in anexpressed position.Results: 3 missense mutations were identified in L opsin genes:R151T, V171L and V232L. 8 mutations were found in M opsingenes: six C203R, one R163I and one synonymous mutation. NoC203R mutation was observed in any L opsin gene. 74 samples werefound to have extra L genes. Of these 25 were confirmed to have theextra L in an expressed position, 20 were confirmed to have L genesat the end of the array and thus are likely to have normal color vision,and 29 had arrays too long to determine the position of the extra Lgene.Conclusions: C203R mutations are unlikely to cause protan defects.Missense mutations that may cause protan defects were present in0.37% of the sample and those that may cause deutan defects weredetected in 1%. 9% of men in this sample have more than one L gene.Of those, at least a quarter had the genetic basis for normal colorvision despite the presence of an extra L gene. 3.1% of men could beconfirmed to have an L gene in the second position and are presumedto have deuteranomaly and another 3.6% may be deuteranomalousdepending on the location of the extra L gene(s) in arrays with > 3genes.Commercial Relationships: Candice Davidoff, None; Jay Neitz,Alcon (F), Alcon (P); Maureen Neitz, Genzyme (F), Alcon (F),Alcon (P)Program Number: 3023 Poster Board Number: C0186Presentation Time: 8:30 AM - 10:15 AMRod Hue Biases for Foveal Stimuli on CRT DisplaysKatharina G. Foote, Steven L. Buck. Psychology, University ofWashington, Seattle, WA.Purpose: Signals from rod photoreceptors bias (shift) the huesdetermined by cone photoreceptors for extrafoveal mesopic stimuli -creating green, blue, and red rod hue biases at long, middle, and shortwavelengths, respectively. The fovea contains far fewer rods and S©2013, Copyright by the Association for Research in Vision and Ophthalmology, Inc., all rights reserved. Go to iovs.org to access the version of record. For permissionto reproduce any abstract, contact the <strong>ARVO</strong> Office at arvo@arvo.org.
<strong>ARVO</strong> 2013 Annual Meeting Abstracts by Scientific Section/Group – <strong>Visual</strong> <strong>Psychophysics</strong> / <strong>Physiological</strong> <strong>Optics</strong>cones but may not be immune to rod hue biases. Here, we determinewhich biases are found for foveal stimuli presented on a CRT display.Methods: On a CRT display, a 1-s duration test disk of 0.5°, 1.0°, or2.0° diameter alternated with a 3-s duration array of 0.25° fixationdots placed 4° from fixation, all on a black background. Sevenobservers adjusted the hue of the test disk around the RGB phosphormixture triangle, to yield each of the 4 unique hues, Ured, Ugreen,Ublue, and Uyellow. Light levels ranged from 0.05 - 0.17 (CIE2°) or0.08 - 0.03 (CIE10°) cd/m 2 .Results: 1°-2°-diameter foveal test disks (a) produced rod green biasat Uyellow for most observers, (b) favored rod green bias at Ublueover the rod red biases shown in prior extrafoveal studies, and (c)produced less consistent rod hue biases at Ured and Ugreen. 0.5°diameterfoveal test disks produced no consistent rod hue biasesacross observers. Remaining rod hue biases tended to be small butsome observers showed larger idiosyncratic effects for a specificunique hue.Conclusions: 1°-2°-diameter foveal disks on a CRT displayproduced relatively strong rod green bias, mediated by rod interactionwith L & M cones, presumably in midget/parvo pathways. Incontrast, these foveal stimuli disadvantaged rod influence mediatedby S cones, presumably in small-bistratified/konio pathways,producing only weak/inconsistent rod red bias at Ublue and rod bluebias at Ured and Ugreen. 0.5°diameter disks disadvantaged all rodhue biases, but with individually idiosyncratic exceptions for someobservers.Commercial Relationships: Katharina G. Foote, None; Steven L.Buck, NoneProgram Number: 3024 Poster Board Number: C0187Presentation Time: 8:30 AM - 10:15 AMFundus-controlled two-color adaptometry with theMicroperimeter MP1Wadim Bowl, Birgit Lorenz. Department of Ophthalmology, Justus-Liebig-University, Giessen, Germany.Purpose: To provide fundus-controlled two-color adaptometry ofmesopic vision with an existing device without modifying the CEmarkedMicroperimeter MP1 itself. Rod and cone sensitivity can bemeasured and differentiated on defined retinal positions the examineris most interested in.Methods: An external filter holder was imposed on the objective lensof the MP1 (Nidek, Padova, Italy) and fitted with filters to modifybackground and stimulus intensity. Light output of the MP1 wasreduced by Schott RG780 and BG3 filters outside the instrument tocreate the stimulus colors red and blue, which were used alternatingin this examination. Absorption of infrared light by these filters islow thereby minimizing problems with fundus observation by thebuilt-in infrared camera system. After bleaching with a GanzfeldColorDome (Espion E2, Diagnosys LLC, Lowell, MA, USA) with aluminous intensity of 3000 cd/m2 for 5 minutes, twenty normalsubjects were investigated with a pattern covering 3 spots at theposterior pole of the retina (3 blue spots at 12° nasal; 3 red spots at 0°and 1°). The test was repeated every 3 minutes during the first 15minutes and every 5 minutes until 45 minutes of dark-adaptation.Thresholds were determined using a 200 ms red Goldmann IVstimulus and a blue Goldmann III stimulus employing the built-in 4-2strategy in a dark room.Results: In the first 5 minutes a slight increase of median lightincrement sensitivity (LIS) was measured for the red stimulus. Withfurther dark-adaptation, LIS to red stimuli remained at about 7 dB.For blue stimuli LIS increased considerably during the first tenminutes. With processing time sensitivity to blue stimuli reached aplateau at 15 dB. Both measurements showed typical characteristicsof dark-adaptation-curves.Conclusions: Two-color fundus-controlled adaptometry with acommercial MP1 without internal changes to the device provides aquick and easy examination of rod and cone function during darkadaptation at defined retinal loci. Under the mesopic lightingconditions chosen, LIS for blue stimuli is determined by the rodpathway. LIS for red stimuli is mediated by the cone pathway. Themethod should be helpful to identify rod vs. cone function in theposterior pole in early stages of retinal degenerations.Commercial Relationships: Wadim Bowl, None; Birgit Lorenz,Optos (F)Support: German Research Counsil (DFG LO457/10-1)Program Number: 3025 Poster Board Number: C0188Presentation Time: 8:30 AM - 10:15 AMColor Discrimination and <strong>Visual</strong> Perimetry Evaluation inMultiple Sclerosis and Neuromyelitis OpticaPhelipe A. Paixao 1, 2 , Lorena B. Botelho Vergara 1, 2 , Lucas Daniel A.Almeida Fernandes 1, 2 , Eliza Maria C. Lacerda 1, 3 , Givago S. Souza 1,3 , Hideraldo Luis Souza Cabeça 5 , Alexandre A. Rosa 2, 4 , Luiz CarlosL. Silveira 1, 3 . 1 Nucleo de Medicina Tropical, Universidade Federaldo Para, Belem, Brazil; 2 Instituto de Ciencias da Saude, UniversidadeFederal do Para, Belem, Brazil; 3 Instituto de Ciencias da Biologicas,Universidade Federal do Para, Belem, Brazil; 4 Hospital UniversitarioBettina Ferro de Souza, Universidade Federal do Para, Belem, Brazil;5 Neurologia, Hospital Ophir Loyola, Belem, Brazil.Purpose: To compare visual performance in color discrimination andvisual perimetry of patients with multiple sclerosis (MS) andneuromyelitis optica (NMO) with or without optic neuritis (ON).Methods: Patients with MS (9 subjects, 17 eyes, 37±9.7 years old)and with NMO (10 subjects, 18 eyes, 36.1±11.8 years old) werestudied with biomicroscopy, fundoscopy, and visual acuitymeasurements. Color vision was evaluated with the full test protocolof Colour Assesment and Diagnosis (CAD) Test. The diameter of thecircle with equivalent area of the color discrimination ellipses wasmeasured. <strong>Visual</strong> perimetry was evaluated by Central 30-2 ThresholdTest of the Humphrey <strong>Visual</strong> Field Analyzer. The two patient groupswere compared to each other and to an age- and gender-matchedcontrol group. Statistical analyses used: tolerance intervals, binomialtest, two-way ANOVA, α=0.05.Results: After the ophthalmologic evaluation, it was observed that 4eyes from patients with MS and 6 eyes from patients with NMO hadON. Color discrimination. 2/4 eyes from patients with MS and ONand 4/10 eyes from patients with MS without ON had colordiscrimination above the upper tolerance limit for controls. 1/6 eyesfrom patients with NMO and ON and 1/9 eyes from patients withNMO without ON had color discrimination above the upper tolerancelimit for controls. Regardless of ON presence, MS had significantlymore eyes with altered color discrimination results than NMO(p
<strong>ARVO</strong> 2013 Annual Meeting Abstracts by Scientific Section/Group – <strong>Visual</strong> <strong>Psychophysics</strong> / <strong>Physiological</strong> <strong>Optics</strong>perimetry than MS patients. The ON presence impaired the visualfunction mainly for visual perimetry and NMO patients.Commercial Relationships: Phelipe A. Paixao, None; Lorena B.Botelho Vergara, None; Lucas Daniel A. Almeida Fernandes,None; Eliza Maria C. Lacerda, None; Givago S. Souza, None;Hideraldo Luis Souza Cabeça, None; Alexandre A. Rosa, None;Luiz Carlos L. Silveira, NoneSupport: CNPq, CAPES, FINEP, FAPESPA, UFPAProgram Number: 3026 Poster Board Number: C0189Presentation Time: 8:30 AM - 10:15 AMPsychophysical and electrophysiological evaluation of visualfunction in type 1 diabeticsValéria D. Garcia 1, 3 , Mirella Gualtieri 3, 1 , Mirella T. Barboni 3, 1 ,Daniela M. Bonci 3, 1 , Thiago L. Costa 3, 1 , Balázs V. Nagy 1, 3 , Sérgio T.Rodrigues 4 , Ana L. Moura 1, 3 , Francisco Max Damico 1, 2 , Dora F.Ventura 1, 3 . 1 Neuroscience and bahavior, University of São Paulo,São Paulo, Brazil; 2 Ophthalmology, University of São Paulo, SãoPaulo, Brazil; 3 Experimental Psychology, University of São Paulo,São Paulo, Brazil; 4 Physical Education, Universidade EstadualPaulista, Bauru, Brazil.Purpose: Diabetes mellitus (DM) is a chronic disease that impairsdifferent aspects of health at different times during its progression.One of the most prevalent complications associated with DM isdiabetic retinopathy (DR), which causes losses in visual functionsand can ultimately result in blindness. <strong>Visual</strong> loss can be detectedprior to the development of DR, potentially leading to improvementin the blood sugar control, prevention, and treatment of DR. Thepresent work investigated color discrimination, contrast sensitivityand the multifocal electroretinogram (mfERG) of type 1 DM patientswithout DR.Methods: Twenty patients with type 1 DM without DR (mean age =28 ± 7 years old) were compared to 20 control subjects withoutdiabetes or ocular diseases (mean age = 28 ± 5). Color discriminationwas evaluated with the Cambridge Colour Test (CCT) and contrastsensitivity with the Metropsis software (Cambridge Research System,Ltd) using vertical sine wave gratings at seven spatial frequencies(0.2; 0.5; 1; 2; 5; 10; 20 cpd). The <strong>Visual</strong> Evoked ResponseImagining System (VERIS) was used to record the mfERGs . Groupswere compared using ANOVA.Results: Type 1 diabetic patients presented significantly elevatedvalues for all CCT parameters compared to control subjects. Protan,deutan and tritan thresholds in u’v’ units were respectively 51.95 ±23.81 (F 1,40 = 5.384, p = 0.026); 53.45 ± 25.66 (F 1,40 = 6.90, p =0,012) and 93,90 ± 41,94 (F 1,40 = 14.30, p = 0.001); elipse area was1672 ± 1102 (F 1,40 = 11.665, p = 0.002). Contrast sensitivity wasreduced in the diabetics at 0. 2 cpd (F 1,40 = 4.67, p = 0.037) and 5 cpd(F 1,40 = 6.08, p = 0.004). mfERGs of DM patients showed increasedimplicit time for N1 at 0° (F 1,40 = 5.18, p = 0.03) and N2 at 5°(F 1,40 =4.15, p = 0.04) eccentricities. In addition, there was reducedamplitude of N2 at the 20° (F 1,40 = 4.40, p = 0.04) and 25° (F 1,40 =5.42, p = 0.02) eccentricities.Conclusions: Non retinopathic type 1 diabetes mellitus patientspresent significant visual loss detectable by psychophysical andelectrophysiological tests. Retinal hypoxia caused by chronichyperglycemia has been identified as the main reason for reducedvisual functions detected in the early DM, including color vision lossand contrast sensitivity. These findings suggest that psychophysicaland electrophysiological tests should be routinely performed indiabetic patientsCommercial Relationships: Valéria D. Garcia, FAPESP (F);Mirella Gualtieri, None; Mirella T. Barboni, None; Daniela M.Bonci, None; Thiago L. Costa, None; Balázs V. Nagy, None;Sérgio T. Rodrigues, None; Ana L. Moura, None; Francisco MaxDamico, None; Dora F. Ventura, NoneProgram Number: 3027 Poster Board Number: C0190Presentation Time: 8:30 AM - 10:15 AMPsychophysical Measurement of Rod and Cone Thresholds inStargardt Disease with Full-Field StimuliFrederick T. Collison 1 , Gerald A. Fishman 1, 2 , J Jason McAnany 2 ,Jana Zernant 3 , Rando Allikmets 3, 4 . 1 The Pangere Center forHereditary Retinal Diseases, The Chicago Lighthouse for PeopleWho Are Blind or <strong>Visual</strong>ly Impaired, Chicago, IL; 2 Department ofOphthalmology, University of Illinois Chicago, Chicago, IL;3 Department of Ophthalmology, Columbia University, New York,NY; 4 Department of Pathology and Cell Biology, ColumbiaUniversity, New York, NY.Purpose: To investigate rod and cone psychophysical thresholds inStargardt disease with the Diagnosys Full-Field Stimulus Test (D-FST) using chromatic stimuli and a dark adaptation protocol.Methods: Twenty-two patients with Stargardt disease (age range 21-52) were categorized by fundus appearance as Stage 1 (flecksconfined to the macula, n=7), Stage 2 (flecks also outside the macula,n=6), or Stage 3 (resorbed flecks, n=9). The better-seeing eye wastested with ETDRS acuity charts, SD-OCT, and full-field ERG.Using the D-FST, dark-adapted rod thresholds were measured withshort-wavelength stimuli and cone thresholds were obtained from thecone plateau phase of dark adaptation using long-wavelength stimuli.Four visually normal subjects (age range 28-38) also underwent theD-FST with the same protocol.For D-FST results zero dB = 0.1 photopic cd/m 2 . Correlationcoefficients were calculated for comparisons of D-FST thresholds toother tests.Results: Stargardt patient D-FST cone thresholds correlated withETDRS acuity (r=+0.56, p
<strong>ARVO</strong> 2013 Annual Meeting Abstracts by Scientific Section/Group – <strong>Visual</strong> <strong>Psychophysics</strong> / <strong>Physiological</strong> <strong>Optics</strong>Laser Eye Protection and Visibility of Multi-Function DisplaysMartin LaFrance 1 , Craig A. Williamson 2 , Leedjia Svec 3 , ThomasKuyk 1 . 1 Air Force Research Laboratory, Fort Sam Houston, TX;2 Defence Science and Technology Laboratory, Salisbury, UnitedKingdom; 3 Defense Equal Opportunity Management Institute, PatrickAFB, FL.Purpose: Handheld lasers have become commonplace, examplesinclude laser games and hobbyist targeting devices. Unfortunatelythese lasers are at times used maliciously against commercial aircraft.Misuse has risen at an alarming pace with the Federal AviationAdministration reporting 3500+ events in 2011 alone; thus, laser eyeprotection (LEP) for aircrew is a growing concern.Aircrew LEP requires careful consideration for integration withavionics and multifunction displays (MFD) which are heavilydependent upon the accurate perception of color. The perception ofcolor, mediated by cone photoreceptors, is altered by conventionalLEP due to incongruent impact upon short, medium and longwavelengthsensitive cones. The objective of this study is to comparea color-balanced LEP design, one which preserves the weighting ofspectral transmission to cone subtypes, with conventional LEP ontests of color discrimination used as predictors of MFD integrationand user acceptance.Methods: 15 color-normal subjects completed color identificationtasks with the Farnsworth Munsell-100 and an 8-hue simulated MFDcolor identification test without and with a color-balanced LEP and aluminance matched neutral density (ND) filter. Results werecompared to predictive models of color identification errors (E94,Color-Zone Border Analysis and ΔEu’v’) and like data collectedpreviously for two conventional LEP.Results: FM-100 total error scores exceeded 80 for conventional andcolor-balanced LEP designs, the threshold for impaireddiscrimination, and were significantly higher than null and ND filterconditions. Color identification was markedly improved on the 8-hueMFD test for the color-balanced design vs. conventional LEP,statistically outperforming on five hues and producing a minordecrement for one. Global error rate across 8 hues was ~40% forconventional designs and 7% for cone-balanced. E94 calculationswere ~10 for conventional vs. 8 for the cone balanced LEP designalso predicting improved hue discrimination.Conclusions: A color-balanced LEP design demonstrates betterintegration for key multi-function display hues when compare withconventional LEP. Both conventional and color-balanced LEP, byvirtue of selectively blocked wavelengths, produce higher total errorscores with the Farnsworth Munsell-100; however, this test may notbe the best predictor of user acceptance for LEP in cockpitintegration.Commercial Relationships: Martin LaFrance, None; Craig A.Williamson, None; Leedjia Svec, None; Thomas Kuyk, NoneProgram Number: 3029 Poster Board Number: C0192Presentation Time: 8:30 AM - 10:15 AMChromatic components in underwater targets do not affect Greatcormorants’ (Phalacrocorax carbo) visual resolutionGadi Katzir 1, 2 , Ruth Almon 1 , Ido Izhaki 1 . 1 Evolutionary andEnvironmental Biology, University of Haifa, Haifa, Israel; 2 MarineBiology, University of Haifa, Haifa, Israel.Purpose: The negative effects of scatter and absorption of light onimage formation impair vision underwater. Because scatter andabsorption are wavelength dependent, it is expected that visualresolution for targets with different chromatic components, willdiffer. Great cormorants pursue prey (fish) underwater, facing visualconstraints in their frequent transitions between air and water. <strong>Visual</strong>resolution of cormorants for achromatic targets has been previouslyestablished yet the effects of chromatic components have remainedopen.We aimed here to determine the underwater visual resolution ofcormorants for square wave gratings comprising chromatic andachromatic components.Methods: Hand-reared Great cormorants (N=6) were trained andtested for their resolution, in an underwater Y-maze. The visualtargets comprised square-wave gratings that were achromatic (black& white) or chromatic (black & color). Colors ranged from “reds”through “yellow greens” to “blues”. Targets with vertically orientedbars were “positive” and targets with horizontally oriented bars were“negative”. Gratings ranged from 1.4 to 12 cpd. Illumination wasdiffuse daylight and water turbidity ranged 0.3-5.6 NTU. Thecormorants’ choice was made at 1.4m from the targets. Eachindividual provided results from ca. 30 tests on chromatic and ca. 7tests on achromatic gratings. The proportion of correct choices wasused to determine resolution (at p=0.75 level).Results: Over all cormorants (grouped) the mean maximalunderwater visual resolution for achromatic and chromatic gratingswas ca. 8cpd. Resolution for achromatic gratings was consistentlyhigher than for chromatic gratings yet the difference was notsignificant. Chromatic components did not have a significant effectwhile the effects of gratings frequency and of individual differenceson resolution were significant. Individuals showing high resolutionreached 6.1-12.2 cpd while individuals showing low resolutionreached 3.0 - 4.0 cpd.Conclusions: Under the experimental conditions here, the chromaticcomponents in the targets did not affect visual resolution. It may wellindicate that color patterns of fishes, such as alternating black andchromatic bars, may not significantly affect their detection byforaging cormorants. Marked and consistent individual differences invisual resolution must play a role in prey detection and capturesuccess.Commercial Relationships: Gadi Katzir, None; Ruth Almon,None; Ido Izhaki, NoneSupport: Israel Science Foundation - ISFProgram Number: 3030 Poster Board Number: C0193Presentation Time: 8:30 AM - 10:15 AMHigh Throughput Behavioral Estimates of <strong>Visual</strong> Thresholds inMice in a Watermaze with Cued Escape PlatformArkady Lyubarsky, Muhammad Sheheryar Khan, Meera Sivalingam,Jean Bennett. F.M. Kirby Center for Molecular Ophthalmology,School of Medicine, University of Pennsylvania, Philadelphia, PA.Purpose: To develop a quantitative, sensitive, cost-effective, noninvasivebehavioral technique for evaluation of vision in mice withemphasis on its suitability for the end point characterization in genetherapy of retinal diseases.Methods: The apparatus was a round (1.2 m diameter and 0.7 mhigh) tub made of a dark blue plastic, and filled with water to a 20 cmdepth with a single submerged escape platform (8 cm diameter). Aplastic 20 cm high pole covered with a disposable aluminum foilsleeve and standing at the platform center served as a visual cueassisting animals in finding the platform. Four infrared sourcesprovided a uniform, invisible for mice, illumination of the tub, and avideo camera with an infrared filter was recording animal’s moves.Four regulated visible light sources provided uniform illuminationinside the apparatus in a 1E-5 to 1E+2 scot cd m -2 range. Wild-type(WT) and neural retina leucine zipper (NRL) knock-out (KO) micelacking rod photoreceptors were trained to escape to the platform atthe brightest level of illumination, and then were tested at 0.5 - 0.8log-unit decrements of the illumination intensity. To determine thethreshold, we first evaluated the probability of reaching the platform©2013, Copyright by the Association for Research in Vision and Ophthalmology, Inc., all rights reserved. Go to iovs.org to access the version of record. For permissionto reproduce any abstract, contact the <strong>ARVO</strong> Office at arvo@arvo.org.
<strong>ARVO</strong> 2013 Annual Meeting Abstracts by Scientific Section/Group – <strong>Visual</strong> <strong>Psychophysics</strong> / <strong>Physiological</strong> <strong>Optics</strong>by chance per second of swimming time; to do this we measured thefrequency of platform encounter by mice swimming in dark with onlyIR illumination on. In test runs an animal was considered as “seeing”the pole if it reached the platform in 3 out of 3 consecutive trials, andthe probability of achieving this result by way of 3 random hits was
<strong>ARVO</strong> 2013 Annual Meeting Abstracts by Scientific Section/Group – <strong>Visual</strong> <strong>Psychophysics</strong> / <strong>Physiological</strong> <strong>Optics</strong>each retinal location could be measured. As an example, for subjectN1, the projection of the cone pointing at the pupil plane from allretinal locations fell within an area of 0.25mm in diameter, locatedslightly nasally (0.15mm) from the pupil center along the horizontalmeridian. The other subjects showed similar nasal bias in alignmentwith respect to the pupil center.Our disarray is smaller than that reported by previous studies(Roorda, JOV, 2002) possibly due to choosing areas that did notinclude retinal blood vessels.Conclusions: For normal subjects, our results are in agreement withprevious reports (both psychophysical and imaging studies) that thedisarray of the photoreceptors is very small; which is to optimize theefficiency of light capture within the photoreceptors. In diseasedeyes, larger variations in cone disarray were reported (Choi et al,IOVS 2008).Commercial Relationships: Nathan Doble, Iris AO Inc (I);Rebecca Kivlin, None; Johanan L. Codona, None; Simone Li,None; Stacey S. Choi, NoneSupport: EY020901Program Number: 3429 Poster Board Number: C0150Presentation Time: 11:00 AM - 12:45 PMThe role of defocus on photoreceptor light coupling analyzedwith a waveguide-based retinal simulatorBrian Vohnsen 1 , Diego Rativa Millan 2 , Carmen Vela 1 , BenjaminLochocki 1 , Philip B. Kruger 3 . 1 School of Physics, University CollegeDublin, Dublin, Ireland; 2 Pós-Graduação em Engenharia de Sistemas(PPGES), Universidade de Pernambuco, Recife, Brazil; 3 College ofOptometry, State University of New York, New York, NY.Purpose: Obliqueness of light at the retina diminishes the visualresponse as a consequence of the Stiles-Crawford effect caused byphotoreceptor waveguiding. The aim of this study is to analyze thesensitivity to defocus under waveguide conditions that resemble thoseof the human eye retina using a retinal simulator consisting of anarray of photonic-crystal waveguides.Methods: A liquid-filled photonic crystal fibre array has been used tosimulate waveguiding by retinal photoreceptors and the total fractionof coupled light has been measured. Defocus is generated with aBadal-system and monitored simultaneously with a Hartmann-Shackwavefront sensor. Measurements are performed both at 633 nm andat 543 nm wavelength to study a possible chromatic impact. Theresults are compared with those of an analytical waveguide modeland Zemax-based eye models.Results: Measurements show that the fraction of coupled light poweris sensitive to defocus as expected due to the wavefront curvature atthe entrance facet of the waveguides. This is in agreement with thenumerical models suggesting a possible role of light power foraccommodation and emmetropization of the eye.Conclusions: We found that a photonic crystal fibre array is asuitable experimental tool to analyze the role of defocus and moregenerally aberrations and their possible role on vision and effectiveretinal images. The fraction of light that couples to waveguide modesmay provide a clue for accommodation and emmetropization of theeye. The sign of defocus is not determined but may relate to thechromatic difference for a finite bandwidth or to photoreceptordisarray though also other aberrations and other factors can provideaccommodative clues.Commercial Relationships: Brian Vohnsen, None; Diego RativaMillan, None; Carmen Vela, None; Benjamin Lochocki, None;Philip B. Kruger, NoneSupport: Science Foundation Ireland grants 07/SK/B1239a and08/IN.1/B2053Program Number: 3430 Poster Board Number: C0151Presentation Time: 11:00 AM - 12:45 PMMeasurement of the Photoreceptor Pointing in the Living ChickEyeMaria Walker, Rebecca Kivlin, Nathan Doble. Vision Science, NewEngland College of Optometry, Boston, MA.Purpose: The chick retina is a widely used animal model in the studyof eye growth, in particular for the study of emmetropization andmyopia. Like most eyes, the ability to image the fine retinal structureis degraded by the aberrations in the lens and cornea. In previouswork, we showed in-vivo images of individual chick photoreceptorstaken with an adaptive optics (AO) fundus camera (Headington et al.Current Eye Research, 2011). Here we utilize this imaging capabilityto examine the individual cone directionality of the chickphotoreceptors.Methods: Two White Leghorn chickens (Gallus gallus domesticus)(age 30d, approx. 650g) were anesthetized with a combination ofKetamine/Xylazine and dilated with Vecuronium Bromidesuspension prior to imaging. The AO fundus camera at the NewEngland College of Optometry was modified in order to image thesmaller 3mm pupil of the chick. Translating the entrance pupilposition of the imaging beam (650nm) allowed for the measurementof the individual cone pointing. Thirteen entrance pupil positionswere tested to obtain 1-degree FOV retinal images; four retinalimages were registered for each position. Upon compensating for thevariation in incident light intensity due to light delivery optics, acentroiding algorithm was used to determine the directionality ofindividual cones.Results: Upon projection of the cone pointing toward the pupil plane,the degree of disarray was found to be slightly larger than that foundin the human eye. Interestingly, our initial results show an ellipticalpointing pattern in the pupil plane with major and minor axes of 0.5and 0.2 mm respectively. The major axis was horizontal and thecenter of the pattern lay on average 0.5 mm from the pupil center.Conclusions: Similar to the human eye, the chick photoreceptordisarray is small, implying that the receptors are aligned to maximizethe signal coming through the center of the pupil aperture.Commercial Relationships: Maria Walker, None; Rebecca Kivlin,None; Nathan Doble, Iris AO Inc (I)Support: NH Grant EY020901Program Number: 3431 Poster Board Number: C0152Presentation Time: 11:00 AM - 12:45 PMReproducibility of the rtx1 adaptive optics retinal camera©2013, Copyright by the Association for Research in Vision and Ophthalmology, Inc., all rights reserved. Go to iovs.org to access the version of record. For permissionto reproduce any abstract, contact the <strong>ARVO</strong> Office at arvo@arvo.org.
<strong>ARVO</strong> 2013 Annual Meeting Abstracts by Scientific Section/Group – <strong>Visual</strong> <strong>Psychophysics</strong> / <strong>Physiological</strong> <strong>Optics</strong>Dirk-Uwe G. Bartsch, Cheryl Arcinue, Feiyan Ma, Lingyun Cheng,William Freeman. Ophthalmology-Shiley Eye Ctr, Univ ofCalifornia-San Diego, La Jolla, CA.Purpose: To study the reproducibility of the flash-illuminationcommercially available adaptive optics retinal camera rtx1(ImagineEyes, Orsay, France) in a group of normal volunteers.Methods: The rtx1 is an adaptive optical fundus camera usingflashed, non-coherent flood illumination centered at 850 nm to recorda series of 40 images. Each image covers an area of 4° x 4°. Theinstrument is claimed to have a pixel resolution of 1.6 µm and resolve250 line pairs per millimeter. The instrument uses a yellow fixationcross to help the subject fixate. The location of the center of fixationcross is stored by the instrument allowing the subject to fixate to thesame stimulus location.After approval by the Institutional Review Board we recruited 6subjects and imaged each subject in two different sessions. Weselected 5 regions of interest. One was at the center of the fovea, andthe other four regions were centered at 2 degrees from the fovealcenter in the four principal directions (superior, inferior, nasal andtemporal). We selected a measurement area for each image pair thatwas matching according to vessel landmarks. We used the adaptiveoptics analysis software from ImagineEyes to measure density andspacing for each image.For statistical analysis we used concordance correlation coefficient(Lin, 1989) with a 95.0% asymptotic confidence interval, and a 95%BCa bootstrap confidence interval using SAS (Cary, NC).Results: We found that the rtx1 was able to resolve the photoreceptorcone mosaic in the parafoveal area. The instrument was not able toresolve the cone mosaic in the center of the macula. The central 2.5°of the fovea could not be resolved. For density means we found aCCC of 0.767. For spacing means we found a CCC of 0.786.Conclusions: The rtx1 adaptive optical camera allows reproducibleacquisition of the photoreceptor cone mosaic. The resolution limit ofthe instrument does not allow imaging at the center of the fovea dueto the very dense spacing of the photoreceptors. The current softwaredoes not allow to exclude blood vessels from the analysis. These twoareas might influence overall accuracy and should be excluded infuture versions of the software.Commercial Relationships: Dirk-Uwe G. Bartsch, None; CherylArcinue, None; Feiyan Ma, None; Lingyun Cheng, SpinnakerBiosciences (C); William Freeman, OD-OS, Inc. (C)Support: NEI Grants R01EY016323, R01EY007366,R01EY018589, P30EY022589were performed using the following settings: a customized 9-pointpattern, 200 ms stimulus duration, Goldmann III size, 4-2-1 dBstaircase strategy, 10 dB initial brightness, and red cross as thefixation target. The 9 points consisted of a 3x3 upright square latticecentered at the fovea, having a 1.5° angle between the center andevery corner point (Figure). The point sensitivities were recorded.Results: Sensitivities and variances are recorded in the Table.Friedman Test showed no significant differences in the meansensitivities across the 3 sessions in both groups (p>0.7 for both). Theoverall inter-session variances in normal (1.03 ± 0.07) and diseased(2.43 ± 0.51) groups were significantly different (p=0.05, Mann-Whitney Test). The variances of 9 points were significantly differentin both groups (p
<strong>ARVO</strong> 2013 Annual Meeting Abstracts by Scientific Section/Group – <strong>Visual</strong> <strong>Psychophysics</strong> / <strong>Physiological</strong> <strong>Optics</strong>Support: Retinal Imaging Research and Reading Center FundProgram Number: 3433 Poster Board Number: C0154Presentation Time: 11:00 AM - 12:45 PMAssessing retinal detailed structure in pathological myopia withadaptive optics scanning laser ophthalmoscopena liao, Chaohong Li, Yiyu Li, Hao Chen, Qinmei Wang. wenzhoumedical college, WenZhou, China.Purpose: To examine the retinal detailed structure in pathologicalmyopia with adaptive optics scanning laser ophthalmoscope(AOSLO).Methods: The 20 eyes (10 emmetropias and 10 pathologicalmyopias) of 20 subjects, whose ages ranged from 18 to 30, wereenrolled. An AOSLO was used to obtain high resolution images ofthe macular photoreceptor mosaic, the surface-level pores of thelamina cribrosa and parafoveal capillary network of all participants.Results: AOSLO can compensate living human eye’s opticalaberrations and get the retinal detailed histological image. Comparedwith the emmetropic eyes, the pathological myopia subjects showedan average lower cone packing densities in macular, greater laminacribrosa pore areas, bigger foveal avascular zone (FAZ) and lowerleukocyte speed.Conclusions: AOSLO as a non-invasive technique is able tovisualize detail images in vivo retina which can assist in detectingpathologic features and illuminating the reasons of the increasedglaucoma susceptibility in highly myopic eyes. This novel techniqueprovides opportunities to enhance the understanding of retinalpathogenesis.Commercial Relationships: na liao, None; Chaohong Li, None;Yiyu Li, None; Hao Chen, None; Qinmei Wang, NoneProgram Number: 3434 Poster Board Number: C0155Presentation Time: 11:00 AM - 12:45 PMVariation of cone density assessed by Adaptive <strong>Optics</strong> RetinalCamera with axial lengthmeillat mathieu, Perle TUMAHAI, Mélanie Bidaut-Garnier,Guillaume Debellemaniere, Mathieu Flores, Michel Montard,Bernard Y. Delbosc, Maher Saleh. ophthalmology, besancon hospitaljean minjoz, Besancon, France.Purpose: To assess macular cone densities changes with axial length(AL) and spherical equivalent (SE) using Adaptive <strong>Optics</strong> (AO).Methods: Fifty-two eyes of 28 healthy adults under 50 years, with avisual acuity of 20/20, were imaged. Group 1 included myopic andgroup 2 non myopic eyes. All patients underwent a completeophthalmologic examination, spectral-domain optical coherencetomography (SD OCT), and imaging with the RTX-1 Adaptive<strong>Optics</strong> (AO) device from Imagine eyes (Orsay, France). Mean conedensity (cells/mm2) at a fixed distance from the fovea (1° nasally andtemporally), spacing between cells (µ) and percentage of hexagonalcells calculated on Voronoi diagrams, were obtained by two maskedgraders using AODetect v. 0.1, the proprietary software of the device.Axial length was measured by using IOL Master® (Carl Zeiss.Meditec. USA).Results: In group 1 (n=22), AL was 25.17+-1.15 mm and SE -5+-2.73 D. In group 2 (n=30), AL was 23.09+-0.87mm (p
<strong>ARVO</strong> 2013 Annual Meeting Abstracts by Scientific Section/Group – <strong>Visual</strong> <strong>Psychophysics</strong> / <strong>Physiological</strong> <strong>Optics</strong>Commercial Relationships: Grace K. Han, Canon Inc. (F), OptosPLC (F); Jan Kristine T. Bayabo, None; Brandon J. Lujan,Genentech (C), Genentech (R), Genentech (F), Carl Zeiss Meditec,Inc (C), Avalanche Biotech (C), Regeneron (R), UC Berkeley (P);Jessica I. Morgan, Canon (F), Optos (F)Support: Earl and Brenda Shapiro Leber's Congenital AmaurosisResearch Initiative, Foundation Fighting Blindness, NIH K12EY017269, NIH EY019861, F.M. Kirby Foundation, Research toPrevent Blindness, Mackall Trust, Canon Inc.Berkeley (P); Shiri Zayit-Soudry, None; Reema Syed, None;Travis Porco, NIH NEI (F); Jan Kristine T. Bayabo, None; JosephCarroll, Imagine Eyes, Inc. (S); Austin Roorda, US Patent#6890076 (P), US Patent #7118216 (P), UC Berkeley (P); Jacque L.Duncan, NoneSupport: Foundation Fighting Blindness, Research to PreventBlindess, That Man May See, NEI Core Grant EY002162, NIH K12EY017269Clinical Trial: NCT00254605Program Number: 3436 Poster Board Number: C0157Presentation Time: 11:00 AM - 12:45 PMCorrelation of outer nuclear layer thickness with cone densityvalues in patients with retinitis pigmentosa and healthy subjectsMoreno Menghini 1 , Brandon J. Lujan 2 , Shiri Zayit-Soudry 1 , ReemaSyed 1 , Travis Porco 1 , Jan Kristine T. Bayabo 2 , Joseph Carroll 3 ,Austin Roorda 2 , Jacque L. Duncan 1 . 1 Ophthalmology, University ofCalifornia San Francisco, San Francisco, CA; 2 School of Optometry,University of California Berkeley, Berkeley, CA; 3 Ophthalmology,Medical College of Wisconsin, Milwaukee, MI.Purpose: Outer nuclear layer thickness (ONL) has been widely usedas a marker for photoreceptor numbers. However, some studies havenot shown a consistent correlation between ONL thickness and conedensity. Variability in ONL thickness measurements may beattributed to the inclusion of Henle’s fiber layer (HFL) when usingstandard optical coherence tomography (OCT) imaging techniques.The aim of our study is to compare ONL thickness using directionalOCT (D-OCT) with cone density values at identical retinal locationsin normals and retinitis pigmentosa (RP) patients.Methods: Cross-sectional analysis of images acquired with D-OCTand adaptive optics scanning laser ophthalmoscopy (AOSLO) fromnormals and RP patients. The D-OCT data sets were obtained using apreviously described method of varying the pupil entry position ofthe beam to reveal the HFL. Five retinal layers (ILM, OPL/HFLjunction, HFL/ONL junction, ELM and outer RPE border) weresegmented using Image J and MatLab® software. Multiple locationsalong the central horizontal meridian were selected on the AOSLOimages and compared with ONL thicknesses at identicaleccentricities. Cone density was analyzed in areas where conemosaics could unambiguously be identified and expressed ascones/degree2.Results: Mean age in our population was 40.5 in patients and 42.0years in normals. Average central retinal thickness was 240±25.0umand 234±12.8um, with an average ONL thickness at 1° eccentricity of47.2±8.8um and 46.0±3.7um in patients and in normals. Mean ONLthickness at 2° eccentricity was also comparable with 33.7±6.7um inRP patients and 33.7±7.1um in normals. Average cone densitiesmeasured at 1° eccentricity were 3718±1287 and 4313±541 forpatients and normals, respectively. At more eccentric locations (2°eccentricity) the values were 2646±531 and 2646±245. Combiningthe normal and patient images, ONL thickness was significantlycorrelated with cone density (Pearson’s correlation coefficient 0.74,95% CI 0.67, 0.82). The correlation between ONL+HFL values andcone density on the other hand was weaker (coefficient 0.59, 95% CI0.46, 0.78).Conclusions: ONL thickness measures correlated with cone densitymeasures in normals and RP patients, as measured using D-OCT.ONL thickness could be an easily obtainable indirect parameter torepresent cone density values both in diseased and healthyindividuals.Commercial Relationships: Moreno Menghini, None; Brandon J.Lujan, Genentech (C), Genentech (R), Genentech (F), Carl ZeissMeditec, Inc (C), Avalanche Biotech (C), Regeneron (R), UCProgram Number: 3437 Poster Board Number: C0158Presentation Time: 11:00 AM - 12:45 PMRepeatability of Cone Density Measurements in Healthy SubjectsUsing Commercially Available Flood-Illuminated Adaptive<strong>Optics</strong>Shu Feng, Anupam K. Garg, Ambar Faridi, Jonathan D. Fay, HopeE. Titus, Travis B. Smith, Keith V. Michaels, Mark E. Pennesi. CaseyEye Institute, Oregon Health & Sciences University, Portland, OR.Purpose: To evaluate a commercially available flood-illuminatedadaptive optics camera for its repeatability in measuring the conemosaic and to determine average cone density among healthysubjectsMethods: We used the RTX1 flood-illuminated adaptive opticscamera (Imagine Eyes: Orsay, France) to image the cone mosaic in54 healthy subjects, ages 14 to 69 years. For each subject, a series of25 4°x4° retinal images were obtained. Using MosaicJ, these imageswere combined to create a retinal montage spanning a 12°x12° fieldof the central macula. Retinal montages were analyzed for regionaldifferences in cone density. Images were post processed in ImageJand cone counting was performed with a MATLAB algorithm. Todetermine repeatability of the device and montaging process, a subsetof 7 subjects ranging in age from 19 to 36 years were imaged on 3separate occasions. To assess the validity of automated cone countingfor each montage, automated cone counts were compared to manualcounts in sample retinal areas 2° and 4° temporal to the foveal center.Results: Image quality was excellent in most young subjects, butincreasingly variable in older subjects. Cones within 1.5° of thefoveal center could not be resolved with this camera. Angular densityof cones averaged 1587 ± 91 cones/degree 2 at 1.6° - 4.3° eccentricityand 1428 ± 64 cones/degree 2 between 4.3° and 5.4° eccentricity.When adjusted for axial length, cone density averaged 18,688 ± 2081cones/mm 2 between 1.6° and 4.3° and 16,763 ± 1669 cones/mm 2between 4.3° and 5.4°. Angular cone density between 1.6° and 4.3°decreased with age, but between 4.3° and 5.4° increased. Repeatedmeasurements of cone density in the same subject from separateimaging sessions resulted in an intraclass correlation coefficient of0.98 (p < 0.001, 95% CI: 0.93-1.00) between 1.6° and 4.3° and 0.95(p < 0.001, 95% CI: 0.83-0.99) between 4.3° and 5.4°. However,validity of the automated cone counting algorithm depended onimage quality, with poor quality images producing higher variability.Conclusions: Flood-illuminated adaptive optics providesmeasurements of cone density that are consistent with anatomicalstudies. Repeated measurements in a subset of younger subjectsresulted in very strong intraclass correction coefficients, whichindicate the system produced consistent measurements. However,challenges remain with older subjects.Commercial Relationships: Shu Feng, None; Anupam K. Garg,None; Ambar Faridi, None; Jonathan D. Fay, None; Hope E.Titus, None; Travis B. Smith, Pfizer, Inc. (F); Keith V. Michaels,Pfizer, Inc. (F); Mark E. Pennesi, Pfizer (F)Support: Research to Prevent Blindness (Unrestricted, CEI),Foundation Fighting Blindness (Pennesi CDA, CD-CL-0808-0469-©2013, Copyright by the Association for Research in Vision and Ophthalmology, Inc., all rights reserved. Go to iovs.org to access the version of record. For permissionto reproduce any abstract, contact the <strong>ARVO</strong> Office at arvo@arvo.org.
<strong>ARVO</strong> 2013 Annual Meeting Abstracts by Scientific Section/Group – <strong>Visual</strong> <strong>Psychophysics</strong> / <strong>Physiological</strong> <strong>Optics</strong>OHSU), Foundation Fighting Blindness (Weleber, C-CL-0711-0534-OHSU01)Program Number: 3438 Poster Board Number: C0159Presentation Time: 11:00 AM - 12:45 PMHigh resolution imaging of photoreceptors in healthy humans ofdifferent ages eyes using RTX-1 Adaptive <strong>Optics</strong> RetinalcameraPerle TUMAHAI, meillat mathieu, Melanie Bidaut-garnier,Guillaume Debellemaniere, Mathieu Flores, Michel Montard,Bernard Y. Delbosc, Maher Saleh. Ophthalmology, UniversityHospital of Besançon, Besançon, France.Purpose: To determine age-related macular photoreceptor densitychanges in healthy patients of various ages.Methods: Observational case series. Healthy subjects with no retinalpathology or systemic affection were included. High myopic patientswere excluded. All patients underwent a full ophthalmologicexamination, SD-OCT imaging, and imaging with the RTX-1 Adaptive <strong>Optics</strong> (AO) retinal camera from Imagine eyes® (Orsay,France).Mean cone density (cells/mm2) at a fixed distance from the fovea (1°nasally and temporally), spacing between cells (µm) and % ofhexagonal cells calculated on Voronoi diagrams, were obtained usingAODetect v. 0.1, the proprietary software of the device.Results: 58 normal eyes of 35 patients were studied. Mean age was34.45±2.5 y (min-max: 10-78y). The mean cone density reached24039±2914.5 cells/mm2. It decreased with age (R2=0.21, p
<strong>ARVO</strong> 2013 Annual Meeting Abstracts by Scientific Section/Group – <strong>Visual</strong> <strong>Psychophysics</strong> / <strong>Physiological</strong> <strong>Optics</strong>test, p
<strong>ARVO</strong> 2013 Annual Meeting Abstracts by Scientific Section/Group – <strong>Visual</strong> <strong>Psychophysics</strong> / <strong>Physiological</strong> <strong>Optics</strong>600μm and 1200μm. In two very late stage patients with sunset-glowfundus at more than 2 years after the onset, analysis of AO showed anirregularity in cone density at both 600μm and 1200μm eccentricities,even though patients’ visual acuity were better than 20/20.Conclusions: We have found that the photoreceptor damage remainlonger even after serous retinal detachment was resolved with OCT inthe convalescent and chronic stage VKH patients. Combinedexaminations using AO and SD-OCT may be useful in betterunderstanding and managing the ophthalmic consequences of VHKdisease.Commercial Relationships: Kiyoko Gocho, None; SachikoKikuchi, None; Takenori Kabuto, None; Hisatomo Takahashi,None; Shuhei Kameya, None; Kunihiko Yamaki, None; HiroshiTakahashi, NoneProgram Number: 3443 Poster Board Number: C0164Presentation Time: 11:00 AM - 12:45 PMSpectral-Domain Optical Coherence Tomographic Findings inAcute Zonal Occult Outer Retinopathy (AZOOR)-complex atInitial Visit to the HospitalYoshitsugu Matsui 1 , Mai Miyata 1 , Hisashi Matsubara 1 , Shinji Ueno 2 ,Shu Kachi 2 , Yasuki Ito 2 , Hiroko Terasaki 2 , Mineo Kondo 1 .1 Opthalmology, Mie University Graduate School of Medicine, Tsu,Japan; 2 Opthalmology, Nagoya University Graduate School ofMedicine, Nagoya, Japan.Purpose: To study outer retinal structural changes in acute zonaloccult outer retinopathy (AZOOR)-complex by using spectraldomainoptical coherence tomography (SD-OCT) at the initial visit tothe hospital.Methods: Twenty-two eyes of 22 patients (four male and 18 female;age, 19-69) with AZOOR-complex, whose periods from symptomonset to initial visit to the hospital were within six months, wereincluded in this study. The continuity of the external limitingmembrane (ELM), photoreceptor inner/outer segment (IS/OS)junction, and cone outer segment tip (COST) were evaluated usingSD-OCT at their initial visit to the hospital. These three lines weredivided into three categories of “continuous”, “discontinuous” and“absent”.Results: At the retinal area of visual field defects, the ELM wascontinuous in eight eyes, discontinuous in five eyes, and absent innine eyes. The IS/OS junction was continuous in one eye,discontinuous in nine eyes, and absent in 12 eyes. The COST linewas absent in all 22 eyes. In thee of 22 eyes, well-demarcated hyperrefractivematerials were present between the retinal pigmentepithelium (RPE) and ERM, and these materials graduallydisappeared within three months after the initial visit.Conclusions: The SD-OCT findings in AZOOR-complex at theinitial visit were variable. The structure of ELM was most likely to bepreserved, and COST line most severely affected. Our findingssupported the idea that outer retinal structure was more vulnerable atthe early stages of AZOOR-complex.Commercial Relationships: Yoshitsugu Matsui, None; MaiMiyata, None; Hisashi Matsubara, None; Shinji Ueno, None; ShuKachi, None; Yasuki Ito, None; Hiroko Terasaki, None; MineoKondo, NoneSongEun Lee 1 , Sung Pyo Park 1, 2 , Eun Jin Bae 2 , Stephen H. Tsang 1 ,Stanley Chang 1 . 1 Ophthalmology, Harkness Eye Institute, ColumbiaUniversity, New York, NY; 2 Ophthalmology, Kangdong SacredHeart Hospital, Hallym University Medical Center, Seoul, Republicof Korea.Purpose: To evaluate structural damage of photoreceptors in apatient with chloroquine/hydroxychloroquine maculopathy and therole of adaptive optics scanning laser ophthalmoscopy in screening ofchloroquine/hydroxychloroquine maculopathyMethods: A 53-year-old Asian woman who had been treated withhydroxychloroquine and chloroquine for lupus erythematosus,developed bull's eye retinopathy. Humphrey visual field, fundusautofluorescence, and adaptive optics scanning laser ophthalmoscopywere performed. The area with disrupted cone in AO-SLO imageswere matched with visual field test results.Results: Adaptive optics scanning laser ophthalmoscopy (AO-SLO)showed patch cone mosaic lesions, where cones were missing or lost.Additionally, cones that were present were asymmetrical in size andshape and varied in brightness. Disrupted cone AO-SLO images werematched with visual field test results, and functional deficits weregiven a precise location on the montage. This allowed functionalchanges (on HVF) to be correlated with histological findings.Conclusions: In the present study, bull’s eye maculopathy developedas a result of chronic use of antimalarial agents. The patient wasstudied with various imaging techniques, including AO-SLO. Wedemonstrated not only the disrupted microarchitecture of thephotoreceptors but also a correlation between functional andstructural defects associated with chloroquine retinopathy. Theadaptive optics scanning laser ophthalmoscopy will provide betterunderstanding of retinal damages in antimalarial agent-associatedretinopathy.Program Number: 3444 Poster Board Number: C0165Presentation Time: 11:00 AM - 12:45 PMEvidence of Retinal Damage in Chloroquine/HydroxychloroquineMaculopathy as Revealed by High Resolution Imaging: A CaseReport Utilizing Adaptive <strong>Optics</strong> Scanning LaserOphthalmoscopy©2013, Copyright by the Association for Research in Vision and Ophthalmology, Inc., all rights reserved. Go to iovs.org to access the version of record. For permissionto reproduce any abstract, contact the <strong>ARVO</strong> Office at arvo@arvo.org.
<strong>ARVO</strong> 2013 Annual Meeting Abstracts by Scientific Section/Group – <strong>Visual</strong> <strong>Psychophysics</strong> / <strong>Physiological</strong> <strong>Optics</strong>Commercial Relationships: SongEun Lee, None; Sung Pyo Park,None; Eun Jin Bae, None; Stephen H. Tsang, None; StanleyChang, Alcon Laboratories (C), Alimera Sciences (C)Program Number: 3445 Poster Board Number: C0166Presentation Time: 11:00 AM - 12:45 PMAdaptive <strong>Optics</strong> Scanning Laser Ophthalmoscopy and HighResolution Imaging in Autosomal Dominant Retinitis PigmentosaCaused by a Novel PRPF31 Nonsense MutationJessica I. Morgan 1, 2 , Meera Sivalingam 1 , Grace K. Han 1 , Albert M.Maguire 1, 2 , Brian J. Forbes 1, 2 , Xiaowu Gai 3 , Eric A. Pierce 4 , JeanBennett 1, 2 , Daniel C. Chung 1, 2 . 1 Ophthalmology, University ofPennsylvania, Philadelphia, PA; 2 Ophthalmology, Children's Hospitalof Philadelphia, Philadelphia, PA; 3 Molecular Pharmacology andTherapeutics, Loyola University Chicago, Chicago, IL; 4 OcularGenomics Institute, Department of Ophthalmology, MassachusettsEye and Ear Infirmary, Harvard Medical School, Boston, MA.Purpose: To study cone photoreceptor density and retinalultrastructure in autosomal dominant retinitis pigmentosa (adRP)using adaptive optics scanning laser ophthalmoscopy (AOSLO) andspectral domain optical coherence tomography (OCT) and tocompare the results with clinical findings and geneticcharacterization.Methods: Exome sequencing was carried out in individuals negativefor previously known mutations causing adRP. The DNA variantswere confirmed in CLIA labs. Patients underwent ophthalmicexamination, visual acuity (VA), Humphrey and Goldman visualfield testing. Retinal images at several locations within 1.5mm offixation were obtained using an AOSLO developed by Canon, Inc.Infrared and color fundus photos, OCT and autofluorescence (AF)images were also obtained.Results: For all patients, peripheral pigmentary clumping and bonespicule retinopathy were observed on ophthalmic examination. Oneindividual was followed in the clinic for over 35 years. His VA wentfrom 20/200 at age 36 to 20/500 OD and hand motion OS at age 73.VA was reduced: 20/60, 20/40, 20/25 for patients aged 44, 16 and 11respectively in the second family. Goldman visual fields showedrestricted peripheral fields with remaining central vision. Humphreyvisual field showed no reduction of visual threshold in the centralretina for the 16 and 11 y.o., but reduced sensitivity in the 44 y.o.OCT for the 11 y.o. revealed central intact photoreceptors withperipheral thinning. The 16 y.o. had macular edema OU. AF revealeda hyper-AF ring within the macula region. As well, the 44 y.o.exhibited clumps of hypo-AF in the periphery corresponding toregions of degenerated retinal pigment epithelium. AOSLO imagingof the central macula revealed intact cone photoreceptor mosaics, andcone density fell within normal limits. Results of genetic testing (inboth families) revealed a PRPF31 c.1060 C>T mutation(p.Arg354Stop) which segregated with the phenotype and wasconsistent with the diagnosis of adRP.Conclusions: Here we report a novel PRPF31 mutation causingadRP in two apparently unrelated families. AOSLO imaging allowsvisualization of the cone mosaic within the remaining central retina inpatients with adRP. AOSLO in combination with other imagingmodalities will be useful for studying the mechanisms of diseaseprogression for degenerations including adRP.Commercial Relationships: Jessica I. Morgan, Canon (F), Optos(F); Meera Sivalingam, Canon Inc (F); Grace K. Han, Canon Inc.(F), Optos PLC (F); Albert M. Maguire, None; Brian J. Forbes,None; Xiaowu Gai, None; Eric A. Pierce, None; Jean Bennett,Gensight Biologics (S); Daniel C. Chung, NoneSupport: Earl and Brenda Shapiro Leber's Congenital AmaurosisResearch Initiative, Foundation Fighting Blindness, Penn GenomeFrontiers Institute, National Institute of Health EY019861,NIHEY012910, F.M. Kirby Foundation, Mackall Trust, Reserach toPrevent Blindness, Canon, Inc. Kathleen Marshall and SarahMcCague.Program Number: 3446 Poster Board Number: C0167Presentation Time: 11:00 AM - 12:45 PMCone Abnormalities in Fundus Albipunctatus Associated withRDH5 Mutation Using Adaptive <strong>Optics</strong> Scanning LaserOphthalmoscopySotaro Ooto, Yukiko Makiyama, Masanori Hangai, Ken Ogino,Norimoto Gotoh, Akio Oishi, Nagahisa Yoshimura. Ophthalmology& <strong>Visual</strong> Sciences, Kyoto University Graduate School of Medicine,Kyoto, Japan.Purpose: To asses macular photoreceptor abnormalities in eyes withfundus albipunctatus associated with RDH5 mutation using adaptiveoptics scanning laser ophthalmoscopy (AO-SLO).Methods: Ten eyes of 5 patients with fundus ablipunctatusassociated with RDH5 mutation (4 men and 1 woman from 4families; mean age, 29.6 y; range, 15-64y) and 11 eyes of 11volunteers underwent a full ophthalmologic examination, colorfundus photography, microperimetry, spectral-domain opticalcoherence tomography (SD-OCT), and imaging with a prototype AO-SLO system. Cone density and spatial organization of the conemosaic were assessed using AO-SLO images.Results: Four patients from 3 families had the same mutation inRDH5, (c.928delC/ insGAAG). One patient had another mutation inRDH5 (c.718delG), which was the novel mutation of RDH5 gene.AO-SLO revealed the presence of small patchy dark areasrepresenting cone loss in the macula of all eyes with fundusalbipunctatus, which was true even in eyes for which SD-OCT didnot reveal any visible defects in the photoreceptor layer. AO-SLOand SD-OCT showed microhole-like photoreceptor defect in thefovea in 1 eye. In eyes with fundus albipunctatus, cone density wassignificantly lower in each area at 0.5 mm and 1.0 mm from thecenter of the fovea compared to normal eyes (P = 0.014 for both). At0.5 mm and 1.0 mm from the center of the fovea, a decreased numberof cones had 6 neighbors in eyes with fundus albipunctatus (P =0.022 and 0.002). The ratio of observed mean nearest neighbordistance (NND) for each subject divided by expected NND(computed assuming a perfectly hexagonal lattice of cones with adensity equal to that observed for a given subject) was significantlylower for eyes with fundus albipunctatus than for normal eyes at 0.5©2013, Copyright by the Association for Research in Vision and Ophthalmology, Inc., all rights reserved. Go to iovs.org to access the version of record. For permissionto reproduce any abstract, contact the <strong>ARVO</strong> Office at arvo@arvo.org.
<strong>ARVO</strong> 2013 Annual Meeting Abstracts by Scientific Section/Group – <strong>Visual</strong> <strong>Psychophysics</strong> / <strong>Physiological</strong> <strong>Optics</strong>mm and 1.0 mm from the center of the fovea (P=0.007 and 0.001).Mean retinal sensitivity was significantly lower in the area with whitedots, compared with area without them (11.2 ± 2.6 dB and 13.9 ± 3.1dB, P
<strong>ARVO</strong> 2013 Annual Meeting Abstracts by Scientific Section/Group – <strong>Visual</strong> <strong>Psychophysics</strong> / <strong>Physiological</strong> <strong>Optics</strong>Commercial Relationships: Sung Pyo Park, None; In HwanHong, None; Winston Lee, None; Marcela Marsiglia, None;Takeshi Kitamura, Canon U.S.A., Inc. (E); Stephen H. Tsang,None; Stanley Chang, Alcon Laboratories (C), Alimera Sciences (C)Program Number: 3449 Poster Board Number: C0170Presentation Time: 11:00 AM - 12:45 PMDisruption of the Human Cone Photoreceptor Mosaic from aDefect in NR2E3 Transcription Factor FunctionFrank S. Siringo 1 , Sung Pyo Park 1, 2 , In Hwan Hong 2 , Stephen H.Tsang 1, 3 , Winston Lee 1 , Jason Horowitz 1 , Rando Allikmets 1 , StanleyChang 1 , Suzanne Yzer 4, 1 . 1 Ophthalmology, Columbia UniversityMedical Center, Fort Lee, NJ; 2 Ophthalmology, Kangdong SacredHeart Hospital, Hallym University Medical Center, Seoul, Republicof Korea; 3 Pathology & Cell Biology, Columbia University MedicalCenter, New York, NY; 4 Ophthalmology, Rotterdam Eye Hospital,Rotterdam, Netherlands.Purpose: Enhanced S-cone syndrome is an orphan disease caused bymutations in the NR2E3 gene, which results in an increased numberof S-cones overpopulating the retina. Although the characteristiconset of enhanced S-cone syndrome can be well documented bycurrent ophthalmic imaging modalities, techniques such as spectraldomain optical coherence tomography (SD-OCT) and scanning laserophthalmoscopy (SLO) fail to provide sufficient details regarding themicrostructure of photoreceptors in retinal diseases. Adaptive optics(AO) provides a unique opportunity to analyze the effects of geneticmutations on photoreceptors by compensating for aberrations in thehuman eye.Methods: 3 eyes of 3 patients with enhanced S-cone syndrome werestudied by clinical examination, genetic screening, fundusautofluorescence (FAF) imaging, SD-OCT, and electroretinography(ERG). Cone mosaic imaging was accomplished by an AO-SLOequipped with a dual crystal on silicon spatial light modulator.Qualitative image analyses and genetic findings were investigated ineach patient.Results: The diagnosis was confirmed by ERG and genetic analysis.Two disease-causing mutations in the NR2E3 gene were identified on2 study patients, as well as a novel mutation (202 A>G, S68G) in thethird. Fundus photograph, FAF and SD-OCT found a rosette-likelesion within the mid-periphery along the vascular arcades of theretina. In all AO-SLO images, sparse distribution and asymmetricsize of cone mosaic pattern were found within central retina. Therewere regions of dark space between groups of photoreceptors,distinguishable from shadowing and artifacts.Conclusions: AO-SLO provided an in-depth window into the retinaof enhanced S-cone syndrome patients beyond the ability of othercurrent imaging modalities. Dark lesions within the central retinacontain structurally dysfunctional cones, which account for retinalmosaic disorganization and may predispose affected areas to otherabnormalities such as rosettes. AO-SLO can be an efficientdiagnostic tool in clinics for examining cellular-level pathologies invarious retinal dystrophies.Commercial Relationships: Frank S. Siringo, None; Sung PyoPark, None; In Hwan Hong, None; Stephen H. Tsang, None;Winston Lee, None; Jason Horowitz, None; Rando Allikmets,None; Stanley Chang, Alcon Laboratories (C), Alimera Sciences(C); Suzanne Yzer, NoneProgram Number: 3450 Poster Board Number: C0171Presentation Time: 11:00 AM - 12:45 PMCellular Imaging after Remission from Diabetic Macular EdemaChing-Lung Chen 1, 2 , Sung Pyo Park 1, 3 , Takeshi Kitamura 4 , StanleyChang 1 . 1 OPhthalmology, Columbia university medical center, Newyork, NY; 2 Department of Ophthalmology, Chang Gung MemorialHospital, Chiayi, Taiwan; 3 Department of Ophthalmology, HallymUniversity Medical Center, Seoul, Republic of Korea; 4 HealthcareSolutions Division, Canon, New york, NY.Purpose: To evaluate structural differences in the patient recoveredfrom diabetic macular edema by using multimodal non-invasiveimaging methods, including adaptive optics scanning laserophthalmoscopy (AO-SLO).Methods: An eighty-one year old Indian male suffered from diabeticretinopathy with macular edema. Following resolution of the macularedema in one eye, the visual acuity did not recover fully. The patientunderwent a complete ophthalmic examination that included funduscolor photography, IR imaging, OCT. High-resolution image of conestructure and measurement of the number and shape of cones wasinvestigated by AO-SLO. After 14 months, the patient received thesame examination. For the accurate analysis of condition of conecells, we focused on the same portions of macula by manualestimation.Results: OCT revealed no macular edema with a central thickness of231um in his right eye and central thickness of 289 um with inferior0.5mm local edema of 352um in his left eye. 14 months later, OCTshowed no specific difference on the right eye with central thicknessof 229 um, but the central and inferior 0.5mm thickness had declinedto 275 um and 339 um. Central vision metamorphopsia had almost©2013, Copyright by the Association for Research in Vision and Ophthalmology, Inc., all rights reserved. Go to iovs.org to access the version of record. For permissionto reproduce any abstract, contact the <strong>ARVO</strong> Office at arvo@arvo.org.
<strong>ARVO</strong> 2013 Annual Meeting Abstracts by Scientific Section/Group – <strong>Visual</strong> <strong>Psychophysics</strong> / <strong>Physiological</strong> <strong>Optics</strong>subsided and the visual acuity had improved. At the 14-month followup visit, the density of cone photoreceptors, as measured by AO-SLOexamination, had only decreased slightly, but the cellular hexagonrate declined remarkably in both eyes on average. Compared to theinitial inferior local edema of 0.5 mm in the left eye, the cellularhexagon rate decreased from 36.4% to 22.8% at the 14-month followupexam.Conclusions: The analyses by AO-SLO imaging revealed only aslightly lower density of cone cells, but the cellular hexagon ratedecreased in both eyes as compared to the examination 14 monthsprior. The cellular hexagon rate of previous edema area of left eyeshowed marked decline. The macular edema from long-term diabeticmacular edema had subsided, based on the OCT image which showedflatter retina. The visual acuity had also improved, but the detaildensity and morphology still remained and even worsened. Longtermedema, diabetic retinopathy, or aging might be the risk factors.However, AO-SLO is more sensitive to the level of a single cone cell,and the ability to visualize the cone cells in vivo should be used in alarger diabetic retinopathy survey and may also be useful for studyingother retinal diseases as well.Commercial Relationships: Ching-Lung Chen, None; Sung PyoPark, None; Takeshi Kitamura, Canon U.S.A., Inc. (E); StanleyChang, Alcon Laboratories (C), Alimera Sciences (C)Support: None in the Support fieldProgram Number: 3451 Poster Board Number: C0172Presentation Time: 11:00 AM - 12:45 PMPhotoreceptor Structure in Presumed Non-NeoplasticAutoimmune RetinopathyDavid B. Kay 1 , Robert F. Cooper 2 , Drew H. Scoles 3 , Fouad R.Zakka 1 , Vesper Williams 1 , Alfredo Dubra 1, 4 , Joseph Carroll 1, 4 ,Kimberly E. Stepien 1 . 1 Department of Ophthalmology, MedicalCollege of Wisconsin, Milwaukee, WI; 2 Department of BiomedicalEngineering, Marquette University, Milwaukee, WI; 3 Department ofBiomedical Engineering, University of Rochester, Rochester, NY;4 Department of Biophysics, Medical College of Wisconsin,Milwaukee, WI.Purpose: Autoimmune retinopathies (AIR) are rare diseases,sometimes associated with systemic neoplasms, in which anti-retinalantibodies lead to cone and rod dysfunction. Patients present withprogressive, bilateral, painless vision loss despite normal clinicalfundus appearance, making diagnosis difficult. SD-OCT has shownouter retinal abnormalities and decreased macular thickness in AIRpatients. Adaptive optics scanning light ophthalmoscopy (AOSLO)enables high-resolution imaging of the photoreceptor mosaic. Thisstudy incorporates AOSLO into the comprehensive investigation ofindividuals with AIR to evaluate its utility in improving thecharacterization and management of AIR.Methods: Three individuals with presumed non-neoplastic AIR whopresented with vision loss, normal fundus appearance and knownanti-retinal antibodies underwent a comprehensive ophthalmicevaluation and multiple retinal imaging sessions over a 5 - 14 monthinterval. Retinal appearance and lamination were assessed usingfundus photography and SD-OCT. The photoreceptor mosaic wasassessed using AOSLO.Results: All three individuals had different anti-retinal antibodycombinations in serum, and presenting vision ranged from 20/40 to20/100. Clinical and fundus photography evaluation confirmednormal appearing fundus. SD-OCT revealed decreased centralmacular thickness in two of the three patients, and focal disruption ofouter retinal lamination was seen at the fovea in all patients. Thisdisruption was also visible in the AOSLO images as a largehyporeflective area at the fovea. In addition, AOSLO imagesrevealed significant reduction in parafoveal cone density in all threesubjects, with variable numbers of non-waveguiding conesinterspersed throughout the mosaic. This disruption was notvisualized on SD-OCT.Conclusions: Both SD-OCT and AOSLO show outer retinalstructure changes associated with AIR not apparent on clinicalexamination. However, AOSLO allows for assessment ofphotoreceptor structure at a resolution not resolvable on SD-OCT.AOSLO may prove to be a useful, noninvasive, highly accurate toolto aid in diagnosis of AIR as well as monitoring progression andtreatment responses. Further study is needed to determine whetherAOSLO can be used to accurately track progression of photoreceptordisruption in AIR over time.Commercial Relationships: David B. Kay, None; Robert F.Cooper, None; Drew H. Scoles, None; Fouad R. Zakka,VitreoRetinal Surgery Foundation (F); Vesper Williams, None;Alfredo Dubra, US Patent No: 8,226,236 (P); Joseph Carroll,Imagine Eyes, Inc. (S); Kimberly E. Stepien, NoneSupport: VitreoRetinal Surgery Foundation, Research to PreventBlindness, NIH (UL1RR031973, EY017607, EY001931), AlconResearch Institute, Burroughs Wellcome FundProgram Number: 3452 Poster Board Number: C0173Presentation Time: 11:00 AM - 12:45 PMCone photoreceptors at the fovea after serous retinal detachmentobserved with adaptive optics fundus camera (rtx1)Atsushi Hayashi, Tomoko Nakamura, Naoki Tojo, Tomoko Ueda,Toshihiko Oiwake, Akio Miyakoshi, Hironori Ozaki. Ophthalmology,University of Toyama, Toyama, Japan.Purpose: Purpose: To examine recovery of cone photoreceptors inthe fovea after serous retinal detachment (SRD) in patients withcentral serous chorioretinopathy (CSC) and Vogt-Koyanagi-Haradadisease (VKH) with an adaptive optics (AO) fundus camera and toexamine correlations between cone analyses and visual acuity.Methods: Methods: Ten eyes of CSC and 4 eyes of VKH wereexamined. After the SRD at the fovea was resolved withphotodynamic therapy or steroid therapy, photographs of conephotoreceptors including the fovea were taken with an AO funduscamera (rtx1, Imagine eyes, France). The area of 200µm X 200µm atthe fovea was chosen in the photograph of each eye and analyzedwith the manufacturer’s software. Analyses of cone density, conespacing, and voronoi domains were obtained and correlationsbetween visual acuity and cone analyses were examined. OCT wasobtained at the same time and length of the IS/OS line in the OCTimage was measured in the area of 200µm at the fovea.Results: Results: Cone analyses showed that average cone density atthe fovea was 15363±4239, average cone spacing was 8.96±1.21μm,and average voronoi domains was 36.9±4.1%. Average visual acuity(logMAR) was 0.155±0.391. Average length of the IS/OS line in thearea of 200µm was 77.7±31.5%. <strong>Visual</strong> acuity and cone analysesshowed significant correlations. Cone density; rs= -0.698(Spearman’s rank Correlation Coefficient), cone spacing; rs=0.663,and voronoi domains; rs=-0.749. The length of IS/OS line and conedensity showed a significant correlation; rs=0.770.Conclusions: Conclusions: Analyses of cone photoreceptors at thefovea after SRD was resolved were significantly correlated withvisual acuity.Commercial Relationships: Atsushi Hayashi, None; TomokoNakamura, None; Naoki Tojo, None; Tomoko Ueda, None;Toshihiko Oiwake, None; Akio Miyakoshi, None; Hironori Ozaki,NoneProgram Number: 3453 Poster Board Number: C0174©2013, Copyright by the Association for Research in Vision and Ophthalmology, Inc., all rights reserved. Go to iovs.org to access the version of record. For permissionto reproduce any abstract, contact the <strong>ARVO</strong> Office at arvo@arvo.org.
<strong>ARVO</strong> 2013 Annual Meeting Abstracts by Scientific Section/Group – <strong>Visual</strong> <strong>Psychophysics</strong> / <strong>Physiological</strong> <strong>Optics</strong>Presentation Time: 11:00 AM - 12:45 PMEvaluation of cone density after retinal detachment surgery usingan Adaptive <strong>Optics</strong> cameraMaher Saleh, meillat mathieu, Mélanie Bidaut-Garnier, PerleTUMAHAI, Guillaume Debellemaniere, Mathieu Flores, MichelMontard, Bernard Y. Delbosc. Ophthalmology, University Hospitalof Besançon, Besançon, France.Purpose: To assess macular cone photoreceptors density in humaneyes operated for retinal detachment (RD) and in contralateralhealthy eyes.Methods: Patients operated for RD with macular involvement wereimaged using the RTX-1 Adaptive <strong>Optics</strong> (AO) device from Imagineeyes (Orsay, France), 6 weeks after the surgery. Cone density(cells/mm2) at a fixed distance from the fovea (1 °), spacing betweencells (µ) and percentage of hexagonal cells calculated on Voronoïdiagrams, were obtained using AO Detect v.0.1, the proprietarysoftware of the device. Group 1 represented the eyes with history ofRD and group 2 the contralateral eyes. <strong>Visual</strong> acuity (logMAR),refraction, axial length (mm) and the thickness of the differentchoroid and retinal layers (RPE, IS/OS, LME lines) imaged by SD-OCT (Spectralis®, Heidelberg), were also compared to the conedensities.Results: Thirty eyes from 15 patients were studied. <strong>Visual</strong> acuitiesdecreased in group 1 (0.34 vs 0.1 in group 2, paired t test, p
<strong>ARVO</strong> 2013 Annual Meeting Abstracts by Scientific Section/Group – <strong>Visual</strong> <strong>Psychophysics</strong> / <strong>Physiological</strong> <strong>Optics</strong>William S. Tuten 1 , Wolf M. Harmening 2 , Lawrence C. Sincich 3 ,Austin Roorda 2 . 1 Vision Science, University of California, Berkeley,Berkeley, CA; 2 School of Optometry, University of California,Berkeley, Berkeley, CA; 3 Vision Sciences, University of Alabama atBirmingham, Birmingham, AL.Purpose: To distinguish L-cones from M- and S-conespsychophysically in humans using an adaptive optics scanning laserophthalmoscope (AOSLO).Methods: We used a multi-wavelength AOSLO to measure visualsensitivity to cone-sized stimuli under L-cone isolating conditions intwo subjects with normal color vision. Increment thresholds weremeasured at 1.5° eccentricity, and stimulus delivery to targeted coneswas achieved using high-speed retinal eye tracking. An image-basedmeasure of transverse chromatic aberration (TCA) was obtained andused to ensure repeated stimulation of the cone of interest. The teststimulus (λ = 711 nm) was a square which subtended 27 seconds ofarc (= 2.2 microns) on the retina. The background was comprised ofdim infrared light from the imaging beam, light leaking through theacousto-optic modulator in the red stimulus channel, and an external488 nm LED source viewed through a beam splitter. The luminancesof the red and blue backgrounds were 2.5 and 50 cd/m2, respectively.Converting these luminances to cone contrasts, an L- versus M-conesensitivity ratio of 24-to-1 was expected. Stimulus intensity of the redbeam was controlled via 10-bit modulation and expressed as arbitraryunits (au) ranging from zero to 1. Thus, for L-cone thresholds greaterthan 0.042 au, M- and S-cone thresholds would be predicted to liebeyond the upper modulation limit of the stimulus beam (i.e., >1.0au).Results: Thresholds were measured for 88 cones in the two subjects.The stimulus was readily visible in one group of cones (n = 59;threshold = 0.55 ± 0.14SD au), and these were classified as candidateL-cones. A second group of cones (n = 18) had thresholds above 1.0au, with even the brightest stimulus being not visible. In these cones,threshold values were normal when tested under achromaticconditions, ruling out underlying dysfunction. In the remainingcones, classification was ambiguous (n = 11). Finally, there weremultiple sites in each subject where thresholds from neighboringcones yielded different spectral identities, supporting the notion thatthe spatial accuracy of our psychophysical apparatus is on the orderof a single cone.Conclusions: With combined retinal eye tracking, high-orderaberration correction, and TCA compensation, AOSLO can be usedto identify the spectral class of single cones in vivo with apsychophysical approach.Commercial Relationships: William S. Tuten, None; Wolf M.Harmening, None; Lawrence C. Sincich, None; Austin Roorda,US Patent #6890076 (P), US Patent #7118216 (P), UC Berkeley (P)Support: EY007043; Irvin M. Borish-Essilor Ezell Fellowship; DFGHa 5323/2-1; EY021642; EY019566; Eyesight Foundation ofAlabama; EY014375Program Number: 3706Presentation Time: 3:00 PM - 3:15 PMS-cone Electroretinograms in Old and New World PrimatesRecorded Using Two MethodsJames A. Kuchenbecker, Scott H. Greenwald, Maureen Neitz, JayNeitz. Ophthalmology, University of Washington, Seattle, WA.Purpose: Using the exchange of two lights that lie along a tritan linemakes it possible to isolate pure S-cone electroretinogram (ERG)signals. Here, we compare the pure S-cone ERG using silentsubstitution with a method in which “S-cone ERGs” are obtained toshort wavelength flashes in the presence of intense long wavelengthadaptation. Results were compared in an Old World (OW) primate(baboon) and a New World (NW) primate (squirrel monkey) toevaluate the possibility of differences in S-cone circuitry between thetwo primate groups that have been proposed to explain reportedneuroanatomical differences.Methods: An LED Ganzfeld system was used (Q450; RolandConsult, modified by replacing 450 with a 420 nm LED). A tritanpair of lights was alternated at 1 Hz with a 50% duty cycle. A tritanpair that completely isolated S-cone responses for each individualanimal was found by making small adjustments to the relativeintensities of the two lights while taking advantage of the strikingdifferences in the temporal characters of L/M vs. S-cone ERGsignals. For comparison, “S-cone ERGS” were recorded in responseto the 420 nm LED in the presence of steady adaption from an amberLED (~590 nm peak).Results: Compared to L/M, S-cone ERGs have very distinct temporalcharacteristics. The component waves also have strikingly differentrelative amplitudes including a much smaller a-wave and absent d-wave which can be explained by the absence of S-cone specific offbipolarcells in primates. In comparison to the pure S-cone ERGsobtained with silent substitution, long wavelength adaptation canreduce but does not eliminate L/M contamination.Conclusions: Using silent substitution we recorded pure S-coneERGs to investigate differences between S-cone and L/M conemediated signals very early in the visual pathway. The temporal peakof both the S-cone a- and b-wave is slower indicating thesluggishness of S-cone temporal responses observed in humanpsychophysics has its origins in the outer retina and, at least, partly inthe cones themselves. The robust off-bipolar cells signals in both thea- and d-waves elicited by L/M cone stimulation are absent in thepure S-cone ERG with no evidence for the species differencespredicted from the anatomy in which off-midget bipolars have beenproposed to contact S-cones in OW but not NW primates.Commercial Relationships: James A. Kuchenbecker, None; ScottH. Greenwald, None; Maureen Neitz, Genzyme (F), Alcon (F),Alcon (P); Jay Neitz, Alcon (F), Alcon (P)Program Number: 3707Presentation Time: 3:15 PM - 3:30 PMAge-related decline in chromatic-spatial sensitivityElise W. Dees 1, 2 , Stuart J. Gilson 1 , Rigmor C. Baraas 1 . 1 Optometry& <strong>Visual</strong> Science, Buskerud University College, Kongsberg,Norway; 2 Mathematical Sciences & Technology, NorwegianUniversity of Life Sciences, Ås, Norway.Purpose: The aim was to investigate the variation in chromaticcontrast sensitivity to low spatial frequencies for observers withvarying degrees of color discrimination at different age decades.Methods: Twenty six normal trichromatic subjects (17 females and 9males, aged 20-71 years), 2 female carriers of protan color visiondeficiencies (aged 20-39) and 6 female carriers of deutan color visiondeficiencies (aged 20-59) were included in the study. All observerswere healthy with no known ocular abnormalities. They were testedwith a battery of color vision tests and their statuses of either anormal trichromat or a carrier were confirmed with genetic analysisof the genes encoding L- and M-pigments. The observers werecorrected to best logMar visual acuity and viewed the stimulusmonocularly at a distance of either 114.6 cm (0.3-3.0 c/deg) or 229.2cm (4.0-6.0 c/deg). The stimulus was a Gabor patch with apseudoisochromatic design. The chromatic contrast was varied alongeither the L- or M-cone axis in the CIE 1931 chromaticity diagram.The observers were tested with 9-16 different spatial frequenciesfrom 0.3-3.0 c/deg in all observers, and up to 6.0 c/deg in some.Results: The sensitivity to chromatic spatial patterns declined withage. Subjects aged 50 years and older had significantly lower©2013, Copyright by the Association for Research in Vision and Ophthalmology, Inc., all rights reserved. Go to iovs.org to access the version of record. For permissionto reproduce any abstract, contact the <strong>ARVO</strong> Office at arvo@arvo.org.
<strong>ARVO</strong> 2013 Annual Meeting Abstracts by Scientific Section/Group – <strong>Visual</strong> <strong>Psychophysics</strong> / <strong>Physiological</strong> <strong>Optics</strong>sensitivity [area under curve (ANOVA: f = 13.27, d.f. = 1, p = 0.01)]and cut-off values (ANOVA: f = 6.33 , d.f. = 1, p = 0.038) than theyounger subjects. The protan carriers had similar sensitivity curves asthe age matched normal trichromatic subjects. The deutan carriers,however, had on average lower chromatic sensitivity than both thenormal trichromatic subjects and the protan carriers (for all agegroups). The cut-off spatial frequencies were lower for the deutancarriers than for the normal trichromatic subjects at all age groups.Conclusions: The results show a decline in sensitivity to chromaticspatial patterns with age, and that deutan carriers have lowersensitivity to chromatic spatial patterns compared with age-matchednormal trichromatic subjects.Commercial Relationships: Elise W. Dees, None; Stuart J. Gilson,None; Rigmor C. Baraas, NoneSupport: Research Council of Norway Grant 176541/V10 and182768/V10 (RCB)Program Number: 3708Presentation Time: 3:30 PM - 3:45 PMContrast Sensitivity (CS): Color CS is Decreased More thanLuminance CS at Low Light LevelsJeff C. Rabin 1 , Michael Castro 1 , Daniel Ewing 1 , Hayley George 1 ,Paul Lau 1 , Shannon Leon 1 , Andrew Yoder 1 , John Gooch 2 , SteveWright 2 . 1 Optometry, UIW Rosenberg School of Optometry, SanAntonio, TX; 2 Ophthalmology, USAF School Aerospace Medicine,Dayton, OH.Purpose: It is well-known that spatial & temporal vision decreasewith decreasing luminance but less is known about the impact ofluminance on color vision. Our purpose was to compare the effect ofluminance on chromatic (color) & achromatic (luminance) CS.Methods: Luminance CS was measured with the Pelli-Robson (PR)chart which has large letters which decrease in contrast in 0.15 logsteps (0.05/letter). Color CS was measured with the cone contrast test(CCT; Innova Systems, Inc.) which uses a Netbook computer & rapidstaircase to present colored letters on a grey background whichdecrease in cone contrast to measure red (L), green (M) and blue (S)cone contrast thresholds. PR & CCT were measured at photopic (85cd/m 2 ), low photopic (5.4 cd/m 2 ) & mesopic (0.7 cd/m 2 ) levels byhaving subjects view monocularly through neutral density filters. 16color vision normals (CVN) & 14 hereditary color vision deficients(CVD) were tested.Results: In CVN color (L & M cone) and luminance log CS wereequal at high luminance (1.95 log CS) but decreased linearly with logluminance with color CS decreasing more rapidly (3.5X) vs.luminance CS (2.5X) such that color CS was 0.2 log units (1.6X)lower than luminance CS at the mesopic level (p
<strong>ARVO</strong> 2013 Annual Meeting Abstracts by Scientific Section/Group – <strong>Visual</strong> <strong>Psychophysics</strong> / <strong>Physiological</strong> <strong>Optics</strong>Purpose: The luminance flicker pathway is typically conceived of asa simple additive combination of M- and L-cone signals. As wereported before (<strong>ARVO</strong>, 2001), this simple picture is complicated bythe existence of multiple cone signals with different delays and signs,which can be revealed by most conditions of chromatic adaptation.Here, we extend these measurements and model the results in termsof an inhibitory surround network.Methods: Cone delays were measured by a flicker photometriccancellation technique. Human subjects varied the relative delaybetween two superimposed flickering lights (and their relativemodulation) in order to minimize or null the perception of flicker.One flickering light was either an M-cone or an L-cone isolatingstimulus, and the other was a “standard” light that was of the samewavelength as the background. Measurements were made as afunction of temporal frequency from 2.5 to about 25 Hz on a series ofadapting backgrounds with wavelengths between 410 and 658 nmand at several background intensities.Results: Under most conditions, sizeable delays or advances by asmuch as 33 ms have to be introduced between the M- or L-coneflickering light and the standard in order to null the perception offlicker, particularly when M-cone flicker is used. In general, theresults are consistent with the L- and M-cone signals being made upof faster components combined with delayed ones of the same oropposite sign. For M-cone signals, the delayed components can belarger than the fast, so that they predominate.Conclusions: These results challenge the idea that the luminancechannel is made up of only additive M- and L-cone inputs. However,these complexities may simply reflect the fact that the inhibitorysurround of each cone has both L- and M-cone inputs, and that thereare typically more L-cone inputs than M. We model the surround as anetwork of direct and indirect inhibitory lateral connections acrosswhich each step in the network inverts and delays the signal. Thus,the effective sign and overall delay of the slow signal depend uponthe relative strengths of the inhibitory feedback at each step and uponthe number of steps.Commercial Relationships: Andrew Stockman, NoneSupport: BBSRC410 Spatial Vision, <strong>Visual</strong> <strong>Psychophysics</strong> and Aging IIWednesday, May 08, 2013 8:30 AM-10:15 AMTCC LL 4/5 Paper SessionProgram #/Board # Range: 4063-4068Organizing Section: <strong>Visual</strong> <strong>Psychophysics</strong> / <strong>Physiological</strong> <strong>Optics</strong>Program Number: 4063Presentation Time: 8:30 AM - 8:45 AMTwo-point detection and appearance in the absence of higherorder aberrationsHeidi J. Hofer, Darren E. Koenig. College of Optometry, Universityof Houston, Houston, TX.Purpose: We investigated the impact of the cone mosaic onspatiochromatic reconstruction of two-point stimuli by measuringdetection and appearance with stimuli made smaller than retinalcones with adaptive optics. We sought to determine whetherdetection and perception of these points are independent near thefovea, as has been previously hypothesized, and if not the extent ofsummation for detection and color. We also investigated whethertwo-point resolution is consistent with a photoreceptor limit underthese conditions.Methods: We performed two experiments in which subjects viewed550nm two-point stimuli through a 6mm pupil with adaptive opticsaberration correction. Stimuli were viewed at ~1 degree eccentricityunder a rod bleaching protocol to isolate cone responses. In oneexperiment two subjects were shown either one or two spots (25 ms,0.5 arcmin estimated retinal full-width at half maximum (fwhm)) ofdifferent intensities and reported the number seen and colorappearance. Separation was varied from 1.5 to 15 arcmin. In thesecond experiment two subjects were shown either one or two dim,yet suprathrehsold, spots (15 ms, 0.5 and 1.1 arcmin estimated fwhm)and reported whether they believed one or two spots were present.Separation was varied from 0.5 to 12 arcmin.Results: Detection thresholds in the first experiment were consistentwith complete spatial summation up to 3-4 arcmin. Detection, but notcolor appearance, was independent for separations of 8 arcmin ormore and consistent with at least 15 arcmin of spatial uncertainty. Fortwo-point stimuli color appearance was highly variable, as for singlepoints, but also highly coupled. Both points were reported to have thesame color appearance on over 97% of trials, regardless ofseparation. Resolution thresholds were similar in both experiments,2.5-5 arcmin, with a slight tendency towards lower thresholds withthe larger spots.Conclusions: Cone detection at 1 degree is consistent with completespatial summation over an extent including at least a cone and itsnearest neighbors, creating challenges in recovering ‘single cone’sensations from the responses to tiny stimuli. Despite this extent,two-point resolution is roughly consistent with expectations based ona photoreceptor limit. The large variation, but lack of independence,in the color appearance of the two-point stimuli, implies nonlocalityin the color reconstruction mechanisms.Commercial Relationships: Heidi J. Hofer, None; Darren E.Koenig, NoneSupport: ROI EY019069, P30 EY07551Program Number: 4064Presentation Time: 8:45 AM - 9:00 AMA Comparison of Acuity and Cone Density in the TemporalRetinaNancy J. Coletta 1 , Toco Y. Chui 2 , Ann E. Elsner 2 . 1 Vision Science,New England College of Optometry, Boston, MA; 2 School ofOptometry, Indiana University, Bloomington, IN.Purpose: Cone spacing has long been thought to set a limit on visualacuity. While parafoveal acuity and cone density decrease at parallelrates with increasing myopia (Coletta and Watson, Vis Res, 2006;Chui et al., IOVS, 2008), parafoveal acuity has been reported toexceed the limit estimated from histological measures of conespacing (Williams and Coletta, JOSA A, 1987). Recent advances inretinal imaging allow a comparison of acuity and cone spacing in thesame eyes. We compared parafoveal acuity to cone density in severalyoung adult individuals to determine whether acuity is matched to thelimit estimated from cone density.Methods: Measurements were made on five subjects with an averageage of 28 years +/- 4.30 s.d., average spherical equivalent refractiveerror of -1.93 D +/- 3.32 s.d. and average axial length of 24.48 mm+/- 1.38 s.d. (IOL Master, Zeiss Meditec). Acuity was measured onthe temporal retinal meridian using 543 nm laser interference fringesat a retinal illumination of 100 td; fringes were displayed in a 1 degpatch at 2 deg and a 2 deg patch at 7 deg eccentricity. Acuity wasestimated at the 75% correct level for a 2AFC vertical/horizontaldiscrimination task. Cone densities in the temporal retinal meridianwere assessed using a second generation Adaptive <strong>Optics</strong> ScanningLaser Ophthalmoscope. Densities were measured at a nominal 630and 2070 microns from the foveal center with custom software(Matlab, Mathworks). Axial lengths were used to correct the conesampling positions and retinal area, as well as to convert conedensities to Nyquist frequencies (NF) in units of c/deg.©2013, Copyright by the Association for Research in Vision and Ophthalmology, Inc., all rights reserved. Go to iovs.org to access the version of record. For permissionto reproduce any abstract, contact the <strong>ARVO</strong> Office at arvo@arvo.org.
<strong>ARVO</strong> 2013 Annual Meeting Abstracts by Scientific Section/Group – <strong>Visual</strong> <strong>Psychophysics</strong> / <strong>Physiological</strong> <strong>Optics</strong>Results: The average acuity at 2 deg and 7 deg locations was 34.4c/deg +/- 3.54 s.e.m. and 17.62 c/deg +/- 2.33 s.e.m., respectively,while the average cone NFs at 2 deg and 7 deg locations were 26.97c/deg +/- 1.02 s.e.m. and 18.79 c/deg +/- 0.73 s.e.m., respectively.Individual ratios of acuity: cone NF ranged from 1.03 to 1.47 with amean of 1.26 at 2 deg and 0.75 to 1.18 with a mean of 0.93 at 7 deg.A paired t-test of acuity and cone NF values at 7 deg was notstatistically significant.Conclusions: <strong>Visual</strong> acuity exceeded the cone NF at 2 degeccentricity, confirming earlier studies that compared parafovealacuity and histological measures from different eyes. However ourresults at 7 deg eccentricity suggest that interferometric acuity mayprovide a good estimate of cone density in the perifoveal region.Commercial Relationships: Nancy J. Coletta, None; Toco Y.Chui, None; Ann E. Elsner, Aeon Imaging, LLC (I), Aeon Imaging,LLC (F), Aeon Imaging, LLC (P)Support: NIH Grants NEI EY007624 (AE Elsner), NEI EY004395(SA Burns), NEI P30EY019008 at IU and NEI R24 EY014817 atNECOProgram Number: 4065Presentation Time: 9:00 AM - 9:15 AMAge-related variation in foveal, parafoveal and peripheral spatialsuppressionRigmor C. Baraas, Craig Aaen-Stockdale, Stuart J. Gilson.Optometry & <strong>Visual</strong> Science, Buskerud University College,Kongsberg, Norway.Purpose: The study investigated motion-related spatial suppressionacross different age groups and across different eccentricities, withthe stimuli scaled according to the size of MT receptive fields. Theaim was to test three alternative hypotheses: If spatial suppression (1)is a perceptual correlate of center-surround antagonism in corticalvisual area V5 then the levels of spatial suppression should beconstant at all eccentricities; (2) reduces with increasing age, as aresult of a generalized weakening of inhibition then suppressionshould be lower for older observers, but constant at all eccentricities;(3) is related to contrast-related changes in receptive field size at aretinal level then suppression should vary with eccentricity andpossibly vary with cone density.Methods: Eleven normal, healthy subjects (7 females) with noknown ocular abnormalities, aged 21-71 yrs participated in the study.Their left eye was patched and they fixated a fixation cross presentedon the screen at eccentricities of 0, 2, 5 or 10 deg, or a back-litfixation point at 25 or 40 deg. The stimulus was a 2 Hz driftingsinusoidal grating with a peak contrast of 92%. Spatial frequency wasvaried with eccentricity to keep it close to peak contrast sensitivity.Stimulus duration was varied to derive a duration threshold. Highresolutionimages of the cone mosaic were obtained with theKongsberg Adaptive <strong>Optics</strong> Ophthalmoscope II.Results: Older observers showed zero suppression for foveal vision(0-2 deg), gradual increase in suppression in the parafovea (5-10 degeccentricity) and weaker suppression in the periphery (25-40 deg).Contrary to this, young observers showed strong suppression forfoveal and parafoveal vision (0-5 deg) with a gradual decline insuppression from 10 deg. There was between-individual variation inboth spatial suppression and cone density. Initial analyses indicatethat lower levels of suppression correlate with lower cone count.Conclusions: The strength of suppression, in both young and oldobservers, varied with eccentricity, despite the scaling of the stimuluswith average MT receptive field size. The results for older observersimply that weaker suppression is not a generalizable result. Theresults suggest that spatial suppression may be the result of low-levelstimulus characteristics and structural variation in the retina ratherthan a direct result of center-surround antagonism in MT.Commercial Relationships: Rigmor C. Baraas, None; CraigAaen-Stockdale, None; Stuart J. Gilson, NoneSupport: The Research Council of Norway Yggdrasil internationalmobility grant #211313 (CAa-S); Research Council of Norway Grant176541/V10 and 182768/V10 (RCB)Program Number: 4066Presentation Time: 9:15 AM - 9:30 AMHeterochromatic Modulation Photometry can be used to measureMacular Pigment Optical DensityCord R. Huchzermeyer 1 , Juliane Schlomberg 1 , Ulrich Welge-Lüssen 1 ,Tos TJM Berendschot 2 , Jan J. Kremers 1 . 1 Department ofOphthalmology, University Erlangen-Nuremberg, Erlangen,Germany; 2 University Eye Clinic, Maastricht, Netherlands.Purpose: Macular pigment optical density (MPOD) can be measuredpsychophysically by comparing the luminance ratio between a shortwavelengthand a long-wavelength light at a central and a peripheralretinal locus using heterochromatic flicker photometry (HFP).Heterochromatic modulation photometry (HMP) is a psychophysicaltest that uses, in contrast to HFP, test fields with constant meanluminance and chromaticity.To study whether HMP is suitable for measuring MPOD, wecompared a custom made HMP protocol with measurements usingHFP and macular pigment reflectometry (MPR).Methods: We developed a protocol for the measurement of MPODusing a Maxwellian view LED stimulator. Two lights (B: 460nm andR:660nm, retinal illuminance of 21 phot Td each) were modulated incounterphase in a 2° center-field surrounded by a 12° whitebackground (587 phot Td). Flicker detection threshold contrasts weredetermined for 9 different contrast ratios (B/R) of the two lights,varying between 10 -1 and 10 1 . Thresholds were determined using tworandomly interleaved staircases and a 2AFC (flicker/no flicker)procedure. The measurements were repeated with central and with 6°nasal fixation.For comparison, MPOD was also measured using an HFP-basedMacular Densitometer (Macular Metrics, USA) and the MacularPigment Reflectometer (Maastricht Instruments bv, TheNetherlands).The right eyes of 14 normal subjects were measured.Results: Log sensitivity (1/threshold) vs log B/R can be described bya V-shaped curve with a minimum at log B/R = 0 for the standardobserver with V λ -like spectral luminosity. A horizontal shift (alongthe log B/R axis) of the minimum represents a deviation from the V λ .The difference of the positions of the minima measured at central and6°nasal fixation were used to estimate the MPOD.MPOD measurements using HMP correlated with HFP (n=12,r=0.79, p
<strong>ARVO</strong> 2013 Annual Meeting Abstracts by Scientific Section/Group – <strong>Visual</strong> <strong>Psychophysics</strong> / <strong>Physiological</strong> <strong>Optics</strong>Program Number: 4067Presentation Time: 9:30 AM - 9:45 AMComparability of <strong>Visual</strong> Performance of Individuals with LowVision in Real and Virtual Street IntersectionsLei Liu, Ellen L. Bowman. School of Optometry, University ofAlabama at Birmingham, Birmingham, AL.Purpose: Low Vision Orientation & Mobility (O&M) evaluation andtraining are typically performed in streets and street intersections.While effective, the efficiency of the practice can be greatlyimproved by employing computer-generated virtual street scenarios.To evaluate the feasibility of virtual O&M training, we comparedvisual performance of low vision patients in real and virtual streetintersections.Methods: A semi-CAVE virtual reality simulator was built. Itconsisted of a game computer, 3 digital projectors, three 2.4x1.9 mscreens (>180 o deg horizontal) and surrounding sound. Four virtualstreet intersections were built based on 4 real intersections in anurban environment. Google Street, Geographic Information Systemand on-site photos/videos were used to match the physical layout andsurrounding, traffic controls, and vehicle and pedestrian traffic of thereal and virtual intersections. Multiple crossing scenarios were set ateach intersection. Ten legally blind subjects with adequate priorO&M training performed 10 visual tasks in both real and virtualintersections. These tasks included identifying traffic elements,determining intersection layout and choosing the safest time to cross.The performance was rated pass or fail by two certified O&Mspecialists. Agreement between performance in corresponding realand virtual intersections was compared.Results: Data from corresponding real and virtual intersections wasorganized into a 2x2 contingency table. The overall, positive andnegative agreements were 83.3%, 89.4% and 68.6%, respectively,indicating that if a subject could perform a task in a real intersection,it was highly likely that she could also perform the same task in avirtual version of the intersection, and vice versa. The kappacoefficient was 0.59, bordering moderate and substantial agreement.A McNemar analysis of paired binary data showed an exactsignificance of 0.824, indicating no difference in performancebetween real and virtual intersections.Conclusions: Persons with low vision exhibited similar abilitieswhile performing visual tasks in real and virtual street intersections.The agreement suggested that computer-generated traffic scenesprovided sufficient visual and auditory information for low visionpatients to perform O&M tasks. Virtual reality has the potential tobecome a useful supplement to tradition low vision rehabilitationtraining.Commercial Relationships: Lei Liu, None; Ellen L. Bowman,NoneSupport: NIH Grant 1R21EY0195491.5s in random order, through adaptive optics to correct theaberrations of the eye. The PSV images (50/50 energy content) wereobtained from the combination of a focused image superimposed to adefocused version of the same image. At least 18 defocus conditions(0-3D) were subjectively ranked (10 repetitions). In addition, opticalquality was evaluated as a function of defocus, from the PSV and PDPoint Spread Functions (PSF), using the Modulation TransferFunction (MTF) at different frequencies as a metric.Results: As expected, images without defocus were perceived assharp (score s=5) in all subjects and conditions. The perceptualweighted rank systematically dropped for PD at a rate of 9.0±4.0 s/D,with the images perceived as completely blurred (s=0) from 0.6 Donwards. PSV images provided a similar decrease as their defocuscomponent increased, in the 0-0.3D range. However, in 3 subjects thescore reached a minimum at 0.5D (s=2.1±0.4) and then it waspartially recovered back towards sharpness (s=3.5 at 1.2D),remaining stable afterwards. The 4th subject showed a similar trendjudging PSV images but without a minimum. The objectivesimulations predicted the perceptual judgment trends, as well as thedifferences between judgments of PD and PSV images. MTF@20c/deg decreased sharply with defocus in PD, but reached a minimum(0.42 at 0.5 D) and recovered a stable level (0.50 from 1.5D) in PSV.Averaged MTFs (15-25 c/deg) provided the most accuratepredictions.Conclusions: As opposed to the common idea that simultaneousvision retinal images (as those found in multifocal contact orintraocular lenses) are severely optically degraded, but later restoredin neural processes, we have found a good correspondence betweenpure subjective perception experiments and pure optical simulations.Although our findings do not preclude for possible effects of neuraladaptation, neural effects seem to be secondary in the perceptualjudgment of sharpness in PSV.Program Number: 4068Presentation Time: 9:45 AM - 10:00 AMOptical quality and subjective judgments of blur under puresimultaneous visionCarlos Dorronsoro, Aiswaryah Radhakrishnan, Lucie Sawides,Susana Marcos. Instituto de Optica, CSIC, Madrid, Spain.Purpose: To compare retinal image quality and subjective imagesharpness under pure bifocal simultaneous vision (PSV) across awide range of addition values.Methods: Four subjects performed a weighted rank psychophysicalexperiment to grade (from totally blurred to totally sharp, 0 to 5) theperceptual quality of PSV images. As a control condition, theperceptual quality of purely defocused (PD) images was alsoassessed. Computer generated images of a face were observed, forCommercial Relationships: Carlos Dorronsoro, EssilorInternational (F); Aiswaryah Radhakrishnan, None; LucieSawides, None; Susana Marcos, Essilor (F), PCT/ES2012/070185(P)Support: FIS2011-25637; ERC-2011-AdG-294099; EU Marie CurieFP7-PEOPLE-2010-ITN #26405©2013, Copyright by the Association for Research in Vision and Ophthalmology, Inc., all rights reserved. Go to iovs.org to access the version of record. For permissionto reproduce any abstract, contact the <strong>ARVO</strong> Office at arvo@arvo.org.
<strong>ARVO</strong> 2013 Annual Meeting Abstracts by Scientific Section/Group – <strong>Visual</strong> <strong>Psychophysics</strong> / <strong>Physiological</strong> <strong>Optics</strong>417 Accommodation and Presbyopia CorrectionWednesday, May 08, 2013 8:30 AM-10:15 AMExhibit Hall Poster SessionProgram #/Board # Range: 4250-4283/B0287-B0320Organizing Section: <strong>Visual</strong> <strong>Psychophysics</strong> / <strong>Physiological</strong> <strong>Optics</strong>Program Number: 4250 Poster Board Number: B0287Presentation Time: 8:30 AM - 10:15 AMThe Influence of Multifocal Lenses on Fine Motor TasksRupal Lovell-Patel 1, 2 , Matthew A. Timmis 2 , Shahina Pardhan 2 , PaulMcCarthy 1, 2 . 1 Vision and Hearing Sciences, Anglia RuskinUniversity, Cambridge, United Kingdom; 2 Vision and Eye ResearchUnit, Anglia Ruskin University, Cambridge, United Kingdom.Purpose: Literature suggests that multifocal lenses are associatedwith a decreased performance for a variety of tasks includingnegotiating steps, obstacles, driving and reading at certain distances,when compared to single vision lenses. In daily life we regularlyperform other motor tasks, such as reaching and grasping an object.Currently, there is no evidence based data on how multifocal lensesaffect the performance of such fine motor tasks when compared tosingle vision lenses.Methods: 12 presbyopic subjects who were habitual multifocalspectacle wearers took part in the study. Performance was comparedfor multifocal lenses and single vision lenses which were prescribedfollowing a comprehensive vision assessment and an analysis of thedistances at which the tasks were carried out. Subjects had aminimum visual acuity of 0.00 LogMAR. Participants completed 3different fine motor tasks wearing both types of correction; objectwidth estimation, reach-and-grasp and transport-and-placement.Hand and head movements were captured by a 3-D motion capturesystem.Results: Data were analysed using ANOVA. Peak grip aperture wassignificantly larger when grasping the large compared to small object(p < .001). Participants also showed greater error when positioningthe large compared to small object (p < .001). For the reach-andgrasptask: onset time, overall movement time, peak velocity, peakgrip aperture, deceleration time and velocity corrections were notsignificantly affected by spectacle type (p>0.05). Interestingly, headflexion was also not affected by the spectacle type (p > .05). For theobject width estimation task: no significant difference was obtainedin the perceived aperture width between the spectacle types. Fortransport-and-placement: movement time, peak velocity, decelerationtime, velocity corrections, head rotation and error in object placementwere unaffected by spectacle type (p > .05).Conclusions: The type of spectacle lens did not affect the fine motortasks which encompassed a range of visual angles that would lieoutside the multifocal lenses’ intermediate corridor. Datademonstrates that habitual multifocal spectacle wearers can carry outfine motor tasks such as reaching and grasping just as competently asthey can with single-vision lenses.Commercial Relationships: Rupal Lovell-Patel, None; MatthewA. Timmis, None; Shahina Pardhan, None; Paul McCarthy, NoneProgram Number: 4251 Poster Board Number: B0288Presentation Time: 8:30 AM - 10:15 AMAccommodative Lag, Facility and Phoria with Multifocal ContactLensesJiyoon Chung 1 , Ravi C. Bakaraju 1 , Cathleen Fedtke 1 , Jerome Ozkan 1 ,Klaus Ehrmann 1, 2 , Darrin Falk 1 , Arthur Ho 1, 2 , Brien A. Holden 1, 2 .1 Brien Holden Vision Institute, Sydney, NSW, Australia; 2 School ofOptometry and Vision Science, University of New South Wales,Sydney, NSW, Australia.Purpose: To compare the accommodative lag, facility and phoriameasurements of myopic participants fitted with various commercialcontact lens designs.Methods: Forty myopic, non-presbyopic, subjects were randomizedto be fitted bilaterally, with a single vision control lens (Air OptixAqua) and two of four multifocal (MF) lenses (Proclear Distance andNear MF, Air Optix Aqua MF and PureVision MF) on a daily wearbasis. Subjects wore each lens type for a minimum of 8 days over 4scheduled (baseline and 3 follow-up) visits with a 1-week wash-outbetween lens types. Static accommodative responses were assessedwith the EyeMapper at all visits. Five repeats were performed in afogged state (+1D) and at four object vergences from -2 to -5D (1Dsteps). Paraxial curvature matching of the wavefront aberration mapyielded the spherical equivalent. Accommodative facility and phoria(at distance and near) were evaluated using ± 2D flippers and Howellcard, respectively. To reduce the effect of between-visit variability,the data was averaged over the four visits.Results: At +1D fogging, all lens types produced a myopic shift.With the control lens, the accommodative response function wasrelatively linear (slope = 0.82). Three centre-near MFs (Air Optix,PureVision and Proclear Near) all demonstrated accommodative leadat -2D, optimal response at -3D, and lag at -4 and -5D objectvergences. Proclear Distance produced lag over all test vergences. AllMFs produced lower accommodative facility compared to controllens (19.2 cycles / min, p
<strong>ARVO</strong> 2013 Annual Meeting Abstracts by Scientific Section/Group – <strong>Visual</strong> <strong>Psychophysics</strong> / <strong>Physiological</strong> <strong>Optics</strong>respectively). To assess the impact of dominance on visualperformance, through-focus visual acuity (VA) from 0.0 to 3.0D at0.5D step with a 4mm artificial pupil was measured under twoconditions by assigning dominant and non-dominant eye to distanceand near, respectively, and vice versa. Traditional monovision of1.5D anisometropia was measured for comparison.Results: Sensory eye dominance spanned from weak (DOD=4%) tostrong (DOD=23%) dominance with average DOD=9±8%. Theaverage difference in through-focus VA between switching eyeassignment for distance in modified and traditional monovision was -0.01±0.04 and 0.00±0.03 logMAR, respectively. The subject with thestrongest dominance experienced a loss in intermediate (0.5-1.5D)VA of 0.16±0.09 and 0.05±0.01 logMAR with modified andtraditional monovision, respectively, when the non-dominant eye wasassigned to distance compared to assigning the non-dominant eye tonear.Conclusions: For subjects with typical low and moderate levels ofsensory eye dominance, the degree of dominance did not have asignificant effect on through-focus VA in monovision regardless ofwhich eye was assigned to distance and near. However, it isimportant for subjects with strong eye dominance to assign thedominant eye to distance vision for optimal through-focus VA,especially in modified monovision correction.Commercial Relationships: Len Zheleznyak, None; Aixa Alarcon,None; Kevin C. Dieter, None; Duje Tadin, None; GeunyoungYoon, Bausch & Lomb (F), Johnson & Johnson (F), Allergan (C),Staar Surgical (C), CIBA Vision (F), Acufocus (C)Support: NIH Grant EY014999, Research to Prevent BlindnessUnrestricted/Challenge Grant, NIH Training Grant T32 EY007125Program Number: 4253 Poster Board Number: B0290Presentation Time: 8:30 AM - 10:15 AMCustomizing depth of focus outcomes in Hyperopic Lasik usingan Adaptive <strong>Optics</strong> Vision AnalyzerGuillermo M. Perez 1 , Eloy A. Villegas 2 , Benjamin Leray 3 , Francois J.Malecaze 3 , Pablo Artal 2 . 1 Voptica S.L., Murcia, Spain; 2 Laboratoriode Optica, Universidad de Murcia, Murcia, Spain; 3 Serviced'Ophtalmologie, CHU Toulouse-Purpan, Toulouse, France.Purpose: LASIK allows not only to correct for the refractive errorbut also to extend depth of focus by inducing controlled amounts ofspherical aberration (SA). However the success of the procedure maydepend on the particular SA values required by each patient. Weevaluate a customization procedure where the optimum values of SAwere determined for each patient using an adaptive optics visionanalyzer before the surgery.Methods: A group of 38 hyperopic/presbyopic patients wereevaluated before and after surgery using the Adaptive <strong>Optics</strong> VisionAnalyzer (AOVA, Voptica SL, Murcia, Spain). This is a clinicalinstrument to perform vision testing with full control of the opticalaberrations induced in the patient’s eye non-invasively. The AOVAincludes a wave-front sensor, a liquid crystal on silicon spatial lightmodulator to induce any desired aberration profile on the patient’seye, and a micro-display to present the visual stimuli. <strong>Visual</strong> acuitywas measured for defined combinations of residual defocus and SA atinfinity, 60 cm and 40 cm. In each patient, the sets of optimizedvalues of defocus and SA required to maintain adequate near and farVA were determined. Then, and taking into account the patient’scorneal asphericity (Q-value), the LASIK procedure (WaveLightAllegretto Wave Eye-Q Laser, Alcon) was settled to induce thedesired range of negative SA in one eye. The fellow dominant eyewas treated only to reach emmetropia without inducing SA. After thesurgery, through focus VA, residual refraction, and SA was measuredusing the AOVA in each patient.Results: The average Q-value changed from -0.1 to -0.6 in thedominant eyes, and from -0.05 to -0.8 in the eyes treated for inducingextra asphericity. The average value of SA providing an extendeddepth of focus was around -0.2 microns for 4.5-mm pupil. In theseeyes, the required positive addition for intermediate and near visionchanged from +1.00D and +1.70D to +0.40D and +1.00Drespectively. In those eyes with no SA induced, the positive additionrequired hardly changed.Conclusions: Hyperopic presbyopic patients are ideal candidates forcustomized LASIK to induce an extended depth of focus. Thisprocedure can be optimized when mediated with adaptive to predictthe right amount of SA to be induced. These results suggest that theLASIK guided with and AOVA can provide improved visualoutcomes at all distances.Commercial Relationships: Guillermo M. Perez, VOPTICA (E);Eloy A. Villegas, Voptica, S.L. (I), Calhoun Vision (F); BenjaminLeray, None; Francois J. Malecaze, None; Pablo Artal, AMO (C),Voptica SL (P), Voptica SL (I), AMO (F), Calhoun Vision (F),Calhoun Vision (C), AcuFocus (C)Support: Ministerio de Ciencia e Innovación, Spain (grantsFIS2010-14926 and CSD2007-00013), Fundación Séneca (Region deMurcia, Spain), grant 4524/GERM/06.Program Number: 4254 Poster Board Number: B0291Presentation Time: 8:30 AM - 10:15 AMEffect of Age on Amplitude of Accommodation in BoliviaMagnus Andersson, Baskar Theagarayan. Section of Optometry andVision Science, Linnaeus University, Kalmar, Sweden.Purpose: The purpose of this study was to investigate the impact ofage on Amplitude of Accommodation (AA) in a Bolivian populationand compare it with previously published data. We were alsointerested in finding out the age of onset of Presbyopia in thispopulation.Methods: A sample of 197 Bolivian subjects aged between 8 to 60years, attending three different field clinics provided by Vision ForAll (non-profit organization, Sweden) was used in the study. All thesubjects were refracted binocularly and had at least best correction<strong>Visual</strong> acuity of 20/25. None of the subjects had any visiblestrabismus or ocular pathology. The AA was measured using thepush-up and push-down method with a Royal Air Force (RAF) ruler.The ruler has both a metric scale in centimeters and a dioptric scale.The subjects were asked to read letters of N5 print size and reportfirst sustained blur in push-up method and first sustained clear in thepush-down method. The subjects had their correction in place duringthe measurements. Among the presbyopic subjects a +2.00D lens wasplaced as an addition to bring the target within measurable limits. Theaverage of push-up and push-down readings was used as thesubjective AA.Results: Independent samples t-test showed no statisticallysignificant difference between the present and the previous AAstudies (p > 0.05). The AA of the Bolivian population was generallylower compared to previous investigations. Regression analysisshowed a significant correlation between age and the AA (r = 0.80, p< 0.05). The onset of presbyopia among the Bolivian population wasfound to be 38 years.Conclusions: This result supports the theory that there is a lower AAamong people in tropical zones compared to those from temperatezones. The onset of presbyopia for this Bolivian population wasseven years earlier than the Hofstetter formula would predict and fiveyears earlier compared to Duane’s (Duane A, Trans Am OphthalmolSoc, 1922; 20:132-157) values.Commercial Relationships: Magnus Andersson, None; BaskarTheagarayan, None©2013, Copyright by the Association for Research in Vision and Ophthalmology, Inc., all rights reserved. Go to iovs.org to access the version of record. For permissionto reproduce any abstract, contact the <strong>ARVO</strong> Office at arvo@arvo.org.
<strong>ARVO</strong> 2013 Annual Meeting Abstracts by Scientific Section/Group – <strong>Visual</strong> <strong>Psychophysics</strong> / <strong>Physiological</strong> <strong>Optics</strong>Program Number: 4255 Poster Board Number: B0292Presentation Time: 8:30 AM - 10:15 AMInfluences of cycloplegia with topical cyclopentolate on higherorderaberrations in myopic childrenTakahiro Hiraoka 1 , Kazunori Miyata 2 , Fumiki Okamoto 1 , TetsuroOshika 1 . 1 Dept of Ophthalmology, University of Tsukuba, Tsukuba,Japan; 2 Miyata Eye Hospital, Miyakonojo, Japan.Purpose: It is little known about the effect of cycloplegia withtopical cyclopentolate on optical quality of the eye in myopicchildren. We conducted this prospective study to investigate theinfluence of topical cyclopentolate on higher-order aberrations(HOAs) in myopic children.Methods: Twenty-eight eyes of 28 myopic children (17 boys and 11girls), ranging in age from 4 to 12 years (7.25 ± 2.55, mean ±standard deviation), were enrolled in this study. We evaluatedrefraction and wavefront aberrations before and after cycloplegiawith topical instillation of 1% cyclopentolate hydrochloride. Ocularand corneal aberrations were simultaneously measured and comparedwith each other. Individual Zernike components were also analyzedfor a 6-mm pupil up to the sixth order. All these parameters werecompared before and after cycloplegia. In addition, the obtained datawere compared with other 23 subjects with hyperopia.Results: Cycloplegia with topical cyclopentolate induced significanthyperopic changes from -3.07 ± 2.23 to -2.57 ± 2.15 D (P < 0.001,paired t-test). Ocular higher-order aberrations (HOAs) increasedsignificantly from 0.243 ± 0.111 to 0.263 ± 0.105 μm for coma-likeaberrations (P = 0.042), from 0.124 ± 0.041 to 0.138 ± 0.037 μm forspherical-like aberrations (P = 0.012), and from 0.279 ± 0.105 to0.304 ± 0.096 μm for total HOAs (P = 0.015). Corneal HOAs did notchange by cycloplegia. When corneal and ocular HOAs werecompared, the ocular HOAs were significantly smaller than thecorneal HOAs in spherical-like aberrations (P < 0.001) and totalHOAs (P = 0.006). When compared between myopic and hyperopicchildren, spherical-like aberrations and total HOAs were significantlylarger in hyperopia than in myopia (P = 0.001 and P = 0.042,unpaired t-test). However, each Zernike component showed a largestandard deviation in both groups.Conclusions: Internal optics compensate for corneal HOAs also inmyopic children, and paralysis of tonic accommodation withcyclopentolate considerably affects ocular HOAs. It may be thatphysiological tonic accommodation is done to improve retinal imagequality by reducing HOAs. In addition, HOAs tend to be smaller inmyopia than in hyperopia, but inter-individual variation in eachZernike component is quite large in both myopic and hyperopicchildren.Commercial Relationships: Takahiro Hiraoka, None; KazunoriMiyata, None; Fumiki Okamoto, None; Tetsuro Oshika, NoneProgram Number: 4256 Poster Board Number: B0293Presentation Time: 8:30 AM - 10:15 AMFive-year Incidence of Loss of Accommodative Ability in theBeaver Dam Offspring StudyDayna S. Dalton, Karen J. Cruickshanks, Mary E. Fischer, BarbaraE. Klein, Ronald Klein, Aaron A. Pinto. Ophthalmology and <strong>Visual</strong>Sciences, University of Wisconsin, Madison, WI.Purpose: To determine the 5-year incidence of loss ofaccommodative ability in a large cohort of adults.Methods: Subjects (n=2256, age 21-84 years at baseline) participatedin both the baseline (2005-2008) and 5-yr follow-up exam (2010 -2012) of Beaver Dam Offspring Study. At each visit a Grand SeikoAutorefractor was used to obtain three measures of refractive error;distance correction and with correction focusing on two near targets;one requiring 2 diopters (D) and the other 4.5D. Readings wereconverted to spherical equivalent (sphere + ½ cylinder) (SE).Participants were classified as myopic (SE ≤ -1.00), hyperopic (SE ≥+1.00) or emmetropic (SE > -1.00 and < +1.00). At each of the twonear targets, the participant was considered to have lostaccommodative ability if the spherical equivalent was ≥ -0.50.Subjects with cataract surgery were excluded.Results: In preliminary analyses of right eyes, there were 741participants in the baseline exam who were able to accommodate atboth targets. Of those, 333 (45%) were not accommodating at the 2Dtarget and 241 (33%) were not accommodating at the 4.5D target atthe 5-yr follow-up exam. Age was highly associated with theincidence of loss of accommodative ability (mean age ofaccommodating at 2D = 38.2 years; 4.5D = 38.7 years, notaccommodating at 2D = 44.7 years; 4.5D = 46.1 years) and risk oflosing accommodative ability increased with increasing age (OR3.18, 95% CI 2.59-3.90 for each 5 years of age). Participants withhyperopia were less likely to lose accommodative ability (OR 0.01,95% CI 0.00 - 0.04) compared to those with emmetropia. There wasno association between myopia or sex with loss of accommodativeability. Eight participants over the age of 55 years at the baselineexamination had accommodative ability at both distances at bothexaminations.Conclusions: Loss of accommodative ability is very common inmiddle-age. These data show that adjusting for age, hyperopia wasassociated with decreased risk. In spite of the strong age effect, asmall number of people retain accommodative ability beyond midlife.Further investigation is necessary to identify factors that areassociated with retention of accommodative ability. To the best ofour knowledge, this is the first longitudinal study using an objectivemeasure to investigate the loss of accommodative ability.Commercial Relationships: Dayna S. Dalton, None; Karen J.Cruickshanks, None; Mary E. Fischer, None; Barbara E. Klein,None; Ronald Klein, None; Aaron A. Pinto, NoneSupport: NIH Grant AG021917Program Number: 4257 Poster Board Number: B0294Presentation Time: 8:30 AM - 10:15 AMEffect of Unclean Display on Accommodative ResponseMasakazu Hirota 1 , Hiroshi Uozato 1, 2 , Shinji Arai 1 , Yuko Shibata 1 .1 Ophthalmology & <strong>Visual</strong> Sciences, Kitasato Univ Graduate School,Minami-ku, Sagamihara-shi, Japan; 2 Orthoptics & <strong>Visual</strong> Sciences,Kitasato University School of Allied Health Science, Minami-ku,Sagamihara-shi, Japan.Purpose: To assess change of accommodative response when wewatched an unclean display.Methods: Twenty volunteers (5 men and 15 women; mean ±standard deviation age, 22.2 ± 3.4 years; range, 19 to 33 years)participated in our study. All subjects had a visual acuity of 20/20 orbetter. In addition, we confirmed that all subjects had enoughaccommodation more than 7.00 D (mean ± standard deviation, 12.31± 0.54 D) and their near reflex was normal. Each subject’saccommodative response was measured by a target moving systemWMT-1 (Grand Seiko Co., Ltd, Hiroshima, Japan). WMT-1 canmove a target optionally from 0.2 to 1.0 m and it include a binocularAutorefractor WAM-5500 (Grand Seiko Co., Ltd, Hiroshima, Japan)that can measure refraction every 0.2 second in open field. Weadopted iPad (Apple Inc., Cupertino, CA) on WMT-1 as a target. Asan unclean display model, we covered closely to 3 pieces of tracingpaper upon the iPad’s display. We compared accommodativeresponse of a clean display and an unclean display in target distanceof 1 m, 0.5 m, and 0.2 m.Results: The accommodative response of unclean display increased©2013, Copyright by the Association for Research in Vision and Ophthalmology, Inc., all rights reserved. Go to iovs.org to access the version of record. For permissionto reproduce any abstract, contact the <strong>ARVO</strong> Office at arvo@arvo.org.
<strong>ARVO</strong> 2013 Annual Meeting Abstracts by Scientific Section/Group – <strong>Visual</strong> <strong>Psychophysics</strong> / <strong>Physiological</strong> <strong>Optics</strong>larger than that of clean display (1.0 m: clean was -0.80 ± 0.24 D,unclean was -1.03 ± 0.25 D.). When the target came near, thedifference of accommodative response between control and uncleandisplay increased (0.5 m: clean was -1.56 ± 0.25 D, unclean was -1.82 ± 0.24 D, 0.2 m: clean was -4.22 ± 0.38 D, unclean was -4.73 ±0.74 D.). Statistical significant differences were found between theaccommodative response of unclean display and of clean display inall target distances (Wilcoxon signed rank test, p < 0.001)Conclusions: The accommodative response of unclean display waslarger than that of clean display. The increase in necessaryaccommodative response may lead to asthenopia. We should keep adisplay clean to prevent eye fatigue.Commercial Relationships: Masakazu Hirota, None; HiroshiUozato, None; Shinji Arai, None; Yuko Shibata, NoneProgram Number: 4258 Poster Board Number: B0295Presentation Time: 8:30 AM - 10:15 AMThe effect of near addition lenses on the accuracy of theaccommodative response in myopic children during readingJinhua Bao, Zhili Zheng, Hao Chen. School of Optometry andOphthalmology, Wenzhou Medical College, Wenzhou, China.Purpose: Addition lenses may play a role in the retardation of theprogression of myopia. The purpose of this study was to evaluate thechanges to accommodation and phoria when myopic childrenperform near work with different near addition lenses.Methods: We measured accommodative response and phoria in 18children (14 myopic and 4 emmetropic) at 33cm through theirdistance refractive correction alone or this correction combined withmultiple addition lenses (+0.50D, +1.00D, +1.50D, +2.00D, +2.50D,and +3.00D). Accommodative response was measured using theinfrared optometer (WAM-5500) and near phoria was measuredusing the modified Thorington technique.Results: Myopic children had larger lags (1.35D) than emmetropicchildren (0.86D) for a 33 cm reading target through the distancecorrection, and significantly decreasing lags of accommodation withlarger addition lenses (P
<strong>ARVO</strong> 2013 Annual Meeting Abstracts by Scientific Section/Group – <strong>Visual</strong> <strong>Psychophysics</strong> / <strong>Physiological</strong> <strong>Optics</strong>Fig 1. Regression plot for TA and AsFac testwere assessed by the Convergence Insufficiency Symptom Survey(CISS).The sample was divided into High (N=22) and Low (N=17) symptomgroups based on the CISS adult cut-off score of 21. The average ARfor each stimulus was compared between groups and correlated withthe average TA.Results: Figure 1 shows the High and Low symptom groups hadsimilar AR for targets (F(4,132)=.54, p=.71). Groups also had thesame AR while reading (t(32)=.51, p=.61). TA values were the samefor both groups (t(37)=.11, p=.91), but the sample averaged asignificantly larger TA value (1.89 ± 1.09 D) than previouslyreported for college students (t(38)=2.14, p=.04).TA was significantly correlated with all AR measures for the Highsymptom group but not for the Low Symptom group (see Table 1). Alinear regression between TA and accommodative error duringreading showed that error increased 0.4 D for every 1 D decrease inTA below the text viewing distance of 3 D (Y = 1.5 - 0.4*X, R2 =0.54, p=.0002).Conclusions: These results suggest TA plays a significant role in theAR of symptomatic graduate students. Those with more TA havebetter accommodative focus at near work distances. Possibleweaknesses in the accommodation system of the symptomaticstudents may be compensated for by tonic accommodation.Fig 2. Regression plot for TA-corrected AS and AsFac testCommercial Relationships: Chunming Liu, None; Chris Chase,None; Stefanie A. Drew, None; Efrain Castellanos, None; AmyEscobar, None; Eric Borsting, None; Lawrence R. Stark, NoneSupport: NIH Grant EY021021Program Number: 4260 Poster Board Number: B0297Presentation Time: 8:30 AM - 10:15 AMLarger Tonic Accommodation Correlates with Better Focus atNear for Symptomatic Graduate School StudentsChris Chase 1 , Stefanie A. Drew 3 , Amy Escobar 1 , Chunming Liu 1 ,Efrain Castellanos 1 , Lawrence R. Stark 2 , Eric Borsting 2 . 1 College ofOptometry, Western University of Health Sciences, Pomona, CA;2 Southern California College of Optometry, Fullerton, CA;3 California State University, Northridge, Northridge, CA.Purpose: Under stimulus-free conditions, tonic accommodation (TA)adopts a resting posture of about 1.5 D, although studies have shownconsiderable individual variability. Models developed in the 1980’ssuggested that TA contributes little to the closed-loopaccommodation response (AR), but empirical research on this issuehas been sparse. This study examines the relationship between TAand AR in symptomatic and asymptomatic graduate students.Methods: Students from Western University of Health Sciencescompleted three tasks using an open-field WAM-5500 infraredautorefractor under monocular viewing conditions. First, continuous2-min recordings were made to assess AR at 0, 2, 3, 4, and 5 D.Second, after 5-min of dark adaptation, TA was recorded for 2-min.Third, continuous recordings were made while reading 20/50 text for10-min at 3 D. Participants were screened for normal visual acuity,no significant ocular pathology, no strabismus, normal stereopsis, andno significant uncorrected refractive error. Near-work symptomsFigure 1. Accommodation S-R Functions for High and Lowsymptomatic groups.Commercial Relationships: Chris Chase, None; Stefanie A. Drew,None; Amy Escobar, None; Chunming Liu, None; EfrainCastellanos, None; Lawrence R. Stark, None; Eric Borsting, NoneSupport: EY021021Clinical Trial: NCT01329848©2013, Copyright by the Association for Research in Vision and Ophthalmology, Inc., all rights reserved. Go to iovs.org to access the version of record. For permissionto reproduce any abstract, contact the <strong>ARVO</strong> Office at arvo@arvo.org.
<strong>ARVO</strong> 2013 Annual Meeting Abstracts by Scientific Section/Group – <strong>Visual</strong> <strong>Psychophysics</strong> / <strong>Physiological</strong> <strong>Optics</strong>Program Number: 4261 Poster Board Number: B0298Presentation Time: 8:30 AM - 10:15 AMThe Dynamic Accommodative Response with the Binocular openfieldautorefractor and a Movable Real TargetShinji Arai 1 , Hiroshi Uozato 1, 2 , Masakazu Hirota 1 . 1 Department of<strong>Visual</strong> Science, Kitasato University Graduate School of MedicalSciences, Kanagawa, Japan; 2 Department Orthoptics and <strong>Visual</strong>Sciences, Kitasato University School of Allied Health Science,Kanagawa, Japan.Purpose: To evaluate the dynamic characteristic of accommodationin the open field and real target using new device WMT-1Methods: Fourteen volunteers (6 men and 8 women; mean ±standard deviation age, 23.9 ± 4.0 years; range, 19 to 33 years)participated in our study. All subject had a visual acuity 20/20 orbetter and normal ocular health. Each subject’s accommodativeresponse was measured by target moving system WMT-1 (GrandSeiko Co., Ltd, Hiroshima, Japan) dynamically. The WMT-1 is a newdevice that is connected to the WAM-5500 open-field autorefractor.It can move a target optionally from 0.2 to 1.0 meter and measurerefraction every 0.2 second. We made shape of the cross as a visualtarget, displayed it in iPad (Apple Inc., Cupertino, CA).We evaluated three difference movements that had been programmedon the WMT-1.First, the constant diopter triangle drive. Second, constant velocitytriangle drive. Third, diopter sin drive. We measured dynamicallyaccommodative response in visual target distance from 1.0 meter to0.2 meter. We compared maximum quantity of accommodativeresponse and among three movements.Results: The maximum quantity of accommodative response ofDiopter Sin Drive became larger than Constant Velocity TriangleDrive (p < 0.05, Scheffe test). However, statistical significantlydifference was not found to other comparison.Accommodative response related to movement of visual target.Conclusions: We could measure dynamic characteristic ofaccommodation in the open field and real target using the WMT-1.The accommodation is evaluated at a definite point conventionally.The WMT-1 is useful to evaluate the dynamic characteristic ofaccommodation, because it can measure not only maximum quantityof accommodative response but also process of accommodativeresponse.Alistair P. Curd, Karen M. Hampson, Edward Mallen. BradfordSchool of Optometry and Vision Science, University of Bradford,Bradford, United Kingdom.Purpose: To investigate whether suppression of the accommodationresponse (AR) would be observed when a dioptric stimulusperformed a step-change, followed by an inverted step-change withinthe latency time for AR. Results would be relevant to models ofaccommodation and nearwork.Methods: A monocular adaptive optics apparatus displayed a targetto participants, and accommodation was recorded using a Shack-Hartmann wavefront sensor. A deformable mirror rapidly changedthe dioptric stimulus provided by the target. The baseline vergence ofthe target was −2D at the eye. An initial step-change in the stimuluswas followed by a second, inverted step, before the stimulus returnedto the baseline. Initial steps were of 1D or 2D in either direction;intervals between the steps ranged from 0.05s to 0.5s. The stimulussettings were randomised in order. The six participants (aged 21-26)observed every stimulus condition five times, through their dominanteye. A Badal optometer arrangement was used to eliminate a size cueand audible cues from the system were masked with auditory inputthrough headphones. Timings of the first change in the stimulus wererandomised.Results: Whether accommodation was responding to the first orsecond change in the stimulus affected the peak AR (p
<strong>ARVO</strong> 2013 Annual Meeting Abstracts by Scientific Section/Group – <strong>Visual</strong> <strong>Psychophysics</strong> / <strong>Physiological</strong> <strong>Optics</strong>its change caused by accommodation was calculated based on theacquired image.Results: Repeated measurements were taken in each accommodativestate. Compared with relaxed state (0D), the mean thickness variationaround the central fovea was 7.4957±8.3616 μm at 5Daccommodation. In further study, we will collect more data toanalyze the variations of axial length and retinal thickness.Conclusions: Preliminary result showed that the thickness betweenILM and RPE in macular has a slight change during accommodation.Commercial Relationships: Chuanqing Zhou, None; ShanhuiFan, None; Zhe Chen, None; Xinyu Chai, NoneSupport: the National Basic Research Program of China(2011CB707504), National Natural Science Foundation of China(81171377)Program Number: 4264 Poster Board Number: B0301Presentation Time: 8:30 AM - 10:15 AMThe Effect Of Age On The Lens Ultrastructure DuringAccommodation As Measured Using Slit Lamp Photos AndWave Front AnalysisRebecca K. Zoltoski 1 , Elizabeth Wyles 1 , Jennifer S. Harthan 1 , Jer R.Kuszak 2 . 1 Illinois College of Optometry, Chicago, IL; 2 LensAR,Orlando, FL.Purpose: During dynamic focusing, the shape, as well as the ultrastructureof the lens is changed. We have hypothesized that uniquestructural features and organization of fiber cells enables them tointerface at the sutures resulting in a change in surface curvature ofthe lens, as well as an increase in thickness, allowing near focus tooccur. We are reporting extended data on lens slit lamp photos, OCTof lens thickness changes, and sequential ray tracing analysis of thepatterns associated with the lens sutures to provide additional insightinto the importance of the ultra-structure of the lens in theaccommodative process.Methods: OCT (Visante), wavefront analysis (iTrace), and slitlamp photos (Haag Streit, 16X magnification, dilated eye) werecollected on the right eye of normal subjects, between the ages of 7 -63 (n=30). Accommodation was stimulated using minus lenses infront of the viewing eye in 2.5 D increments until the subject couldno longer clearly view the target. For the photos a prism system wasused to keep the eye appropriately oriented. The objectiveaccommodative response was calculated as the change from adistance measurement refractive value. ImageJ (NIH) was used toanalyze the area of the sutural components. Data were analyzed usingSystat v11 to correlate accommodative response (AR) with totalHOA, SA and the foil patterns, as well as changes in slit lamp sutureareas. Spearman Rank Correlation coefficients and p values arepresented.Results: Lens thickness increases by 0.13 ± 0.05 μm/D duringaccommodation. The total foil aberration pattern was correlated withAR (r2=0.5, p=0.04). There was a decrease in suture band thicknessthat correlated with the AR (r2=-0.5, p
<strong>ARVO</strong> 2013 Annual Meeting Abstracts by Scientific Section/Group – <strong>Visual</strong> <strong>Psychophysics</strong> / <strong>Physiological</strong> <strong>Optics</strong>The optical bench system consisted of a model eye with phase-plateinduced SA, a liquid crystal spatial light modulator to control pupilapodization, and a camera for imaging a tumbling E letter chart.TFIQ was quantified by calculating the correlation coefficientbetween a reference image (without SA and apodization) andcaptured through-focus images (0 to 2.5D with 0.1D step). Pupilapodization was modeled as a Gaussian function with various sigmavalues (0.5 to 2.0mm). Through-focus visual acuity was measured in2 cyclopleged subjects at distance, intermediate and near objectdistances (0, 1 and 2D). Both optical bench testing and visualperformance were carried out with ±0.2µm SA over a 4mm artificialpupil.Results: Introducing Gaussian apodization improved distance imagequality, regardless of sign of SA, by 7-12% for sigma ranging from0.5 to 2.0mm. At intermediate (1D) image quality, the negative SAcase had a larger improvement (9-18%) than the positive SA case (7-11%) for sigma ranging 0.5 to 2.0mm. For near (2D), theimprovement with negative SA was even larger (14-33%) whilepositive SA showed no improvement. <strong>Visual</strong> benefits withapodization were also found. Pupil apodization with sigma=0.5 led toa 1.0, 2.6 and 4.5 line improvement in visual acuity at 0, 1 and 2D,respectively, in the presence of negative SA. For positive SA, visualacuity improved by 1.0, 1.8 and 0.1 lines, respectively.Conclusions: Pupil amplitude apodization led to a significantimprovement in through-focus image quality, especially withnegative SA. This finding suggests that halos and glare induced bymultifocal presbyopic corrections can be reduced with appropriatepupil amplitude apodization.Commercial Relationships: Hae Won Jung, None; LenZheleznyak, None; Geunyoung Yoon, Bausch & Lomb (F), Johnson& Johnson (F), Allergan (C), Staar Surgical (C), CIBA Vision (F),Acufocus (C)Support: NIH Grant EY014999, Unrestricted Grant from Researchto Prevent Blindness, NYSTAR/CEIS, Bausch & LombProgram Number: 4267 Poster Board Number: B0304Presentation Time: 8:30 AM - 10:15 AMContribution of shape and gradient index to the sphericalaberration of donor human lensesJudith Birkenfeld, Alberto de Castro, Susana Marcos. CSIC-Institutode Optica, Madrid, Spain.Purpose: The relative contribution of crystalline lens geometry andgradient index (GRIN) to its spherical aberration (SA) and its agerelatedchanges is unknown. We investigated these relationship usingOptical Coherence Tomography (OCT) and Laser Ray Tracing(LRT).Methods: 11 ex vivo human lenses (22-71 years) from an eye bankwere imaged in 3D with a custom OCT to obtain optical pathdifferences. The shape of the lens surfaces was extracted from theimages using surface segmentation and Zernike polynomial fitting.The lens power was measured using LRT for 2 and 4-mm pupildiameters. The 3D GRIN was estimated by means of an optimizationmethod based on genetic algorithms (de Castro et al. OE 2010),which searched for the parameters of a 4-variable GRIN model thatbest fits the distorted posterior lens surface of the lens in 18 differentmeridians. The SA of the lenses was estimated by computational raytracing, assuming both a homogeneous index and the estimatedGRIN.Results: Geometrical data of all lenses were reconstructed using 3DOCT images. Anterior radius of curvature and asphericity variedwidely across lenses (6.1 to 11.3 mm, and -9.9 to 5.6, respectively),and were rather constant for the posterior surface (mean: 5 mm and -0.3, respectively). Lens power ranged from 34D (younger lens) to24D (older lens). In 10/11 lens power decreased with pupil diameter,revealing a negative spherical aberration. Lens thickness (rangingfrom 3.8 to 5.2 mm) increased and mean group refractive index(ranging from 1.392 to 1.407) decreased slightly with age. Thereconstructed GRIN showed surface refractive index values between1.368 and 1.376, nucleus refractive index values between 1.403 and1.415, and an exponential decay value ranging from 1.8 to 3.4 (axial)and from 1.9 to 5.8 (meridional). The estimated SA (from lensgeometry and index) ranged from -0.8 to 0.3 µm for the equivalentrefractive index, and from -2.1 to -0.3 µm for the estimated GRIN.SA shifted with age towards less negative values (slope=0.028 µm/yrand 0.022 µm/yr assuming equivalent index or GRIN, respectively).Conclusions: 3D OCT data and experimental power data of humandonor lenses of different ages allowed reconstruction of the lensGRIN and evaluation of external geometry and GRIN contribution tothe lens spherical aberration. GRIN shifted the SA towards negativevalues in all cases and played a role in the age-related shift of SA.Commercial Relationships: Judith Birkenfeld, None; Alberto deCastro, None; Susana Marcos, Essilor (F), PCT/ES2012/070185 (P)Support: FIS2008-02065, FIS2011-25637 (Spanish Government)and ERC 2011 Advanced Grant 294099 (European ResearchCouncil) to SM, CSIC JAE Program Fellowship to JB.Program Number: 4268 Poster Board Number: B0305Presentation Time: 8:30 AM - 10:15 AMCrystalline lens thickness determines transverse chromaticaberrationYun Chen, Frank Schaeffel. Section of neurobiology of the Eye,Institute for Ophthalmic Research, Tuebingen, Germany.Purpose: To describe the magnitude and variability of transversechromatic aberration (TCA) in the human eye, and to identify theocular parameters that might determine its magnitude.Methods: Two different psychophysical procedures were used toquantify TCA. First, a red and a blue square, presented on a blackscreen, had to be matched in size by the subjects with their right eyes,using the arrow keys on keyboard. Second, two filled red or bluesquares, flickering on top of each other at 2 Hz, had to be adjusted inbrightness and in size to minimize the perceived flicker by subjects.Biometric ocular parameters in the right eyes were measured with acommercially available low coherence interferometer, the Lenstar LS900 (Haag Streit, Switzerland). Corneal power, thickness, anteriorchamber depth, lens thickness, vitreous chamber depth and axiallength were correlated to psychophysical date. Sixteen subjects withno ocular pathologies other than refractive errors, with ages rangingfrom 22 to 58 years, participated in the study.Results: TCA varied widely among subjects, as was evident from theperceived differences between the red and the blue square whichranged from 0 to 3.2%. The two different psychophysical proceduresto measure TCA provided highly correlated results, suggesting thatno major confounders existed. The measurements of TCA wereaffected neither by changes in brightness of the blue or red nor byindividual refractive errors. Comparing to optical parameters in thesubjects’ eyes, only lens thickness was significantly correlated toTCA (p
<strong>ARVO</strong> 2013 Annual Meeting Abstracts by Scientific Section/Group – <strong>Visual</strong> <strong>Psychophysics</strong> / <strong>Physiological</strong> <strong>Optics</strong>Presentation Time: 8:30 AM - 10:15 AMPrediction of human crystalline lens power and sphericalaberration using an anatomically-based discrete shell modelFabrice Manns 1, 2 , Arthur Ho 3, 4 , Jean-Marie A. Parel 1, 5 .1 Ophthalmic Biophysics Center, Bascom Palmer Eye Inst, Univ ofMiami, Miami, FL; 2 Department of Biomedical Engineering,University of Miami College of Engineering, Coral Gables, FL;3 Brien Holden Vision Institute, Sydney, NSW, Australia; 4 School ofOptometry and Vision Science, University of New South Wales,Sydney, NSW, Australia; 5 Vision Cooperative Research Centre,Sydney, NSW, Australia.Purpose: To develop an anatomically-correct aspheric discretemodel of the human crystalline lens that predicts power and sphericalaberration and the contribution of the refractive index gradient.Methods: A continuous and a discrete model of a 30 year old relaxedhuman lens were developed. The shape was modeled using data fromDubbelman et al (Vis Res, 2001): Ant Radius=11.10mm; AntAsphericity=-3.05; Post Radius = -5.82mm; Post Asphericity=-0.795;Thickness=3.69mm. In the continuous model, the refractive indexgradient is represented as a set of aspheric iso-indicial surfaces withradius of curvature R(z) and asphericity Q(z) that vary linearly fromthe lens equator to the value at the surface. The axial refractive indexfollows a power-dependence in each half of the lens (Kasthuriranganet al, IOVS 2008): n(z)=1.41-0.032×(z/t) 4 , where t is the anterior orposterior half-thickness and z is the distance, both measured from theequator. The discrete shell model was created by sampling isoindicialsurfaces of the continuous model at regularly spacedintervals. The ith shell of a model with K shells has thicknesst K =t lens /K, is located at position z i = i*t K , radius R i =R(z i ), asphericityQ i =Q(z i ), and is surrounded by refractive indices n i-1 =n(z i-1 ) andn i =n(z i ). The number of shells ranged from K=6 to K=3000. Thecontribution of each surface to lens power and Seidel primaryspherical aberration was calculated from a paraxial ray trace. Thecontributions were plotted as a function of axial position and summedto provide the Seidel wavefront aberration coefficient W 040 , and totalpower contribution P sum . The power P sum was compared to theeffective power P eff .Results: The spherical aberration coefficient and lens powerconverge as the number of shell increases. The asymptotic valueswere W 040 =0.053mm -3 , P sum =22.2D, and P eff =22.3D. For lens power,the number of shells required to reach 90%, 95% and 99% of theasymptote are 20, 40, and 200. For spherical aberration the values are160, 320, and approx. 1000. The contributions of the anterior andposterior halves of the lens were -0.015mm -3 and 0.068mm -3 .Conclusions: The power and spherical aberration of the crystallinelens can be predicted using a discrete model with tightly packedshells.The discrete model allows calculation of contributions ofspecific regions of the lens to total spherical aberration from aparaxial ray trace.Commercial Relationships: Fabrice Manns, None; Arthur Ho,None; Jean-Marie A. Parel, CROMA (F), InnFocus (F), Abeamed(F), University of Miami (P)Support: NIH Grants R01EY14225, R01EY021834, and CenterGrant P30EY14801; Australian Government CRC Scheme (VisionCRC); Florida Lions Eye Bank; an unrestricted grant from Researchto Prevent Blindness; Henri and Flore Lesieur Foundation (JMP).Program Number: 4270 Poster Board Number: B0307Presentation Time: 8:30 AM - 10:15 AMAge-related Stiffening of Human Lens Measured by In VivoBrillouin MicroscopySebastien Besner 1, 2 , Giuliano Scarcelli 1, 2 , Roberto Pineda 3 , Seok H.Yun 1, 2 . 1 Department of Dermatology, Harvard Medical School,Boston, MA; 2 Wellman Center for Photomedicine, MassachusettsGeneral Hospital, Boston, MA; 3 Department of Ophthalmology,Massachusetts Eye and Ear Infirmary, Boston, MA.Purpose: The loss of accommodation power with age is thought tobe related to the increase of the stiffness of the crystalline lens. Morerecently, evidences have shown that the change in the stiffnessgradient may also play a dominant role in accommodation amplitude.In order to investigate the contribution of lens sclerosis to loss ofaccommodation with age, we present a novel optical, non-contact andnon-destructive method based on Brillouin scattering, whichmeasures the local elastic modulus of the crystalline lens in vivo withmicron size resolution.Methods: Brillouin confocal microscopy was performed on 5 dilatedeyes (2.5% phenylephrine and 0.5% tropicamide) of 5 patients withan age range of 23 to 47 years. The Brillouin spectral shift, which isproportional to the longitudinal modulus of elasticity, was acquiredalong the optical axis of the crystalline lens with an axial resolutionof about 60 microns and a lateral resolution of less than 10 microns.Ongoing study will include 10 eyes from 10 patients with age rangingbetween 20 and 60 years.Results: At all ages, the elastic modulus was found to increase fromthe lens cortex to the nucleus with a general steeper increase in theposterior part of the lens. The overall lens stiffness was found toincrease with age (p
<strong>ARVO</strong> 2013 Annual Meeting Abstracts by Scientific Section/Group – <strong>Visual</strong> <strong>Psychophysics</strong> / <strong>Physiological</strong> <strong>Optics</strong>Support: NIH grant P41-EB015903, NSF grant CBET-0853773 ,Harvard Clinical and Translational Science Center (NIH UL1-RR025758), American Society for Laser Medicine and SurgeryProgram Number: 4271 Poster Board Number: B0308Presentation Time: 8:30 AM - 10:15 AMEffect of Temperature on Lens Power, Anterior and PosteriorSurface Lens Curvatures and Force during SimulatedAccommodation in Cynomolgus MonkeysJean-Marie A. Parel 1, 3 , Bianca M. Maceo 1, 2 , Cornelis J. Rowaan 1 ,Fabrice Manns 1, 2 , Esdras Arrieta 1 . 1 Ophthalmic Biophysics Center,Bascom Palmer Eye Institute, Univ. of Miami Miller School ofMedicine, Miami, FL; 2 Biomedical <strong>Optics</strong> and Laser Laboratory,Dept of Biomedical Engineering, College of Engineering, Universityof Miami, Miami, FL; 3 Vision Cooperative Research Centre, Sydney,NSW, Australia.Purpose: To determine whether temperature has an effect on theaccommodative response of primate lenses during simulatedaccommodation in a lens stretcher.Methods: Lens shape was measured during ex vivo simulatedaccommodation on 4 cynomolgus monkey (4.5-6.9 years) lenses from4 donors (PMT 9.5+/-11 hours). Tissue samples were mounted in theEVASII lens stretching system (Ehrmann et al, Clin Exp Opt, 2008)and stretched in a step-wise fashion (0.25mm/step up to 2.5mmradially). In EVAS II, the tissue is immersed in preservation medium(DMEM) throughout the experiment. A temperature controller withthermocouple feedback was used to control the temperature of themedium. For each lens, a stretching experiment was first performedat 24°C (room temperature). At the end of the experiment, thetemperature of the medium was increased to 35°C (oculartemperature). A second stretching experiment was then performed.The power, anterior and posterior curvatures, and thickness of thelens, and the force exerted to stretch the lens were measured at eachstep at both temperatures. The change in lens power, thickness, radiusand the maximum force produced at the two temperatures werecompared.Results: At 25°C, the average+/-SD of the change was 19.5+/-2.1Dfor lens power, 0.58+/-0.09mm for lens thickness, -2.54+/-0.74 forlens anterior radius; -0.94+/-0.12mm for lens posterior radius. Themaximum force was 1.50+/-0.22g. At 35°C, the average+/-SD of thechange was 18.1+/-2.7D for lens power, 0.57+/-0.09mm for lensthickness, -2.46+/-0.86mm for lens anterior radius; -0.91+/-0.29mmfor lens posterior radius. The maximum force was 1.30+/-0.26g.Conclusions: Within the range of temperatures tested in this study(25-35°C), temperature does not have significant effect on thechanges in lens shape, power and force during simulatedaccommodation in a lens stretcher.Commercial Relationships: Jean-Marie A. Parel, CROMA (F),InnFocus (F), Abeamed (F), University of Miami (P); Bianca M.Maceo, None; Cornelis J. Rowaan, None; Fabrice Manns, None;Esdras Arrieta, NoneSupport: NIH Grant R01EY14225, R01EY021834, F31EY021444(NRSA Individual Predoctoral Fellowship [BM]), and Center GrantP30EY14801; Australian Government CRC Scheme (Vision CRC);FloridaLions Eye Bank; an unrestricted grant from Research toPrevent Blindness; Henri and Flore LesieurFoundation (JMP)Program Number: 4272 Poster Board Number: B0309Presentation Time: 8:30 AM - 10:15 AMLens Spherical Aberration Changes in Cynomolgus Monkeysduring Simulated Accommodation in a Lens StretcherBianca M. Maceo 1, 2 , Fabrice Manns 1, 2 , Alberto de Castro 3 , StephenUhlhorn 1 , Esdras Arrieta 1 , Susana Marcos 3 , Jean-Marie A. Parel 1, 4 .1 Ophthalmic Biophysics Center, Bascom Palmer Eye Institute,Miami, FL; 2 Biomedical <strong>Optics</strong> and Laser Laboratory, Department ofBiomedical Engineering, University of Miami College ofEngineering, Coral Gables, FL; 3 Instituto de Óptica, ConsejoSuperior de Investigaciones Científicas, Madrid, Spain; 4 VisionCooperative Research Centre, Sydney, NSW, Australia.Purpose: To quantify the difference in spherical aberration (SA) ofcynomolgus monkey lenses in the accommodated andunaccommodated state.Methods: A Laser Ray Tracing system (LRT) was used to obtain SAmeasurements on 2 cynomolgus monkey lenses from 2 donors (4.5and 6.9 years, PMT= 4 and 26 hours). The tissue was mounted in achamber filled with Dulbecco's Modified Eagle Medium inside a lensstretcher (Ehrmann et al, Clin Exp Opt, 2008). The lens sphericalaberration was measured in the unstretched (accommodated) andstretched (relaxed) state. The LRT delivered 51 equally-spacedparallel rays along the vertical meridian of the lens over a total lengthof 6mm. A camera mounted on a vertical position stage was placedunder the chamber containing the lens to sequentially record the spotcorresponding to each individual ray. Spot images were measured atup 12 camera positions along the optical axis covering a range of upto 22mm. The images were processed to determine the centroid ofeach spot and calculate the corresponding ray height at each cameraposition. For each camera position, the measured ray heights wereplotted as a function of entrance ray height and fit with a 3rd orderpolynomial: y = A*x + B*x 3 . The A and B coefficients were thenplotted as a function of camera position and a linear fit wasperformed. The effective focal length and Seidel spherical aberrationcoefficient were extracted from the fits. A ray-trace analysis showedthat the posterior window of the chamber contributes less than 1%error to the SA coefficient. Therefore the contribution of the windowto spherical aberration was not corrected for.Results: The results for the two lenses are summarized in the tablebelow:Conclusions: Spherical aberration in cynomolgus monkey lensesincreases in absolute value with accommodation, as found in humanand rhesus monkeys.Commercial Relationships: Bianca M. Maceo, None; FabriceManns, None; Alberto de Castro, None; Stephen Uhlhorn, None;Esdras Arrieta, None; Susana Marcos, Essilor (F),PCT/ES2012/070185 (P); Jean-Marie A. Parel, CROMA (F),InnFocus (F), Abeamed (F), University of Miami (P)Support: NIH Grant R01EY14225, R01EY021834, F31EY021444(NRSA Individual Predoctoral Fellowship [BM]), and Center GrantP30EY14801; Australian Government CRC Scheme (Vision CRC);Florida Lions Eye Bank; an unrestricted grant from Research toPrevent Blindness; Henri and Flore Lesieur Foundation (JMP),Spanish Government FIS2011-25637, European Research CouncilERC-2011-AdG-294099; CSIC I3P Program.Program Number: 4273 Poster Board Number: B0310Presentation Time: 8:30 AM - 10:15 AMComparison between in vivo and in vitro age-related loss ofaccommodation in rhesus monkeysMark Wendt, Adrian Glasser. College of Optometry, University ofHouston, Houston, TX.©2013, Copyright by the Association for Research in Vision and Ophthalmology, Inc., all rights reserved. Go to iovs.org to access the version of record. For permissionto reproduce any abstract, contact the <strong>ARVO</strong> Office at arvo@arvo.org.
<strong>ARVO</strong> 2013 Annual Meeting Abstracts by Scientific Section/Group – <strong>Visual</strong> <strong>Psychophysics</strong> / <strong>Physiological</strong> <strong>Optics</strong>Purpose: The progressive age related loss of accommodation inrhesus monkeys has been studied in vivo or with in vitro mechanicalstretching to simulate disaccommodative changes in enucleated eyes(in vitro accommodation). No prior study had directly compared thetwo approaches with the same eyes. Here a direct comparison is madebetween the age-related in vivo loss of accommodation in rhesusmonkeys and in vitro mechanical stretching induceddisaccommodative changes in the same eyes after enucleation.Methods: Experiments were performed on 10 iridectomizedmonkeys aged between 10 and 25 years. Accommodation wasstimulated with intravenous (i.v.) pilocarpine and refraction measuredstatically with a Hartinger coincidence refractometer and dynamicallywith infrared photorefraction. In one subsequent i.v. pilocarpineexperiment with each monkey, accommodative changes in lensdiameter were measured dynamically. Following euthanasia one eyeeach from nine of the monkeys was dissected and stretched radiallystep-wise while measuring changes in lens focal length and diameterto attempt to achieve the largest changes possible.Results: In vivo accommodative amplitudes decreased linearly withage from 12.38 D to 3.38 D (n = 10; r 2 = 0.9097; p < 0.0001) andaccommodative decrease in lens diameter decreased linearly with agefrom 0.703 mm to 0.327 mm (n = 9; r 2 = 0.8097; p = 0.0009). In vitroaccommodative change in lens power decreased linearly with agefrom 16.9 D to 6.16 D (n = 9; r 2 = 0.8805; p = 0.0001) and in vitroaccommodative change in lens diameter decreased linearly with agefrom 1.43 mm to 0.73 mm (n = 9; r 2 = 0.62; p < 0.0009). In vitroaccommodation with the maximum radial stretch overestimated invivo accommodation on average by 2.94 ±1.604 D without opticalcompensation for ocular optical effects. In vitro accommodativechanges in lens diameter with the maximum radial stretchoverestimated the in vivo accommodative changes in lens diameter by0.65 ± 0.083 mm.Conclusions: Maximum change in power and diameter that lensesundergo with stretching overestimates the in vivo accommodativechanges in optical power and lens diameter. Both in vivo and in vitroaccommodation in the same eyes of rhesus monkeys show a similarprogressive age-related loss of accommodation. Since in vitroaccommodation does not rely on ciliary muscle function, thissupports a lenticular basis for presbyopia in rhesus monkeys.Commercial Relationships: Mark Wendt, None; Adrian Glasser,NoneSupport: NEI Core Grant P30 EY007551 to UHCOProgram Number: 4274 Poster Board Number: B0311Presentation Time: 8:30 AM - 10:15 AMAge-related loss of accommodation in rhesus monkeys isassociated with an age-related increase in lens stiffnessAdrian Glasser, Mark Wendt. College of Optometry, University ofHouston, Houston, TX.Purpose: It is generally agreed that presbyopia in humans is causedby an age-related increase in lens stiffness. Rhesus monkeys developpresbyopia with a similar relative age-course as humans and are usedas an animal model for human presbyopia, although prior studieshave suggested differences in the aetiology of presbyopia betweenhumans and monkeys. Here, the age-related loss of accommodationfrom in vivo and in vitro experiments is correlated with the stiffnessof the same lenses to ascertain the relationship between presbyopiaand lens stiffness in rhesus monkeys.Methods: Experiments were performed on 10 iridectomized rhesusmonkeys aged between 10 and 25 years. Accommodation wasstimulated with intravenous pilocarpine and refraction measured witha Hartinger and infrared photorefraction and accommodative changesin lens diameter measured with slit-lamp videography. Aftereuthanasia, one eye each from nine monkeys was used formechanical stretching experiments in which changes in lens focallength and lens diameter were measured as a function of the appliedradial stretch. Lenses were then isolated and squeezed in six 100 µmsteps while measuring the applied force.Results: In vivo accommodative amplitudes decreased linearly withage (r 2 = 0.9097; p < 0.001) and accommodative change in lensdiameter decreased linearly with age (r 2 = 0.8097; p < 0.001). Withmechanical stretching the lens power and lens diameter curves foreach lens plateaued and the maximum changes in lens power anddiameter from all lenses decreased linearly with age (r 2 = 0.8805; p
<strong>ARVO</strong> 2013 Annual Meeting Abstracts by Scientific Section/Group – <strong>Visual</strong> <strong>Psychophysics</strong> / <strong>Physiological</strong> <strong>Optics</strong>asymmetrical terms of the WAs were found. The accommodativeresponses had an implicit time of 2 to 6 sec and an amplitude of 1 to2 diopters. The implicit times were slower than that in humans (0.4second, F. W. Campbell, 1960) and the cat’s response to electricalstimulation of the LS area (1.0 second, K. Ohtsuka, 1996). After thestimulation, accommodation decreased slowly to the original statetaking >10 sec. The latencies of the accommodative responses werealways shorter than the detection limit (
<strong>ARVO</strong> 2013 Annual Meeting Abstracts by Scientific Section/Group – <strong>Visual</strong> <strong>Psychophysics</strong> / <strong>Physiological</strong> <strong>Optics</strong>damage to cells; 2) optical microscopy of the scleral tissue, clearedwith a 40% glucose solution after laser irradiation; and 3) mechanicalinstrument probing to simulate the insertion of PSI implants.Results: Optical microscopy of cleared sclera showed explicitsubsurface disruption when irradiated with microjoule-energy pulsesat 1030nm wavelength. The efficacy of tissue separation wasdemonstrated by inserting a 1mm-wide blunt probe along tunnels of3-4mm length. Histological assessment continued to showimprovement in accuracy and consistency of the ablated tissue planeas the irradiation parameters were refined.Conclusions: Given the challenges that scleral tissue presents as anoptical medium, our preliminary parametric trials of scleralsubsurface femtosecond laser ablation on ex-vivo porcine areencouraging. These early results suggest that currently availablerefractive femtolaser platforms might be adapted for the creation ofPSI tunnels. In-vivo animal experiments are necessary to assess theclinical viability of the procedure.Commercial Relationships: Aghapi mordovanakis, Refocus Group(F); Larry Baitch, Refocus Group (E)Support: Support from Refocus Group (Dallas, TX)Program Number: 4279 Poster Board Number: B0316Presentation Time: 8:30 AM - 10:15 AMElectro-optic lens for correction of presbyopiaGuoqiang Li, Thomas F. Mauger. Depts of Ophthal and Vis Sci andECE, Ohio State University, Columbus, OH.Purpose: A large population on the planet needs correction of nearvision with aging. To overcome the disadvantages of the existingeyeglasses for correction of presbyopia based on area division, it isvery attractive to develop tunable electro-optic lens with highimaging quality and large aperture. In this technique, the power canbe continuously adjusted by a small voltage across the wholeaperture.Methods: By incorporating nanotechnology and cost-effectivemicrofabrication technology, we have designed and fabricatedtunable liquid crystal lenses with large aperture and large tunablerange needed for correction of presbyopia. To our knowledge, this isthe first demonstration of such a powerful device. The nanoparticlesdoped in the liquid crystals provide excellent alignment of the liquidcrystals and this property eliminates the alignment layer on thesurface of the microsturctured element.Results: We have designed and fabricated a tunable liquid crystallens with large aperture (over 20 mm), large tunable range (over 3diopters) and low driving voltage. The lens shows high opticalquality. These lenses have been used to build the prototypes ofadaptive spectacles and visual simulator. Vision test results will beshown.Conclusions: The electro-optic tunable lenses with large aperture andlarge tunable range are promising for vision correction and visionassessment.Model eye imaging. Left, adaptive lens off; right, adaptive lens on.Commercial Relationships: Guoqiang Li, The Ohio StateUniversity (E); Thomas F. Mauger, NoneSupport: NIH/NEI grant R01 EY020641Program Number: 4280 Poster Board Number: B0317Presentation Time: 8:30 AM - 10:15 AMTolerance to astigmatism with a small aperture corneal inlayAbhiram S. Vilupuru 1 , Juan Tabernero 2 , Pablo Artal 2 . 1 R&D,AcuFocus, Inc, Irvine, CA; 2 Universidad de Murcia, Murcia, Spain.Purpose: Small aperture corneal inlays are used to extend depth offocus in presbyopic patients. <strong>Visual</strong> outcomes depend on residualrefractive error. While the impact of defocus was already studied(Tabernero & Artal, JCRS, 2011), we expanded their study toinvestigate how much uncorrected astigmatism can be tolerated witha small aperture corneal inlay.Methods: We developed 20 computational eye models using datafrom corneal topography, ocular axial lengths and wavefrontaberrations taken in 20 healthy presbyopic subjects (mean age 59years, standard deviation 7 years). The axial length was adjusted torender all eyes to be at best focus (emmetropia). A small aperture of1.6 mm of diameter was placed at the corneal plane. The pupil of theeye was set to 3 mm of diameter. Astigmatism was induced in stepsof 0.25 D (axis 90°) by placing a cylindrical lens at 15 mm from thecorneal axis and then the eye’s modulation transfer function (formonochromatic light of 550 nm) was obtained for every eye from 0 Dup to 3 D of induced astigmatism. The spatial frequency thatcorresponded to a modulation value of 0.2 (along the orthogonaldirection to the axis of the astigmatism) was used as an image qualitymetric and calculated in every eye with and without the smallaperture.Results: With the small aperture implanted in the cornea, the cut-offfrequencies increased significantly for all values of inducedastigmatism. On average for the 20 eyes, if 1 D of astigmatismremained uncorrected for a pupil diameter of 3 mm (whichcorresponds to a 0.2 cut-off frequency of 0.22 decimal visual acuityunits) then the equivalent value with the small aperture inlayimplanted is obtained at 1.9 D (i.e. an increasing of 0.9 D of toleranceto astigmatism). For a different uncorrected threshold value ofastigmatism, for instance to 0.5 D, then the tolerance with the smallaperture would double up to 1 D. Since the inlay is actually anannulus (external diameter of 3.8 mm), this tolerance would be lowerin those subjects with pupil diameters significantly larger than 4 mm.Conclusions: The retinal image quality in eyes implanted with asmall aperture corneal inlay to extend depth of focus is affected bythe remaining uncorrected astigmatism. Although there is anindividual variability due to the particular eye’s aberrations, thepresence of the small aperture approximately doubles the typicaltolerance to astigmatism.Commercial Relationships: Abhiram S. Vilupuru, AcuFocus (E);Juan Tabernero, None; Pablo Artal, AMO (C), Voptica SL (P),Voptica SL (I), AMO (F), Calhoun Vision (F), Calhoun Vision (C),AcuFocus (C)Support: FIS2010-14926 CSD2007-00013 4524/GERM/06Program Number: 4281 Poster Board Number: B0318Presentation Time: 8:30 AM - 10:15 AMDistribution of Achromatizing Pupil Positions and First PurkinjeReflections in a Normal PopulationSilvestre Manzanera 1 , Juan Tabernero 1 , Antonio Benito 1 , Abhiram S.Vilupuru 2 , Pedro M. Prieto 1 , Pablo Artal 1 . 1 Laboratorio de Optica,University of Murcia, Murcia, Spain; 2 R&D, AcuFocus, Irvine, CA.©2013, Copyright by the Association for Research in Vision and Ophthalmology, Inc., all rights reserved. Go to iovs.org to access the version of record. For permissionto reproduce any abstract, contact the <strong>ARVO</strong> Office at arvo@arvo.org.
<strong>ARVO</strong> 2013 Annual Meeting Abstracts by Scientific Section/Group – <strong>Visual</strong> <strong>Psychophysics</strong> / <strong>Physiological</strong> <strong>Optics</strong>Purpose: Quality of vision in patients with small aperture cornealinlays to correct for presbyopia depends on its proper centration. Inpractice, the inlay is positioned on the 1 st Purkinje image but if thislocation is far from the foveal achromatic axis, a significanttransverse chromatic aberration could degrade retinal images. Wedeveloped a new instrument to simultaneously measure both the 1 stPurkinje image and the intersection of the achromatic axis with thepupil plane.Methods: The apparatus records images of the eye’s pupil and the 1 stPurkinje reflection when illuminated with a semicircle of infraredLEDs. In addition, a liquid crystal spatial light modulator produces asmall aperture conjugated to the subject’s pupil plane with a locationthat can be controlled by the subject. Subjects perform a Vernier-typealignment task by moving a 1-mm aperture over the eye’s naturalpupil to align a red target to a blue grid. Both the positions of the 1 stPurkinje reflection and the achromatic axis intersection aredetermined simultaneously. Series of data in 33 eyes with a range of+/- 4 D refractive errors were obtained.Results: For each subject the procedure was repeated 10 times. Thestandard deviation in the measurements was below 0.18 and 0.04 mmfor the achromatic axis and 1 st Purkinje positions respectively. Theaverage location of the achromatizing pupil, relative to the subject’snatural pupil, was: x = 0.29 ± 0.19 mm (nasal); y = 0.09 ± 0.19 mm(superior). These values should be compared to the average locationof the 1 st Purkinje image: x = 0.34 ± 0.19 mm; y = 0.07 ± 0.07 mm.Considered individually, the two positions were statistically differentin 8 and 16 eyes for the horizontal (x) and vertical (y) directionsrespectively. The differences in the two locations were smaller than0.4 mm for both directions in all the measured eyes.Conclusions: We have designed and built a new instrument thatallows to measure simultaneously both the locations of the 1 stPurkinje image and the achromatic axis intersection with the pupilplane. On average, both locations coincide within the measurementerrors. Although there is individual variability, the maximumdifferences in location did not exceed 0.4 mm in any eye. This valueshould induce a modest amount of transverse chromatic aberration,indicating that centration of the inlay on the 1 st Purkinje image shouldbe adequate for most patients.Commercial Relationships: Silvestre Manzanera, AMO (F), CIBAVision (F), CALHOUN (F), VOPTICA (I); Juan Tabernero, None;Antonio Benito, None; Abhiram S. Vilupuru, AcuFocus (E); PedroM. Prieto, AMO (F), AcuFocus (F), Voptica SL (I), Voptica SL (P);Pablo Artal, AMO (C), Voptica SL (P), Voptica SL (I), AMO (F),Calhoun Vision (F), Calhoun Vision (C), AcuFocus (C)Support: Supported by the Ministerio de Ciencia e Innovación,Spain (grants FIS2010-14926 and CSD2007-00013) and FundaciónSéneca (Región de Murcia, Spain), grant 4524/GERM/06 &AcuFocus.Program Number: 4282 Poster Board Number: B0319Presentation Time: 8:30 AM - 10:15 AM<strong>Visual</strong> Simulation of Retinal Images with Various Designs ofPinhole Contact Lenses using Ray Tracing SoftwareKazuno Negishi 1 , Yasuyo Nishi 1 , Kazuhiko Ohnuma 2 , KazuoTsubota 1 . 1 Department of Ophthalmology, Keio Univ School ofMedicine, Shinjuku-Ku, Japan; 2 Graduate School of Engineering,Chiba Univesity, Chiba, Japan.Purpose: To determine the optimal design of pinhole contact lenses(PCLs) without refractive power to obtain a full range of vision fromfar to near using ray tracing software.Methods: We used five PCL designs in this study: design 1, a 2-mmcentral clear zone with a 6-mm opaque zone; design 2, five randomlypositioned clear zones 2 mm in diameter in the 8-mm opaque zone;design 3, eight randomly positioned clear zones 2 mm in diameter inthe 8-mm opaque zone. Simulated retinal images with the PCLs at 5and 0.3 meter were obtained using an optical design software and aLiou & Brennan eye model with an 8-mm corneal diameter, a 3-mmpupil diameter, a -1.0-diopter refraction, and a 555-nm wavelength.The modulation transfer functions (MTFs) also were calculated ineach condition.Results: Among the three designs, design 3 performed the best.Conclusions: Our results suggested that a PCL without refractivepower might be useful to obtain a full range of vision from far to nearif designed optimally, and the central clear zone may not always benecessary for a PCL.Commercial Relationships: Kazuno Negishi, Oculentis (F);Yasuyo Nishi, None; Kazuhiko Ohnuma, None; Kazuo Tsubota,AcuFocus, Inc (C), Allergan (F), Bausch Lomb Surgical (C),Functional visual acuity meter (P), JiNS (P), Kissei (F), Kowa (F),Santen, Inc. (F), Otsuka (F), Pfizer (C), Thea (C), Echo Denki (P),Nidek (F), Ophtecs (F), Wakasa Seikatsu (F), CEPT Company (P)Support: 2011FY NEDO Innovation Promotion Program 0822001Program Number: 4283 Poster Board Number: B0320Presentation Time: 8:30 AM - 10:15 AM<strong>Visual</strong> Simulation of Retinal Images with Various Designs ofPinhole Contact LensesYasuyo Nishi, Kazuno Negishi, Kazuhiro Watanabe, Yuki Hidaka,Hidemasa Torii, Megumi Saiki, Kazuo Tsubota. Ophthalmology,Keio University School of Medicine, Tokyo, Japan.Purpose: To determine the optimal design of pinhole contact lenses(PCL) without refractive power to obtain a full range of vision fromfar to near using a visual simulation system and to evaluate theoptical performance.Methods: The PCL has a central clear zone in a 6.0-mm diameteropaque zone with many minute clear zones. The total diameter andthe base curve of the PCL were 14.0 mm and 8.5 mm, respectively.The visual simulation system consists of a model eye and a chargecoupleddevice camera. The different PCLs can be placed in front ofthe model eye and evaluated. <strong>Visual</strong> simulations were performedusing this system at 5, 1, and 0.3 meters through a 3-mm apertureusing Landolt visual acuity (VA) charts with different PCLs(different sized central clear zone, 2.0, 1.8, 1.6, 1.4, and 1.2 mm;different sized minute clear zones in the opaque zone, 0.14, 0.17,0.20, and 0.23 mm). The contrast levels of the gaps of the LandoltVA charts in the simulated images were analyzed using Photoshopsoftware to determine the optimal PCL design.Results: The PCL with a 1.4-mm central clear zone and 0.17-mmclear zones in the opaque zone maintained the contrast of thesimulated images over 10% at all distances and had the bestperformance among the tested designs.Conclusions: Our results suggested that the PCL without refractivepower might be useful to obtain a full range of vision from far to nearif designed optimally.Commercial Relationships: Yasuyo Nishi, None; Kazuno Negishi,Oculentis (F); Kazuhiro Watanabe, None; Yuki Hidaka, None;Hidemasa Torii, None; Megumi Saiki, None; Kazuo Tsubota,AcuFocus, Inc (C), Allergan (F), Bausch Lomb Surgical (C),Functional visual acuity meter (P), JiNS (P), Kissei (F), Kowa (F),Santen, Inc. (F), Otsuka (F), Pfizer (C), Thea (C), Echo Denki (P),Nidek (F), Ophtecs (F), Wakasa Seikatsu (F), CEPT Company (P)Support: 2011FY NEDO Innovation PromotionProgram.0822001,Dated August 22nd,2011.432 Refractive Errors, Myopia II©2013, Copyright by the Association for Research in Vision and Ophthalmology, Inc., all rights reserved. Go to iovs.org to access the version of record. For permissionto reproduce any abstract, contact the <strong>ARVO</strong> Office at arvo@arvo.org.
<strong>ARVO</strong> 2013 Annual Meeting Abstracts by Scientific Section/Group – <strong>Visual</strong> <strong>Psychophysics</strong> / <strong>Physiological</strong> <strong>Optics</strong>Wednesday, May 08, 2013 11:00 AM-12:45 PMTCC LL 4/5 Paper SessionProgram #/Board # Range: 4549-4554Organizing Section: <strong>Visual</strong> <strong>Psychophysics</strong> / <strong>Physiological</strong> <strong>Optics</strong>Program Number: 4549Presentation Time: 11:00 AM - 11:15 AMThe impact of Spherical Aberration, Stiles Crawford Apodizationand Spatial Frequency on wavefront-based and subjectiverefractionsRenfeng Xu 1 , Arthur Bradley 1 , Larry N. Thibos 1 , Gildas Marin 2 ,Martha Hernandez 2 . 1 School of Optometry, Indiana University,Bloomington, IN; 2 Essilor International, Paris, France.Purpose: Subjective refraction is independent of pupil size even foreyes with spherical aberration (SA). We tested the popularexplanation that Stiles-Crawford apodization (SCA) biases subjectiverefraction towards the pupil center by attenuating marginal rays.Methods: Aberrometry data were used for objective wavefrontrefractions that indentify the target vergence required to maximizemetrics of image quality for varying levels and signs of SA andapodization, and a range of spatial frequencies (SFs). Subjectiverefractions for a variety of test stimuli were measured with phaseplates that controlled SA levels, and apodization filters that controlledthe Stiles-Crawford effect.Results: In the presence of SA, high SF image quality and subjectiveappearance of best focus are both achieved with a near paraxial focusirrespective of the presence or absence of pupil apodization.Optimum low SF image quality is achieved by focusing moremarginal pupil regions, and thus best focus for low SFs changes withSA levels and apodization. For letter charts used in clinical refraction,optimum retinal image quality is achieved with a sphere lens thatfocuses rays entering the eye 1- 1.5 mm from the pupil center.Conclusions: Clinical subjective refractions are independent of pupilsize because retinal image quality is maximized when rays near thepupil center are preferentially focused, independent of SCA.Removing high spatial frequencies from the visual stimulus makessubjective refractions more dependent on pupil size in the presence ofSA.Commercial Relationships: Renfeng Xu, None; Arthur Bradley,Essilor International (F); Larry N. Thibos, Essilor International (F),Vistakon Inc. (F), Vistakon, Inc. (C), Self (P); Gildas Marin, Essilorinternational (E); Martha Hernandez, Essilor International (E)Support: NIH P30EY019008, Essilor InternationalProgram Number: 4550Presentation Time: 11:15 AM - 11:30 AMImpact of Primary and Secondary Spherical Aberration onPredicted Peripheral Image QualityAmanda C. Kingston 1, 2 , Geunyoung Yoon 2 . 1 BME, University ofRochester, Rochester, NY; 2 Flaum Eye Institute, University ofRochester, Rochester, NY.Purpose: To determine the impact of sign and magnitude of primaryand secondary spherical aberration (SA) on predicted image qualityat retinal eccentricities up to 20°.Methods: An Arizona eye model was implemented in commerciallyavailable optical design software (Zemax Bellevue, WA). Radii ofcurvature, index and thicknesses were used from the model whileaxial length and crystalline lens asphericity were varied to produce aneye with zero defocus and SA. Zernike SA up to ±1.00μm over a6mm diameter was added to the anterior cornea to induce differentsigns and magnitudes of primary and secondary SA. Foveal retinalimage quality with each SA condition was optimized at distance byadjusting defocus. Wavefronts were calculated for an elliptical pupilwith a 6mm long axis, at each retinal eccentricity, using Zemax.Through-focus peripheral image quality, using an image-convolutionbased image quality metric was done with a custom Matlab program.Measured outcomes were retinal image quality, refractive error anddepth of focus (DOF) as a function of retinal eccentricity.Results: For all eccentricities, negative primary SA inducedhyperopic defocus whereas positive primary SA and zero SA inducedmyopic defocus. Peak image quality with zero SA was higher than alleyes with SA, and maintained the same magnitude of myopic shift asprimary SA (0.25D and 1.50D at 10 and 20°, respectively). DOF wasextended with increasing magnitude of primary SA for alleccentricities compared to the zero SA case. Positive secondary SAinduced hyperopic defocus at all eccentricities, whereas negativesecondary SA induced myopic defocus. Secondary SA gives asecondary peak image quality instead of single focus found withprimary SA. This secondary peak is in the hyperopic direction forpositive SA and myopic direction for negative SA. Increasing themagnitude of secondary SA degraded image quality by 26-35% forall eccentricities. Decreasing the magnitude of secondary SA to -0.10μm increased image quality while still maintaining myopicdefocus.Conclusions: Positive primary and negative secondary SA yieldacceptable foveal image quality while maintaining myopic defocus atall eccentricities. Inducing optimal primary and secondary SA of theeye with an advanced ophthalmic lens manipulates the amount ofrefractive defocus and depth of focus in the peripheral retina,potentially providing the ability to control myopia progression.Commercial Relationships: Amanda C. Kingston, Bausch &Lomb (E); Geunyoung Yoon, Bausch & Lomb (F), Johnson &Johnson (F), Allergan (C), Staar Surgical (C), CIBA Vision (F),Acufocus (C)Support: Research to Prevent Blindness (RPB)Program Number: 4551Presentation Time: 11:30 AM - 11:45 AMPeripheral Wavefront Aberrations of Accommodating HumanEyeTao Liu, Larry N. Thibos. School of Optometry, Indiana University,Bloomington, Bloomington, IN.Purpose: Retinal image quality in the peripheral visual field isthought to contribute to visual control of eye growth and myopiaprogression. The contribution of spherical aberration is of particularinterest because accommodation typically causes a sign reversal thatcan have a large impact on accommodative lag and image quality.Thus we aimed to measure spherical aberration in central andperipheral visual field as a function of accommodative demand.Methods: A scanning Shack-Hartmann wavefront aberrometer (Wei& Thibos, 2010 Opt Express 18: 1134) was employed to measureocular aberrations along 37 different lines-of-sight over the central 26degree visual field in 30 seconds. Aberrations were measuredsequentially using light reflected from a small spot produced on thefundus by an incident probe beam that pivoted around the center ofthe eye’s entrance pupil. Scanning mirrors that steered the incidentprobe beam also de-scanned the reflected light into a fixed wavefrontsensor. Accommodation was stimulated over the range 0-6D by anacuity target in a Badal configuration. Target and room illuminationwas reduced to promote pupil dilation. Spherical aberrationcoefficients C40 (primary) and C60 (secondary) for ellipticallyforeshortened pupils (Wei & Thibos, 2010, Optom Vis Sci 87, E767-777) describe ocular wavefront error over a fixed, 6mm circleconcentric with the eye’s pupil.Results: Primary spherical aberration varied significantly in sign andmagnitude over the visual field but always changed in the negative©2013, Copyright by the Association for Research in Vision and Ophthalmology, Inc., all rights reserved. Go to iovs.org to access the version of record. For permissionto reproduce any abstract, contact the <strong>ARVO</strong> Office at arvo@arvo.org.
<strong>ARVO</strong> 2013 Annual Meeting Abstracts by Scientific Section/Group – <strong>Visual</strong> <strong>Psychophysics</strong> / <strong>Physiological</strong> <strong>Optics</strong>direction during accommodation. For 6D of accommodation, changesin C40 ranged from 0.1 to 0.4 microns RMS, with larger valuesoccurring for larger eccentricities. These changes are much largerthan the population mean values reported previously (Mathur,Atchison, & Charman, 2009. J Vis 9, 20 21-11). This discrepancymay be due to several factors, including individual variation, durationof measurement sequences, and the problematic interpretation ofaberration coefficients obtained over elliptical pupils. Unlike C40,secondary spherical aberration C60 was typically positive and did notvary significantly with accommodationConclusions: Spherical aberration in peripheral vision changessignificantly during accommodation, which may provide a potentialclue for visual control of eye growth.Commercial Relationships: Tao Liu, None; Larry N. Thibos,Essilor International (F), Vistakon Inc. (F), Vistakon, Inc. (C), Self(P)Support: NIH grant R01-EY05109Program Number: 4552Presentation Time: 11:45 AM - 12:00 PM1 Changes in Ocular Biometrics and Refraction during NearWork in Downward Gaze over TimeAtanu Ghosh, Michael J. Collins, Brett A. Davis, Scott A. Read, FanYi, Payel Chatterjee. School of Optometry and Vision Science,Queensland University of Technology, Brisbane, QLD, Australia.Purpose: To investigate changes in the characteristics of the cornealoptics, total optics, anterior biometrics and axial length of the eyeduring a near task, in downward gaze, over 10 min.Methods: Ten emmetropes (mean - 0.14 ± 0.24 DS) and 10 myopes(mean - 2.26 ± 1.42 DS) aged from 18 to 30 years were recruited. Tomeasure ocular biometrics and corneal topography in downwardgaze, an optical biometer (Lenstar LS900) and a rotating Scheimpflugcamera (Pentacam HR) were inclined on a custom built, height andtilt adjustable table. The total optics of the eye were measured indownward gaze with binocular fixation using a modified Shack-Hartmann wavefront sensor. Initially, subjects performed a distanceviewing task at primary gaze for 10 min to provide a “wash-out”period for prior visual tasks. A distance task (watching video at 6 m)in downward gaze (25°) and a near task (watching video on aportable LCD screen with 2.5 D accommodation demand) in primarygaze and 25°downward gaze were then carried out, each for 10 minin a randomized order. During measurements, in dichoptic view, aMaltese cross was fixated with the right (untested) eye and theinstrument’s fixation target was fixated with the subject’s tested lefteye. Immediately after (0 min), 5 and 10 min from thecommencement of each trial, measurements of ocular parameterswere acquired in downward gaze.Results: Axial length exhibited a significant increase with downwardgaze and accommodation over time (p
<strong>ARVO</strong> 2013 Annual Meeting Abstracts by Scientific Section/Group – <strong>Visual</strong> <strong>Psychophysics</strong> / <strong>Physiological</strong> <strong>Optics</strong>later myopic shift in 3- to 14-year-old children with IET.Methods: Eye length (right eye) was measured with a Haag-StreitLenstar in 40 children with infantile ET. Five measurements wereobtained at the fovea and at 10° and 20° on the temporal retina. Foroff-axis measurements, children fixated a dim mini-LED affixed tothe instrument. Distance refraction (right eye) was obtained for thesame 3 locations with a Grand Seiko binocular autorefractor with thechild fixating letter targets.Results: At 3-4 and 5-6 years old, children with IET had mean±serefractive error of +3.63±0.61D and +3.81±0.43D, respectively, andaxial length of 21.4±0.3mm and 21.2±0.2mm, respectively.Peripheral eye length was 0.2-0.4 mm longer than axial length,consistent with oblate ocular shape. Peripheral refraction was -0.84 to-0.91D more myopic relative to foveal refraction. At 7-8 years, meanhyperopia was lower (+2.66±0.67D) and axial length longer(22.1±0.2mm). In this age group, peripheral eye length was shorterthan axial length by 0.1-0.3 mm; i.e., eyes were less oblate in shape.By 9-14 years, mean hyperopia was again lower at +1.54±0.76D andaxial length longer at 23.1±0.5mm; eyes were even less oblate(peripheral eye length was 0.2-0.4 mm shorter than axial length). Inthe older age groups peripheral refraction remained slightly myopic (-0.1 to -0.2D) relative to foveal refraction.Conclusions: Hyperopia in IET is associated with oblate eye shape.While the putative “stop” signal of relative peripheral myopia ispresent in younger eyes, the older eyes are significantly longer andsignificantly less oblate at 7-14 years of age, just as the childrenexperience a myopic shift. The possibility that some eyes can growrapidly to become less hyperopic despite inhibitory peripheraldefocus requires longitudinal confirmation.Commercial Relationships: Eileen E. Birch, None; Simone Li,None; Sarah E. Morale, None; Reed M. Jost, None; VidhyaSubramanian, None; Donald O. Mutti, NoneSupport: NIH grant EY022313467 <strong>Visual</strong> Functions in AMDWednesday, May 08, 2013 2:45 PM-4:30 PMExhibit Hall Poster SessionProgram #/Board # Range: 5017-5042/A0179-A0204Organizing Section: <strong>Visual</strong> <strong>Psychophysics</strong> / <strong>Physiological</strong> <strong>Optics</strong>Program Number: 5017 Poster Board Number: A0179Presentation Time: 2:45 PM - 4:30 PMPreliminary assessment of a new device to test potential visualacuity when compared to gold standard PAMElizabeth R. Richter, Jan A. Kylstra. Storm Eye Institute, MedicalUniversity of South Carolina, Charleston, SC.Purpose: Assess a newly-developed potential visual acuity devicecompared with the gold standard Guyton-Minkowski PotentialAcuity Meter (PAM)Methods: The rationale for potential acuity assessment is todetermine if vision loss is due solely to cataract or due to other ocularpathology. The current gold standard is the Guyton-Minkowski PAM.This method has several problems, including high cost and difficultyin use. The physician cannot see the projected chart on the retina andhas to rely on patient cooperation. When this method is unsuccessful,the cause of failure may result from true retinal pathology ordifficulties with equipment use.We have developed a new device (the SCALE) which combinescurrent indirect ophthalmoscopy with a 20 diopter lens andtransparent ETDRS-style eye chart. The virtual image of the retina isformed 5cm in front of the lens, and in this same plane the eye chartis held. This allows the physician to directly project the eye chartonto the patient's retina while the practitioner also views the patient'sretina to make sure the image is directed on the macula. This is thefirst comparison study to determine the ability of visual acuitymeasurement when compared to the current gold standard in 23patients with preoperative cataracts. After conversion to logMARacuity, paired t-test was used to compare differences amongst thedata. The goal of this study was to determine ease of use andcorrelation with other accepted methods.Results: Of 23 eyes, only one patient was unable to see letters oneither device. Another subject was unable to see anything on thePAM device (>20/800), but could see one line (20/252) with theSCALE. Analysis of the other patients yielded a significantdifference between the visual acuities measured by these twopotential acuity methods (t(20)=3.4916, p=0.00230). The mean PAMlogMAR acuity was 0.551 (SD=0.384), while the SCALE showed a0.335 acuity (SD=0.246); this is approximately 2-line increase on theETDRS chart.Conclusions: The SCALE is another method to assess potentialacuity. From preliminary study, it appears to overestimate visualacuity when compared to the gold standard PAM. However, this newdevice may be an excellent and inexpensive addition to the precataracttoolkit to assess retinal function. Further studies are neededto assess post-surgical acuity to determine if this is a good estimatorof prospective surgical outcome.Commercial Relationships: Elizabeth R. Richter, US ProvisionalApplication No. 61/653,171 (P); Jan A. Kylstra, provisional61/653,171 (P)Clinical Trial: 00016836Program Number: 5018 Poster Board Number: A0180Presentation Time: 2:45 PM - 4:30 PMEvaluation of vision auto-testing in patients with AMD using aniPad AppMatthias G. Hartmann. Private Practice, Berlin, Germany.Purpose: Patients with age-related macular degeneration (AMD)need to undergo regular testing of their visual acuity. A tool for selfmeasurementto be run on an iPad was developed to enable patientsto have regular testing by themselves. It is available in German,English, Spanish and Japanese. This project was designed to evaluatewhether iPad-based vision auto-testing is a feasible method forpatients with AMD compared to established instruments.Methods: The project was run in 4 ophthalmologist’s offices. Targetsample size was 100 patients; only patients with an initial vision of atleast 0.05 were included. Patients had to consent to a threepart visiontest every 4 weeks for 6 months. <strong>Visual</strong> acuity was measured by a)distance vision testing by projection of Landolt rings (EN ISO 8596)b) near vision test charts (Oculus) with Landolt rings and c) automeasurementwith Landolt rings using the iPad App “Eyetest -Control your visual acuity”. Patients were initially advised how touse the iPad App. All tests were performed in the office. Test resultswere defined to be consistent when they differed to a maximum ofone line.Results: 112 patients of 57 to 92 years of age (mean 77.2 yrs) wereincluded. Nearly all patients had never used an iPad before (96% vs.4%). Results for vision tests by projection and iPad were consistent in76% (right eye) and 83% (left eye) of the measurements. Near visiontest charts were used as a control. Results acquired by near vision testcharts frequently differed from projection results by 2 or more lines.At the end of study, patients were asked for their preference. Themajority of patients (81.25%) chose the iPad App as their preferredmethod to test visual acuity, only 12.5% chose the projection method,6.25% preferred near distance test charts.Conclusions: The fact that over 80% of the patients prefer the iPad©2013, Copyright by the Association for Research in Vision and Ophthalmology, Inc., all rights reserved. Go to iovs.org to access the version of record. For permissionto reproduce any abstract, contact the <strong>ARVO</strong> Office at arvo@arvo.org.
<strong>ARVO</strong> 2013 Annual Meeting Abstracts by Scientific Section/Group – <strong>Visual</strong> <strong>Psychophysics</strong> / <strong>Physiological</strong> <strong>Optics</strong>App for vision testing illustrates the feasibility of the method. It iseasy to use even for former iPad non-users and delivers resultsconsistent with established vision testing instruments. This suggeststhat the iPad App is suitable to support patients and ophthalmologistsin the routine care of AMD. Features like an adjustable reminder anda mail function contribute to its value. The Amsler grid will beincluded and an automated distance adjustment will be implementedto further improve feasibility and reliability of the tool. Home use ofthe auto-vision App will be evaluated.Commercial Relationships: Matthias G. Hartmann, Novartis (F)Program Number: 5019 Poster Board Number: A0181Presentation Time: 2:45 PM - 4:30 PMA New Contour Integration Macular Perimetry (CIMP) on iPadfor <strong>Visual</strong> Function Evaluation in MaculopathyYi-Zhong Wang 1, 2 , Gina Mitzel 1 . 1 Retina Foundation of theSouthwest, Dallas, TX; 2 Ophthalmology, UT Southwestern MedicalCenter, Dallas, TX.Purpose: Patients with maculopathy often show early abnormalitiesoutside fovea. Such paracentral deficits may not be detected by visualfunction tests for foveal vision. In this study, a new macularperimetry based on contour integration was developed on iPad, andthe feasibility of using CIMP to detect paracentral vision loss inmaculopathy was assessed.Methods: Thirty normal subjects (mean age 51 years ± 22SD, meanvisual acuity (VA) 0.04 logMAR ± 0.08SD) and 30 patients (meanage 62±21, mean VA 0.36±0.35) with maculopathy (12 withStargardt disease, 7 diabetic maculopathy, and 11 age-related maculardegeneration) participated in the study. CIMP stimuli were circularcontour segments, and were generated on iPad screen that subtended18x23.4 deg at a viewing distance of 18”. In each trial, 4 contoursegments, each a 30 deg circular arc, were evenly placed along thecenter of the inner or outer ring of the ETDRS macular grid. Among4 segments, one was distorted and others were smooth. The distortionwas introduced by radial modulation. The stimulus duration was 0.25sec. The subject’s task was to indicate by touch which one of 4locations had distorted contour. A spatial 4-alternative, forced-choice(4AFC) staircase paradigm and a maximum likelihood fittingprocedure were employed to estimate the threshold for detectingcontour distortion in the inner or outer ring of the grid.Results: Thirty-four diseased eyes (mean VA 0.19±0.20) were ableto perform the CIMP test. Their mean thresholds to detect distortionin the inner and outer rings were -0.36±0.36 and -0.54±0.35logMAR, respectively, significantly worse than normal controls (-0.73±0.16 and -0.81±0.16, respectively, p0.16), the innerand outer ring mean thresholds were -0.36±0.39 and -0.49±0.41,respectively, also significantly worse than the normal controls(p
<strong>ARVO</strong> 2013 Annual Meeting Abstracts by Scientific Section/Group – <strong>Visual</strong> <strong>Psychophysics</strong> / <strong>Physiological</strong> <strong>Optics</strong>(C); Catherine A. Egan, Bayer (S), Oculogics (S), Novartis (S),Allergan (S), Novartis (F); Steven Dakin, NoneSupport: Supported by a Fight for Sight studentship, by MoorfieldsSpecial Trustees and by an award from the NIHR BiomedicalResearch Centre for Ophthalmology, Moorfields Eye Hospital &UCL Institute of Ophthalmology, LondonProgram Number: 5022 Poster Board Number: A0184Presentation Time: 2:45 PM - 4:30 PMScreening for AMD Using Psychophysical Correlates of MacularDysfunctionHan Li 1 , Susan M. Culican 2 . 1 Washington University School ofMedicine, St. Louis, MO; 2 Dept of Ophthalmology and <strong>Visual</strong>Science, Washington University School of Medicine, St. Louis, MO.Purpose: To assess the utility of our novel computerized vision taskas a screening tool for AMD and other macular disorders.Methods: We developed a computerized task and administered it to20 participants with AMD or other macular disorders, and 17similarly aged control participants.The task was based on participant identification of interruptions invisual stimuli. Testing was conducted monocularly. Subject distanceto the video display was determined by empirical adjustment, bypositioning the physiological blind spot at the periphery of stimuli.Stimuli consisted of a central fixation point surrounded by rotatingobjects. Objective interruptions of some objects were programmedinto the stimuli, which the participant was instructed to report bystriking a key. We hypothesized that those with macular dysfunctionwould subjectively perceive more interruptions than wereprogrammed, due to foveal and parafoveal scotomata.Results: Our results show significantly different task performancebetween those with and without macular disorders. Macular disorderparticipants reported a higher number of subjective interruptions(n=4.65 vs n=0.35, p
<strong>ARVO</strong> 2013 Annual Meeting Abstracts by Scientific Section/Group – <strong>Visual</strong> <strong>Psychophysics</strong> / <strong>Physiological</strong> <strong>Optics</strong>AS superimposed on MPCommercial Relationships: Anthony P. Cappo, Opticology, Inc.(E), Centrofuse Technologies, LLC (I), LacriSciences, LLC (I);Richard B. Rosen, Opko-OTI (C), Optos (C), Clarity (C), OD-OS(C), Topcon (R), Zeavision (F), Genetech (F), Optovue (C); WilliamH. Seiple, None; Matthew D. Orr, Opticology, Inc. (C), Opticology,Inc. (P); michele arthurs, None; Trisha Emborgo, NoneProgram Number: 5024 Poster Board Number: A0186Presentation Time: 2:45 PM - 4:30 PMSpaeth/Richman Contrast Sensitivity Test in MacularDegenerationBruno M. Faria, Fulya Duman, Mohsin Ali, Camila Zangalli, SherylS. Wizov, Lan Lu, Jesse Richman, Eric Spaeth, George L. Spaeth.Glaucoma, Bruno Faria, Philadelphia, PA.Purpose: To evaluate contrast sensitivity in age-related maculardegeneration (AMD) patients using a new contrast sensitivityinstrument.Methods: Age-related Macular Degeneration patients and controlswere prospectively evaluated using the Spaeth-Richman ContrastSensitivity (SPARCS) method and the Pelli-Robson test. Testing wasperformed monocularly in a standardized testing environment.Contrast thresholds for the central, superonasal, superotemporal,inferonasal and inferotemporal areas of vision were determined. Thecontrast sensitivity scores for each area of vision and the cumulativescores of AMD patients were compared with those of the controls.The results were analyzed with Spearman coefficients for continuousvariables and the Kruskal-Wallis test for categorical variables.Results: Fifty-four eyes with AMD and one-hundred and eightycontrol eyes completed the study. The mean SPARCS scores were54.6 for patients with AMD and 73.9 for controls (p
<strong>ARVO</strong> 2013 Annual Meeting Abstracts by Scientific Section/Group – <strong>Visual</strong> <strong>Psychophysics</strong> / <strong>Physiological</strong> <strong>Optics</strong>Methods: In this prospective study,16 patients with maculopathy andno change in VA (≤ 5 letters change in ETDRS score) and CRT (≤ 20μm in spectral-domain optical coherence tomography (SD-OCT))between 2 visits (interval: 2-6 months) were evaluated. Diseaseentities included diabetic macular edema, age related maculardegeneration, central serous retinopathy, Stargardt's disease andidiopathic macular hole.Retinal sensitivity was assessed using the Spectral-OCT/SLOmicroperimetry (MP) (Optos Inc, Scotland, UK) at both visits. Thetest pattern was a standardized polar 3 grid which consists of 28points within 11° from the fovea. The mean change and variance inretinal sensitivity for all patients was compared to the MP intersessionvariation of 10 patients with retinopathies.Results: A total of 700 points from 25 eyes (16 patients) withmaculopathy were analyzed. The mean age of subjects was 53 years(SD ±16). The results are summarized in the table. The overallvariance between the two visits (6.0dB) was significantly greater thanthe inter-session variance (2.4dB) (Mann Whitney Test, p=0.008).Conclusions: Microperimetry may capture subtle functional changesin maculopathy patients with stable visual acuity and no change incentral retinal thickness. Further studies with larger sample size areindicated to validate the observed results.decibels) was measured with fundus-tracking microperimetry. Acircular pattern of 28 test locations covering the central 11 degrees ofthe macula was used. Stimulus duration was 200ms, at an averageinterval of two seconds, and at a Goldmann III size. Fixationlocations were recorded during 20 seconds of viewing an “X.”Fixation stability was calculated by fitting a Bivariate ContourEllipse Area to these data.Results: Thickness remained stable post-treatment in half of thepatients whereas the other half demonstrated an initial drop after thefirst injection and remained stable after subsequent visits. Aqualitative assessment of OCT suggests that the integrity of the IS/OSlayer did not improve if it appeared disrupted at baseline visit.Sensitivity increased across all visits for one patient(12.5%),increased for two patients in later visits(25%), remained stable inthree patients(37.5%), decreased slightly in one patient(12.5%), andmore importantly in the last patient(12.5%). While fixation locationwas variable for all subjects, fixation stability (BCEA area) slightlyimproved in one patient(12.5%), did not change in fivepatients(62.5%), and was quite variable for two patients(25%).Conclusions: Our data suggests that thickness and sensitivity werepredictors in evaluating outcome of anti-VEGF treatment. Fixationdid not show a significant improvement in stability post-treatmentand fixation location tended to vary between visits indicating thepossibility of more than one PRL.Commercial Relationships: michele arthurs, None; Richard B.Rosen, Opko-OTI (C), Optos (C), Clarity (C), OD-OS (C), Topcon(R), Zeavision (F), Genetech (F), Optovue (C); Gennady Landa,None; Rishard Weitz, None; William H. Seiple, NoneSupport: GenentechClinical Trial: nct01255774Commercial Relationships: Hongting Liu, None; Millena G.Bittencourt, None; Owhofasa O. Agbedia, None; AhmadrezaMoradi, None; Yasir J. Sepah, None; Daniel A. Ferraz, None;Mohamed A. Ibrahim, None; Raafay Sophie, None; MehreenAnsari, None; Quan Dong Nguyen, Genentech (F), Regeneron (F),Lux Biosciences (F), Abbott (F), GSK (F), Santen (F), Santen (C),Bausch and Lomb (C), Optos (F), Heidelberg Engineering (F)Support: Wilmer Research GrantProgram Number: 5027 Poster Board Number: A0189Presentation Time: 2:45 PM - 4:30 PMMonitoring the Progression of AMD post anti-VEGF treatmentusing the OPKO OCT/SLOmichele arthurs 1 , Richard B. Rosen 3 , Gennady Landa 3 , RishardWeitz 3 , William H. Seiple 2, 3 . 1 Université de Montréal, Montréal, QC,Canada; 2 New York Lighthouse, New York, NY; 3 New York Eye &Ear Infirmary, New York, NY.Purpose: To evaluate the outcome of anti-VEGF treatment inpatients with exudative age-related macular degeneration (AMD)using the optical coherence tomography-scanning lightophthalmoscope (OCT/SLO), and to determine if predictors of anindividual patient’s responses to treatment can be identified.Methods: Patients diagnosed with exudative AMD and havingreceived no prior AMD treatment were recruited. Eight subjectsbetween 58 and 85 years of age with visual acuities ranging between20/16 and 20/200 were enrolled. Monthly treatments of ranibizumabwere given in the affected eye for up to 12 months. Three measuresof local retinal function were obtained monthly using the OPKOOCT/SLO: retinal structure (OCT), psychophysical function(microperimetry), and fixation location and stability. Integrity ofouter layers and retinal thickness were obtained with the OCT fromline scans and from 3D topographies. Psychophysical sensitivity (inProgram Number: 5028 Poster Board Number: A0190Presentation Time: 2:45 PM - 4:30 PMRelationship between <strong>Visual</strong> Function and Optical CoherenceTomography features in Early Age-related macular degeneration(AMD)-Early Markers Observational StudyRuth E. Hogg 1 , George Murphy 1 , Giovanni Staurenghi 2 , ChiaraRosina 2 , Rufino Silva 3 , Ana Rita Santos 3 , Usha Chakravarthy 1 .1 Center for Vision and Vascular Science, Queen's University Belfast,Belfast, United Kingdom; 2 Eye Clinic - Department of ClinicalScience, “Luigi Sacco”- Sacco Hospital, II School of Ophthalmology- University of Milan, Milan, Italy; 3 Faculty of Medicine., Universityof Coimbra, Coimbra, Portugal.Purpose: To investigate the relationship between visual functionparameters and tomographic metrics.Methods: Study sample: 105 patients (53 males, 52 females) withunilateral advanced AMD from 3 Centres (Milan, Coimbra andBelfast) aged 52-93 years. Study Eye=Fellow eye without advancedneovascular disease. Best corrected distance acuity (BCVA) and nearacuity (NVA), reading speed adjusted for print size (reading index;RI) and low-luminance acuity (SKILL test) were measured. Highdensity macular raster scans on the Heidelberg were obtained.Trained graders measured the neuroretinal thickness (NRT) andchoroidal thickness (CT) at the foveal centre and evaluated thecontinuity of the following layers (ganglion cell layer GCL, innersegment/outer segment junction IS/OS, external limiting membraneELM, photoreceptor layer PRL and retinal pigment epithelium RPE).Univariate and logistic regression analyses were employed toexamine relationships between function and morphology.Results: NRT was associated with BCVA (r=0.24 p=0.024); CT withreduced (SKILL score) (r=-0.4 p
<strong>ARVO</strong> 2013 Annual Meeting Abstracts by Scientific Section/Group – <strong>Visual</strong> <strong>Psychophysics</strong> / <strong>Physiological</strong> <strong>Optics</strong>(p=0.021) and Reading index (p=0.020). IS/OS junction continuitywas associated with DVA (p=0.007), NVA (p=0.03) and SKILLscore (p=0.050). Photoreceptor layer continuity was associated withReading index (p=0.039). RPE layer continuity was associated withSKILL score (p=0.003).Conclusions: Significant associations exist between stressors ofmacular visual function such as near acuity and low luminance acuityand tomographic markers of retinal and choroidal morphology.Commercial Relationships: Ruth E. Hogg, Novartis (F), Novartis(C); George Murphy, None; Giovanni Staurenghi, OcularInstruments (P), GSK (C), Novartis (C), Alcon (C), Allergan (C),Bayer (C), Roche (C), Heidelberg Engineering (C), OD-OS (C), QLT(C), Optos (C); Chiara Rosina, None; Rufino Silva, Thea (C),Novartis (C), Bayer (C), Allergan (C), Alimera (C); Ana RitaSantos, None; Usha Chakravarthy, Bayer (C), Novartis (F),Neovista (C), Oraya (F)Program Number: 5029 Poster Board Number: A0191Presentation Time: 2:45 PM - 4:30 PMRelationship between retinal sensitivity and retinal thickness ineyes with retinal diseaseSrinivas R. Sadda, Muneeswar Nittala. Ophthalmology, Doheny EyeInstitute - USC, Los Angeles, CA.Purpose: To evaluate the point-to-point relationship between localretinal sensitivity as assessed by Optos SLO microperimetry andretinal thickness and volume as determined by optical coherencetomography (OCT).Methods: Twenty four eyes of twenty four subjects with variousretinal diseases were enrolled in this IRB-approved prospective crosssectional study. Microperimetry and spectral domain opticalcoherence tomography (SD-OCT) were obtained on the study eye ofall enrolled subjects using an Optos Spectral OCT/SLO (Optos plc,Dunfermline, UK). Microperimetry was performed with the using astandard 45 stimuli pattern spread over the central 12 degrees of themacula (foveal-centered), Goldmann III stimuli, and a 4-2-1threshold strategy. The OCT-derived retinal thickness map wasregistered to the microperimetry data by the OCT instrumentallowing point-to-point correlation between retinal sensitivity andOCT thickness. Correlation analysis was performed using a total of1080 loci.Results: The mean age of the study cohort was 69 (SD; 13) years and50 % were female. Retinal diseases in the study eyes included dryand wet age related macular degeneration, diabetic retinopathy, veinocclusions, macular telangiectasia and central serouschorioretinopathy. The mean baseline best-corrected (log MAR)visual acuity was 0.26 (Snellen ~ 20/30) and the mean (± SD) totalretinal sensitivity was 13.70 (± 2.74, range: 6.0 - 16.90) dB. The logMAR visual acuity was significantly correlated with mean retinalsensitivity (r= -0.43, p=0.05), with an expected stronger correlationfor foveal sensitivity (r= -0.74, p
<strong>ARVO</strong> 2013 Annual Meeting Abstracts by Scientific Section/Group – <strong>Visual</strong> <strong>Psychophysics</strong> / <strong>Physiological</strong> <strong>Optics</strong>Methods: Fourty four eyes showing untreated nAMD were examinedwith the Heidelberg Spectralis-OCT. Pateints’ reading acuity(logRAD) was assessed using a German language reading test(Radner Lesetest), visual acuity (logMAR) was assessed usingEDTRS charts.Reading- and visual performance was evaluated with respect to thefollowing OCT-findings in the subfoveal area 500x500µm:neovascular complex (NVC), fibrovascular pigment epitheliumdetachment (fPED), serous pigment epithelium detachment (sPED),subretinal fluid (SRF), intraretinal fluid (IRF) and intraretinal cysts(IRC).Results: Of 44 eyes with nAMD mean reading acuity in logRAD was0.72 ± 0.3 and mean visual acuity in logMAR was 0.59 ± 0.28showing a strong correlation of r=0.821 spearmen (P=0,000).In general, in subfoveal NVC, the mean logRAD score was 0.84 ±0.24, whereas in NVC with additional cysts the mean logRAD scorewas 1.0 ± 0.18.With SRF, the mean logRAD was 0.58 ± 0.32, whereas with IRF themean logRAD was measured at 0.70 ± 0.35.A SPED was associated with a mean logRAD score of 0.37 ± 0.10, aFPED was associated with 0.83 ± 0.26 and FPED with additional cystrevealed a mean logRAD score of 0.92 ± 0.28.Conclusions: In nAMD, a severe deficiency in reading acuity wasobserved especially with subfoveal NVC associated with additionalcysts and fibrovascular PED overlying cysts. Morphologic changes ofthe central retina have a direct impact on reading ability.Commercial Relationships: Florian Sulzbacher, None;Christopher G. Kiss, None; Stefan Sacu, None; Marion R. Munk,None; Alexandra Kaider, None; Tamara Mittermueller, None;Philipp K. Roberts, Canon Inc. (F); Ursula Schmidt-Erfurth,Alcon (C), Bayer Healthcare (C), Novartis (C)Program Number: 5032 Poster Board Number: A0194Presentation Time: 2:45 PM - 4:30 PMDark-adapted Microperimetry In Age-related Maculopathy AndGeographic AtrophyMichael D. Crossland 1, 2 , Rola Ba-Abbad 1, 2 , Simona Degli Esposti 2 ,Adnan Tufail 2, 3 , Gary S. Rubin 1, 3 . 1 UCL Institute of Ophthalmology,London, United Kingdom; 2 Moorfields Eye Hospital NHSFoundation Trust, London, United Kingdom; 3 NIHR MoorfieldsBiomedical Research Centre for Ophthalmology, London, UnitedKingdom.Purpose: In order to evaluate the effectiveness of emergingtreatments for geographic atrophy, responsive metrics of visualfunction are required. Histological, psychophysical and questionnairedata indicate reduced rod function in age-related maculopathy (ARM)and geographic atrophy (GA). In this study we use the new test ofdark-adapted microperimetry on a cohort of patients with ARM andGA to determine the effectiveness of this test on identifying areas ofretinal abnormality.Methods: 20 patients with ARM or GA were recruited. Conventionaland dark-adapted microperimetry were performed on a modifiedmicroperimeter (MP-1S, Nidek Technologies, Italy). Perimetry mapswere registered with autofluorescence images (obtained usingSpectralis, Heidelberg Engineering, Germany; superimposed usingNavis software (Nidek Technologies, Italy)). Areas of abnormality onthe autofluorescence image were identified by an ophthalmologistmasked to microperimetry results.Results: On average, more points were not seen at the highestintensity on dark-adapted than conventional microperimetry (meannumber of points missed: conventional: 4.45, dark-adapted: 12.2;matched pairs t-test, p
<strong>ARVO</strong> 2013 Annual Meeting Abstracts by Scientific Section/Group – <strong>Visual</strong> <strong>Psychophysics</strong> / <strong>Physiological</strong> <strong>Optics</strong>Commercial Relationships: Gregory R. Jackson, MacuLogix (F),MacuLogix (I), MacuLogix (E), Genentech (R); John G. Edwards,MacuLogix, Inc (I), MacuLogix, Inc (E), MacuLogix, Inc (P),MacuLogix, Inc (S)Support: NIH Grant EY019593Program Number: 5034 Poster Board Number: A0196Presentation Time: 2:45 PM - 4:30 PMHigh Angular Resolution Peripheral Refraction in Patients withAge Related Macular DegenerationBart Jaeken 2, 1 , Encarna Alcón 1, 3 , Jose María Marín 3 , Pablo Artal 1 .1 Laboratorio de Optica, Universidad de Murcia, Murcia, Spain;2 R&D, Voptica, Murcia, Spain; 3 Oftalmología, Hospital Virgen de laArrixaca, Murcia, Spain.Purpose: The Hartmann-Shack (HS) wavefront sensor was used todetermine the peripheral refraction (PR) at specific angles in subjectswith age related macular degeneration (AMD) (Lundström et al.,Optom Vis Sci 2007). The correction of the PR in those subjectscould improve their visual acuity at eccentric locations. However,instrumentation specifically designed for accurate and fast measuringPR was never tested in those patients. Easy determination of PRcould provide those patients with customized corrections.Methods: We adapted a fast scanning peripheral HS wavefrontsensor previously developed (Jaeken et al., Opt Exp 2011). Its designmakes it possible to measure fast (order of seconds) and with a highangular resolution (1 measurement/°) a large part of a horizontalmeridian of the visual field (50°). Two fixation methods were tested:placing the target in the patient’s preferred retinal location (PRL) andhaving the PRL aligned to the center of the measuring system. Forboth applications a red laser beacon was projected on a wall at 2meter from the patient. The stability of fixation while scanning wasdetermined looking at the position of the pupil in each frame of ascan. PR (sphere and cylinder) was determined from the series ofrecorded HS images. The repeatability of 4 consecutive scans wascompared with that in normal elderly eyes. The light distributionwithin the HS spots was evaluated intra-patient between the differentretinal areas.Results: No variation in the quality of the HS images was observedbetween the areas with and without retinal damage. Smalldisplacements of the centre of the pupil were registered, although thisdid not affect the refraction results. The repeatability of the 4 scans ineyes with AMD was not different from that in normal elderly eyes. Insome subjects anomalies were observed in the HS images which arepresumed to come from a plane close to the pupil plane. Since someof the patients did not undergo cataract surgery, it probably comesfrom crystalline lens opacities. The measured PR of PRL variedamong subjects.Conclusions: An adapted scanning peripheral wavefront sensor wasfound to be a functional tool for measuring fast and accurately the PRin AMD patients. This refractive information can be useful forcustomized corrections. For example, they could benefit from acustom designed intraocular lens adjusted to their exact PR at theirPRL.Commercial Relationships: Bart Jaeken, PCT/ES2011/070640 (P);Encarna Alcón, None; Jose María Marín, None; Pablo Artal,AMO (C), Voptica SL (P), Voptica SL (I), AMO (F), Calhoun Vision(F), Calhoun Vision (C), AcuFocus (C)Support: Ministerio de Ciencia e Innovación, Spain (grantsFIS2010-14926 and CSD2007-00013) and Fundación Séneca, Regionde Murcia, Spain (grant 4524/GERM/06)Program Number: 5035 Poster Board Number: A0197Presentation Time: 2:45 PM - 4:30 PMCompensation of fixational instability by the NIDEK MP-1micro-perimeterArunkumar Krishnan, Harold E. Bedell. University of Houston -College of Optometry, Houston, TX.Purpose: Micro-perimeters are used increasingly to assess patientswith central field loss, because of the reported capability of theseinstruments to compensate for fixational eye movements and presenttest stimuli repeatably at an intended retinal location. In this study weinvestigated the precision of eye-movement compensation by theNIDEK MP-1, when the fixation instability of normal subjects isincreased by changing the size of the fixation target.Methods: Retinal sensitivity for horizontal (H) and vertical (V)traverses across one edge of the optic disc were assessed in one eyeof 7 normal subjects, aged 25-35 years. Two fixation targets werechosen to promote ‘more’ and ‘less’ stable foveal fixation,respectively: a 1 deg cross and a 10 deg circle. A customized 15 x 2element array of Goldmann size II test stimuli, each separated by 0.1deg, was positioned horizontally across the temporal disc margin orvertically across the inferior or superior disc margin. An in-built 4-2-1 strategy determined the detection threshold for each stimuluselement in the array. The MP-1 recorded the distribution of fixationpositions during testing, from which the standard deviation (SD) offixation was computed in both the H and V directions. CumulativeGaussians were fit to the threshold profiles obtained during fixationon the cross and circle and the fitted SD for the circle fixation targetwas compared to the expected value based on an additive-variancemodel. Percent compensation during fixation on the circle target wasdefined as (expected SD - observed SD) / (expected SD).Results: Average fixational SDs increased from 0.20 to 0.65 deg (H)and 0.20 to 0.72 deg (V) for fixation on the cross and circle targets,respectively. Best-fit Gaussians to the perimetric profiles had SDsthat were not significantly shallower during fixation on the circlecompared to the cross (P = 0.11 [H]; P = 0.68 [V]). The averagepercent compensation for the increase in fixation instability on thecircle target, was 91.7% (H) and 86.6% (V), corresponding to anincrease in the SD of retinal image scatter of 2.2 (H) and 3.8 (V) minarc.Conclusions: The NIDEK MP-1 compensates well for an increase infixational instability in the horizontal and vertical directions. Thiscompensation ensures that, even in subjects with unstable fixation,perimetric test stimuli are presented close to the intended retinallocations.Commercial Relationships: Arunkumar Krishnan, None; HaroldE. Bedell, NoneSupport: Minnie flaura turner fund for impaired vision research,University of Houston sVGR.Program Number: 5036 Poster Board Number: A0198Presentation Time: 2:45 PM - 4:30 PMBCEA evaluation after pattern stimulation in wet AMD patientsEnzo M. Vingolo, Paolo G. Limoli, Serena Fragiotta, Vittoria DeRosa, Daniela Domanico. UOC Ophthal Hosp "SM Goretti" LT,University La Sapienza of Rome, Roma, Italy.Purpose: age related macular degeneration is one of the main causeof visual impairment in elderly people. We studied and compared theefficacy of rehabilitation by means of two different type ofbiofeedback techniques with MP-1 microperimeter in patients withevoluted AMD.Methods: We enrolled 30 patients, mean age 76,38yrs (8,77SD)bilaterally affected by wet AMD. Patients were randomly divided intwo groups: A was treated with an acoustic biofeedback, group B wastreated with a luminous biofeedback constituted by a black and whitecheckerboard flickering during the examination. All patients©2013, Copyright by the Association for Research in Vision and Ophthalmology, Inc., all rights reserved. Go to iovs.org to access the version of record. For permissionto reproduce any abstract, contact the <strong>ARVO</strong> Office at arvo@arvo.org.
<strong>ARVO</strong> 2013 Annual Meeting Abstracts by Scientific Section/Group – <strong>Visual</strong> <strong>Psychophysics</strong> / <strong>Physiological</strong> <strong>Optics</strong>underwent a complete ophthalmological examination including: bestdistance and near visual acuity assessment, reading speed test, MP-1microperimetry evaluating BCEA. Low vision rehabilitationconsisted in 12 training sessions of 10 minutes for each eyeperformed once a week with MP-1 for both groups. Statisticalanalysis was performed using Student’s t- test.Results: After training all patients displayed an improvement invisual acuity, fixation behaviuor, retinal sensitivity and readingspeed.Group A: visual acuity was not statistically improved (p=0.054),reading speed showed statistically significant improvement(p=0.031), and a statistically significant reduction in average BCEAfixation (p=0.0023) was evidenced and a mean single point retinalsensitivity value was also improved (p=0.044).Group B: visual acuity was statistically higher (p=0.048), readingspeed showed statistically significant improvement (p=0.024), astatistically significant high reduction in BCEA (p=0.0012) wasevidenced and a mean single point retinal sensitivity value was alsoimproved (p=0.027).Conclusions: Our results show that biofeedback techniques canimprove fixation stability. Audio feedback and pattern stimulusfacilites transmission between intraretinal neurons as well as betweenthe retina and the brain, thereby probably facilitating a remappingphenomenon.Furthermore, highly informative and contrast rich pattern stimulusshowed a statistically significant difference towards uninformativeplain exercise limited to train the PRL as obtained with oldersoftware, thus indicating that it is possible with more informativetasks to reach a wider involvement of cell populations and recruitmore and more efficient ganglion cell receptive fields so to betterutilize the residual retinal function.Commercial Relationships: Enzo M. Vingolo, None; Paolo G.Limoli, None; Serena Fragiotta, None; Vittoria De Rosa, None;Daniela Domanico, NoneSupport: Sapienza C26A10NRES/2010Program Number: 5037 Poster Board Number: A0199Presentation Time: 2:45 PM - 4:30 PMThe Influence of Fixation Stability on Balance in Patients with aCentral ScotomaCaitlin Murphy 1, 4 , Janette Chu 2 , Eoghan Landy 2 , Jean-ChristopheCampbell 2 , Amy Phan 2 , Olga Overbury 1, 3 . 1 School of Optometry,University of Montreal, Montreal, QC, Canada; 2 Physiotherapy,McGill University, Montreal, QC, Canada; 3 Ophthalmology, McGillUniversity, Montreal, QC, Canada; 4 Centre for InterdisciplinaryResearch in Rehabilitation (CRIR), Montreal, QC, Canada.Purpose: Vision is second only to the vestibular system in terms ofits contribution to balance. Research has shown that visually impairedpeople (VIPs) often have problems in this domain. Some major visualdisorders damage the central retina. To compensate for the loss of afunctioning fovea, those affected use their remaining peripheral retinato accomplish daily tasks. This sometimes results in the formation ofan unstable, non-central fixation point. The purpose of this study wasto determine if reduced balance in VIPs is related to unstable fixation.Methods: Individuals with a visual acuity of 20/200 or better and adiagnosis of a retinal disorder, were recruited for this study. Therewere 44 participants (23 M and 21 F) ranging in age from 47 to 89years. Fixation stability was determined using the Mirametrix EyeTracker and participants were then divided into two groups: stablefixation and poor fixation. Functional balance was measured usingthe Timed Get-Up-and-Go (TUG) and the Berg Balance Scale (BBS).Balance confidence was assessed using the Activities-SpecificBalance (ABC) Scale. The examiners conducting the balance testswere masked to the fixation status of the participants.Results: Performance on the TUG test was significantly differentbetween the groups, with the poor-fixation group having a slowerTUG time than the stable-fixation group, t (42) = 1.7263, p < .05.Clinically, taking more than 13.5 seconds to complete the taskindicates an increased risk of falls. The poor fixation stability grouphad a mean score of 14.3 seconds. There was no significantdifference in functional balance between the stable- and unstablefixationgroups as determined by the BBS. Subjects with poorfixation stability scored lower on the ABC scale compared to thestable fixation group, t (42) = -1.856, p < .05. However, their scoreswere not low enough to have any clinical significance.Conclusions: Based on the TUG, VIPs with unstable fixation are at ahigher risk of falls compared to those with stable fixation. Althoughthere is a statistically significant difference between the two groupson the ABC scale, it is not great enough to conclude that those withpoor fixation are at risk of falls.Commercial Relationships: Caitlin Murphy, None; Janette Chu,None; Eoghan Landy, None; Jean-Christophe Campbell, None;Amy Phan, None; Olga Overbury, NoneProgram Number: 5038 Poster Board Number: A0200Presentation Time: 2:45 PM - 4:30 PMImpact of <strong>Visual</strong> Motion Displayed in a Non-Immersive Head-Mounted Device on the Balance of Patients with Age-RelatedMacular DegenerationCaroline Chauvire 1 , Coen Cecilia 1 , Arnaud Koustanai 1 , Johan LeBrun 1 , Samuel Pineau 1 , Thierry Villette 2 , Philippe Chaumet-Riffaud 1,3 , Saddek Mohand-Said 1 , Jose A. Sahel 1 , Avinoam B. Safran 1 .1 INSERM, U968; UPMC Univ Paris 06, UMR_S 968, Institut de laVision; CNRS, UMR_7210; CHNO des Quinze-Vingts, INSERM-DHOS CIC 503, Paris, France; 2 Essilor R&D International, Paris,France; 3 Univ Paris Sud, AP-HP, CHU Bicêtre, Paris, France.Purpose: Age-related Macular Degeneration (AMD) results in areduced visual acuity (VA). Head-Mounted Displays (HMD) may beuseful for affected individuals, by magnifying, freezing and draggingthe view, vertically or horizontally, to relieve from reduced field ofvision due to magnification. However, changes in image (size andmovements) are susceptible to disturb visuomotor coordination andthus to disrupt postural control. The aim of this study was to evaluatethe impact of changes in image on the balance of AMD patients,when using a non-immersive HMD.Methods: Three groups were included: 12 patients with atrophicAMD (AMDs: age between 62 and 81 years, mean 70; VA between+1.22 and +0.28 logMAR , mean +0.62), 6 older healthy subjects(OH: age between 65 and 75 years, mean 70; VA between 0 and -0.2logMAR, mean -0.04), and 5 young healthy subjects (YH: agebetween 30 and 48 years, mean 37 ; VA between +0 and -0.1logMAR, mean -0,01).Subjects stood in the dark on a stable force plate. A virtual street wasprojected onto a wall-screen. For comparison, subjects were testedwithout HMD eyes closed (EC) and eyes open (EO). When testedwith HMD, subjects wore a non-immersive binocular opto-electronicdevice, displaying an image through transparent lenses. They viewedthe scene moving successively in vertical and horizontal directionsand from one size to another. In non-immersive mode, subjectsviewed the scene both onto the wall-screen and in-motion through theHMD. In immersive mode, they only viewed the scene in-motionthrough HMD.Average velocity of center of pressure (V) was recorded. Each triallasted 51.2 s and was repeated 3 consecutive times.Results: Difference between EO and EC was greater in OH than inAMDs and YH (p
<strong>ARVO</strong> 2013 Annual Meeting Abstracts by Scientific Section/Group – <strong>Visual</strong> <strong>Psychophysics</strong> / <strong>Physiological</strong> <strong>Optics</strong>immersive mode (p 1.05), 5experienced acuity inhibition (BR < 1.05), and 9 showed equality(BR = 1 ± .05). There were no differences in the mean acuity of thebetter eye, fixation stability, or PRL distance from the fovea of thethree groups. Maximum reading speed was significantly slower (p
<strong>ARVO</strong> 2013 Annual Meeting Abstracts by Scientific Section/Group – <strong>Visual</strong> <strong>Psychophysics</strong> / <strong>Physiological</strong> <strong>Optics</strong>Institute from the vision rehabilitation unit. Patients without previousexperience of low vision optical aids use underwent a visionrehabilitation program (the IOBA-RRP). <strong>Visual</strong> (reading speed andduration, visual acuity and magnification) and psychosocialquestionnaire outcomes were recorded before and after undergoingthe 6-week training. Odds ratios (ORs) were calculated to assess thepredictive value of these variables.Results: Contrast sensitivity (OR’s: 2.94, 95% confidence intervals(CI): 0.99-8.33), age (OR’s: 0.21, 95% CI: 0.06-0.74) and GeriatricDepression Scale (GDS) score (OR’s: -2.33, 95% CI: 1.16-4.76) wereassociated with improvement in reading speed.Conclusions: Better contrast sensitivity, older age and lower GDSscores can predict success on reading fluency in CFL patients afterreading rehabilitation training.Commercial Relationships: Salvatore Di Lauro, None; Maria B.Coco, None; Alberto López-Miguel, VISIÓN I+D, SL (E); RubénCuadrado, None; Agustin Mayo, None; José Alberto De Lázaro,None; Miguel J. Maldonado, None; Joaquín Herrera, None;Laura Mena, None; Jose-Carlos Pastor, NoneSupport: RD 12/0034/0001Program Number: 5042 Poster Board Number: A0204Presentation Time: 2:45 PM - 4:30 PMDo Pedestrians Make Safe Street-Crossing Decisions?Shirin E. Hassan. School of Optometry, Indiana University,Bloomington, IN.Purpose: The aim of this study was to determine whether the streetcrossingdecisions of subjects with Age-related MacularDegeneration (AMD) are as safe as those made by young and oldersubjects with normal vision.Methods: Street-crossing decisions and crossing times in 12 AMDsubjects, 20 young and 20 older control subjects with normal visionwere measured along an unsignalized street for nine different gaptime categories. Using their habitual vision and hearing, subjectsobserved an approaching vehicle for two seconds. At the end of thetwo second period, subjects were required to make a crossingdecision of whether or not they thought it was safe to cross the street.Subjects’ crossing decisions were then objectively classified as being“safe” when the measured gap time was longer than the subject’sstreet-crossing time. The converse was true for objectivelyclassifying crossing decisions as being “unsafe”. The proportion ofsafe crossing decisions (ie. subjects reporting it was safe to cross forobjectively safe gap times) and unsafe crossing decisions (ie. subjectsreporting it was safe to cross for objectively unsafe gap times) wasdetermined for each subject group and gap time category. Ahierarchical logistic regression, with repeated measures for subject,was used to determine if the proportion of safe and unsafe decisionschanged as a function of subject group and gap time category.Results: We observed that the older normally-sighted subjects mademore unsafe crossing decisions compared to the AMD subjects forgap times that were between four and one second shorter than thetime they needed to cross the street. However, the differencesbetween these two groups were only marginally significant (p=0.06,p=0.05, p=0.04 and p=0.05 for gap times that were four, three, twoand one second shorter than subjects’ crossing times, respectively).No significant difference in the proportion of unsafe decisions werefound between the young and older normally-sighted subjects(p>0.05) and between the young normally-sighted and AMD subjects(p>0.05). No significant differences in the proportion of safe crossingdecisions were also found between the different subject groups forgap times that were longer than subjects’ crossing times (p>0.05).Conclusions: Our data suggests that older pedestrians with normalvision have a tendency to adopt a more risky crossing strategy thaneither the young normally-sighted or AMD pedestrians.Commercial Relationships: Shirin E. Hassan, None508 Improving Imaging and Ophthalmic InstrumentationThursday, May 09, 2013 8:30 AM-10:15 AMExhibit Hall Poster SessionProgram #/Board # Range: 5543-5554/B0053-B0064Organizing Section: <strong>Visual</strong> <strong>Psychophysics</strong> / <strong>Physiological</strong> <strong>Optics</strong>Program Number: 5543 Poster Board Number: B0053Presentation Time: 8:30 AM - 10:15 AMStabilized cone imaging with adaptive optics optical coherencetomographyOmer P. Kocaoglu 1 , R. D. Ferguson 2 , Zhuolin Liu 1 , Ravi S. Jonnal 1 ,Qiang Wang 1 , Daniel X. Hammer 3 , Donald T. Miller 1 . 1 School ofOptometry, Indiana University, Bloomington, IN; 2 Physical SciencesInc., Andover, MA; 3 Office of Science and Engineering Laboratories,Center for Devices and Radiological Health, Food and DrugAdministration, Silver Spring, MD.Purpose: Cone photoreceptors exhibit a complex optical signaturethat has become increasingly valuable in ophthalmologicexamination. Adaptive optics optical coherence tomography (AO-OCT) is a highly sensitive method that is particularly well suited for3D imaging the cone signature. Like all in vivo retinal imagingmethods, however, AO-OCT suffers from the effects of involuntaryeye movements that blur and distort the image, especially at the conelevel. Compensation of movement can be realized with registrationalgorithms in post processing or dynamic retinal tracking inhardware. Tracking is particularly attractive for AO-OCT as it cancompensate for eye motion larger than the imaging field of view andpermits repeated imaging of the same retinal patch. In light of theseadvantages, this study examines the efficacy of an active retinaltracker integrated into AO-OCT for cone imaging.Methods: The 2nd-generation Indiana AO-OCT system wasintegrated with a customized retina tracker module. Key AO-OCTcomponents included a broadband light source (λc=800nm,Δλ=160nm, bandpassed to Δλ=80nm), an astigmatism-free samplearm, and a high-speed linescan camera operating at 100K Alines/s.The tracker module was designed to stabilize the location of the AO-OCT beam relative to a specific retinal landmark tracked at 1060nm,and to provide a 35° field of view SLO image at 950 nm. Closed-looptracking performance was assessed by comparing cone motion in1.8°x1.8° volume videos acquired with and without dynamic retinaltracking. Videos were obtained at 4° nasal and 3° superior to thefovea of a normal subject (30 yrs). Five sessions of volume videoswere collected, each consisting of five volumes (1 vol/s). En faceprojections of the AO-OCT volumes were assessed for lateral conemotion. To avoid masking tracker performance, no post-processingregistration was applied to the videos.Results: The average maximum cone displacement was 18±5μmwith tracking compared to 150±107μm without tracking, a factor ofeight improvement. The corresponding contrast improvement in theaveraged en face cone image was 38% (p=0.008). Tracking wassufficiently robust to find repeatedly the same cone patch acrosssessions.Conclusions: Dynamic tracking stabilized AO-OCT cone images,sufficiently so for monitoring the same cones over time.Commercial Relationships: Omer P. Kocaoglu, None; R. D.Ferguson, Physical Sciences Inc (E), Physical Sciences Inc (P);Zhuolin Liu, None; Ravi S. Jonnal, 7,364,296 (P); Qiang Wang,©2013, Copyright by the Association for Research in Vision and Ophthalmology, Inc., all rights reserved. Go to iovs.org to access the version of record. For permissionto reproduce any abstract, contact the <strong>ARVO</strong> Office at arvo@arvo.org.
<strong>ARVO</strong> 2013 Annual Meeting Abstracts by Scientific Section/Group – <strong>Visual</strong> <strong>Psychophysics</strong> / <strong>Physiological</strong> <strong>Optics</strong>None; Daniel X. Hammer, Physical Sciences Inc. (C), PhysicalSciences Inc. (P); Donald T. Miller, n/a (P)Support: NEI Grants 5R01 EY014743, 1R01 EY018339,P30EY019008Program Number: 5544 Poster Board Number: B0054Presentation Time: 8:30 AM - 10:15 AMIn vivo Imaging of the Human Retinal Pigment Epithelium CellMosaic using Short-wavelength Autofluorescence andachromatizing lensesAlfredo Dubra 1, 2 , Drew H. Scoles 3 , Yusufu N. Sulai 4 .1 Ophthalmology, Medical College of Wisconsin, Milwaukee, WI;2 Biophysics, Medical College of Wisconsin, Milwaukee, WI;3 Biomedical Engineering, University of Rochester, Rochester, NY;4 The Institute of <strong>Optics</strong>, University of Rochester, Rochester, NY.Purpose: Although adaptive optics (AO) imaging of the humanretinal pigment epithelium (RPE) cell mosaic using intrinsicfluorescence has been recently demonstrated, it remains difficult toperform. This is mostly due to light safety limitations, the presence oflongitudinal chromatic aberration (LCA) in the eye and moreimportantly, its variation across individuals. This last pointcomplicates the focusing of the illumination (excitation) and theimaging (emission) channels, as they need to be adjusted for eachindividual. Here we explore the use of achromatizing lenses tomitigate this problem by compensating for the LCA that would befound in an average eye, thus bringing to closer focus the excitationand emission wavelength ranges.Methods: An AO scanning light ophthalmoscope (AOSLO) thatallows simultaneous near-infrared (NIR) and visible imaging wasmodified with achromatizing lenses in the pupil planes of theillumination and imaging paths. Images were recorded in foursubjects using a 2° field of view, 30 μW of 850 nm light forwavefront sensing, 92 μW of 790 nm light for reflectance imagingand 60 μW of 560-570 nm light for fluorescence excitation. At eachretinal location, the excitation was first brought into focus onto thephotoreceptor layer in reflectance, and then shifted towards the RPE.This was followed by simultaneous NIR reflectance and fluorescenceimaging during 60-120 seconds using a 2.5 Airy disk confocalaperture and a 625 nm central wavelength (90 nm bandwidth) in thevisible channel.Results: Imaging the photoreceptor mosaic using a broadbandexcitation light source (10 nm bandwidth) in reflectance greatlyfacilitates the focusing of the RPE imaging in fluorescence. Thecontiguous RPE cell mosaic can be visualized using safe light levelsin human subjects after recording images at multiple foci.Conclusions: RPE imaging at the cellular scale is facilitated by theuse of achromatizing lenses, although further improvement to thismethod requires accounting for inter-subject variations of LCA. Theability to visualize the RPE mosaic holds promise for studying anddiagnosing retinal degenerations such as age related maculardegeneration, as well as evaluating new therapies.RPE cell mosaic in two different human subjects, with the fluorescentsignal originating from lipofuscin containing granules (scale bars are50 μm across).Commercial Relationships: Alfredo Dubra, US Patent No:8,226,236 (P); Drew H. Scoles, None; Yusufu N. Sulai, NoneSupport: Glaucoma Research Foundation Grant Catalyst for a Curegrant, Research to Prevent Blindness Career Development Award andBurroughs Wellcome Fund CASI award.Program Number: 5545 Poster Board Number: B0055Presentation Time: 8:30 AM - 10:15 AMA novel compact optical instrument for the clinical measurementof intraocular light scatteringOnurcan Sahin 1 , Harilaos S. Ginis 2, 1 , Guillermo M. Perez 3 , Juan M.Bueno 2 , Pablo Artal 2 . 1 Institute of Vision & <strong>Optics</strong>, University ofCrete, Heraklion, Greece; 2 Laboratorio de Optica, Universidad deMurcia, Murcia, Spain; 3 Voptica SL, Murcia, Spain.Purpose: To develop a compact instrument to measure lightscattering in the human eye for angles in the range between 3 and 9degrees of visual angle.Methods: The instrument is based on a previous laboratory setupusing extended light sources in a double-pass (DP) configuration(Ginis et al., J of Vision, 2012). The light source is an array of green(528±10 nm) light emitting diodes (LEDs) spatially homogenized bylight shaping diffusers. The field is separated in 2 zones: a centralarea (corresponding to visual angles from 0 to 3 degrees (in radius)and an annular area (3 to 9 degrees). In both zones LEDs are squarewavetemporally modulated at 483 Hz and 769 Hz for the central andperipheral areas respectively. Two annular diaphragms conjugatedwith the cornea and the lens allow the projection of the source on tothe retina while leaving the central part of the pupil free of backscattered light and reflections. Light reflected from the fundus issensed through a circular diaphragm conjugated with the center of thepupil with no overlapping of the illumination and measurement paths.A pupil camera controls the alignment. The light reflected from thecentral retinal area (15-arcmin) is selected through a circulardiaphragm and a pinhole by a photodiode. The Fourier transform ofthe signal reveals the contribution of each annulus and therefore theaverage intensity of scattered light for the corresponding angles. Thetotal measurement time is 200 msec.Results: Functionality, sensitivity and repeatability of the methodwere demonstrated with an artificial eye and two different previouslycharacterized diffusers. The equivalent logarithm of the straylightparameter measured for the diffusers were 0.67 (SD=0.005) and 0.84(SD=0.003), values not statistically significantly different than theanticipated. Pilot measurements in human eyes were also obtained. Acareful analysis of the artifacts associated to alignment and refractiveerrors was also performed.Conclusions: A new compact instrument suitable for routine orclinical measurements of light scattering in the eye was developed. It©2013, Copyright by the Association for Research in Vision and Ophthalmology, Inc., all rights reserved. Go to iovs.org to access the version of record. For permissionto reproduce any abstract, contact the <strong>ARVO</strong> Office at arvo@arvo.org.
<strong>ARVO</strong> 2013 Annual Meeting Abstracts by Scientific Section/Group – <strong>Visual</strong> <strong>Psychophysics</strong> / <strong>Physiological</strong> <strong>Optics</strong>builds on previous experience with multi-wavelength, highsensitivity,imaging double-pass system for the measurement thewide-angle point-spread function of the eye.Commercial Relationships: Onurcan Sahin, None; Harilaos S.Ginis, Universidad de Murcia (P); Guillermo M. Perez, VOPTICA(E); Juan M. Bueno, None; Pablo Artal, AMO (C), Voptica SL (P),Voptica SL (I), AMO (F), Calhoun Vision (F), Calhoun Vision (C),AcuFocus (C)Support: ITN OpAL (PITN-GA-2010-264605), Ministerio deCiencia e Innovación, Spain (grants FIS2010-14926 and CSD2007-00013), Fundación Séneca (Region de Murcia, Spain), grant4524/GERM/06.Program Number: 5546 Poster Board Number: B0056Presentation Time: 8:30 AM - 10:15 AMThe Effect of AOSLO Image Distortion on Metrics of MosaicGeometryRobert F. Cooper 1 , Zachary Harvey 2 , Michael Dubow 3, 4 , Yusufu N.Sulai 5 , Alexander Pinhas 3, 4 , Drew H. Scoles 6 , Nishit Shah 3 , RichardB. Rosen 3 , Alfredo Dubra 2, 7 , Joseph Carroll 2, 8 . 1 BiomedicalEngineering, Marquette University, Milwaukee, WI;2 Ophthalmology, Medical College of Wisconsin, Milwaukee, WI;3 New York Eye and Ear Infirmary, New York, NY; 4 Mount SinaiSchool of Medicine, Mount Sinai Hospital, New York, NY; 5 TheInstitute of <strong>Optics</strong>, University of Rochester, Rochester, NY;6 Biomedical Engineering, University of Rochester, Rochester, NY;7 Biophysics, Medical College of Wisconsin, Milwaukee, WI; 8 CellBiology, Medical College of Wisconsin, Milwaukee, WI.Purpose: Adaptive <strong>Optics</strong> Scanning Light Ophthalmoscopes(AOSLOs) permit near diffraction-limited imaging of the humanphotoreceptor mosaic, though intraframe eye movements lead toimage distortion. Here, we explore the impact of these distortions ona number of metrics commonly used to characterize thephotoreceptor mosaic.Methods: We acquired 9 image sequences of the parafoveal conemosaic from 7 subjects on 3 similar AOSLOs. In another subject, weacquired an AOSLO and flood-illuminated AO image sequences ofthe same retinal location. To assess the effect of distortions withinAOSLO images, ten averaged images were produced by registeringagainst different reference frames using a previously describedalgorithm. The images were then registered with the same softwarewhile tracking the distortion applied to each image. Thephotoreceptor coordinates from the reference frame were transformedusing this distortion. Voronoi geometry, cone density, nearestneighbordistance (NND), inter-cell spacing (ICS), and regularityindex (RI) were calculated for each set of images. Repeatability wascalculated to assess the effect of intraframe distortion on thesemetrics.Results: Across the AOSLO images, we analyzed 17,942 cones, 75%of which retained the number of sides in the corresponding Voronoidomains across the 10 images (range 56%-90%). Cone density wasfound to have a repeatability of 1.8% (i.e., the difference between any2 measurements on the same subject would be less than 1.8% for95% of observations). NND and ICS had even better repeatability, at1.4% and 0.95%, respectively. In contrast, the NND RI and ICS RIhad a repeatability of 11% and 31%, respectively. Comparing anAOSLO image set to a flood-illuminated AO image, we foundsimilar repeatability (density: 2.7%, NND: 0.7%, ICS: 0.83%, NNDRI: 8.9%, ICS RI: 20.3%) and 83% of cells had retained Voronoigeometry.Conclusions: Global metrics (density and cell spacing) are minimallyaffected by intraframe distortions, whereas local metrics (regularityindex and Voronoi geometry) are more significantly affected.Intraframe distortion in AO scanning instruments limits themeasurement accuracy of mosaic geometry, thus every effort shouldbe made to choose minimally distorted reference frames.Commercial Relationships: Robert F. Cooper, None; ZacharyHarvey, None; Michael Dubow, None; Yusufu N. Sulai, None;Alexander Pinhas, None; Drew H. Scoles, None; Nishit Shah,None; Richard B. Rosen, Opko-OTI (C), Optos (C), Clarity (C),OD-OS (C), Topcon (R), Zeavision (F), Genetech (F), Optovue (C);Alfredo Dubra, US Patent No: 8,226,236 (P); Joseph Carroll,Imagine Eyes, Inc. (S)Support: RPB, NIH (UL1RR031973, EY017607, EY001931),Foundation Fighting Blindness, Alcon Research Institute, BurroughsWellcome FundProgram Number: 5547 Poster Board Number: B0057Presentation Time: 8:30 AM - 10:15 AMPhotoreceptor imaging with in-the-plane adaptive optics opticalcoherence tomography using toroidal mirrorsZhuolin Liu, Omer P. Kocaoglu, Qiang Wang, Donald T. Miller.School of Optometry, Indiana University, Bloomington, IN.Purpose: Recent technological advances in adaptive optics (AO) andhigh-resolution ophthalmoscopy have resulted in sharper images ofthe cellular retina than previously possible. As part of these ongoingdevelopments, we have re-engineered the Indiana AO-OCT system toimprove imaging performance. In this study, we assessed systemperformance for imaging the 3D structure of photoreceptors.Methods: The 2nd generation Indiana AO-OCT system is based on anovel in-the-plane design of an off-axis ophthalmic AO systemrealized with toroidal mirrors. Unlike conventional designs that relyon all spherical mirrors, the inclusion of toroidal mirrors avoidsaccumulation of system astigmatism and unwanted beamdisplacement at pupil conjugate planes. As part of the new design, theAO system was upgraded with a 97-magnetic-actuator ALPAOwavefront corrector to improve stroke and fidelity, and a Shack-Hartmann wavefront sensor configured with an Andor Neo scientificCMOS camera to improve sensitivity and speed. To assessperformance, volume images of the retina with focus at thephotoreceptor layer were acquired at retinal eccentricities rangingfrom the fovea to 6 degrees in human subjects. Power spectra werecomputed of en face images at different depths in the photoreceptorlayer. Each spectrum was radially averaged to increase signal tonoise.Results: Ray trace analysis of the in-the-plane design predictsdiffraction-limited imaging across the entire 3.6°x3.6° field of viewof the AO-OCT system. Beam displacement of less than the pitch ofthe SHWS lenslet array is also predicted, thus enabling the fullsensitivity of the SHWS to high spatial frequencies. Measured beamdisplacement and wavefront root-mean-square error of the systemconfirmed the theoretical predictions. Cone photoreceptors wereroutinely observed at retinal eccentricities as small as 0.2 degrees.This corresponds to cones narrower than that detected with theprevious Indiana AO-OCT system. Analysis of power spectra at theinner segment / outer segment junction, and posterior tip of the outersegment revealed more energy at high spatial frequencies.Conclusions: The 2nd-generation Indiana AO-OCT system providesa more detailed view of the photoreceptor optical signature than theprevious generation system.Commercial Relationships: Zhuolin Liu, None; Omer P.Kocaoglu, None; Qiang Wang, None; Donald T. Miller, n/a (P)Support: NIH R01EY018339, NIH R01EY014743, NIHP30EY019008Program Number: 5548 Poster Board Number: B0058©2013, Copyright by the Association for Research in Vision and Ophthalmology, Inc., all rights reserved. Go to iovs.org to access the version of record. For permissionto reproduce any abstract, contact the <strong>ARVO</strong> Office at arvo@arvo.org.
<strong>ARVO</strong> 2013 Annual Meeting Abstracts by Scientific Section/Group – <strong>Visual</strong> <strong>Psychophysics</strong> / <strong>Physiological</strong> <strong>Optics</strong>Presentation Time: 8:30 AM - 10:15 AMEvaluation of a Dual-Conjugate Adaptive <strong>Optics</strong> ClinicalPrototype for Retinal ImagingZoran Popovic 1 , Jörgen Thaung 1 , Bengt Svensson 2 , Mette Owner-Petersen 1 . 1 Department of Ophthalmology, University ofGothenburg, Mölndal, Sweden; 2 Exomed AB, Sollentuna, Sweden.Purpose: To investigate the applicability of a new dual-conjugateadaptive optics clinical prototype for wide-field high-resolutionadaptive optics retinal imaging in healthy volunteers and patientswith early stages of retinal disease.Methods: A new design of a compact dual-conjugate adaptive opticsclinical prototype has been built and used to image healthy volunteersand patients with early stages of retinal disease such as age-relatedmacular degeneration (AMD) and diabetic retinopathy (DR).The clinical prototype, based on the concept of dual-conjugateadaptive optics, employs five spatially separated retinal probebeacons, two magnetic deformable mirrors (DM) (ALPAO,Grenoble, France), and a multi-channel Shack-Hartmann wavefrontsensor.Monochromatic aberrations are measured and corrected over a 6 mmpupil. The five probe beacons are generated using light at awavelength of 830±10 nm from a superluminescent diode (Superlum,Cork, Ireland). A 52 actuator DM positioned in a plane conjugate tothe pupil of the eye will apply an identical correction for all fieldpointsin the field of view (FOV). A 97 actuator DM positioned in aplane conjugated to a plane inside the eye will contribute withpartially individual corrections for the five angular directions andthus compensate for non-uniform (anisoplanatic) or field-dependentaberrations. Imaging is performed over a 7x7 deg FOV using aspectrally filtered Xenon flash at a wavelength of 575±10 nm.Results: The dual-conjugate adaptive optics clinical prototypefeatures a 7x7 degree FOV and allows retinal features down to 2 μmto be resolved. A narrow depth of field of approximately 9 µm in theretina enables tomographic imaging of separate retinal layers, such asthe cone photoreceptor layer deep within the retina in AMD patients,and superficial retinal capillary layers in DR patients.Conclusions: High resolution adaptive optics retinal imaging hasenabled the vision research community to gain deeper insight into thedevelopment and progression of retinal diseases. We believe that thedual-conjugate adaptive optics clinical prototype has a futurepotential for clinical imaging with an impact particularly importantfor early diagnosis of retinal diseases, follow-up of treatment effects,and follow-up of disease progression.Commercial Relationships: Zoran Popovic, US7639369 (P),PCT/EP2012/069620 (P), EP12165365 (P); Jörgen Thaung,US7639369 (P), PCT/EP2012/069620 (P), EP12165365 (P); BengtSvensson, Exomed AB (E), PCT/EP2012/069620 (P), EP12165365(P); Mette Owner-Petersen, US7639369 (P), PCT/EP2012/069620(P), EP12165365 (P)Support: Marcus and Amalia Wallenberg's Memorial Fund GrantMAW 2009.0053, Vinnova Grant 2010-00518Program Number: 5549 Poster Board Number: B0059Presentation Time: 8:30 AM - 10:15 AMAO-OCT Retinal Imaging with 163-Segment Deformable MirrorSusanna C. Finn 1 , Cherry Greiner 1 , Nathan Doble 1 , Robert J.Zawadzki 2 , John S. Werner 2 , Stacey S. Choi 1 . 1 Vision Science, NewEngland College of Optometry, Boston, MA; 2 Ophthalmology &Vision Science, University of California Davis, Davis, CA.Purpose: Adaptive <strong>Optics</strong> (AO) has enabled vision scientists todirectly image single retinal cells in vivo. We have constructed anAO Fourier-domain Optical Coherence Tomography (AO-FD-OCT)system utilizing a high segment count microelectromechanicalsystems (MEMS) deformable mirror (DM). This DM provides muchhigher spatial correction over a 7.5mm dilated pupil (Doble et al.Applied <strong>Optics</strong> 2007), providing diffraction-limited imaging. Wedescribe retinal imaging results obtained on a range of humansubjects.Methods: An AO-FD-OCT was designed and constructed at the NewEngland College of Optometry. The AO-OCT system acquires B-scans made up of 600 A-scans at a frame rate of 60 Hz. A Superlumbroadband superluminescent diode (SLD) light source is used with acentral wavelength of 860nm and a full bandwidth of 135nm.Imaging data are post-processed and analyzed with custom Matlabsoftware. The AO system consists of a Hartmann-Shack wavefrontsensor and a 163-segment, 489-actuator Iris AO MEMS DM. TheAO-OCT is designed for a 7.5mm pupil, with 13 discrete mirrorsegments across the pupil diameter.Retinal images were obtained on normal human subjects at 4 and 10degrees in the nasal retina. The scan size for each B-scan was 0.5°,corresponding to approximately 150µm at the retina.Results: Distinct retinal layers were visible from the nerve fiberlayer, to the inner and outer photoreceptor segments, through to theretinal pigment epithelium. Moreover, individual cone photoreceptorswere clearly visible in images at 4 and 10 degrees eccentricity. Thelateral spacing of the cones was measured to be 6.4±1.5 microns at 4°nasal, and 10.4±3.8 microns at 10°. The inner segment length of thecones was found to be 32.9±5.7 microns at 4°, and 24.5±3.0 micronsat 10°. The outer segment length was correspondingly found to be26.2±1.9 microns at 4°, and 27.8±1.4 microns at 10°. These resultsare in good agreement with histology.Conclusions: The combination of AO with the use of a highersegment MEMS DM with established OCT technology has enabledus to resolve fine retinal structure unseen with conventional OCTtechnologies and promises to be highly valuable in the study ofretinal disease and injury.Commercial Relationships: Susanna C. Finn, None; CherryGreiner, None; Nathan Doble, Iris AO Inc (I); Robert J.Zawadzki, None; John S. Werner, None; Stacey S. Choi, NoneSupport: DoD Grant W81XWH-10-1-0738Program Number: 5550 Poster Board Number: B0060Presentation Time: 8:30 AM - 10:15 AMUse of multiple metrics to describe the parafoveal cone mosaicMarco Lombardo 1 , Sebastiano Serrao 1 , Pietro Ducoli 1 , GiuseppeLombardo 2, 3 . 1 Fondazione GB Bietti IRCCS, Rome, Italy; 2 CNR-IPCF Unit of Support Cosenza, Rende, Italy; 3 Vision Engineering,Rome, Italy.Purpose: To investigate the distribution of cone density and spacingas well as the preferred packing arrangement of the cone mosaic as afunction of retinal eccentricity.Methods: A flood-illumination adaptive optics retinal camera wasused to obtain images of the parafoveal cone mosaic in nineteenhealthy volunteers. Cone density and spacing were estimated for eachsubject using a sampling window of 80 x 80 pixels, at 250-, 450-,650- and 1100-um eccentricities from the fovea along the nasal andtemporal retina of both eyes. The inter-subject and intra-subjectvariation of cone density and spacing were calculated via Coefficientof Variation (CoV). Cone packing arrangement was assessed usingVoronoi analysis; calculations were done over 1024x128 pixelsimage sections of the cone mosaic across the horizontal meridianfrom 200- to 1050-um eccentricities.Results: The inter-subject variation of parafoveal cone densityranged between 10% and 15% (P
<strong>ARVO</strong> 2013 Annual Meeting Abstracts by Scientific Section/Group – <strong>Visual</strong> <strong>Psychophysics</strong> / <strong>Physiological</strong> <strong>Optics</strong>(CoV
<strong>ARVO</strong> 2013 Annual Meeting Abstracts by Scientific Section/Group – <strong>Visual</strong> <strong>Psychophysics</strong> / <strong>Physiological</strong> <strong>Optics</strong>Commercial Relationships: Takashi Yuasa, Canon Inc. (E);Futoshi Hirose, Canon Inc. (E); Kenichi Saito, Canon Inc. (E);Kazuhiro Matsumoto, CANON INC. (E); Hiraku Sonobe, CanonInc (E); Akihito Uji, None; Sotaro Ooto, None; Masanori Hangai,Topcon (F), Canon (F), Nidek (C), Topcon (C); NagahisaYoshimura, Canon (C), Canon (F), Nidek (C), Topcon (F),PCT/JP2011/073160 (P)Support: the Innovative Techno-Hub for Integrated Medical BioimagingProject of the Special Coordination Funds for PromotingScience and TechnologyProgram Number: 5553 Poster Board Number: B0063Presentation Time: 8:30 AM - 10:15 AMCompact multimodal adaptive optics imager (MAOI)R. D. Ferguson, Mircea Mujat, Ankit Patel, Nicusor Iftimia.Biomedical Imaging Group, Physical Sciences Inc, Andover, MA.Purpose: To demonstrate the imaging capabilities of a new multimodalversion of the compact Adaptive <strong>Optics</strong> Line ScanningOphthalmoscope (AOLSO). High-resolution AO imaging of theretina, capable of resolving photoreceptors and other cells andstructures in the eye, is an important new window on ocular healthand disease. A new design of the compact multi-modal AOLSO lineconfocalimager combines advantages of AOSLO with those of theAO fundus cameras for routine mapping of photoreceptor density..Methods: The new multimodal adaptive optics imager (MAOI)incorporates a number of improvements in the optical design and theAO/focus control algorithms. The AOLSO uses
<strong>ARVO</strong> 2013 Annual Meeting Abstracts by Scientific Section/Group – <strong>Visual</strong> <strong>Psychophysics</strong> / <strong>Physiological</strong> <strong>Optics</strong>cases acceptable frames of even the large field size may be difficultto obtain.Commercial Relationships: Ting Luo, None; Gang Huang, None;Toco Y. Chui, None; Stephen A. Burns, None536 Inner Retina and Blood VesselsThursday, May 09, 2013 10:30 AM-12:15 PMExhibit Hall Poster SessionProgram #/Board # Range: 6054-6066/B0065-B0077Organizing Section: <strong>Visual</strong> <strong>Psychophysics</strong> / <strong>Physiological</strong> <strong>Optics</strong>Program Number: 6054 Poster Board Number: B0065Presentation Time: 10:30 AM - 12:15 PMFuture Insights on an Ocular Hypertension Model in the WhiteLeghorn ChickenJennifer L. Choi 1 , Radouil T. Tzekov 2, 3 , Stacey S. Choi 1 . 1 NewEngland College of Optometry, Boston, MA; 2 The RoskampInstitute, Sarasota, FL; 3 Department of Ophthalmology, University ofSouth Florida, Tampa, FL.Purpose: While White Leghorn chicken (Gallus gallus domesticus)have been used to study physiological optical properties of the eyeand conditions such as myopia, there is a lack of in vivo studies thatlook at the potential of chicken as a model of ocular hypertension orglaucoma. When advanced imaging techniques are to be used in suchmodels, chicken have an advantage over rodents, having bigger eyeswith less optical aberrations. The induction of elevated IOP inchicken via anterior chamber injections of microbeads has thus beeninvestigated.Methods: Animals of both genders and varying ages (n=15:12-124days old) were subject to one of 12 combinations of anterior chamberinjections of microbeads: magnetic (4.5 µm) or non-magnetic (12µm) in one or both eyes with saline as a control. Intraocular pressure(IOP) was monitored frequently before and after injections withTonopen. In 4 out of the 17 animals A-scan ultrasound was used tomeasure ocular parameters including anterior chamber depth (ACD),lens thickness (LT), vitreous chamber depth (VCD), retinal thickness(RT) and choroidal thickness (ChT) pre and post all injections. Allbirds had isofluorane anesthesia prior to injections and ultrasound.Results: Elevation of IOP with maintenance of a clear visual axiswas successful in 2 out of 17 animals after two 70µL injections ofmagnetic microbeads (concentration 20x10 8 beads/mL). Animal#1943 was injected with 140x10 6 beads at age 51 days and with thesame amount two weeks later; 5 days later IOP was elevated 5 mmHg greater than the fellow eye for a period of 7 days. Animal #1975received an injection of 140x10 6 beads at age 99 days and 160x10 6beads at age of 110 days and an average elevation of 8mm Hg greaterthan the fellow eye was noted from day 4 to day 7 post secondinjection. In other animals injection of 98x10 6 magnetic beads at day40 and again at day 51 blocked the visual axis. Non-magneticmicrobeads (125x10 8 to 875x10 8 beads) did not elevate the IOP. Oneto 3 saline injections did not influence the growth rate of ocularparameters measured via ultrasound biometry.Conclusions: The White Leghorn chicken has potential for in vivostudies of ocular hypertension and/or glaucoma via magneticmicrobead anterior chamber injections. Studying the effects ofelevated IOP on the chicken retina over a longer time period isindicated. SD-OCT and Adaptive <strong>Optics</strong> imaging may shed furtherinsights.Commercial Relationships: Jennifer L. Choi, None; Radouil T.Tzekov, None; Stacey S. Choi, NoneSupport: NIH Grant EY007149Program Number: 6055 Poster Board Number: B0066Presentation Time: 10:30 AM - 12:15 PMDetection of flow velocity fluctuations associated with erythrocyteaggregation in diabetic retinopathy by using adaptive opticsscanning laser ophthalmoscopyAkihito Uji, Masanori Hangai, Sotaro Ooto, Shigeta Arichika,Tomoaki Murakami, Nagahisa Yoshimura. Ophthalmology, KyotoUniv Graduate Sch of Med, Kyoto City, Japan.Purpose: Adaptive <strong>Optics</strong> Scanning Laser Ophthalmoscopy (AO-SLO) has enabled noninvasive and direct monitoring of erythrocyteaggregates in the retinal capillaries. In this study, we quantified theblood flow velocity in the parafoveal capillaries of patients withdiabetic retinopathy (DR) by using the AO-SLO system prototypedeveloped by Canon Inc.Methods: Ten patients (mean age ± standard deviation [SD], 45.8 ±16.7 years) diagnosed with DR at Kyoto University Hospital (8patients with mild nonproliferative DR [NPDR], 2 patients withmoderate NPDR) and 8 control subjects without any history of ocularor systemic diseases (mean age, 34.6 ± 8.6 years) were recruited forthis study. AO-SLO videos were acquired from the temporal andnasal areas located 0.5° from the foveal center. The scan area of theretina was 1.4 × 2.8°, and scans were recorded for 4 seconds per areaat a frame rate of 64 Hz. Erythrocyte aggregates were detected as“dark tails” that were darker than the vessel shadows, and thevelocities of all the dark tails observed in both temporal and nasalareas were measured. In subjects whose pulse was measuredsimultaneously during the AO-SLO video recording, a relativecardiac cycle was assigned to each dark tail velocity in order toinvestigate the effect of cardiac pulsation on the velocities.Results: Vessels showing rapid changes in dark tail flow velocitywere noted in 6 DR patients, but these vessels were not detected innormal subjects. In these vessels, dark tail flow velocity wasextremely low and deformation of the trajectory of the dark tail flowwas depicted in the spatiotemporal image. Two such vessels werefound in 3 patients and 1 vessel was found in each of the remaining 3patients. The average velocity change in these vessels was 0.95 ±0.53 mm/s. Pulse was measured in 6 DR patients and 8 normalsubjects, and 220 dark tails were analyzed in total. The velocity of thedark tail in DR patients (1.45 ± 0.52 mm/s) was significantly higherthan that in normal subjects (1.33 ± 0.40 mm/s) (P < 0.05).Conclusions: The velocity of the dark tail in NPDR patients washigher than that in normal subjects. However, at the same time, therewere some vessels with extremely slow dark tail flow.Spatiotemporal images were useful in detecting rapid changes in darktail flow.Commercial Relationships: Akihito Uji, None; Masanori Hangai,Topcon (F), Canon (F), Nidek (C), Topcon (C); Sotaro Ooto, None;Shigeta Arichika, None; Tomoaki Murakami, None; NagahisaYoshimura, Canon (C), Canon (F), Nidek (C), Topcon (F),PCT/JP2011/073160 (P)Support: Innovative Techno-Hub for Integrated Medical BioimagingProgram Number: 6056 Poster Board Number: B0067Presentation Time: 10:30 AM - 12:15 PMAdaptive contrast enhancement in capillary shadow region ofAOSLO images using blood cell flow informationHiroshi Imamura 1 , Takashi Yuasa 1 , Hiraku Sonobe 1 , Akihito Uji 2 ,Sotaro Ooto 2 , Masanori Hangai 2 , Nagahisa Yoshimura 2 . 1 Canon Inc,Ohta-ku, Japan; 2 Ophthalmology, Kyoto University Graduate Schoolof Medicine, Kyoto City, Japan.Purpose: To improve visibility of photoreceptors in capillary shadowregion of AOSLO images using characteristics of temporal intensity©2013, Copyright by the Association for Research in Vision and Ophthalmology, Inc., all rights reserved. Go to iovs.org to access the version of record. For permissionto reproduce any abstract, contact the <strong>ARVO</strong> Office at arvo@arvo.org.
<strong>ARVO</strong> 2013 Annual Meeting Abstracts by Scientific Section/Group – <strong>Visual</strong> <strong>Psychophysics</strong> / <strong>Physiological</strong> <strong>Optics</strong>variation caused by blood cell flow.Methods: Our capillary shadow correction method consists ofdetecting abnormal frames in an AOSLO video, calculating statisticalvalues of temporal intensity variation in each pixel except theabnormal frames, and allocating the pixel value based on thestatistical values in each pixel position for producing the resultantcontrast enhanced AOSLO image. In this study, we recorded AOSLOvideos using Canon prototype AOSLO system with a high wavefrontcorrection efficiency using dual liquid crystal phase modulators. Theimaging light wavelength was 840 nm and the frame rate was 32 Hz.The scan area at the parafovea was 1.1 × 1.1° and was sampled at 400× 400 pixels. The videos were recorded for 2-5 seconds. Theproposed adaptive contrast enhancement method was applied to 15AOSLO videos for 5 healthy subjects including parafoveal capillaryregions (leukocyte preferred paths (LPPs) and plasma-gap capillaries(PGCs)) and macular arteriolovenous region. We calculated thespectral power ratio as a function of frequency between the adaptivecontrast enhanced images and conventional frame averaged imagesparticularly in LPPs, PGCs and macular arteriolovenous regions.Results: The spectral power ratio at a given frequency in LPPs andPGCs of the adaptive contrast enhanced AOSLO images were 1.62and 1.09 on average respectively, because capillary shadows werecorrected by using intensity values when leukocyte or plasma-gappasses. On the other hand, shadows in macular arteriolovenousregions were not corrected because pixel intensity was low in allframes of AOSLO video as the result of erythrocytes next to aleukocyte blocking the imaging light.Conclusions: Our method improved contrast of photoreceptors inretinal capillary shadow region of AOSLO images using blood cellflow information.Commercial Relationships: Hiroshi Imamura, Canon Inc. (E);Takashi Yuasa, Canon Inc. (E); Hiraku Sonobe, Canon Inc (E);Akihito Uji, None; Sotaro Ooto, None; Masanori Hangai, Topcon(F), Canon (F), Nidek (C), Topcon (C); Nagahisa Yoshimura,Canon (C), Canon (F), Nidek (C), Topcon (F), PCT/JP2011/073160(P)Support: the Innovative Techno-Hub for Integrated Medical BioimagingProject of the Special Coordination Funds for PromotingScience and TechnologyProgram Number: 6057 Poster Board Number: B0068Presentation Time: 10:30 AM - 12:15 PMStudy of epimacular membranes using adaptative optics highresolution imagingHassiba Bouakkaz 1 , Sarah Ayello-Scheer 1 , Alexandre Leseigneur 1 ,Celine Devisme 1 , Jose A. Sahel 1, 2 , Michel Paques 1, 2 . 1 CentreHospitalier National d'Ophtalmologie des Quinze Vingts, Paris,France; 2 Institut de la Vision, Paris, France.Purpose: High resolution imaging using adaptative optics (AO)allows an improved viewing of retinal microstructures. Here, weanalyzed the AO features of epimacular membranes (ERMs) beforeand after surgery.Methods: Seven eyes with ERM were included. For each patient, acomplete ophthalmological examination including measurement ofvisual acuity, optical coherence tomography and AO infrared floodimaging (rtx1, ImagineEye, Orsay, France) was performed. In fourpatients these exams were repeated after surgical ablation of themembrane.Results: A very precise viewing of the ERMs and of the underlyingretinal wrinkling was obtained. The ERM surface showed a myriad ofhighly reflective dots, whose reflectance varied with the lightincidence. Around ERMs, radial retinal folds were seen. The peculiaraspect of ERMs at their very beginning, which seemed to developaround vessels, could be identified. By changing focus, it waspossible in three cases to distinguish the ERM itself from theunderlying retinal wrinkling. After surgery, retinal unfolding could bedocumented.Conclusions: Specific interests of AO imaging in ERM patientscomprise the ability to identify the earliest stages of ERMs, whichseem to develop primarily around vessels, and the characterization ofthe optical properties of the ERM surface. The strong dependence ofreflectance to the angle of the incident light suggested that ERMshave a bumpy mosaic-like surface.Commercial Relationships: Hassiba Bouakkaz, None; SarahAyello-Scheer, None; Alexandre Leseigneur, None; CelineDevisme, None; Jose A. Sahel, UPMC/Essilor (P), Second Sight (F);Michel Paques, MerckSerono (C), Roche (C), Sanofi (C)Support: ANR_09_TECS_009_01_IPHOTProgram Number: 6058 Poster Board Number: B0069Presentation Time: 10:30 AM - 12:15 PMParietal morphometry of retinal arterioles in health andhypertension using adaptive opticsEdouard Koch 1, 2 , David Rosenbaumm 3 , Xavier Girerd 3 , FlorenceRossant 4 , Michel Paques 1 . 1 Clinial Investigation Center, Quinze-Vingts Hospital-INSERM, Paris, France; 2 Ophthalmology, VersaillesHospital, Versailles, France; 3 Cardiology, Pitié Salpétrière Hospital,Paris, France; 4 Institut Supérieur d'Electronique de Paris, ISEP, Paris,France.Purpose: Morphological changes affecting the wall of small retinalarteries are recognized surrogates of end-organ damage secondary toaging and/or arterial hypertension. However, direct observation of themicrovascular wall is not feasible with routine imaging techniques.We report here the quantitative analysis of the structure of retinalarterioles (~ 50-150 µm diameter) using adaptive optics (AO) nearinfrared (NIR) imaging (rtx1 camera; ImagineEyes, France) in normoand hypertensive humans.Methods: From OA images, the wall-to-lumen ratio (WLR) wascalculated using a dedicated software. We compared the WLRbetween a control group (n = 20; 30.2 ± 6 years) and a group ofhypertensive subjects (n = 30, 48.1 ± 13 years). Focal lesions(arteriolar narrowing and arteriovenous nickings) were also analyzed.These data were compared to the carotid intima-media thickness(IMT).Results: The WLR was significantly higher in the hypertensivegroup than in controls (0.35 ± 0.071 vs 0.26 ± 0.035, respectively;p=0.017) after correcting for age. The WLR of retinal arterioles wasalso positively correlated to current arterial pressure (r=0.36; p=0.03)and to IMT (p=0.028). Arteriolar narrowing, but not arteriovenousnickings, showed locally increased WLR. Follow-up of patientsunder hypotensive treatment (n=7; mean follow-up 6 months) coulddocument progressive vasodilation in two.Conclusions: Past history of arterial hypertension and current arterialpressure are both associated with increased WLR. Arteriovenousnarrowing and arteriovenous nicking show distinct parietalabnormalities and hence are probably due to distinct pathologicalprocesses. Thickening of large and small arteries are correlated,suggesting some degree of parallelism of the evolution of macro andmicrocirculatory damage. We conclude that AO imaging enables tophenotype the microcirculation with an unprecedented precision andmay improve the understanding and the management of arterialhypertension.Commercial Relationships: Edouard Koch, None; DavidRosenbaumm, None; Xavier Girerd, None; Florence Rossant,None; Michel Paques, MerckSerono (C), Roche (C), Sanofi (C)Support: ANR_09_TECS_009_01_iPhot©2013, Copyright by the Association for Research in Vision and Ophthalmology, Inc., all rights reserved. Go to iovs.org to access the version of record. For permissionto reproduce any abstract, contact the <strong>ARVO</strong> Office at arvo@arvo.org.
<strong>ARVO</strong> 2013 Annual Meeting Abstracts by Scientific Section/Group – <strong>Visual</strong> <strong>Psychophysics</strong> / <strong>Physiological</strong> <strong>Optics</strong>Clinical Trial: C10-03Program Number: 6059 Poster Board Number: B0070Presentation Time: 10:30 AM - 12:15 PMInvestigation of the correlation among diameter of retinal vesseland arteriosclerosis risk factors including hypoadiponectinemiaKei Homma 1 , Ryo Kawasaki 2 , Yusuke Tanabe 1 , Koko Saito 1 , AkiraSugano 1 , Atsushi Hozawa 3 , Katou Takeo 4 , Isao Kubota 5 , TakamasaKayama 6 , Hidetoshi Yamashita 1 . 1 Ophthalmology, Yamagata UnivSch of Medicine, Yamagata, Japan; 2 Public Health, Yamagata UnivSch of Medicine, Yamagata, Japan; 3 Tohoku Univ Sch of Medicine,Sendai, Japan; 4 Neurology,Hematology,Metabolism,Endocrinologyand Diabetology, Yamagata Univ Sch of Medicine, Yamagata, Japan;5 Cardiology,Pulmonology,and Nephrology, Yamagata Univ Sch ofMedicine, Sendai, Japan; 6 Neurosurgery, Yamagata Univ Sch ofMedicine, Yamagata, Japan.Purpose: Hypoadiponectinemia caused by visceral fat accumulationis related to hypertension, diabetes, and hyperlipidemia, and is anindependent risk factor for the arteriosclerosis.In this research, the correlation among diameter of retinal vessel andarteriosclerosis risk factors including hypoadiponectinemia wasinvestigated in the population based epidemiological study.Methods: This research was approved by the Ethics committee ofYamgatata University School of Medicine. Fundus photographs weretaken in the subjects who participated in the Takahata study andanalyzed after securing written permission from the subjects. Intotal,1473 subjects were investigated.The estimated retinal artery(CRAE:centaral retinal artery equivalent,the estimated retinal vein(CRVE:central retinal vein equivalent),andAVR (arteliole to venule ratio) were measured from the fundusphotographs used by the vessel diameter measurement dedicatedsoftware (Retinal Analysis,University of Wisconsin,Wisconsin).Characteristics to be inspected were divided into about 4groups, and the vessel diameter of an each part was analyzed.Results: Multiple linear regression analysis showed that CRAEdecreased along with systolic arterial pressure increased(-0.067μm;p=0.039).CRAE increased along with adiponectin levelincreased(0.153μm;p=0.049).CRVE increase was also associatedwith HbA1c,smoking index,and body massindex(3.333μm;p=0.004,0.004μm;p=0.023,0.412μm;p=0.007respectively).Conclusions: Hypoadiponectinemia was an independent risk factorfor CRAE decrease.The results suggest that measurement of retinalblood vessels are a good clinical marker to detect macrovasculardiseases.Commercial Relationships: Kei Homma, None; Ryo Kawasaki,None; Yusuke Tanabe, None; Koko Saito, None; Akira Sugano,None; Atsushi Hozawa, None; Katou Takeo, None; Isao Kubota,None; Takamasa Kayama, None; Hidetoshi Yamashita, Senju (C),Senju (P)Program Number: 6060 Poster Board Number: B0071Presentation Time: 10:30 AM - 12:15 PMNoninvasive Imaging of Retinal Pericytes and Endothelial Cellsin Living Human EyesToco Y. Chui, Thomas Gast, Stephen A. Burns. Optometry, IndianaUniversity, Bloomington, IN.Purpose: To image the retinal vascular pericytes and endothelialcells in living human retina using an adaptive optics scanning laserophthalmoscope (AOSLO).Methods: In vivo arteriolar wall imaging was performed on 8 healthysubjects using the Indiana AOSLO (Ferguson et al, 2010). Vesselwall imaging was performed using systematic control of the positionof a large confocal aperture (Chui et al, 2012). Peripapillary arteriesand arterioles were divided into 4 groups based on their lumendiameters (Gr 1: ≥100µm; Gr 2: 50-99µm; Gr 3: 10-49µm; Gr 4:retinal capillaries).Results: The retinal microvasculature and scattering behavior oferythrocytes were clearly visualized in all 8 subjects. On the smallervessels the pericytes were visualized as distinct cells laying along thelumen of the blood vessel. The smaller vessel pericytes bulgedoutward from the vessel wall resulting in a wall of irregularthickness. For the larger Gr 1 vessels the pericytes were much flatterand formed the outer corrugated layer of a two (or more) layeredvascular wall. While pericytes were readily seen in vessel groups 1,2, and 3, endothelial cells were only visible in Gr 1 vessels - thelargest retinal arteries. Fig 1A shows the fine structure of arteriolarwall in a Gr 1 and Gr 3 vessel. The ratio of pericytes to endothelialcells was approximately 1:1 in the Gr 1 arteries (Fig 1B). Vascularwall components were not identified in the smallest retinal capillaries(Gr 4).Conclusions: Our results show that retinal pericytes can be readilyresolved in normal subjects for arterioles with a lumen diameter>10µm. Our noninvasive imaging approach allows direct assessmentof the cellular structure of the vascular wall in vivo with potentialapplications in retinal vasculopathies such as diabetic retinopathy.Fig1 A) Fine structure of vessel wall in peripapillary arterioles.Asterisks indicate the vessel lumen of a 100µm diameter and 14µmdiameter arteriole. The inner and outer vessel wall linings of thelarger arteriole are indicated by the white arrows. Pericytes (blackarrows) are observed in a precapillary arteriole with a lumen diameterof 14µm. B) Magnified region of the white box on A. Endothelialcells (white arrows) and pericytes (black arrows) are readily seenalong the inner and outer vessel wall linings. Note the one to oneratio of endothelial cells and pericytes.Commercial Relationships: Toco Y. Chui, None; Thomas Gast,None; Stephen A. Burns, NoneSupport: NIH grants R01-EY14375, R01-EY04395, andP30EY019008Program Number: 6061 Poster Board Number: B0072Presentation Time: 10:30 AM - 12:15 PM©2013, Copyright by the Association for Research in Vision and Ophthalmology, Inc., all rights reserved. Go to iovs.org to access the version of record. For permissionto reproduce any abstract, contact the <strong>ARVO</strong> Office at arvo@arvo.org.
<strong>ARVO</strong> 2013 Annual Meeting Abstracts by Scientific Section/Group – <strong>Visual</strong> <strong>Psychophysics</strong> / <strong>Physiological</strong> <strong>Optics</strong>Adaptive <strong>Optics</strong> Measurements of Retinal Arterial WallThickness in both Normotensive and Hypertensive SubjectsJake Hillard 1 , Toco Y. Chui 1 , Dan A. Sapir 2 , Thomas Gast 1 , StephenA. Burns 1 . 1 School of Optometry, Indiana University, Bloomington,IN; 2 Medical School, Indiana University, Bloomington, IN.Purpose: To make precise measurements of vascular wall thicknessin the retinas of both systemically normotensive and hypertensiveindividuals using an adaptive optics scanning laser ophthalmoscope(AOSLO).Methods: We used the Indiana AOSLO, operated with a relativelylarge (10x the Airy disc) confocal aperture, displaced by more thanthe Airy disc radius. This imaging approach provides excellentimaging of the retinal vasculature, and gives a better visualization ofthe walls (Chui et al 2012). Images of retinal blood vessels rangingfrom capillaries to the largest retinal vessels were obtained in a groupof 6 normal subjects and 16 subjects with a history of hypertension.Vessels ranging in size from an inner diameter of 9 to 171 micronswere measured. Measurements were made using an image editingprogram and were repeated on each vessel 5 times. The lumens of thevessels were differentiated from the vessel walls by the motion oferythrocytes, within the lumens, readily seen on aligned videosequences.Results: Arterial walls and lumens were able to be measured in allsubjects and in almost all of the vessels chosen for analysis. Venouswalls were occasionally measurable in hypertensive but not in normalsubjects. Some arteries could not be measured due to shadowing orfocusing in a different plane although all tested individuals had atleast some measurable arteries. For both small arteries and arterioles(lumen diameters < 50 microns) and larger ones, the hypertensivesubjects had higher wall to lumen ratios (p< 0.02 , p
<strong>ARVO</strong> 2013 Annual Meeting Abstracts by Scientific Section/Group – <strong>Visual</strong> <strong>Psychophysics</strong> / <strong>Physiological</strong> <strong>Optics</strong>(C); Sotaro Ooto, None; Nagahisa Yoshimura, Canon (C), Canon(F), Nidek (C), Topcon (F), PCT/JP2011/073160 (P)Program Number: 6063 Poster Board Number: B0074Presentation Time: 10:30 AM - 12:15 PMIn vivo imaging of Hypertensive Retinopathy using FluorescenceAdaptive <strong>Optics</strong> Scanning Light OphthalmoscopyMichael Dubow 1, 2 , Alexander Pinhas 1, 2 , Nishit Shah 1 , Yusufu N.Sulai 3 , Patricia Garcia 1 , Nicole K. Scripsema 4 , Joseph Carroll 5 ,Alfredo Dubra 5 , Richard B. Rosen 1 . 1 New York Eye and EarInfirmary, New York City, NY; 2 Mount Sinai School of Medicine,Mount Sinai Hospital, New York City, NY; 3 University of Rochester,Rochester, NY; 4 New York Medical College, Valhalla, NY; 5 MedicalCollege of Wisconsin, Milwaukee, WI.Purpose: While hypertension affects 1 in 3 adults and 2 in 3 adultsover age 60, hypertensive retinopathy is often overlooked as animportant indicator of systemic disease. Previous studies haveexplored the relationship between hypertensive retinopathy anddiabetes, nephropathy, heart disease and cerebrovascular events.Reflectance adaptive optics scanning light ophthalmoscopy(RAOSLO) is a powerful tool in our exploration of the retina,providing access to retinal microstructure previously unavailable invivo. However, the technology has not yet been optimized to studythe microvasculature. Our group has combined AOSLO withfluorescein angiography (FAOSLO) to image patients withhypertensive retinopathy.Methods: 12 adult patients with vascular disease were recruited.Baseline RAOSLO images were collected using a 790 nm lightsource and 1° FOV. Patients then ingested 1g of fluorescein sodiummixed with juice. Starting at 15 minutes post ingestion, reflectanceand fluorescence (488nm excitation emission; emission filtercentered at 525nm; 45nm bandwidth) 1° FOV image sequences wererecorded simultaneously. Conventional fundus photography with andwithout intravenous fluorescein was performed.Results: FAOSLO revealed fine changes in the retinalmicrovasculature not seen with traditional imaging modalities andRAOSLO in all patients. We successfully imaged features ofhypertensive retinopathy present in larger vessels on the microscopicscale, including microaneurysms, hemorrhages, intravascular lesions,focal arteriolar narrowing, and vessel tortuosity.Conclusions: FAOSLO represents a promising new technology toimage features of hypertensive retinopathy with resolution previouslyattainable only through biopsy. New quantitative classificationschemas will need to be developed to describe and categorize theseabnormalities. Following patients over time will capture the evolutionof the disease, giving invaluable insight into the onset andprogression of hypertensive changes, both in the eye and throughoutthe body.Figure 1: A tortuous tertiary artery imaged on both fundus photo (A)and IV fluorescein (B). While the artery was visible on RAOSLO(C), FAOSLO revealed a focal filling defect (D, E), suggesting localconstriction or intravascular lesion.Figure 2: Variable vessel tortuosity was seen in all levels inhypertensive retinopathy.Commercial Relationships: Michael Dubow, None; AlexanderPinhas, None; Nishit Shah, None; Yusufu N. Sulai, None; PatriciaGarcia, None; Nicole K. Scripsema, None; Joseph Carroll,Imagine Eyes, Inc. (S); Alfredo Dubra, US Patent No: 8,226,236(P); Richard B. Rosen, Opko-OTI (C), Optos (C), Clarity (C), OD-OS (C), Topcon (R), Zeavision (F), Genetech (F), Optovue (C)Support: Marrus Family Foundation, Bendheim-Lowenstein FamilyFoundation, Wise Family Foundation, Chairman's Research Fund ofthe NYEEI, Research to Prevent Blindness, Burroughs WellcomeFund, Glaucoma Research FoundationProgram Number: 6064 Poster Board Number: B0075Presentation Time: 10:30 AM - 12:15 PMNormal retinal vasculature imaged using fluorescence adaptiveoptics scanning light ophthalmoscopy (FAOSLO)©2013, Copyright by the Association for Research in Vision and Ophthalmology, Inc., all rights reserved. Go to iovs.org to access the version of record. For permissionto reproduce any abstract, contact the <strong>ARVO</strong> Office at arvo@arvo.org.
<strong>ARVO</strong> 2013 Annual Meeting Abstracts by Scientific Section/Group – <strong>Visual</strong> <strong>Psychophysics</strong> / <strong>Physiological</strong> <strong>Optics</strong>Nishit Shah 1 , Michael Dubow 1, 2 , Alexander Pinhas 1, 2 , Nicole K.Scripsema 1 , Alfredo Dubra 3, 4 , Yusufu N. Sulai 6, 3 , Drew H. Scoles 5, 3 ,Richard B. Rosen 1 . 1 Ophthalmology, New York Eye and EarInfirmary, New York, NY; 2 Mount Sinai Hospital, Mount SinaiSchool of Medicine, New York, NY; 3 Ophthalmology, MedicalCollege of Wisconsin, Milwaukee, WI; 4 Biophysics, Medical Collegeof Wisconsin, Milwaukee, WI; 5 Biomedical Engineering, Universityof Rochester, Rochester, NY; 6 The Institute of <strong>Optics</strong>, University ofRochester, Rochester, NY.Purpose: To report high resolution images of retinal vasculatureusing Fluorescein Angiography (FA) with the Adaptive <strong>Optics</strong>Scanning Light Ophthalmoscope (AOSLO).Methods: 5 subjects with no retinal pathology or evidence of eyedisease were identified prior to imaging. Reflectance imaging with a790nm super luminescent diode was used to identify the vascularstructures of interest. One gram of fluorescein mixed with 4oz oforange juice was administered orally. Single-photon fluorescenceimages were then collected at the previously identified areas using a488nm solid state laser for excitation and an emission filter centeredat 525nm with a 45nm bandwidth over a 1° field of view. Imagingwas repeated at 15 minute intervals until signal extinction. 3 subjectswere also imaged after IV fluorescein administration.Results: Averaging 120 fluorescence images revealed the retinalmicrovasculature. Measurable fluorescence signal was observed asearly as 8 minutes and as late as 2 hours after administeringfluorescein orally. Although absolute fluorescence signal variedacross patients, the best images were obtained between 15 and 45minutes after administration. On the AOSLO, oral fluoresceinprovided comparable image quality to that of IV fluorescein. Time tosignal extinction with IV fluorescein was shorter, probably due toquicker redistribution of the dye. No side effects from either oral orIV administration of fluorescein were observed.Conclusions: Fluorescein angiography is an invaluable tool in themanagement of ocular disease. Coupled with AOSLO, it permits adetailed examination of the capillary bed of the inner nuclear layerwhen compared to conventional IV FA. Furthermore, FAOSLO withoral fluorescein is a safer alternative to IV angiography and providesa longer imaging time window. High resolution imaging of the retinalmicrovasculature with FAOSLO will not only help to furtherunderstand vascular micropathology but will also guide earlyintervention in management of vascular diseases.Fig 1. Retinal vasculature as seen on: A.fundus photography B.withIV Fluorescein C.magnified view of a vessel (top arrow in B)D.FAOSLO image with IV fluorescein corresponding to frame CE.magnified view of a vessel (bottom arrow in B) F.FAOSLO imagewith oral fluorescein corresponding to frame EFig 2. Comparison of mean intensity over time on averagedfluorescence imagesCommercial Relationships: Nishit Shah, None; Michael Dubow,None; Alexander Pinhas, None; Nicole K. Scripsema, None;Alfredo Dubra, US Patent No: 8,226,236 (P); Yusufu N. Sulai,None; Drew H. Scoles, None; Richard B. Rosen, Opko-OTI (C),Optos (C), Clarity (C), OD-OS (C), Topcon (R), Zeavision (F),Genetech (F), Optovue (C)Support: Marrus Family Foundation, Bendheim-Lowenstein FamilyFoundation, Wise Family Foundation, Chairman's Research Fund ofthe NYEEI, Research to Prevent Blindness, The BurroughsWellcome Fund and the Glaucoma Research FoundationProgram Number: 6065 Poster Board Number: B0076Presentation Time: 10:30 AM - 12:15 PMHistopathologic Features of Diabetic Microangiopathy ImagedUsing an Adaptive <strong>Optics</strong> Scanning Laser FluoresceinAngiographyRichard B. Rosen 1, 2 , Alfredo Dubra 3 , Rishard Weitz 1 , JosephCarroll 3 , Michael Dubow 1, 4 , Alexander Pinhas 1, 4 , Nishit Shah 1 ,Yusufu N. Sulai 3, 5 , Nicole K. Scripsema 1, 2 , Joseph B. Walsh 1, 2 .1 Ophthalmology, New York Eye & Ear Infirmary, New York, NY;2 Ophthalmology, New York Medical College, Valhalla, NY;3 Ophthalmology, Medical College of Wisconsin, Milwaukee, WI;4 Ophthalmology, Mount Sinai School of Medicine, New York, NY;5 Ophthalmology, University of Rochester, Rochester, NY.Purpose: To describe the fluorescein angiographic features ofdiabetic microangiopathy lesions imaged with an adaptive opticsscanning light ophthalmoscope (AOSLO) compared to theirappearance on conventional fundus photography and spectral domainoptical coherence tomography (SDOCT).Methods: AOSLO images (790nm; 1° degree field of view) withoutfluorescein dye were collected in 15 adult diabetic retinopathypatients to identify microvascular points of interest. Patients theningested 1gm fluorescein dye mixed in 4oz of orange juice.Simultaneous reflectance (790 nm) and fluorescence (488 nmexcitation, 503-548 nm emission) AOSLO images (1° field of view)were collected between 15 and 60 minutes post-ingestion. Forcomparison with conventional imaging techniques, fundus imagingwith and without intravenous fluorescein were performed.Results: In the fluorescence AOSLO channel we were able to©2013, Copyright by the Association for Research in Vision and Ophthalmology, Inc., all rights reserved. Go to iovs.org to access the version of record. For permissionto reproduce any abstract, contact the <strong>ARVO</strong> Office at arvo@arvo.org.
<strong>ARVO</strong> 2013 Annual Meeting Abstracts by Scientific Section/Group – <strong>Visual</strong> <strong>Psychophysics</strong> / <strong>Physiological</strong> <strong>Optics</strong>visualize microangiopathic features of diabetic microangiopathy invivo at the level of the retinal capillary bed. A number of lesionswere clearly delineated, including a variety of microaneurysms,capillary loops, IRMA, and neovascularization, which could not beseen well in the 790nm channel. These lesions typically appeared asred dots on fundus photography or bright spots on clinical fluoresceinangiography. OCT appearances were typically less distinct.Conclusions: Micro fluorescein angiography can by successfully andsafely achieved using AOSLO in diabetic patients revealing anatomicfeatures previously seen only on pathology slides. This level ofclinical imaging may prove useful for evaluating the impact oftreatment at a the microscopic scale.Figure 1. A:Segment of wide field fundus photograph demonstratingmicroaneurysms, tortuosity, and neovascularization. B:Standard widefield fluorescein angiogram with color coded frames corresponding tomicro angiographic images in figure 2. C:Corresponding SD-OCTslice through the red frame revealing microaneurysmsFigure 2. AOSLO FA images corresponding to frames in figure 1revealing details of microangiopathy including vascular loops(A,B,C) microaneurysms(A,B,C), and capillary dropout( A, B,C).Commercial Relationships: Richard B. Rosen, Opko-OTI (C),Optos (C), Clarity (C), OD-OS (C), Topcon (R), Zeavision (F),Genetech (F), Optovue (C); Alfredo Dubra, US Patent No:8,226,236 (P); Rishard Weitz, None; Joseph Carroll, Imagine Eyes,Inc. (S); Michael Dubow, None; Alexander Pinhas, None; NishitShah, None; Yusufu N. Sulai, None; Nicole K. Scripsema, None;Joseph B. Walsh, NoneSupport: Marrus Family Foundation, Chairman's Research Fund ofthe New York Eye and Ear Infirmary, Bendheim-Lowenstein FamilyFoundation, Wise Family FoundationProgram Number: 6066 Poster Board Number: B0077Presentation Time: 10:30 AM - 12:15 PMMicroangiopathic Features of Central Retinal Vein OcclusionImaged Using Fluorescence Adaptive <strong>Optics</strong> Scanning LightOphthalmoscopyAlexander Pinhas 1, 2 , Nishit Shah 1 , Michael Dubow 1, 2 , Mitul Mehta 1 ,Patricia Garcia 1 , Nicole K. Scripsema 1, 3 , Joseph Carroll 4, 5 , YusufuN. Sulai 6 , Alfredo Dubra 4, 7 , Richard B. Rosen 1 . 1 Ophthalmology,New York Eye and Ear Infirmary, New York, NY; 2 Mount SinaiSchool of Medicine, New York, NY; 3 New York Medical College,Valhalla, NY; 4 Ophthalmology, Medical College of Wisconsin,Milwaukee, WI; 5 Cell Biology, Neurology and Anatomy, MedicalCollege of Wisconsin, Milwaukee, WI; 6 The Institute of <strong>Optics</strong>,University of Rochester, Rochester, NY; 7 Biophysics, MedicalCollege of Wisconsin, Milwaukee, WI.Purpose: Central retinal vein occlusion (CRVO) remains a commoncause of vision loss in retinal vascular disease, second only todiabetic retinopathy. Fluorescein angiography (FA) has remained thegold standard for confirming its diagnosis and assessing the degree ofretinal nonperfusion, macroangiopathic change and macroscopicresponse to treatment. The high transverse resolution of adaptiveoptics scanning light ophthalmoscopy (AOSLO) has allowed for invivo study of retinal micropathology, but has been limited in itscapability to image retinal microvasculature. Here, we demonstratethe use of fluorescence AOSLO (FAOSLO) for imaging microscopicangiopathic features of CRVO.Methods: Reflectance AOSLO (RAOSLO) images (790nm; 1° fieldof view) were collected in five adult CRVO patients to identifymicrovascular points of interest. Patients then ingested 1g fluoresceindye. Simultaneous RAOSLO and FAOSLO images were thencollected between 15 and 60 minutes post-ingestion. Thefluorescence channel used a 488nm light for excitation; and, anemission filter centered at 525nm with a 45nm bandwidth. Forcomparison with conventional imaging techniques, Topcon fundusimaging with and without IV fluorescein was performed.Results: The combination of RAOSLO and FAOSLO enabled us tovisualize CRVO microangiopathic features in vivo in the finestcapillaries of the retinal inner nuclear layer. Among the featuresvisualized were vessel wall thickening, microaneurysms,neovascularization and hemorrhage. FAOSLO showed the full extentand detail of microangiopathy, as opposed to RAOSLO andconventional fundus photography.Conclusions: We believe that the clinical role of FAOSLO hassignificant potential. Comparison with motion contrast-basedtechniques remains to be evaluated. We believe that coupled withRAOSLO and a method to analyze microangiopathic featuresquantitatively, FAOSLO will lead to a better understanding of CRVOpathophysiology, disease progression and a more comprehensivemethod in monitoring tissue response to different treatmentmodalities.©2013, Copyright by the Association for Research in Vision and Ophthalmology, Inc., all rights reserved. Go to iovs.org to access the version of record. For permissionto reproduce any abstract, contact the <strong>ARVO</strong> Office at arvo@arvo.org.
<strong>ARVO</strong> 2013 Annual Meeting Abstracts by Scientific Section/Group – <strong>Visual</strong> <strong>Psychophysics</strong> / <strong>Physiological</strong> <strong>Optics</strong>Fig 1. Fine capillary microaneurysms were seen (C, D) that were notappreciated on either conventional imaging (A, B) or RAOSLO.Fig 2. RAOSLO was better at visualizing hemorrhage (B) and vesselwall thickening (D), whereas FAOSLO was better at outlining theintravascular space and visualizing capillaries of finest caliber (C, E).Commercial Relationships: Alexander Pinhas, None; Nishit Shah,None; Michael Dubow, None; Mitul Mehta, None; PatriciaGarcia, None; Nicole K. Scripsema, None; Joseph Carroll,Imagine Eyes, Inc. (S); Yusufu N. Sulai, None; Alfredo Dubra, USPatent No: 8,226,236 (P); Richard B. Rosen, Opko-OTI (C), Optos(C), Clarity (C), OD-OS (C), Topcon (R), Zeavision (F), Genetech(F), Optovue (C)Support: Marrus Family Foundation, Bendheim-Lowenstein FamilyFoundation, Wise Family Foundation, Chairman's Research Fund ofthe NYEEI, Research to Prevent Blindness, the Burroughs WellcomeFund and the Glaucoma Research Foundation©2013, Copyright by the Association for Research in Vision and Ophthalmology, Inc., all rights reserved. Go to iovs.org to access the version of record. For permissionto reproduce any abstract, contact the <strong>ARVO</strong> Office at arvo@arvo.org.