Intel talk on Interconnect power - UCSD VLSI CAD Laboratory
Intel talk on Interconnect power - UCSD VLSI CAD Laboratory
Intel talk on Interconnect power - UCSD VLSI CAD Laboratory

You also want an ePaper? Increase the reach of your titles
YUMPU automatically turns print PDFs into web optimized ePapers that Google loves.
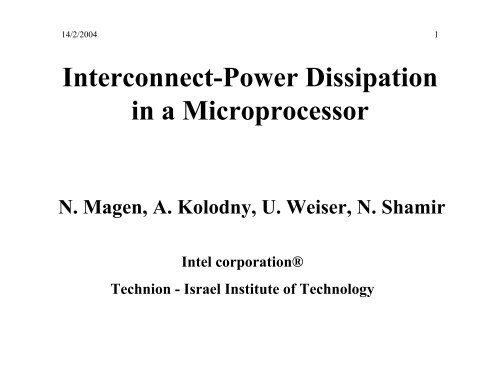
14/2/2004 1Interc<strong>on</strong>nect-Power Dissipati<strong>on</strong>in a MicroprocessorN. Magen, A. Kolodny, U. Weiser, N. Shamir<str<strong>on</strong>g>Intel</str<strong>on</strong>g> corporati<strong>on</strong>®Techni<strong>on</strong> - Israel Institute of Technology
14/2/2004 2Interc<strong>on</strong>nect-Power Definiti<strong>on</strong>• Interc<strong>on</strong>nect-Power is dynamic <strong>power</strong> c<strong>on</strong>sumpti<strong>on</strong>due to interc<strong>on</strong>nect capacitance switching– How much <strong>power</strong> is c<strong>on</strong>sumed by Interc<strong>on</strong>necti<strong>on</strong>s ?– Future generati<strong>on</strong>s trends ?– How to reduce the interc<strong>on</strong>nect <strong>power</strong> ?0.13 µm cross-secti<strong>on</strong>, source - <str<strong>on</strong>g>Intel</str<strong>on</strong>g>
14/2/2004 4Outline• Research methodology• Interc<strong>on</strong>nect Power Analysis• Power-Aware Router Experiment• Interc<strong>on</strong>nect Power Predicti<strong>on</strong>• Summary
14/2/2004 5Case study• Low-<strong>power</strong>, state-of-the-art µ-processor• Dynamic switching <strong>power</strong> analysis• Interc<strong>on</strong>nect attributes:‣ Length‣ Capacitance‣ Fan Out (FO)‣ Hierarchy data‣ Net type‣ Activity factors (AF)‣ Miscellaneous.
14/2/2004 6Interc<strong>on</strong>nect Length Model1• Total wire length• Stitched across hierarchies• Summed over repeaters864 41377• Net modelCdiff.CwireCgate
14/2/2004 7Activity Factors Generati<strong>on</strong>Power test vectors generati<strong>on</strong>(worst case for high <strong>power</strong>, unit stressing)RTL full-chip simulati<strong>on</strong>(results in blocks primary inputs: Activity,Probability)M<strong>on</strong>te-Carlo based block inputs generati<strong>on</strong>(based <strong>on</strong> the RTL statistics)Transistor level simulati<strong>on</strong> - per block(Unit delay, tuning for glitches)Per node activity factorSource -”<str<strong>on</strong>g>Intel</str<strong>on</strong>g>® Pentium® M Processor Power Estimati<strong>on</strong>, Budgeting, Optimizati<strong>on</strong>, and Validati<strong>on</strong>”, ITJ 2003
14/2/2004 8Outline• Research methodology• Interc<strong>on</strong>nect Power Analysis• Power-Aware Router Experiment• Interc<strong>on</strong>nect Power Predicti<strong>on</strong>• Summary
14/2/2004 9Interc<strong>on</strong>nect Length Distributi<strong>on</strong>100001000100Number of nets1010.10.01Pentium® 0.5 [um]Pentium® MMX 0.35 [um]Pentium® Pro 0.5 [um]Pentium® II 0.35 [um]Pentium® II 0.25 [um]Pentium® III 0.18 [um]Low Power Processor 0.13 [um]0.0011 10 100 1000 10000 100000Net Length [um]Source: Shekhar Y. Borkar, CRL - <str<strong>on</strong>g>Intel</str<strong>on</strong>g>
14/2/2004 10Interc<strong>on</strong>nect Length Distributi<strong>on</strong>Nets vs. Net Length• Log – Logscale• Exp<strong>on</strong>entialdecrease withlength• Global clock –not includedNumber of Nets10001001010.1LocalGlobal TotalTotal0.010.0011 10 100 1000 10000 100000Length [um]
14/2/2004 11Total Dynamic Power• Total DynamicPower• Global clock –not included• Localnets = 66%• Globalnets = 34%Normalized Dynamic Power1009080706050403020Nets: 390kCap: 10[nF]FO: 2AF: 0.0485Total Power vs. Net LengthPeak 1Peak 2Interc<strong>on</strong>nectLocalGlobal TotalTotal TotalNets: 75kCap: 20[nF]FO: 20AF: 0.0551001 10 100 1000 10000 100000Length [um]
14/2/2004 12Total Dynamic Power BreakdownGlobal clock includedInterc<strong>on</strong>nect51%Gate34%Diffusi<strong>on</strong>15%
14/2/2004 13Power Breakdown by Net TypesGlobal clock includedglobalsignals34%global clock19%local signals27%local clock20%globalsignals21%global clock13%local clock29%local signals37%Interc<strong>on</strong>nect <strong>power</strong>(Interc<strong>on</strong>nect <strong>on</strong>ly)Total <strong>power</strong>(Gate, Diffusi<strong>on</strong> and Interc<strong>on</strong>nect)
14/2/2004 14Interc<strong>on</strong>nect Power Breakdown• Interc<strong>on</strong>nect c<strong>on</strong>sumes 50% of dynamic <strong>power</strong>• Clock <strong>power</strong> ~40% (of Interc<strong>on</strong>nect and total)• 90% of <strong>power</strong> c<strong>on</strong>sumed by 10% of nets• Interc<strong>on</strong>nect design is NOT <strong>power</strong>-aware !• Predictive model can project the interc<strong>on</strong>nect <strong>power</strong>.Interc<strong>on</strong>nect <strong>power</strong> Total <strong>power</strong>100 %global signals90 %80 %34 %global clockLocal signalslocal clock70 %60 %50 %40 %30 %19 %27 %Interc<strong>on</strong>nect51%Gate34%Local local signals clock20 %10 %20 %Diffusi<strong>on</strong>15%0%
14/2/2004 15Outline• Research methodology• Interc<strong>on</strong>nect Power Analysis• Power-Aware Router Experiment• Interc<strong>on</strong>nect Power Predicti<strong>on</strong>• Summary
14/2/2004 16Experiment - Power-Aware Router• Routing Experiment optimizing processor’s blocks• Local nodes (clock and signals) c<strong>on</strong>sume 66% of dynamic <strong>power</strong>• 10% of nets c<strong>on</strong>sume 90% of <strong>power</strong>• Min. spanning trees can save over 20% Interc<strong>on</strong>nect <strong>power</strong>• Routing with spacing can save up to 40% Interc<strong>on</strong>nect <strong>power</strong>Small block’s local clock network
14/2/2004 17Power-Aware Router FlowPower grid routingClock tree:high FO, l<strong>on</strong>g lines, very activeClock tree routingWith spacingAvoiding c<strong>on</strong>gesti<strong>on</strong>Top n% <strong>power</strong> c<strong>on</strong>sumingsignal nets routingGlobal and Detailed Routing -of the un-routed nets(timing and c<strong>on</strong>gesti<strong>on</strong> driven)Rip-up: not high <strong>power</strong> netsAll netsrouted?NoPower-aware Rip upand re-routeYesFollowed by downsizingFinish
14/2/2004 18Results - Power SavingAverageDynamic <strong>power</strong> saving60%Driver Downsizing50%Router Power Saving40%30%Downsize20%saving10%Router0%savingBlock A Block B Block C Block D Block EAverage saving results: 14.3% for ASIC blocks 11 - Estimated based <strong>on</strong> clock interc<strong>on</strong>nect <strong>power</strong>
14/2/2004 19Outline• Research methodology• Interc<strong>on</strong>nect Power Analysis• Power-Aware Router Experiment• Interc<strong>on</strong>nect Power Predicti<strong>on</strong>• Summary
14/2/2004 20Future of Interc<strong>on</strong>nect Power100%Dynamic Power breakdownGate90%80%Diffusi<strong>on</strong>70%60%50%Interc<strong>on</strong>nect40%30%20%10%% G POW% D POW% IC POWSource - ITRS 2001 Editi<strong>on</strong> adapted data0%0.15 0.13 0.1 0.09 0.08 0.07 0.065 0.045 0.032 0.022Generati<strong>on</strong>Technology generati<strong>on</strong> [µm]Interc<strong>on</strong>nect <strong>power</strong> grows to 65%-80% within 5 years !(using optimistic interc<strong>on</strong>nect scaling)
14/2/2004 21Interc<strong>on</strong>nect Power Predicti<strong>on</strong>• The number of netsvs. unit length –Modified Davis modelNumber of Number Nets of (normalized)1001010.10.010.10 .0010 .0000110.010 .00010.001 0100 %Interc<strong>on</strong>nect length projecti<strong>on</strong>Upper local boundLower global boundPowerMeasured1 10 100 1000 10000 100000Length [ um ]Dynamic <strong>power</strong> breakdownmodel• The dynamic <strong>power</strong>average breakdownPowerPower90 %80 %70 %60 %50 %40 %30 %Interc<strong>on</strong>nectDiffusi<strong>on</strong>Interc<strong>on</strong>nectDiffGate20 %10 %Gate0%Local Intermediate Global
14/2/2004 22Interc<strong>on</strong>nect Power Model• Multiplicati<strong>on</strong> of the number of interc<strong>on</strong>nects with <strong>power</strong>breakdowns gives:6Projected dynamic <strong>power</strong> vs. net lengthPower (normalized)Power54321Measured <strong>power</strong>Projecti<strong>on</strong>01 10 100 1000 10000 100000Length [µm][ um ]The <strong>power</strong> model matches processor <strong>power</strong> distributi<strong>on</strong> !
14/2/2004 23Outline• Research methodology• Interc<strong>on</strong>nect Power Analysis• Power-Aware Router Experiment• Interc<strong>on</strong>nect Power Predicti<strong>on</strong>• Summary
14/2/2004 24Summary• Interc<strong>on</strong>nect is 50% of the dynamic <strong>power</strong> of processors, andgetting worse.► Interc<strong>on</strong>nect <strong>power</strong>-aware design is recommended• Clock c<strong>on</strong>sumes 40% of interc<strong>on</strong>nect <strong>power</strong>.► Clock interc<strong>on</strong>nect spacing is suggested• Interc<strong>on</strong>nect <strong>power</strong> is sum of nearly all net lengths and types.► Router level Interc<strong>on</strong>nect <strong>power</strong> reducti<strong>on</strong> addresses all• Interc<strong>on</strong>nect <strong>power</strong> has str<strong>on</strong>g dependency <strong>on</strong> the hierarchy►Per Hierarchy analysis and optimizati<strong>on</strong> algorithms
14/2/2004 25Future Research1. Interc<strong>on</strong>nect Power characterizati<strong>on</strong> and predicti<strong>on</strong>2. Investigate Interc<strong>on</strong>nect <strong>power</strong> reducti<strong>on</strong> techniques:• Interc<strong>on</strong>nect-Spacing for <strong>power</strong>• Interc<strong>on</strong>nect Power-Aware physical design• Aspect Ratio optimizati<strong>on</strong> for <strong>power</strong>• Architectural communicati<strong>on</strong> reducti<strong>on</strong>
14/2/2004 26Questi<strong>on</strong>s ?
14/2/2004 27BACKUP-Slides
14/2/2004 28Processor Case Study• Analysis subject: Processor, 0.13 [µm]• 77 milli<strong>on</strong> transistors, die size of 88 [mm 2 ]• Data sources (AF, Capacitance, Length)• Excluded: L2 cache, global clock, analog units
14/2/2004 29Global Communicati<strong>on</strong>• Global <strong>power</strong> isimportant• Global <strong>power</strong> ismostly IC• For higher <strong>power</strong>benchmarks –Global <strong>power</strong> ishigher• G-clock excludedGlobal Power Percent35%30%25%20%15%10%%GlobalGlobal Power % vs. Test PowerPoly. (%Global )5%0%Total Power [uW]
14/2/2004 30Benchmark Selecti<strong>on</strong>• High <strong>power</strong> test benchmarks• Worst case design• Suitable for: thermal design, <strong>power</strong> grid design• Average <strong>power</strong> is a fracti<strong>on</strong> of peak <strong>power</strong>• Unit stressing benchmarks• Averaging of all high <strong>power</strong> benchmarks• High node coverageITC logo
14/2/2004 31Interc<strong>on</strong>nect Power Implicati<strong>on</strong>s• Interc<strong>on</strong>nect <strong>power</strong> can be reduced byminimizing switched capacitance:• Fabricati<strong>on</strong> process (wire parameters)• Power-driven physical design• Logic optimizati<strong>on</strong> for <strong>power</strong>• Architectural interc<strong>on</strong>nect optimizati<strong>on</strong>
14/2/2004 32Interc<strong>on</strong>nect Capacitance• Side-cap is increasing:70% to 80%self-cap.Layer 3100%90%80%70%60%Global Capacitance breakdownV-cap50%H-capH-capV-capLayer 2Side-cap.40%30%20%V-capH-capSource - ITRS 2001 Editi<strong>on</strong> adapted dataLayer 110%0%0.15 0.13 0.1 0.09 0.08 0.07 0.065 0.045 0.032 0.022Generati<strong>on</strong>Technology generati<strong>on</strong> [µm]The majority of interc<strong>on</strong>nect capacitance is side-capacitance !
14/2/2004 33Fabricati<strong>on</strong> Process –Aspect Ratio (AR)• Interc<strong>on</strong>nect AR =ThicknessWidthThickness• Low AR = Low Interc<strong>on</strong>nect <strong>power</strong>• Low AR = High resistance• Frequency Modeling• Local: average gate, average IC• Global: optimally buffered global ICWidthLocalR intR intR intR int R intR intR int...C intC intC intC int C intC intC intGlobalL critR intC intL critR intC intL critL critR intR int. . .C intC int
14/2/2004 34Aspect Ratio – Trade offs• Power – depends <strong>on</strong> cap.• Frequency:• Local – gates and IC cap.• Global – mostly IC – RC120%110%100%Freq. And Power vs. Relative ARLocal path speed• Per layer AR optimizati<strong>on</strong> !• Scaling ⇒ more <strong>power</strong> save,less frequency loss90%80%PowerFrequency - LocalFrequency - Global70%Global path speedDynamic Power60%50.0% 62.5% 75.0% 87.5% 100.0% 112.5% 125.0% 137.5% 150.0%ARRelative ARAspect Ratio optimizati<strong>on</strong> can save over 10% of dynamic <strong>power</strong> !
14/2/2004 35Physical Design - Spacing• Spacing can save up to 40%120%0.13 [µm] global IC cap. vs. spacing• About 30% is with double space• Spacing advantages: scaling,frequency, reliability, noise,easy to modifymin. spaceCapacitanceRelative capacitance100%80%60%40%20%2X 3X 4XGlobal capacitanc0%1 1.5 2 2.5 3 3.5 4 4.5 5SpacingSpacingWire spacing can save up to 20% of the dynamic <strong>power</strong> !
14/2/2004 36Spacing calculati<strong>on</strong>Back of an envelope estimati<strong>on</strong>:• 10% of Interc<strong>on</strong>nect ⇒ 90% <strong>power</strong>• X2 spacing = extra 20% wiring• Global clock – not spaced (inductance)• Global clock is 20% of interc<strong>on</strong>nect <strong>power</strong>• Save: 30% of (90%-20%) = 20%• Interc<strong>on</strong>nect is 50% ⇒ 10% <strong>power</strong> saveExpected 20% with downsizing• Minor losses - c<strong>on</strong>gesti<strong>on</strong>
14/2/2004 37µ-Architecture - CMP• Comparing two scalingmethods, by IC <strong>power</strong>.Gen. 1 Gen. 2UniprocessorP`• IC - predicted by Rent• L2 - identical, minor• Clock - Identical !• Same average AF.PL2`L2CMPP” P”• Result ~5% less dynamic <strong>power</strong> for CMPL2`
14/2/2004 38Power criticalvs.Timing critical100%90%80%acummulated <strong>power</strong>70%Accumulated Power60%50%40%30%20%10%0%Timing criticalSlack [ps]
14/2/2004 39Outline• Research methodology• Interc<strong>on</strong>nect Power Analysis• Future Trends Analysis• Interc<strong>on</strong>nect Power Implicati<strong>on</strong>s• Summary
14/2/2004 40Interc<strong>on</strong>nect Length Predicti<strong>on</strong>• Technology projecti<strong>on</strong>s - ITRS• Interc<strong>on</strong>nect length predicti<strong>on</strong>s:• ITRS model: 1/3 of the routing space- most optimistic• Davis model:o Rent’s rule basedo Predicts number of nets as functi<strong>on</strong> of:the number of gates and complexity factors• Models calibrated based <strong>on</strong> the case studyTime?
14/2/2004 41Rent’s parametersRent’s rule: T = k N rTNKr= # of I/O terminals (pins)= # of gates= avg. I/O’s per gate= Rent’s exp<strong>on</strong>entcan be: 0 < r < 1 , but comm<strong>on</strong> -(simple) 0.5 < r < 0.75 (complex)N gatesT terminals
14/2/2004 42D<strong>on</strong>ath’s length estimati<strong>on</strong> modelFor the i-th level:There are4 iblocksFor each block there are:⎛k ⋅⎜⎝Assuming two terminal nets :Ni4k2r⎞⎟⎠⎛⋅⎜⎝terminalsNi4r⎞⎟⎠netsThe nets of the i-1 level must be substracted.Nets for level i : ni= 4i⋅k ⎛⋅⎜2 ⎝Ni4r⎞⎟⎠- 4i−1⋅k ⎛ N⋅⎜2 ⎝ 4i−1r⎞⎟⎠= 4i⋅k ⎛⋅⎜2 ⎝Ni4r⎞⎟⎠⋅(r−11−4 )
14/2/2004 43Average interc<strong>on</strong>necti<strong>on</strong> lengthThe wires can be of two types A and D.LA =LD =λ λ λ λ∑∑∑∑[ λ + iA−iB+ jB− jA]i = 1j = 1i = 1j= 1A A B Bλ λ λ λ∑∑∑∑i = 1j = 1i = 1j= 1A A B BThe average: ri=Overall :RI∑i=1=I∑i=14λ2λ+ i[ + j −i− ]niAAB4λ14⋅λ2−9 9⋅λ⋅ rniiequals4 1= ⋅λ−3 3λjB= 2⋅λ29⎛⋅⎜7⋅⎝N4r−0.5Taken from a SLIP 2001 tutorial by Dirk Stroobandtr−0.5−11−N−−11−4r−1.5r−1.5⎞ ⎛ −⋅ 1 4⎟⎜⎠ ⎝1−Nr−1r−1⎞⎟⎠
14/2/2004 44• From Rent’s rule:•IDF:()i l• Where:FOα = ,Davis ModelTr= r⋅N3⎧ α ⋅r⎛l2 ⎞ 2⋅ p−4⋅Γ⋅ 2 N l 2 N l l1 l N : ⎜ − ⋅ ⋅ + ⋅ ⋅ ⎟⋅⎪ ≤ ≤2 3= ⎝ ⎠⎨N l 2 N : α r3⎪ ≤ ≤ ⋅ ⋅2⋅p−4⋅Γ⋅( 2⋅ N ⋅l)⋅l⎪⎩6P−1( )Γ= 2⋅N⋅ 1−N2 1FO + 1 ⎛ ⋅p−p 1+ 2⋅ p−2 1 2⋅N N ⎞⎜−N ⋅ − + − ⎟⎝ p ⋅( 2⋅ p −1) ⋅( p −1) ⋅( 2⋅ p −3)6⋅ p 2⋅ p −1 p −1⎠P• Interc<strong>on</strong>nect total number and length:2⋅N2⋅NNets: I i ζ dζLength:total1• Multipoint Length:= ∫ ( )total ∫ ( )multi_terminalL = i ζ ⋅ζ ⋅dζL = L ⋅χwhere χ=1total4FO+3
14/2/2004 45Davis Model - extensi<strong>on</strong>• C<strong>on</strong>stant factor favors shorter nets.• Short P2P net has higher chance to be a partof a multipoint net.• Correcti<strong>on</strong> factor:• Length:number of point to point nets shorter than lmulti-terminal factor( l) =total point to point netsl1Imulti-terminal() l = i( ζ ) multi-terminal factor( ζ)dζFO∫1110000000.1ExtractedDavis Model100000MeasuredExtended Davis Model10000Nets0.010 .001Number of Nets10001000 .0001100.000011 10 100 1000 10000 100000Length [um ]11 10 100 1000 10000 100000Length |um|
14/2/2004 46RMST - Example
14/2/2004 47Total Dynamic Power• Total DynamicPower• Global clock –not included• Localnets = 66%Globalnets = 34%Power (normalized)Power654321Total Power vs. Net LengthTOTALTotal_IC0Interc<strong>on</strong>nect1 10 100 1000 10000 100000Length [um]Length [µm]
14/2/2004 48Local and Global IC• Local and GlobalIC are different:• Number byLengthbreakdown• IC breakdown –cap and <strong>power</strong>• Fan out• Metal usage• AF is similarPowerPower100 %80 %60 %40 %20 %0%100 %80 %60 %40 %20 %Local Power breakdown vs. Net Length4 .16 8 . 32 16 .64 32 .864 65 .728 131 . 456 262 .496 523 .744 1044 . 99 2084 .99 4160 8300 . 45 16561 .4 33930 83850Length [ um ]Global Power breakdown vs. Net LengthICDiffGateICDiffGate0%4 . 16 8 . 32 16 . 64 32 . 864 65 . 728 131 . 456 262 . 496 523 . 744 1044 . 99 2084 . 99 4160 8300 . 45 16561 . 4 33930 83850Length [ um ]
14/2/2004 4945Benchmarks Comparis<strong>on</strong>Global Dynamic <strong>power</strong> vs. Length40High Power TestsBenchmarks3530Power25201510501 10 100 1000 10000 100000 1000000Length [um ]High <strong>power</strong> tests show similar behavior to average SPEC !
14/2/2004 50Interc<strong>on</strong>nect PeaksTotal wire length vs. Length4MeasuredDavis ModelTotal wire length32120101 0 10 100 Length [ um ] 1000 10000 100000Length [µm]Average gate sizing vs. Length1 . 8Average gate sizing1 . 61 . 4Relative sizing1 . 210 . 80 . 60 . 40 . 201 10 100 1000 10000 100000010 100 1000 10000 100000[ um ]Length [µm]
14/2/2004 51ITRS Power Trends• The ITRS <strong>power</strong> projecti<strong>on</strong> interc<strong>on</strong>nect <strong>power</strong>reducti<strong>on</strong> that happens in 2006-2007 is based <strong>on</strong>:1. Aggressive voltage reducti<strong>on</strong>2. Low-k dielectric improvements• The devices capacitance increase by +30% (trend -15%)• The combined effect:• Interc<strong>on</strong>nect <strong>power</strong> reducti<strong>on</strong> (relative to voltage)• Device <strong>power</strong> remains c<strong>on</strong>stant
[ W]14/2/2004 52Dynamic <strong>power</strong> - ITRS trend600 .00Dynamic <strong>power</strong> projecti<strong>on</strong>500 .00ICPower (normalized)400 .00300 .00200 .00DiffGate100 .000.000 .15 0 .13 0 .1 0 .09 0 .08 0 .07 0 .065 0 .045 0 .032 0 .02Generati<strong>on</strong> 1 /2 min pitchTechnology generati<strong>on</strong> [µm]The Black curve is the ITRS maximum heat removal capabilities
14/2/2004 53Power-Aware FlowPlacement• The reduced IC cap allows fordriver downsizing• On average it reduced thedynamic <strong>power</strong> by 1.4 of the IC<strong>power</strong> saving• Downsizing is timing verified• Cells downsizing reduced thetotal area and leakage by 0.4%• No signal spacing was appliedover 30% unused metal• Post-layout optimizati<strong>on</strong> arepossibleYesPower-aware RoutingRC Extracti<strong>on</strong>Timing Analysis,Power AnalysisAll slackspositive?YesPower drivenTiming c<strong>on</strong>straineddriver downsizingSizingmodified?NoTiming driven -driver upsizingNoFinish
14/2/2004 54FUBS – descripti<strong>on</strong>• A – medium, randomly picked• B – small, highest clock <strong>power</strong>• C – small, good potential• D – medium, good potential• E – worse than averageBlock Name Block A Block B Block C Block D Block E AVERAGEArea [µm 2 ] 138801.6 101274.6 65816.1 164229.1 59766.3 209537.8Devices 14574 8644 7618 18194 6109 16675Inactive Nodes 63.66% 98.78% 82.36% 39.22% 35.38% 52.94%Power [uW] 17170.22 251.15 1786.76 11811.90 6757.11 15373.86RMST potential<strong>power</strong> saving14.3% 17% 22% 29% 4.1% 17%Clock cap. 11.25% 2.59% 12.75% 13.16% 3.27% 8.01%Clock <strong>power</strong> 72.10% 99.99% 96.46% 94.99% 33.84% 60.47%IC cap. 34.00% 27.70% 38.14% 36.05% 29.86% 34.67%IC <strong>power</strong> 28.89% 59.54% 46.74% 48.62% 40.65% 36.83%Clock IC <strong>power</strong> 20.19% 59.54% 45.48% 46.26% 16.87% 23.87%Clock IC length 1.71% 2.34% 2.05% 2.09% 0.74% 3.85%Relative -Capacitance perLength Unit.82.23% 113.15% 87.46% 83.74% 85.97% 88.46%
14/2/2004 55Miller Factor - PowerR1• Opposite directi<strong>on</strong> switching-• The current:• Energy:• That is 4 times a single switching energy.V1CR2V2dQ dC ( ∆Vc)d∆VcIc= = = Cdt dt dtd∆VE I V dt C V dt C V dv C VT T Vddc2c= ∫ c⋅dd⋅ = ∫ ⋅ ⋅dd⋅ = ⋅dd c2dddt∫ = ⋅ ⋅0 0−VddDecoupling by Miller factor of ‘2’.• Same directi<strong>on</strong> switching => no current.Decoupling by Miller factor of ‘0’.• Average case: Miller factor of ‘1’ suitable for <strong>power</strong>averagecase sum metric.
14/2/2004 56Routing Model• Via blockage:• Router efficiency: 0.6• Power grid: 20% of routing• Clock grid: 10% of top tier( ) Low layer pitch High layer pitchLayer multiplier = 1 - blocking fracti<strong>on</strong>• More accurate than ITRS 2001.