Seeds will not germinate when kept in salt water and show only poor ...
Seeds will not germinate when kept in salt water and show only poor ...
Seeds will not germinate when kept in salt water and show only poor ...

Create successful ePaper yourself
Turn your PDF publications into a flip-book with our unique Google optimized e-Paper software.
Chapter 6 Effects of sal<strong>in</strong>ity on germ<strong>in</strong>ationseeds of halophytic species typically <strong>germ<strong>in</strong>ate</strong> early <strong>in</strong> the spr<strong>in</strong>g <strong>when</strong> soil sal<strong>in</strong>ity levels arereduced, which promotes seedl<strong>in</strong>g establishment prior to the high <strong>salt</strong>-stressed conditionscaused by hot, dry summers. However, many halophytes have the potential to <strong>germ<strong>in</strong>ate</strong> atany time of the year under favourable conditions (ra<strong>in</strong>fall, optimum temperatures, <strong>and</strong>reduced sal<strong>in</strong>ity).Germ<strong>in</strong>ation has also been l<strong>in</strong>ked to seed mass. Large seeds tend to have fastergerm<strong>in</strong>ation rates <strong>when</strong> compared to small seeds (e.g. Fenner 1983, 1992; Milberg et al. 1996;Easton & Kle<strong>in</strong>dorfer 2008a, 2008b). As a consequence, seedl<strong>in</strong>gs from larger-seeded speciesshould be able to establish under a range of environmental conditions that can<strong>not</strong> be exploitedby smaller-seeded species. Large-seededness <strong>in</strong> plants may be an adaptive strategy <strong>in</strong> droughtprone regions (see Baker 1972; Salisbury 1974; Wulff 1986; Mazer 1990; Geritz et al. 1999;Susko & Lovett Doust 2000; Westoby et al. 2002). Increased sal<strong>in</strong>ity, which results <strong>in</strong> aphysiologically <strong>in</strong>duced drought, may also <strong>in</strong>duce larger seed masses (Fenner 1992). Rapidseed germ<strong>in</strong>ation, often characteristic of halophytes, may be an adaptive strategy to utilize anysoil <strong>water</strong> with reduced sal<strong>in</strong>ity levels – even of short duration (Khan & Ungar 1996).However, the correlation between germ<strong>in</strong>ation rates <strong>in</strong> halophytes <strong>and</strong> seed mass has receivedlimited <strong>in</strong>vestigation (Leishman & Westoby 1994).Halophyte species exhibit different levels of <strong>salt</strong> tolerance (Vicente et al. 2004). Abetter underst<strong>and</strong><strong>in</strong>g of <strong>in</strong>terspecific variation to sal<strong>in</strong>ity stress is constructive from both thescientific perspective, which <strong>in</strong>cludes the identification of traits associated with sal<strong>in</strong>itytolerance, as well as from an applied perspective, which <strong>in</strong>cludes identify<strong>in</strong>g plant species forspecific restoration <strong>and</strong> remediation projects (Hester et al. 2001). This paper <strong>in</strong>vestigates theeffects of sal<strong>in</strong>ity on germ<strong>in</strong>ation <strong>in</strong> Australian species of Frankenia L. (Frankeniaceae).Frankenia is a cosmopolitan halophytic plant genus that occurs <strong>in</strong> Mediterranean, semi-arid,<strong>and</strong> arid regions. Ecological data on Frankenia as a taxon, <strong>and</strong> specifically the 47 species ofAustralian Frankenia, are limited. Published data on Frankenia germ<strong>in</strong>ation are limited toBrightmore’s (1979) study of F. laevis L. (a European species), <strong>and</strong> botanical tomes (e.g.Elliot & Jones 1986; Wrigley & Fagg 2003). Only a few Australian species are currentlycultivated (e.g. F. pauciflora, F. connata) despite their recognized tolerance to soil sal<strong>in</strong>ity<strong>and</strong> drought conditions. There is also potential for <strong>in</strong>clud<strong>in</strong>g Frankenia <strong>in</strong> remediation <strong>and</strong>revegetation projects <strong>in</strong> areas affected by <strong>in</strong>creas<strong>in</strong>g sal<strong>in</strong>ity.We compare seed germ<strong>in</strong>ation <strong>in</strong> 12 Australian Frankenia species that have beensubjected to various levels of sal<strong>in</strong>ity. We test for <strong>in</strong>terspecific variation <strong>in</strong> germ<strong>in</strong>ation rates<strong>and</strong> germ<strong>in</strong>ation success, also <strong>in</strong> relation to large- <strong>and</strong> small-seededness. Six of these 12101
Chapter 6 Effects of sal<strong>in</strong>ity on germ<strong>in</strong>ationspecies have low numbers of ovules per flower <strong>and</strong> thus produce low numbers of larger seedsper fruit (‘larger-seeded species’ sensu Easton & Kle<strong>in</strong>dorfer 2008a) <strong>and</strong> six species havehigh numbers of ovules per flower <strong>and</strong> produce many smaller seeds per fruit (‘smaller-seededspecies’ sensu Easton & Kle<strong>in</strong>dorfer 2008a). Larger- <strong>and</strong> smaller-seeded Frankenia speciesoften occur <strong>in</strong> close geographical proximity, even with<strong>in</strong> the same community. This providesa good opportunity to exam<strong>in</strong>e selective pressures that have shaped these geographically cooccurr<strong>in</strong>greproductive strategies.The aims of our study were: (1) to <strong>in</strong>vestigate germ<strong>in</strong>ation (germ<strong>in</strong>ation rates,germ<strong>in</strong>ation success) of Frankenia seeds at four sal<strong>in</strong>ity levels (0%, 10%, 20% 30%), (2) totest for possible <strong>in</strong>teractions between seed mass, sal<strong>in</strong>ity, <strong>and</strong> germ<strong>in</strong>ation, <strong>and</strong> (3) to exam<strong>in</strong>ethe effects of sal<strong>in</strong>ity levels on <strong>in</strong>hibition of germ<strong>in</strong>ation <strong>and</strong>/or seed damage. We predictedhigher germ<strong>in</strong>ation rates <strong>and</strong> germ<strong>in</strong>ation success <strong>in</strong> larger-seeded species overall <strong>and</strong> <strong>not</strong>ablyat higher sal<strong>in</strong>ities. We also predicted high recovery rates <strong>in</strong> Frankenia species after exposureto high sal<strong>in</strong>ities.MATERIALS AND METHODSTest speciesTable 1 lists the population locations, <strong>and</strong> the mean seed mass of the species <strong>in</strong>cluded<strong>in</strong> this study. We follow the taxonomic descriptions proposed by Summerhayes (1930), <strong>and</strong>revised by Barnsley (1982). Mean seed mass was calculated by <strong>in</strong>dividually weigh<strong>in</strong>g 150seeds per population on a Mettler Toledo MX/UMX microbalance. Twelve Frankenia specieswere <strong>in</strong>cluded <strong>in</strong> this study, six species with a low number of ovules per flower <strong>and</strong> largerseeds (F. cordata J.Black, F. <strong>in</strong>terioris Ostenf., F. serpyllifolia L<strong>in</strong>dl., F. sessilis Summerh.,F. setosa W.Fitzg., F. tetrapetala Labill.), <strong>and</strong> six species with a high number of ovules perflower <strong>and</strong> smaller seeds (F. c<strong>in</strong>erea A. DC., F. fecunda Summerh., F. foliosa J.Black, F.laxiflora Summerh., <strong>and</strong> two varieties of F. pauciflora DC). A recent revision of F. pauciflorademonstrated that two varieties of F. pauciflora, one from South Australia <strong>and</strong> the other fromWestern Australia, are sufficiently unrelated to warrant their <strong>in</strong>clusion as two separate species<strong>in</strong> this study (Craigie 2007).102
Chapter 6 Effects of sal<strong>in</strong>ity on germ<strong>in</strong>ationRecovery experimentsAfter 28 days, solutions were discarded <strong>and</strong> un<strong>germ<strong>in</strong>ate</strong>d seeds were placed over areservoir of distilled <strong>water</strong> for a further 14 days to test whether the sal<strong>in</strong>e solutions had<strong>in</strong>hibited germ<strong>in</strong>ation (Khan & Ungar 1996; Pujol et al. 2000; Rubio-Cas et al. 2003). Weused 14 days as a cut-off because little additional germ<strong>in</strong>ation occurred after 10 days fromtransfer to distilled <strong>water</strong> (also see Khan & Ungar 1996; Ramírez-Padilla & Valverde 2005).It was <strong>not</strong> necessary to do viability tests (e.g. us<strong>in</strong>g tetrazolium) on un<strong>germ<strong>in</strong>ate</strong>d seeds at theend of experiment s<strong>in</strong>ce most of the seeds that rema<strong>in</strong>ed un<strong>germ<strong>in</strong>ate</strong>d <strong>show</strong>ed clear signs ofrott<strong>in</strong>g or fungal <strong>in</strong>fection.Percentage recovery germ<strong>in</strong>ation was calculated us<strong>in</strong>g the follow<strong>in</strong>g formula;Recovery % = [a/(c-b)].100where a is the total number of seeds <strong>germ<strong>in</strong>ate</strong>d after be<strong>in</strong>g transferred to distilled <strong>water</strong>, b isthe total number of seeds germ<strong>in</strong>at<strong>in</strong>g <strong>in</strong> the sal<strong>in</strong>e solution, <strong>and</strong> c is the total number of seeds(modified from Khan & Gulzar 2003).Effect of seed massAnalyses test<strong>in</strong>g for the effect of seed mass on germ<strong>in</strong>ation rates followed the protocoloutl<strong>in</strong>ed <strong>in</strong> Chapter 3. We used a Nested (Hierarchical) Design ANOVA to <strong>in</strong>vestigatedifferences <strong>in</strong> germ<strong>in</strong>ation rates between larger-seeded <strong>and</strong> smaller-seeded species every twodays over a 28–day period, us<strong>in</strong>g temperature <strong>and</strong> seed mass as fixed factors, <strong>and</strong> species as ar<strong>and</strong>om factor. Type III Sum of Squares were calculated for each test to adjust for the effectof different species that were nested with<strong>in</strong> each seed mass category.Partial Eta Squares (η p2 ) – a measure of effect size – were calculated. Measures ofeffect size quantify the degrees of association or correlation between an effect (e.g. a ma<strong>in</strong>effect or an <strong>in</strong>teraction) <strong>and</strong> the dependent variable (Becker 2000). If the value of the measure2of association is squared, as it is for η p it can be <strong>in</strong>terpreted as the proportion of variance <strong>in</strong>the dependent variable (i.e. germ<strong>in</strong>ation) that is attributed to each effect, <strong>and</strong> is calculated as;2η p = SS effect /(SS effect + SS error ).2Statistically, η p is the proportion of the Sum of Squares effects plus Sum of Squares errorvariances that are attributed to the effects.F<strong>in</strong>ally, st<strong>and</strong>ard l<strong>in</strong>ear regression analyses assessed the relationship between meanseed mass per species <strong>and</strong> germ<strong>in</strong>ation rates (us<strong>in</strong>g the modified Timson Index) at each105
Chapter 6 Effects of sal<strong>in</strong>ity on germ<strong>in</strong>ationspecies (measured as time <strong>in</strong> days to reach 50% germ<strong>in</strong>ation; T 50 ) for all sal<strong>in</strong>ity levels. At 0%sal<strong>in</strong>ity, time to T 50 ranged from Day 4 (F. cordata, F. <strong>in</strong>terioris, F. serpyllifolia, F. setosa) toDay 10 (F. pauciflora (WA)) (ANOVA: F = 2.27, df = 11, P
Chapter 6 Effects of sal<strong>in</strong>ity on germ<strong>in</strong>ationafter exposure to 10% sal<strong>in</strong>ity). At 30% sal<strong>in</strong>ity, germ<strong>in</strong>ation ranged between 2.8% (F.pauciflora (WA)) <strong>and</strong> 53.3% (F. setosa). All but four species had less than 10% germ<strong>in</strong>ation.All species with high germ<strong>in</strong>ation were larger-seeded species. Recovery was greater than 48%for all species, <strong>and</strong> three species had greater than 70% recovery, <strong>not</strong>ably F. <strong>in</strong>terioris (92.6%).Effect of seed massTable 4 lists the effect of the <strong>in</strong>teraction between sal<strong>in</strong>ity*species(seed mass category)on germ<strong>in</strong>ation rates for Day 2, Day 4, Day 6, <strong>and</strong> Day 8, <strong>and</strong> on germ<strong>in</strong>ation success for Day8 <strong>and</strong> Day 28. Notable are the significant differences <strong>in</strong> germ<strong>in</strong>ation rates at Day 2 <strong>and</strong> Day 4,<strong>and</strong> <strong>in</strong> germ<strong>in</strong>ation success at Day 8 <strong>and</strong> Day 28. Table 5 lists the differences <strong>in</strong> germ<strong>in</strong>ationrates between species(seed mass category) (henceforth called the SSM) at Day 2, Day 4, Day6 <strong>and</strong> Day 8, <strong>and</strong> <strong>in</strong> germ<strong>in</strong>ation success at Day 28 for each sal<strong>in</strong>ity level. Germ<strong>in</strong>ation rateswere significantly different between SSM on Day 2 at 10% sal<strong>in</strong>ity, Day 2 at 20% sal<strong>in</strong>ity,<strong>and</strong> Day 8 at 30% sal<strong>in</strong>ity.We exam<strong>in</strong>ed the Partial Eta Squared (η 2 p ) values to identify the degree of associationbetween germ<strong>in</strong>ation <strong>and</strong> SSM. First we exam<strong>in</strong>ed differences <strong>in</strong> germ<strong>in</strong>ation between largerseeded<strong>and</strong> smaller-seeded species by comb<strong>in</strong><strong>in</strong>g the results of all four sal<strong>in</strong>ity categories (seeTable 5). The largest <strong>in</strong>teraction occurred on Day 2, account<strong>in</strong>g for 67% of the total variance<strong>in</strong> the performance scores (i.e. germ<strong>in</strong>ation).Next we exam<strong>in</strong>ed differences <strong>in</strong> germ<strong>in</strong>ation rates that could be attributed to the SSMeffect with<strong>in</strong> each of the four sal<strong>in</strong>ity levels (0%, 10%, 20%, 30%). The days for whichgerm<strong>in</strong>ation was <strong>in</strong>fluenced by SSM varied between sal<strong>in</strong>ity levels. At 0% sal<strong>in</strong>ity, thehighest SSM effect occurred on Day 6 (44%). At 10% sal<strong>in</strong>ity, the highest SSM effectoccurred on Day 2 (60%). At 20% sal<strong>in</strong>ity, the highest SSM effect occurred on Day 2 (84%).At 30% sal<strong>in</strong>ity, the highest SSM effect occurred on Day 8 (66%). The importance of seedmass for germ<strong>in</strong>ation success <strong>in</strong>creased with sal<strong>in</strong>ity levels. Germ<strong>in</strong>ation success at Day 28attributable to SSM effect was most pronounced for 20% sal<strong>in</strong>ity (61%) <strong>and</strong> 30% sal<strong>in</strong>ity(78%).F<strong>in</strong>ally, st<strong>and</strong>ard l<strong>in</strong>ear regression analyses calculated the relationship between meanseed mass per species <strong>and</strong> germ<strong>in</strong>ation rates (Timson Index at Day 28) for each sal<strong>in</strong>ity level,to test the null hypothesis of no relationship between seed mass <strong>and</strong> germ<strong>in</strong>ation rate. The nullhypothesis was supported for 0% sal<strong>in</strong>ity (r 2 = 0.13, F = 1.42, P = 0.26), <strong>and</strong> 10% sal<strong>in</strong>ity (r 2 =0.30, F = 4.33, P = 0.06). This f<strong>in</strong>d<strong>in</strong>g suggests that <strong>only</strong> 13% <strong>and</strong> 30% respectively of the<strong>in</strong>crease <strong>in</strong> germ<strong>in</strong>ation rates could be expla<strong>in</strong>ed by an <strong>in</strong>crease <strong>in</strong> seed mass dur<strong>in</strong>g the 28-108
Chapter 6 Effects of sal<strong>in</strong>ity on germ<strong>in</strong>ationday period. Exam<strong>in</strong>ation of residual plots revealed that with<strong>in</strong> the smaller-seeded species, an<strong>in</strong>crease <strong>in</strong> seed mass did <strong>not</strong> necessarily correlate with an <strong>in</strong>crease <strong>in</strong> germ<strong>in</strong>ation rates.However, there was a significant relationship between seed mass <strong>and</strong> germ<strong>in</strong>ation rates for20% sal<strong>in</strong>ity (r 2 = 0.77, F = 32.43, P
Chapter 6 Effects of sal<strong>in</strong>ity on germ<strong>in</strong>ationConclusionArid, drought prone areas are often claimed to favour large-seededness. Here we <strong>show</strong>that even with<strong>in</strong> arid zones, micro-habitats may be important <strong>in</strong> determ<strong>in</strong><strong>in</strong>g optimal seedmass. Variation <strong>in</strong> <strong>salt</strong> tolerance for germ<strong>in</strong>ation may be important <strong>in</strong> expla<strong>in</strong><strong>in</strong>g small-scalevariation <strong>in</strong> vegetation patterns among Frankenia species with<strong>in</strong> close geographicalproximity. The results of this study provide <strong>in</strong>direct evidence that selection <strong>in</strong> someAustralian Frankenia species to develop larger seeds (a result of the reduction <strong>in</strong> ovulenumber) has facilitated their establishment <strong>and</strong> reproduction under conditions that were lessfavourable for smaller-seeded Frankenia species.ACKNOWLEDGEMENTSA Fl<strong>in</strong>ders University undergraduate project by T. Playford (2003) provided prelim<strong>in</strong>ary data ofFrankenia germ<strong>in</strong>ation. D. Allen, T. Chapman, A. Craigie, R. Davies, G. <strong>and</strong> G. Easton, D. Mackay, <strong>and</strong> D.Nicolle assisted with seed collection. Thanks to R. Crozier of Anna Creek Station <strong>and</strong> P. Barnes of MurnepeowieStation for permission to collect seeds, to F. Badman <strong>and</strong> D. Albrecht for provid<strong>in</strong>g their localities for Frankeniapopulations. <strong>Seeds</strong> was collected with permission <strong>in</strong> SA (DEHAA permit #Z24947 3), NT (Parks <strong>and</strong> WildlifeCommission permit # 20216), WA (Conservation <strong>and</strong> L<strong>and</strong> Management), <strong>and</strong> NSW (National Parks <strong>and</strong>Wildlife Services permit # B2368). This study was funded to LCE by the follow<strong>in</strong>g: Australian Flora FoundationGrant, Mark Mitchell Research Foundation Grant, Nature Foundation SA Postgraduate Scholarship Grant,Native Vegetation Grant, Wildlife Conservation Foundation Grant, <strong>and</strong> the Fl<strong>in</strong>ders University Post-GraduateDevelopment program. This study is part of a PhD thesis undertaken by LCE at Fl<strong>in</strong>ders University, Adelaide,South Australia.REFERENCESAhmad, R. & Ismail, S. (1995) Rehabilitation of sal<strong>in</strong>ity tolerant plants under sal<strong>in</strong>e conditions. In: Biology of<strong>salt</strong> tolerant plants. Khan, M.A. & Ungar, I.A. (eds.). Book Crafters, USA.Badman, F.J. (1999) The Lake Eyre South study: Vegetation. Gill<strong>in</strong>gham Publish<strong>in</strong>g, South Australia.Baker, H.G. (1972) Seed weight <strong>in</strong> relation to environmental conditions <strong>in</strong> California. Ecology 53: 997-1010.Barnsley, B. (1982) Frankeniaceae. In: George A.S. (ed.) Flora of Australia Volume 8. Australian GovernmentPublish<strong>in</strong>g, Canberra. pp 112–146.Becker, L.A. (2000) SPSS Course Content – Fall, 2000. At .[Accessed 4th October 2008].Boyko, H. (1996) Sal<strong>in</strong>ity <strong>and</strong> Aridity. D.W. Junk Publishers, The Hague.112
Chapter 6 Effects of sal<strong>in</strong>ity on germ<strong>in</strong>ationBrightmore, D. (1979) Biological flora of the British Isles: Frankenia laevis L. Journal of Ecology 67: 1097–1197.Craigie, A.I. (2007) Systematic studies of the Australian species of Frankenia L. (Frankeniaceae). PhDthesis, Fl<strong>in</strong>ders University, Adelaide, Australia.Easton, L.C. & Kle<strong>in</strong>dorfer, S. (2008a) Germ<strong>in</strong>ation <strong>in</strong> two Australian species of Frankenia L., F. serpyllifoliaL<strong>in</strong>dl. <strong>and</strong> F. foliosa J.Black (Frankeniaceae) – effect of seed mass, seed age, light, <strong>and</strong> temperature.Transactions of the Royal Society South Australia 132: 29–40.Easton, L.C. & Kle<strong>in</strong>dorfer, S. (2008b) Interaction effects of seed mass <strong>and</strong> temperature on germ<strong>in</strong>ation <strong>in</strong>Australian species of Frankenia L. (Frankeniaceae). Folia Geobotanica 43(4).Elliot, W.R. & Jones, D.L. (1986) Encyclopaedia of Australian plants suitable for cultivation: Volume 4.Lothian, Melbourne.Fenner, M. (1983) Relationships between seed weight, ash content <strong>and</strong> seedl<strong>in</strong>g growth <strong>in</strong> twenty four species ofCompositae. New Phytologist 95: 697–706.Fenner, M. (1992) Environmental <strong>in</strong>fluences on seed size <strong>and</strong> composition. Horticultural Review 13: 183–213.Geritz, S.A.H., van der Meijden, E. & Metz, J.J. (1999) Evolutionary dynamics of seed size <strong>and</strong> seedl<strong>in</strong>gcompetitive ability. Theoretical Population Biology 55: 324–343.Gul, B., Weber, D.J. & Khan, M.A. (2001) Growth, ionic <strong>and</strong> osmotic relations of an Allenrolfea occidentalispopulation <strong>in</strong> an <strong>in</strong>l<strong>and</strong> <strong>salt</strong> playa of the Great Bas<strong>in</strong> Desert. Journal of Arid Environments 4: 445–460.Gutterman, Y. (1994) Strategies of seed dispersal <strong>and</strong> germ<strong>in</strong>ation <strong>in</strong> plants <strong>in</strong>habit<strong>in</strong>g deserts. Botanical Review60: 373–425.Hendry, G.A.F. & Grime, J.P. (1993) Methods <strong>in</strong> Comparative Plant Ecology. A Laboratory Manual.Chapman <strong>and</strong> Hall.Hester, M.W., Mendelssohn, I.A. & McKee, K.L. (2001) Species <strong>and</strong> population variation to sal<strong>in</strong>ity stress <strong>in</strong>Panicum hemitomon, Spart<strong>in</strong>a patens <strong>and</strong> Spart<strong>in</strong>a alterniflora: morphological <strong>and</strong> physiologicalconstra<strong>in</strong>ts. Environmental <strong>and</strong> Experimental Botany 46: 277–297.Keiffer, C.H. & Ungar, I.A. (1997) The effect of extended exposure to hypersal<strong>in</strong>e conditions on the germ<strong>in</strong>ationof five <strong>in</strong>l<strong>and</strong> halophyte species. American Journal of Botany 84: 104–111.Keiffer, C.H. & Ungar, I.A. (2001) The effect of competition <strong>and</strong> edaphic conditions on the establishment ofhalophytes on br<strong>in</strong>e effected soils. Wetl<strong>and</strong> Ecology Management 9: 469–481.Khan, M.A. & Gulzar, S. (2003) Germ<strong>in</strong>ation responses of Sporobolus ioclados: a sal<strong>in</strong>e desert grass. Journal ofArid Environments 53: 387–394.Khan, M.A. & Rizvi, Y. (1994) Effect of sal<strong>in</strong>ity, temperature, <strong>and</strong> growth regulators on the germ<strong>in</strong>ation <strong>and</strong>early seedl<strong>in</strong>g growth of Atriplex griffithii var. stocksii. Can<strong>and</strong>ian Journal of Botany 72: 475–479.Khan, M.A. & Ungar, I.A. (1996) Influence of sal<strong>in</strong>ity <strong>and</strong> temperature on the germ<strong>in</strong>ation of Haloxylonrecurvum Bunge ex. Boiss. Annals of Botany 78: 547–551.Khan, M.A. & Ungar, I.A. (1998) Germ<strong>in</strong>ation of the <strong>salt</strong> tolerant shrub Suaeda fruticosa from Pakistan: sal<strong>in</strong>ity<strong>and</strong> temperature responses. Seed Science Technology 26: 657–667.Khan, M.A., Ahmed, M.Z. & Hameed, A. (2006) Effect of sea <strong>salt</strong> <strong>and</strong> L-ascorbic acid on the seed germ<strong>in</strong>ationof halophytes. Journal of Arid Environments 67: 535–540.113
Chapter 6 Effects of sal<strong>in</strong>ity on germ<strong>in</strong>ationKroker, S.J. (1996) Seed <strong>and</strong> seedl<strong>in</strong>g biology of three Frankenia species. BSc. (Honours) Degree thesis,Fl<strong>in</strong>ders University, Adelaide, Australia.Leishman, M.R. & Westoby, M. (1994) The role of seed size <strong>in</strong> seedl<strong>in</strong>g establishment <strong>in</strong> dry soil conditions –experimental evidence from semi-arid species. Journal of Ecology 82: 249–258.Mazer, S.J. (1990) Seed mass of Indiana Dune genera <strong>and</strong> families: taxonomic <strong>and</strong> ecological correlates.Evolutionary Ecology 4: 326–357.Milberg, P., Anderson, L., Elfverson, C. & Regnér, S. (1996) Germ<strong>in</strong>ation characteristics of seeds differ<strong>in</strong>g <strong>in</strong>mass. Seed Science Research 6: 191–197.Pujol, J.A., Calvo, J.F. & Diaz, L.R. (2000) Recovery of germ<strong>in</strong>ation from different osmotic conditions by fourhalophytes from southeastern Spa<strong>in</strong>. Annals of Botany 85: 279–286.Ramírez-Padilla, C.A. & Valverde, T. (2005) Germ<strong>in</strong>ation responses of three congeneric cactus species(Neobuxbaumia) with differ<strong>in</strong>g degrees of rarity. Journal of Arid Environments 61: 333–343.Ransom Seed Laboratory. (2003) [Accessed8th May 2008].Rav<strong>in</strong>dran, K.C., Venkatesan, K., Balakrishnan, V., Chellappan, K.P. & Balasubramanian, T. (2007) Restorationof sal<strong>in</strong>e l<strong>and</strong> by halophytes for Indian soils. Soil Biology <strong>and</strong> Biochemistry 39: 2661–2664.Rubio-Cas, A.E., Castillo, J.M., Luque, C.J. & Figueroa, M.E. (2003) Influence of sal<strong>in</strong>ity on germ<strong>in</strong>ation <strong>and</strong>seeds viability of two primary colonizers of Mediterranean <strong>salt</strong> pans. Journal of Arid Environments 53:145–154.Salisbury, E. (1974) Seed size <strong>and</strong> mass <strong>in</strong> relation to environment. Proceed<strong>in</strong>gs of the Transactions of the RoyalSociety London B. 186: 83–88.Shanberg, I. (1975) Sal<strong>in</strong>ity of soils – effects of sal<strong>in</strong>ity on the physics <strong>and</strong> chemistry of soils. In: Plants <strong>in</strong>sal<strong>in</strong>e environments. J. Gale (ed.). Spre<strong>in</strong>ger-Verlag, Berl<strong>in</strong>.Summerhayes, V.S. (1930) A revision of the Australian species of Frankenia. L<strong>in</strong>nean Journal of Botany 48:337–387.Susko, D.J. & Lovett Doust, L. (2000) Patterns of seed mass variation <strong>and</strong> their effects on seedl<strong>in</strong>g traits <strong>in</strong>Allaria petiolata (Brassicaceae). American Journal of Botany 87: 56–66.Tobe, K., Li, X.M. & Omasa, K. (2000) Effects of sodium chloride on seed germ<strong>in</strong>ation <strong>and</strong> growth of twoCh<strong>in</strong>ese desert shrubs, Haloxylon ammodendron <strong>and</strong> H. persicum (Chenopodiaceae). AustralianJournal of Botany 48: 455–460.Trudgill, D.L., Squire, G.R. & Thompson, K. (2000) A thermal basis for compar<strong>in</strong>g the germ<strong>in</strong>ationrequirements of some British herbaceous plants. New Phytologist 145: 107–114.Ungar, I.A. (1978) Halophyte seed germ<strong>in</strong>ation. Botanical Review 44: 233–264.Ungar, I.A. (1991) Ecophysiology of Vascular Halophytes. CRC Press.Ungar, I.A. (1996) Effect of sal<strong>in</strong>ity on seed germ<strong>in</strong>ation, growth <strong>and</strong> ion accumulation of Atriplex patula(Chenopodiaceae). American Journal of Botany 83: 604–607.Vicente, O., Boscaiu, M., Naranjo, M.A., Estrelles, E., Belles, J.M. & Soriano, P. (2004) Responses to <strong>salt</strong> stress<strong>in</strong> the halophyte Plantago crassifolia (Plantag<strong>in</strong>aceae). Journal of Arid Environments 58: 463–481.Westoby, M., Falster, D.S., Moles, A.T., Vesk, P.A. & Wright, I.J. (2002) Plant ecology strategies: Some lead<strong>in</strong>gdimensions of variation between species. Annual Review of Ecology & Systematics 33: 125–159.114
Chapter 6 Effects of sal<strong>in</strong>ity on germ<strong>in</strong>ationWoodell, S.R.J. (1985) Sal<strong>in</strong>ity <strong>and</strong> seed germ<strong>in</strong>ation patterns <strong>in</strong> coastal plants. Vegetatio 61: 223–229.Wrigley, J.W. & Fagg, M. (2003) Australian native plants: Cultivation, use <strong>in</strong> l<strong>and</strong>scap<strong>in</strong>g, <strong>and</strong> propagation(5 th ed.). Reed New Holl<strong>and</strong> Publish<strong>in</strong>g, Australia.Wulff, R.D. (1986) Seed size variation <strong>in</strong> Desmodium paniculatum. II. Effects on seedl<strong>in</strong>g growth <strong>and</strong>physiological performance. Journal of Ecology 74: 99–114.Yensen, N.P. (1995) In: Biology of Salt Tolerant Plants. M.A. Khan. & I.A. Ungar (eds.). University ofKarachi, Pakistan. pp 1–12.Zubr<strong>in</strong>ich, T.M. (1990) An experimental exam<strong>in</strong>ation of factors <strong>in</strong>fluenc<strong>in</strong>g zonation of the halophyte plantspecies, Frankenia pauciflora <strong>in</strong> a Goolwa <strong>salt</strong> marsh. BSc. (Honours) thesis, Fl<strong>in</strong>ders University,Adelaide, Australia.115
Chapter 6 Effects of sal<strong>in</strong>ity on germ<strong>in</strong>ationSpeciesReferencenumberF. c<strong>in</strong>erea LE03038LE03037aLE03057F. cordata LE05006LE05007LE05011F. fecunda LE03013LE03018LE03023F. foliosa LE01004LE01037LE04001F. <strong>in</strong>terioris LE03007LE03012LE03065F. laxiflora LE03014LE03031LE03047F. pauciflora (SALE04021varieties)LE05025LE05026F. pauciflora (WAvarieties)LE03005LE03037bLE03039F. serpyllifolia LE01038LE02007LE02013F. sessilis LE03001LE03066LE01007F. setosa LE01041LE03035LE03040F. tetrapetala LE03056LE03058LE03061Location GPS co -ord<strong>in</strong>ates Mean seed mass(±se) μgmsShark Bay, WA S26°10’10” E113°40’55”NRShark Bay, WA S26°01’18” E113°35’07”61 (±2)Lake K<strong>in</strong>g, WA S35°05’24” E119°36’37”95 (±3)Ormiston Gorge, NTRa<strong>in</strong>bow Valley, NTCurt<strong>in</strong> S pr<strong>in</strong>gs, NTLeonora, WALake Mir<strong>and</strong>a, WALake Aust<strong>in</strong>, WAWest F<strong>in</strong>nis Spr<strong>in</strong>gs, SABirdsville Track, SAStrzelecki TrackCoolgardie, WALake Goongarrie, WAMundrabilla, WALeonora, WAMt Narryer, WAH<strong>in</strong>es Hill, WACoorong, SAPt Rickaby, SAPt Gawler, SAKambalda, WAShark Bay, WALeeman, WABirdsville Track, SABungadill<strong>in</strong>a Creek, SAMt Barry Station, SACactus Beach,SA Head of Bight, SAEucla, WACarnarvon Range, WAGascoyne Junction, WAKalbarri, WALake Newton, WANewdegate, WAGrasspatch, WAS23°40’45” E132°42’42”S24°19’57” E133°37’53”S25°21’01” E131°50’47”S29°01’59” E121°29’13”S27°41’58” E120°32’32”S27°36’07” E117°53’3 1”S29°30’05’ E137°24’29”S29°20’13” E139°19’32”S29°33’27” E139°25’08”S30°58’20” E121°03’11”S30°00’56” E121°09’46”S31°54’37” E127°21’26”S28°16’52” E 121 °07’26”S28°42’13” E 115 °53’24”S31°34’55” E117°58’37”S36°03’20” E139 °35 ’21”S34°40’50” E 137 °29’37”S34°38’35” E138°26’22”S31°13’20” E 121 °30’01”S35°05’24” E 119 °36’37”S29°41’23” E114°32’36”S29°12’38” E138°23’58”S28°16’33” E 135 °50’16”S28°13’40” E 134 °48’12”S32°03’56” E132°59’37”S31°28’28” E131 °05’41”S31°42’49” E 128 °53’06”S25°08’44” E 120 °14’20”S24°51’18” E 115 °18’20”S27°45’23” E 114 °08’21”S32°57’39” E119°36’33”S33°11’29” E 119 °12’49”S33°25’09” E 121 °42”32”391 (±18)295 (±16)375 (±9)52 (±25)48 (±2)82 (±2)115 (±4)81 (±4)43 (±1)343 (±9)320 (±85)286 (±62)86 (±4)105 (±4)72 (±1)106 (±7)145 (±7)128 (±8)57 (±2)59 (±5)59 (±2)452 (±9)724 (±21)537 (±16)239 (±9)194 (±25)138 (±3)688 (±22)1214 (±34)832 (±28)135 (±3)135 (±3)185 (±11)Table 1. Species <strong>in</strong>cluded <strong>in</strong> experiments, site reference numbers, location, <strong>and</strong> GPS co-ord<strong>in</strong>ates for eachpopulation, <strong>and</strong> mean weights (with st<strong>and</strong>ard errors) of seeds per population, <strong>in</strong> micrograms. ‘NR’ de<strong>not</strong>es data<strong>not</strong> recorded. ‘SA’ de<strong>not</strong>es South Australia. ‘WA’ de<strong>not</strong>es Western Australia. ‘NT de<strong>not</strong>es Northern Territory.116
Chapter 6 Effects of sal<strong>in</strong>ity on germ<strong>in</strong>ationSal<strong>in</strong>ity level Day 2 Day 4 Day 6 Day 80% 5.667 *** 10.88 *** 6.38 *** 3.48 ***10% 1.32 (NS) 7.33 *** 4.95 *** 4.49 ***20% 0.96 (NS) 1.45 (NS) 3.71 *** 3.03 ***30% 0.00 2.84 *** 4.46 *** 1.57 (NS)Table 2. Results of ANOVAs calculated for differences <strong>in</strong> germ<strong>in</strong>ation rates between Frankenia species at 0%,10%, 20%, <strong>and</strong> 30% sal<strong>in</strong>ity levels, for Day 2, Day 4, Day 6, <strong>and</strong> Day 8. ‘NS’ de<strong>not</strong>es no significant difference.‘***’ de<strong>not</strong>es P
Chapter 6 Effects of sal<strong>in</strong>ity on germ<strong>in</strong>ation0% sal<strong>in</strong>ity 10% sal<strong>in</strong>ity 20% sal<strong>in</strong>ity 30% sal<strong>in</strong>ity All sal<strong>in</strong>ities%<strong>germ<strong>in</strong>ate</strong>%recover%<strong>germ<strong>in</strong>ate</strong>%recover%<strong>germ<strong>in</strong>ate</strong>%recover%<strong>germ<strong>in</strong>ate</strong>%recover%<strong>germ<strong>in</strong>ate</strong>%recoverF. c<strong>in</strong>erea 91.7 0.0 83.3 26.7 28.9 89.1 8.3 80.0 53.1 75.1F. cordata 90.0 0.0 83.3 20.0 23.9 74.5 14.4 74.7 52.9 65.8F. fecunda 78.3 10.3 61.7 46.4 14.4 59.7 7.2 76.1 40.4 59.4F. foliosa 92.2 7.1 73.3 47.9 20.6 87.4 3.3 82.8 47.4 77.3F. <strong>in</strong>terioris 96.7 0.0 91.7 60.0 36.7 90.4 25.0 92.6 62.5 87.8F. laxiflora 75.0 0.0 73.9 14.9 28.3 62.8 7.8 66.9 46.3 51.4F. pauciflora (SA) 93.9 45.5 69.4 65.5 27.8 83.8 7.8 85.5 49.7 80.7F. pauciflora (WA) 68.9 0.0 47.8 13.8 12.2 48.7 2.8 48.0 32.9 36.0F. serpyllifolia 94.4 0.0 88.9 35.0 48.3 83.9 26.7 84.1 64.6 76.9F. sessilis 92.2 14.3 63.9 64.6 16.1 94.7 4.4 88.4 44.2 84.3F. setosa 86.7 0.0 85.6 7.7 76.1 53.5 53.3 63.1 75.4 44.1F. tetrapetala 86.1 8.0 67.8 65.5 25.0 88.9 10.0 82.1 47.2 77.1Table 3. Germ<strong>in</strong>ation percentages at solution sal<strong>in</strong>ities of 0%, 10%, 20% <strong>and</strong> 30%, <strong>and</strong> percentage germ<strong>in</strong>ation after transferr<strong>in</strong>g un<strong>germ<strong>in</strong>ate</strong>d seeds <strong>in</strong>todistilled <strong>water</strong> for a further 14 days.
Chapter 6 Effects of sal<strong>in</strong>ity on germ<strong>in</strong>ationdfdfdenom<strong>in</strong>atorMeanSquaresF-valueSignificancelevelPartial EtaSquaredGERMINATION RATESDay 2Seed category 1 10 94.71 0.365 0.322Species(seed category) 10 30 257.67 6.093 0.035Sal<strong>in</strong>ity 3 30 272.25 6.438 *** 0.670Seed category*sal<strong>in</strong>ity 3 30 10.74 0.254 ** 0.392Sal<strong>in</strong>ity*species(seed category) 10 30 257.67 6.093 *** 0.670Day 4Seed category 1 10 3800.41 8.521 * 0.460Species(seed category) 10 30 446.00 5.352 *** 0.641Sal<strong>in</strong>ity 3 30 8206.16 98.48 *** 0.908Seed category*sal<strong>in</strong>ity 3 30 138.79 1.665 0.143Sal<strong>in</strong>ity*species(seed category) 10 30 446.00 5.352 *** 0.641Day 6Seed category 1 10 718.29 4.60 *** 0.973Species(seed category) 10 30 156.02 1.002 0.315Sal<strong>in</strong>ity 3 30 6236.92 40.065 0.250Seed category*sal<strong>in</strong>ity 3 30 402.47 2.585 *** 0.800Sal<strong>in</strong>ity*species(seed category) 10 30 156.02 1.002 0.250Day 8Seed category 1 10 36.80 0.362 0.035Species(seed category) 10 30 101.69 0.866 0.224Sal<strong>in</strong>ity 3 30 2023.26 17.229 *** 0.633Seed category*sal<strong>in</strong>ity 3 30 557.45 4.747 ** 0.322Sal<strong>in</strong>ity*species(seed category) 10 30 101.70 0.866 0.224GERMINATION SUCCESSDay 8Seed category 1 10 4842.19 5.844 * 0.369Species(seed category) 10 30 828.60 3.052 ** 0.504Sal<strong>in</strong>ity 3 30 47516.23 175.00 *** 0.946Seed category*sal<strong>in</strong>ity 3 30 157.134 0.579 0.055Sal<strong>in</strong>ity*species(seed category) 10 30 271.56 3.052 ** 0.504Day 28Seed category 1 10 5941.84 5.150 * 0.340Species(seed category) 10 30 1153.66 4.696 *** 0.610Sal<strong>in</strong>ity 3 30 43724.77 177.987 *** 0.947Seed category*sal<strong>in</strong>ity 3 30 137.90 0.561 0.053Sal<strong>in</strong>ity*species(seed category) 10 30 1153.66 4.700 *** 0.610Table 4. Summary of the <strong>in</strong>teraction effects of sal<strong>in</strong>ity, seed mass category <strong>and</strong> species on germ<strong>in</strong>ation rates,calculated us<strong>in</strong>g Nested Design ANOVAs, at Day 2, Day 4, Day 6 <strong>and</strong> Day 8, <strong>and</strong> for germ<strong>in</strong>ation success atDay 8 <strong>and</strong> Day 28. (*) <strong>in</strong>dicates a significance level of P
Chapter 6 Effects of sal<strong>in</strong>ity on germ<strong>in</strong>ationSal<strong>in</strong>ity Day Effect df dfdenom<strong>in</strong>atorMeansquaresF-valueSignificancelevelPartial EtaSquared0%Rates 2 Seed category 1 10 34.20 0.182 * 0.454Species(seed category) 10 24 187.51 1.808 0.0184 Seed category 1 10 948.33 3.599 0.265Species(seed category) 10 24 263.52 1.204 0.3346 Seed category 1 10 125.89 0.512 0.049Species(seed category) 10 24 245.82 1.893 0.4418 Seed category 1 10 498.33 6.669 * 0.400Species(seed category) 10 24 74.72 0.691 0.224Success 28 Seed category 1 10 531.53 2.717 0.214Species(seed category) 10 24 195.60 0.868 0.26610%Rates 2 Seed category 1 10 44.44 0.452 0.043Species(seed category) 10 24 98.27 3.58 ** 0.5994 Seed category 1 10 1378.64 4.663 0.318Species(seed category) 10 24 295.65 1.848 0.4356 Seed category 1 10 47.518 0.399 0.038Species(seed category) 10 24 119.024 1.272 0.3468 Seed category 1 10 43.25 0.508 0.048Species(seed category) 10 24 85.10 1.334 0.357Success 28 Seed category 1 10 1283.91 3.024 0.232Species(seed category) 10 24 424.51 0.861 0.26420%Rates 2 Seed category 1 10 48.28 0.489 0.047Species(seed category) 10 24 98.74 12.425 *** 0.8384 Seed category 1 10 1684.56 15.221 ** 0.604Species(seed category) 10 24 110.67 1.931 0.4466 Seed category 1 10 1229.55 7.765 * 0.437Species(seed category) 10 24 158.34 1.953 0.4498 Seed category 1 10 60.114 0.465 0.511Species(seed category) 10 24 129.33 1.300 0.351Success 28 Seed category 1 10 2203.83 2.738 0.215Species(seed category) 10 24 805.02 3.689 ** 0.60630%Rates 2 Seed category 1 10 0.00Species(seed category) 10 24 0.004 Seed category 1 10 205.25 7.851 * 0.440Species(seed category) 10 24 26.15 0.743 0.2366 Seed category 1 10 522.73 5.235 * 0.344Species(seed category) 10 24 99.86 1.680 0.4128 Seed category 1 10 1107.48 6.718 * 0.402Species(seed category) 10 24 164.85 4.659 ** 0.660Success 28 Seed category 1 10 2336.27 5.019 * 0.334Species(seed category) 10 24 465.53 8.670 *** 0.783Table 5. Summary of the <strong>in</strong>teraction effect of seed mass <strong>and</strong> species on germ<strong>in</strong>ation rates, calculated us<strong>in</strong>gNested Design ANOVAs, at Day 2, Day 4, Day 6 <strong>and</strong> Day 8, <strong>and</strong> for germ<strong>in</strong>ation success at Day 28, at 0%,10%, 20%, <strong>and</strong> 30% sal<strong>in</strong>ity. (*) <strong>in</strong>dicates a significance level of P
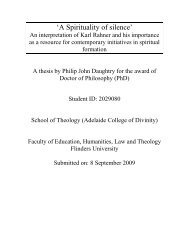
Chapter 6 Effects of sal<strong>in</strong>ity on germ<strong>in</strong>ation25(a)Day 225(b)20Day 4Day 620Day 8Timson's <strong>in</strong>dex1510xTimson's Inde15105500%F. c<strong>in</strong>erea10% 20% 30% 0%F. cordata10% 20% 30% 0%F. fecunda10% 20% 30%00%F . fo lio s a10% 20% 30% 0%F. <strong>in</strong>terioris10% 20% 30% 0%F. laxiflora10% 20% 30%25(c)25(d)2020xTimson's Inde1510Timson's Index15105500%F. pauciflora(SA)10% 20% 30% 0%F. pauciflora(WA)10% 20% 30% 0%F. s erpyllifolia10% 20% 30%00%F . s e s s ilis10% 20% 30% 0%F. setosa10% 20% 30% 0%F. tetrapetala10% 20% 30%Figure 1. Germ<strong>in</strong>ation rates, calculated us<strong>in</strong>g a modified Timson Index at Days 2, Day 4, Day 6, <strong>and</strong> Day 8, at sal<strong>in</strong>ity levels of 0%, 10%, 20%, <strong>and</strong> 30%. (a) comprises F.c<strong>in</strong>erea, F. cordata <strong>and</strong> F. fecunda. (b) comprises F. foliosa, F. <strong>in</strong>terioris <strong>and</strong> F. laxiflora. (c) comprises F. pauciflora (SA), F. pauciflora (WA) <strong>and</strong> F. serpyllifolia. (d)comprises F. sessilis, F. setosa <strong>and</strong> F. tetrapetala.
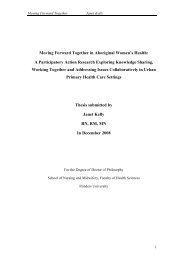
Chapter 6 Effects of sal<strong>in</strong>ity on germ<strong>in</strong>ation0% sal<strong>in</strong>ity (a)0% sal<strong>in</strong>ity (b)1001009080541290809 7101112Percent (T50)7060504036Percent (T50)706050408303020201010Percent (T50)00 2 4 6 8 10 12 14 16 18 20 22 24 26 28Day10% sal<strong>in</strong>ity (a)10090807060504030201000 2 4 6 8 10 12 14 16 18 20 22 24 26 28Day521643Percent (T50)00 2 4 6 8 10 12 14 16 18 20 22 24 26 28Day10% sal<strong>in</strong>ity (b)10090911807701260105084030201000 2 4 6 8 10 12 14 16 18 20 22 24 26 28Day20% sal<strong>in</strong>ity (a)20% sal<strong>in</strong>ity (b)10090100908070807011Percent (T50)60504030201000 2 4 6 8 10 12 14 16 18 20 22 24 26 28Day516243Percent (T50)605094030712201081000 2 4 6 8 10 12 14 16 18 20 22 24 26 28Day30% sal<strong>in</strong>ity (a)30% sal<strong>in</strong>ity (b)Percent (T50)100908070605040Percent (T50)10090807060504011305202101 63400 2 4 6 8 10 12 14 16 18 20 22 24 26 28Day309201210710080 2 4 6 8 10 12 14 16 18 20 22 24 26 28DayFigure 2. Germ<strong>in</strong>ation success of each species for each sal<strong>in</strong>ity level (0%, 10%, 20%, 30%) over 28 days.Species are designated numbers as follows: (1) F. c<strong>in</strong>erea, (2) F. cordata, (3) F. fecunda, (4) F. foliosa, (5) F.<strong>in</strong>terioris, (6) F. laxiflora, (7) F. pauciflora (SA), (8) F. pauciflora (WA), (9) F. serpyllifolia, (10) F. sessilis,(11) F. setosa, <strong>and</strong> (12) F. tetrapetala.