Analysis of ductile fracture in damaged pipelines by ... - ResearchGate
Analysis of ductile fracture in damaged pipelines by ... - ResearchGate
Analysis of ductile fracture in damaged pipelines by ... - ResearchGate

You also want an ePaper? Increase the reach of your titles
YUMPU automatically turns print PDFs into web optimized ePapers that Google loves.
Eng<strong>in</strong>eer<strong>in</strong>g Structures 21 (1999) 924–936www.elsevier.com/locate/engstruct<strong>Analysis</strong> <strong>of</strong> <strong>ductile</strong> <strong>fracture</strong> <strong>in</strong> <strong>damaged</strong> pipel<strong>in</strong>es <strong>by</strong> a geometricparameter methodAlberto Corigliano * , Giulio Maier, Stefano MarianiDepartment <strong>of</strong> Structural Eng<strong>in</strong>eer<strong>in</strong>g, Politecnico <strong>of</strong> Milano, piazza L. da V<strong>in</strong>ci 32, 20133 Milan, ItalyReceived 9 October 1997; received <strong>in</strong> revised form 16 February 1998; accepted 24 February 1998AbstractNumerical simulations <strong>by</strong> a geometric parameter approach <strong>of</strong> <strong>ductile</strong> <strong>fracture</strong> processes <strong>in</strong> <strong>damaged</strong> pipel<strong>in</strong>es are here presentedand discussed. The geometric parameters are the crack-tip-open<strong>in</strong>g-displacement (CTOD) and the crack-tip-open<strong>in</strong>g-angle (CTOA):follow<strong>in</strong>g recent literature, they are assumed to govern the onset <strong>of</strong> crack propagation and the subsequent propagation phase,respectively. A simplified procedure is proposed for the identification <strong>of</strong> critical CTOA c as a function <strong>of</strong> the tip advancement.Numerical simulations <strong>of</strong> crack propagation <strong>in</strong> Three-Po<strong>in</strong>t-Bend<strong>in</strong>g Tests and <strong>in</strong> pressurised <strong>damaged</strong> pipel<strong>in</strong>es are criticallypresented and compared with experiments and with numerical simulations based on the use <strong>of</strong> Gurson’s model. © 1999 ElsevierScience Ltd. All rights reserved.Keywords: Ductile <strong>fracture</strong>; Geometric parameters; Pipel<strong>in</strong>es1. IntroductionDuctile <strong>fracture</strong> characterised <strong>by</strong> large-scale yield<strong>in</strong>g(LSY) is a phenomenon <strong>of</strong> major importance for thedesign and <strong>in</strong>tegrity assessment <strong>of</strong> steel structures, suchas pressure vessels and pressurised pipel<strong>in</strong>es, <strong>in</strong> a variety<strong>of</strong> <strong>in</strong>dustrial situations. In the presence <strong>of</strong> LSY, andespecially <strong>of</strong> local unstress<strong>in</strong>g <strong>of</strong> plastically deformedmaterial, the traditional J-<strong>in</strong>tegral approach to elasticplastic<strong>fracture</strong> mechanics is known to become <strong>in</strong>accurateor even <strong>in</strong>applicable to eng<strong>in</strong>eer<strong>in</strong>g purposes [1–3].In the recent literature alternative approaches havebeen proposed. A noteworthy one rests on an extension<strong>of</strong> the J-<strong>in</strong>tegral theory and is characterised <strong>by</strong> the use,besides the J-<strong>in</strong>tegral, <strong>of</strong> a second <strong>fracture</strong> parameter,which is related to higher order approximations <strong>of</strong> theasymptotic (near tip) solution [4–8]. Another approach,which is at present <strong>in</strong>creas<strong>in</strong>gly studied, is rooted <strong>in</strong>micromechanics and rests on constitutive laws which<strong>in</strong>clude a phenomenological description <strong>of</strong> local damageprocesses lead<strong>in</strong>g to crack <strong>in</strong>itiation and propagation.Representative <strong>of</strong> this k<strong>in</strong>d <strong>of</strong> damage laws is the Gur-* Correspond<strong>in</strong>g author. Tel.: 39-2-2399-4244; Fax: 39-2-2399-4220.son’s model, <strong>in</strong> which crack generation and advancementare l<strong>in</strong>ked to the evolution <strong>of</strong> porosity as a manifestation<strong>of</strong> void <strong>in</strong>itiation and growth up to coalescence [9,10].The geometric approach adopted here<strong>in</strong> for numericalsimulations is motivated <strong>by</strong> its computational simplicityand <strong>by</strong> empirical and phenomenological arguments [11–18]. The basic hypotheses are that the shape <strong>of</strong> the cracknear the tip can be characterised <strong>by</strong> the crack tip open<strong>in</strong>gdisplacement (CTOD) and the crack tip open<strong>in</strong>g angle(CTOA) and that these geometric parameters, and theirexperimentally determ<strong>in</strong>ed critical values, govern the<strong>fracture</strong> process, at least when it occurs <strong>in</strong> mode I. Thisunderly<strong>in</strong>g assumption, not endowed with micromechanicalor physical motivation, has been corroborated <strong>by</strong>experiments on pipel<strong>in</strong>e steels [19,20].In this paper the geometric method is <strong>in</strong>vestigatedthrough its usage <strong>in</strong> simulat<strong>in</strong>g <strong>ductile</strong> crack propagationprelim<strong>in</strong>arily <strong>in</strong> three-po<strong>in</strong>t-bend<strong>in</strong>g (TPB) specimens toparameter identification purposes and, subsequently, <strong>in</strong>pressurised pipes (for <strong>in</strong>dustrial purposes). The relevanceand timel<strong>in</strong>ess <strong>of</strong> <strong>fracture</strong> mechanics <strong>in</strong> the design and<strong>in</strong>tegrity assessment <strong>of</strong> important <strong>in</strong>frastructures, such aspressurised pipel<strong>in</strong>es, have been elucidated, e.g. <strong>by</strong> Kann<strong>in</strong>enand O’Donoghue [15].The objectives <strong>of</strong> the paper are: to assess the feasibility,<strong>in</strong> an <strong>in</strong>dustrial environment, <strong>of</strong> <strong>ductile</strong> <strong>fracture</strong>0141-0296/99/$ - see front matter © 1999 Elsevier Science Ltd. All rights reserved.PII: S0141-0296(98)00040-6
A. Corigliano et al. /Eng<strong>in</strong>eer<strong>in</strong>g Structures 21 (1999) 924–936925simulations based on the geometric approach andspecifically concern<strong>in</strong>g pressurised pipel<strong>in</strong>es; to exam<strong>in</strong>ethe aptitude <strong>of</strong> these simulations to atta<strong>in</strong> a satisfactorycompromise between the conflict<strong>in</strong>g requirements <strong>of</strong>simplicity and realism; to perform a calibration and validation<strong>of</strong> the geometric analysis procedure, keep<strong>in</strong>g <strong>in</strong>m<strong>in</strong>d the high costs <strong>of</strong> <strong>fracture</strong> experiments on gas-ducts.In the simulations large stra<strong>in</strong>s and displacements areallowed for and, as suggested <strong>by</strong> symmetry <strong>in</strong> the geometriesand load<strong>in</strong>g conditions, rectil<strong>in</strong>ear mode I crackpropagation is assumed. The s<strong>of</strong>tware employed is basicallythe commercial f<strong>in</strong>ite element code ABAQUS [21]coupled with user-def<strong>in</strong>ed procedures which govern thecrack advancement.The f<strong>in</strong>al objective <strong>of</strong> the present critical rather thanmethodologically <strong>in</strong>novative study is to provide anorientation <strong>in</strong> plann<strong>in</strong>g and <strong>in</strong>terpret<strong>in</strong>g computerisedanalyses <strong>by</strong> <strong>in</strong>dustrial analysts <strong>in</strong> similar eng<strong>in</strong>eer<strong>in</strong>gsituations.2. Identification <strong>of</strong> critical values <strong>of</strong> geometricparameters <strong>by</strong> means <strong>of</strong> simplified models <strong>of</strong> threepo<strong>in</strong>t-bend<strong>in</strong>gtestsExperimental data on the mode I advancement <strong>of</strong> thecrack tip <strong>in</strong> a <strong>ductile</strong> material (see e.g. Han et al. [20];Guan et al. [22]) suggest that the follow<strong>in</strong>g empiricalcriteria can be regarded as satisfactory to eng<strong>in</strong>eer<strong>in</strong>ganalysis purposes: (a) <strong>in</strong> mode I <strong>fracture</strong> processes, crackpropagation starts when the crack tip open<strong>in</strong>g displacement(CTOD, Fig. 1(a)) reaches a critical level, sayCTOD c ; (b) the subsequent crack growth is controlled <strong>by</strong>the parameter CTOA (Fig. 1(b)) which, after a transitionphase, reaches a constant critical value CTOA c dur<strong>in</strong>gthe steady-state propagation phase.It is worth not<strong>in</strong>g that the geometrical def<strong>in</strong>itions <strong>of</strong>CTOD and CTOA given <strong>in</strong> Fig. 1(a,b) have a clear,unambiguous mean<strong>in</strong>g oriented to the use <strong>in</strong> the context<strong>of</strong> customary f<strong>in</strong>ite element modell<strong>in</strong>g. It is also worthnot<strong>in</strong>g that the CTOA parameter is assumed to characterisesituations <strong>of</strong> grow<strong>in</strong>g crack, <strong>in</strong> which the crack surfaceshave already lost their <strong>in</strong>itial round blunted shapenear the tip.As for the assumption (a), the critical value <strong>of</strong> CTODat the onset <strong>of</strong> crack propagation can be computedaccord<strong>in</strong>g to the British Standards [23] which make use<strong>of</strong> a formula proposed <strong>by</strong> Dawes [24]. More recently, adiscussion on a procedure for comput<strong>in</strong>g CTOD <strong>in</strong> bentspecimens has been presented <strong>by</strong> Kolednik [25,26]. Thesuggested new procedure is based on experimental plots(obta<strong>in</strong>ed from TPB tests) <strong>of</strong> load versus crack-mouthopen<strong>in</strong>g-displacement(CMOD). This empirical procedureis used here<strong>in</strong> only <strong>in</strong> order to identify the criticalCTOD c at the onset <strong>of</strong> crack propagation with referenceto situations <strong>of</strong> large-scale yield<strong>in</strong>g <strong>in</strong> s<strong>in</strong>gle-edgenotched(SEN) bent specimens endowed with deepnotches and made <strong>of</strong> steels usually employed <strong>in</strong> pressurevessels.The variation <strong>of</strong> the parameter CTOA CTOA c upto its constant value CTOA c is identified <strong>in</strong> Section 2.2on the basis <strong>of</strong> the response <strong>of</strong> a TPB test <strong>in</strong>terpreted<strong>by</strong> means <strong>of</strong> the simplified model discussed below <strong>in</strong>Section 2.1.2.1. A simplified (k<strong>in</strong>ematic) description <strong>of</strong> crackgrowth dur<strong>in</strong>g three-po<strong>in</strong>t-bend<strong>in</strong>g testsFig. 1.Def<strong>in</strong>ition <strong>of</strong> the geometric parameters referred to here<strong>in</strong>.As anticipated <strong>in</strong> Section 1, the geometric parameterCTOA can be assumed to govern mode I crack propagation<strong>in</strong> the sense that the crack tip advances only ifCTOA CTOA c . Rice and Sorensen [27] po<strong>in</strong>ted outthat, <strong>in</strong> elastic-perfectly plastic materials, the deformedpr<strong>of</strong>ile <strong>of</strong> a grow<strong>in</strong>g crack asymptotically for r→0 (rbe<strong>in</strong>g the distance from the crack tip) is proportional to(logr)r, which implies a vertical tangent at the tip. Inview <strong>of</strong> this the def<strong>in</strong>ition <strong>of</strong> CTOA has to be suitablychosen. Here<strong>in</strong> CTOA is <strong>in</strong>terpreted as the anglebetween two straight l<strong>in</strong>es emanat<strong>in</strong>g backward from thetip and reach<strong>in</strong>g two po<strong>in</strong>ts located on the crack flanks ata predeterm<strong>in</strong>ed, constant distance from the tip measuredalong the propagation direction (Fig. 1(b)). The concept<strong>of</strong> cohesive stresses across the crack near the tip, notexplicitly envisaged <strong>in</strong> the geometric approach to <strong>ductile</strong><strong>fracture</strong> simulations, might <strong>in</strong>terpret the experimentalevidence <strong>of</strong> <strong>in</strong>creas<strong>in</strong>g sharpen<strong>in</strong>g <strong>of</strong> the crack at the tipdur<strong>in</strong>g the propagation phase.In the available literature CTOA c is usually <strong>in</strong>terpretedas a material constant (see e.g. Kann<strong>in</strong>en and O’Don-
926 A. Corigliano et al. /Eng<strong>in</strong>eer<strong>in</strong>g Structures 21 (1999) 924–936oghue [15]; Wang [28]; Mart<strong>in</strong>elli and Venzi [29]). Inthis paper, CTOA c is <strong>in</strong>stead assumed to vary dur<strong>in</strong>g afirst stage <strong>of</strong> transient crack propagation, and to reach astationary value <strong>in</strong> a subsequent phase <strong>of</strong> steady-statepropagation. Specifically, <strong>in</strong> the present <strong>in</strong>terpretation,the crack starts propagat<strong>in</strong>g with CTOA at the highestvalue (say CTOA 0 c); after some amount a t <strong>of</strong> tipadvancement with decreas<strong>in</strong>g CTOA c CTOA c (a), asteady-state value CTOA c is reached, which is generallymuch lower than CTOA 0 c. In such a model CTOA 0 c,CTOA c and the transition advancement a t are consideredas material parameters which def<strong>in</strong>e the dependenceCTOA c (a) through <strong>in</strong>terpolations to be suitablychosen later (see Eq. (6)).In this and <strong>in</strong> the subsequent section a simple procedureis developed for the identification <strong>of</strong> the abovethree parameters through simulations <strong>of</strong> TPB tests. Tothis aim, use is made <strong>of</strong> a simplified <strong>in</strong>terpretation <strong>of</strong>the TPB test, ma<strong>in</strong>ly based on k<strong>in</strong>ematic assumptions,proposed <strong>by</strong> Mart<strong>in</strong>elli and Venzi [29], on the behaviour<strong>of</strong> the specimen dur<strong>in</strong>g the test. This simplified modelallows one to obta<strong>in</strong> <strong>in</strong> analytical form a theoretical loadversus-displacementrelationship P P(u) dur<strong>in</strong>g crackpropagation and this relationship can be compared to itsexperimental counterpart <strong>in</strong> order to identify the parametersgovern<strong>in</strong>g the function CTOA c (a).With reference to a SEN bent specimen, for the crackpropagation phase <strong>in</strong> a TPB test the follow<strong>in</strong>g hypothesesare assumed: (a) the material behaviour is rigid perfectly-plasticwith a yield limit f 1 2 ( y u ), y and u be<strong>in</strong>g the elastic limit and the ultimate stress, respectively;(b) the two halves (or arms) <strong>of</strong> the specimen rigidlyrotate one respect to the other around a plastic h<strong>in</strong>gecentred on the mid-section; (c) the centre <strong>of</strong> relativerotation is located <strong>in</strong> the mid-section at a distance (W a) from the crack tip, and the plastic rotational factor is <strong>in</strong>dependent from the crack depth a/W (see e.g. Wuet al. [30]).By virtue <strong>of</strong> the hypothesis (c), some geometrical considerations[29] lead to the follow<strong>in</strong>g relation whichl<strong>in</strong>ks the <strong>in</strong>f<strong>in</strong>itesimal crack advancement da to the<strong>in</strong>f<strong>in</strong>itesimal rotation d <strong>of</strong> one arm <strong>of</strong> the specimen withrespect to a fixed reference (see Fig. 2):da1 tan tan(CTOA/2) (W a) (1)d tan(CTOA/2)By separat<strong>in</strong>g the variables a and and <strong>in</strong>tegrat<strong>in</strong>gfrom the <strong>in</strong>itial to the current situation, Eq. (1) yields arelation between the current ligament length (W a)and the current rotation angle :W aW a 0exp 1 tantan(CTOA/2)tan(CTOA/2) 0d (2)Fig. 2.Three Po<strong>in</strong>t Bend<strong>in</strong>g (TPB) test: def<strong>in</strong>ition <strong>of</strong> symbols.where denotes the <strong>in</strong>tegration variable and 0 therotation angle at the onset <strong>of</strong> the crack propagation, i.e.when a a 0 ; the ligament (W a) is measured <strong>in</strong> areference frame rigidly rotat<strong>in</strong>g with one arm <strong>of</strong> thespecimen, Fig. 2.By virtue <strong>of</strong> the above hypotheses (a) and (b), the loadcarry<strong>in</strong>g capacity (<strong>in</strong> terms <strong>of</strong> the load P applied on themid-section) <strong>of</strong> the specimen dur<strong>in</strong>g crack propagationcan be expressed as follows (see Fig. 2):P th fBS (W a) 2 (3)where S (S 2R 2 s<strong>in</strong>); (W a) (W a)/cosThis expression merely represents the plastic collapse(ultimate) load <strong>of</strong> a simply supported notched beamunder central concentrated load<strong>in</strong>g, with thickness B,current span S and current mid-section height (W a) .The constra<strong>in</strong>t factor which shows up as a correctivefactor <strong>in</strong> Eq. (3) is <strong>in</strong>tended to take <strong>in</strong>to account somefeatures <strong>of</strong> the actual two-dimensional collapse mechanismnot reflected <strong>by</strong> the drastic idealisation <strong>of</strong> thespecimen as a rigid-perfectly plastic beam [31]. Factor can be determ<strong>in</strong>ed <strong>in</strong> two different ways, the latter <strong>of</strong>which is adopted here<strong>in</strong>: (i) from the slip-l<strong>in</strong>e field solutionfor the TPB test (see e.g. Wu et al. [30]); (ii) <strong>by</strong>impos<strong>in</strong>g that the ultimate load for a a 0 <strong>in</strong> Eq. (3)equals the maximum load value recorded <strong>in</strong> the experimentalload-versus-displacement plot.Let now the current span S (Eq. (3)) and mid-sectionheight (W a) (Eq. (3)) be expressed <strong>in</strong> terms <strong>of</strong> their<strong>in</strong>itial values and <strong>of</strong> the rotation angle (see Fig. 2);thereafter, mak<strong>in</strong>g use <strong>of</strong> Eq. (2), we obta<strong>in</strong>:P th () fBS (W a) 2
f B(S 2R 2 s<strong>in</strong>) W a 20cos1 tantan(CTOA/2)exp 2tan(CTOA/2) 0for 0 eA. Corigliano et al. /Eng<strong>in</strong>eer<strong>in</strong>g Structures 21 (1999) 924–936d(4)where e denotes the value <strong>of</strong> at the end <strong>of</strong> the <strong>fracture</strong>process, i.e. for a a e W.The load-po<strong>in</strong>t displacement u can be computed as afunction <strong>of</strong> the rotation angle on the basis <strong>of</strong> thegeometry <strong>of</strong> the TPB specimen <strong>in</strong> its deformed configuration(see Fig. 2):u th () S 2 tan (W R 1 R 2 ) 1 cos , (5)cosfor 0 eEq. (4) and (5) can be <strong>in</strong>terpreted as a parametric representation<strong>of</strong> the load-versus-displacement relationshipfor the TPB specimen dur<strong>in</strong>g crack propagation, the variableparameter be<strong>in</strong>g the rotation angle . This approximaterepresentation <strong>of</strong> a TPB test will be used <strong>in</strong> Section2.2 <strong>in</strong> order to identify, for some steels, the functionCTOA c () and, hence, CTOA c (a). It is worth stress<strong>in</strong>gthat the identification procedure will rest only on theexperimental data after crack <strong>in</strong>itiation, so that its resultsare practically not <strong>in</strong>fluenced <strong>by</strong> the very crude approximation<strong>of</strong> the above simplified model for the TPB testbefore crack <strong>in</strong>itiation.2.2. Identification <strong>of</strong> CTOA c as a function <strong>of</strong> the cracktip advancementLet the variation <strong>of</strong> CTOA CTOA c be modelled <strong>by</strong>the follow<strong>in</strong>g function <strong>of</strong> the rotation angle <strong>of</strong> one arm<strong>of</strong> the specimen with respect to a ground reference(Fig. 2):CTOA c CTOA c (CTOA 0 c CTOA c ) t 2 t 0for 0 t (6)CTOA c CTOA c for t eHere CTOA 0 c and CTOA c represent the values <strong>of</strong>CTOA c at the onset <strong>of</strong> crack propagation and dur<strong>in</strong>g steady-statepropagation, respectively. Symbols 0 , t , e <strong>in</strong>Eq. (6) denote the values at the follow<strong>in</strong>g situations:the start <strong>of</strong> transient crack propagation with vary<strong>in</strong>gCTOA c ; the beg<strong>in</strong>n<strong>in</strong>g <strong>of</strong> steady-state crack propagation;the end <strong>of</strong> the propagation phase, respectively.927The procedure here proposed for the identification <strong>of</strong>the above five parameters is based on the knowledge <strong>of</strong>the follow<strong>in</strong>g data from a TPB test under displacementcontrol: the experimental load-versus-displacementrelationship P ex P ex (u); the experimental valuesu 0 ex, P 0 ex <strong>of</strong> the po<strong>in</strong>t <strong>in</strong> the P ex (u) graph correspond<strong>in</strong>gto the onset <strong>of</strong> crack propagation, as revealed <strong>by</strong> a potential-dropdevice; the <strong>in</strong>itial a 0 and f<strong>in</strong>al a e crack lengths,measured (as averages along the thickness) on the specimenafter the test.In SEN bent specimens made <strong>of</strong> low-strength hightoughnesssteels (currently employed <strong>in</strong> transmissionpipel<strong>in</strong>es), such as those considered here<strong>in</strong>, the externalwork dur<strong>in</strong>g a test turns out to be dissipated almost completely<strong>in</strong> the mid-section <strong>fracture</strong> and plastic collapse(plastic h<strong>in</strong>ge activation). Hence, the hypotheses (b) and(c) <strong>in</strong> Section 2.1 appear to be acceptable and the modelproposed there reasonably accurate for <strong>in</strong>terpret<strong>in</strong>gTPB tests.Among the five parameters which govern the functionCTOA c () accord<strong>in</strong>g to Eq. (6), parameters 0 and e canbe directly obta<strong>in</strong>ed from Eq. (5) evaluated at the onsetand at the end <strong>of</strong> crack propagation. The optimal choice<strong>of</strong> the other three is obta<strong>in</strong>ed <strong>by</strong> m<strong>in</strong>imis<strong>in</strong>g, with respectto the parameters CTOA 0 c, CTOA c , and t , a measure <strong>of</strong>the discrepancy between the experimental load P ex (u)and the theoretical one P th (u) i.e.:u em<strong>in</strong> (PCTOA 0 c , CTOA c t th (u) P ex (u)) 2 (7), u 0duu 0 and u e be<strong>in</strong>g the values <strong>of</strong> the load-po<strong>in</strong>t displacementat the onset and at the end <strong>of</strong> the propagation phase,respectively. The m<strong>in</strong>imisation (7) has been carried outhere <strong>by</strong> the simplest direct search, namely <strong>by</strong> select<strong>in</strong>gthe optimal choice <strong>of</strong> parameters with<strong>in</strong> a set <strong>of</strong> predef<strong>in</strong>edtrial po<strong>in</strong>ts.Once the parameters govern<strong>in</strong>g the relationshipCTOA c (), Eq. (6), have been identified, the functionCTOA c (a) can be numerically computed <strong>by</strong> means <strong>of</strong>Eq. (2) and (6) comb<strong>in</strong>ed.The above procedure for the identification <strong>of</strong> the functionCTOA c (a) has been applied to three SEN bentspecimens labelled 1, 2 and 3 <strong>of</strong> steels with different<strong>fracture</strong> toughness and equal elastic moduli (E 207 000 MPa; 0.3). Geometrical and material dataare collected <strong>in</strong> Table 1 together with the identifiedvalues <strong>of</strong> parameters CTOD c , CTOA 0 c, CTOA c and a t .As far as specimen (2) is concerned, the extremelyhigh value <strong>of</strong> CTOA 0 c is partially due to the assumedquadratic variation <strong>of</strong> CTOA c (a) dur<strong>in</strong>g the first stage<strong>of</strong> crack propagation. More accurate results can be achieved<strong>by</strong> <strong>in</strong>creas<strong>in</strong>g the order <strong>of</strong> the simplified polynomial<strong>in</strong>terpolation used dur<strong>in</strong>g this transient propagation
928 A. Corigliano et al. /Eng<strong>in</strong>eer<strong>in</strong>g Structures 21 (1999) 924–936Table 1Geometrical and material data for TPB specimens. E 207 000 Mpa, 0.3Specimen Steel S (mm) B W a 0 (mm) y u K V Charpy CTOD c CTOA 0 c CTOA c a t (mm)number (mm) (N/mm 2 ) (N/mm 2 ) (J/mm 2 ) (micron) (degrees) (degrees)(1) API 5L-X60 48 12 6.26 482. 565. 1.9 33.52 25.00 5.25 1.99(2) API 5L-X65 56 14 5.33 553. 605. 2.6 56.00 180.00 40.00 1.92(3) API 5L-X60 40 10 4.11 545. 629. 1.9 38.57 59.00 7.50 1.33phase, as shown <strong>by</strong> recent experimental results [20]. Thevalue <strong>of</strong> CTOA c is, <strong>by</strong> contrast, close to the one observeddur<strong>in</strong>g the steady-state propagation phase if crackgrowth is governed <strong>by</strong> means <strong>of</strong> the Gurson’s model (seeSection 3.2).In Table 1 the Charpy toughness K V <strong>of</strong> the specimensteels are also reported for the sake <strong>of</strong> completeness.These values have been measured dur<strong>in</strong>g a separate series<strong>of</strong> tests conducted <strong>in</strong> order to determ<strong>in</strong>e thematerial properties.The experimental load-versus-displacement diagramsfor the three specimens are compared <strong>in</strong> Fig. 3 to thetheoretical ones achieved <strong>by</strong> means <strong>of</strong> the simplified(rigid-plastic) model <strong>of</strong> the specimen described <strong>in</strong> Section2.1 after its calibration <strong>by</strong> the above procedure. Fig.3 shows also the theoretical load-versus-displacementplots which result from the hypothesis (adopted <strong>in</strong> theliterature earlier cited) that CTOA c is constant throughoutthe whole crack propagation process. The proposedtheoretical model turns out to accurately <strong>in</strong>terpret thes<strong>of</strong>ten<strong>in</strong>g branch <strong>of</strong> the load-versus-displacement plotsobta<strong>in</strong>ed experimentally. The change <strong>of</strong> curvature afterthe peak load is seen to be correctly represented <strong>by</strong> thevariable CTOA c approach. The comparable accuracyachieved <strong>by</strong> the constant CTOA c approach is ma<strong>in</strong>ly dueto the <strong>in</strong>correct localisation <strong>of</strong> the start<strong>in</strong>g po<strong>in</strong>t <strong>of</strong> crackgrowth. In fact, Fig. 3 shows that the propagation onsetis always estimated, <strong>by</strong> the constant CTOA c approach,to occur after the peak load on the load-versus-displacementplots, while the experimental beg<strong>in</strong>n<strong>in</strong>g <strong>of</strong> crackgrowth happens before it, as assumed <strong>in</strong> the simulationprocedure discussed <strong>in</strong> what precedes.For the three TPB specimens considered, Fig. 4 visu-Fig. 4. Functions CTOA c (a) for the TPB specimens <strong>of</strong> Table 1.Fig. 3. Experimental and theoretical load-versus-displacement for three TPB specimens (R 1 R 2 5 mm; other data <strong>in</strong> Table 1). (a) TPB 1;(b) TPB 2; (c) TPB 3.
A. Corigliano et al. /Eng<strong>in</strong>eer<strong>in</strong>g Structures 21 (1999) 924–936929alises the relationship between CTOA c and crackadvancement, result<strong>in</strong>g from the adopted identificationprocedure. These results show a considerable differencebetween the CTOA c (a) for TPB1 or TPB3 and TPB2,which well represents the significant scatter <strong>in</strong> the steeltoughness measured <strong>by</strong> the values K V from Charpy tests(see Table 1).Clearly more experimental results are needed <strong>in</strong> orderto statistically assess the <strong>in</strong>tr<strong>in</strong>sic uncerta<strong>in</strong>ties for each<strong>of</strong> the identified parameters.3. Comparative simulations <strong>of</strong> <strong>fracture</strong> testsThe analyses <strong>of</strong> <strong>fracture</strong> processes briefly describedbelow (Section 3.1) rest on the assumption that the <strong>fracture</strong>processes are governed <strong>by</strong> the critical values CTOD cand CTOA c (a) accord<strong>in</strong>g to the geometric criteriaassumed <strong>in</strong> Section 2. Analyses based on Gurson’smodel are briefly discussed <strong>in</strong> Section 3.2. In Section3.3 simulations <strong>of</strong> TPB tests <strong>by</strong> both approaches arecomparatively presented and compared to experimentaldata, <strong>in</strong> order to achieve more <strong>in</strong>sight <strong>in</strong>to the performance<strong>of</strong> the k<strong>in</strong>ematic approach adopted <strong>in</strong> what precedes.In all simulations performed <strong>in</strong> this study thef<strong>in</strong>ite element code ABAQUS [21] has been employedfor analyses at fixed boundary conditions along the ligament,i.e. at constant crack length, while ad hoc proceduresexternal to that code have been implemented <strong>in</strong>order to govern the crack advancement. For bothemployed procedures the same f<strong>in</strong>ite element mesh hasbeen used.3.1. F<strong>in</strong>ite element simulations based on the geometricparametersS<strong>in</strong>ce rectil<strong>in</strong>ear mode I crack propagation can a prioribe conjectured <strong>in</strong> TPB <strong>fracture</strong> tests, the adopted f<strong>in</strong>iteelement discretisation <strong>of</strong> the specimen <strong>by</strong> displacementmodell<strong>in</strong>g <strong>in</strong> space rests on structured meshes, withcharacteristic element size along the ligament <strong>of</strong> about1/50 <strong>of</strong> the specimen width W. It is important to noticethat a further reduction <strong>of</strong> the element size along theligament does not change significantly the global structuralresponse [32]. In all computations the materialsconsidered are typical pressure-vessel structural steels(see Table 1), the plastic behaviour <strong>of</strong> which is described<strong>by</strong> means <strong>of</strong> Mises J 2 yield criterion and slight isotropicharden<strong>in</strong>g with saturation.Dur<strong>in</strong>g each simulation, the geometric parametersCTOD and CTOA are computed on the basis <strong>of</strong> displacements<strong>of</strong> nodes ly<strong>in</strong>g on the crack flanks near thetip accord<strong>in</strong>g to the proposal <strong>of</strong> Rice and Sorensen [27].Specifically (cf. Fig. 1(a)), the value <strong>of</strong> CTOD isobta<strong>in</strong>ed as the open<strong>in</strong>g <strong>of</strong> the crack where two l<strong>in</strong>esemanat<strong>in</strong>g from the tip with a slope <strong>of</strong> 45° with respectto the propagation direction <strong>in</strong>tersect the l<strong>in</strong>es which bestfit the deformed crack faces along the <strong>in</strong>itial crack(which has been generated <strong>in</strong> the specimen <strong>by</strong> fatigueload<strong>in</strong>g). When CTOD reaches its critical value CTOD cand, hence, the crack may start propagat<strong>in</strong>g, the node atthe tip is released (i.e. is replaced <strong>by</strong> two separatenodes).Along the subsequent propagation phase controlled <strong>by</strong>the function CTOA c (a), the value <strong>of</strong> CTOA is computedas the angle between the tangents to the modelledcrack surfaces at the tip; these tangent l<strong>in</strong>es are determ<strong>in</strong>ed<strong>by</strong> means <strong>of</strong> the displacements <strong>of</strong> the last releasednode. At each step <strong>of</strong> the analysis, the CTOA is computed<strong>in</strong> the current configuration and compared to thecurrent critical value given <strong>by</strong> the function CTOA c (a),identified as described <strong>in</strong> Section 2.2. When CTOA CTOA c (a) the tip node is released.3.2. F<strong>in</strong>ite element simulations based on Gurson’smodelThe material model orig<strong>in</strong>ally developed <strong>by</strong> Gurson[9] can be regarded as an elastic-plastic s<strong>of</strong>ten<strong>in</strong>g constitutivelaw <strong>in</strong> which the s<strong>of</strong>ten<strong>in</strong>g behaviour is governed<strong>by</strong> an evolution law for the porosity (or void volumefraction) f, i.e. <strong>by</strong> an <strong>in</strong>ternal variable susceptible to be<strong>in</strong>terpreted as a measure, <strong>in</strong> an average sense, <strong>of</strong> thevoid growth.The present f<strong>in</strong>ite element simulations are centred on af<strong>in</strong>ite-stra<strong>in</strong> generalisation <strong>of</strong> the Gurson’s yield criterionwith associated flow rule, <strong>in</strong> the follow<strong>in</strong>g modified formproposed <strong>by</strong> Tvergaard [33,34]: 2 e 2q 2 1 f cosh q 2 k kM2 M 1 (q 1 f) 2 0 (8)where e (3s ij s ij /2) 1/2 is the effective Mises stress,s ij ij G ij k k/3 is the stress deviator, G ij are thecomponents <strong>of</strong> the metric tensor <strong>in</strong> the current configuration, M is the equivalent tensile flow stress <strong>in</strong> thematrix material which surrounds the void. Besides theelastic moduli (E, ) and yield and ultimate stresses ( y , u ) the set <strong>of</strong> parameters <strong>in</strong> this model <strong>in</strong>cludes thosewhich govern the <strong>in</strong>fluence <strong>of</strong> porosity on the materialresponse, namely the <strong>in</strong>itial value f 0 <strong>of</strong> the void volumefraction and the two Tvergaard parameters q 1 , q 2 . Alsothe void nucleation, <strong>in</strong>duced and controlled <strong>by</strong> plasticstra<strong>in</strong>s, is taken <strong>in</strong>to account and reflected at thephenomenological macroscale level <strong>by</strong> the model (seee.g. Chu and Needleman [35]; Tvergaard [10] for a comprehensivethorough description <strong>of</strong> this model).In the simulations presented <strong>in</strong> Section 3.3 f 0 isassumed to be zero; q 1 , q 2 are identified <strong>by</strong> a directsearchm<strong>in</strong>imisation <strong>of</strong> discrepancy between numericaland experimental results concern<strong>in</strong>g each TPB test.
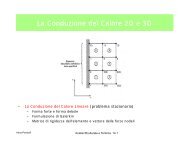
930 A. Corigliano et al. /Eng<strong>in</strong>eer<strong>in</strong>g Structures 21 (1999) 924–936For computational economy, material which behavesaccord<strong>in</strong>g to Gurson’s model has been conf<strong>in</strong>ed to a strip<strong>of</strong> elements (or computational cells) along the propagationdirection, similarly to what done <strong>in</strong> Xia and Shih[36] and Xia et al. [37]; all other elements <strong>in</strong> the meshobey a standard J 2 plasticity constitution, like <strong>in</strong> thesimulations based on the geometric approach. The thickness<strong>of</strong> the strip <strong>of</strong> Gurson elements has been chosen <strong>in</strong>the range 200–300 m. This range has recently beensuggested [36,37] on the basis <strong>of</strong> micromechanical considerations(average distance among <strong>in</strong>clusions) and, <strong>in</strong>a sense, can be regarded as a simple regularisation provision<strong>in</strong> the presence <strong>of</strong> constitutive <strong>in</strong>stability due tos<strong>of</strong>ten<strong>in</strong>g.Us<strong>in</strong>g Gurson’s model, a complete simulation <strong>of</strong> the<strong>ductile</strong> <strong>fracture</strong> process from void <strong>in</strong>itiation to coalescenceup to rupture (material separation) is <strong>in</strong> pr<strong>in</strong>ciplepossible [10,36]. However, this would require regularisationprovisions and ad hoc f<strong>in</strong>ite element modell<strong>in</strong>ghardly compatible with the use <strong>of</strong> a commercial generalpurposecode. Therefore, the node release techniquealready employed <strong>in</strong> the geometric parameter method(Section 2) is adopted here<strong>in</strong>. Specifically, the currenttip node is released when the porosity f reaches theext<strong>in</strong>ction value f E 0.2, which can be <strong>in</strong>terpreted as acritical threshold at which the material is no more ableto susta<strong>in</strong> tractions. The value f E 0.2 has been assumedwith satisfactory results <strong>in</strong> Xia and Shih [36], also onthe basis <strong>of</strong> an earlier study <strong>by</strong> Tvergaard and Needleman[38].identified on the basis <strong>of</strong> the experimental load-versusdisplacementplot for each specimen).In order to check the accuracy <strong>of</strong> the simplified procedure<strong>of</strong> Section 2.1 for the identification <strong>of</strong> therelationship CTOA c CTOA c (a), <strong>in</strong> Fig. 6 the curvestheoretically obta<strong>in</strong>ed for SEN bent specimens 2 and 3<strong>by</strong> the geometric method are compared with the values<strong>of</strong> CTOA computed <strong>in</strong> the simulation based on Gurson’smodel at the <strong>in</strong>stant when the current tip node isreleased. A fairly good agreement can be observedbetween results atta<strong>in</strong>ed <strong>by</strong> the two so diverse approaches.For the TPB 2 only, Fig. 7 shows the f<strong>in</strong>al deformedmesh as arrived at <strong>by</strong> means <strong>of</strong> the geometric and Gurson’ssimulations, both carried out up to almost completecrack propagation across the ligament and, hence, with<strong>in</strong>a phase <strong>of</strong> large displacements and rotations.The results shown <strong>in</strong> Figs. 5–7 can be considered asa positive test for the applicability, at least to TPB testsimulations, <strong>of</strong> the geometric parameter approachdescribed <strong>in</strong> Section 3.1 and for the validity <strong>of</strong> the identificationprocedures discussed <strong>in</strong> Section 2. It can be concludedthat the simple geometric approach leads toresults satisfactorily close to those based on Gurson’smodel and to experimental data. It is worth not<strong>in</strong>g, <strong>in</strong>particular, that allow<strong>in</strong>g for the (identified) variability <strong>of</strong>the function CTOA c (a) always leads to better resultsthan the assumption CTOA c const., both <strong>in</strong> terms <strong>of</strong>load-versus-displacement plots and <strong>in</strong> terms <strong>of</strong> ligamentversus-displacementdiagrams.3.3. Simulation <strong>of</strong> three-po<strong>in</strong>t-bend<strong>in</strong>g tests andcomparisons with experimental resultsReference is made here aga<strong>in</strong> to the three TPB testsconsidered <strong>in</strong> Section 2.2 (for parameter identification).The relevant geometrical and material data are gathered<strong>in</strong> Table 1. In the f<strong>in</strong>ite element analyses performed <strong>in</strong>this study, plane-stra<strong>in</strong> hypothesis has been adopted (<strong>in</strong>view <strong>of</strong> the square section <strong>of</strong> the specimen) and fournodeisoparametric elements have been used for the spatialdiscretisation.In Fig. 5 experimental results concern<strong>in</strong>g the threeTPB tests <strong>of</strong> Table 1 are compared to results <strong>of</strong> simulationscarried out <strong>by</strong> the geometric parameter approach, <strong>in</strong>terms <strong>of</strong> load-versus-displacement graphs and ligamentversus-displacementplots. For the crack propagationphase both the hypothesis <strong>of</strong> CTOA c constant and <strong>of</strong>CTOA c CTOA c (a) have been assumed, <strong>in</strong> the lattercase employ<strong>in</strong>g the values <strong>of</strong> the geometric parametersidentified <strong>in</strong> Section 2 and shown <strong>in</strong> Table 1.For the specimens 2 and 3, Fig. 5 also presents <strong>in</strong> (b)and (c) results provided <strong>by</strong> simulations based on Gurson’smodel (Section 3.2) with the parameters q 1 , q 2given <strong>in</strong> Table 2 (parameters q 1 , q 2 have been directly4. Simulation <strong>of</strong> <strong>ductile</strong> <strong>fracture</strong> <strong>in</strong> a pipel<strong>in</strong>eThe proposed geometric parameter approach to <strong>ductile</strong>crack propagation analysis has been conceived primarilyfor study<strong>in</strong>g <strong>fracture</strong> phenomena <strong>in</strong> pressurised pipes.This section concerns the simulation <strong>of</strong> crack propagationalong the thickness <strong>of</strong> an <strong>in</strong>dented-pressurisedpipe. The numerical results are compared to experimentaldata relevant to a series <strong>of</strong> experiments whichhas not been completed yet. More details on the experimentsand a more deep discussion <strong>of</strong> numerical simulationswill be presented <strong>in</strong> a forthcom<strong>in</strong>g paper.The phenomenon here described is a simplification <strong>of</strong>real-life situations <strong>in</strong> which <strong>in</strong>dentation and notch (dentand-gaugeaccident) can be caused <strong>by</strong>, for example, anagricultural tool hitt<strong>in</strong>g the pipel<strong>in</strong>e; subsequent crackpropagation can be observed due to the <strong>in</strong>ternal pressure<strong>in</strong> the pipe. In the study, only crack propagation alongthe thickness has been considered. This phenomenonusually precedes de-pressurisation and dynamic crackpropagation <strong>in</strong> the axial direction <strong>of</strong> the pipe driven <strong>by</strong>the <strong>in</strong>ternal gas (see e.g. Alpa et al. [39]; Kann<strong>in</strong>en andO’Donoghue [15]).Full scale tests on segments <strong>of</strong> pipel<strong>in</strong>es are conducted
A. Corigliano et al. /Eng<strong>in</strong>eer<strong>in</strong>g Structures 21 (1999) 924–936931Fig. 5. Experimental and numerical results for TPB 1 (a), TPB 2 (b) and TPB 3 (c): load P versus displacement u and residual ligament (W a) versus displacement u.Table 2Gurson’s model parameters for TPB 2 and 3Specimen number q 1 q 2(2) 1.50 1.00(3) 1.60 1.52<strong>by</strong> Snam S.p.a. <strong>in</strong> order to assess the safety <strong>of</strong> pressurisedpipel<strong>in</strong>es aga<strong>in</strong>st dent-and-gauge accidents. Theexperiments concern segments <strong>of</strong> pipes and the dentand-gaugephase precedes the crack propagation phasedur<strong>in</strong>g pressurisation. Fig. 8 represents a segment <strong>of</strong>pipel<strong>in</strong>e with a longitud<strong>in</strong>al notch or defect. First, thestructure is subjected to a radial load which causes an<strong>in</strong>dentation around the defect. This load<strong>in</strong>g phase ()leads to a residual deformed configuration <strong>in</strong> which thediameter <strong>of</strong> the pipe below the defect is reduced (<strong>by</strong> 3%<strong>of</strong> its orig<strong>in</strong>al length). A second phase () consists <strong>of</strong> an<strong>in</strong>ternal pressurisation which leads to crack propagationalong the thickness.The above two phases () and () <strong>of</strong> the load<strong>in</strong>g pro-Fig. 6. CTOA c (a) dependence on tip advancement a for TPBspecimens 2 and 3.
932 A. Corigliano et al. /Eng<strong>in</strong>eer<strong>in</strong>g Structures 21 (1999) 924–936Fig. 7. F<strong>in</strong>al deformed meshes for the TPB specimen 2. (a) Geometricapproach; (b) Gurson model.Fig. 8. Simulated dent-and-gauge accident <strong>in</strong> a pipel<strong>in</strong>e. In mm: D 660, t 11.13, a 0 2.23, L 2200, L i 200.cess have been simulated <strong>by</strong> means <strong>of</strong> both plane stra<strong>in</strong>(2D) and three-dimensional (3D) f<strong>in</strong>ite element discretisations<strong>in</strong> space. The spatial discretisation, <strong>in</strong> the former(2D) case has been performed <strong>by</strong> four-node isoparametricelements, <strong>in</strong> the latter (3D) case <strong>by</strong> shell elementsfar from the defect zone and brick elements around it.In the 2D case the element size along the ligament hasbeen chosen equal to about 1/50 <strong>of</strong> the pipe thickness,as done <strong>in</strong> TPB simulations described <strong>in</strong> the previousSection 3. In the 3D case the brick element size to thicknessratio has been <strong>in</strong>creased to about 1/20 <strong>in</strong> order toreduce the computational burden.In the 2D <strong>in</strong>terpretation <strong>of</strong> the system, the analysesfor the phase () have been carried out <strong>in</strong> two ways:with a traditional Mises elastic-plastic model over thewhole doma<strong>in</strong>; with Gurson’s model <strong>in</strong> the strip <strong>of</strong>elements along the ligament on the radial directionbelow the notch. The f<strong>in</strong>al states <strong>of</strong> the above analyseshave been used as start<strong>in</strong>g states for the numerical simulations<strong>of</strong> crack propagation phase (): the former <strong>by</strong>means <strong>of</strong> the geometric method described <strong>in</strong> Section 3.1;the latter <strong>by</strong> means <strong>of</strong> Gurson’s model (Section 3.2).For the 3D simulation <strong>of</strong> phase () aJ 2 (von Mises)plasticity model was adopted over the whole mesh.Fig. 9(b) provides load (applied on the <strong>in</strong>dentor) versusdisplacement (<strong>of</strong> the po<strong>in</strong>t below the <strong>in</strong>dentor, asdepicted <strong>in</strong> Fig. 9(a)) plots concern<strong>in</strong>g the pre-deformation(<strong>in</strong>dentation) phase (). As it can be observed,the 3D analysis result is not far from the experimentalone, while the (<strong>by</strong> far more economical) 2D simulationdoes not reproduce the actual response (as expecteds<strong>in</strong>ce L i ≪L <strong>in</strong> Fig. 8 and, hence, the <strong>in</strong>dentation is localised<strong>in</strong> both the circumferential and longitud<strong>in</strong>aldirections).In order to simulate the response <strong>of</strong> the pipe along theload<strong>in</strong>g phase (), with crack propagation through thethickness, the numerical approaches <strong>of</strong> Section 3.1 andSection 3.2 have been applied, with parameters identifiedon the basis <strong>of</strong> TPB 3 (see Tables 1 and 2). 3D simulationshave been carried out <strong>by</strong> the geometric parameterapproach only. When CTOA, <strong>in</strong> the transversal symmetryplane <strong>of</strong> the pipe, reaches a critical value the crackpropagates along the thickness ma<strong>in</strong>ta<strong>in</strong><strong>in</strong>g a rectil<strong>in</strong>earfront <strong>in</strong> the longitud<strong>in</strong>al direction. This simplified strategyfor crack advancement disregards the existence <strong>of</strong> acurved crack front <strong>in</strong> the longitud<strong>in</strong>al direction and givesrise to a f<strong>in</strong>al critical situation which is a lower bound<strong>of</strong> the real one.The computed response dur<strong>in</strong>g this phase (), driven<strong>by</strong> <strong>in</strong>creas<strong>in</strong>g <strong>in</strong>ternal pressure, is represented <strong>in</strong> Fig. 10.Namely, <strong>in</strong> Fig. 10(b) through plots which depict therelationship between the pressure and the displacementss <strong>of</strong> the po<strong>in</strong>t ly<strong>in</strong>g on the <strong>in</strong>ternal surface <strong>of</strong> the pipejust below the defect (as shown <strong>in</strong> Fig. 10(a)); <strong>in</strong> Fig.10(c) through diagrams <strong>of</strong> residual ligament versus thesame displacement s (positive upward and referred to thef<strong>in</strong>al configuration after phase () <strong>of</strong> load<strong>in</strong>g). In thesefigures, 2D simulations <strong>by</strong> the geometric and Gursonapproaches can be compared to the 3D simulation carriedout <strong>by</strong> the geometric approach only. A comparison<strong>in</strong> Fig. 10(b) between these graphs and those <strong>of</strong> the computed2D and 3D responses without crack propagationacross the thickness <strong>of</strong> the pipe quantifies the loss <strong>of</strong>stiffness due to the crack growth.In Fig. 10(b) also the experimental response is shown.The 2D simulations show a response which appearsmore compliant than the 3D one. This difference can bedue to the fact that <strong>in</strong> 2D the contribution to resistance
A. Corigliano et al. /Eng<strong>in</strong>eer<strong>in</strong>g Structures 21 (1999) 924–936933Fig. 9.For the pipe <strong>in</strong> Fig. 8 dur<strong>in</strong>g the <strong>in</strong>dentation phase: (a) Visualisation <strong>of</strong> displacement s and load P; (b) load-versus-displacement.Fig. 10. For the pipe <strong>in</strong> Fig. 8 dur<strong>in</strong>g the pressurisation phase: (a) visualisation <strong>of</strong> displacement s and pressure p; (b) pressure-versus-displacementsdur<strong>in</strong>g crack propagation up to failure; (c) residual ligament-versus-displacement.given <strong>by</strong> the non <strong>in</strong>dented sections around the <strong>damaged</strong>zone cannot be taken <strong>in</strong>to account. The differencebetween the experimental plot and the 3D simulated oneis partially justified <strong>by</strong> the way <strong>in</strong> which crack propagates<strong>in</strong> 3D simulations, ma<strong>in</strong>ta<strong>in</strong><strong>in</strong>g a straight front anddisregard<strong>in</strong>g the effect <strong>of</strong> curved crack fronts.All the analyses have been made under load-control,the <strong>in</strong>ternal pressure be<strong>in</strong>g the controlled variable. Thevalue <strong>of</strong> failure pressure has been considered to beco<strong>in</strong>cident with the value <strong>of</strong> the control variable <strong>in</strong> thelast converged step <strong>of</strong> the analyses.At the end <strong>of</strong> the simulations without crack propagation<strong>in</strong> the thickness the follow<strong>in</strong>g values <strong>of</strong> failurepressure have been obta<strong>in</strong>ed: p cr 18.12 MPa for the2D case; p cr 16.84 MPa for the 3D case.At the end <strong>of</strong> the analyses with crack propagation <strong>in</strong>
934 A. Corigliano et al. /Eng<strong>in</strong>eer<strong>in</strong>g Structures 21 (1999) 924–936the thickness, governed <strong>by</strong> the geometric parameters, theobta<strong>in</strong>ed values <strong>of</strong> failure pressures and relevantreductions with respect to the non-propagation case are:p cr 5.49 MPa for the 2D case ( 70%) and p cr 6.17 MPa ( 63%) for the 3D case. Such strongdecreases quantify the carry<strong>in</strong>g capacity loss due to thecrack propagation across the thickness. The ultimatevalues <strong>of</strong> pressure at the end <strong>of</strong> the propagation phaseare not very different <strong>in</strong> 2D and 3D <strong>in</strong>terpretations ( 3.4%), ma<strong>in</strong>ly because after the crack propagation alongits thickness, the pipe recovers almost completely theorig<strong>in</strong>al cyl<strong>in</strong>drical shape.Fig. 11 shows the deformed configuration <strong>of</strong> the pipeat the onset <strong>of</strong> crack tip advancement <strong>in</strong> the 3D simulation.In Fig. 12 the deformed shapes <strong>of</strong> the mesh aroundthe process zone (discretised <strong>by</strong> means <strong>of</strong> brickelements) at the onset and at almost complete crackgrowth are depicted: <strong>in</strong> this figure the darkest zones representthe residual ligaments <strong>in</strong> the longitud<strong>in</strong>al plane<strong>of</strong> symmetry.Generally, the <strong>fracture</strong> analyses <strong>by</strong> means <strong>of</strong> the geometricparameter method, compared to the correspond<strong>in</strong>gones us<strong>in</strong>g Gurson’s model, turned out to be easierto <strong>in</strong>terpret and to implement <strong>in</strong> computer codes and lessdemand<strong>in</strong>g <strong>in</strong> terms <strong>of</strong> comput<strong>in</strong>g time.5. Clos<strong>in</strong>g remarksA computational procedure based on geometric parametersfor the analysis <strong>of</strong> <strong>ductile</strong> <strong>fracture</strong> processes hasbeen presented with reference to three-po<strong>in</strong>t-bend<strong>in</strong>gtests and pressurised steel pipel<strong>in</strong>es affected <strong>by</strong> dentand-gaugeaccidents. The govern<strong>in</strong>g geometric parametersare the crack-tip open<strong>in</strong>g displacement (CTOD)and the crack tip open<strong>in</strong>g angle (CTOA); <strong>in</strong> an <strong>in</strong>itial(transient) propagation phase the latter depends on thetip advancement. By comparisons with experiments andalternative approaches (specifically, <strong>fracture</strong> analysisprocedures <strong>by</strong> Gurson’s porosity model), it has beenshown that a noticeable advantage <strong>of</strong> the geometric parametermethod proposed here<strong>in</strong> is provided <strong>by</strong> its costeffectiveness,namely <strong>by</strong> the comb<strong>in</strong>ation <strong>of</strong> simplicityand technically acceptable accuracy with which crack<strong>in</strong>itiation and propagation up to failure can be numericallysimulated <strong>by</strong> means <strong>of</strong> commercial state-<strong>of</strong>-the-artf<strong>in</strong>ite element codes with marg<strong>in</strong>al user’s <strong>in</strong>terventions.The practical applicability <strong>of</strong> the present methodologyrests on the actual possibility <strong>of</strong> rout<strong>in</strong>ely identify<strong>in</strong>g,through standard laboratory tests and their simplifiedsimulations, the critical values <strong>of</strong> geometric parametersFig. 11.3D deformed mesh for the pipe at the end <strong>of</strong> the <strong>in</strong>dentation phase.
A. Corigliano et al. /Eng<strong>in</strong>eer<strong>in</strong>g Structures 21 (1999) 924–936935<strong>of</strong> crack processes governed <strong>by</strong> s<strong>of</strong>ten<strong>in</strong>g material models,like the Gurson’s one.AcknowledgementsThis work has been carried out <strong>in</strong> the framework <strong>of</strong>a research project sponsored <strong>by</strong> Snam Spa (San Donato,Milan, Italy), which provided the experimental data. Thepermission to publish some <strong>of</strong> the results, fruitful <strong>in</strong>teractionswith G. Bolzoni, S. Venzi and their co-workers,and the contribution <strong>of</strong> S. Testol<strong>in</strong>a, before and after hisgraduation (laurea), are also gratefully acknowledged.ReferencesFig. 12. Particular <strong>of</strong> the 3D deformed mesh at the end <strong>of</strong> the <strong>in</strong>dentationphase and at failure.which describe the crack shape near its tip dur<strong>in</strong>g the<strong>fracture</strong> process.The limitations <strong>of</strong> the above conclusions should bestressed: they hold <strong>in</strong> the peculiar k<strong>in</strong>d <strong>of</strong> eng<strong>in</strong>eer<strong>in</strong>gsituations considered <strong>in</strong> this paper, namely situations <strong>in</strong>which <strong>ductile</strong> <strong>fracture</strong> can be a priori conjectured to substantiallyoccur <strong>in</strong> mode I, as it is frequently the case <strong>in</strong>pipel<strong>in</strong>es and pressure vessels. Lack <strong>of</strong> physical foundationsand <strong>of</strong> micromechanical <strong>in</strong>terpretations does notpermit to warrant a general use <strong>of</strong> the elastic-plastic <strong>fracture</strong>analysis method based on geometric parameters as<strong>in</strong>vestigated <strong>in</strong> this paper. The alternative analysismethod rest<strong>in</strong>g on the use <strong>of</strong> Gurson’s porosity model,has been employed <strong>in</strong> this study for comparisons andrecognised as more versatile and physically sound, butalso significantly more laborious as for rout<strong>in</strong>e computationsto be carried out <strong>in</strong> <strong>in</strong>dustrial environments. Furthermore,simulations <strong>of</strong> crack propagation driven <strong>by</strong>critical values <strong>of</strong> the geometric parameters do not showmesh dependent results, which occur dur<strong>in</strong>g simulation[1] Rice JR. Mathematical analysis <strong>in</strong> the mechanics <strong>of</strong> <strong>fracture</strong>. In:Liebowitz H, editor. Fracture: an advanced treatise. New York:Academic Press, 1968;II:191–311.[2] Broek D. Elementary eng<strong>in</strong>eer<strong>in</strong>g <strong>fracture</strong> mechanics. TheNetherlands: Mart<strong>in</strong>us Nijh<strong>of</strong>f, 1982.[3] Schmitt W, Kienzler R. The J-<strong>in</strong>tegral concept for elastic-plasticmaterial behavior. Engng Fracture Mech 1989;32:409–18.[4] Betegon C, Hancock JW. Two-parameter characterization <strong>of</strong> elastic-plasticcrack tip fields. J Appl Mech 1991;58:104–10.[5] O’Dowd NP, Shih CF. Family <strong>of</strong> crack-tip fields characterized<strong>by</strong> a triaxiality parameter—I. Structure <strong>of</strong> fields. J Mech PhysSolids 1991;39:989–1015.[6] O’Dowd NP, Shih CF. Family <strong>of</strong> crack-tip fields characterized<strong>by</strong> a triaxiality parameter—II. Fracture applications. J Mech PhysSolids 1992;40:939–63.[7] Dodds RH, Shih CF, Anderson TL. Cont<strong>in</strong>uum and micromechanicstreatment <strong>of</strong> constra<strong>in</strong>t <strong>in</strong> <strong>fracture</strong>. Int J Fract1993;64:101–33.[8] Nevala<strong>in</strong>en M, Dodds RH. Numerical <strong>in</strong>vestigation <strong>of</strong> 3-D constra<strong>in</strong>teffects on brittle <strong>fracture</strong> <strong>in</strong> SE(B) and C(T) specimens.Int J Fracture 1995;74:131–61.[9] Gurson AL. Cont<strong>in</strong>uum theory <strong>of</strong> <strong>ductile</strong> rupture <strong>by</strong> voidnucleation and growth. I. Yield criteria and flow rules for porous<strong>ductile</strong> media. J Engng Mat Techn 1977;99:2–15.[10] Tvergaard V. Material failure <strong>by</strong> void growth to coalescence. AdvAppl Mech 1990;27:83–151.[11] Venzi S, Mart<strong>in</strong>elli A, Re G. Measurement <strong>of</strong> <strong>fracture</strong> <strong>in</strong>itiationand propagation parameters from <strong>fracture</strong> k<strong>in</strong>ematics. In: Sih GC,Mirabile M, editors. Analytical and experimental <strong>fracture</strong> mechanics.The Netherlands: Sijth<strong>of</strong>f and Noordh<strong>of</strong>f, 1981:737–56.[12] Battacharya A. Crack tip open<strong>in</strong>g displacement <strong>in</strong> relatively hightoughness materials. Engng Fracture Mechanics 1991;40:187–200.[13] Kann<strong>in</strong>en MF, Grant TS, Dem<strong>of</strong>onti G, Venzi S. The developmentand validation <strong>of</strong> a theoretical <strong>ductile</strong> <strong>fracture</strong> model. In:Proceed<strong>in</strong>gs <strong>of</strong> the Eight Symposium on L<strong>in</strong>e Pipe Research,Houston, Texas. Arl<strong>in</strong>gton, Virg<strong>in</strong>ia: American Gas Association,1993.[14] Brocks W, Eberle A, Fricke S, Veith H. Large stable crackgrowth <strong>in</strong> <strong>fracture</strong> mechanics specimens. Nuclear Engng andDesign 1994;151:387–400.[15] Kann<strong>in</strong>en MF, O’Donoghue PE. Research challenges aris<strong>in</strong>gfrom current and potential applications <strong>of</strong> dynamic <strong>fracture</strong> mechanicsto the <strong>in</strong>tegrity <strong>of</strong> eng<strong>in</strong>eer<strong>in</strong>g structures. Int J Solids Structures1995;32:2423–45.[16] McCl<strong>in</strong>tock FA, Kim Y-J, Parks DM. A criterion for plane stra<strong>in</strong>,
936 A. Corigliano et al. /Eng<strong>in</strong>eer<strong>in</strong>g Structures 21 (1999) 924–936fully plastic, quasi-steady crack growth. Int J Fracture1995;72:197–221.[17] Shan GX, Kolednik O, Fisher FD. A numerical study on the<strong>in</strong>fluence <strong>of</strong> geometry variations on stable crack growth <strong>in</strong> CTspecimens for different materials. In: Constra<strong>in</strong>t effect <strong>in</strong> <strong>fracture</strong>:theory and applications. ASTM STP 1995;1244:71–87.[18] Kolednik O, Shan GX, Yan WY, Fisher FD. A study <strong>of</strong> near-tiplocal parameters for stable crack growth with a 3D FE-analysis.J de Physique IV 1996;6:C6521–7.[19] Sorem WA, Dodds RH, Rolfe ST. Effects <strong>of</strong> crack depth on elastic-plastic<strong>fracture</strong> toughness. Int J Fracture 1991;47:105–26.[20] Han G, Sutton MA, Chao YJ, Lyons JS. A study <strong>of</strong> stable crackgrowth <strong>in</strong> th<strong>in</strong> sec specimens <strong>of</strong> 304 sta<strong>in</strong>less steel <strong>by</strong> computervision. Engng Fracture Mechanics 1995;52:525–55.[21] Abaqus 55. Theory Manual. Hibbit, Karlsson and SorensenInc., 1996.[22] Guan Z-X, Wang D-M, Yang N-S. Deformation analysis <strong>of</strong> thelocal field <strong>in</strong> the vic<strong>in</strong>ity <strong>of</strong> a stably grow<strong>in</strong>g crack-tip. EngngFracture Mechanics 1988;30:415–34.[23] BS 5762 Methods for crack open<strong>in</strong>g displacement (COD) test<strong>in</strong>g.The British Standards Institution, 1979.[24] Dawes MG. Elastic-plastic <strong>fracture</strong> toughness based on the CODand J-contour <strong>in</strong>tegral concepts. In: Elastic-plastic <strong>fracture</strong>.ASTM STP 1979;668:307–33.[25] Kolednik O. On the calculation <strong>of</strong> COD from clip-gauge displacement<strong>in</strong> CT and bend specimens. Engng Fracture Mechanics1988;29:173–88.[26] Kolednik O. An improved procedure for calculat<strong>in</strong>g COD <strong>in</strong> bendand CT specimens. Engng Fracture Mechanics 1989;33:813–26.[27] Rice JR, Sorensen EP. Cont<strong>in</strong>u<strong>in</strong>g crack-tip deformation and <strong>fracture</strong>for plane-stra<strong>in</strong> crack growth <strong>in</strong> elastic-plastic solids. J MechPhys Solids 1978;26:163–86.[28] Wang GS. An EPFM analysis <strong>of</strong> crack <strong>in</strong>itiation, stable growthand <strong>in</strong>stability. Engng Fracture Mech 1995;50:261–82.[29] Mart<strong>in</strong>elli A, Venzi S. Tear<strong>in</strong>g modulus, J-<strong>in</strong>tegral, CTOA andcrack pr<strong>of</strong>ile shape obta<strong>in</strong>ed from the load-displacement curveonly. Engng Fracture Mechanics 1996;53:263–77.[30] Wu SX, Mai YW, Cotterell B. Slip-l<strong>in</strong>e field solutions <strong>of</strong> threepo<strong>in</strong>tbend specimens with deep notches. Int J Mech Sci1987;29:557–64.[31] Green AP, Hundy BB. Initial plastic yield<strong>in</strong>g <strong>in</strong> notch bend tests.J Mech Phys Solids 1956;4:128–44.[32] Corigliano A, Maier G, Mariani S. Numerical simulation <strong>of</strong> <strong>ductile</strong>crack processes based on geometrical parameters. In: OwenDRJ, Oñate E, H<strong>in</strong>ton E, editors. Computational plasticity: fundamentalsand applications 1997;1033–38.[33] Tvergaard V. Influence <strong>of</strong> voids on shear band <strong>in</strong>stabilities underplane stra<strong>in</strong> conditions. Int J Fracture 1981;17:389–407.[34] Tvergaard V. On localization <strong>in</strong> <strong>ductile</strong> materials conta<strong>in</strong><strong>in</strong>gspherical voids. Int J Fracture 1982;18:237–52.[35] Chu C-C, Needleman A. Void nucleation effects <strong>in</strong> biaxiallystretched sheets. J Engng Mat Techn 1980;102:249–56.[36] Xia L, Shih CF. Ductile crack growth—I. A numerical studyus<strong>in</strong>g computational cells with micro-structurally based lengthscales. J Mech Phys Solids 1995;43:233–59.[37] Xia L, Shih CF, Hutch<strong>in</strong>son JW. A computational approach to<strong>ductile</strong> crack growth under large scale yield<strong>in</strong>g conditions. JMech Phys Solids 1995;43:389–413.[38] Tvergaard V, Needleman A. <strong>Analysis</strong> <strong>of</strong> the cup-cone <strong>fracture</strong> <strong>in</strong>a round tensile bar. Acta Metall 1984;32:157–69.[39] Alpa G, Bozzo E, Gambarotta L. A theoretical evaluation <strong>of</strong> thebackfill effect <strong>in</strong> <strong>fracture</strong> <strong>of</strong> gas pressurized pipel<strong>in</strong>es. J PressureVessel Techn, ASME 1984;106:47–53.