Download PDF - Nutricao de Plantas
Download PDF - Nutricao de Plantas
Download PDF - Nutricao de Plantas

You also want an ePaper? Increase the reach of your titles
YUMPU automatically turns print PDFs into web optimized ePapers that Google loves.
Plant Soil (2009) 324:329–343DOI 10.1007/s11104-009-9950-zREGULAR ARTICLEEffect of carbon assimilation on dry weight productionand partitioning during vegetative growthEdward Gerar<strong>de</strong>aux & Etienne Saur &Julie Constantin & Annabel Porté &Lionel Jordan-MeilleReceived: 8 December 2008 /Accepted: 24 February 2009 /Published online: 14 March 2009# Springer Science + Business Media B.V. 2009Abstract Potassium <strong>de</strong>ficiency is known to <strong>de</strong>eplyimpact dry matter yield through a lower photoassimilatesproduction. The objectives of this studywere to find out and classify the principal mechanismsthat accounted for the reduction in plant stature.Our approach used the framework of interceptionconversionmo<strong>de</strong>lling, with focuses on photosynthesis(gas exchange analysis, Farquhar mo<strong>de</strong>l), plant-waterrelations (water potential components), and solublesugars in leaves. Cotton plants were grown during7 weeks un<strong>de</strong>r glasshouse hydroponic conditions and4 increasing levels of potassium nutrition (K0, K1,K2 and K3). Sugar started to accumulate in matureleaves of K <strong>de</strong>ficient plants at 20 days afteremergence (DAE). This was mainly interpreted asResponsible Editor: Ismail Cakmak.E. Gerar<strong>de</strong>aux (*) : E. Saur : J. Constantin : A. Porté :L. Jordan-MeilleCIRAD,Montpellier Ce<strong>de</strong>x 5, France-mail: gerar<strong>de</strong>aux@cirad.frE. Saure-mail: e-saur@enitab.frJ. Constantine-mail: julie.constantin@laon.inra.frA. Portée-mail: annabel@pierroton.inra.frL. Jordan-Meillee-mail: l-jordan@enitab.frthe consequence of a low phloem loading for sucrose.At 40 DAE, leaf area and dry weight were reduced inK0 and K1 treatments compared to K2 and K3.Specific leaf weight was much higher in K <strong>de</strong>ficientplants then in non <strong>de</strong>ficient ones. Photosynthesis wasreduced but only for severe <strong>de</strong>ficient treatments (K0)and at the last measuring dates (50 DAE). We venturethe hypothesis that sugar accumulation may be thekey factor affecting nutrition of the growing organs,and photosynthetic capacity of the unfol<strong>de</strong>d andmature leaves.Keywords Potassium . Cotton . Gossypiumhirsutum L. . DW partitioning . Specific leaf weight .Photosynthesis . Water potential . SucroseAbbreviationsDW dry weightDAE days after emergenceΨp pressure potentialΨs osmotic potentialΨ the water potentialPAR photosynthetic active radiationC i internal CO 2 pressureC a external CO 2 pressurePLA plant leaf areaRUE radiation use efficiencyJ max electron transport capacityV cmax maximum carboxylation rateα apparent light efficiency of electrontransport
330 Plant Soil (2009) 324:329–343RdSLWGs%DW LR/SIntroductiondark respirationspecific leaf weightstomatal conductance% of leaves DW in total DWroot/shootCotton is particularly sensitive to potassium (K)<strong>de</strong>ficiency, much more than other crops (Cassman etal. 1989), with strong impacts on fibre yield andquality (Kerby and Adams 1985; Zhao et al. 2001).An increasing inci<strong>de</strong>nce of K <strong>de</strong>ficiency in cotton cropsin intensive cropping conditions around the world, suchas in USA or Australia, is associated with theintroduction of fast fruiting, high yielding cottoncultivars that have a greater <strong>de</strong>mand for K duringfructification (Pettigrew 1999; Wright 1999;Camberatoand Jones 2005). In the cotton production areas of sub-Saharan Africa, <strong>de</strong>creases in soil organic matter andlow levels of K fertilization have led to an increase inK <strong>de</strong>ficiency (Pieri 1989; Possetal.1997).Plant cells have a high requirement for K forphotosynthesis, enzyme activation, protein synthesis,regulation of cell turgor, and ion homeostasis (Marschner1995). However, K <strong>de</strong>ficiency may not disturb theseprocesses at the same time or K content, since they donot take place in the same parts of the cells (Leigh andWyn 1984). Some of these processes take place in thecytoplasm (like protein synthesis) and others in thevacuole (like turgor). Compensation phenomena of K-<strong>de</strong>ficiency may also be efficient for some processes liketurgor (Leigh and Wyn 1984; Bednarz and Oosterhuis1998) and inefficient for others like photosynthesis orprotein synthesis. From the prece<strong>de</strong>nt statements itappearsthatwhenKcontentstartstodropinaplantsome physiological dysfunctions may appear immediatelywhile others may appear later.A reduction in leaf growth has been commonlyreported for mo<strong>de</strong>rately K-<strong>de</strong>ficient plants of wheat(Rama 1986), soybean (Itoh et al. 1987) and cotton(Xi and Lihua 1989; Pettigrew and Meredith 1997;Reddy et al. 2000; Zhao et al. 2001). The relative<strong>de</strong>crease in leaf area has been mainly associated witha reduction in the rate of leaf elongation (Jordan-Meille and Pellerin 2004). The physiological cause ofthis reduction, however, is still subject of controversy.Some authors attribute leaf area reduction to limitedcell expansion caused by a <strong>de</strong>crease in the osmoticregulation of the plant water status by K (Leigh andWyn 1984; Mengel and Kirkby 2001; Benlloch-Gonzàles et al. 2008). Others highlight the role of Kin phloem transport of sugars from source leaves tosink organs (roots, fruits and apical buds) (Huber1985; Cakmak et al. 1994a), which may reduce leafgrowth potential without affecting photosynthesis atthe source (Mengel and Viro 1974a).During acute <strong>de</strong>ficiency whereby the concentrationof K in plant leaves is less than 20 mg g −1 of DW or25 mM (Leigh and Wyn 1984; Bednarz and Oosterhuis1999; Reddy et al. 2000), DW production is drasticallyreduced and exceeds what we could expect from areduction in sunlight interception caused by a smallerleaf area. DW reduction may be the consequence of areduction in photosynthesis per leaf unit area (Bednarzand Oosterhuis 1999; Zhaoetal.2001; Jordan-Meilleand Pellerin 2008; Pettigrew 2008). Three majorcauses of a reduction of photosynthesis un<strong>de</strong>r K<strong>de</strong>ficiency have been implicated: (i) reduced stomataland mesophyll conductance (Terry and Ulrich 1973;Longstreth and Nobel 1980; Pervez et al. 2004): (ii) anegative feedback on CO 2 assimilation rates inducedby the accumulation of soluble sugars (Bednarz et al.1998; Roitsch 1999) which can impact negatively onthe activity of the enzyme Rubisco (Farquhar et al.1980); (iii) impaired counterbalancing by K + of H +accumulation during electron transport across thethylakoid membrane (Mengel 1984; Tester and Blatt1989; Wengetal.2007). The photosynthetic mo<strong>de</strong>lproposed by Farquhar and Sharkey (1982) isappropriateto quantify among these three mechanisms whichones are affected by K-<strong>de</strong>ficiency.It is yet unclear whether photosynthate translocationor insufficient osmotic pressure is the keymechanism affecting plant physiology (photosynthesis,leaf area expansion, DW partitioning) un<strong>de</strong>rmo<strong>de</strong>rate and acute K <strong>de</strong>ficiency. Recently, differenthexoses and sucrose have been recognised as importantsignal molecules in source-sink regulation (Roitsch andGonzales 2004). This strengthens “sucrose impairedtranslocation” as the main dysfunction un<strong>de</strong>r K<strong>de</strong>ficiency and lead to the suggestion it is necessaryto re-examine the source−sink relationship of the plantun<strong>de</strong>r the influence of the stress. Characterizing sugaraccumulates in leaves (Huber 1984) and plant waterstatus (Mengel and Arneke 1982) willbeusefulin
Plant Soil (2009) 324:329–343 331<strong>de</strong>termining the physiological mechanisms un<strong>de</strong>rlyingK <strong>de</strong>ficiency.The objectives of this study is to investigate changesin carbon assimilation associated with different levels ofK <strong>de</strong>ficiency such as stomatal conductance, photosynthesisor biochemistry and to relate them to associatedimpacts at plant scale such as radiation use efficiency(Sinclair and Muchow 1999), DW production andresource partitioning.Materials and methodsPlantsThe H 279-1 cotton (Gossypium hirsutum L.) cultivarwas pre-germinated and transplanted in hydroponicpots 2 days after emergence on March 9th 2006 in aglasshouse at the INRA Domaine <strong>de</strong> la Gran<strong>de</strong>Ferra<strong>de</strong> (44° 50′ N, 0° 34′ W, Bor<strong>de</strong>aux, France).Seedlings were thinned to one per pot. Overall, therewere sixty 24 l randomly arranged polyvinyl chlori<strong>de</strong>(PVC) pots. The nutrient solutions were changed weeklyand the pH corrected to a value of 6.5. The growthchamber was programmed at 25°C/20°C (day/night) and65% relative humidity. Plants were grown un<strong>de</strong>r naturallight conditions. Pots were filled with <strong>de</strong>ionized waterand the nutrient solution composed of 14 mM NO − 3 ,2mMNH + 4 ,4mMCa 2+ ,2mMPO 3− 4 ,2mMSO 2− 4 ,2mMMg 2+ ,1mMFe 3+ ,48μM H 3 BO 3 ,7.3μM Cl − ,3.7μM Mn 2+ , 0.77μM Zn 2+ , 0.32μM Cu 2+ and0.12μM MoO 3 .Four K levels in nutrient solution were tested: acontrol (K3) with 3 mM of K, and three levels of K<strong>de</strong>ficiency, i.e. K2, K1 and K0 with 0.3, 0.07 and0.02 mM of KCl, respectively. According to a previousexperiment these levels led to a wi<strong>de</strong> range of leaf Kcontents. The experimental <strong>de</strong>sign was randomized witheach experimental treatment repeated 5 times. Plantswere harvested at 20, 40 and 50 DAE. Plant DWcomponents were dried during 48 h at 80°C.MeasurementsAir temperature and humidity were measured usingtwo sensors (HMP35C Sensor Vaisala, Helsinki,Finland) positioned on top of a 1.5 m high polelocated in the centre of the experimental <strong>de</strong>sign. Lightintensity was monitored using four PAR sensors(SP1110 pyranometers). Data was collected using adata logger (21X, Campbell Scientific, UK) every5 min and averaged on an hourly basis.Water relation measurementsThe leaf water potential was measured with the“Scholan<strong>de</strong>r-bomb” (Scholan<strong>de</strong>r et al. 1965). Osmolaritywas <strong>de</strong>termined in leaf disk samples by freezingpoint <strong>de</strong>pression (Roebling osmometer, LH Roebling,Berlin, Germany). Ψp was calculated from valuesobtained for Ψs andΨ according to the followingequation (Hsiao 1973): Ψ = Ψs =Ψp.Photosynthetic ratesCarbon assimilation was measured on the first fullyexpan<strong>de</strong>d leaves 20, 40 and 50 DAE. At these ages,plants were in the vegetative exponential growthphase. Gas exchange measurements were conductedwith a LICOR 6400 (LI-6400; LICOR Inc., NE,USA) with the air temperature and relative humidityinsi<strong>de</strong> the leaf chamber controlled at 25°C and 60 %,respectively. The photosynthetic rate response to leafinternal partial pressure of CO 2 (Ci) was obtained by<strong>de</strong>creasing the ambient CO 2 (Ca) concentration from400, 200, 100 and 50 ppm. Inci<strong>de</strong>nt PAR level wasmaintained at a high level of 3,000µmol PAR m − ²s −1to have non limiting light condition. The light responsecurves were obtained at 400 ppm of CO 2 and by<strong>de</strong>creasing inci<strong>de</strong>nt light intensities. Range of lightintensity was 2,000, 1,250, 800, 400, 200, 100 and 0 atthe first date (20 DAE) and 3,000µmol, 1,500µmol,800µmol, 400µmol 200µmol, 100µmol and 0µmolPAR m − ²s −1 at latest dates (40 and 50 DAE).Maximum light intensity was modified between 20DAE and the other dates when we realized that cottonhad not reached saturation at 2,000µmol PAR m − ²s −1 .Photosynthesis was measured around 5 min after eachchange in C a or PAR when a steady state was reached.C i /C a , the relative CO 2 partial pressure betweenexternal and internal stomatal chambers was calculatedat the three dates for 400 ppm of ambient CO 2 and3,000µmol PAR m − ²s −1 .Daily gas exchange surveyAt 50 DAE, the leaves’ gas exchange un<strong>de</strong>r“natural” conditions was measured every 2 h
332 Plant Soil (2009) 324:329–343throughout a day using a LICOR 6400. According tothe natural light conditions, light intensities weresettled at 300µmol, 600µmol, 1,500µmol, 800µmoland 300µmol PAR m − ²s −1 respectively at 10 h, 12 h,14 h, 16 h and 18 h. Even though these values arelow, they reflect greenhouse light conditions andcertainly some shading by the structure.Cations analysisK, Ca, Mg and Na content were <strong>de</strong>termined fromplant material in the following way: dried materialwas milled to pass a 1 mm sieve. It was then ashed at550°C. The ashes were then digested in a 1M nitricacid which was boiled off. The residue was taken upin hot 0.5M nitric acid and the volume cooled down.The cations were <strong>de</strong>termined by atomic emission orabsorption.Sugar analysisSoluble sugars (glucose, fructose and sucrose) fromleaf disks and root apices were extracted in boiling80% ethanol for 15 min. The extraction was repeateda second time in ethanol and a third time with water(Moing et al. 1992). All extracts were evaporated todryness and frozen until analysis. Soluble sugarconcentrations were then measured by the microtitreplate-adapted enzymatic according to Kunst et al.(1984). All samples and standards were <strong>de</strong>termined asthe mean value of two replicates assay wells. Endpoint<strong>de</strong>termination for the three soluble sugars wasbased on the reduction of NAD to NADH (Jones et al.1977). First step was glucose <strong>de</strong>termination byphosphorylation of glucose to G6P and NAD and to6PGlcU and NADH as the final step of the reactionsequence. The last sequence was quantified byspectrophotometric method. The second step wasfructose <strong>de</strong>termination by enzymatic transformationof fructose to glucose and the previously <strong>de</strong>scribedconversion of G6P. As fructose assay is accomplishedin the same well as glucose assay, they are temporallyseparated, and fructose is <strong>de</strong>termined by substractionof glucose prior to isomerisation from total glucose atthe end of the assay. Sucrose <strong>de</strong>termination was basedon the cleavage of sucrose into glucose and fructoseby sucrose phosphorylase. Fructose was then convertedinto glucose, as previously <strong>de</strong>scribed and totalglucose was measured by the spectrophotometricmethod on a Microplate rea<strong>de</strong>r (ELx 800 uv, BIO-TEK Instruments, Winooski, USA). Sucrose was<strong>de</strong>termined by substraction of glucose and fructoseprior to sucrose phosphorylation from the totalglucose at the end of the assay.Calculating& PLA was calculated as follows: the sum ofindividual leaf sizes.& Intercepted PAR was calculated as follows: 0.48*total radiation* PLA. Since there was little selfshadingas our experiment involved only plants inthe early vegetative stage, light interception waslinearly related to PLA. Value of 0.48 is the ratioof PAR to total radiation (Tao et al. 2005)& RUE was calculated as follows: total dry biomassdivi<strong>de</strong>d by the cumulated intercepted PAR betweenemergence and the last sampling date.Mo<strong>de</strong>lling photosynthesisPhotosynthesis can be biochemically limited by oneof two basic mechanisms: the Rubisco activity and therate of RuBP regeneration which can be <strong>de</strong>terminedby looking at J max (Lawlor 2002). To <strong>de</strong>termine whichof these mechanisms were affected by K <strong>de</strong>ficiency,we used the mo<strong>de</strong>l of Farquhar et al. (1980), based onthe use of A-Ci and A-PAR response curves.Response curves were used to estimate parametersof the biochemical photosynthesis mo<strong>de</strong>l <strong>de</strong>velopedby Farquhar et al. (1980) by non-linear fittingprocedures (Systat 10, SPSS Inc 2000). V cmax , α,Rd and J max were calculated according to VonCaemmerer and Farquhar (1981). Un<strong>de</strong>r light saturatedconditions and Ci below 200 ppm, we assumedthat assimilation was limited by RubisCO functioning,and at low light intensity (
Plant Soil (2009) 324:329–343 333Plant growth mo<strong>de</strong>llingTo discuss the relative effects of photosynthesis andcarbon allocation, a growth mo<strong>de</strong>l was built usingcarbon budget formalism. This approach is commonlyused for crop mo<strong>de</strong>lling (Cotons®, EPIC,CERES) (Tardieu et al. 1999). It uses the specificleaf weight to calculate leaf area production of plantnet photosynthesis:Δleaf area=Δt ¼ net photosynthesis*p=SLWwhere p is the proportion of carbon allocated to leavesthe same day. Values of p and SLW were calculateddaily from the three measurement dates and <strong>de</strong>cayedto negative asymptotes. One relationship was calculatedfor every treatment.The complete mo<strong>de</strong>l was built on the basis offollowing factors:& Starting leaf area was the leaf area measured onthe third day of the experiment and starting dryweight was the average dry seed weight.& Light interception: It was assumed that allleaves intercept light without any leaf shadingand at the same efficiency. Daily photosynthesiswas thus certainly overestimated, but we consi<strong>de</strong>redthat as our experiment lasted 50 DAE,most leaves were fully efficient and there wouldbe little auto-shading.& Photosynthesis was calculated hourly. Nightrespiration value was consi<strong>de</strong>red equal to observeddark respiration value. To i<strong>de</strong>ntify theplant net assimilation rates, we used the meanresponse for each treatment (mean of five leaves)of assimilation to varying light intensity. Theseresponse curves where established at 20, 40 and50 DAE.& We supposed that, on a weight basis, cotton plantshad only vegetative organs. The relative carboncontent of dry weight was measured for eachtreatment. Simulated dry weight production wascalculated as follows:[simulated net carbon assimilation/observed relativecarbon content].In parallel, we ran one simplified mo<strong>de</strong>l that didn’ttake the SLW and the DW partitioning to leaveschanges among K treatments into account (<strong>de</strong>faultdata remained unchanged between treatments, equalto those of K3 treatment). The mo<strong>de</strong>l adaptability wasevaluated by R² and a between simulated andobserved data. R² is the coefficient of <strong>de</strong>terminationof the regression formula for the mo<strong>de</strong>l, where a is theslope of the linear regression curve between observedand predicted values. We ran the mo<strong>de</strong>ls andcompared to observed data.Data analysisAn analysis of variance (ANOVA) was carried outaccording to the general linear mo<strong>de</strong>l of the StatisticalAnalysis System (SAS Institute, Cary, NC, USA).Data means were tested using the Stu<strong>de</strong>nt-Newman-Keuls test, and significant differences were based on a0.05 probability value.ResultsLeaf K and other major cation contentsThe foliar K concentrations significantly differedbetween treatments from the first to the lastmeasurement date (Table 1). The leaf K contents<strong>de</strong>clined in the K0 and K1 treatments while K2 andK3 had more stable leaf K contents. At 20 DAE, theK0 leaf K content was 18 mg g −1 of DW, which wassignificantly lower than in the other treatments. Thenit fell to 10 and 8 mg g −1 at 40 DAE and 50 DAErespectively. Obvious visible symptoms (interveinalchlorosis) of leaf K <strong>de</strong>ficiency on K0 treatmentsappeared at around 40 DAE. From the secondmeasurement date to the end of the experiment, theleaf K contents differed highly significantly betweentreatments. As expected, foliar potassium levels werevery high in the K2 and K3 treatments, even at thelast measurement date (23 mg g −1 and42mgg −1 ). K<strong>de</strong>ficiency did not affect the total foliar nitrogenconcentration (data not shown). Ca, Mg and Naconcentrations were significantly higher in K <strong>de</strong>privedplants. Therefore, the calculated sum ofcations in tissue water (K + Ca + Mg + Na),calculated on basis of the assumption that all ofthese cations were in a soluble form, was significantlylower in K <strong>de</strong>prived plants (Table 1). Thissuggests that the higher uptake of other cations (Ca,Mg, Na) by K <strong>de</strong>prived plants does not potentiallyoffset the lack of molarity due to the lower Kcontent.
334 Plant Soil (2009) 324:329–343Table 1 Variations in K content in inleaf DW (mg (mgg −1 g −1 ), ), total total cationmolarity concentration (mM) and in the soluble nutrient sugarsolution. content in Means leaf DW with(mg theg −1 same )atmolarity the three(mM) measurement and soluble dates, sugars according contentointhe leaf potassium DW (mgconcentration g −1 ) lettersinarethe consi<strong>de</strong>red nutrient solution. to be notMeans different with at p=0.05 the same letters areat consi<strong>de</strong>red the threeto measurement be not different dates, p=0.05 according to the potassiumParameter K0 K1 K2 K3 Stu<strong>de</strong>nt testFoliar K at 20 DAE 18 (c) 31 (b) 33 (ab) 36 (a) **Foliar K at 40 DAE 10 (d) 18 (c) 33 (b) 43 (a) ***Foliar K at 50 DAE 8 (d) 11 (c) 23 (b) 42 (a) ***Total foliar cations (mM) at 50 DAE 187 (a) 198 (b) 222 (b) 269 (c) **Hexose at 20 DAE 12 8 7 6 *Hexose at 40 DAE 48 (a) 22 (b) 21 (b) 17 (b) ***Hexose at 50 DAE 45 (a) 24 (b) 8 (c) 5 (c) ***Sucrose at 20 DAE 52 43 37 44 NSSucrose at 40 DAE 141 (a) 61 (b) 59 (b) 76 (b) ***Sucrose at 50 DAE 152 (a) 73 (b) 54 (b) 52 (b) ***Levels not connected by the same letter in the same lines are significantly different according to the Stu<strong>de</strong>nt’s t test.. NS: p>0.05, *:0.01 < p
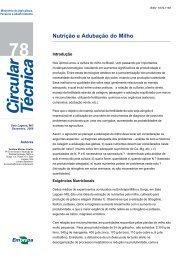
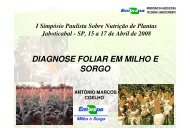
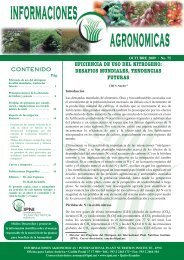
Plant Soil (2009) 324:329–343 335In addition, dry weight allocation was modified for thehighest K <strong>de</strong>ficiency treatments. The R/S ratio for theK0 treatment remained at a constant value of 0.17±0.02,whereas it increased with time up to 0.25±0.01 fortreatments K1 to K3. This was mainly due to the highercontribution of leaves in the total DW (Table 2). Inaddition to this modification, K0 treatment plants hadsignificantly higher SLW values from the secondmeasurement date and the differences between treatmentsincreased with time (Table 2): SLW ranged from5.39 mg cm −2 to 4.14 mg cm −2 for K0 and K3,respectively, at the end of the experiment. As a resultof the reduced DW and increased SLW induced by theK <strong>de</strong>ficiency, leaf areas were significantly differentbetween treatments at the last sampling date, increasingwith greater K availability. Finally, RUE was significantlylower for the K0 treatment plants (1.97 g DWMJ −1 ), compared to the three other treatments, withmean values ranging from 2.65 to 2.74 g DW MJ −1 .Effect of K-<strong>de</strong>ficiency on leaf and apex solublesugar contentThe sucrose concentration of matures leaves accountedfor most of the soluble sugar in each treatment. In theK0 treatment plants the sucrose concentration wassignificantly higher at 40 and 50 DAE, i.e. evensurpassing 15% of the leaf DW at the last samplingdate. This content at the latest date is very highcompared with the leaf DW content of the K1, K2 andK3 treatment which ranked from 52 to 73 mg g −1 of theleaf DW (Table 1). Note that the sucrose concentrationdrastically increased (Fig. 1) when the K concentrationdropped below 15 mg g −1 (100 mM) at 40 and 50DAE. The same trend was noted for hexose concentration,which was also significantly higher in theleaves of the K0 treatment plants at all dates. Unlikemature leaves, the shoot and root apexes of the K0treatment plants had lower hexose content than all theother treatments (relative content less than 50%; datanot shown). In or<strong>de</strong>r to have sufficient material forsugar analysis, we had to combine the apices from the5 plants in each treatment. Thus the results cannot bestatistically supported due to the lack of replications.Effects of potassium on plant-water relationsFor treatments K1 to K3, the plant water contentmeasured at the whole plant scale <strong>de</strong>creased linearlySucrose content in leaf DW (mg g -1 )30252015100 10 20 30 40 50during the experiment from 92 to 88%. The watercontent of the K0 treatment plants followed the sametrend, although the values were significantly 1%lower (data not shown). However, when only leavesare taken into account, difference between treatmentsis no longer existent (data not shown). Measurementsobtained on the first fully expan<strong>de</strong>d leaves showedthat K <strong>de</strong>ficiency had slight but positive effects onturgor, as <strong>de</strong>duced from the water and osmoticpotential measurements (Fig. 2). For instance, thewater potential ranged from −0.6 to −1.4 MPa andlowest values were shown by leaves with a higherK content. The osmotic potential ranged from −1.8to −0.9 MPa. The maximum value of −0.9 MPa wasobtainedwithaleafKcontentof15to30mgg −1 ,whereas leaves with higher and lower K contents hadosmotic potentials ranging from −1 to −1.8 MParespectively.Photosynthetic activityK content in leaf DW (mg g -1 )Analysis of light and CO 2 response curves20 DAE40 DAE50 DAEFig. 1 Relationship between sucrose and potassium concentrationsin the first expan<strong>de</strong>d leaves at 20, 40 and 50 DAEK <strong>de</strong>ficiency did not affect CO 2 assimilation at earlystages (20 DAE). The PAR and CO 2 response curveswere not significantly different (Figs. 3a and 4a). Themaximum assimilation rate at high light intensity wasapproximately 20µmol CO 2 m −2 s −1 for all treatments.In contrast, CO 2 assimilation differed among treatmentsfor the light response curves at 50 DAE andCO2 response curves at 40 and 50 DAE. K0 had
MpabMpa336 Plant Soil (2009) 324:329–343-0.5-1.0-1.5-2.00.0-0.5R 2 = 0.38p
Plant Soil (2009) 324:329–343 337A (µmol CO2 m -2 s -1 )bA (µmol CO2 m -2 s -1 )A (µmol CO2 m - s -1 ) ²c50403020100-100 50 100 150 200 250 300 3500 50 100 150 200 250 300 350-105040302010504030201000-100 50 100 150 200 250 300 350Ci (µmol mol -1 )Fig. 4 Average response curve of net assimilation to internalCO 2 concentration (Ci) for four potassium levels, measured at20 DAE a, 40b and 50 DAE c. Each value is the means forfour plants. Vertical and horizontal bars around each pointrepresent +/− the standard <strong>de</strong>viation. The horizontal barindicates that the difference the assimilation between treatmentsis significant at P
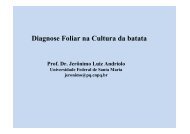
dα (mol CO2/mol photon)338 Plant Soil (2009) 324:329–343Fig. 5 Dark respiration a,Vcmax b, Jmax c and α das a function of K content inleaf DW. Linear regressionequations and R² whenP
Plant Soil (2009) 324:329–343 3392003). According to our calculation, sugar accumulationin K0 <strong>de</strong>ficient leaves accounted for around 50%of the osmolarity, compared to 30% in K1 leaves andless than 20% in K2 and K3 leaves. This highlightsthe role of sugar compensation in K <strong>de</strong>ficient leaves(Scherer and Schubert 1982; Huber 1984; Pettigrew1999), and especially for sucrose (Talbott and Zeiger1998; Pretorius et al. 1999).Review of the effects of the K-<strong>de</strong>ficiency on DWallocation and sugar accumulationK <strong>de</strong>ficiency significantly <strong>de</strong>creased leaf area and dryweight accumulation (Table 2), which were bothreduced by 60% between treatments K3 and K0 atthe end of the experiment. Root biomass was muchmore affected than aerial biomass. This observation isclosely in line with several authors on diverse plants(Ericsson 1995, Egilla et al. 2001, El Dessougi et al.2002), and particularly on cotton plants (Zhao et al.2001). Moreover, SLW, R/S and %DW L weresignificantly different among K treatments (Table 2).This last variable was the only one among all growthvariables observed in the experiment that differedsignificantly among treatments as soon as 20 DAE.Our hypothesis is that these morphological patternsare accounted for by sugar accumulation in matureleaves. K <strong>de</strong>ficiency led to a spectacular accumulationof soluble sugars especially for sucrose (Fig. 1), asalready reported in a wi<strong>de</strong> range of plants (Schererand Schubert 1982; Huber 1984; Itoh et al. 1987;Cakmak et al. 1994a; Zhao et al. 2001), includingcotton (Bednarz and Oosterhuis 1999; Pettigrew1999). Many convergent results consolidate thisassumption:&&Soluble sugars accumulation, especially hexose, isprecocious. It occurs significantly as soon as 20DAE (Table 1), simultaneously to the modified %DW L , and before the other growth variablebecome significantly different (leaf area, SLW,R/S).Sugar accumulation in mature leaves seems to beclosely related to the SLW, whose increase fortreatments K0 and K1 is explained for more than15% by their accumulation. This relationshipbetween carbon export ratio and SLW has alreadybeen un<strong>de</strong>rlined by Reddy et al. (1989). Pettigrew(1999) found the same trend although the sugar&contribution to the SLW increase was significantlysmaller (5%).Parallel to the accumulation in mature leaves, lowsugar concentrations were measured in roots andleaf apexes, which could account for the lower R/S ratio and lower leaf area, even at mild K-<strong>de</strong>ficiency (Table 2).Overall, the present study provi<strong>de</strong>s evi<strong>de</strong>nce that Kstarvation globally <strong>de</strong>creases the translocation ofphotosynthetic products in plants by acting directlyon the phloem loading and/or transport into cells insinks as already reported by other authors (Conti andGeiger 1982; Cakmak et al. 1994b; Marschner et al.1996; Pettigrew 1999). Phloem loading dysfunctionun<strong>de</strong>r K-<strong>de</strong>ficiency has been confirmed by labelledCO 2 studies (Mengel and Viro 1974b). This dysfunctionin sucrose transport might also be advanced toexplain the photosynthesis disturbance.Effect of K-<strong>de</strong>ficiency on carbon assimilationThe ability of plants to transform light into dry weighwas <strong>de</strong>creased, as shown by the lower RUE calculatedon the most starving plants (K0, Table 2). Un<strong>de</strong>r ourconditions, RUE values ranged from 1.97 to 2.74 gDW MJ −1 PAR (for treatment K0 and K3 respectively).These values are 30 to 40 % above those reportedby Rosenthal and Gerik (1991) and Sadras andWilson (1997) in irrigated field trials, where theyobtained RUE values ranging from 1.3 to 1.9 g DWMJ −1 . This difference is not surprising as wecalculated RUE on the total biomass basis whileRUE on field studies was calculated on aerial biomassbasis. Moreover, even irrigated and well fertilizedconditions are not as optimal as hydroponic conditions.It should be emphasized that the <strong>de</strong>crease inRUE due to K starvation was corroborated byinstantaneous photosynthesis measurements whichshowed differences between treatments from 40DAE. However, they can not be directly compared,as RUE is a time-integrative parameter.Photosynthesis was reduced (Figs. 3 and 4) for themost K-starved plants, from the second measurementdate until the end of the experiment. The <strong>de</strong>crease inphotosynthesis might be partly explained by the lowerreactivity of stomata towards environmental conditions(Fig. 6). However, it should be un<strong>de</strong>rlined thatstomatal dysfunction is in contradiction to the absence
340 Plant Soil (2009) 324:329–343of <strong>de</strong>trimental effects of the K-<strong>de</strong>ficiency on leaf waterpotentials (Fig. 2), and especially to the high level ofsucrose in leaves (Fig. 7), whose role as a primaryguard cell osmoregulator is well-known (Talbott Zeiger1998). Non stomatal reduction of photosynthesis wasalso <strong>de</strong>monstrated in Fig. 4. Once more, sugaraccumulation may account more or less directly to thisdysfunction, with two possible un<strong>de</strong>rlying mechanisms:(i) a negative metabolic feedback exerted bysugar accumulation (Goldschmidt and Huber 1992;Rook and Bevan 2003; Koch2004), which affects themaximum carboxylation velocity (V cmax ,Fig.5) priorto any other photosynthetic parameter (Farquhar et al.1980), and (ii) a <strong>de</strong>trimental effect exerted by theleaves’ thickness (through higher specific leaf weight)on mesophyl diffusion conductance (Terry and Ulrich1973). However they are not exclusive and theunchanged C i /C a tends to favour the hypothesis thatboth carbon assimilation and carbon input by stomatalaperture are responsible of the <strong>de</strong>cline of the photosynthesis(Ehleringer and Cerling 1995).Biomass production mo<strong>de</strong>llingNow, to what extent was the growth potential affectedby lower photosynthesis? We ran a simple mo<strong>de</strong>l ofdry weight production at the plant scale using thesimulated leaf area, net photosynthesis response tolight (response curves 3a, b and c), %DW L, C contentin DW and SLW as input variables. The bestestimation of DW production by the complete mo<strong>de</strong>lcompared to the estimation by the mo<strong>de</strong>l with onlyphotosynthesis effect (Fig. 8) led to conclu<strong>de</strong> that thephotosynthesis modification may not be sufficient totake into account the observed changes in total DW ofcotton plants un<strong>de</strong>r K <strong>de</strong>ficiency. Therefore, theremust be a growing constraint, whose effect is additiveto the least photosynthesis. We may conclu<strong>de</strong>, likeTriboulot and Pritchard (1997) that cell-wall extensibilitymay be the cause of this <strong>de</strong>crease but we alsoestablish the hypothesis that there might be amorphogenetic signal to <strong>de</strong>veloping organs (Black etal. 1995) (Waclawovsky et al. 2006).K overall effects on cotton morphologyand physiologyK <strong>de</strong>ficient cotton plants are characterized by amarked reduction in assimilates production andSimulated DW (g plant -1 ) .10080604020y = 0.97xR 2 = 0.50NSy = 0.91xR 2 = 0.69P
Plant Soil (2009) 324:329–343 341In our hydroponic conditions, smaller root growthresulting from the K starvation did not impact on thenutrient uptake. However, it can be easily un<strong>de</strong>rstoodthat in natural conditions, this would emphasize theeffects of the <strong>de</strong>ficiency, thus leading to more<strong>de</strong>trimental effects at the plant scale, with negativeeffects on yield potential and fibre quality.Acknowledgement We thank Sylvie Millin for the sugaranalysis, Cyril Ardouin for the water status measurements, PabloTittonell for english rewording, and the staff of UMR INRATCEM for element chemical analysis, advice and support.ReferencesBarraclough PB, Leigh RA (1993) Grass yield in relation topotassium supply and the concentration of cations in tissuewater. J Agric Sci 121:283–287Bednarz CW, Oosterhuis DM (1998) Development of aprotocol to study the effects of potassium <strong>de</strong>ficiency incotton un<strong>de</strong>r controlled environmental conditions. J PlantNutr 21:329–339. doi:10.1080/01904169809365407Bednarz CW, Oosterhuis DM (1999) Physiological changesassociated with potassium <strong>de</strong>ficiency in cotton. J PlantNutr 22:303–313. doi:10.1080/01904169909365628Bednarz CW, Oosterhuis DM, Evans RD (1998) Leaf photosynthesisand carbon isotope discrimination of cotton inresponse to potassium <strong>de</strong>ficiency. Environ Exp Bot39:131–139. doi:10.1016/S0098-8472(97)00039-7Benlloch-Gonzàles M, Arquero O, Fournier JM, Barranco D,Benlloch M (2008) K + starvation inhibits water-stressinducedstomatal closure. J Plant Physiol 165:623–630.doi:10.1016/j.jplph.2007.05.010Black CC, Loboda T, Chen JQ, Sung SJS (1995) Can sucrosecleavage enzymes serve as markers for sink strenght and issucrose a signal molecule during plant sink <strong>de</strong>velopment.American Society of Plant physiologists, 49–64Brou<strong>de</strong>r SM, Cassman KG (1994) Evaluation of a mechanisticmo<strong>de</strong>l of potassium uptake by cotton in vermiculitic soil.Soil Science society american proceedings 58:1174–1183Cakmak I, Hengeler C, Marschner H (1994a) Changes in phloemexport of sucrose in leaves in response to phosphorus,potassium and magnesium <strong>de</strong>ficiency in bean plants. J ExpBot 45:1251–1257. doi:10.1093/jxb/45.9.1251Cakmak I, Hengeler C, Marschner H (1994b) Partitioning of shootand root dry matter and carbohydrates in bean plants sufferingfrom phosphorus, potassium and magnesium <strong>de</strong>ficiency. JExp Bot 45:1245–1250. doi:10.1093/jxb/45.9.1245Camberato JJ, Jones MA (2005) Differences in potassiumrequirement and response by ol<strong>de</strong>r and mo<strong>de</strong>rn cottonvarieties. Better crops 89:18–20Caroll MJ, Slaughter LH, Krouse JM (1994) Turgor potential andosmotic constituents of Kentucky bluegrass leaves suppliedwith four levels of potassium. Agron J 86:1079–1083Cassman KG, Kerby TA, Roberts BA, Bryant DC, Brou<strong>de</strong>r SM(1989) Differential response of two cotton cultivars tofertilizer and soil potassium. Agron J 81:870–876Conti TR, Geiger DR (1982) Potassium nutrition and translocationin sugar beet. Plant Physiol 70:168–172. doi:10.1104/pp.70.1.168Egilla JN, Davies FTJ, Drew CJ, Drew MC (2001) Effect ofpotassium on drought resistance of Hibiscus rosa-sinensiscv. Leprechaun: Plant growth, leaf macro- and micronutrientcontent and root longevity. Plant Soil 229:214–224Ehleringer JR, Cerling TE (1995) Atmospheric CO2 and theratio of intercellular to ambient CO2 concentrations inplants. Tree Physiol 15:105–111El Dessougi H, Claassen N, Steingrobe B (2002) Potassiumefficiency mechanisms of wheat, barley, and sugar beetgrown on a K fixing soil un<strong>de</strong>r controlled conditions. JPlant Nutr Soil Sci 165:732–737Ericsson T (1995) Growth and shoot: root ratio of seedlings inrelation to nutrient availability. Plant Soil 168-169:205–214Farquhar GD, Sharkey TD (1982) Stomatal conductance andphotosynthesis. Annu Rev Plant Physiol 33:317–345.doi:10.1146/annurev.pp.33.060182.001533Farquhar GD, Von Caemerer S, Berry JA (1980) A biochemicalmo<strong>de</strong>l of photosynthetic CO2 assimilation in leaves of C3species. Planta 149:78–90. doi:10.1007/BF00386231Goldschmidt EE, Huber SC (1992) Regulation of photosynthesisby end-product accumulation in leaves of plants storingstarch, sucrose, and hexose sugars. Plant Physiol 99:1443–1448. doi:10.1104/pp.99.4.1443Henning HJ (2003) The effect of potassium <strong>de</strong>ficiency ongrowth and N2-fixation in Trifolium repens. Physiol Plant119:440–449. doi:10.1034/j.1399-3054.2003.00189.xHsiao TC (1973) Plant responses to water stress. Annu RevPlant Physiol 24:519–570. doi:10.1146/annurev.pp.24.060173.002511Huber SC (1984) Biochemical Basis for Effects of K-Deficiency on Assimilate Export Rate and Accumulationof Soluble Sugars in Soybean Leaves. Plant Physiol76:424–430. doi:10.1104/pp.76.2.424Huber SC (1985) Role of potassium in photosynthesis andrespiration. In: Munson RD (ed) Potassium Agriculture.American Society of Agronomiy, Madison, WI, pp 339–369Itoh K, Nakamura Y, Kawata H, Yamada T, Ohta E, Sakata M(1987) Effect of osmotic stress on turgor pressure in mungbean root cells. Plant Cell Physiol 28:987–994Jones MGK, Outlaw WH Jr, Lowry OH (1977) Enzymic Assayof 10–7 to10–14 Moles of Sucrose in Plant Tissues. PlantPhysiol 60:379–383. doi:10.1104/pp.60.3.379Jordan-Meille L, Pellerin S (2004) Leaf area establishment of amaize (Zea mays L.) field crop un<strong>de</strong>r potassium <strong>de</strong>ficiency.Plant Soil 265:75–92. doi:10.1007/s11104-005-0695-zJordan-Meille L, Pellerin S (2008) Shoot and root growth ofhydroponic maize (Zea mays L.) as influenced by K<strong>de</strong>ficiency. Plant Soil 304:157–168. doi:10.1007/s11104-007-9534-8Kerby TA, Adams F (1985) Potassium Nutrition of Cotton. In:Munson RD (ed) Potassium. Agric. American Society ofAgronomy, MadisonKoch KE (2004) Sucrose metabolism: regulatory mechanisms andpivotal roles in sugar sensing and plant <strong>de</strong>velopment. CurrOpinPlantBiol7:235–246. doi:10.1016/j.pbi.2004.03.014Kunst A, Draeger B, Ziegenhorn J (1984) UV-methods withhexokinase and glucose-6-phosphate <strong>de</strong>hydrogenase.Weinheim, Deerfield Beach, Florida
342 Plant Soil (2009) 324:329–343Lawlor DW (2002) Limitation to photosynthesis in water-stressedleaves: stomata vs. metabolism and the role of ATP. Ann Bot(Lond) 89:871–885. doi:10.1093/aob/mcf110Leigh RA, Wyn JRG (1984) A hypothesis relating criticalpotassium concentrations for growth to the distributionand functions of this ion in the plant cell. New Phytol97:1–13. doi:10.1111/j.1469-8137.1984.tb04103.xLeuning R (1990) Mo<strong>de</strong>lling stomatal behaviour and photosynthesisof Eucalyptus grandis. Funct Plant Biol 17:159–175. doi:10.1071/PP9900159Leuning R (2002) Temperature <strong>de</strong>pen<strong>de</strong>nce of two parametersin a photosynthesis mo<strong>de</strong>l. Plant Cell Environ 25:1205–1210. doi:10.1046/j.1365-3040.2002.00898.xLongstreth DJ, Nobel DJ (1980) Nutrient influences on leafphotosynthesis. Effects of nitrogen, phosphorus, andpotassium for Gossypium hirsutum L. Plant Physiol65:541–543. doi:10.1104/pp.65.3.541Marschner H (1995) Mineral Nutrition of Higher Plants.Aca<strong>de</strong>mic press, LondonMarschner H, Kirkby E, Cakmak I (1996) Effect of mineralnutritional status on shoot-root partitioning of photoassimilatesand cycling of mineral nutrients. J Exp Bot47:1255–1263Mengel K (1984) Le potassium en physiologie végétale. Acad.Agri, <strong>de</strong> France, pp 1365–1376Mengel K, Arneke WW (1982) Effect of potassium on the waterpotential, the pressure potential, the osmotic potential and cellelongation in leaves of Phaseolus vulgaris. Physiol Plant54:402–408. doi:10.1111/j.1399-3054.1982.tb00699.xMengel K, Kirkby EA (2001) Principles of plant nutrition.Kluwer aca<strong>de</strong>my publishersMengel K, Viro M (1974a) Effect of potassium supply on thetransport of photosynthates to the fruits of tomatoes. PhysiolPlant 30:295–300. doi:10.1111/j.1399-3054.1974.tb03660.xMengel K, Viro M (1974b) Effect of Potassium Supply on theTransport of Photosynthates to the Fruits of Tomatoes(Lycopersicon esculentum). Physiol Plant 30:295–300.doi:10.1111/j.1399-3054.1974.tb03660.xMoing A, Escobar-Gutierrez A, Gaudillère JP (1992) CarbonFluxes in Mature Peach Leaves. Plant Physiol 106:591–600Pervez H, Ashraf M, Makhdum MI (2004) Influence ofpotassium nutrition on gas exchange characteristics andwater relations in cotton (Gossypium hirsutum L.). Photosynthetica42:251–255. doi:10.1023/B:PHOT.0000040597.62743.5bPettigrew T (2008) Potassium influences on yield and qualityproduction for maize, wheat, soybean and cotton. PhysiolPlant 133:670–681. doi:10.1111/j.1399-3054.2008.01073.xPettigrew WT (1999) Potassium <strong>de</strong>ficiency increases specificleaf weights and leaf glucose levels in field-grown cotton.Agron J 91:962–968Pettigrew WT, Meredith WR (1997) Dry matter production,nutrient uptake, and growth of cotton as affected bypotassium fertilization. J Plant Nutr 20:531–548.doi:10.1080/01904169709365272Pieri C (1989) Fertilité <strong>de</strong>s savannes: Bilan <strong>de</strong> trente ans <strong>de</strong>recherche et <strong>de</strong> développement agricole au sud du Sahara.CIRAD/IRAT, ParisPoss R, Far<strong>de</strong>au JC, Saragoni H (1997) Sustainable agriculturein the tropics: the case of potassium un<strong>de</strong>r maize croppingin Togo. Nutr Cycl Agroecosyst 46:205–213Pretorius JC, Nieuwoudt DT, Eksteen D (1999) Sucrosesynthesis and translocation in Zea mays L. during earlygrowth, when subjected to N and K <strong>de</strong>ficiency. S Afr JPlant Soil 16:173–179Pujos A, Morard P (1997) Effects of potassium <strong>de</strong>ficiency ontomato growth and mineral nutrition at the earlyproduction stage. Plant Soil 189:189–196. doi:10.1023/A:1004263304657Rama R (1986) Potassium requirement for growth and itsrelated processes <strong>de</strong>termined by plant analysis in wheat.Plant Soil 96:125–131. doi:10.1007/BF02375001Reddy KR, Zhao D (2005) Interactive effects of elevated CO 2and potassium <strong>de</strong>ficiency on the photosynthesis, growth,and biomass partitionning of cotton. Field Crops Res94:201–213. doi:10.1016/j.fcr.2005.01.004Reddy RK, Hodges HF, Varco J (2000) Potassium nutrition ofcotton. In: Hearn RA (ed) Bulletin 1094. Office ofAgricultural Communications, Mississipi State UniversityDivision of Agriculture, Mississipi State, pp 1–10Reddy VR, Acock B, Baker D, Acock M (1989) Seasonnal leafarea-leaf weight relationships in the cotton canopy. AgronJ 81:1–4Roitsch T (1999) Source-sink regulation by sugar and stress.Curr Opin Plant Biol 2:198–206. doi:10.1016/S1369-5266(99)80036-3Roitsch T, Gonzales M (2004) Function and regulation of plantinvertases: sweet sensations. Trends Plant Sci 9:606–613.doi:10.1016/j.tplants.2004.10.009Rook F, Bevan MW (2003) Genetic approaches to un<strong>de</strong>rstandingsugar-response pathways. J Exp Bot 54:495–501.doi:10.1093/jxb/erg054Rosenthal WD, Gerik TJ (1991) Radiation use efficiencyamong cotton cultivars. Agron J 83:655–658Sadras VO, Wilson LJ (1997) Growth analysis of cotton cropsinfested with spi<strong>de</strong>r mites: I. Light interception andradiation-use efficiency. Crop Sci 37:481–491Scherer H, Schubert WS (1982) Effect of potassium nutritionon growth rate, carbohydrate content and water retentionin young wheat plants. Z Pflanz Bo<strong>de</strong>nk 145:237–245.doi:10.1002/jpln.19821450304Scholan<strong>de</strong>r PF, Hammel HT, Bradstreet ED, Hemmingsen EA(1965) Sap pressure in vascular plants. Negative hydrostaticpressure can be measured in plants. Science148:339–346. doi:10.1126/science.148.3668.339Sinclair TR, Muchow RC (1999) Radiation use efficiency. AdvAgron 65:215–265. doi:10.1016/S0065-2113(08)60914-1Talbott LD, Zeiger E (1998) The role of sucrose in guard cellosmoregulation. J Exp Bot 49:329–337. doi:10.1093/jexbot/49.suppl_1.329Tao F, Yokozawa M, Zhang Z, Xu Y, Hayashi Y (2005) Remotesensing of crop production in China by productionefficiency mo<strong>de</strong>ls: mo<strong>de</strong>ls comparisons, estimates anduncertainties. Ecol Mo<strong>de</strong>ll 183:385–396. doi:10.1016/j.ecolmo<strong>de</strong>l.2004.08.023Tardieu F, Granier C, Muller B (1999) Mo<strong>de</strong>lling leaf expansionin a fluctuating environment: are changes in specific leafarea a consequence of changes in expansion rate? NewPhytol 143:33–43. doi:10.1046/j.1469-8137.1999.00433.xTerry N, Ulrich A (1973) Effects of potassium <strong>de</strong>ficiency on thephotosynthesis and respiration leaves of sugar beet. PlantPhysiol 51:783–786. doi:10.1104/pp. 51.4.783
Plant Soil (2009) 324:329–343 343Tester M, Blatt MR (1989) Direct measurement of K +channels in thylakoid membranes by incorporation ofvesicles into planar lipid bilayers. Plant Physiol 91:249–252. doi:10.1104/pp.91.1.249Triboulot MB, Pritchard J (1997) Effects of potassium<strong>de</strong>ficiency on cell water relations and elongation of tapand lateral roots of maritime pine seedlings. New Phytol135:269–272. doi:10.1046/j.1469-8137.1997.00647.xVon Caemmerer S, Farquhar GD (1981) Some relathionshipsbetween the biochemistry of photosynthesis and gasexchange of leaves. Planta 153:433–451Waclawovsky AJ, Loureiro ME, Rd Freitas, Cd Rocha, CanoMA, Fontes EP (2006) Evi<strong>de</strong>nce for the sucrose-bindingprotein role in carbohydrate metabolism and transport atearly <strong>de</strong>velopmental stage. Physiol Plant 128:391–404.doi:10.1111/j.1399-3054.2006.00751.xWeng X, Zheng C, Xu H, Sun J (2007) Characteristics ofphotosynthesis and functions of the water-water cycle inrice (Oryza sativa) leaves in response to potassium<strong>de</strong>ficiency. Physiol Plant 131:614–621. doi:10.1111/j.1399-3054.2007.00978.xWright PR (1999) Premature senescence of cotton (Gossypiumhirsutum L.)- Predominantly a potassium disor<strong>de</strong>r causedby an imbalance of source and sink. Plant Soil 211:231–239. doi:10.1023/A:1004652728420Xi S, Lihua R (1989) Effect of potassium fertilizer applicationon physiological parameters and yield of cotton grown ona potassium <strong>de</strong>ficient soil. Z Pflanz Bo<strong>de</strong>nk 152:269–272.doi:10.1002/jpln.19891520301Yu G-R, Zhuang J, Yu Z-L (2001) An attempt to establish asynthetic mo<strong>de</strong>l of photosynthesis-transpiration basedon stomatal behavior and soybean plants grown in field.J Plant Physiol 158:861–874. doi:10.1078/0176-1617-00177Zhao D, Oosterhuis DM, Bednarz CW (2001) Influence ofpotassium <strong>de</strong>ficiency on photosynthesis, chlorophyll content,and chloroplast ultrastructure of cotton plants. Photosynthetica39:103–109. doi:10.1023/A:1012404204910