Unit Planning Guide
Unit Planning Guide Unit Planning Guide
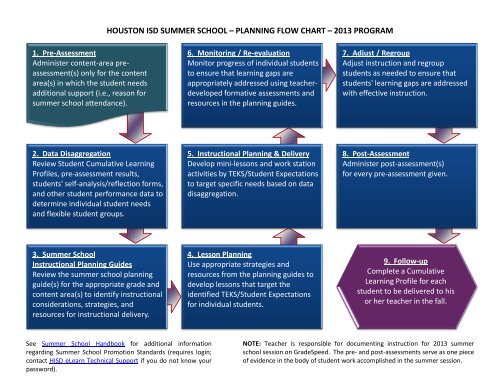
HOUSTON ISD SUMMER SCHOOL – PLANNING FLOW CHART – 2013 PROGRAM1. Pre-AssessmentAdminister content-area preassessment(s)only for the contentarea(s) in which the student needsadditional support (i.e., reason forsummer school attendance).6. Monitoring / Re-evaluationMonitor progress of individual studentsto ensure that learning gaps areappropriately addressed using teacherdevelopedformative assessments andresources in the planning guides.7. Adjust / RegroupAdjust instruction and regroupstudents as needed to ensure thatstudents' learning gaps are addressedwith effective instruction.2. Data DisaggregationReview Student Cumulative LearningProfiles, pre-assessment results,students' self-analysis/reflection forms,and other student performance data todetermine individual student needsand flexible student groups.5. Instructional Planning & DeliveryDevelop mini-lessons and work stationactivities by TEKS/Student Expectationsto target specific needs based on datadisaggregation.8. Post-AssessmentAdminister post-assessment(s)for every pre-assessment given.3. Summer SchoolInstructional Planning GuidesReview the summer school planningguide(s) for the appropriate grade andcontent area(s) to identify instructionalconsiderations, strategies, andresources for instructional delivery.4. Lesson PlanningUse appropriate strategies andresources from the planning guides todevelop lessons that target theidentified TEKS/Student Expectationsfor individual students.9. Follow-upComplete a CumulativeLearning Profile for eachstudent to be delivered to hisor her teacher in the fall.See Summer School Handbook for additional informationregarding Summer School Promotion Standards (requires login;contact HISD eLearn Technical Support if you do not know yourpassword).NOTE: Teacher is responsible for documenting instruction for 2013 summerschool session on GradeSpeed. The pre- and post-assessments serve as one pieceof evidence in the body of student work accomplished in the summer session.
- Page 2 and 3: SOCIAL STUDIES GRADE 6 CONTEMPORARY
- Page 4 and 5: Performance Expectation(s)SOCIAL ST
- Page 6 and 7: SOCIAL STUDIES GRADE 6 CONTEMPORARY
- Page 8 and 9: SOCIAL STUDIES GRADE 6 CONTEMPORARY
- Page 10 and 11: Instructional Considerationstheir m
- Page 12 and 13: SOCIAL STUDIES GRADE 6HISD Curricul
- Page 15: SOCIAL STUDIES GRADE 6HISD Curricul
- Page 18 and 19: SOCIAL STUDIES GRADE 6HISD Curricul
- Page 20 and 21: SOCIAL STUDIES GRADE 6HISD Curricul
- Page 22 and 23: SOCIAL STUDIES GRADE 6HISD Curricul
- Page 24 and 25: SOCIAL STUDIES GRADE 6HISD Curricul
HOUSTON ISD SUMMER SCHOOL – PLANNING FLOW CHART – 2013 PROGRAM1. Pre-AssessmentAdminister content-area preassessment(s)only for the contentarea(s) in which the student needsadditional support (i.e., reason forsummer school attendance).6. Monitoring / Re-evaluationMonitor progress of individual studentsto ensure that learning gaps areappropriately addressed using teacherdevelopedformative assessments andresources in the planning guides.7. Adjust / RegroupAdjust instruction and regroupstudents as needed to ensure thatstudents' learning gaps are addressedwith effective instruction.2. Data DisaggregationReview Student Cumulative LearningProfiles, pre-assessment results,students' self-analysis/reflection forms,and other student performance data todetermine individual student needsand flexible student groups.5. Instructional <strong>Planning</strong> & DeliveryDevelop mini-lessons and work stationactivities by TEKS/Student Expectationsto target specific needs based on datadisaggregation.8. Post-AssessmentAdminister post-assessment(s)for every pre-assessment given.3. Summer SchoolInstructional <strong>Planning</strong> <strong>Guide</strong>sReview the summer school planningguide(s) for the appropriate grade andcontent area(s) to identify instructionalconsiderations, strategies, andresources for instructional delivery.4. Lesson <strong>Planning</strong>Use appropriate strategies andresources from the planning guides todevelop lessons that target theidentified TEKS/Student Expectationsfor individual students.9. Follow-upComplete a CumulativeLearning Profile for eachstudent to be delivered to hisor her teacher in the fall.See Summer School Handbook for additional informationregarding Summer School Promotion Standards (requires login;contact HISD eLearn Technical Support if you do not know yourpassword).NOTE: Teacher is responsible for documenting instruction for 2013 summerschool session on GradeSpeed. The pre- and post-assessments serve as one pieceof evidence in the body of student work accomplished in the summer session.
SOCIAL STUDIES GRADE 6 CONTEMPORARY WORLD CULTURESHISD Curriculum <strong>Planning</strong> <strong>Guide</strong>Grading Cycle Instructional Days Time AllocationSummer School<strong>Unit</strong> 1.1 Overview20 Days 4 Weeks of Instructional <strong>Unit</strong>sJune 11 – July 18, 2013Our World – This Summer School unit entitled Our World explores the world based on the concept of regions. Usingthese world regions, students review map and graph interpretation skills. The unit also helps students explore the ESPNcategorization that forms the basis of all social studies courses.Outline of Summer School Curriculum <strong>Unit</strong>s<strong>Unit</strong> Title: Our World• Week One: Interpreting and Creating Maps• Week Two: Defining/Comparing Regions• Week Three: Human Systems – Economic• Week Four: Human Systems – Political and ESPN – Tying it All TogetherEssential Understandings• Graphic representations of information and data [maps, graphs, charts…] often express relationships and patterns inthe physical and human geography of a place/region.• Regions often reflect similar human and/or physical characteristics• Varieties of human and physical factors affect settlement patterns and population distributions.• Resource distribution often has a direct impact on settlement patterns.• Economic systems allow people to organize the production and distribution of goods and services.• Culture influences the way of life for a group of people and forms the basis for social interaction between and amonggroups/societies.• Political [government] systems allow people to live and work together by establishing rules and laws.• Physical and human systems [ESPN ] often both link and separate regions and cultural/ethnic groups within and amongregions.Key ConceptsKey Skills• systems [human, physical]• push/pull factors• production and distribution• region• culture• resource distribution• settlement patternsAcademic Vocabulary• tables• charts• interpret• create• interpret geographic tools [maps, graphs, charts, data]• create mental maps/sketch maps• determine cause and effect relationships• compare and contrast world regions• TODALSIG• ESPN categorization• compare/contrastContent-Specific Vocabulary• prime meridian• renewable resources• equator• non-renewable resources• latitude/longitude• traditional economy• Tropic of Cancer• command economy• Tropic of Capricorn• market economy• continent [names]• mixed economy• ocean [names]• free-enterprise system• country• factors of production• region• limited government• culture• unlimited government• cultural diffusion• monarchy• human [cultural] regions • democracy• human factors• dictator/dictatorship• physical regions• emperor/empire• physical factors• ESPN• natural resources - English Language Proficiency Standards (ELPS)- Literacy Leads the Way Best PracticesP - HISD Power Objective R - STAAR Readiness Standards S - STAAR Supporting Standards T - TAKS Tested Objective© Houston ISD CurriculumPage 1 of 24
HISD Objectives / TEKSSOCIAL STUDIES GRADE 6 CONTEMPORARY WORLD CULTURESHISD Curriculum: Summer School <strong>Unit</strong> Framework and <strong>Planning</strong> <strong>Guide</strong>Week One: Days 1 - 3: Interpreting Maps and Other DataSS.6.3B Pose and answer questions about geographic distributions and patterns for various world regions andcountries shown on maps, graphs, charts, models, and databases.SS.6.21C Organize and interpret information from outlines, reports, databases, and visuals, including graphs, charts,timelines, and maps.SS.6.21F Use appropriate mathematical skills to interpret social studies information such as maps and graphs.SS.6.22A Use social studies terminology correctly.Week One: Day 4: Creating MapsSS.6.3D Create thematic maps, graphs, charts, models, and databases depicting aspects such as population, disease,and economic activities of various world regions and countries.SS.6.22D Create written and visual material such as journal entries, reports, graphic organizers, outlines, andbibliographies based on research.SS.6.22A Use social studies terminology correctly.Week Two: Defining/Comparing World RegionsSS.6.3C Compare various world regions and countries using data from geographic tools, including maps, graphs, charts,databases, and models.SS.6.4B Identify and explain the geographic factors responsible for patterns of population in places and regions.SS.6.21B Analyze information by sequencing, categorizing, identifying cause-and-effect relationships, comparing,contrasting, finding the main idea, summarizing, making generalizations and predictions, and drawing inferences andconclusions.SS.6.22A Use social studies terminology correctly.Week Three: Human Systems: EconomicPSS.6.8A Describe ways in which the factors of production (natural resources, labor, capital, and entrepreneurs)influence the economies of various contemporary societies.PSS.6.8B Identify problems and issues that may arise when one or more of the factors of production is in relatively shortsupply.P SS.6.10B Describe levels of economic development of various societies using indicators such as life expectancy, grossdomestic product (GDP), GDP per capita, literacy.SS.6.21B Analyze information by sequencing, categorizing, identifying cause-and-effect relationships, comparing,contrasting, finding the main idea, summarizing, making generalizations and predictions, and drawing inferences andconclusions.SS.6.22A Use social studies terminology correctly.Week Four [Days 1 – 2]: Human Systems: PoliticalSS.6.11A Identify and describe examples of limited and unlimited governments such as constitutional (limited) andtotalitarian (unlimited).SS.6.11C Identify reasons for limiting the power of government.SS.6.12A Identify and give examples of governments with rule by one, few, or many.SS.6.21B Analyze information by sequencing, categorizing, identifying cause-and-effect relationships, comparing,contrasting, finding the main idea, summarizing, making generalizations and predictions, and drawing inferences andconclusions.SS.6.22A Use social studies terminology correctly.Week 4 [Days 3 – 4] Putting It All Together: Economic, Social, Political, and eNvironmental [ESPN]SS.6.16A Identify institutions basic to all societies, including government, economic, educational, and religiousinstitutions.SS.6.17A Identify and describe how culture traits such as trade, travel, and war spread.SS.6.21B Analyze information by sequencing, categorizing, identifying cause-and-effect relationships, comparing,contrasting, finding the main idea, summarizing, making generalizations and predictions, and drawing inferences andconclusions.SS.6.22A Use social studies terminology correctly. - English Language Proficiency Standards (ELPS) - Literacy Leads the Way Best PracticesProcess Standards aligned to Grade 8 STAAR© Houston ISD CurriculumPage 2 of 24
Performance Expectation(s)SOCIAL STUDIES GRADE 6 CONTEMPORARY WORLD CULTURESHISD Curriculum: Summer School <strong>Unit</strong> Framework and <strong>Planning</strong> <strong>Guide</strong>• Given a variety of types of maps [historical, physical/political, satellite imagery and so on], students will use theacronym TODALSIG to determine significant information related to map interpretation and share that information with apartner using a Think/Pair/Share strategy.• Using data such as population distribution, land use, physical and political features, and economic activities about oneof the major world regions, students will choose a region and create a sketch map of the region to depict data from twoselected categories.• Given visual [satellite images, video or still photos or drawings] and/or text about a natural disaster [such as ahurricane, earthquake, volcano eruption, tsunami, and so on], students will create a chart to categorize the economic,social/cultural, political and environmental impact of this natural disaster.Texas English Language Proficiency Assessment System (TELPAS): End of year assessment in Listening, Speaking,Reading, and Writing for all students coded as LEP (ELL) and students who are LEP but have Parental Denials forLanguage Support Programming (coded WH). For the Writing TELPAS, teachers provide 5 writing samples (1 narrativeabout a past event, 2 academic {Science, Social Studies, Mathematics}, and 2 other). - English Language Proficiency Standards (ELPS) - Literacy Leads the Way Best PracticesProcess Standards aligned to Grade 8 STAAR© Houston ISD CurriculumPage 3 of 24
SOCIAL STUDIES GRADE 6 CONTEMPORARY WORLD CULTURESHISD Curriculum: Summer School <strong>Unit</strong> Framework and <strong>Planning</strong> <strong>Guide</strong><strong>Unit</strong> <strong>Planning</strong> <strong>Guide</strong> User Information<strong>Unit</strong> TitleOur WorldLesson Set:Interpreting Maps and other DataHISD Objectives / TEKSWeek 13 DaysSS.6.3B Pose and answer questions about geographic distributions and patterns for various world regions andcountries shown on maps, graphs, charts, models, and databases.SS.6.21C Organize and interpret information from outlines, reports, databases, and visuals, including graphs, charts,timelines, and maps.SS.6.21F Use appropriate mathematical skills to interpret social studies information such as maps and graphs.SS.6.22A Use social studies terminology correctly.Student-friendly Objectives:• I can use maps, graphs, and charts to create [pose] and answer questions about geographic patterns such assettlement patterns, land use patterns, relationship of landforms to settlement patterns, and other physical and humanpatterns.• I can use maps, graphs, charts to interpret geographic information including using appropriate math skills andgeographic terms correctly. English Language Proficiency Standards• ELPS C.2c Learn new language structures, expressions,and basic and academic vocabulary heard duringclassroom instruction and interactions.• ELPS C.3d Speak using grade-level content areavocabulary in context to internalize new English wordsand build academic language proficiency;• ELPS C.3e Share information in cooperative learninginteractions.• ELPS C.4k Demonstrate English comprehension andexpand reading skills by employing inferential skills suchas predicting, making connections between ideas,drawing inferences and conclusions from text andgraphic sources, and finding supporting text evidencecommensurate with content area needs.Essential Understandings / Guiding QuestionsCollege and Career Readiness Standards• CCRS 1.A1 Use the tools and concepts of geographyappropriately and accurately.• CCRS 1.A3 Analyze how physical and cultural processeshave shaped human communities over time.• CCRS 1.A5 Analyze how various cultural regions havechanged over time.• CCRS 3.B1 Apply social studies methodologies tocompare societies and cultures.Graphic representations of information and data [maps, graphs, charts…] often express relationships and patterns in thephysical and human geography of a place/region.1. How does the physical geography of a place affect settlement patterns?2. What physical and human geographic patterns appear in the ____[map, graph, chart…]? How do you analyze therelationship between and among those patterns?Instructional ConsiderationsInstructional StrategiesPrerequisites and/or Background Knowledge forStudentsThis should be a review topic for most students.Interpreting maps is a skill begun in First Grade.Interpreting graphs, charts and other data is introduced inGrade 3. This is also a strong interdisciplinary topic thatcorrelates with math and science objectives.Students are introduced to interpreting various types ofmaps, graphs, charts, and other geographic tools to poseCues, Questions, and Advance Organizer -Provide various types of maps (see continuation of thisobjective below) for students to view. Pose questions suchas:• When would a physical map be most helpful inunderstanding a place?• When would it be better to use a political map?• What advantages does a physical/political map offer?• What information might a special purpose map such aspopulation density offer? - English Language Proficiency Standards (ELPS) - Literacy Leads the Way Best PracticesProcess Standards aligned to Grade 8 STAAR© Houston ISD CurriculumPage 4 of 24
SOCIAL STUDIES GRADE 6 CONTEMPORARY WORLD CULTURESHISD Curriculum: Summer School <strong>Unit</strong> Framework and <strong>Planning</strong> <strong>Guide</strong>Instructional Considerationsand answer questions about geographic distributions andpatterns in history in Grade 5.Students are introduced to organizing and interpretingprint/visual information from outlines, reports, databases,maps, graphs, charts, and timelines in Grade 4.Background Knowledge for TeacherMaps, graphs, charts, tables, databases, and other graphicrepresentations are tools that geographers use to interpretdata.This objective has three cognitive parts: viewing,determining the usefulness of, and interpreting data ingraphic form; and two “action” parts: posing and answeringquestions about geographic distributions and patterns.Instructional Strategies• What might a land use map tell us about a specific placeor region?• How might a series of maps be useful to a geographer indetermining information about a specific location orregion?Cooperative LearningIt is recommended that students be assigned to and remainin the same 9 regional groups through <strong>Unit</strong>s 1.1 and 1.2[six week period] so that members of each group become“experts” about the general physical and human geographicpatterns that exist in their assigned region. During theseintroductory lessons general review material is presentedon reading maps, graphs, charts, interpreting text andvisuals, learning more about the categories and contentspecificvocabulary of both physical and human geography.• Determining the usefulness of a particular representationof data includes understanding the different ways ofrepresenting data in map, graph, or chart forms.• Interpreting data includes using appropriate mathematicalskills [scale for instance, changing percentages toequivalent value] as well as the understanding of termssuch as increase, decrease, trend, percent increase ordecrease.• Both posing and answering appropriate questions basedon what the data conveys is a critical skill for students tomaster.The ability to interpret data from maps, graphs, charts, andother sources is a life-long learning skill that goes beyondlearning about world regions.For <strong>Unit</strong> 1.1 use the 8 regional units as they are arranged inthe adopted text: North West Africa/SW Asia; Asia[including South, East, and Southeast Asia); Europe;Russia and the Eurasian Republics; Africa South of theSahara; North America and Middle America; SouthAmerica, and Australia Oceania, and Antarctica.Review with students the types and uses of maps:Maps are drawings/pictures representing physical andhuman characteristics of places; a series of maps can showchange over time.Types/purposes of maps:Physical – depicts land and water forms and otherphysical features.Political – depicts man-made political divisions on theearth’s surface – countries, states, counties, cities.Special purpose – indicates special information such aspopulation density, land use, resources, climate zones,manufacturing activity, and so on.Graphs [various types] allow comparisons of statistical - English Language Proficiency Standards (ELPS) - Literacy Leads the Way Best PracticesProcess Standards aligned to Grade 8 STAARDivide students into groups and ask each group to reviewone unit of the text to find the types of maps, graphs,charts, data, and so on available in that unit. Have eachgroup pose a minimum of ten (10) questions using theavailable data representations from the assigned sectionand referencing appropriate page numbers.Ask groups to trade sets of questions and answer thosegiven to them using the appropriate maps, graphs, andother data as indicated. Have groups trade question setsonce more so that each group creates one set of questionsand answers at least two other sets…[this strategy canserve as a formative assessment for this objective]Using the suggested text and internet resources studentscan view and interpret different types of maps and othergeographic tools.Cues, Questions, and Advance Organizers -Allow opportunities to interpret graphic data (maps, graphs,charts/tables) and pose/answer related questions.Use atlases and/or the reference sections of the text toidentify, view, interpret and use various types of maps,graphs, charts, and graphic information. (see group worksuggestions on the previous page)Pose teacher-constructed questions as models. Questionsmight include:• By comparing a physical map and a population densitymap of Africa, what relationship do you see betweenthe presence of key landforms and the populationdensity of various areas?• By looking at a political map of the <strong>Unit</strong>ed States, whatdo you notice about the size and shape of the states?• When viewing a bar graph, what comparisons can you© Houston ISD CurriculumPage 5 of 24
SOCIAL STUDIES GRADE 6 CONTEMPORARY WORLD CULTURESHISD Curriculum: Summer School <strong>Unit</strong> Framework and <strong>Planning</strong> <strong>Guide</strong>Instructional Considerationsdata.Types/uses of graphs:Pictographs – simple representations using symbols asamountsBar graphs – used to make comparisons of dataLine graphs – used to determine change over time ofgiven datasetsMulti-line graphs – used to indicate change over time andallow comparison of dataCircle graphs – used to compare parts to the wholeTables/charts:Used to represent factual and/or statistical data topresent information in an organized way to makecomparisons, analysis, summarizations, inferences andconclusions easier and more concise than expositorytext.. Data is arranged in rows and columns withdescriptive labels. Numerical data from charts/tables canbe transferred to graph form using traditional methods(graph paper, sketch graphs) or computer programs.Use these lessons to review necessary interpretation skillsfor this type of data:Maps – Teach/review the TODALSIG acronymT – titleO – orientation [compass rose]D – dateA – authorL – legend/key including scaleS – scale [reminder] and surrounding placesI – insets/index when presentG – grid system [alpha-numeric; latitude/longitude]Graphs – teach/review the function of the x-axis and the y-axis for pictographs, bar graphs, and line graphs (includingmulti-line graphs). Check with the math and scienceteachers at your school to coordinate the use of similarterminology.Charts/Tables – teach/review the importance of the labelsgiven to the rows and columns of a char.These havespecial meaning to help label and sort factual and/orstatistical information into the appropriate categories foranalysis.Timelines – teach/review that timelines are simplynumerical repress: BC/BCE dates represent negativenumbers and AD/CE dates represent positive numbers.This is also a good time to review time specific terms suchas decade, century, BC/BCE, AD/CE, historic, prehistoric,and so on.This skills objective reinforces the use of math indetermining:Instructional Strategiesmake about the data represented?• By viewing the Almanac in your text (pp. 690-699) whatcan you determine about various regions of the world?Cooperative LearningThink-Pair-ShareFacilitate student-generated questions about map andgraph interpretation. Using cooperative groups or pairs togenerate questions have each group trade questions andanswer those posed by other students. (see above)Nonlinguistic RepresentationProject/view a combination of historic world maps andcontemporary maps and satellite images [see InternetResources]. Ask questions to help increase theunderstanding that maps can be a biased presentation of aspace/area.As you show maps encourage students to drawconclusions about the world view of the author of the map[this is a good way to reinforce the TODALSIG analysistool, particularly the date and author parts]. Use apair/share strategy and have each partner in the pairexplain the use of TODALSIG as they analyze specificmaps.After viewing at least one satellite image [see resources]have students turn to a partner and discuss theirconclusions about how the accuracy of these images haschanged understanding about spaces/places on the earth.Graphic OrganizerUse Charts/Tables from the text or other sources (seeresource column) to point out to students the importance ofthe labels on the rows and columns of a chart ortable…[note: This is the first step in helping students learnto construct their own charts and tables.]Using Chapter 1 in the text, model using the headings inthe text as a guide to set up an organizational grid [chart].Continue to work in the 8 regional groups and ask studentsto view one chapter in the text for their assigned region.Ask students to create a chart with column and rowheadings that would help present the factual informationfrom that part of the text. Ask each group to share theirdecisions with the rest of the class by sketching a chart onthe board, overhead, or chart paper.Use timelines from the text to review the use of timelinesposing appropriate questions.Use graphs from the text or other sources (the math text) toreview the function of the x-axis and the y-axis in varioustypes of graphs. Ask students to explain how they would - English Language Proficiency Standards (ELPS) - Literacy Leads the Way Best PracticesProcess Standards aligned to Grade 8 STAAR© Houston ISD CurriculumPage 6 of 24
SOCIAL STUDIES GRADE 6 CONTEMPORARY WORLD CULTURESHISD Curriculum: Summer School <strong>Unit</strong> Framework and <strong>Planning</strong> <strong>Guide</strong>Instructional Considerations• miles on a map using the map scale;• amount increase/decrease from one time period toanother on a line graph or multi-line graph as well astrend data or projections;• comparison of one amount of something to another on abar graph or % of the whole on a circle graph;measurement of time using a timelineInstructional Accommodations for Diverse LearnersWhen working with English Language Learners onvocabulary, it is critical to provide opportunities for listening,speaking, and reading so that students can use new wordsin a variety of settings. Linking visual [such as Verbal-Visualvocabulary strategies] helps students incorporate newlanguage into their own experiences. Using a Thesaurushelps students connect new words with prior knowledge andexperiences. The English Language Proficiency Standards[ELPS] cited in the HISD Objectives column incorporatethinking, listening, reading, and speaking strategiesnecessary for language acquisition.Instructional Strategieslabel data from a table to turn it into graph form.Pose questions such as: What kind of graph would you useto represent data from Table x? How would you set up thex and y axis for that graph? Draw a rough sketch of thegraph and the dataset. Turn to a partner and share yourgraph sketches and discuss similarities and differences.Provide multiple opportunities for students, working first ingroups and then individually, to practice these math skills.Coordinate [if possible] with the math and/or scienceteachers in your cluster/grade to work together for this mathreview.Instructional Accommodations for Diverse LearnersUse Charts/Tables from the text or other sources (seeresource column) to point out to students the importance ofthe labels on the rows and columns of a chart ortable…[note: This is the first step in helping students learnto construct their own charts and tables.]Assessment ConnectionsGiven a variety of types of maps [historical, physical/political, satellite imagery and so on], students will use the acronymTODALSIG to determine significant information related to map interpretation and share that information with a partnerusing a Think/Pair/Share strategy.ResourcesTextbookOur World Today text resources• Atlas provided with text or other map sources (Internet,transparencies with text)• Reference Section in the front of the text• RA12 – 30, pp. 1-17• Nations of the World Databank Almanac section pp. 690-699• Maps, Graphs and charts throughout the text (see list inthe front of the text) on pages T12 – T15• Text Supplement: Geography Skills for LifeFrom National GeographicMap Elements LessonInternet ResourcesNational Geographic Mapping SiteTimelines, maps and data on countries can be found at theWorld Bank website and at the World Health OrganizationThe Perry-Castañeda Map collection at the University ofTexas has historical and current maps available online andaccessed atInternet map sources including:National AtlasGoogle Earth provides both satellite and regular imagesBedford/St. Martins’ MapCentral site is one source ofhistorical continental, regional, and national maps outlinemaps. - English Language Proficiency Standards (ELPS) - Literacy Leads the Way Best PracticesProcess Standards aligned to Grade 8 STAAR© Houston ISD CurriculumPage 7 of 24
SOCIAL STUDIES GRADE 6HISD Curriculum: Summer School <strong>Planning</strong> <strong>Guide</strong><strong>Unit</strong> TitleOur WorldLesson Set:Creating Maps:HISD Objectives / TEKSWeek 11 DaySS.6.3D Create thematic maps, graphs, charts, models, and databases depicting aspects such as population, disease,and economic activities of various world regions and countries.PSS.6.22D Create written and visual material such as journal entries, reports, graphic organizers, outlines, andbibliographies based on research.SS.6.22A Use social studies terminology correctly.Student-friendly Objectives:• I can create and interpret maps, charts, graphs, outlines or graphic organizers showing geographic information suchas population statistics, spread of disease, patterns of economic activities, and other data based on world regions andcountries within those regions. English Language Proficiency Standards• ELPS C.5c Spell familiar English words with increasingaccuracy and employ English spelling patterns and ruleswith increasing accuracy as more English is acquired.• ELPS C.5d Edit writing for standard grammar and usage,including subject-verb agreement, pronoun agreement,and appropriate verb tenses commensurate with gradelevelexpectations as more English is acquired.• ELPS C.5f Write using a variety of grade-appropriatesentence lengths, patterns, and connecting words tocombine phrases, clauses, and sentences in increasinglyaccurate ways as more English is acquired; andEssential Understandings / Guiding QuestionsCollege and Career Readiness Standards• CCRS 1.A1 Use the tools and concepts of geographyappropriately and accurately.• CCRS 4.B3 Gather, organize, and display the results ofdata and research.• CCRS 4.B4 Identify and collect sources.• CCRS 5.A2 Use conventions of standard written English.• CCRS 5.B1 Attribute ideas and information to sourcematerials and authors.Graphic representations of information and data [maps, graphs, charts…] often express relationships and patterns in thephysical and human geography of a place/region.1. How does the physical geography of a place affect settlement patterns?2. What physical and human geographic patterns appear in the ____[map, graph, chart…]? How do you analyze therelationship between and among those patterns?Instructional ConsiderationsInstructional StrategiesPrerequisites and/or Background Knowledge forStudentsIn previous grades, students have used various visualrepresentations to interpret information. This objective asksthem to extend this skill to the CREATION of their ownvisual representations of data.Background Knowledge for TeacherReview the components of formal maps using the acronymTODALSIG: Title; Orientation (compass rose); Date;Author; Legend/Key/Scale; Surrounding places; Index[when present]; Grid system [latitude/longitude; alphanumeric].Limit the use of copied outline maps indicating regions,countries, landforms that student merely label and color.When using these maps, ensure that students INTERPRETBrainstorm a list of real-world map uses such as gettingdriving directions, planning a trip, checking a destination forclimate and weather to help plan an appropriate wardrobe,checking the flood plain when moving to a new house orapartment and other real-world map examples.Use atlases, the internet, classroom maps/transparencies,textbook maps/graphs/charts/databases, and other sourcesof data for students to view as one source when creatingtheir own maps.Nonlinguistic RepresentationBegin by asking students to sketch a map for a frienddetailing how to get to a specific location [their home, themall, Reliant Stadium…] or have them sketch the route theytake to get from home to school [via vehicle or foot]. Havestudents share their map with a partner and discuss the - English Language Proficiency Standards (ELPS) - Literacy Leads the Way Best PracticesProcess Standards aligned to Grade 8 STAAR© Houston ISD CurriculumPage 8 of 24
Instructional Considerationstheir maps, not just label and memorize them. For example,students can be instructed to develop and place their ownsymbols on maps to represent characteristics of variousregions.After studying a region’s physical and/or political geographyask students to create sketch maps of their own whichencourage student thinking about the relational geographyof a place.Connections to other Content AreasUse examples of graphs, charts, databases (from text orother sources) to teach how to create and interpret thesedata sources. Encourage the use of computer softwarewhen at all possible. Perhaps coordinate this lesson withthe technology teacher on the campus.Remind students of types and uses of graphs, charts,databases, and so on from the two previous lessons andfrom other subject areas including math, science, andlanguage arts.Instructional Accommodations for Diverse LearnersWhen working with English Language Learners onvocabulary it is critical to provide opportunities for listening,speaking, and reading so that students can use new wordsin a variety of settings. Linking visual [such as Verbal-Visualvocabulary strategies] helps students incorporate newlanguage into their own experiences. Using a Thesaurushelps students connect new words with prior knowledge andexperiences. The English Language Proficiency Standards[ELPS] cited in the HISD Objectives column incorporatethinking, listening, reading, and speaking strategiesnecessary for language acquisition.Assessment ConnectionsSOCIAL STUDIES GRADE 6HISD Curriculum: Summer School <strong>Planning</strong> <strong>Guide</strong>Instructional Strategiessimilarities and differences between the two maps.Introduce more formal sketch maps to students by havingthem progress to representations of world maps,continents, and/or Texas by first looking at a map and thencreating their own maps. This increases spatial thinkingand helps develop relational thinking. Have studentspractice sketching world maps with continents/oceans untilthey master the relationship between and among theselarge landmasses.Emphasize that sketch maps do not have to be perfectrepresentations of places – they are relationalrepresentations showing the relative location of places toone another.Ask students to take information from a special purposemap and transfer that information into a graph, table, orchart comparing three or more places/regions/continentsfrom the map.When creating graphs, begin with simple graphs and teachthe use of technology to enhance graph creation. Askstudents to transfer information from one form to anothersuch as statistical data represented in tables to graph formor data in graph form into a statistical table.Using data such as population distribution, land use, physical and political features, and economic activities about one ofthe major world regions, students will choose a region and create a sketch map of the region to depict data from twoselected categoriesResourcesTextbookMaps, Graphs and charts throughout the text (see list in thefront of the text) on pages T12 – T15Internet ResourcesGood sources for customizable online maps using GISlayers are:National Atlas of the U.S. (USGS)The National Map (USGS)ArcExplorer Web Services (ESRI)Census 2000 School District Profiles (NCES)U.S. Census Bureau - English Language Proficiency Standards (ELPS) - Literacy Leads the Way Best PracticesProcess Standards aligned to Grade 8 STAAR© Houston ISD CurriculumPage 9 of 24
SOCIAL STUDIES GRADE 6HISD Curriculum: Summer School <strong>Planning</strong> <strong>Guide</strong><strong>Unit</strong> TitleOur WorldLesson Set:Defining/Comparing World RegionsHISD Objectives / TEKSWeek 24 DaysPSS.6.3C Compare various world regions and countries using data from geographic tools, including maps, graphs,charts, databases, and models.PSS.6.4B Identify and explain the geographic factors responsible for patterns of population in places and regions.SS.6.21B Analyze information by sequencing, categorizing, identifying cause-and-effect relationships, comparing,contrasting, finding the main idea, summarizing, making generalizations and predictions, and drawing inferences andconclusions.SS.6.22A Use social studies terminology correctly.Student-friendly Objectives:• I know where the Middle East and North Africa, Sub-Saharan Africa, South and Southeast Asia, East Asia, Russiaand the CIS [Commonwealth of Independent Soviets], Europe, North America, South America, Australia/New Zealandand Oceania are located on a world map.• I know and can locate at least one important country in each major world region.• I can use geographic data such to compare regions and countries within/among regions and I can draw conclusionsbased on those comparisons. English Language Proficiency StandardsCollege and Career Readiness Standards• ELPS C.3f Ask and give information ranging from using a • CCRS 1.A1 Use the tools and concepts of geographyvery limited bank of high-frequency, high-need, concrete appropriately and accurately.vocabulary, including key words and expressions needed • CCRS 1.A5 Analyze how various cultural regions havefor basic communication in academic and socialchanged over time.contexts, to using abstract and content-based vocabulary•during extended speaking assignments.CCRS 4.A1 Identify and analyze the main idea(s) and• ELPS C.3g Express opinions, ideas, and feelings ranging point(s)-of-view in sources.from communicating single words and short phrases toparticipating in extended discussions on a variety ofsocial and grade-appropriate academic topics.• ELPS C.3h Narrate, describe, and explain withincreasing specificity and detail as more English isacquired.Essential Understandings / Guiding Questions• Regions often reflect similar human and/or physical characteristics.1. Are regional divisions always the same or can they differ? Explain your answer using examples.2. How are ___ and ____ [two regions] similar in terms of their physical geography [landforms; climate; vegetation;land use…] and settlement patterns [number and location of cities; population density; land use]? How are theydifferent?• Varieties of human and physical factors affect settlement patterns and population distributions.1. Which physical and human geographic factors are preferable for a society to thrive and grow?2. Which physical and human geographic factors affect settlement patterns and population distributions most?• Resource distribution often has a direct impact on settlement patterns.1. Why does resource distribution have an impact on settlement patterns and population distributions?2. How has the relationship between resource distribution and settlement patterns changed in the 20 th and 21 stcenturies?Instructional ConsiderationsInstructional StrategiesPrerequisites and/or Background Knowledge forStudentsCues, Questions, and Advance Organizers -The PowerPoint: Places in the World can provide an - English Language Proficiency Standards (ELPS) - Literacy Leads the Way Best PracticesProcess Standards aligned to Grade 8 STAAR© Houston ISD CurriculumPage 10 of 24
SOCIAL STUDIES GRADE 6HISD Curriculum: Summer School <strong>Planning</strong> <strong>Guide</strong>Instructional ConsiderationsThere are no prerequisites for these objectives. In previousgrades students have examined regions in Texas and theU.S. , but this is their first introduction to world regions.Parts of this objective began in Kindergarten and this sameobjective continues through all of the high school courses,each time using more sophisticated and difficult informationto analyze.ackground Knowledge for TeacherStudents should be able to locate the major world regionson a world map. These regions form the basis for the entire6 th grade curriculum. These include: North America and theCaribbean, South America, Europe, Russia and the CIS,SW Asia and N. Africa, Africa South of the Sahara, Southand SE Asia, East Asia, Australia/New Zealand and PacificRim. The concept of region will be reinforced throughoutthe year. This lesson is an introductory lesson.Students should have an understanding of the definition ofregion and the ways that regions can be defined. Forexample:Physical regions can be based on location of landforms,climate, vegetation, and/or animal life. Some examples ofphysical regions are:• Geographic regions - Middle East, Southeast Asia,Western Europe, the Balkan States• Climate regions - the Tropics, Desert regions, Savannaregions• Vegetation regions - tundra, steppesHuman (cultural) regions are based on the activities of thepeople and can be defined in a variety of changing wayssuch as:• Religious regions - the Islamic world• Economic regions - developing countries, OPEC(Organization of Petroleum Exporting Countries)Political regions - Communist nations, Democratic nations,the Roman Empire, TexasIdentify significant geographic factors that could affectwhere people settle and continue to live. These mightinclude:• Rivers and bodies of fresh water• Landforms and natural barriers such as mountains,deserts, large bodies of water• Arable land for farming• Available natural resources such as plants, animals (forfood, clothing, housing)• Climate and weather patterns• Natural routes of travel and communication• Rainfall and precipitationInstructional Strategiesadvance organizer for students to begin to think about howthe physical geography of a place affects settlement in thatarea.Use the Frayer Model to help students define varioustypes of regions and/or gather data about an assignedregion. This strategy can be repeated as an introduction toeach regional <strong>Unit</strong> throughout the year.Similarities and DifferencesGraphic OrganizerAsk students to create a three column chart choosing tworegions to compare and picking five categories from the listbelow to use for that comparison.• Land Area• Representative countries within this region• Climate• Major cities• Population• Population density• Mineral, agricultural, and industrial products• Land use• Demographic data – birthrate, literacy rate, infantmortality rateCues, Questions and Advance OrganizerHave the students complete the chart detailing informationabout the regions they chose to compare and then havestudents pose/answer questions such as:• Which countries/regions have similar___ ?• How many regions have a tropical climate zone? Whichare they? How might this affect people?• In which regions is there significant agricultural activity?• Which regions share a common root language? Whatmight you conclude about why people share a commonlanguage there?• In which regions is ___ (petroleum, for instance) a majorresource?• Which regions/countries share high literacy rates? Whatconclusions does this lead you to regarding lifestyle inthese regions?Cooperative LearningWorking with a partner, allow students to pose their ownquestions. Each pair could generate one question per pairand share with the other students. (You may wish to usethe Clock Buddies cooperative grouping strategy.)Cues, Questions and Advance OrganizerHave students interpret multiple maps of a givenlocation/region (physical, political and special purposemaps – population density, land use, climate) to infer therelationship between geographic factors and settlementpatterns. - English Language Proficiency Standards (ELPS) - Literacy Leads the Way Best PracticesProcess Standards aligned to Grade 8 STAAR© Houston ISD CurriculumPage 11 of 24
SOCIAL STUDIES GRADE 6HISD Curriculum: Summer School <strong>Planning</strong> <strong>Guide</strong>Instructional ConsiderationsAsk students to infer the relationship between physicalgeographic factors and population density or settlementpatterns (cities, countries) – human geographic factors.For example:• Rivers and bodies of fresh water – settlement tends tooccur on or near these geographic features which areused for transportation, drinking, and farming.• Landforms and natural barriers such as mountains,deserts, large bodies of water – mountainous, desert,and non-arable regions tend are less inhabited thanother areas; also, areas of dense vegetation such astropical rain forests also tend to have less densepopulations than more temperate climate areas. Areas ofrugged terrain (steppes, mountains) tend to be lessinhabited than flat land.Arable land for farming – at least initially, cultural groupsneed to provide their own food source and fertile soil is anecessity for a landed group.This skill objective will repeats in each social studies courseand will provide a strong foundation for students enteringGrade 7. Within this one objective are most of the criticalthinking skills necessary for students to master in order tobe able to analyze information in any context or stage oflife. Therefore, it is a critical objective.In the context of this lesson the parts of the objective beingemphasized are:• Cause and effect relationships – how geography affectswhere people [historically and currently] settle• Comparing/contrasting – comparing and contrastinggeographic factors and settlement patterns in one regionto those in other regions• Drawing inferences and conclusions – about howgeography [does or might] affect a region historically,currently, and in the futureRemind students that inferences are simply guesses basedon available information and previous experiences. Thebest inferences are based on solid or strong clues. Theworst are just pure guesses. Both are called inferences, butone is much stronger than the other because of validsupporting evidence.Conclusions are always based on evidence presented.Valid conclusions are based on valid evidence. One canreach the wrong conclusion by misinterpreting the facts ornot having all the facts available.Instructional Accommodations for Diverse LearnersWhen working with English Language Learners onvocabulary it is critical to provide opportunities forInstructional StrategiesPoint out (review) the location of the early culture groups –Nile, Tigris-Euphrates, Indus, Huang, Central America.• Ask: What do the locations of the ancient civilizationshave in common? (Help students reach thegeneralization that all of the major ancient civilizationsdeveloped in river valleys and were protected frominvasion by natural barriers - mountains, deserts, bodiesof water).• Ask: Using a population density and physical map,analyze current settlement patterns and compare themto historical patterns. What do you conclude? (Helpstudents to reach the conclusion that modern patternsfollow those of ancient civilizations: heavy populationcenters near bodies of water and areas of richresources. In today’s world some population centerscan be inland because of improved transportationsources - rail, air, automobile.)• Point out to students that with the onset of more moderntechnologies [tools to make work easier] geographicfactors have somewhat less effect on where people liveand work. In the 21 st century, for instance, people nolonger have to live near where they work because insome instances the Internet, cell phones, and faxmachines allow them to work from home which might bein another country from where the parent company hasits offices. In another example, modern constructiontechniques allow us to build in areas that were notpossible 100 years ago. Ask students to generate theirown examples.Summarizing and Note-TakingSummary FrameOne strategy that will help students understand cause andeffect is to have them use a summary frame.If xx…Then xx… - If there are mountains…then peopleusually don’t live there unless they have to. If there is ariver or seacoast…then people settle there first…Help students understand that there can be several[effects]…not always just one…Nonlinguistic RepresentationGraphic OrganizerA graphic organizer can be used to help studentsunderstand multiple causes and effects.CAUSESEFFECTS#1 EVENT #1#2 Briefly #2describe#3 the event #3 - English Language Proficiency Standards (ELPS) - Literacy Leads the Way Best PracticesProcess Standards aligned to Grade 8 STAAR© Houston ISD CurriculumPage 12 of 24
SOCIAL STUDIES GRADE 6HISD Curriculum: Summer School <strong>Planning</strong> <strong>Guide</strong>Resources• Text Table of Contents for references for each of the world regions studiedduring the year.highlighting themes and eras in WorldHistory.Text: Our World Today pp. 14 – 15; 22-33Use the Table of Contents pp T4 – T7 and the Index beginning on p 717 tolocate appropriate countries and regions.Social Studies Skill Builders are found in theTable of Contents on page T8 of the Text: Our World Today: People, Places,Issues - English Language Proficiency Standards (ELPS) - Literacy Leads the Way Best PracticesProcess Standards aligned to Grade 8 STAAR© Houston ISD CurriculumPage 14 of 24
SOCIAL STUDIES GRADE 6HISD Curriculum: Summer School <strong>Planning</strong> <strong>Guide</strong>Instructional Considerationscontent is introduced at Grade 6.Background Knowledge for TeacherLesson Topic: Human Systems – Economic: one lesson onthe types of economies and the second on indicators ofeconomic development.This is the first of four lessons that introduce theclassification system of ESP – Economic, Social/Cultural,and Political. This is a recurring concept throughout allsocial studies courses.These lessons center on economicaspects.VocabularyTraditional Economies:An economy where time honored production methods areused. What and how to produce is done the same way asthe generation before. The wealthy often benefit greatlyfrom the “For whom” question. Distribution and trade arelimited and are usually accomplished mostly by barter orsimple economy (limited capital and investments).Command Economies (Socialism):An economy in which the basic economic questions areanswered by central authority. This authority may be agovernment or a local lord. Trade is more widespread, butgenerally is still limited to what is produced within thesphere of influence of the government or individual. Thefactors of production are generally owned by the centralauthority.Market Economies (Free Enterprise):An economy where the basic economic questions areanswered by the forces of the marketplace. Consumerdemand determines what is produced; competitiondetermines how goods are produced; and price determinesthe distribution question. The factors of production areconcentrated in the private sector.Many economies are Mixed-Market economies where thereis a combination of public and private control of the factorsof production.Define key indicators of economic development such as:• purchasing power - how much one can buy with a givenincome• exports - product sold out of area• imports - product brought in for sale• life expectancy - average age before death• literacy - average level of education• birth rate - # of babies born per year• GNP - Gross National Product• population density - # of people per square mile• land use - ways in which land is used (i.e., farming,grazing, and so on)Instructional Strategieshow they answer the basic economic questions:• What to produce? Determined by natural resources,supply/demand considerations, and availabletechnology• How to produce? Determined by available technology• How much to produce? Determined by the governmentor the marketplace – supply and demand• For whom to produce? Determines who receives thegoods and service, and in what amountsThe handout Economic Systems: Basic EconomicQuestions will provide background and guidance forstudents.Cooperative Grouping Strategy –Identifying Similarities and DifferencesFrayer ModelDefinitionExamplesCriticalattributesNonexamplesUsing the same regional groups and the Frayer Model havestudents create posters detailing essential characteristics ofeach type of economic system and identifying examples ofcountries (or segments of the economy within a country)that exemplify this type of economy. See the text andInternet Resources for additional information. The wordstraditional, command, market, and mixed-market go in thecenter oval Emphasize the significance of our globaleconomy and the interdependence of most nations andregions. The Frayer Models produced by each group are aform of Formative Assessment to help determine the levelsof student understanding.Vocabulary AcquisitionThink AloudIllustrate the use of key indicators of economicdevelopment by modeling the process of examining data onlevels of economic development using a Think Aloudstrategy. Choose one county in one of the regions toexamine. Use the Nations of the World Databank in the textto discuss with the class how to decide if that country isdeveloped or developing, then model for students how towrite three conclusions about the level of development inthat country. - English Language Proficiency Standards (ELPS) - Literacy Leads the Way Best PracticesProcess Standards aligned to Grade 8 STAAR© Houston ISD CurriculumPage 16 of 24
SOCIAL STUDIES GRADE 6HISD Curriculum: Summer School <strong>Planning</strong> <strong>Guide</strong>Instructional Considerations• products - manufactured goods• death rate - # of deaths compared with total populationper year• average income - average amount earned perhousehold/person• levels of foreign investors - # and types of investmentsby outside agentsPoint out to students that the level of economicdevelopment corresponds to:• high levels of GNP, trade surplus, literacy,manufacturing, average income, purchasing power, lifeexpectancy, and availability of resources; and• low levels of birth rates, death rates, population density,and # of foreign investors.Instructional StrategiesCooperative LearningAfter modeling the desired outcome, divide students intotheir regional groups and ask each group to analyze thelevels of economic development for selected countries fromtheir assigned region. They could choose up to fivecountries to analyze, looking for countries that will showsome contrast. Students can use the Nations of the WorldDatabank from the text and/or suggested internetresources.[Recommendation: For use throughout the year downloadthe most recent World Population Datasheet from thePopulation Reference Bureau]Instructional Accommodations for Diverse Learners• Note: Verbal/Visual Vocabulary is an excellent strategyto use with ELL students to help them begin tointernalize new vocabulary terms. Allow the use of aThesaurus to facilitate their ability to connect new termswith more familiar ones from their own experiences.Assessment ConnectionsHave students look at per capita GNP and Literacy rates forthe selected countries. Ask students to write at least threeconclusions about levels of economic development withinthe region based on data analysis.Verbal/Visual VocabularyHave students create a glossary of economic terms [beginwith traditional, command, and market economies from theprevious lesson; in this lesson add key economicindicators] that they can use throughout the year as theystudy each region. Use a Verbal/Visual Vocabulary strategyin which students1. Define the term2. Write the definition in the student’s own words.3. Look for synonyms of that word.4. Create an illustration that reminds them of the term.• After modeling the desired outcome, divide students into their regional groups and ask each group to analyze the levelsof economic development for selected countries from their assigned region. They could choose up to five countries toanalyze, looking for countries that will show some contrast. Students can use the Nations of the World Databank fromthe text and/or suggested internet resources. [Recommendation: For use throughout the year download the mostrecent World Population Datasheet from the Population Reference Bureau]• Have students look at per capita GNP and Literacy rates for the selected countries. Ask students to write at least threeconclusions about levels of economic development within the region based on data analysis.ResourcesTextbookOur World Today: People, Places,Issues Glencoe Publishingpp. 32-33Internet ResourcesVisit the World Bank’s countries and regions webpage to view reports onaspects of that country’s/region’s economy. Once at the website, click on acountry, then on the publications and reports link.Use the Table of Contents pp T4 – T7and the Index beginning on p 717 tolocate appropriate countries andregions.Text Nations of the World DatabankAlmanac pp 690-699The Central Intelligence Agency’s World Fact Book site provides information onall the world’s countries and their economies.Sources of current world population data for use in instruction are:• Population Reference Bureau on its Educators and DataFinders links;The World Population Datasheet is a pdf document accessed at thissite that provides excellent current data on world regions.• U.S. Census Bureau on its International Programs Center (IPC) > - English Language Proficiency Standards (ELPS) - Literacy Leads the Way Best PracticesProcess Standards aligned to Grade 8 STAAR© Houston ISD CurriculumPage 17 of 24
SOCIAL STUDIES GRADE 6HISD Curriculum: Summer School <strong>Planning</strong> <strong>Guide</strong>ResourcesSupporting DocumentsEconomic Systems: Basic EconomicQuestionsInternational Database (IDB) and other pages.• The World Bank and the World Bank Youth• CIA World Factbook - English Language Proficiency Standards (ELPS) - Literacy Leads the Way Best PracticesProcess Standards aligned to Grade 8 STAAR© Houston ISD CurriculumPage 18 of 24
SOCIAL STUDIES GRADE 6HISD Curriculum: Summer School <strong>Planning</strong> <strong>Guide</strong><strong>Unit</strong> TitleOur WorldLesson Set:Human Systems: PoliticalHISD Objectives / TEKSWeek 42 DaysSS.6.11A Identify and describe examples of limited and unlimited governments such as constitutional (limited) andtotalitarian (unlimited).SS.6.11C Identify reasons for limiting the power of government.SS.6.12A Identify and give examples of governments with rule by one, few, or many.SS.6.21B Analyze information by sequencing, categorizing, identifying cause-and-effect relationships, comparing,contrasting, finding the main idea, summarizing, making generalizations and predictions, and drawing inferences andconclusions.SS.6.22A Use social studies terminology correctly.Student-friendly Objectives:• I can identify the differences between the characteristics of limited and unlimited governments.• I can give categorize and give examples of countries that have limited [democratic] and unlimited [totalitarian]governments.• I can correctly use the vocabulary terms for rule by one [monarchy, dictator], rule by a few [oligarchy, military junta,communist party, theocracy], rule by many [democracy, popular sovereignty] and give example of countries with theseforms of government.English Language Proficiency StandardsCollege and Career Readiness Standards• ELPS C.3d Speak using grade-level content areavocabulary in context to internalize new English wordsand build academic language proficiency.• ELPS C.4g Demonstrate comprehension of increasinglycomplex English by participating in shared reading,retelling or summarizing material, responding toquestions, and taking notes commensurate with contentarea and grade level needs.Essential Understandings / Guiding Questions• CCRS 1.B3 Analyze causes and effects of majorpolitical, economic, and social changes in U.S. and worldhistory.• CCRS 1.C1 Evaluate different governmental systemsand functions.• CCRS 1.C2 Evaluate changes in the functions andstructures of government across time.Political [government] systems allow people to live and work together by establishing rules and laws.1. Why do people have government and how do people decide how to divide [allocate] in a political system?2. Which types of political systems/governments can be categorized as rule by one, rule by a few, or rule by many?How does each of these system groups function differently in relationship to the concept of power?Instructional ConsiderationsInstructional StrategiesPrerequisites and/or Background Knowledge forStudentsThe concept of rules and laws is introduced beginning inKindergarten. In grades 4 and 5 students examinegovernment organization in Texas and the U.S. Theconcepts of limited and unlimited governments introducedat Grade 6.Cooperative LearningThink-Pair-Share - Have students imagine two differentfamilies, one with very authoritarian [strict] parent(s) andone with very permissive parent(s). In a Pair/Share discussand record ways in which life would be different in the twohouseholds. What would be the benefits and drawbacks ofeach household?Background Knowledge for TeacherThis lesson completes the examination of the ESPcategorization by studying an overview of politicalsystems.Vocabulary – limited vs. unlimited governments• characteristics of limited (constitutional andSummarizing and Note-TakingTwo-Column NotesDistribute Critical Attributes of Limited and UnlimitedGovernments and Note Taking Strategy: Limited vUnlimited Governments to help students distinguishbetween the characteristics of each type of governmentusing a two-column note taking strategy. - English Language Proficiency Standards (ELPS) - Literacy Leads the Way Best PracticesProcess Standards aligned to Grade 8 STAAR© Houston ISD CurriculumPage 19 of 24
SOCIAL STUDIES GRADE 6HISD Curriculum: Summer School <strong>Planning</strong> <strong>Guide</strong>Instructional Considerationsdemocratic) government• characteristics of unlimited (totalitarian/nondemocratic)governmentGovernments can be organized in three ways:• rule by one• rule by a few• rule by many types of governmentRule by one can be referred to by several terms,depending on how the leader was chosen.• Autocracy (Autocrat) - means rule by one person• Monarchy (Monarch) - refers to a king or queen whorules through inherited power• Dynasty - refers to a long line of autocratic rulers whopass power down from one generation to another• Dictatorship (Dictator) - an autocratic ruler who seizespower, often through military action• Emperor - an autocratic ruler who governs a largeterritoryRule by a few is called an oligarchy. These oligarchs areselected by a variety of methods which usually involveprivilege or military power.Rule by many is most commonly shown in a democracy.Two forms of democracy:• Direct Democracy which involves all of the citizensdirectly in the law-making process.Representative Democracy (Republic) involves citizensvoting for people who will represent them in a law-makingassembly - indirect democracy.Instructional Accommodations for Diverse LearnersDeciding About Democracy student handouts have Englishand Spanish versions.Assessment Connections• Critical Attributes of Limited and Unlimited Governments• Deciding About DemocracyResourcesTextbookOur World Today: People, Places, Issues GlencoePublishing pp. 31Nations of the World Databank Almanac in the textbeginning on p. 690Instructional StrategiesUse a Think Aloud strategy and the ComparingGovernments Teacher Notes as you process aloud andwrite notes on a sample set of notes on the overhead.Consistent references to the <strong>Unit</strong>ed States as an exampleof limited government provides the scaffolding studentsmay need to understand these concepts.Ask students to continue writing ideas of their own with theadditional characteristics of limited government. Then pairstudents and ask them to share their ideas and exampleswith a partner.Call on individual pairs of students and add their ideas toyour own [teacher] notes on the overhead to provide anexemplar for students.Remind students that regardless of the way a governmentis categorized (rule by one, rule by few, rule by many) allgovernments come to power in one of two ways:Consent - where the governed (citizens) agree or consentto the system of governmentForce - where the system of government is imposed on thecitizens.Working in regional groups and using the Nations of theWorld Databank have students review the types ofgovernment organization within four countries in theirassigned region and categorize these governments as ruleby one, rule by a few, rule by many. Have studentsdisplay the results of their research in graphic form (chart,web, poster with illustrations, etc.)Distribute Deciding About Democracy as a class orhomework assignment.Supporting DocumentsCritical Attributes of Limited and Unlimited GovernmentsNote Taking Strategy: Limited v Unlimited GovernmentsComparing Governments Teacher NotesDeciding About Democracy - English Language Proficiency Standards (ELPS) - Literacy Leads the Way Best PracticesProcess Standards aligned to Grade 8 STAAR© Houston ISD CurriculumPage 20 of 24
SOCIAL STUDIES GRADE 6HISD Curriculum: Summer School <strong>Planning</strong> <strong>Guide</strong><strong>Unit</strong> TitleOur WorldLesson Set:Putting It All Together: Economic, Social, Political, andeNvironmental [ESPN]HISD Objectives / TEKSWeek 44 DaysSS.6.16A Identify institutions basic to all societies, including government, economic, educational, and religiousinstitutions.SS.6.17A Identify and describe how culture traits such as trade, travel, and war spread.SS.6.21B Analyze information by sequencing, categorizing, identifying cause-and-effect relationships, comparing,contrasting, finding the main idea, summarizing, making generalizations and predictions, and drawing inferences andconclusions.SS.6.22A Use social studies terminology correctly.Student-friendly Objectives:I can identify institutions like government, economic systems, religious institutions/groups that are common to allorganized social groups.I can use the ESPN [Economic, Social, Political, and eNvironmental] categorization strategy to describe a given country orregion.I can describe how trade, travel and war spread cultural traits through cultural diffusion.English Language Proficiency StandardsCollege and Career Readiness Standards• ELPS C.3f Ask and give information ranging from using avery limited bank of high-frequency, high-need, concretevocabulary, including key words and expressions neededfor basic communication in academic and socialcontexts, to using abstract and content-based vocabularyduring extended speaking assignments.• ELPS C.4g Demonstrate comprehension of increasinglycomplex English by participating in shared reading,retelling or summarizing material, responding toquestions, and taking notes commensurate with contentarea and grade level needs.• ELPS C.4i Demonstrate English comprehension andexpand reading skills by employing basic reading skillssuch as demonstrating understanding of supportingideas and details in text and graphic sources,summarizing text, and distinguishing main ideas fromdetails commensurate with content area needs.Essential Understandings / Guiding Questions• CCRS 1.A5 Analyze how various cultural regions havechanged over time.• CCRS 1.B3 Analyze causes and effects of majorpolitical, economic, and social changes in U.S. and worldhistory.• CCRS 1.C1 Evaluate different governmental systemsand functions.• CCRS 1.D2 Analyze the basic functions and structures ofinternational economics.• CCRS 1.E3 Analyze how social institutions (e.g.,marriage, family, churches, schools) function and meetthe needs of society.Physical and human systems [ESPN ] often both link and separate regions and cultural/ethnic groups within and amongregions.1. Why are ESPN factors so critical in developing an understanding of a region or group?2. How do these factors both unite and divide people/groups?Instructional ConsiderationsInstructional StrategiesPrerequisites and/or Background Knowledge forStudentsThis objective includes the ESP categorization introducedand reinforces in previous lessons. This ESP lens is usedthroughout all social studies courses.Background Knowledge for TeacherESPN categorization strategy-Use this strategy tointroduce the common social studies categories studentswill use to study a region, a country, or an event. Havestudents create an ESP chart for their own lives.• Economic - What economic factors influence them ordetermine what they do – do they have job? Do they getan allowance? What work is they expected at home…at - English Language Proficiency Standards (ELPS) - Literacy Leads the Way Best PracticesProcess Standards aligned to Grade 8 STAAR© Houston ISD CurriculumPage 21 of 24
SOCIAL STUDIES GRADE 6HISD Curriculum: Summer School <strong>Planning</strong> <strong>Guide</strong>Instructional ConsiderationsBasic ESP institutions• government - a plan of organization in which groupsmanage power and resources through laws; somesystems of government include democracy, monarchy,oligarchy, dictatorship• economics - the use of resources and capital to meet thebasic needs of a group of people; how people answer theeconomic questions of What to produce? How toproduce? and For whom to produce?• education - the ways, both formal and informal, in whichpeople learn to function in a culture• religion - the belief system adopted by a group of peopleincluding the writings, teachings, and practices• language - the means of communication (oral and/orwritten) of a group of people, including regional dialects• customs - learned behavior of a group of people• traditions - long held cultural or societal beliefs ormethods that are often passed down orally fromgeneration to generation; ways of celebrating orperforming basic tasks are part of tradition and custom• celebrations/rituals - activities of a cultural group thatoften revolve around their religious, political, educationaland economic institutions•SPRITES Organizational ChartSetting – Where is this place? What is this place like?Politics – What is the government?Religion – What is/are the dominant religiouspractices?Innovations/Ideas – What contributions [including artsand music] has this group made to our lives?Technology – What tools or inventions have theycontributed?Economics – What is the economic system? Whatjobs do people here do?Social (Society) – What is the social structure? Whatare customs and traditions?Review culture characteristics:• language• celebrations• religion• customs• food• race• traditions• government• education• economic considerations (jobs, use of resources)Instructional Strategiesschool? What economic system do they live under?• Social – What do they like to do in their spare time?What are some of their favorite foods? What religiousand/or cultural background do they have? What aresome of their common family customs and traditions?• Political – Who are authority figures in their lives? Whatrules and laws are important to them? What decisions dothey get to make? What type of government do they liveunder?• eNvironmrntal – Where do they live? What are thephysical characteristics of their neighborhood orcommunity? What modifications/adaptations affect theirenvironment?Use this strategy as a way for students to interview andintroduce each other. It is a good strategy to use at thebeginning of the year to find out more about students’interest and backgrounds.Nonlinguistic RepresentationGraphic OrganizerIntroduce the SPRITES Organizational Chart to helpstudents organize information about an assignedegion/country/area. Model the use of the SPRITES chart bycompleting the information for Houston, Texas or the<strong>Unit</strong>ed States. Continue to use this organization gridthroughout the year as students study each world region.Cues, Questions and Advance OrganizersThink AloudModel the use of this organizational grid to comparesimilarities and differences for students. Using the Nationsof the World Databank beginning on page 690 and of thetext, pick two random countries and complete portions ofthe chart below comparing similarities and differences. Usean example from the Marzano Classroom Strategies thatWork book, the chart might take the following format:Identifying Similarities and DifferencesGraphic OrganizerE = Economic;S = Social/Cultural;P = Political/GovernmentN = eNvironmentalExamine characteristics of cultures looking for worldcultures linked or separated by one or more of thosecharacteristics. For example:• Hispanic countries are linked by language, traditions, - English Language Proficiency Standards (ELPS) - Literacy Leads the Way Best PracticesProcess Standards aligned to Grade 8 STAAR© Houston ISD CurriculumPage 22 of 24
SOCIAL STUDIES GRADE 6HISD Curriculum: Summer School <strong>Planning</strong> <strong>Guide</strong>Instructional Considerationscustoms, religion and foods.• Jews throughout the world are linked by religion, foodlaws, celebrations and customs.• Democratic countries are linked by similar types ofgovernments.• Religion both unites and separates specific countriesand regions.• Levels of education (literacy), technologicaldevelopment, and major occupations align certaincountries into groups such as industrialized and nonindustrializednations.Instructional StrategiesTrait CountryAESPNCountryBSimilarDifferWithin various cultures there are often specific groups thatshare cultural similarities. These groups are referred to asethnic groups. Often differences within these groups createconflict in various cultural regions. This conflict is based ondifferences between the dominant group and other minoritygroups.This objective is taught as a basic skill objective in thefollowing lesson groupings:• Physical systems – cause/effect relationships andcategorizing• Human/Environment Interaction – cause/effectrelationships• ESP human systems - main idea and summarization• Comparing systems in the world – compareInstructional Accommodations for Diverse LearnersProvide partially completed models for students tocomplete. Give simplified definitions to students. ProvideSPED or ELL students with primary sources that are visualor easy to read text.Instructional Accommodations for Diverse LearnersESPN is one of the chief organizing and categorizingprinciples of social studies classrooms. This strategy allowsstudents to manage information in order to use other higherorder thinking skills which include drawing conclusions,summarizing, making inferences,Teach the ESPN [Economic, Social/Cultural, Political, andeNvironmental] categories and ensure that studentsunderstand the factors related to each category.• Economic Factors - relate to $, taxes, industry,agriculture, jobs, availability of resources, ways peopleorganize for the production, distribution and so on.• Social Factors - relate to population density,immigration, cultural diversity, lifestyle, leisure time…• Political Factors - relate to the functions andprocedures of government, laws, and elected officials;factors that deal with the topic of power and control.Some systems of government include democracy,monarchy, oligarchy, dictatorship. Governments areeither limited or unlimited.• eNvironmental Factors – relate to the setting orphysical environment of a place/time/event.Assessment ConnectionsRefer students to the Nations of the World Databank in the text beginning on page 690. Divide students into triads and,assign student groups different letters of the alphabet and ask each triad to choose two countries from that letter group tocompare using the organizational chart above comparing economic, social, political [government] and environmentalaspects of the chosen countries. After gathering ESPN for the two countries, have students look for and record at leasttwo similarities and differences. Also ask each triad to locate the region of the world in which their chosen countries arelocated.When each triad has found the appropriate information call on each group to share which countries they chose by locatingthat region on a wall map or transparency and telling one similarity and one difference they found between the twocountries. Allow each triad to share their information with the rest of the class. See strategies on the previous page forcause and effect, comparison, summarizing, and main idea. - English Language Proficiency Standards (ELPS) - Literacy Leads the Way Best PracticesProcess Standards aligned to Grade 8 STAAR© Houston ISD CurriculumPage 23 of 24
SOCIAL STUDIES GRADE 6HISD Curriculum: Summer School <strong>Planning</strong> <strong>Guide</strong>ResourcesTextbookNations of the World DatabankAlmanac in the text beginning on p.690Supporting DocumentsSPRITES Organizational ChartInternet ResourcesAdditional graphic organizers mightalso include foldables. Thismanipulative are detailed in each unitof the text and many examples areincluded on the Virginia Department ofEducation website - English Language Proficiency Standards (ELPS) - Literacy Leads the Way Best PracticesProcess Standards aligned to Grade 8 STAAR© Houston ISD CurriculumPage 24 of 24


