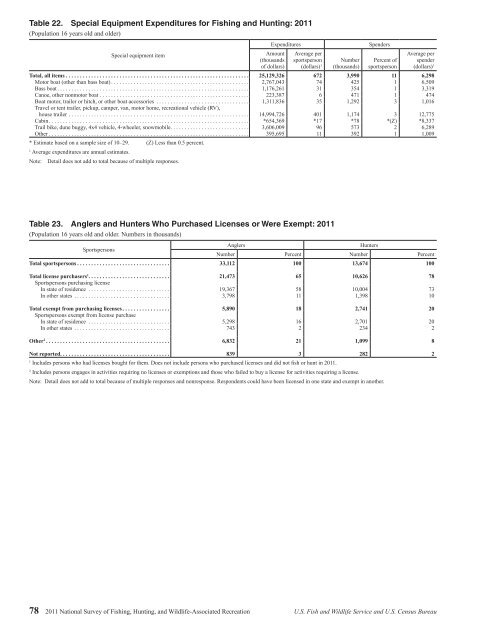
Table 22. Special Equipment Expenditures for <strong>Fishing</strong> <strong>and</strong> <strong>Hunting</strong>: 2011(Population 16 years old <strong>and</strong> older)Special equipment itemExpendituresAmount(thous<strong>and</strong>s<strong>of</strong> dollars)Average persportsperson(dollars) 1Number(thous<strong>and</strong>s)SpendersPercent <strong>of</strong>sportspersonAverage perspender(dollars) 1Total, all items ................................................................. 25,129,326 672 3,990 11 6,298Motor boat (other than bass boat) ................................................. 2,767,043 74 425 1 6,509Bass boat .................................................................... 1,176,261 31 354 1 3,319Canoe, other nonmotor boat ..................................................... 223,387 6 471 1 474Boat motor, trailer or hitch, or other boat accessories ................................. 1,311,836 35 1,292 3 1,016Travel or tent trailer, pickup, camper, van, motor home, recreational vehicle (RV),house trailer ................................................................ 14,994,726 401 1,174 3 12,775Cabin ....................................................................... *654,369 *17 *78 *(Z) *8,337Trail bike, dune buggy, 4x4 vehicle, 4-wheeler, snowmobile ............................ 3,606,009 96 573 2 6,289Other ....................................................................... 395,695 11 392 1 1,009* Estimate based on a sample size <strong>of</strong> 10–29. (Z) Less than 0.5 percent.1Average expenditures are annual estimates.Note: Detail does not add to total because <strong>of</strong> multiple responses.Table 23. Anglers <strong>and</strong> Hunters Who Purchased Licenses or Were Exempt: 2011(Population 16 years old <strong>and</strong> older. Numbers in thous<strong>and</strong>s)SportspersonsAnglersHuntersNumber Percent Number PercentTotal sportspersons ................................. 33,112 100 13,674 100Total license purchasers 1 . . . . . . . . . . . . . . . . . . . . . . . . . . . . . 21,473 65 10,626 78Sportspersons purchasing licenseIn state <strong>of</strong> residence ............................. 19,367 58 10,004 73In other states .................................. 3,798 11 1,398 10Total exempt from purchasing licenses ................. 5,890 18 2,741 20Sportspersons exempt from license purchaseIn state <strong>of</strong> residence ............................. 5,298 16 2,701 20In other states .................................. 743 2 234 2Other 2 ............................................ 6,832 21 1,099 8Not reported. . . . . . . . . . . . . . . . . . . . . . . . . . . . . . . . . . . . . . . 839 3 282 21Includes persons who had licenses bought for them. Does not include persons who purchased licenses <strong>and</strong> did not fish or hunt in 2011.2Includes persons engages in activities requiring no licenses or exemptions <strong>and</strong> those who failed to buy a license for activities requiring a license.Note: Detail does not add to total because <strong>of</strong> multiple responses <strong>and</strong> nonresponse. Respondents could have been licensed in one state <strong>and</strong> exempt in another.78 2011 <strong>National</strong> <strong>Survey</strong> <strong>of</strong> <strong>Fishing</strong>, <strong>Hunting</strong>, <strong>and</strong> <strong>Wildlife</strong>-Associated Recreation U.S. Fish <strong>and</strong> <strong>Wildlife</strong> Service <strong>and</strong> U.S. Census Bureau
Table 24. Selected Characteristics <strong>of</strong> Anglers <strong>and</strong> Hunters Who Purchased Licenses: 2011(Population 16 years old <strong>and</strong> older. Numbers in thous<strong>and</strong>s)CharacteristicTotalAnglersPurchaseda license 1Did not purchasea license 2TotalHuntersPurchaseda license 1Did not purchasea license 2Number Percent Number Percent Number Percent Number Percent Number Percent Number PercentTotal persons ........................... 33,112 100 21,473 65 11,639 35 13,674 100 10,626 78 3,049 22Population Density <strong>of</strong> ResidenceUrban ................................ 20,216 100 13,243 66 6,973 34 5,797 100 4,585 79 1,212 21Rural ................................ 12,896 100 8,230 64 4,666 36 7,877 100 6,041 77 1,837 23Population Size <strong>of</strong> ResidenceMetropolitan Statistical Area (MSA) ....... 29,442 100 19,144 65 10,298 35 10,915 100 8,515 78 2,400 221,000,000 or more .................... 12,669 100 7,792 62 4,877 38 3,367 100 2,577 77 791 23250,000 to 999,999 ................... 7,071 100 4,720 67 2,351 33 2,374 100 1,957 82 418 1850,000 to 249,999 .................... 9,702 100 6,632 68 3,070 32 5,174 100 3,982 77 1,192 23Outside MSA .......................... 3,670 100 2,329 63 1,341 37 2,759 100 2,111 76 648 24Census Geographic DivisionNew Engl<strong>and</strong> .......................... 1,355 100 896 66 459 34 420 100 316 75 104 25Middle Atlantic ........................ 3,496 100 1,799 51 1,697 49 1,558 100 1,208 78 349 22East North Central ...................... 5,861 100 4,339 74 1,521 26 2,688 100 2,249 84 439 16West North Central ..................... 3,591 100 2,793 78 798 22 1,661 100 1,395 84 265 16South Atlantic ......................... 6,163 100 3,191 52 2,972 48 1,870 100 1,340 72 530 28East South Central ...................... 2,444 100 1,533 63 911 37 1,531 100 1,001 65 530 35West South Central ..................... 4,298 100 2,138 50 2,160 50 1,909 100 1,451 76 458 24Mountain ............................. 2,586 100 2,166 84 420 16 1,043 100 929 89 114 11Pacific ............................... 3,319 100 2,617 79 702 21 996 100 736 74 260 26Age16 to 17 years ......................... 942 100 499 53 444 47 419 100 356 85 *63 *1518 to 24 years ......................... 2,668 100 1,874 70 794 30 1,288 100 967 75 322 2525 to 34 years ......................... 6,133 100 3,819 62 2,314 38 2,079 100 1,537 74 542 2635 to 44 years ......................... 5,962 100 4,221 71 1,740 29 2,416 100 2,021 84 395 1645 to 54 years ......................... 7,428 100 5,148 69 2,280 31 3,143 100 2,670 85 473 1555 to 64 years ......................... 5,886 100 4,074 69 1,812 31 2,842 100 2,220 78 622 2265 years <strong>and</strong> older ...................... 4,093 100 1,838 45 2,256 55 1,487 100 856 58 632 4265 to 74 years ....................... 3,051 100 1,513 50 1,538 50 1,221 100 707 58 514 4275 <strong>and</strong> older ......................... 1,042 100 325 31 717 69 266 100 149 56 118 44SexMale ................................ 24,226 100 16,599 69 7,627 31 12,217 100 9,587 78 2,630 22Female ............................... 8,885 100 4,873 55 4,012 45 1,457 100 1,039 71 419 29EthnicityHispanic ............................. 1,675 100 1,052 63 623 37 271 100 154 57 *117 *43Non-Hispanic ......................... 31,436 100 20,421 65 11,016 35 13,403 100 10,472 78 2,932 22RaceWhite ................................ 28,560 100 19,060 67 9,500 33 12,852 100 10,143 79 2,710 21African American ...................... 2,286 100 1,255 55 1,031 45 413 100 *246 *60 *167 *40Asian American ........................ 733 100 318 43 414 57 *27 *100 *15 *54 ... ...<strong>All</strong> others ............................. 1,533 100 839 55 693 45 382 100 223 58 159 42Annual Household IncomeLess than $20,000 ...................... 3,266 100 1,808 55 1,458 45 991 100 716 72 275 28$20,000 to $24,999 ..................... 1,573 100 893 57 681 43 533 100 334 63 *199 *37$25,000 to $29,999 ..................... 1,364 100 674 49 690 51 495 100 355 72 *140 *28$30,000 to $34,999 ..................... 1,444 100 1,021 71 423 29 556 100 428 77 128 23$35,000 to $39,999 ..................... 1,521 100 885 58 636 42 606 100 481 79 125 21$40,000 to $49,999 ..................... 2,721 100 1,792 66 929 34 1,129 100 831 74 298 26$50,000 to $74,999 ..................... 5,851 100 3,832 66 2,019 34 2,610 100 2,131 82 480 18$75,000 to $99,999 ..................... 4,848 100 3,450 71 1,398 29 2,371 100 1,895 80 477 20$100,000 to $149,999 ................... 4,131 100 3,050 74 1,081 26 1,932 100 1,579 82 352 18$150,000 or more ...................... 2,722 100 1,845 68 877 32 861 100 731 85 130 15Not reported .......................... 3,671 100 2,222 61 1,449 39 1,591 100 1,146 72 445 28Education11 years or less ........................ 3,705 100 2,023 55 1,682 45 1,482 100 1,104 74 379 2612 years .............................. 10,503 100 6,621 63 3,882 37 4,975 100 3,839 77 1,136 231 to 3 years <strong>of</strong> college ................... 8,495 100 5,718 67 2,777 33 3,510 100 2,624 75 886 254 years <strong>of</strong> college ...................... 6,342 100 4,620 73 1,722 27 2,447 100 2,025 83 422 175 years or more <strong>of</strong> college ................ 4,068 100 2,492 61 1,576 39 1,260 100 1,034 82 226 18Days <strong>of</strong> Participation1 to 5 days ............................ 14,732 100 8,387 57 6,346 43 3,730 100 2,575 69 1,155 316 to 10 days ........................... 6,168 100 4,012 65 2,156 35 2,721 100 2,128 78 593 2211 to 25 days .......................... 5,971 100 4,361 73 1,610 27 3,457 100 2,760 80 697 2026 days or more ........................ 6,049 100 4,643 77 1,406 23 3,678 100 3,158 86 520 14* Estimate based on a sample size <strong>of</strong> 10–29. … Sample size too small (less than 10) to report data reliably.1Includes persons who purchased a license in 2011 in any state. Respondents could have been licensed in one state <strong>and</strong> exempt in another.2Includes those persons who did not purchase a license in any state in 2011 <strong>and</strong> those who did not specify a license purchase in 2011.U.S. Fish <strong>and</strong> <strong>Wildlife</strong> Service <strong>and</strong> U.S. Census Bureau 2011 <strong>National</strong> <strong>Survey</strong> <strong>of</strong> <strong>Fishing</strong>, <strong>Hunting</strong>, <strong>and</strong> <strong>Wildlife</strong>-Associated Recreation 79
- Page 1:
U.S. Fish & Wildlife Service2011Nat
- Page 4 and 5:
Economics and StatisticsAdministrat
- Page 6 and 7:
List of TablesFishing and Hunting1.
- Page 8 and 9:
ForewordWhen I was growing up, it w
- Page 11 and 12:
Highlights
- Page 13 and 14:
watching (observing, photographing,
- Page 15 and 16:
Expenditures for Wildlife-Related R
- Page 17 and 18:
Fishing
- Page 19 and 20:
Fishing ExpendituresAnglers spent $
- Page 21 and 22:
Freshwater Fishing ExpendituresAngl
- Page 23 and 24:
pike, pickerel, and muskie, as well
- Page 25 and 26:
Sex and Age of AnglersAlthough more
- Page 27 and 28:
The majority of anglers had househo
- Page 29:
2001-2011 Fishing Participants, Day
- Page 32 and 33:
Hunting HighlightsIn 2011, 13.7 mil
- Page 34 and 35:
Big Game HuntingIn 2011, a majority
- Page 36 and 37:
Days per hunterTrips per hunterTrip
- Page 38 and 39: Hunting on Public and PrivateLandsm
- Page 40 and 41: Large MSA25%Medium MSA17%Percent of
- Page 42 and 43: Hispanics, who represent a growingp
- Page 45 and 46: Wildlife WatchingU.S. Fish and Wild
- Page 47 and 48: Wildlife-Watching ExpendituresThirt
- Page 49 and 50: Wildlife Fed, Observed, orPhotograp
- Page 51 and 52: Metropolitan and NonmetropolitanAro
- Page 53 and 54: Education, Race, and Ethnicity ofAr
- Page 55 and 56: Away-From-Home Participantsby Type
- Page 57 and 58: Away-From-Home WildlifeWatchers by
- Page 59 and 60: Metropolitan and NonmetropolitanAwa
- Page 61 and 62: 2001-2011 Comparison of Wildlife-Wa
- Page 63: 2006-2011 Wildlife-Watching Partici
- Page 66 and 67: Guide to Statistical TablesPurpose
- Page 68 and 69: Table 3. Freshwater Anglers and Day
- Page 70 and 71: Table 7. Hunters and Days of Huntin
- Page 72 and 73: Table 8. Selected Characteristics o
- Page 74 and 75: Table 9. Selected Characteristics o
- Page 76 and 77: Table 10. Selected Characteristics
- Page 78 and 79: Table 12. Expenditures for Fishing:
- Page 80 and 81: Table 14. Trip and Equipment Expend
- Page 82 and 83: Table 16. Trip and Equipment Expend
- Page 84 and 85: Table 18. Trip and Equipment Expend
- Page 86 and 87: Table 20. Trip and Equipment Expend
- Page 90 and 91: Table 25. Freshwater Anglers and Da
- Page 92 and 93: Table 29. Hunters and Days of Hunti
- Page 94 and 95: Table 33. Hunters Preparing for Hun
- Page 96 and 97: Table 37. Participation in Wildlife
- Page 98 and 99: Table 40. Expenditures for Wildlife
- Page 100 and 101: Table 41. Selected Characteristics
- Page 102 and 103: Table 42. Selected Characteristics
- Page 104 and 105: Table 46. Total Wildlife-Related Pa
- Page 106 and 107: Appendix A.DefinitionsAnnual househ
- Page 108 and 109: State governments (such as State pa
- Page 110 and 111: Appendix B.2010 Participation of 6-
- Page 112 and 113: Table B-4. Most Recent Year of Fish
- Page 114 and 115: Table B-7. Selected Characteristics
- Page 116 and 117: Table B-9. Participation by 6-to-15
- Page 118 and 119: Appendix C.Significant Methodologic
- Page 120 and 121: Table C-1. Major Characteristics of
- Page 122 and 123: Table C-2. Anglers and Hunters by C
- Page 124 and 125: household income in the 2001Survey.
- Page 126 and 127: Table C-4. Comparison of Major Find
- Page 128 and 129: Table C-5. Anglers and Hunters by C
- Page 130 and 131: Appendix D.Sample Design and Statis
- Page 132 and 133: lation 6 to 15 years of age were de
- Page 134 and 135: compute in advance the standard err
- Page 136 and 137: Illustration of the Computation of
- Page 138 and 139:
Table D-2. Approximate Standard Err
- Page 140 and 141:
Table D-4. Approximate Standard Err
- Page 143:
U.S. Department of the InteriorU.S.