Table 9. Selected Characteristics <strong>of</strong> Anglers by Type <strong>of</strong> <strong>Fishing</strong>: 2011—Continued(Population 16 years old <strong>and</strong> older. Numbers in thous<strong>and</strong>s)CharacteristicFreshwater, except Great LakesNumberFreshwaterPercentwhoparticipated Percent NumberGreat LakesPercentwhoparticipated Percent NumberSaltwaterPercentwhoparticipatedTotal persons ................................... 27,060 11 100 1,665 1 100 8,889 4 100Population Density <strong>of</strong> ResidenceUrban ........................................ 15,656 9 58 907 1 54 6,654 4 75Rural ........................................ 11,404 19 42 758 1 46 2,235 4 25Population Size <strong>of</strong> ResidenceMetropolitan Statistical Area (MSA) ............... 23,759 11 88 1,416 1 85 8,519 4 961,000,000 or more ............................ 9,598 8 35 555 (Z) 33 4,658 4 52250,000 to 999,999 ........................... 5,498 11 20 485 1 29 2,191 5 2550,000 to 249,999 ............................ 8,663 18 32 376 1 23 1,669 3 19Outside MSA .................................. 3,301 22 12 *249 *2 *15 370 2 4Census Geographic DivisionNew Engl<strong>and</strong> .................................. 996 9 4 ... ... ... 661 6 7Middle Atlantic ................................ 2,343 7 9 395 1 24 1,425 4 16East North Central .............................. 4,871 13 18 1,139 3 68 533 1 6West North Central ............................. 3,418 22 13 *66 *(Z) *4 *63 *(Z) *1South Atlantic ................................. 4,241 9 16 *35 *(Z) *2 3,101 7 35East South Central .............................. 2,274 16 8 ... ... ... 360 3 4West South Central ............................. 3,760 14 14 ... ... ... 1,092 4 12Mountain ..................................... 2,494 15 9 ... ... ... 170 1 2Pacific ....................................... 2,663 7 10 ... ... ... 1,482 4 17Age16 to 17 years ................................. 754 10 3 ... ... ... 234 3 318 to 24 years ................................. 2,228 8 8 ... ... ... 530 2 625 to 34 years ................................. 5,127 12 19 *320 *1 *19 1,505 4 1735 to 44 years ................................. 4,847 12 18 232 1 14 1,571 4 1845 to 54 years ................................. 5,954 13 22 483 1 29 2,161 5 2455 to 64 years ................................. 4,911 13 18 359 1 22 1,730 4 1965 years <strong>and</strong> older .............................. 3,239 8 12 *137 *(Z) *8 1,157 3 1365 to 74 years ............................... 2,403 11 9 *117 *1 *7 913 4 1075 <strong>and</strong> older ................................. 836 5 3 ... ... ... 244 2 3SexMale ........................................ 20,033 17 74 1,257 1 75 6,610 6 74Female ....................................... 7,026 6 26 408 (Z) 25 2,279 2 26EthnicityHispanic ..................................... 1,267 4 5 ... ... ... 603 2 7Non-Hispanic ................................. 25,793 12 95 1,644 1 99 8,286 4 93RaceWhite ........................................ 23,562 13 87 1,561 1 94 7,383 4 83African American .............................. 1,701 7 6 ... ... ... 764 3 9Asian American ................................ 472 4 2 ... ... ... 373 3 4<strong>All</strong> others ..................................... 1,326 6 5 ... ... ... 369 2 4Annual Household IncomeLess than $20,000 .............................. 2,631 9 10 ... ... ... 725 2 8$20,000 to $24,999 ............................. 1,416 11 5 ... ... ... *98 *1 *1$25,000 to $29,999 ............................. 1,132 11 4 ... ... ... 428 4 5$30,000 to $34,999 ............................. 1,155 10 4 ... ... ... 310 3 3$35,000 to $39,999 ............................. 1,276 11 5 ... ... ... 256 2 3$40,000 to $49,999 ............................. 2,346 14 9 *153 *1 *9 611 4 7$50,000 to $74,999 ............................. 4,921 15 18 278 1 17 1,731 5 19$75,000 to $99,999 ............................. 4,032 16 15 *321 *1 *19 1,367 5 15$100,000 to $149,999 ........................... 3,308 14 12 334 1 20 1,167 5 13$150,000 or more .............................. 2,022 12 7 *72 *(Z) *4 1,050 6 12Not reported .................................. 2,821 6 10 *123 *(Z) *7 1,146 3 13Education11 years or less ................................ 3,040 10 11 ... ... ... 706 2 812 years ...................................... 8,596 10 32 517 1 31 2,399 3 271 to 3 years <strong>of</strong> college ........................... 7,126 13 26 488 1 29 2,282 4 264 years <strong>of</strong> college .............................. 5,263 12 19 344 1 21 1,828 4 215 years or more <strong>of</strong> college ........................ 3,035 11 11 *177 *1 *11 1,673 6 19* Estimate based on a sample size <strong>of</strong> 10–29. … Sample size too small (less than 10) to report data reliably. (Z) Less than 0.5 percent.Note: Percent who participated columns show the percent <strong>of</strong> each row’s population who participated in the activity named by the column. Percent columns show the percent <strong>of</strong>each column’s participants who are described by the row heading. Demographic variables we could include but haven’t are (1) relationship to head <strong>of</strong> household, (2) maritalstatus, (3) population size <strong>of</strong> area participant grew up, (4) years participant lived in resident state, (5) whether or not participant has a job, <strong>and</strong> (6) whether or not participantis going to school, keeping house, or retired.Percent64 2011 <strong>National</strong> <strong>Survey</strong> <strong>of</strong> <strong>Fishing</strong>, <strong>Hunting</strong>, <strong>and</strong> <strong>Wildlife</strong>-Associated Recreation U.S. Fish <strong>and</strong> <strong>Wildlife</strong> Service <strong>and</strong> U.S. Census Bureau
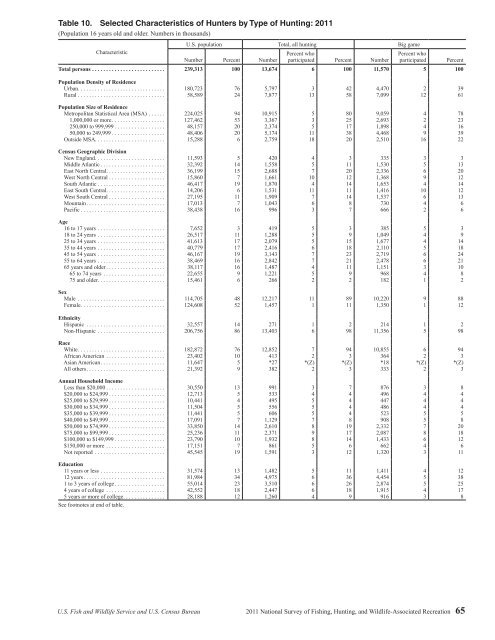
Table 10. Selected Characteristics <strong>of</strong> Hunters by Type <strong>of</strong> <strong>Hunting</strong>: 2011(Population 16 years old <strong>and</strong> older. Numbers in thous<strong>and</strong>s)CharacteristicU.S. population Total, all hunting Big gameNumber Percent NumberPercent whoparticipated Percent NumberPercent whoparticipatedTotal persons .......................... 239,313 100 13,674 6 100 11,570 5 100Population Density <strong>of</strong> ResidenceUrban ............................... 180,723 76 5,797 3 42 4,470 2 39Rural ............................... 58,589 24 7,877 13 58 7,099 12 61Population Size <strong>of</strong> ResidenceMetropolitan Statistical Area (MSA) ...... 224,025 94 10,915 5 80 9,059 4 781,000,000 or more ................... 127,462 53 3,367 3 25 2,693 2 23250,000 to 999,999 .................. 48,157 20 2,374 5 17 1,898 4 1650,000 to 249,999 ................... 48,406 20 5,174 11 38 4,468 9 39Outside MSA ......................... 15,288 6 2,759 18 20 2,510 16 22Census Geographic DivisionNew Engl<strong>and</strong> ......................... 11,593 5 420 4 3 335 3 3Middle Atlantic ....................... 32,392 14 1,558 5 11 1,530 5 13East North Central ..................... 36,199 15 2,688 7 20 2,336 6 20West North Central .................... 15,860 7 1,661 10 12 1,368 9 12South Atlantic ........................ 46,417 19 1,870 4 14 1,653 4 14East South Central ..................... 14,206 6 1,531 11 11 1,416 10 12West South Central .................... 27,195 11 1,909 7 14 1,537 6 13Mountain ............................ 17,013 7 1,043 6 8 730 4 6Pacific .............................. 38,438 16 996 3 7 666 2 6Age16 to 17 years ........................ 7,652 3 419 5 3 385 5 318 to 24 years ........................ 26,517 11 1,288 5 9 1,049 4 925 to 34 years ........................ 41,613 17 2,079 5 15 1,677 4 1435 to 44 years ........................ 40,779 17 2,416 6 18 2,110 5 1845 to 54 years ........................ 46,167 19 3,143 7 23 2,719 6 2455 to 64 years ........................ 38,469 16 2,842 7 21 2,478 6 2165 years <strong>and</strong> older ..................... 38,117 16 1,487 4 11 1,151 3 1065 to 74 years ...................... 22,655 9 1,221 5 9 968 4 875 <strong>and</strong> older ........................ 15,461 6 266 2 2 182 1 2SexMale ............................... 114,705 48 12,217 11 89 10,220 9 88Female .............................. 124,608 52 1,457 1 11 1,350 1 12EthnicityHispanic ............................ 32,557 14 271 1 2 214 1 2Non-Hispanic ........................ 206,756 86 13,403 6 98 11,356 5 98RaceWhite ............................... 182,872 76 12,852 7 94 10,855 6 94African American ..................... 23,402 10 413 2 3 364 2 3Asian American ....................... 11,647 5 *27 *(Z) *(Z) *18 *(Z) *(Z)<strong>All</strong> others ............................ 21,392 9 382 2 3 333 2 3Annual Household IncomeLess than $20,000 ..................... 30,550 13 991 3 7 876 3 8$20,000 to $24,999 .................... 12,713 5 533 4 4 496 4 4$25,000 to $29,999 .................... 10,441 4 495 5 4 447 4 4$30,000 to $34,999 .................... 11,504 5 556 5 4 486 4 4$35,000 to $39,999 .................... 11,441 5 606 5 4 523 5 5$40,000 to $49,999 .................... 17,091 7 1,129 7 8 908 5 8$50,000 to $74,999 .................... 33,850 14 2,610 8 19 2,332 7 20$75,000 to $99,999 .................... 25,236 11 2,371 9 17 2,087 8 18$100,000 to $149,999 .................. 23,790 10 1,932 8 14 1,433 6 12$150,000 or more ..................... 17,151 7 861 5 6 662 4 6Not reported ......................... 45,545 19 1,591 3 12 1,320 3 11Education11 years or less ....................... 31,574 13 1,482 5 11 1,411 4 1212 years ............................. 81,984 34 4,975 6 36 4,454 5 381 to 3 years <strong>of</strong> college .................. 55,014 23 3,510 6 26 2,874 5 254 years <strong>of</strong> college ..................... 42,552 18 2,447 6 18 1,915 4 175 years or more <strong>of</strong> college ............... 28,188 12 1,260 4 9 916 3 8See footnotes at end <strong>of</strong> table.PercentU.S. Fish <strong>and</strong> <strong>Wildlife</strong> Service <strong>and</strong> U.S. Census Bureau 2011 <strong>National</strong> <strong>Survey</strong> <strong>of</strong> <strong>Fishing</strong>, <strong>Hunting</strong>, <strong>and</strong> <strong>Wildlife</strong>-Associated Recreation 65
- Page 1:
U.S. Fish & Wildlife Service2011Nat
- Page 4 and 5:
Economics and StatisticsAdministrat
- Page 6 and 7:
List of TablesFishing and Hunting1.
- Page 8 and 9:
ForewordWhen I was growing up, it w
- Page 11 and 12:
Highlights
- Page 13 and 14:
watching (observing, photographing,
- Page 15 and 16:
Expenditures for Wildlife-Related R
- Page 17 and 18:
Fishing
- Page 19 and 20:
Fishing ExpendituresAnglers spent $
- Page 21 and 22:
Freshwater Fishing ExpendituresAngl
- Page 23 and 24: pike, pickerel, and muskie, as well
- Page 25 and 26: Sex and Age of AnglersAlthough more
- Page 27 and 28: The majority of anglers had househo
- Page 29: 2001-2011 Fishing Participants, Day
- Page 32 and 33: Hunting HighlightsIn 2011, 13.7 mil
- Page 34 and 35: Big Game HuntingIn 2011, a majority
- Page 36 and 37: Days per hunterTrips per hunterTrip
- Page 38 and 39: Hunting on Public and PrivateLandsm
- Page 40 and 41: Large MSA25%Medium MSA17%Percent of
- Page 42 and 43: Hispanics, who represent a growingp
- Page 45 and 46: Wildlife WatchingU.S. Fish and Wild
- Page 47 and 48: Wildlife-Watching ExpendituresThirt
- Page 49 and 50: Wildlife Fed, Observed, orPhotograp
- Page 51 and 52: Metropolitan and NonmetropolitanAro
- Page 53 and 54: Education, Race, and Ethnicity ofAr
- Page 55 and 56: Away-From-Home Participantsby Type
- Page 57 and 58: Away-From-Home WildlifeWatchers by
- Page 59 and 60: Metropolitan and NonmetropolitanAwa
- Page 61 and 62: 2001-2011 Comparison of Wildlife-Wa
- Page 63: 2006-2011 Wildlife-Watching Partici
- Page 66 and 67: Guide to Statistical TablesPurpose
- Page 68 and 69: Table 3. Freshwater Anglers and Day
- Page 70 and 71: Table 7. Hunters and Days of Huntin
- Page 72 and 73: Table 8. Selected Characteristics o
- Page 76 and 77: Table 10. Selected Characteristics
- Page 78 and 79: Table 12. Expenditures for Fishing:
- Page 80 and 81: Table 14. Trip and Equipment Expend
- Page 82 and 83: Table 16. Trip and Equipment Expend
- Page 84 and 85: Table 18. Trip and Equipment Expend
- Page 86 and 87: Table 20. Trip and Equipment Expend
- Page 88 and 89: Table 22. Special Equipment Expendi
- Page 90 and 91: Table 25. Freshwater Anglers and Da
- Page 92 and 93: Table 29. Hunters and Days of Hunti
- Page 94 and 95: Table 33. Hunters Preparing for Hun
- Page 96 and 97: Table 37. Participation in Wildlife
- Page 98 and 99: Table 40. Expenditures for Wildlife
- Page 100 and 101: Table 41. Selected Characteristics
- Page 102 and 103: Table 42. Selected Characteristics
- Page 104 and 105: Table 46. Total Wildlife-Related Pa
- Page 106 and 107: Appendix A.DefinitionsAnnual househ
- Page 108 and 109: State governments (such as State pa
- Page 110 and 111: Appendix B.2010 Participation of 6-
- Page 112 and 113: Table B-4. Most Recent Year of Fish
- Page 114 and 115: Table B-7. Selected Characteristics
- Page 116 and 117: Table B-9. Participation by 6-to-15
- Page 118 and 119: Appendix C.Significant Methodologic
- Page 120 and 121: Table C-1. Major Characteristics of
- Page 122 and 123: Table C-2. Anglers and Hunters by C
- Page 124 and 125:
household income in the 2001Survey.
- Page 126 and 127:
Table C-4. Comparison of Major Find
- Page 128 and 129:
Table C-5. Anglers and Hunters by C
- Page 130 and 131:
Appendix D.Sample Design and Statis
- Page 132 and 133:
lation 6 to 15 years of age were de
- Page 134 and 135:
compute in advance the standard err
- Page 136 and 137:
Illustration of the Computation of
- Page 138 and 139:
Table D-2. Approximate Standard Err
- Page 140 and 141:
Table D-4. Approximate Standard Err
- Page 143:
U.S. Department of the InteriorU.S.