Guide to Statistical TablesPurpose <strong>and</strong> Coverage <strong>of</strong> TablesThe statistical tables <strong>of</strong> this report weredesigned to meet a wide range <strong>of</strong> needsfor those interested in wildlife-relatedrecreation. Special terms used in thesetables are defined in Appendix A.The tables are based on responses tothe 2011 <strong>Survey</strong>, which was designedto collect data about participation inwi ldlife-related recreation. To havetaken part in the <strong>Survey</strong>, a respondentmust have been a U.S. resident (aresident <strong>of</strong> one <strong>of</strong> the 50 states or theDistrict <strong>of</strong> Columbia). No one residingoutside the United States (includingU.S. citizens) was eligible for interviewing.Therefore, reported nationaltotals do not include participation bythose who were not U.S. residents orwho were U.S. citizens residing outsidethe United States.Comparability With Previous<strong>Survey</strong>sThe numbers reported can be comparedwith those in the 1991, 1996, 2001, <strong>and</strong>2006 <strong>Survey</strong> Reports. The methodologyused in 2011 was similar to that used inthose <strong>Survey</strong>s. These results should notbe directly compared to results from<strong>Survey</strong>s earlier than 1991 since therewere major changes in methodology.These changes were made to improveaccuracy in the information provided.Trends further back than 1991 arepresented in Appendix C. These trendswere developed using parts <strong>of</strong> the<strong>Survey</strong>s that were comparable.Coverage <strong>of</strong> an Individual TableSince the <strong>Survey</strong> covers many activitiesin various places by participants<strong>of</strong> different ages, all table titles,headnotes, stubs, <strong>and</strong> footnotes aredesigned to identify <strong>and</strong> articulate eachitem being reported in the table. Forexample, the title <strong>of</strong> Table 1 shows thatdata about anglers <strong>and</strong> hunters, theirdays <strong>of</strong> participation, <strong>and</strong> their number<strong>of</strong> trips are reported by type <strong>of</strong> activity.By contrast, the title <strong>of</strong> Table 3 indicatesthat it contains data on freshwateranglers <strong>and</strong> the days they fished fordifferent species.Percentages Reported in the TablesPercentages are reported in the tablesfor the convenience <strong>of</strong> the user. Whenexclusive groups are being reported,the base <strong>of</strong> a percentage is apparentfrom its context because the percentsadd to 100 percent (plus or minus arounding error). For example, Table 1reports the number <strong>of</strong> trips taken by biggame hunters (65 percent), those takenby small game hunters (17 percent),those taken by migratory bird hunters(8 percent), <strong>and</strong> those taken by hunterspursuing other animals (10 percent).These comprise 100 percent becausethey are exclusive categories.Percents should not add to 100when nonexclusive groups are beingreported. Using Table 1 as an exampleagain, note that adding the percentagesassociated with the total number <strong>of</strong> biggame hunters (85 percent), total smallgame hunters (33 percent), total migratorybird hunters (19 percent), <strong>and</strong> totalhunters <strong>of</strong> other animals (16 percent)will not yield total hunters (100percent) because respondents couldhunt for more than one type <strong>of</strong> game.When the base <strong>of</strong> the percentage is notapparent in context, it is identified in afootnote. For example, Table 6 reportsthree percentages with different bases:one for the number <strong>of</strong> hunters, one forthe number <strong>of</strong> trips, <strong>and</strong> one for days <strong>of</strong>hunting. Footnotes are used to clarifythe bases <strong>of</strong> the reported percentages.Footnotes to the TablesFootnotes are used to clarify the informationor items that are being reportedin a table. Symbols in the body <strong>of</strong> atable indicate important footnotes.The following symbols are used in thetables to refer to the same footnote eachtime they appear:* Estimate based on a sample size<strong>of</strong> 10–29.... Sample size too small to report datareliably.Z Less than 0.5 percent.XNot applicable.NA Not available.Estimates based upon fewer than tenresponses are regarded as being basedon a sample size that is too small forreliable reporting. An estimate basedupon at least 10 but fewer than 30responses is treated as an estimatebased on a small sample size. Otherfootnotes appear, as necessary, toqualify or clarify the estimates reportedin the tables. In addition, these twoimportant footnotes appear frequently:• Detail does not add to total because<strong>of</strong> multiple responses.• Detail does not add to totalbecause <strong>of</strong> multiple responses <strong>and</strong>no nresponse.“Multiple responses” is a term used toreflect the fact that individuals or theircharacteristics fall into more than onecategory. Using Table 2 as an example,those who fished in saltwater <strong>and</strong> freshwaterappear in both <strong>of</strong> these totals. Yeteach angler is represented only once inthe “Total, all fishing” column. Similarly,in Table 6, those who hunt forbig game <strong>and</strong> small game are countedonly once as a hunter in the “Total, allhunting” column. Therefore, totals willbe smaller than the sum <strong>of</strong> subcategorieswhen multiple responses exist.“Nonresponse” exists because the<strong>Survey</strong> questions were answeredvoluntarily, <strong>and</strong> some respondents didnot or could not answer all the questions.The effect <strong>of</strong> nonresponse isillustrated in Table 27, where the totaldays <strong>of</strong> hunting is greater than thesum <strong>of</strong> hunting days on private l<strong>and</strong><strong>and</strong> hunting days on public l<strong>and</strong>. Thisoccurs because some respondents didnot answer the days hunted on private/public l<strong>and</strong> questions. As a result,it is known how many days huntershunted but not known if those dayswere on public or private l<strong>and</strong>. In thiscase, totals are greater than the sum <strong>of</strong>subcategories when nonresponses haveoccurred.56 2011 <strong>National</strong> <strong>Survey</strong> <strong>of</strong> <strong>Fishing</strong>, <strong>Hunting</strong>, <strong>and</strong> <strong>Wildlife</strong>-Associated Recreation U.S. Fish <strong>and</strong> <strong>Wildlife</strong> Service <strong>and</strong> U.S. Census Bureau
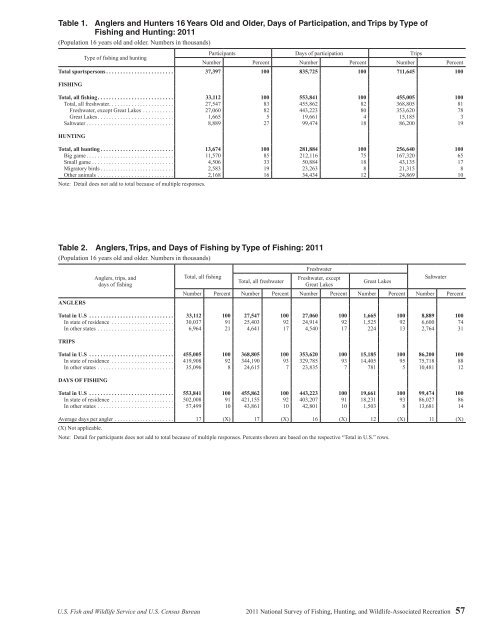
Table 1. Anglers <strong>and</strong> Hunters 16 Years Old <strong>and</strong> Older, Days <strong>of</strong> Participation, <strong>and</strong> Trips by Type <strong>of</strong><strong>Fishing</strong> <strong>and</strong> <strong>Hunting</strong>: 2011(Population 16 years old <strong>and</strong> older. Numbers in thous<strong>and</strong>s)Type <strong>of</strong> fishing <strong>and</strong> huntingParticipants Days <strong>of</strong> participation TripsNumber Percent Number Percent Number PercentTotal sportspersons ........................ 37,397 100 835,725 100 711,645 100FISHINGTotal, all fishing ........................... 33,112 100 553,841 100 455,005 100Total, all freshwater ....................... 27,547 83 455,862 82 368,805 81Freshwater, except Great Lakes ........... 27,060 82 443,223 80 353,620 78Great Lakes ........................... 1,665 5 19,661 4 15,185 3Saltwater ............................... 8,889 27 99,474 18 86,200 19HUNTINGTotal, all hunting .......................... 13,674 100 281,884 100 256,640 100Big game ............................... 11,570 85 212,116 75 167,320 65Small game ............................. 4,506 33 50,884 18 43,135 17Migratory birds .......................... 2,583 19 23,263 8 21,315 8Other animals ........................... 2,168 16 34,434 12 24,869 10Note: Detail does not add to total because <strong>of</strong> multiple responses.Table 2. Anglers, Trips, <strong>and</strong> Days <strong>of</strong> <strong>Fishing</strong> by Type <strong>of</strong> <strong>Fishing</strong>: 2011(Population 16 years old <strong>and</strong> older. Numbers in thous<strong>and</strong>s)ANGLERSAnglers, trips, <strong>and</strong>days <strong>of</strong> fishingTotal, all fishingTotal, all freshwaterFreshwaterFreshwater, exceptGreat LakesGreat LakesSaltwaterNumber Percent Number Percent Number Percent Number Percent Number PercentTotal in U.S .............................. 33,112 100 27,547 100 27,060 100 1,665 100 8,889 100In state <strong>of</strong> residence ...................... 30,037 91 25,403 92 24,914 92 1,525 92 6,600 74In other states ........................... 6,964 21 4,641 17 4,540 17 224 13 2,764 31TRIPSTotal in U.S .............................. 455,005 100 368,805 100 353,620 100 15,185 100 86,200 100In state <strong>of</strong> residence ...................... 419,908 92 344,190 93 329,785 93 14,405 95 75,718 88In other states ........................... 35,096 8 24,615 7 23,835 7 781 5 10,481 12DAYS OF FISHINGTotal in U.S .............................. 553,841 100 455,862 100 443,223 100 19,661 100 99,474 100In state <strong>of</strong> residence ...................... 502,008 91 421,155 92 403,207 91 18,231 93 86,027 86In other states ........................... 57,499 10 43,861 10 42,801 10 1,503 8 13,681 14Average days per angler ..................... 17 (X) 17 (X) 16 (X) 12 (X) 11 (X)(X) Not applicable.Note: Detail for participants does not add to total because <strong>of</strong> multiple responses. Percents shown are based on the respective “Total in U.S.” rows.U.S. Fish <strong>and</strong> <strong>Wildlife</strong> Service <strong>and</strong> U.S. Census Bureau 2011 <strong>National</strong> <strong>Survey</strong> <strong>of</strong> <strong>Fishing</strong>, <strong>Hunting</strong>, <strong>and</strong> <strong>Wildlife</strong>-Associated Recreation 57
- Page 1:
U.S. Fish & Wildlife Service2011Nat
- Page 4 and 5:
Economics and StatisticsAdministrat
- Page 6 and 7:
List of TablesFishing and Hunting1.
- Page 8 and 9:
ForewordWhen I was growing up, it w
- Page 11 and 12:
Highlights
- Page 13 and 14:
watching (observing, photographing,
- Page 15 and 16: Expenditures for Wildlife-Related R
- Page 17 and 18: Fishing
- Page 19 and 20: Fishing ExpendituresAnglers spent $
- Page 21 and 22: Freshwater Fishing ExpendituresAngl
- Page 23 and 24: pike, pickerel, and muskie, as well
- Page 25 and 26: Sex and Age of AnglersAlthough more
- Page 27 and 28: The majority of anglers had househo
- Page 29: 2001-2011 Fishing Participants, Day
- Page 32 and 33: Hunting HighlightsIn 2011, 13.7 mil
- Page 34 and 35: Big Game HuntingIn 2011, a majority
- Page 36 and 37: Days per hunterTrips per hunterTrip
- Page 38 and 39: Hunting on Public and PrivateLandsm
- Page 40 and 41: Large MSA25%Medium MSA17%Percent of
- Page 42 and 43: Hispanics, who represent a growingp
- Page 45 and 46: Wildlife WatchingU.S. Fish and Wild
- Page 47 and 48: Wildlife-Watching ExpendituresThirt
- Page 49 and 50: Wildlife Fed, Observed, orPhotograp
- Page 51 and 52: Metropolitan and NonmetropolitanAro
- Page 53 and 54: Education, Race, and Ethnicity ofAr
- Page 55 and 56: Away-From-Home Participantsby Type
- Page 57 and 58: Away-From-Home WildlifeWatchers by
- Page 59 and 60: Metropolitan and NonmetropolitanAwa
- Page 61 and 62: 2001-2011 Comparison of Wildlife-Wa
- Page 63: 2006-2011 Wildlife-Watching Partici
- Page 68 and 69: Table 3. Freshwater Anglers and Day
- Page 70 and 71: Table 7. Hunters and Days of Huntin
- Page 72 and 73: Table 8. Selected Characteristics o
- Page 74 and 75: Table 9. Selected Characteristics o
- Page 76 and 77: Table 10. Selected Characteristics
- Page 78 and 79: Table 12. Expenditures for Fishing:
- Page 80 and 81: Table 14. Trip and Equipment Expend
- Page 82 and 83: Table 16. Trip and Equipment Expend
- Page 84 and 85: Table 18. Trip and Equipment Expend
- Page 86 and 87: Table 20. Trip and Equipment Expend
- Page 88 and 89: Table 22. Special Equipment Expendi
- Page 90 and 91: Table 25. Freshwater Anglers and Da
- Page 92 and 93: Table 29. Hunters and Days of Hunti
- Page 94 and 95: Table 33. Hunters Preparing for Hun
- Page 96 and 97: Table 37. Participation in Wildlife
- Page 98 and 99: Table 40. Expenditures for Wildlife
- Page 100 and 101: Table 41. Selected Characteristics
- Page 102 and 103: Table 42. Selected Characteristics
- Page 104 and 105: Table 46. Total Wildlife-Related Pa
- Page 106 and 107: Appendix A.DefinitionsAnnual househ
- Page 108 and 109: State governments (such as State pa
- Page 110 and 111: Appendix B.2010 Participation of 6-
- Page 112 and 113: Table B-4. Most Recent Year of Fish
- Page 114 and 115: Table B-7. Selected Characteristics
- Page 116 and 117:
Table B-9. Participation by 6-to-15
- Page 118 and 119:
Appendix C.Significant Methodologic
- Page 120 and 121:
Table C-1. Major Characteristics of
- Page 122 and 123:
Table C-2. Anglers and Hunters by C
- Page 124 and 125:
household income in the 2001Survey.
- Page 126 and 127:
Table C-4. Comparison of Major Find
- Page 128 and 129:
Table C-5. Anglers and Hunters by C
- Page 130 and 131:
Appendix D.Sample Design and Statis
- Page 132 and 133:
lation 6 to 15 years of age were de
- Page 134 and 135:
compute in advance the standard err
- Page 136 and 137:
Illustration of the Computation of
- Page 138 and 139:
Table D-2. Approximate Standard Err
- Page 140 and 141:
Table D-4. Approximate Standard Err
- Page 143:
U.S. Department of the InteriorU.S.