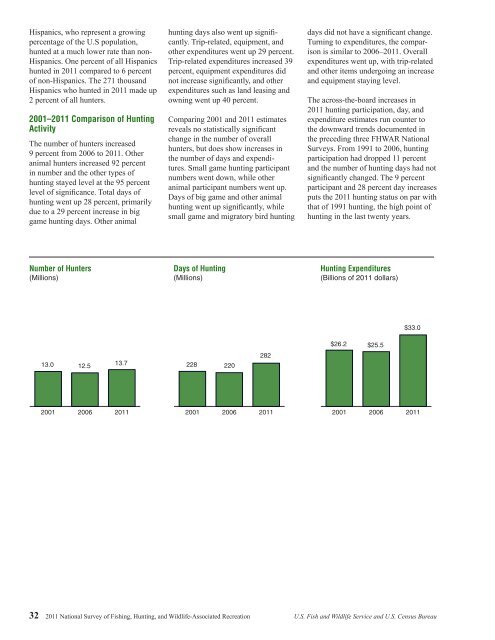
Hispanics, who represent a growingpercentage <strong>of</strong> the U.S population,hunted at a much lower rate than non-Hispanics. One percent <strong>of</strong> all Hispanicshunted in 2011 compared to 6 percent<strong>of</strong> non-Hispanics. The 271 thous<strong>and</strong>Hispanics who hunted in 2011 made up2 percent <strong>of</strong> all hunters.2001–2011 Comparison <strong>of</strong> <strong>Hunting</strong>ActivityThe number <strong>of</strong> hunters increased9 percent from 2006 to 2011. Otheranimal hunters increased 92 percentin number <strong>and</strong> the other types <strong>of</strong>hunting stayed level at the 95 percentlevel <strong>of</strong> significance. Total days <strong>of</strong>hunting went up 28 percent, primarilydue to a 29 percent increase in biggame hunting days. Other animalhunting days also went up significantly.Trip-related, equipment, <strong>and</strong>other expenditures went up 29 percent.Trip-related expenditures increased 39percent, equipment expenditures didnot increase significantly, <strong>and</strong> otherexpenditures such as l<strong>and</strong> leasing <strong>and</strong>owning went up 40 percent.Comparing 2001 <strong>and</strong> 2011 estimatesreveals no statistically significantchange in the number <strong>of</strong> overallhunters, but does show increases inthe number <strong>of</strong> days <strong>and</strong> expenditures.Small game hunting participantnumbers went down, while otheranimal participant numbers went up.Days <strong>of</strong> big game <strong>and</strong> other animalhunting went up significantly, whilesmall game <strong>and</strong> migratory bird huntingdays did not have a significant change.Turning to expenditures, the comparisonis similar to 2006–2011. Overallexpenditures went up, with trip-related<strong>and</strong> other items undergoing an increase<strong>and</strong> equipment staying level.The across-the-board increases in2011 hunting participation, day, <strong>and</strong>expenditure estimates run counter tothe downward trends documented inthe preceding three FHWAR <strong>National</strong><strong>Survey</strong>s. From 1991 to 2006, huntingparticipation had dropped 11 percent<strong>and</strong> the number <strong>of</strong> hunting days had notsignificantly changed. The 9 percentparticipant <strong>and</strong> 28 percent day increasesputs the 2011 hunting status on par withthat <strong>of</strong> 1991 hunting, the high point <strong>of</strong>hunting in the last twenty years.Number <strong>of</strong> Hunters(Millions)Days <strong>of</strong> <strong>Hunting</strong>(Millions)<strong>Hunting</strong> Expenditures(Billions <strong>of</strong> 2011 dollars)$33.0$26.2 $25.528213.0 12.513.7 228 22020012006201120012006201120012006201132 2011 <strong>National</strong> <strong>Survey</strong> <strong>of</strong> <strong>Fishing</strong>, <strong>Hunting</strong>, <strong>and</strong> <strong>Wildlife</strong>-Associated Recreation U.S. Fish <strong>and</strong> <strong>Wildlife</strong> Service <strong>and</strong> U.S. Census Bureau
2001–2011 <strong>Hunting</strong> Participants, Days, <strong>and</strong> Expenditures(U.S. population 16 years old <strong>and</strong> older. Numbers in thous<strong>and</strong>s)Hunters, total ....................... 13,034Big game ......................... 10,911Small game ....................... 5,434Migratory birds .................... 2,956Other animals ..................... 1,0472001 2011 2001-2011Number Percent Number Percent percent change100844223813,67411,5704,5062,583**2,16810085331916NS5NS6–17NS–13107Days, total .......................... 228,368Big game ......................... 153,191Small game ....................... 60,142Migratory birds .................... 29,310Other animals ..................... 19,2071006726138281,884212,11650,88423,263**34,43410075188122338NS–15NS–2179<strong>Hunting</strong>, total (2011 dollars) ........... $26,178,562Trip-related ....................... 6,671,189Equipment, total ................... 13,160,387<strong>Hunting</strong> equipment ............... 5,793,937Auxiliary equipment .............. 1,527,736Special equipment. ............... 5,838,687Other ............................ 6,346,98710025502262224***$32,999,41610,421,18913,972,4907,738,3241,844,8804,389,286***8,605,739100324223613262656NS634NS21NS–2536NSNot different from zero at the 5 percent level <strong>of</strong> significance.** Other animals redefined to include feral pigs.*** Plantings not included in 2011 expenditures for comparison purposes. 2011 was first year plantings were included.2006–2011 <strong>Hunting</strong> Participants, Days, <strong>and</strong> Expenditures(U.S. population 16 years old <strong>and</strong> older. Numbers in thous<strong>and</strong>s)Hunters, total ....................... 12,510Big game ......................... 10,682Small game ....................... 4,797Migratory birds .................... 2,293Other animals ..................... 1,1282006 2011 2006-2011Number Percent Number Percent percent change100853818913,67411,5704,5062,583**2,168100853319169NS8NS–6NS1392Days, total .......................... 219,925Big game ......................... 164,061Small game ....................... 52,395Migratory birds .................... 19,770Other animals ..................... 15,205100752497281,884212,11650,88423,263**34,43410075188122829NS–3NS18126<strong>Hunting</strong>, total (2011 dollars) ........... $25,543,470Trip-related. ........................ 7,451,789Equipment, total. .................... 11,973,875<strong>Hunting</strong> equipment. ................ 5,987,611Auxiliary equipment. ............... 1,484,214Special equipment ................. 4,502,047Other ............................. 6,117,80610029472361824***$32,999,41610,421,18913,972,4907,738,3241,844,8804,389,286***8,605,739100324223613262940NS1729NS24NS–341NSNot different from zero at the 5 percent level <strong>of</strong> significance.** Other animals redefined to include feral pigs.*** Plantings not included in 2011 expenditures for comparison purposes. 2011 was first year plantings were included.U.S. Fish <strong>and</strong> <strong>Wildlife</strong> Service <strong>and</strong> U.S. Census Bureau 2011 <strong>National</strong> <strong>Survey</strong> <strong>of</strong> <strong>Fishing</strong>, <strong>Hunting</strong>, <strong>and</strong> <strong>Wildlife</strong>-Associated Recreation 33
- Page 1: U.S. Fish & Wildlife Service2011Nat
- Page 4 and 5: Economics and StatisticsAdministrat
- Page 6 and 7: List of TablesFishing and Hunting1.
- Page 8 and 9: ForewordWhen I was growing up, it w
- Page 11 and 12: Highlights
- Page 13 and 14: watching (observing, photographing,
- Page 15 and 16: Expenditures for Wildlife-Related R
- Page 17 and 18: Fishing
- Page 19 and 20: Fishing ExpendituresAnglers spent $
- Page 21 and 22: Freshwater Fishing ExpendituresAngl
- Page 23 and 24: pike, pickerel, and muskie, as well
- Page 25 and 26: Sex and Age of AnglersAlthough more
- Page 27 and 28: The majority of anglers had househo
- Page 29: 2001-2011 Fishing Participants, Day
- Page 32 and 33: Hunting HighlightsIn 2011, 13.7 mil
- Page 34 and 35: Big Game HuntingIn 2011, a majority
- Page 36 and 37: Days per hunterTrips per hunterTrip
- Page 38 and 39: Hunting on Public and PrivateLandsm
- Page 40 and 41: Large MSA25%Medium MSA17%Percent of
- Page 45 and 46: Wildlife WatchingU.S. Fish and Wild
- Page 47 and 48: Wildlife-Watching ExpendituresThirt
- Page 49 and 50: Wildlife Fed, Observed, orPhotograp
- Page 51 and 52: Metropolitan and NonmetropolitanAro
- Page 53 and 54: Education, Race, and Ethnicity ofAr
- Page 55 and 56: Away-From-Home Participantsby Type
- Page 57 and 58: Away-From-Home WildlifeWatchers by
- Page 59 and 60: Metropolitan and NonmetropolitanAwa
- Page 61 and 62: 2001-2011 Comparison of Wildlife-Wa
- Page 63: 2006-2011 Wildlife-Watching Partici
- Page 66 and 67: Guide to Statistical TablesPurpose
- Page 68 and 69: Table 3. Freshwater Anglers and Day
- Page 70 and 71: Table 7. Hunters and Days of Huntin
- Page 72 and 73: Table 8. Selected Characteristics o
- Page 74 and 75: Table 9. Selected Characteristics o
- Page 76 and 77: Table 10. Selected Characteristics
- Page 78 and 79: Table 12. Expenditures for Fishing:
- Page 80 and 81: Table 14. Trip and Equipment Expend
- Page 82 and 83: Table 16. Trip and Equipment Expend
- Page 84 and 85: Table 18. Trip and Equipment Expend
- Page 86 and 87: Table 20. Trip and Equipment Expend
- Page 88 and 89: Table 22. Special Equipment Expendi
- Page 90 and 91: Table 25. Freshwater Anglers and Da
- Page 92 and 93:
Table 29. Hunters and Days of Hunti
- Page 94 and 95:
Table 33. Hunters Preparing for Hun
- Page 96 and 97:
Table 37. Participation in Wildlife
- Page 98 and 99:
Table 40. Expenditures for Wildlife
- Page 100 and 101:
Table 41. Selected Characteristics
- Page 102 and 103:
Table 42. Selected Characteristics
- Page 104 and 105:
Table 46. Total Wildlife-Related Pa
- Page 106 and 107:
Appendix A.DefinitionsAnnual househ
- Page 108 and 109:
State governments (such as State pa
- Page 110 and 111:
Appendix B.2010 Participation of 6-
- Page 112 and 113:
Table B-4. Most Recent Year of Fish
- Page 114 and 115:
Table B-7. Selected Characteristics
- Page 116 and 117:
Table B-9. Participation by 6-to-15
- Page 118 and 119:
Appendix C.Significant Methodologic
- Page 120 and 121:
Table C-1. Major Characteristics of
- Page 122 and 123:
Table C-2. Anglers and Hunters by C
- Page 124 and 125:
household income in the 2001Survey.
- Page 126 and 127:
Table C-4. Comparison of Major Find
- Page 128 and 129:
Table C-5. Anglers and Hunters by C
- Page 130 and 131:
Appendix D.Sample Design and Statis
- Page 132 and 133:
lation 6 to 15 years of age were de
- Page 134 and 135:
compute in advance the standard err
- Page 136 and 137:
Illustration of the Computation of
- Page 138 and 139:
Table D-2. Approximate Standard Err
- Page 140 and 141:
Table D-4. Approximate Standard Err
- Page 143:
U.S. Department of the InteriorU.S.