Large MSA25%Medium MSA17%Percent <strong>of</strong> Hunters by Residence(Hunter population: 13.7 million)Percent <strong>of</strong> U.S. Population Who Hunted by Residence(Total U.S. population that hunted: 6 percent)Large MSA(1,000,000 or more)Medium MSA(250,000 to 999,999)Small MSA(50,000 to 249,999)Outside MSA3%5%11%Outside MSA20%Percent <strong>of</strong> U.S. Population Who Hunted by Household IncomeLess than $20,000$20,000 to $24,999$25,000 to $29,999$30,000 to $34,999$35,000 to $39,999$40,000 to $49,999$50,000 to $74,999$75,000 to $99,9993%4%5%5%5%7%8%9%Small MSA38%18%Metropolitan <strong>and</strong> NonmetropolitanHuntersAs was the case for fishing, participationrates for hunting were the lowestamong residents <strong>of</strong> the largest metropolitanstatistical areas (MSAs) 1 <strong>and</strong>were the highest among non-MSAresidents. Residents <strong>of</strong> the MSAs with apopulation <strong>of</strong> 1 million or more huntedat a 3 percent rate, which compares to18 percent <strong>of</strong> those who resided outsideMSAs. Furthermore the smaller theMSA the higher the participation rate.The rate among residents <strong>of</strong> MSAs <strong>of</strong>50,000 to 249,999 was 11 percent <strong>and</strong>among residents <strong>of</strong> MSAs with 250,000to 999,999 inhabitants the rate was5 percent.Despite the lower participation ratesamong MSA residents, they still madeup the majority <strong>of</strong> hunters. Over 10.9million hunters were MSA residents,compared to 2.8 million who werenon-metropolitan residents.Household Income <strong>of</strong> HuntersThe participation rate in huntingincreased as household incomeincreased until it reached incomes <strong>of</strong>$100,000 or more. The participationwas highest among those with incomes<strong>of</strong> $75,000 to $99,999 at 9 percent.Participation rates for those whoreported incomes <strong>of</strong> $50,000 to $74,999<strong>and</strong> $100,000 to $149,999 was slightlylower at 8 percent. The participationrate in hunting for household incomes<strong>of</strong> $40,000 to $49,999 was 7 percent.A participation rate <strong>of</strong> 5 percent wasreported for the following four incomegroups: $25,000 to $29,999; $30,000to $34,999; $35,000 to $39,999; <strong>and</strong>$150,000 or more. The lowest participationrate was 3 percent reportedfor household incomes <strong>of</strong> less than$20,000.$100,000 to $149,999$150,000 or more5%8%The majority <strong>of</strong> hunters had householdincomes <strong>of</strong> $50,000 or more.Among hunters who reported income,64 percent had household incomes<strong>of</strong> $50,000 or more, <strong>and</strong> 36 percenthad household incomes <strong>of</strong> less than1See Appendix A for definition <strong>of</strong> metropolitan statisticalarea.30 2011 <strong>National</strong> <strong>Survey</strong> <strong>of</strong> <strong>Fishing</strong>, <strong>Hunting</strong>, <strong>and</strong> <strong>Wildlife</strong>-Associated Recreation U.S. Fish <strong>and</strong> <strong>Wildlife</strong> Service <strong>and</strong> U.S. Census Bureau
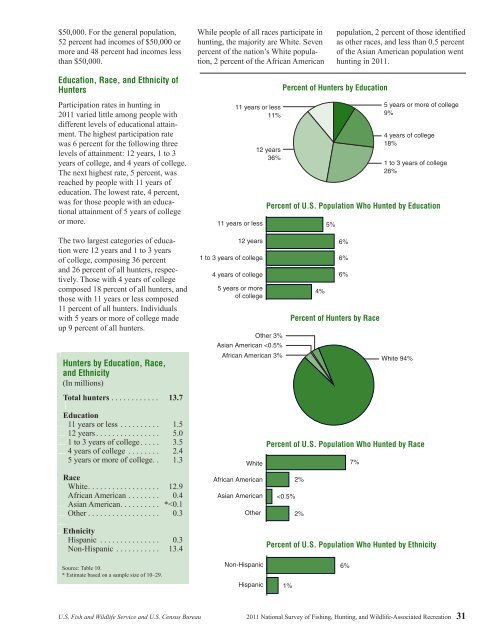
$50,000. For the general population,52 percent had incomes <strong>of</strong> $50,000 ormore <strong>and</strong> 48 percent had incomes lessthan $50,000.While people <strong>of</strong> all races participate inhunting, the majority are White. Sevenpercent <strong>of</strong> the nation’s White population,2 percent <strong>of</strong> the African Americanpopulation, 2 percent <strong>of</strong> those identifiedas other races, <strong>and</strong> less than 0.5 percent<strong>of</strong> the Asian American population wenthunting in 2011.Education, Race, <strong>and</strong> Ethnicity <strong>of</strong>HuntersParticipation rates in hunting in2011 varied little among people withdifferent levels <strong>of</strong> educational attainment.The highest participation ratewas 6 percent for the following threelevels <strong>of</strong> attainment: 12 years, 1 to 3years <strong>of</strong> college, <strong>and</strong> 4 years <strong>of</strong> college.The next highest rate, 5 percent, wasreached by people with 11 years <strong>of</strong>education. The lowest rate, 4 percent,was for those people with an educationalattainment <strong>of</strong> 5 years <strong>of</strong> collegeor more.11 years or less11%12 years36%Percent <strong>of</strong> Hunters by Education4 years <strong>of</strong> college18%Percent <strong>of</strong> U.S. Population Who Hunted by Education11 years or less 5%5 years or more <strong>of</strong> college9%1 to 3 years <strong>of</strong> college26%The two largest categories <strong>of</strong> educationwere 12 years <strong>and</strong> 1 to 3 years<strong>of</strong> college, composing 36 percent<strong>and</strong> 26 percent <strong>of</strong> all hunters, respectively.Those with 4 years <strong>of</strong> collegecomposed 18 percent <strong>of</strong> all hunters, <strong>and</strong>those with 11 years or less composed11 percent <strong>of</strong> all hunters. Individualswith 5 years or more <strong>of</strong> college madeup 9 percent <strong>of</strong> all hunters.Hunters by Education, Race,<strong>and</strong> Ethnicity(In millions)Total hunters ............ 13.712 years1 to 3 years <strong>of</strong> college4 years <strong>of</strong> college5 years or more<strong>of</strong> collegeOther 3%Asian American
- Page 1: U.S. Fish & Wildlife Service2011Nat
- Page 4 and 5: Economics and StatisticsAdministrat
- Page 6 and 7: List of TablesFishing and Hunting1.
- Page 8 and 9: ForewordWhen I was growing up, it w
- Page 11 and 12: Highlights
- Page 13 and 14: watching (observing, photographing,
- Page 15 and 16: Expenditures for Wildlife-Related R
- Page 17 and 18: Fishing
- Page 19 and 20: Fishing ExpendituresAnglers spent $
- Page 21 and 22: Freshwater Fishing ExpendituresAngl
- Page 23 and 24: pike, pickerel, and muskie, as well
- Page 25 and 26: Sex and Age of AnglersAlthough more
- Page 27 and 28: The majority of anglers had househo
- Page 29: 2001-2011 Fishing Participants, Day
- Page 32 and 33: Hunting HighlightsIn 2011, 13.7 mil
- Page 34 and 35: Big Game HuntingIn 2011, a majority
- Page 36 and 37: Days per hunterTrips per hunterTrip
- Page 38 and 39: Hunting on Public and PrivateLandsm
- Page 42 and 43: Hispanics, who represent a growingp
- Page 45 and 46: Wildlife WatchingU.S. Fish and Wild
- Page 47 and 48: Wildlife-Watching ExpendituresThirt
- Page 49 and 50: Wildlife Fed, Observed, orPhotograp
- Page 51 and 52: Metropolitan and NonmetropolitanAro
- Page 53 and 54: Education, Race, and Ethnicity ofAr
- Page 55 and 56: Away-From-Home Participantsby Type
- Page 57 and 58: Away-From-Home WildlifeWatchers by
- Page 59 and 60: Metropolitan and NonmetropolitanAwa
- Page 61 and 62: 2001-2011 Comparison of Wildlife-Wa
- Page 63: 2006-2011 Wildlife-Watching Partici
- Page 66 and 67: Guide to Statistical TablesPurpose
- Page 68 and 69: Table 3. Freshwater Anglers and Day
- Page 70 and 71: Table 7. Hunters and Days of Huntin
- Page 72 and 73: Table 8. Selected Characteristics o
- Page 74 and 75: Table 9. Selected Characteristics o
- Page 76 and 77: Table 10. Selected Characteristics
- Page 78 and 79: Table 12. Expenditures for Fishing:
- Page 80 and 81: Table 14. Trip and Equipment Expend
- Page 82 and 83: Table 16. Trip and Equipment Expend
- Page 84 and 85: Table 18. Trip and Equipment Expend
- Page 86 and 87: Table 20. Trip and Equipment Expend
- Page 88 and 89: Table 22. Special Equipment Expendi
- Page 90 and 91:
Table 25. Freshwater Anglers and Da
- Page 92 and 93:
Table 29. Hunters and Days of Hunti
- Page 94 and 95:
Table 33. Hunters Preparing for Hun
- Page 96 and 97:
Table 37. Participation in Wildlife
- Page 98 and 99:
Table 40. Expenditures for Wildlife
- Page 100 and 101:
Table 41. Selected Characteristics
- Page 102 and 103:
Table 42. Selected Characteristics
- Page 104 and 105:
Table 46. Total Wildlife-Related Pa
- Page 106 and 107:
Appendix A.DefinitionsAnnual househ
- Page 108 and 109:
State governments (such as State pa
- Page 110 and 111:
Appendix B.2010 Participation of 6-
- Page 112 and 113:
Table B-4. Most Recent Year of Fish
- Page 114 and 115:
Table B-7. Selected Characteristics
- Page 116 and 117:
Table B-9. Participation by 6-to-15
- Page 118 and 119:
Appendix C.Significant Methodologic
- Page 120 and 121:
Table C-1. Major Characteristics of
- Page 122 and 123:
Table C-2. Anglers and Hunters by C
- Page 124 and 125:
household income in the 2001Survey.
- Page 126 and 127:
Table C-4. Comparison of Major Find
- Page 128 and 129:
Table C-5. Anglers and Hunters by C
- Page 130 and 131:
Appendix D.Sample Design and Statis
- Page 132 and 133:
lation 6 to 15 years of age were de
- Page 134 and 135:
compute in advance the standard err
- Page 136 and 137:
Illustration of the Computation of
- Page 138 and 139:
Table D-2. Approximate Standard Err
- Page 140 and 141:
Table D-4. Approximate Standard Err
- Page 143:
U.S. Department of the InteriorU.S.