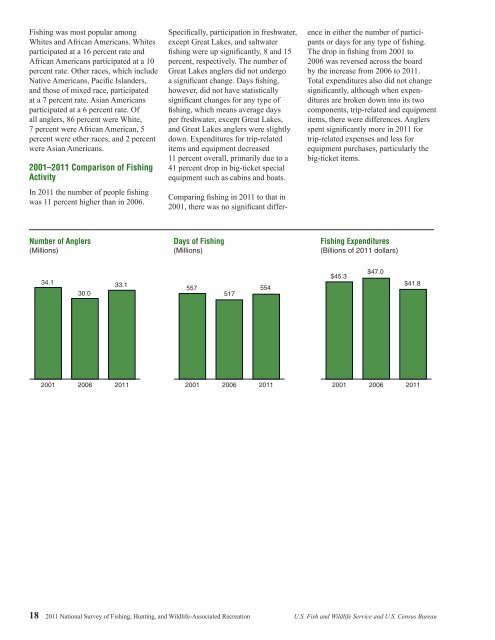
<strong>Fishing</strong> was most popular amongWhites <strong>and</strong> African Americans. Whitesparticipated at a 16 percent rate <strong>and</strong>African Americans participated at a 10percent rate. Other races, which includeNative Americans, Pacific Isl<strong>and</strong>ers,<strong>and</strong> those <strong>of</strong> mixed race, participatedat a 7 percent rate. Asian Americansparticipated at a 6 percent rate. Ofall anglers, 86 percent were White,7 percent were African American, 5percent were other races, <strong>and</strong> 2 percentwere Asian Americans.2001–2011 Comparison <strong>of</strong> <strong>Fishing</strong>ActivityIn 2011 the number <strong>of</strong> people fishingwas 11 percent higher than in 2006.Specifically, participation in freshwater,except Great Lakes, <strong>and</strong> saltwaterfishing were up significantly, 8 <strong>and</strong> 15percent, respectively. The number <strong>of</strong>Great Lakes anglers did not undergoa significant change. Days fishing,however, did not have statisticallysignificant changes for any type <strong>of</strong>fishing, which means average daysper freshwater, except Great Lakes,<strong>and</strong> Great Lakes anglers were slightlydown. Expenditures for trip-relateditems <strong>and</strong> equipment decreased11 percent overall, primarily due to a41 percent drop in big-ticket specialequipment such as cabins <strong>and</strong> boats.Comparing fishing in 2011 to that in2001, there was no significant differencein either the number <strong>of</strong> participantsor days for any type <strong>of</strong> fishing.The drop in fishing from 2001 to2006 was reversed across the boardby the increase from 2006 to 2011.Total expenditures also did not changesignificantly, although when expendituresare broken down into its twocomponents, trip-related <strong>and</strong> equipmentitems, there were differences. Anglersspent significantly more in 2011 fortrip-related expenses <strong>and</strong> less forequipment purchases, particularly thebig-ticket items.Number <strong>of</strong> Anglers(Millions)Days <strong>of</strong> <strong>Fishing</strong>(Millions)<strong>Fishing</strong> Expenditures(Billions <strong>of</strong> 2011 dollars)34.130.033.1557517554$45.3$47.0$41.820012006201120012006201120012006201118 2011 <strong>National</strong> <strong>Survey</strong> <strong>of</strong> <strong>Fishing</strong>, <strong>Hunting</strong>, <strong>and</strong> <strong>Wildlife</strong>-Associated Recreation U.S. Fish <strong>and</strong> <strong>Wildlife</strong> Service <strong>and</strong> U.S. Census Bureau
2001–2011 <strong>Fishing</strong> Participants, Days, <strong>and</strong> Expenditures(U.S. population 16 years old <strong>and</strong> older. Numbers in thous<strong>and</strong>s)Anglers, total ....................... 34,071<strong>All</strong> freshwater ..................... 28,439Freshwater, except Great Lakes ..... 27,913Great Lakes ..................... 1,847Saltwater ......................... 9,0512001 2011 2001–2011Number Percent Number Percent percent change100838252733,11227,54727,0601,6658,8891008382527NS–3NS–3NS–3NS–10NS–2Days, total .......................... 557,394<strong>All</strong> freshwater ..................... 466,984Freshwater, except Great Lakes ..... 443,247Great Lakes ..................... 23,138Saltwater ......................... 90,8381008480416553,841455,862443,22319,66199,4741008280418NS–1NS–20NS–15NS10<strong>Fishing</strong>, total (2011 dollars). ........... $45,257,393Trip-related ....................... 18,614,941Equipment, total ................... 21,545,781<strong>Fishing</strong> equipment ............... 5,864,914Auxiliary equipment. ............. 915,822Special equipment. ................. 14,765,019Other ............................ 5,096,66910041481323311$41,788,93621,789,46515,506,4336,141,8951,106,8658,257,6734,493,03710052371532011NS–817–28NS5NS21–44NS–12NSNot different from zero at the 5 percent level <strong>of</strong> significance.2006–2011 <strong>Fishing</strong> Participants, Days, <strong>and</strong> Expenditures(U.S. population 16 years old <strong>and</strong> older. Numbers in thous<strong>and</strong>s)Anglers, total ....................... 29,952<strong>All</strong> freshwater ..................... 25,431Freshwater, except Great Lakes ..... 25,035Great Lakes ..................... 1,420Saltwater ......................... 7,7172006 2011 2006–2011Number Percent Number Percent percent change100858452633,11227,54727,0601,6658,88910083825271188NS1715Days, total .......................... 516,781<strong>All</strong> freshwater ..................... 433,337Freshwater, except Great Lakes ..... 419,942Great Lakes ..................... 18,016Saltwater ......................... 85,6631008481317553,841455,862443,22319,66199,4741008280418NS7NS5NS6NS9NS16<strong>Fishing</strong>, total (2011 dollars). ........... $47,036,454Trip-related ....................... 19,948,340Equipment, total ................... 20,928,889<strong>Fishing</strong> equipment ............... 5,949,727Auxiliary equipment. ............. 868,894Special equipment ............... 14,110,268Other ............................ 6,159,22510029472361824$41,788,93621,789,46515,506,4336,141,8951,106,8658,257,6734,493,03710052371532011NS–11NS9–26NS3NS27–41–27NSNot different from zero at the 5 percent level <strong>of</strong> significance.U.S. Fish <strong>and</strong> <strong>Wildlife</strong> Service <strong>and</strong> U.S. Census Bureau 2011 <strong>National</strong> <strong>Survey</strong> <strong>of</strong> <strong>Fishing</strong>, <strong>Hunting</strong>, <strong>and</strong> <strong>Wildlife</strong>-Associated Recreation 19
- Page 1: U.S. Fish & Wildlife Service2011Nat
- Page 4 and 5: Economics and StatisticsAdministrat
- Page 6 and 7: List of TablesFishing and Hunting1.
- Page 8 and 9: ForewordWhen I was growing up, it w
- Page 11 and 12: Highlights
- Page 13 and 14: watching (observing, photographing,
- Page 15 and 16: Expenditures for Wildlife-Related R
- Page 17 and 18: Fishing
- Page 19 and 20: Fishing ExpendituresAnglers spent $
- Page 21 and 22: Freshwater Fishing ExpendituresAngl
- Page 23 and 24: pike, pickerel, and muskie, as well
- Page 25 and 26: Sex and Age of AnglersAlthough more
- Page 27: The majority of anglers had househo
- Page 32 and 33: Hunting HighlightsIn 2011, 13.7 mil
- Page 34 and 35: Big Game HuntingIn 2011, a majority
- Page 36 and 37: Days per hunterTrips per hunterTrip
- Page 38 and 39: Hunting on Public and PrivateLandsm
- Page 40 and 41: Large MSA25%Medium MSA17%Percent of
- Page 42 and 43: Hispanics, who represent a growingp
- Page 45 and 46: Wildlife WatchingU.S. Fish and Wild
- Page 47 and 48: Wildlife-Watching ExpendituresThirt
- Page 49 and 50: Wildlife Fed, Observed, orPhotograp
- Page 51 and 52: Metropolitan and NonmetropolitanAro
- Page 53 and 54: Education, Race, and Ethnicity ofAr
- Page 55 and 56: Away-From-Home Participantsby Type
- Page 57 and 58: Away-From-Home WildlifeWatchers by
- Page 59 and 60: Metropolitan and NonmetropolitanAwa
- Page 61 and 62: 2001-2011 Comparison of Wildlife-Wa
- Page 63: 2006-2011 Wildlife-Watching Partici
- Page 66 and 67: Guide to Statistical TablesPurpose
- Page 68 and 69: Table 3. Freshwater Anglers and Day
- Page 70 and 71: Table 7. Hunters and Days of Huntin
- Page 72 and 73: Table 8. Selected Characteristics o
- Page 74 and 75: Table 9. Selected Characteristics o
- Page 76 and 77: Table 10. Selected Characteristics
- Page 78 and 79:
Table 12. Expenditures for Fishing:
- Page 80 and 81:
Table 14. Trip and Equipment Expend
- Page 82 and 83:
Table 16. Trip and Equipment Expend
- Page 84 and 85:
Table 18. Trip and Equipment Expend
- Page 86 and 87:
Table 20. Trip and Equipment Expend
- Page 88 and 89:
Table 22. Special Equipment Expendi
- Page 90 and 91:
Table 25. Freshwater Anglers and Da
- Page 92 and 93:
Table 29. Hunters and Days of Hunti
- Page 94 and 95:
Table 33. Hunters Preparing for Hun
- Page 96 and 97:
Table 37. Participation in Wildlife
- Page 98 and 99:
Table 40. Expenditures for Wildlife
- Page 100 and 101:
Table 41. Selected Characteristics
- Page 102 and 103:
Table 42. Selected Characteristics
- Page 104 and 105:
Table 46. Total Wildlife-Related Pa
- Page 106 and 107:
Appendix A.DefinitionsAnnual househ
- Page 108 and 109:
State governments (such as State pa
- Page 110 and 111:
Appendix B.2010 Participation of 6-
- Page 112 and 113:
Table B-4. Most Recent Year of Fish
- Page 114 and 115:
Table B-7. Selected Characteristics
- Page 116 and 117:
Table B-9. Participation by 6-to-15
- Page 118 and 119:
Appendix C.Significant Methodologic
- Page 120 and 121:
Table C-1. Major Characteristics of
- Page 122 and 123:
Table C-2. Anglers and Hunters by C
- Page 124 and 125:
household income in the 2001Survey.
- Page 126 and 127:
Table C-4. Comparison of Major Find
- Page 128 and 129:
Table C-5. Anglers and Hunters by C
- Page 130 and 131:
Appendix D.Sample Design and Statis
- Page 132 and 133:
lation 6 to 15 years of age were de
- Page 134 and 135:
compute in advance the standard err
- Page 136 and 137:
Illustration of the Computation of
- Page 138 and 139:
Table D-2. Approximate Standard Err
- Page 140 and 141:
Table D-4. Approximate Standard Err
- Page 143:
U.S. Department of the InteriorU.S.