

National Survey of Fishing, Hunting, and Wildlife ... - All About Birds
National Survey of Fishing, Hunting, and Wildlife ... - All About Birds
National Survey of Fishing, Hunting, and Wildlife ... - All About Birds

You also want an ePaper? Increase the reach of your titles
YUMPU automatically turns print PDFs into web optimized ePapers that Google loves.
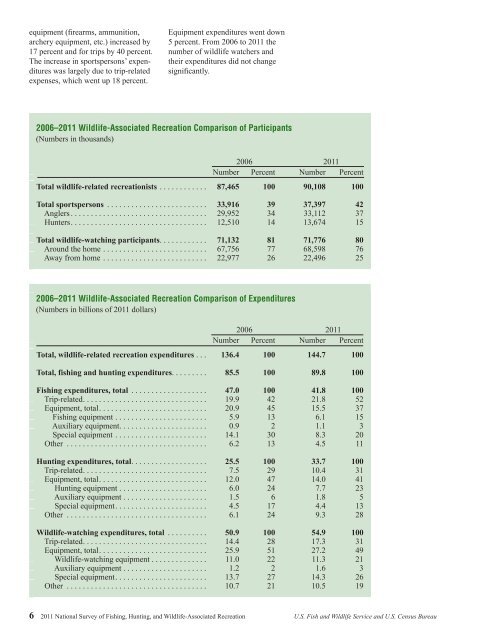
equipment (firearms, ammunition,archery equipment, etc.) increased by17 percent <strong>and</strong> for trips by 40 percent.The increase in sportspersons’ expenditureswas largely due to trip-relatedexpenses, which went up 18 percent.Equipment expenditures went down5 percent. From 2006 to 2011 thenumber <strong>of</strong> wildlife watchers <strong>and</strong>their expenditures did not changesignificantly.2006–2011 <strong>Wildlife</strong>-Associated Recreation Comparison <strong>of</strong> Participants(Numbers in thous<strong>and</strong>s)2006 2011Number Percent Number PercentTotal wildlife-related recreationists ............ 87,465 100 90,108 100Total sportspersons ......................... 33,916 39 37,397 42Anglers .................................. 29,952 34 33,112 37Hunters. ................................. 12,510 14 13,674 15Total wildlife-watching participants. ........... 71,132 81 71,776 80Around the home .......................... 67,756 77 68,598 76Away from home .......................... 22,977 26 22,496 252006–2011 <strong>Wildlife</strong>-Associated Recreation Comparison <strong>of</strong> Expenditures(Numbers in billions <strong>of</strong> 2011 dollars)2006 2011Number Percent Number PercentTotal, wildlife-related recreation expenditures ... 136.4 100 144.7 100Total, fishing <strong>and</strong> hunting expenditures. ........ 85.5 100 89.8 100<strong>Fishing</strong> expenditures, total ................... 47.0 100 41.8 100Trip-related. .............................. 19.9 42 21.8 52Equipment, total. .......................... 20.9 45 15.5 37<strong>Fishing</strong> equipment ....................... 5.9 13 6.1 15Auxiliary equipment. ..................... 0.9 2 1.1 3Special equipment ....................... 14.1 30 8.3 20Other ................................... 6.2 13 4.5 11<strong>Hunting</strong> expenditures, total. .................. 25.5 100 33.7 100Trip-related. .............................. 7.5 29 10.4 31Equipment, total. .......................... 12.0 47 14.0 41<strong>Hunting</strong> equipment ...................... 6.0 24 7.7 23Auxiliary equipment ..................... 1.5 6 1.8 5Special equipment. ...................... 4.5 17 4.4 13Other ................................... 6.1 24 9.3 28<strong>Wildlife</strong>-watching expenditures, total .......... 50.9 100 54.9 100Trip-related. .............................. 14.4 28 17.3 31Equipment, total. .......................... 25.9 51 27.2 49<strong>Wildlife</strong>-watching equipment .............. 11.0 22 11.3 21Auxiliary equipment ..................... 1.2 2 1.6 3Special equipment. ...................... 13.7 27 14.3 26Other ................................... 10.7 21 10.5 196 2011 <strong>National</strong> <strong>Survey</strong> <strong>of</strong> <strong>Fishing</strong>, <strong>Hunting</strong>, <strong>and</strong> <strong>Wildlife</strong>-Associated Recreation U.S. Fish <strong>and</strong> <strong>Wildlife</strong> Service <strong>and</strong> U.S. Census Bureau


