Table 41. Selected Characteristics <strong>of</strong> Participants <strong>of</strong> <strong>Wildlife</strong>-Watching Activities AwayFrom Home: 2011—Continued(Population 16 years old <strong>and</strong> older. Numbers in thous<strong>and</strong>s)Away-from-home participantsCharacteristicObserve Photograph FeedPercent whoPercent whoPercent whoNumber participated Percent Number participated Percent Number participated PercentTotal persons .............................. 19,808 8 100 12,354 5 100 5,399 2 100Population Density <strong>of</strong> ResidenceUrban ................................... 14,100 8 71 9,302 5 75 3,675 2 68Rural ................................... 5,708 10 29 3,052 5 25 1,724 3 32Population Size <strong>of</strong> ResidenceMetropolitan Statistical Area (MSA) .......... 18,335 8 93 11,551 5 93 5,043 2 931,000,000 or more ....................... 9,523 7 48 6,284 5 51 2,775 2 51250,000 to 999,999 ...................... 4,059 8 20 2,646 5 21 782 2 1450,000 to 249,999 ....................... 4,753 10 24 2,621 5 21 1,487 3 28Outside MSA ............................. 1,473 10 7 803 5 7 356 2 7Census Geographic DivisionNew Engl<strong>and</strong> ............................. 1,126 10 6 761 7 6 178 2 3Middle Atlantic ........................... 2,200 7 11 1,182 4 10 *379 *1 *7East North Central ......................... 2,644 7 13 1,499 4 12 829 2 15West North Central ........................ 1,589 10 8 999 6 8 411 3 8South Atlantic ............................ 3,962 9 20 2,577 6 21 1,318 3 24East South Central ......................... 1,234 9 6 751 5 6 395 3 7West South Central ........................ 1,615 6 8 874 3 7 888 3 16Mountain ................................ 2,021 12 10 1,415 8 11 384 2 7Pacific .................................. 3,417 9 17 2,295 6 19 616 2 11Age16 to 17 years ............................ *300 *4 *2 *228 *3 *2 ... ... ...18 to 24 years ............................ 522 2 3 388 1 3 *257 *1 *525 to 34 years ............................ 2,825 7 14 1,704 4 14 960 2 1835 to 44 years ............................ 3,586 9 18 2,045 5 17 900 2 1745 to 54 years ............................ 5,041 11 25 3,641 8 29 1,501 3 2855 to 64 years ............................ 4,363 11 22 2,525 7 20 949 2 1865 years <strong>and</strong> older ......................... 3,170 8 16 1,822 5 15 693 2 1365 to 74 years .......................... 2,485 11 13 1,482 7 12 634 3 1275 <strong>and</strong> older ............................ 685 4 3 340 2 3 *60 *(Z) *1SexMale, total ............................... 9,716 8 49 5,920 5 48 2,602 2 4816 to 17 years .......................... *126 *3 *1 ... ... ... ... ... ...18 to 24 years .......................... 266 2 1 *228 *2 *2 ... ... ...25 to 34 years .......................... 1,319 6 7 565 3 5 *493 *2 *935 to 44 years .......................... 2,008 10 10 998 5 8 435 2 845 to 54 years .......................... 2,337 10 12 1,828 8 15 650 3 1255 to 64 years .......................... 2,121 12 11 1,246 7 10 483 3 965 years <strong>and</strong> older ....................... 1,539 9 8 950 6 8 342 2 665 to 74 years ........................ 1,245 11 6 754 7 6 304 3 675 <strong>and</strong> older .......................... 294 5 1 *196 *3 *2 ... ... ...Female, total ............................. 10,092 8 51 6,433 5 52 2,796 2 5216 to 17 years .......................... *175 *5 *1 ... ... ... ... ... ...18 to 24 years .......................... 256 2 1 *159 *1 *1 *98 *1 *225 to 34 years .......................... 1,506 7 8 1,139 5 9 467 2 935 to 44 years .......................... 1,579 8 8 1,046 5 8 465 2 945 to 54 years .......................... 2,704 11 14 1,814 8 15 851 4 1655 to 64 years .......................... 2,242 11 11 1,279 6 10 466 2 965 years <strong>and</strong> older ....................... 1,631 8 8 872 4 7 351 2 765 to 74 years ........................ 1,240 10 6 728 6 6 330 3 675 <strong>and</strong> older .......................... 391 4 2 *144 *2 *1 ... ... ...EthnicityHispanic ................................ 1,207 4 6 932 3 8 *198 *1 *4Non-Hispanic ............................ 18,602 9 94 11,422 6 92 5,201 3 96RaceWhite ................................... 18,318 10 92 11,351 6 92 4,715 3 87African American ......................... 449 2 2 289 1 2 *318 *1 *6Asian American ........................... 193 2 1 *134 *1 *1 ... ... ...<strong>All</strong> others ................................ 848 4 4 580 3 5 301 1 6Annual Household IncomeLess than $20,000 ......................... 1,367 4 7 734 2 6 589 2 11$20,000 to $24,999 ........................ 700 6 4 437 3 4 *194 *2 *4$25,000 to $29,999 ........................ 630 6 3 508 5 4 *126 *1 *2$30,000 to $34,999 ........................ 628 5 3 450 4 4 184 2 3$35,000 to $39,999 ........................ 852 7 4 474 4 4 *282 *2 *5$40,000 to $49,999 ........................ 1,496 9 8 856 5 7 445 3 8$50,000 to $74,999 ........................ 3,994 12 20 2,410 7 20 1,146 3 21$75,000 to $99,999 ........................ 3,408 14 17 2,124 8 17 1,130 4 21$100,000 to $149,999 ...................... 2,544 11 13 1,644 7 13 395 2 7$150,000 or more ......................... 1,974 12 10 1,331 8 11 392 2 7Not reported ............................. 2,214 5 11 1,386 3 11 516 1 10Education11 years or less ........................... 1,065 3 5 581 2 5 564 2 1012 years ................................. 4,149 5 21 2,514 3 20 1,518 2 281 to 3 years <strong>of</strong> college ...................... 4,712 9 24 2,753 5 22 1,375 2 254 years <strong>of</strong> college ......................... 4,950 12 25 3,369 8 27 1,260 3 235 years or more <strong>of</strong> college ................... 4,933 18 25 3,136 11 25 681 2 13* Estimate based on a sample size <strong>of</strong> 10–29. … Sample size too small (less than 10) to report data reliably. (Z) Less than 0.5 percent.Note: Detail does not add to total because <strong>of</strong> multiple responses. Percent who participated columns show the percent <strong>of</strong> each row’s population who participated in the activitynamed by the column. Percent columns show the percent <strong>of</strong> each column’s participants who are described by the row heading.90 2011 <strong>National</strong> <strong>Survey</strong> <strong>of</strong> <strong>Fishing</strong>, <strong>Hunting</strong>, <strong>and</strong> <strong>Wildlife</strong>-Associated Recreation U.S. Fish <strong>and</strong> <strong>Wildlife</strong> Service <strong>and</strong> U.S. Census Bureau
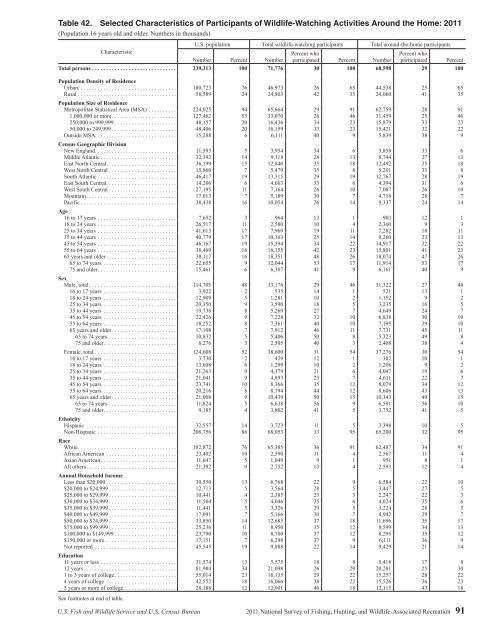
Table 42. Selected Characteristics <strong>of</strong> Participants <strong>of</strong> <strong>Wildlife</strong>-Watching Activities Around the Home: 2011(Population 16 years old <strong>and</strong> older. Numbers in thous<strong>and</strong>s)U.S. population Total wildlife-watching participants Total around-the-home participantsCharacteristicPercent whoPercent whoNumber Percent Number participated Percent Number participated PercentTotal persons .............................. 239,313 100 71,776 30 100 68,598 29 100Population Density <strong>of</strong> ResidenceUrban ................................... 180,723 76 46,973 26 65 44,538 25 65Rural ................................... 58,589 24 24,803 42 35 24,060 41 35Population Size <strong>of</strong> ResidenceMetropolitan Statistical Area (MSA) .......... 224,025 94 65,664 29 91 62,759 28 911,000,000 or more ....................... 127,462 53 33,070 26 46 31,459 25 46250,000 to 999,999 ...................... 48,157 20 16,436 34 23 15,879 33 2350,000 to 249,999 ....................... 48,406 20 16,159 33 23 15,421 32 22Outside MSA ............................. 15,288 6 6,111 40 9 5,839 38 9Census Geographic DivisionNew Engl<strong>and</strong> ............................. 11,593 5 3,954 34 6 3,858 33 6Middle Atlantic ........................... 32,392 14 9,118 28 13 8,744 27 13East North Central ......................... 36,199 15 12,840 35 18 12,492 35 18West North Central ........................ 15,860 7 5,479 35 8 5,201 33 8South Atlantic ............................ 46,417 19 13,315 29 19 12,767 28 19East South Central ......................... 14,206 6 4,663 33 6 4,394 31 6West South Central ........................ 27,195 11 7,164 26 10 7,087 26 10Mountain ................................ 17,013 7 5,189 30 7 4,716 28 7Pacific .................................. 38,438 16 10,054 26 14 9,337 24 14Age16 to 17 years ............................ 7,652 3 964 13 1 903 12 118 to 24 years ............................ 26,517 11 2,580 10 4 2,360 9 325 to 34 years ............................ 41,613 17 7,969 19 11 7,282 18 1135 to 44 years ............................ 40,779 17 10,163 25 14 9,260 23 1345 to 54 years ............................ 46,167 19 15,594 34 22 14,917 32 2255 to 64 years ............................ 38,469 16 16,155 42 23 15,801 41 2365 years <strong>and</strong> older ......................... 38,117 16 18,351 48 26 18,074 47 2665 to 74 years .......................... 22,655 9 12,044 53 17 11,914 53 1775 <strong>and</strong> older ............................ 15,461 6 6,307 41 9 6,161 40 9SexMale, total ............................... 114,705 48 33,176 29 46 31,322 27 4616 to 17 years .......................... 3,922 2 535 14 1 521 13 118 to 24 years .......................... 12,909 5 1,281 10 2 1,152 9 225 to 34 years .......................... 20,350 9 3,590 18 5 3,235 16 535 to 44 years .......................... 19,738 8 5,269 27 7 4,649 24 745 to 54 years .......................... 22,426 9 7,228 32 10 6,838 30 1055 to 64 years .......................... 18,252 8 7,361 40 10 7,195 39 1065 years <strong>and</strong> older ....................... 17,108 7 7,912 46 11 7,731 45 1165 to 74 years ........................ 10,832 5 5,406 50 8 5,323 49 875 <strong>and</strong> older .......................... 6,276 3 2,505 40 3 2,408 38 4Female, total ............................. 124,608 52 38,600 31 54 37,276 30 5416 to 17 years .......................... 3,730 2 429 12 1 382 10 118 to 24 years .......................... 13,608 6 1,299 10 2 1,208 9 225 to 34 years .......................... 21,263 9 4,379 21 6 4,047 19 635 to 44 years .......................... 21,041 9 4,893 23 7 4,611 22 745 to 54 years .......................... 23,741 10 8,366 35 12 8,079 34 1255 to 64 years .......................... 20,216 8 8,794 44 12 8,606 43 1365 years <strong>and</strong> older ....................... 21,008 9 10,439 50 15 10,343 49 1565 to 74 years ........................ 11,824 5 6,638 56 9 6,591 56 1075 <strong>and</strong> older .......................... 9,185 4 3,802 41 5 3,752 41 5EthnicityHispanic ................................ 32,557 14 3,723 11 5 3,398 10 5Non-Hispanic ............................ 206,756 86 68,053 33 95 65,200 32 95RaceWhite ................................... 182,872 76 65,385 36 91 62,487 34 91African American ......................... 23,402 10 2,590 11 4 2,567 11 4Asian American ........................... 11,647 5 1,049 9 1 951 8 1<strong>All</strong> others ................................ 21,392 9 2,752 13 4 2,593 12 4Annual Household IncomeLess than $20,000 ......................... 30,550 13 6,768 22 9 6,584 22 10$20,000 to $24,999 ........................ 12,713 5 3,564 28 5 3,447 27 5$25,000 to $29,999 ........................ 10,441 4 2,385 23 3 2,247 22 3$30,000 to $34,999 ........................ 11,504 5 4,046 35 6 4,024 35 6$35,000 to $39,999 ........................ 11,441 5 3,326 29 5 3,224 28 5$40,000 to $49,999 ........................ 17,091 7 5,166 30 7 4,942 29 7$50,000 to $74,999 ........................ 33,850 14 12,685 37 18 11,696 35 17$75,000 to $99,999 ........................ 25,236 11 8,950 35 12 8,599 34 13$100,000 to $149,999 ...................... 23,790 10 8,700 37 12 8,295 35 12$150,000 or more ......................... 17,151 7 6,298 37 9 6,111 36 9Not reported ............................. 45,545 19 9,888 22 14 9,429 21 14Education11 years or less ........................... 31,574 13 5,575 18 8 5,418 17 812 years ................................. 81,984 34 21,098 26 29 20,281 25 301 to 3 years <strong>of</strong> college ...................... 55,014 23 16,135 29 22 15,257 28 224 years <strong>of</strong> college ......................... 42,552 18 16,066 38 22 15,526 36 235 years or more <strong>of</strong> college ................... 28,188 12 12,901 46 18 12,115 43 18See footnotes at end <strong>of</strong> table.U.S. Fish <strong>and</strong> <strong>Wildlife</strong> Service <strong>and</strong> U.S. Census Bureau 2011 <strong>National</strong> <strong>Survey</strong> <strong>of</strong> <strong>Fishing</strong>, <strong>Hunting</strong>, <strong>and</strong> <strong>Wildlife</strong>-Associated Recreation 91
- Page 1:
U.S. Fish & Wildlife Service2011Nat
- Page 4 and 5:
Economics and StatisticsAdministrat
- Page 6 and 7:
List of TablesFishing and Hunting1.
- Page 8 and 9:
ForewordWhen I was growing up, it w
- Page 11 and 12:
Highlights
- Page 13 and 14:
watching (observing, photographing,
- Page 15 and 16:
Expenditures for Wildlife-Related R
- Page 17 and 18:
Fishing
- Page 19 and 20:
Fishing ExpendituresAnglers spent $
- Page 21 and 22:
Freshwater Fishing ExpendituresAngl
- Page 23 and 24:
pike, pickerel, and muskie, as well
- Page 25 and 26:
Sex and Age of AnglersAlthough more
- Page 27 and 28:
The majority of anglers had househo
- Page 29:
2001-2011 Fishing Participants, Day
- Page 32 and 33:
Hunting HighlightsIn 2011, 13.7 mil
- Page 34 and 35:
Big Game HuntingIn 2011, a majority
- Page 36 and 37:
Days per hunterTrips per hunterTrip
- Page 38 and 39:
Hunting on Public and PrivateLandsm
- Page 40 and 41:
Large MSA25%Medium MSA17%Percent of
- Page 42 and 43:
Hispanics, who represent a growingp
- Page 45 and 46:
Wildlife WatchingU.S. Fish and Wild
- Page 47 and 48:
Wildlife-Watching ExpendituresThirt
- Page 49 and 50: Wildlife Fed, Observed, orPhotograp
- Page 51 and 52: Metropolitan and NonmetropolitanAro
- Page 53 and 54: Education, Race, and Ethnicity ofAr
- Page 55 and 56: Away-From-Home Participantsby Type
- Page 57 and 58: Away-From-Home WildlifeWatchers by
- Page 59 and 60: Metropolitan and NonmetropolitanAwa
- Page 61 and 62: 2001-2011 Comparison of Wildlife-Wa
- Page 63: 2006-2011 Wildlife-Watching Partici
- Page 66 and 67: Guide to Statistical TablesPurpose
- Page 68 and 69: Table 3. Freshwater Anglers and Day
- Page 70 and 71: Table 7. Hunters and Days of Huntin
- Page 72 and 73: Table 8. Selected Characteristics o
- Page 74 and 75: Table 9. Selected Characteristics o
- Page 76 and 77: Table 10. Selected Characteristics
- Page 78 and 79: Table 12. Expenditures for Fishing:
- Page 80 and 81: Table 14. Trip and Equipment Expend
- Page 82 and 83: Table 16. Trip and Equipment Expend
- Page 84 and 85: Table 18. Trip and Equipment Expend
- Page 86 and 87: Table 20. Trip and Equipment Expend
- Page 88 and 89: Table 22. Special Equipment Expendi
- Page 90 and 91: Table 25. Freshwater Anglers and Da
- Page 92 and 93: Table 29. Hunters and Days of Hunti
- Page 94 and 95: Table 33. Hunters Preparing for Hun
- Page 96 and 97: Table 37. Participation in Wildlife
- Page 98 and 99: Table 40. Expenditures for Wildlife
- Page 102 and 103: Table 42. Selected Characteristics
- Page 104 and 105: Table 46. Total Wildlife-Related Pa
- Page 106 and 107: Appendix A.DefinitionsAnnual househ
- Page 108 and 109: State governments (such as State pa
- Page 110 and 111: Appendix B.2010 Participation of 6-
- Page 112 and 113: Table B-4. Most Recent Year of Fish
- Page 114 and 115: Table B-7. Selected Characteristics
- Page 116 and 117: Table B-9. Participation by 6-to-15
- Page 118 and 119: Appendix C.Significant Methodologic
- Page 120 and 121: Table C-1. Major Characteristics of
- Page 122 and 123: Table C-2. Anglers and Hunters by C
- Page 124 and 125: household income in the 2001Survey.
- Page 126 and 127: Table C-4. Comparison of Major Find
- Page 128 and 129: Table C-5. Anglers and Hunters by C
- Page 130 and 131: Appendix D.Sample Design and Statis
- Page 132 and 133: lation 6 to 15 years of age were de
- Page 134 and 135: compute in advance the standard err
- Page 136 and 137: Illustration of the Computation of
- Page 138 and 139: Table D-2. Approximate Standard Err
- Page 140 and 141: Table D-4. Approximate Standard Err
- Page 143: U.S. Department of the InteriorU.S.