Making Schools Work - World Bank Internet Error Page AutoRedirect
Making Schools Work - World Bank Internet Error Page AutoRedirect
Making Schools Work - World Bank Internet Error Page AutoRedirect

You also want an ePaper? Increase the reach of your titles
YUMPU automatically turns print PDFs into web optimized ePapers that Google loves.
HUMAN DEVELOPMENTPERSPECTIVES<strong>Making</strong><strong>Schools</strong> <strong>Work</strong>New Evidence on Accountability ReformsBarbara Bruns, Deon Filmer, and Harry Anthony Patrinos
<strong>Making</strong> <strong>Schools</strong> <strong>Work</strong>
<strong>Making</strong> <strong>Schools</strong><strong>Work</strong>New Evidence onAccountability ReformsBarbara Bruns, Deon Filmer, andHarry Anthony Patrinos
© 2011 The International <strong>Bank</strong> for Reconstruction and Development / The <strong>World</strong> <strong>Bank</strong>1818 H Street NWWashington DC 20433Telephone: 202-473-1000<strong>Internet</strong>: www.worldbank.orgAll rights reserved1 2 3 4 :: 14 13 12 11This volume is a product of the staff of the International <strong>Bank</strong> for Reconstruction andDevelopment / The <strong>World</strong> <strong>Bank</strong>. The findings, interpretations, and conclusions expressed inthis volume do not necessarily reflect the views of the Executive Directors of The <strong>World</strong> <strong>Bank</strong>or the governments they represent.The <strong>World</strong> <strong>Bank</strong> does not guarantee the accuracy of the data included in this work. Theboundaries, colors, denominations, and other information shown on any map in this work donot imply any judgement on the part of The <strong>World</strong> <strong>Bank</strong> concerning the legal status of anyterritory or the endorsement or acceptance of such boundaries.Rights and PermissionsThe material in this publication is copyrighted. Copying and/or transmitting portions or all ofthis work without permission may be a violation of applicable law. The International <strong>Bank</strong> forReconstruction and Development / The <strong>World</strong> <strong>Bank</strong> encourages dissemination of its work andwill normally grant permission to reproduce portions of the work promptly.For permission to photocopy or reprint any part of this work, please send a request with completeinformation to the Copyright Clearance Center Inc., 222 Rosewood Drive, Danvers, MA01923, USA; telephone: 978-750-8400; fax: 978-750-4470; <strong>Internet</strong>: www.copyright.com.All other queries on rights and licenses, including subsidiary rights, should be addressed to theOffice of the Publisher, The <strong>World</strong> <strong>Bank</strong>, 1818 H Street NW, Washington, DC 20433, USA; fax:202-522-2422; e-mail: pubrights@worldbank.org.ISBN: 978-0-8213-8679-8eISBN: 978-0-8213-8680-4DOI: 10.1596/978-0-8213-8679-8Library of Congress Cataloging-in-Publication DataBruns, Barbara.<strong>Making</strong> schools work : new evidence on accountability reforms / Barbara Bruns, DeonFilmer, Harry Anthony Patrinos.p. cm. — (Human development perspectives)Includes bibliographical references.ISBN 978-0-8213-8679-8 (alk. paper) — ISBN 978-0-8213-8680-41. Educational tests and measurements—United States. 2. Educational accountability—United States. 3. Public schools—United States—Examinations. 4. School improvement programs.5. Educational leadership. I. Filmer, Deon. II. Patrinos, Harry Anthony. III. Title.LB3051.B78 2011371.2'07—dc222010053396Cover photos: Barbara Bruns/<strong>World</strong> <strong>Bank</strong> (sleeping teacher); Erica Amorim/<strong>World</strong> <strong>Bank</strong>(Brazilian teacher with students)Cover design: Naylor Design
ContentsForeword ixAcknowledgments xiAbout the Authors xiiiAbbreviations xvChapter 1: Motivation and Framework 1Service Delivery Failure in the Developing <strong>World</strong> 3Three Core Strategies for More AccountableEducation Systems 12Accountability and Evidence 20Notes 25References 25Chapter 2: Information for Accountability 29How Information Can Increase Accountability—andOutcomes 33Information for Accountability in High-IncomeCountries 38Information for Accountability in Middle- andLow-Income Countries 41Evaluating the Impact of Information-for-Accountability Interventions 49What Have We Learned? 62v
Contents | viiBoxes2.1 Using Aggregated Data for Accountability 312.2 Using Information for Management 372.3 Citizen Report Cards 432.4 Cost-Effectiveness of Information Interventions 643.1 Eight Years to See Results 1013.2 Ongoing SBM Experiments in Africa 1214.1 Targets that Avoid Perverse Incentives: Brazil’sIndex of Basic Education Development 1685.1 New Evidence on Information for Accountability 2135.2 New Evidence on School-Based Management 2195.3 New Evidence on Contract Teachers 2245.4 New Evidence on Pay for Performance 228Figures1.1 Comparative PISA Math Proficiency, 2009 41.2 Correlation of Education Spending to StudentPerformance 61.3 Shares of Public Education Spending Benefitingthe Richest and Poorest Population Quintiles,Selected Countries 81.4 Teacher Classroom Presence and Time Spent Teaching,Selected Countries 101.5 The Accountability Framework 111.6 Teacher Performance Incentives 182.1 The Role of Information in the AccountabilityFramework 332.2 Report Cards Given to Parents in Pakistan 672.3 Report Card in Paraná State, Brazil, 1999–2000 683.1 The Accountability Framework in School-BasedManagement 913.2 The Autonomy-Participation Nexus, SelectedSBM Programs 943.3 From School-Based Management to MeasurableResults 984.1 Teacher Performance Incentives 1444.2 Comparison of Bonus-Pay Programs by ImpactSize and Predicted Incentive Strength 1944A.1 Bonus Predictability Ratings 2024A.2 Bonus Size Ratings 2035.1 SBM Results: A Meta-Analysis of U.S. Models 2185.2 Complementarities in Accountability Reform 239
viii | ContentsTables1.1 Percentage of School Grants Reaching <strong>Schools</strong>in Selected Countries 92.1 Impact Evaluation Studies of Information-for-Accountability Interventions 633.1 School-Based Management Reforms in SelectedCountries 953.2 Intermediate Outcomes from SBM Reforms 973.3 Inside the Black Box: How to Measure theImpact of SBM Programs 1003.4 Evaluations and Impacts: SBM Evidence from RecentRigorous Studies 1234.1 Summary of Evaluated Contract Tenure Reforms 1484.2 Summary of Evaluated Pay-for-Performance(Bonus Pay) Reforms 1604.3 Classroom Dynamics in 220 Pernambuco <strong>Schools</strong>,November 2009 1734.4 Incentive Program Design Features and PossibleEffects 1874.5 Pay-for-Performance Programs by Core DesignFeatures and Effect Size 191
ForewordVery few topics command as much attention in the development field asschool effectiveness. Schooling is a basic service that most citizens expectfrom their governments, but the quality available is quite variable, and theresults too often disappointing. What will it take for schools in developingcountries to deliver good quality education? <strong>Making</strong> <strong>Schools</strong> <strong>Work</strong>: New Evidenceon Accountability Reforms seeks to answer this question.The 2004 <strong>World</strong> Development Report developed a conceptual framework toanalyze the kind of government and market failures in service delivery thatexist in a large number of developing countries: weak accountability leadingto poor motivation and inadequate incentives for performance. That reportproposed a set of approaches to remedy those failures that rely on strongeraccountability mechanisms. But the empirical evidence supporting thoseapproaches was limited—and uncomfortably so.Over several years, <strong>World</strong> <strong>Bank</strong> researchers and project staff haveworked with academic researchers and their counterparts in governmentand civil society to remedy this evidence gap. Their studies isolate andmeasure the impacts of reforms and expand the evidence base on the bestmethods for improving school effectiveness, especially through betterinformation, devolution of authority, and stronger incentives for teachers.This volume is a systematic stock-taking of the evidence on schoolaccountability reforms in developing countries. It provides a measured andinsightful review and assessment of the results of a variety of approachesthat developing countries are experimenting with in their quest for betterix
x | Forewordschools. It is not the final word on the subject, but will hopefully contributeto better policy choices, grounded in the evidence currently available.The Human Development Perspectives series presents research findingson issues of critical strategic importance for developing countries. Improvingthe effectiveness of social service delivery is clearly one such issue. <strong>Making</strong><strong>Schools</strong> <strong>Work</strong> sets a standard for future efforts to assess the effectiveness ofpolicy reforms.Ariel FiszbeinChief Economist for Human DevelopmentChair, Editorial Board, Human DevelopmentPerspectives series<strong>World</strong> <strong>Bank</strong>Washington, D.C.Elizabeth KingDirector for Education<strong>World</strong> <strong>Bank</strong>Washington, D.C.
AcknowledgmentsThis study was managed by Barbara Bruns, Deon Filmer, and HarryAnthony Patrinos, who jointly authored chapters 1 and 5. Deon Filmerauthored chapter 2 with inputs from Marta Rubio-Codina; Harry AnthonyPatrinos authored chapter 3; and Barbara Bruns co-authored chapter 4with Lucrecia Santibañez. The study grew out of a cross-country researchprogram launched in 2006 with generous support from the government ofthe Netherlands through the <strong>Bank</strong>–Netherlands Partnership Program. Thatresearch program expanded with the launch of the Spanish ImpactEvaluation Fund (SIEF) in 2007 and the establishment of a formal clusterof work on education reforms aimed at strengthening accountability. Thisbook is above all a stocktaking of evidence emerging from the wave of newimpact evaluations that the <strong>World</strong> <strong>Bank</strong> and partner countries have beenable to launch thanks to this global funding support.For the initial inspiration to step up knowledge generation from <strong>World</strong><strong>Bank</strong> operations through rigorous evaluation, the authors are grateful toPaul Gertler, former <strong>World</strong> <strong>Bank</strong> chief economist for human development(HD). For the idea of focusing on education reforms in developing countriesthat tested the accountability framework of the 2004 <strong>World</strong> DevelopmentReport, the authors are grateful to current HD chief economist, Ariel Fiszbein.This book is underpinned by significant contributions, includingbackground papers, by Marta Rubio-Codina and Lucrecia Santibañez. Wealso thank Debora Brakarz, Katherine Conn, Margaret Koziol, and MartinSchlotter for excellent research assistance. Bruce Ross-Larsen providedxi
xii | Acknowledgmentsexcellent editorial advice. The team was guided and supervised by ElizabethKing and Ariel Fiszbein.We also benefitted from valuable comments from our peer reviewers,Luis Benveniste, Shantayanan Devarajan, Philip Keefer, and KarthikMuralidharan, and comments from colleagues Helen Abadzi, Felipe Barrera,Nick Manning, and Halsey Rogers. Helpful guidance received at earlierstages included comments from Sajitha Bashir, Isabel Beltran, FrancoisBourguignon, Jishnu Das, Pascaline Dupas, Claudio Ferraz, FranciscoFerreira, Paul Gertler, Paul Glewwe, Robin Horn, Emmanuel Jimenez, StutiKhemani, Arianna Legovini, Reema Nayar, Ritva Reinikka, CarolynReynolds, Sofia Shakil, Lars Sondergaard, Connor Spreng, Miguel Urquiola,Emiliana Vegas, and Christel Vermeersch. Any and all errors that remain inthis volume are the sole responsibility of the authors.
About the AuthorsBarbara Bruns is lead economist in the Latin America and Caribbean regionof the <strong>World</strong> <strong>Bank</strong>, responsible for education. She is currently co-managingseveral impact evaluations of teacher pay for performance reforms in Braziland is lead author of Achieving <strong>World</strong> Class Education in Brazil: The Next Agenda(2010). As the first manager of the $14 million Spanish Impact EvaluationFund (SIEF) at the <strong>World</strong> <strong>Bank</strong> from 2007 to 2009, Barbara oversaw thelaunch of more than 50 rigorous impact evaluations of health, education,and social protection programs. She has also served on the Education TaskForce appointed by the UN Secretary General in 2003, co-authored thebook A Chance for Every Child: Achieving Universal Primary Education by 2015(2003), and headed the Secretariat of the global Education for All Fast TrackInitiative from 2002 to 2004. She holds degrees from the London School ofEconomics and the University of Chicago.Deon Filmer is lead economist in the Research Department of <strong>World</strong> <strong>Bank</strong>.His research has spanned the areas of education, health, social protection,and poverty, and he has published extensively in these areas. Recentpublications include papers on the impact of scholarship programs onschool participation in Cambodia; on the roles of poverty, orphanhood, anddisability in explaining education inequalities; and on the determinants offertility behavior. He was a core team member of the <strong>World</strong> DevelopmentReports in 1995 <strong>Work</strong>ers in an Integrating <strong>World</strong> and 2004 <strong>Making</strong> Services<strong>Work</strong> for Poor People. His current research focuses on measuring andexplaining inequalities in education and health outcomes and evaluatingxiii
xiv | About the Authorsthe impact of interventions that aim to increase and promote schoolparticipation among the poor (such as conditional cash or food transfers)and interventions that aim to improve education service provision (such aspolicies to improve the quality of teachers in remote areas). He received hisPh.D. in economics from Brown University.Harry Anthony Patrinos is lead education economist in the EducationDepartment of the <strong>World</strong> <strong>Bank</strong>. He specializes in all areas of education,especially school-based management, demand-side financing, and publicprivatepartnerships. He manages the Benchmarking Education Systemsfor Results program and leads the Indigenous Peoples, Poverty, andDevelopment research program. He manages impact evaluations in LatinAmerica focusing on school-based management, parental participation,compensatory education, and savings programs. Previous books includeIndigenous Peoples, Poverty and Human Development in Latin America (PalgraveMacmillan, 2006), Lifelong Learning in the Global Knowledge Economy (2003),Policy Analysis of Child Labor: A Comparative Study (St. Martin’s, 1999),Decentralization of Education: Demand-Side Financing (1997), and IndigenousPeople and Poverty in Latin America: An Empirical Analysis (Ashgate, 1997). Hereceived a doctorate from the University of Sussex.
AbbreviationsAGEBOSCERCADDEDUCOEGRAEMISEQIPETPFUNDEFGDPGMIDEBIVNCLBNGOSupport to School Management Program (Apoyo a laGestión Escolar) [Mexico]School Operational Assistance Program (BantuanOperasional Sekolah) [Indonesia]Civic Engagement for Education Reform in Central Americadifference-in-differences [econometric method]Education with Community Participation (Educación conParticipación de la Comunidad)Early Grade Reading Assessment [Liberia]Education Management Information SystemEducation Quality Improvement Project [Cambodia]Extra Teacher Program [Kenya]Fund for Primary Education Development and Maintenanceand Enhancement of the Teaching Profession (Fundo deManutenção e Desenvolvimento da Educação Básica e deValorização dos Profissionais da Educação) [Brazil]gross domestic productgrant-maintained [school-based management model, UnitedKingdom]Index of Basic Education Development (Índice deDesenvolvimento da Educação Básica) [Brazil]instrumental variables [econometric method]No Child Left Behind [U.S. law]nongovernmental organizationxv
xvi | AbbreviationsOECD Organisation for Economic Co-operation and DevelopmentPDE School Development Plan (Plano de Desenvolvimiento daEscola) [Brazil]PEC Quality <strong>Schools</strong> Program (Programa Escuelas de Calidad)[Mexico]PEC-FIDE Program of Strengthening and Direct Investment in <strong>Schools</strong>(Programa de Fortalecimiento e Inversión Directa a lasEscuelas) [Mexico]PIRLS Progress in International Reading Literacy StudyPISA Programme for International Student AssessmentPREAL Partnership for Educational Revitalization in the AmericasPTA parent-teacher associationRCT ramdomized control trial [experimental method]RDD regression discontinuity design [experimental method]SBM school-based managementSD standard deviationSDMC school development and monitoring committee [India]SIMCE National System for Measuring the Quality of Education(Sistema Nacional de Medición de la Calidad de laEducación) [Chile]SNED National System for Performance Evaluation of SubsidizedEducational Establishments (Sistema Nacional de Evaluacióndel Desempeño de los Establecimientos EducativosSubvencionados) [Chile]TIMSS Trends in International Mathematics and Science StudyVEC Village Education Committee [India]$ All dollar amounts refer to U.S. dollars
1Motivation and FrameworkHow can it be that a teacher sleeps in a classroom in the middle of a schoolday while students wait patiently outside? That grants intended for schoolsarrive with most of the funds siphoned off by intermediate layers ofadministration? That classrooms in slum areas teem with students, graffiti,and broken windows while schools in richer districts enjoy ampleresources? That national school systems function without the periodictests that would reveal how little students are learning over time andacross districts?These are not the only problems facing education systems in the developingworld, but they are some of the most egregious—and in some sense,puzzling. While inadequate funding may be the biggest challenge thatdeveloping countries face, the proximate cause of the phenomena observedabove is not a lack of resources. The teacher is in the classroom, his salarypaid. The school grants program was funded by the central ministry. A fixedpot of resources may be distributed more or less equally across schools.While not simple or costless, the technology for tracking learning progressis readily available to developing countries, and many have started toimplement it while others have not.This book is about the threats to education quality that cannot beexplained by lack of resources. It focuses on publicly financed school systemsand the phenomenon of service delivery failures: cases where programsand policies that increase the inputs to education fail to produce effectivedelivery of services where it counts—in schools and classrooms. It documentswhat we know about the extent and costs of service delivery failuresin public education in the developing world. And it further develops aspectsof the conceptual model posited in the <strong>World</strong> Development Report 2004: that1
2 | <strong>Making</strong> <strong>Schools</strong> <strong>Work</strong>a root cause of low-quality and inequitable public services—not only ineducation—is the weak “accountability” of providers to both their supervisorsand their clients (<strong>World</strong> <strong>Bank</strong> 2003).The central focus of this book, however, is a new story. It is that developingcountries are increasingly adopting innovative strategies to attackthese issues. In more and more of the developing world, education resultsare improving because, among other reasons, education systems arebecoming more accountable for results. A highly encouraging part of thenew story is growing willingness by developing-country policy makers tosubject new reforms to rigorous evaluations of their impacts and costeffectiveness.Impact evaluation itself strengthens accountability because itexposes whether programs achieve desired results, who benefits, and atwhat public cost. A willingness to undertake serious impact evaluation is acommitment to more effective public service delivery.In just the past five years, the global evidence base on education reformsto improve accountability has expanded significantly. While still not large,the wave of accountability-oriented reforms in developing countries thathave been, or are being, rigorously evaluated now includes several differentapproaches and a diverse set of countries and regions. This book looksacross this growing evidence base to take stock of what we now know andwhat remains unanswered. Although similar reforms have been adopted inmany developed countries, it is beyond the scope of this book to reviewthat policy experience in equivalent depth. Wherever possible, we do comparethe emerging evidence from developing-country cases with thebroader global evidence, particularly where the Organisation for EconomicCo-operation and Development (OECD) experience is robust enough tosupport meta-evaluations and more general conclusions, or where developed-countrycases appear to differ in important ways from outcomes inthe developing world.Our goal is to use evidence to distill practical guidance for policy makersgrappling with the same challenges and considering the same types ofreforms. In many areas, the current evidence base does not support clearanswers. But by synthesizing what is supported by current evidence and byframing the issues where further research is needed, we hope to contributeto more effective policy design today and encourage further experimentationand evaluation tomorrow.This initial chapter provides an overview and context for the rest of thebook. It reviews the motivation and global context for education reformsaimed at strengthening provider accountability. It provides a rationale forthe focus on the three key lines of reform that are analyzed in detail inchapters 2, 3, and 4:• Chapter 2 drills into the global experience with information reforms—policies that use the power of information to strengthen the ability of
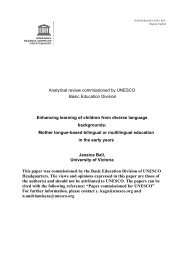
Motivation and Framework | 3clients of education services (students and their parents) to hold providersaccountable for results.• Chapter 3 analyzes the experience with school-based management reforms—policies that increase schools’ autonomy to make key decisions and controlresources, often empowering parents to play a larger role.• Chapter 4 reviews the evidence on two key types of teacher incentivereforms—policies that aim to make teachers more accountable for results,either by making contract tenure dependent on performance, or by offeringperformance-linked pay.The final chapter summarizes what we know about the impact of thesetypes of reforms, draws cautious conclusions about possible complementaritiesif they are implemented in tandem, and considers issues related toscaling up reform efforts and the political economy of reform. Finally, wesuggest directions for future work.Service Delivery Failure in the Developing <strong>World</strong>Between 1990 and 2010, the share of children who completed primaryschool in low-income countries increased from less than 45 percent tomore than 60 percent (<strong>World</strong> <strong>Bank</strong> 2010)—a substantially faster rate ofimprovement than the standard set by the now high-income countries(Clemens, Kenny, and Moss 2007). Despite this progress, two swaths of thedeveloping world—South Asia and Sub-Saharan Africa—will likely notachieve the United Nations Millennium Development Goal of universalprimary completion by 2015. In many countries, the failure to achieveeven this basic threshold of education development will come after havinginvested substantial national and donor resources in education—highershares of gross domestic product (GDP) than high-income countries spentover the course of their development.The gap in education results between developing and developed countriesis even greater when measured by learning outcomes, as figure 1.1illustrates. Among 15-year-olds tested in the OECD’s Programme for InternationalStudent Assessment (PISA) in 2009, only 7 percent of Korean studentsand 22 percent of students across all OECD countries scored below400 points—a threshold that signals even the most basic numeracy skillshave not been mastered. Yet 73 percent of students in upper-middle-incomecountries and 90 percent of students in lower-middle-income developingcountries performed below this level. Among the 38 developing countriesparticipating in the Trends in International Mathematics and Science Study(TIMSS), even students in the highest-income quintile performed, on average,worse than test takers from the poorest 20 percent of OECD students.
4 | <strong>Making</strong> <strong>Schools</strong> <strong>Work</strong>Figure 1.1 Comparative PISA Math Proficiency, 2009percentages of 15-year-old students scoring at “high,”“average,” and “below basic” levelspercentage of students scoringabove and below 400100806040200–20–40–60–80–100KoreaOECD countriesupper-middle-incomecountrieslower-middle-incomecountrieshigh (>600) average (400–600) below basic (
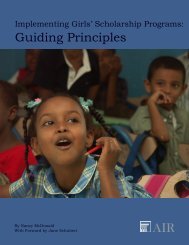
Motivation and Framework | 5within regions: differences in average cognitive skills are consistently andhighly correlated with long-term rates of per capita income growth. Whilethe quantity of education (average years of schooling of the labor force) isstatistically significantly related to long-term economic growth in analysesthat neglect education quality, the association between years of schoolingand economic growth falls to close to zero once education quality (measuredby average scores on internationally benchmarked tests) is introduced.It is the quality of education that counts for economic benefits fromschooling.The recent Commission on Growth and Development, which reviewedthe factors associated with sustained economic growth around the world,included these two key conclusions in its 2008 report, The Growth Report:Strategies for Sustained Growth and Inclusive Development:• “Every country that sustained high growth for long periods put substantialeffort into schooling its citizens and deepening its human capital.”• [Rather than the quantity of education (years of schooling or rates ofenrollment),] “it is the results (literacy, numeracy, and other cognitiveskills) that matter to growth.”How Services FailDeveloping countries in 2010 spent an estimated 5 percent of GDP on publiceducation. While this average obscures a slightly lower share in low-incomecountries and a higher share in middle-income countries, the salient pointis that these levels of investment are not wildly different from average publicspending on education in OECD countries, which was 4.8 percent of GDPin 2010.Researchers have documented the weak correlation between spendingand results in education that emerges from cross-country and withincountryanalysis—whether measured in terms of aggregate spending as ashare of GDP, spending per student, or trends over time (<strong>World</strong> <strong>Bank</strong>2003). The lack of correlation holds whether spending is compared to outputs(education attainment) or outcomes (learning), and it holds aftercontrolling for incomes, as shown in figure 1.2a.This pattern is not restricted to the developing world. For example, perstudentU.S. spending on education doubled in real terms from 1970 to2000 but produced no increase in student performance on benchmarkedtests (Hanushek 2006). For many years, this observed “failure of inputbasedpolicies” was a core conundrum of education economics.The <strong>World</strong> Development Report 2004 broke new ground on this questionby looking broadly at the ways in which public spending in developingcountries failed to result in quality services for clients, particularly the
6 | <strong>Making</strong> <strong>Schools</strong> <strong>Work</strong>Figure 1.2 Correlation of Education Spending to Student Performance20a. Primary math test scores vs. global publiceducation spending a15normalized primary test score(controlling for GDP per capita)1050–5–10–15–20–15 –10 –5 0 5 10 15spending on primary education(controlling for GDP per capita)1.0b. Malawi Primary School Leaving Exam (PSLE)pass rate vs. per-student spending badjusted PSLE pass rate0.80.60.40.206 7 8 9 10unit cost (log)Sources: International test data for various years from Altinok and Murseli 2007; GDP percapita data from Penn <strong>World</strong> Tables (http://pwt.econ.upenn.edu); and education spendingdata from <strong>World</strong> <strong>Bank</strong> EdStats database. Malawi data from <strong>World</strong> <strong>Bank</strong>, UNESCO/Pole deDakar, and Government of Malawi 2010.a. The global figure shows deviation of normalized test scores from that predicted by GDPper capita against deviation of public spending on primary education per student (relativeto GDP per capita) from that predicted by GDP per capita.b. The Malawi figure includes only government-funded schools, and the unit cost includesteachers and book-related expenses.
Motivation and Framework | 7poorest clients (<strong>World</strong> <strong>Bank</strong> 2003). It documented key issues in the “servicedelivery chain,” including inequitable allocation to low-income groups, the“leakage” of funding en route from central ministries to front-line providers,and the failure of front-line providers such as teachers, doctors, and nursesto perform effectively—or even, in many cases, to show up.Inequitable spendingThe allocation of public education spending in developing countries oftenbenefits the rich rather than the poor. Public expenditure studies in sixdifferent African countries, for example, have found that more than30 percent of education spending benefited the richest 20 percent, whileonly 8 to 16 percent benefited the poorest 20 percent (figure 1.3a). But asthe case of Malawi illustrates, public policy choices can transform a highlyregressive pattern of expenditures into an equitable one, as that countrydid between 1990 and 1998, shown in figure 1.3b.Funding leaksPublic expenditure tracking studies have documented substantial “leakage”of public funding in the flow from central ministries to the front-lineproviders: schools. In one well-documented case, it took concerted governmentaction over an eight-year period to raise the share of capitationgrants that actually reached Ugandan schools from less than 20 percent to80 percent (Reinikka and Svensson 2005). Other studies have shown that“leakage” is a serious problem in many settings, as seen in table 1.1. Innovativeresearch by Ferraz, Finan, and Moreira (2010) exploited data fromrandomized government audits of municipalities in Brazil to take this analysisa step further and quantify how much the leaks can matter for educationquality. The 35 percent of municipalities where significant corruptionwas uncovered were less likely than other municipalities to have adequateschool infrastructure or to provide in-service training to teachers, and theirstudent test scores were on average a 0.35 standard deviation lower—alarge disparity by global standards.Teacher absence and loss of instructional timeThe most widespread losses and abuses in education systems occur onthe front lines—teachers who are absent from their posts or who demandillegal payments for services that are legally free. A study that collectedestimates of teacher absenteeism in nine developing countries (usingsurprise visits to a nationally representative sample of schools in eachcountry) found, on average, 19 percent of all teachers absent on anygiven day. The lowest rate registered was 11 percent in Peru; the highestwas 27 percent in Uganda (Chaudhury and others 2006). The estimatedaverage for India was 25 percent, but in some states, it reached 40 percent(Kremer and others 2005).
8 | <strong>Making</strong> <strong>Schools</strong> <strong>Work</strong>Figure 1.3 Shares of Public Education Spending Benefiting the Richestand Poorest Population Quintiles, Selected Countries40a. Pattern across countries3530percentage of population2520151050South Africa 2000Bosnia and Herzegovina 2001Albania 2002Nepal 2003–04Kenya 1992–93Azerbaijan 2001Cambodia 2002Egypt 2004–05Indonesia 1998Malawi 1994–95Mexico 1999Guinea 1994Benin 2003Uganda 1992–93Lesotho 2002Côte d’Ivoire 1995Mozambique 2003Tanzania 1993–94poorest quintilerichest quintile40b. Pattern in Malawi35percentage of population3025201510501990–91 1994–95 1997–98poorest quintile quintile 2 quintile 3quintile 4 richest quintileSource: Filmer and Goldstein 2010.
Motivation and Framework | 9Table 1.1 Percentage of School Grants Reaching <strong>Schools</strong> in SelectedCountriesCountry and grant year(s)Percentage received by schoolsBrazil 2003 (FUNDEF capitation grant) a45–87 bGhana 1997–98 51Kenya 2004 (secondary school bursary funds) 78Madagascar 2002 88Papua New Guinea (2001, 2002) 72, 93Tanzania 2002–03 62Uganda 1991–95, 2001
10 | <strong>Making</strong> <strong>Schools</strong> <strong>Work</strong>Figure 1.4 Teacher Classroom Presence and Time Spent Teaching,Selected Countries100percentage of time at school806040200Egypt, Arab Rep.LebanonYemen, Rep.Lao PDRTunisiaCambodiaMoroccoofficial time presence time time on taskPernambuco(Brazil)GhanaSources: Millot and Lane 2002 for the Arab Republic of Egypt, Lebanon, and the Republicof Yemen; Abadzi 2009 for Ghana, Morocco, Pernambuco (Brazil), and Tunisia; Benveniste,Marshall, and Araujo 2008 for Cambodia; and Benveniste, Marshall, and Santibañez 2007for the Lao People’s Democratic Republic.That the effective use of resources hinges critically on the incentives facedby system actors is a core insight from economics. The <strong>World</strong> DevelopmentReport 2004: <strong>Making</strong> Services <strong>Work</strong> for Poor People focused on the incentivesfaced by the various actors involved in the delivery of public services in thedeveloping world (<strong>World</strong> <strong>Bank</strong> 2003).Incentive systems in education face a challenge that is common to mostsectors and firms: the principal-agent problem. The principal (a country’sministry of education) would like to ensure that its agents (school directorsand teachers) deliver schooling that results in learning. But achievingthis is complex because of the nature of the service. If education were likeproducing pizzas or kebabs or samosas or empanadas, the delivery processcould be reduced to a set of predefined tasks that agents are instructed tocarry out. Quality could be monitored by ensuring that workers follow thepredefined steps.But education services are complicated. At the point of delivery—theinteraction of teachers with their students—the service provided is highlydiscretionary, variable, and transaction-intensive:• Discretionary, in that teachers must use their own judgment to decidewhat part of the curriculum to deliver and how
Motivation and Framework | 11• Variable, in that in a single classroom a teacher must customize servicesto a large number of different students with different aptitudes, motivations,and learning styles• Transaction-intensive, in that producing learning results requires repeatedand frequent interaction between teachers and individual students.These features make it difficult to predefine in sufficient detail the actionsteachers must take, either to specify a complete contract of what they areexpected to do or to monitor that contract completely.The principal-agent problem is further complicated because ministriesof education are themselves the agents of the citizenry. If the “consumers”of education services were like restaurant patrons, repeat businessand competition could be expected to ensure the restaurant’s quality or itwould go out of business. But governments universally mediate the marketfor education because the sector suffers from a set of market failuresthat government intervention can rectify. As a result, the users of educationservices—parents and children—are also principals trying to ensurethat their country’s ministry of education establishes a system that producesthe high-quality education they demand. This sequential set ofprincipal-agent problems demands a more complex system of incentivesand accountability.Figure 1.5 shows the set of actors and relationships that determine publicsector accountability. The sequence of principal-agent problems forms aFigure 1.5 The Accountability Frameworkthe statevoice/politicslong route of accountabilitycompactcitizens/clientsclient powerprovidersshort routeSource: <strong>World</strong> <strong>Bank</strong> 2003.
12 | <strong>Making</strong> <strong>Schools</strong> <strong>Work</strong>long route of accountability between the users of services and front-lineproviders. In a first step, the clients (parents and students) hold the stateaccountable. They do this by using their voice and votes, through the politicalprocess, to try to ensure that politicians and policy makers deliver theservices they demand. In a second step, the state holds providers (schoolsand teachers) accountable for their behaviors and their results through acompact or managerial relationship. This compact can be implicit, as inmost countries where schools are managed mostly within a ministry ofeducation. But the compact can also be explicit in the case of vouchers,charter schools, and other strategies for contracting out services. When thestate turns over the delivery of services to a nonstate entity, it is forced todefine the terms of a specified contract.There is also a more direct route of accountability—a short route—that runs directly from users to front-line providers. When a service iscompetitively provided and its quality is easy to monitor, as in a restaurant,client power is strong, and this short route is sufficient to ensure satisfactoryservice delivery.In education, the short route also has an important role to play. Just asthere are market failures that create the rationale for government interventionin a sector, there are also “government failures” whereby the long routebreaks down, and the short route can compensate for those failures. Citizens,and poor citizens in particular, may lack the voice or the political cloutto hold politicians accountable through “long-route” electoral processes.Entrenched interests, or even just the inherent difficulties of monitoringservice delivery, may make it hard to define or implement an effective compact.Strengthening the short route—that is, giving parents and students adirect voice in their local school—can be an important way of improvingservice delivery.Three Core Strategies for More AccountableEducation SystemsOur focus on accountability is in part motivated by the theory outlinedabove—that education results depend on the effective resolution of a seriesof principal-agent problems that characterize service delivery in this sector.But the focus also has an empirical foundation. Cross-country analysis ofinternational tests such as PISA and TIMSS shows that countries withgreater local decision-making authority and greater accountability havebetter learning outcomes (Fuchs and Woessmann 2007; Woessmann 2003).More compelling yet is the growing set of experiments with school accountabilityreforms in developed and developing countries that show causalimpacts on student learning.
Motivation and Framework | 13Although a variety of accountability reform strategies have been adoptedin OECD, middle-income, and low-income countries over the past twodecades, this book focuses on three widely used strategies that each have aclear rationale for how reforms might translate into improved learning outcomes:• Information for accountability: generation and dissemination of informationabout schooling rights and responsibilities, inputs, outputs, and outcomes• School-based management: decentralization of school-level decisionmaking—autonomy—to school-level agents• Teacher incentives: policies that link pay or tenure directly to performance.Information for AccountabilityThe notion that increased information in education can improve accountabilityand outcomes is not new. In the 1990s, the education sector in theUnited States experienced a large-scale increase in test-based accountability(Loveless 2005). By the end of the decade, most states had some form ofstatewide testing system in place, and this approach was entrenched at thefederal level in 2001 as a part of the No Child Left Behind (NCLB) law.Before NCLB, the implementation of school accountability systems variedextensively across states. In particular, the degree to which schools performingbelow standard would receive any “punishment” from state authoritiesvaried. In some states, test-based accountability amounted to no more thaninformation about average school (test) performance, commonly referred toas “school report cards.” Studies of this U.S. experience have typically foundthat the impact of accountability on test scores has been positive (Carnoyand Loeb 2002; Hanushek and Raymond 2003, 2005; and Loeb and Strunk2007). Intriguingly, the findings suggest that simply reporting informationabout average school test scores led to increased performance (Hoxby 2001,Hanushek and Raymond 2003), although these findings vary when alternativemeasures of the degree of sanction associated with accountability areused in the analysis (Hanushek and Raymond 2005).Creating an information feedback loop to connect public service users,providers, and policy makers as a reform strategy cuts across sectors. InBangalore, India, a civil society organization initiated the generation of“citizen report cards” that rated the quality of public services based oninterviews with the users of these services (Paul 2002). These report cardswere then disseminated through various media channels in ways thatallowed service users to compare quality across services and across neighborhoods.This initiative has been credited with management reforms
14 | <strong>Making</strong> <strong>Schools</strong> <strong>Work</strong>that contributed to improvements in service delivery (also see the discussionabout the “right to information” movement in India in Jenkins andGoetz 1999). Similar approaches are being tried in a variety of contexts—for example, in the Ugandan health sector, where detailed “report cards”for health clinics were prepared and shared with villagers and healthworkers, followed by workshops to develop improvement plans for theclinics (Björkman and Svensson 2007).When parents and students have little information about the performanceof their schools or about the inputs those schools are entitled toreceive, their position relative to service providers and governments isweak. They have limited ability to hold schools and teachers accountablefor either effort or efficiency in the use of resources, and they have a limitedempirical foundation to lobby local or national governments for greater(or better) public support to their schools. In terms of the accountabilityrelationships illustrated in figure 1.5, lack of information weakens clients’power to hold providers directly accountable and also weakens citizens’voices relative to policy makers and politicians.There are three main accountability channels through which informationcould affect learning outcomes: increasing choice, participation, and voice.Increasing choiceProviding parents with hard evidence about learning outcomes at alternativeschools allows parents and students to optimally go to their preferredschools. In a context where there is a choice of schools and where schoollevelresources are linked to attendance, the information about learningoutcomes can have two effects. First, it can reduce the information asymmetrybetween service providers (who know substantially more aboutwhat is going on in the schools) and service users. Second, the enhancedcompetitive pressure induced by more effective choice can induce providersto improve quality. Both of these effects increase client power in the provisionof services.Increasing participationBy publicizing rights, roles, and responsibilities and by documenting servicedelivery shortfalls relative to other schools in the village, district, province,or country, information can be a motivator for action on the part of parentsand other stakeholders. Lack of information could lead parents and otherstakeholders to believe that performance is adequate—in turn leading tocomplacency. The provision of information can rebalance the relationshipbetween users and providers and spur users to action, including increasedor more effective oversight of schools—thereby also increasing client power.The logical chain is that provider effort increases as a result of this intensifiedoversight, thereby improving education quality.
Motivation and Framework | 15Increasing voiceProviding credible information can allow parents and other stakeholders tolobby governments more effectively for improved policies, either at thelocal or national level. It provides content to feed the voice that citizens useto pressure governments and hold them to account. Information can exposeshortcomings and biases, and its wide dissemination can overcome informationasymmetries that perpetuate inequalities (Keefer and Khemani2005; Majumdar, Mani, and Mukand 2004). Finally, information canbecome the basis for political competition (Khemani 2007).School-Based ManagementThe highly decentralized nature of education services at the point of deliverymakes them extremely demanding of the managerial, technical, andfinancial capacity of governments. The requirements for effective, efficient,and centrally produced and distributed education services aretherefore stringent. There is an association across countries between goodperformance on international student achievement tests and local- andschool-level autonomy to adapt and implement education content and toallocate and manage resources. Indeed, there is a trend in many countriestoward increasing autonomy, devolving responsibility, and encouragingresponsiveness to local needs, all with the objective of raising performancelevels.SBM definedSchool-based management (SBM) is the decentralization of authority fromthe government to the school level. Responsibility for, and decision-makingauthority over, school operations is transferred to local agents. Many ofthese reforms also attempt to strengthen parental involvement in theschools, sometimes by means of school councils.These aspects of SBM form two important dimensions: (1) the extent towhich schools are granted autonomy over decisions—an attempt at improvingthe compact between those who oversee service provision and thosewho deliver it; and (2) the extent to which parents are actively encouragedto participate in the decision making—an attempt at improving the voiceparents have in the delivery of services.The granting of autonomy in SBM programs usually works through theestablishment of a school committee (which goes by various names such asschool council or school management committee). The tasks of the councilor committee can vary substantially across initiatives and can include thefollowing functions:• Monitoring the school’s performance as measured by test scores or byteacher and student attendance
16 | <strong>Making</strong> <strong>Schools</strong> <strong>Work</strong>• Developing curriculum• Procuring textbooks and other education material• Improving infrastructure and developing school improvement plans• Hiring and firing of teachers and other school staff• Monitoring and evaluating teacher performance and student learningoutcomes• Allocating budgetary resources• Approving annual budgets (including the development budget) andexamining monthly financial statements.In programs that actively promote parental participation, the school committee(in the context of the figure 1.5 framework) becomes a middle pointbetween users and front-line providers. As in the dimension of autonomy,there is a wide range in the extent to which SBM initiatives translateinto effective parental involvement. In some cases, parents act merely asobservers or volunteers; in others, parents take on responsibilities such asthe assessment of student learning or financial management. In cases withmore intensive involvement, parents are directly involved in the school’smanagement by being custodians of the funds received and verifying thepurchases and contracts made by the school.SBM objectivesSchool-based management is a form of decentralization. While decentralizationcan involve the transfer of responsibilities from the central governmentto lower levels of government (such as the regional, municipal, ordistrict levels), this book is concerned with the school as the locus of decisionmaking. The main thrust behind SBM is that it encourages demand,ensures that schools reflect local priorities and values, and allows closermonitoring of the performance of service providers. In other words, SBMshortens the long route of accountability. By giving a voice and decision-makingpower to local stakeholders who know more about local needs than centralpolicy makers do, it is argued that SBM will improve education outcomesand increase client satisfaction.SBM emphasizes the individual school (as represented by any combinationof principals, teachers, parents, students, and other members ofthe school community) as the primary unit for improving education. Itsredistribution of decision-making authority over school operations is theprimary means by which this improvement can be stimulated and sustained.Arguments in favor of SBM typically emphasize that it will lead to• increased participation of local stakeholders in decision-making processes;• more effective and transparent use of resources (because of the ability touse local knowledge in allocating resources and the increased oversightrole of parents);
Motivation and Framework | 17• more inputs and resources from parents, whether in cash or in-kind(because of the increased stake parents have in the provision of education);• more open and welcoming school environments (because of increasedparental participation and communication with school authorities); and• higher-quality delivery of education services, ultimately improving studentperformance (as measured by lower repetition and dropout ratesand by higher test scores).SBM pioneersIn Australia, the 1967 Currie Report recommended the establishment ofgoverning bodies for each school, consisting of teachers, parents, localcommunity members, and students (Currie 1967). This report was implementedin 1974, and by the late 1990s, all eight Australian school systemshad enacted legislation to introduce reforms involving SBM.Other countries followed suit. Britain’s Education Reform Act, in 1988,empowered school communities by giving public secondary schools theoption of leaving local-education-authority control and becoming autonomous,grant-maintained (GM) schools. GM schools were funded by a newagency but were owned and managed by each school’s governing body: anew 10- to 15-member entity composed of the head teacher and teacherand parent representatives. Control over all staff contracts and ownershipof the buildings and grounds were taken from the local school districts andgiven to GM schools. Between 1988 and 1997, among almost 1,000 schoolsholding votes on the matter, most favored conversion to GM status. Elsewhere,also in 1988, boards of trustees were introduced at each school inNew Zealand, and the School Reform Act instituted mandatory schoolcouncils in the United States.In the developing world, one of the first countries to adopt SBM as partof an overall reform program was El Salvador. The reform began in 1991under the name Educación con Participación de la Comunidad (Education withCommunity Participation, or EDUCO). EDUCO schools were publiclyfunded schools where parents were expected to make contributions such asproviding meals or volunteering their time and labor. The distinguishingfeature of EDUCO schools was their management by local Associations forCommunity Education (ACEs), community-elected bodies that receivedfunds directly from the Ministry of Education. ACEs were responsible forenacting and implementing all school-level education policies, includingthe hiring, firing, and monitoring of teachers (Sawada and Ragatz 2005).The main tenet of EDUCO’s philosophy was the need for parents to bedirectly involved in their children’s education. The program contributed torebuilding the school system after a civil war and is credited with expanding
18 | <strong>Making</strong> <strong>Schools</strong> <strong>Work</strong>preprimary and primary enrollments in rural areas, particularly in thepoorest areas with little access to existing education services (Di Gropello2006). Some evidence also shows positive effects on teacher effort, studentretention, and reduced teacher absences as well as some limited evidenceof improved learning outcomes (Jimenez and Sawada 1999, 2003; Sawada1999; Sawada and Ragatz 2005).Teacher IncentivesMany different monetary and nonmonetary factors motivate individualsto become and remain teachers, as figure 1.6 summarizes—ranging frombase salaries, pensions, and benefits to the intrinsic satisfaction of helpinga child to learn. Yet the phenomena described earlier in this chapter(high rates of teacher absence and persistently low learning results) attestto failures of the education system in many developing countries to createadequate incentives for teachers to deliver effective performance inthe classroom.It is not only in developing countries that policy makers wishing to recruit,groom, or motivate “great teachers” confront a political reality of recruitmentand compensation systems with weak links, if any, between rewardsand performance. Most education systems globally are characterized byfixed salary schedules, lifetime job tenure, and flat labor hierarchies, whichcreate a rigid labor environment where extra effort, innovation, and goodFigure 1.6 Teacher Performance Incentivesintrinsicmotivationrecognitionand prestigebonus payrespondingto clientsmasteryqualified,motivated,effectiveteacherssalarydifferentialsjobstabilityadequateinfrastructure andteaching materialsprofessionalgrowthpensions andbenefitsSource: Adapted from Vegas 2005.
Motivation and Framework | 19results are not rewarded and where dismissal for poor performance isexceedingly rare (Weisberg and others 2009). Almost universally, teacherrecruitment and promotion are based on the number of years of preservicetraining, formal certificates, and years of service. Yet an extensive body ofresearch has documented the lack of correlation between these observablefactors and teachers’ effectiveness in the classroom—measured by their abilityto produce learning improvements in their students (Rivkin, Hanushek,and Kain 2005).In this context, both OECD and developing countries are increasinglyexperimenting with two particular teacher policy reforms that aim tostrengthen teachers’ accountability for performance: contract tenure reformsand pay-for-performance reforms.In terms of the accountability triangle in figure 1.5, these reforms tightenthe managerial compact between policy makers and providers by definingexpected results with more specificity and establishing clearer rewards andsanctions. In those cases where contract teachers are directly hired andsupervised by school-level committees with parent participation—a commonformula—the reform also strengthens client power by giving parentsand community members a degree of direct authority over teachers thatthey previously lacked. Contract tenure and pay-for-performance reformswork at the opposite ends of the incentives spectrum, one offering positiverewards and the other strengthening the threat of sanctions. But it is interestingto note that they share a political advantage: they can both be introducedalongside existing teacher policies without requiring wholesalereform of civil service rules regarding teacher salary scales, tenure, andrecruitment processes.Contract tenure reformsTeacher recruitment under contracts that do not grant civil service statusand tenure protection creates a parallel corps of “contract teachers”who work alongside the existing stream. Contract teachers are hired onfixed-term (usually one-year) contracts and, in many cases, the locus ofhiring is more decentralized (to the school or community level) thanunder the civil service. Entry standards (education level) and salariesfor contract teachers are also often different. From an incentive standpoint,the absence of job stability should make contract teachers moreaccountable for performance. More localized hiring also creates thepotential for closer monitoring of teacher performance and additionalaccountability pressure.Pay-for-performance reformsMerit pay, performance-based pay, or teacher bonus schemes leave coresalary policies intact but create an incentive at the margin with the offer of
20 | <strong>Making</strong> <strong>Schools</strong> <strong>Work</strong>a bonus (usually an annual bonus) based on some explicit measure ofteacher performance. There are many different designs, but one core distinctionis who is rewarded: individual teachers or the school as a whole (groupbasedrewards). A second distinction is what is rewarded: bonuses can rewardinputs (such as teacher attendance), outcomes (such as student learning andgrade progression), or a combination. Given the expansion of standardizedstudent testing, pay-for-performance programs are increasingly based onimprovement in learning outcomes. From an incentive standpoint, pay-forperformanceprograms are among the strongest possible levers to strengthenaccountability for specific desired results.Accountability and EvidenceTo improve student learning outcomes, school systems everywhere commonlyemploy a broad range strategies: teacher training, curriculum reform,textbook provision, school lunches, libraries and infrastructure, and manymore. Each of these interventions has the potential to increase learning,but they typically rely on a technocratic approach to changing the level andmix of inputs. As discussed above, changing the level of inputs throughincreased resources is often ineffective (as figure 1.2 illustrated). Even if itis possible to establish a technically optimal mix of inputs in a given situation,the mix actually implemented is ultimately the result of accountabilityrelationships and pressures. For example, the allocation of more resourcesto teacher-related inputs, as opposed to other inputs, often reflects thepolitical voice of teachers, who are typically the most organized group ofeducation stakeholders (see Pritchett and Filmer 1999 for a discussion andempirical illustration of this). Underlying accountability relationships havethe power to shape education outcomes by affecting the level and mix ofeducation inputs that are available in an education system as well as theeffectiveness of resource use.Among the possible strategies for strengthening accountability in education,this book focuses on information for accountability, SBM, and teacherincentives because these particular reforms are increasingly being implementedin developing countries. There is also a new wave of evidenceregarding how these reforms work that has grown out of a concerted effortby the <strong>World</strong> <strong>Bank</strong> since 2005 to identify clusters of innovative developingcountryreforms in these three areas and to work with partner governmentsto support their rigorous evaluation. 1 The three themes of this bookmirror the clusters that were identified for impact evaluation support.This book does not address two additional approaches to increasingaccountability, however, and these deserve mention. The first approachinvolves greater use of the private sector to create a more competitive
Motivation and Framework | 21market for education—for example, through the use of vouchers or publicprivatepartnerships. The theory of change underlying these strategies is toleverage public-private competition to induce quality improvements in thepublic sector. While the rigorous evidence in developing country contextsis currently limited (there has been more experience in OECD countries), itis growing, and the evidence base will be stronger in the years to come(Patrinos, Barrera-Osorio, and Guáqueta 2009).A second approach is to strengthen the compact through administrativedecentralization—reforms that shift powers or resources from the centralgovernment to the regional or district levels but do not change the degreeof autonomy at the school level. These intergovernmental reforms, whilethey may also aim at strengthening accountability, are less amenable tothe type of impact evaluation prioritized in this book. While there havebeen some attempts to identify impacts of these reforms using approachesthat require more assumptions for identification (Galiani, Gertler, andSchargrodsky 2008; Eskeland and Filmer 2007), even these are rare. Last,to the extent that these decentralization reforms merely shorten the longroute of accountability (by replacing the “state” with “local government”in the figure 1.5 framework), basic accountability problems on the frontlines of service delivery may remain (Khemani 2001).Accountability Reforms in ContextAccountability-oriented reforms in education or in any other sector takeplace in a broader context of public sector policies and management. Theyare influenced by, and interact with, this context in several ways.Context of broad public sector reformFirst, there can be a direct link between broader public sector reform effortsand specific applications in education. In Australia and New Zealand in thelate 1980s, for example, information and SBM reforms similar in designand spirit to the cases reviewed in this book were implemented as part ofhigh-profile, government-wide efforts to make the public sector moreresults-focused, transparent, and responsive to citizens. A more recent case,the 2008 teacher pay-for-performance reform adopted in the state of MinasGerais in Brazil (which closely parallels one of the cases discussed in thisbook) was an explicit part of a broad, statewide “management shockprogram” (choque de gestao) aimed at making the public sector more resultsfocusedand efficient.Context of public sector dysfunctionSecond, dysfunctions in the broader public sector context can create thelatent or explicit demand for education accountability reforms. If schools
22 | <strong>Making</strong> <strong>Schools</strong> <strong>Work</strong>are not functioning because of a breakdown of the state, as in civil-wartornEl Salvador in the early 1990s or Nepal in 2001, bottom-up demandsfrom parents can generate a radical model of locally managed schools inresponse. If constrained public sector resources cannot finance universalprimary schooling at the prevailing civil service teacher wage, local hiringof lower-wage contract teachers may emerge as an official or unofficialeducation system response, as occurred in many parts of Africa and Indiain the 1990s. Indeed, as noted earlier, it is likely no coincidence that thetwo specific approaches to teacher incentive reforms reviewed in this book(contract tenure and pay-for-performance reforms) are attracting increasinginterest from developing-country policy makers. Both can inject flexibilityinto otherwise rigid civil service rules governing teachers’ pay levels andaccountability for performance without requiring across-the-board reformsof those rules that would be resisted by teachers’ unions, or the civil serviceas whole.Context of political powerThird, the broader political context can delimit or undermine the impact ofreforms adopted in the education sector to improve accountability. Thepower of a reform that gives parents information about school outcomes topromote systemwide improvement will be constrained if the ethnic minoritiesor low-income communities whose schools are most disadvantagedare underrepresented in the political process.Context of influence on public sector accountabilityFourth, and conversely, accountability reforms in education also have thepotential to wedge open a political space for broader public sector managementreforms. Increasing the information available to all stakeholders—theusers of services, the overseers, and the providers—could change the debateabout overall public sector effectiveness. Access to information can alsoprovide tools for various stakeholders to hold each other to account. Likewise,SBM could change the relative power of the different stakeholders,with spin-off effects for performance management. And increasing the roleof performance evaluation in the career management of public sectorteachers could set the stage for more generalized public-sector pay reforms.From this perspective, each of these smaller-scale reforms may not be anend in itself but rather a contribution to a dynamic process that ultimatelyproduces larger-scale change.Use of Impact EvaluationsThis book synthesizes results from 22 recent, high-quality impact evaluationsof accountability-focused reforms in 11 developing countries. These
Motivation and Framework | 23evaluations represent only a small subset of the available studies on thesetopics, but they merit special attention because they meet a high bar formethodological rigor. In almost all cases, the studies were prospectivelydesigned impact evaluations whose goal was to establish attribution: thatthe size and nature of the impacts observed were directly caused by theprogram.This focus on the identification of causal impacts is one of the hallmarksof rigorous impact evaluation. Rather than being satisfied withcorrelations—for example, that schools with management committeestend to have better learning outcomes—rigorous impact evaluations aimto quantify the extent to which observed increases in learning outcomeswere the result of school committees, excluding the possible role of otherobserved and unobservable factors.Rigorous impact evaluations quantify causal effects by comparing whathappened with the program to a credible estimate of what would have happenedwithout it. The most robust method for this is a randomized controltrial (RCT). When programs are implemented so that beneficiaries (be theyschools, communities, or individual students) are randomly selected from alarger group of potential beneficiaries, the “treatment” and “comparison”populations will be statistically identical—in both observable and unobservableways. Under these conditions, the impacts of a program on itsbeneficiaries can be directly compared with the outcomes experienced bynonrecipients. The use of random assignment minimizes the threat of selectionbias—that is, that the individuals benefiting from a program are insome way different from those who do not benefit and that these inherentdifferences, rather than exposure to the program, explain the differentresults.Evidence from RCT evaluations of accountability-oriented reforms figuresprominently in this book because these evaluations typically achievethe highest internal validity—or standard of proof that the observed resultsare attributable to the program. Fifteen of the 22 cases reviewed in thisbook are pilot programs whose experimental design was expressly developedto establish rigorous evidence of impact. They constitute excellenttests of the efficacy of a new reform or program because they demonstratewhether the program can work under carefully controlled conditions andthe size of the impacts that can result.While RCTs are often implemented on a pilot scale, it is relatively rare tofind systemwide reforms implemented through random assignment. 2 Butpilot programs are not necessarily a window into the reality of how thesekinds of reforms would gestate or be implemented in a nonexperimentalcontext or at scale. As such, they raise questions of the external validity ofthe results: to what extent can we expect the same impacts if these programsare implemented in different settings or systemwide?
24 | <strong>Making</strong> <strong>Schools</strong> <strong>Work</strong>Therefore, while evaluations that rely on quasi-experimental approachessuch as regression discontinuity design (RDD) or difference-in-differencesanalysis (DD) require somewhat more stringent assumptions to generatecredible estimates of causal impacts, they can play a valuable role indeepening our understanding of how reforms work at larger scale. Inthis spirit, we also review studies that have been carried out with careful,nonexperimental designs that attempt to overcome problems incausal inference by using statistical approaches such as instrumentalvariables (IV) or by controlling for observable characteristics through theuse of regression or matching techniques. When carefully done, thesestudies can provide a window into the impacts of a reform programimplemented at large scale and under real-world political and technicalconditions.The availability of a critical mass of studies that rely on rigorous impactevaluation methods allows findings in this book to be implicitly weighted.Evaluations with the highest internal validity weigh heavily in our overallconclusions, but we also consider external validity important. Results froma study that is well designed from a statistical standpoint but whose resultsare valid for only a small—and possibly unrepresentative—population maybe of limited value for education policy makers. Evaluation results from aprogram that has been carefully monitored and “tended” but has littleresemblance to what could be implemented on a large scale may also beless relevant than evaluations of programs implemented systemwide. Oursynthesis attempts to balance these considerations.The central research question in all 22 of the studies we review was“how much does the accountability-linked reform cause student learningto improve?” Thus, valid measurement of student learning was a key concernacross the studies. In the experimental-design (RCT) studies, studentlearning was measured by learning assessments specifically designed forthe evaluation. In some cases, these instruments included innovative features,such as the effort of researchers in Andhra Pradesh, India, to applyboth a standard math and literacy test and “conceptual tests” that challengedstudents to apply the same material in new ways. The objective wasto identify whether students’ improvements reflected true mastery of conceptsor intensified memorization and “teaching to the test.”In other contexts, such as the evaluations in Brazil and Mexico, learningwas measured by national assessments that can be linked to internationalassessments. Across programs and evaluations of this degree of heterogeneity,the only way to describe learning impacts in a uniform way is to presentthem in terms of standard deviations of the administered tests.It is important to keep in mind that a 1.0 standard deviation increase inlearning measured on one test will not reflect the same amount of actuallearning improvement as a 1.0 standard deviation increase on another test.
Motivation and Framework | 25What underlies the measure of a 1.0 standard deviation improvement inlearning outcomes will differ across these studies. Yet the language andframework of what is evaluated remains comparable. In each setting, thestudent assessment instrument was devised to capture the range of learningperformance that is appropriate and expected for children of that age andgrade in that schooling context. In every context, a 0.3 standard deviationimprovement in outcomes will represent significant progress relative to theorder of magnitude of learning improvements more typically observed inthe education evaluation literature, in which a 0.2 standard deviationimprovement is generally considered robust. Thus, with the caveat in mindthat we cannot translate the actual content of a 0.2 standard deviationimprovement in learning from one country context to another, we cancertainly learn from the comparative evaluation of programs that aim togenerate impacts of this size. The following chapters review this evidenceand its implications for the design of accountability-based reforms toimprove education results.Notes1. This comparative research program would not have been possible without thegenerous support of the <strong>Bank</strong>-Netherlands Partnership Program (BNPP) andthe Spanish Impact Evaluation Fund (SIEF).2. A notable exception is Mexico’s Progresa-Oportunidades conditional cash transferprogram, rolled out to the universe of eligible low-income districts over a fiveyearperiod, in which the order of districts’ incorporation in the program wasrandomly assigned.ReferencesAbadzi, Helen. 2009. “Instructional Time Loss in Developing Countries: Concepts,Measurement, and Implications.” <strong>World</strong> <strong>Bank</strong> Research Observer 24 (2): 267–90.Altinok, Nadir, and Hatidje Murseli. 2007. “International Database on Human CapitalQuality.” Economics Letters 96 (2): 237–44.Benveniste, Luis, Jeffery Marshall, and M. Caridad Araujo. 2008. Teaching inCambodia. Washington, DC: <strong>World</strong> <strong>Bank</strong> and Royal Government of Cambodia.Benveniste, Luis, Jeffery Marshall, and Lucrecia Santibañez. 2007. Teaching in LaoPDR. Washington, DC: <strong>World</strong> <strong>Bank</strong> and Lao People’s Democratic Republic.http://siteresources.worldbank.org/INTLAOPRD/Resources/Teaching_In_LaoPDR_Eng.pdf.Björkman, Martina, and Jakob Svensson. 2007. “Power to the People: Evidencefrom a Randomized Field Experiment of a Community-Based MonitoringProject in Uganda.” Policy Research <strong>Work</strong>ing Paper 4289, <strong>World</strong> <strong>Bank</strong>,Washington, DC.
26 | <strong>Making</strong> <strong>Schools</strong> <strong>Work</strong>Carnoy, Martin, and Susanna Loeb. 2002. “Does External Accountability Affect StudentOutcomes? A Cross-State Analysis.” Educational Evaluation and Policy Analysis24 (4): 305–31.Chaudhury, Nazmul, Jeffrey Hammer, Michael Kremer, Karthik Muralidharan,and F. Halsey Rogers. 2006. “Missing in Action: Teacher and Health <strong>Work</strong>erAbsence in Developing Countries.” Journal of Economic Perspectives 20 (1):91–116.Clemens, Michael A., Charles J. Kenny, and Todd J. Moss. 2007. “The Trouble withthe MDGs: Confronting Expectations of Aid and Development Success.” <strong>World</strong>Development 35 (5): 735–51.Commission on Growth and Development. 2008. The Growth Report: Strategies forSustained Growth and Inclusive Development. Washington, DC: <strong>World</strong> <strong>Bank</strong>.Currie, George. 1967. “An Independent Education Authority for Australian CapitalTerritory: Report of a <strong>Work</strong>ing Party (Currie Report).” Department of AdultEducation, Australian National University, Canberra.Das, Jishnu, Stefan Dercon, James Habyarimana, and Pramila Krishnan. 2005.“Teacher Shocks and Student Learning: Evidence from Zambia.” Policy Research<strong>Work</strong>ing Paper 3602, <strong>World</strong> <strong>Bank</strong>, Washington, DC.Di Gropello, E. 2006. “A Comparative Analysis of School-based Management inCentral America.” <strong>Work</strong>ing Paper 72, <strong>World</strong> <strong>Bank</strong>, Washington, DC.Eskeland, Gunnar, and Deon Filmer. 2007. “Autonomy, Participation, and Learningin Argentine <strong>Schools</strong>: Findings, and Their Implications for Decentralization.”Education Economics 15 (1): 103–27.Ferraz, Claudio, Frederico Finan, and Diana B Moreira. 2010. “Corrupting Learning:Evidence from Missing Federal Education Funds in Brazil.” DiscussionPaper 562, Pontifícia Universidade Católica do Rio de Janeiro (PUC-Rio)Department of Economics, Rio de Janeiro, Brazil.Filmer, Deon, and Markus Goldstein. 2010. “The Expenditure Incidence of PublicSpending on Health and Education: An Update.” Unpublished manuscript,<strong>World</strong> <strong>Bank</strong>, Washington, DC.Francken, Nathalie. 2003. “Service Delivery in Public Primary <strong>Schools</strong> in Madagascar:Results of a Budget Tracking Survey.” Public Expenditure Tracking Survey(PETS) study report, Madagascar Country Office, <strong>World</strong> <strong>Bank</strong>, Antananarivo,Madagascar.Fuchs, Thomas, and Ludger Woessmann. 2007. “What Accounts for InternationalDifferences in Student Performance? A Re-Examination Using PISA Data.”Empirical Economics 32 (2–3): 433–64.Galiani, Sebastian, Paul Gertler, and Ernesto Schargrodsky. 2008. “School Decentralization:Helping the Good Get Better, but Leaving the Poor Behind.” Journalof Public Economics 92 (10–11): 2106–20.Government of Tanzania. 2005. Public Expenditure Tracking Survey (PETS) studyreport for the Ministry of Finance, Dar es Salaam, Tanzania.Hanushek, Eric. 2006. “School Resources.” In Vol. 1 of Handbook of the Economics ofEducation, ed. Eric Hanushek and Finis Welch, 866–908. Amsterdam: NorthHolland.Hanushek, Eric, and Margaret Raymond. 2003. “Lessons about the Design of StateAccountability Systems.” In No Child Left Behind? The Politics and Practice of
Motivation and Framework | 27Accountability, ed. Paul Peterson and Martin West, 127–51. Washington, DC:Brookings Institution Press.———. 2005. “Does School Accountability Lead to Improved Student Performance?”Journal of Policy Analysis and Management 24 (2): 297–327.Hanushek, Eric, and Ludger Woessmann. 2007. “The Role of Education Qualityfor Economic Growth.” Policy Research <strong>Work</strong>ing Paper 4122, <strong>World</strong> <strong>Bank</strong>,Washington, DC.———. 2010. “Education and Economic Growth.” In Economics of Education, ed.Dominic J. Brewer and Patrick J. McEwan, 60–67. Amsterdam: Elsevier.Hoxby, Caroline. 2001. “Testing Is about Openness and Openness <strong>Work</strong>s.” HooverDaily Report, July 30.Jenkins, Rob, and Anne Marie Goetz. 1999. “Accounts and Accountability: TheoreticalImplications of the Right-to-Information Movement in India.” Third<strong>World</strong> Quarterly 20 (3): 603–22.Jimenez, E., and Y. Sawada. 1999. “Do Community-Managed <strong>Schools</strong> <strong>Work</strong>? AnEvaluation of El Salvador’s EDUCO Program.” <strong>World</strong> <strong>Bank</strong> Economic Review 13(3): 415–41.———. 2003. “Does Community Management Help Keep Kids in <strong>Schools</strong>? EvidenceUsing Panel Data from El Salvador’s EDUCO Program.” Center forInternational Research on the Japanese Economy (CIRJE) Discussion PaperF-236, University of Tokyo, Japan.Keefer, Philip, and Stuti Khemani. 2005. “Democracy, Public Expenditures, and thePoor: Understanding Political Incentives for Providing Public Services.” <strong>World</strong><strong>Bank</strong> Research Observer 20 (1): 1–28.Khemani, Stuti. 2001. “Decentralization and Accountability: Are Voters More Vigilantin Local than in National Elections?” Policy Research Paper 2557, <strong>World</strong><strong>Bank</strong>, Washington, DC.———. 2007. “Can Information Campaigns Overcome Political Obstacles to Servingthe Poor?” In The Politics of Service Delivery in Democracies. Better Access for the Poor,ed. Shantayanan Devarajan and Ingrid Widlund, 56–69. Stockholm: Ministryfor Foreign Affairs, Sweden. http://citeseerx.ist.psu.edu/viewdoc/download?doi=10.1.1.133.7367&rep=rep1&type=pdf.Kremer, Michael, Nazmul Chaudhury, F. Halsey Rogers, Karthik Muralidharan, andJeffrey Hammer. 2005. “Teacher Absence in India: A Snapshot.” Journal of theEuropean Economic Association 3 (2–3): 658–67.Loeb, Susanna, and Katharine Strunk. 2007. “Accountability and Local Control:Response to Incentives with and without Authority over Resource Generationand Allocation.” Education Finance and Policy 2 (1): 10–39.Loveless, Tom. 2005. “Test-Based Accountability: The Promise and the Perils.”Brookings Papers on Education Policy (2005): 7–45.Majumdar, Sumon, Anandi Mani, and Sharun Mukand. 2004. “Politics, Informationand the Urban Bias.” Journal of Development Economics 75 (1): 137–65.Millot, Benoit, and Julia Lane. 2002. “The Efficient Use of Time in Education.” EducationEconomics 10 (2): 209–28.OECD PISA (Organisation for Economic Co-operation and Development Programmefor International Student Assessment) 2004 Database. http://pisa2006.acer.edu.au/.
28 | <strong>Making</strong> <strong>Schools</strong> <strong>Work</strong>Patrinos, Harry Anthony, Felipe Barrera-Osorio, and Juliana Guáqueta. 2009. TheRole and Impact of Public-Private Partnerships in Education. Washington, DC: <strong>World</strong><strong>Bank</strong>.Paul, Samuel. 2002. Holding the State to Account: Citizen Monitoring in Action. Bangalore,India: Books for Change.Pritchett, Lant, and Deon Filmer. 1999. “What Education Production FunctionsReally Show: A Positive Theory of Education Expenditures.” Economics of EducationReview 18 (2): 223–39.Reinikka, Ritva, and Jakob Svensson. 2005. “Fighting Corruption to ImproveSchooling: Evidence from a Newspaper Campaign in Uganda.” Journal of theEuropean Economic Association 3 (2–3): 259–67.Republic of Kenya. 2005. “Public Expenditure Tracking Survey (PETS) 2004: PreliminaryReport.” Ministries of Planning and National Development, Finance,Health, and Education Science and Technology, Republic of Kenya.Rivkin, Steven G., Eric A. Hanushek, and John F. Kain. 2005. “Teachers, <strong>Schools</strong>,and Academic Achievement.” Econometrica 73 (2): 417–58.Sawada, Y. 1999. “Community Participation, Teacher Effort, and Educational Outcome:The Case of El Salvador’s EDUCO Program.” <strong>Work</strong>ing Paper 307, WilliamDavidson Institute, University of Michigan, Ann Arbor.Sawada, Y., and A. B. Ragatz. 2005. “Decentralization of Education, Teacher Behavior,and Outcomes.” In Incentives to Improve Teaching: Lessons from Latin America,ed. E. Vegas, 255–306. Washington, DC: <strong>World</strong> <strong>Bank</strong>.Vegas, E., ed. 2005. Incentives to Improve Teaching: Lessons from Latin America.Washington, DC: <strong>World</strong> <strong>Bank</strong>.Weisberg, D., S. Sexton, J. Mulhern, and D. Keeling. 2009. “The Widget Effect: OurNational Failure to Acknowledge and Act on Differences in Teacher Effectiveness.”2nd ed. Report of The New Teacher Project, Brooklyn, NY. http://widgeteffect.org/downloads/TheWidgetEffect.pdf.Woessmann, Ludger. 2003. “Schooling Resources, Educational Institutions, andStudent Performance: The International Evidence.” Oxford Bulletin of Economicsand Statistics 65 (2): 117–70.<strong>World</strong> <strong>Bank</strong>. 2003. <strong>World</strong> Development Report 2004: <strong>Making</strong> Services <strong>Work</strong> for Poor People.Washington, DC: <strong>World</strong> <strong>Bank</strong>.———. 2004. “Papua New Guinea: Public Expenditure and Service Delivery(PESD).” PESD study report, <strong>World</strong> <strong>Bank</strong>, Washington, DC. http://siteresources.worldbank.org/INTPUBSERV/Resources/PNG.PESD.Education.Final(G).jun.2004.pdf.———. 2010. <strong>World</strong> Development Indicators 2010. Washington, DC: <strong>World</strong> <strong>Bank</strong>.<strong>World</strong> <strong>Bank</strong>, UNESCO/Pole de Dakar, and Government of Malawi. 2010. The EducationSystem in Malawi—Country Status Report. <strong>Work</strong>ing Paper 182, <strong>World</strong> <strong>Bank</strong>,Washington, DC.Ye, Xiao, and Sudharshan Canagarajah. 2002. “Efficiency of Public ExpenditureDistribution and Beyond: A Report on Ghana’s 2000 Public Expenditure TrackingSurvey in the Sectors of Primary Health and Education.” Africa Region<strong>Work</strong>ing Paper 31, <strong>World</strong> <strong>Bank</strong>, Washington, DC.
2Information for AccountabilityRecent decades have seen an exponential growth in the availability and useof information in the education sector. At the global level, data such asthose compiled by the United Nations Educational, Scientific, and CulturalOrganization (UNESCO) Institute for Statistics (UIS) are covering a greaternumber of countries with regular updates; coverage of 283 indicators compiledby the UIS increased from 45 percent in 1990 to over 64 percent in2009 (Porta Pallais and Klein 2010).Countries are increasingly carrying out national learning assessments,and more countries are participating in regionally and internationallybenchmarked learning assessments. The number of low- and middleincomecountries participating in the Trends in International Mathematicsand Science Study (TIMSS) increased from 15 to 38 between 1995 and2011, and the number participating in the Programme for InternationalStudent Assessment (PISA) increased from 18 to 37 between 2000 and2009. At the same time, Education Management Information Systems(EMISs) are becoming commonplace and are being used for planning andfor programmatic purposes in many countries.All of these data have the potential to be turned into information—information that can be used to leverage change for improved servicedelivery and better learning outcomes. A direct way that information canbe used is as an input into management decisions, both at a national leveland at the level of a particular school. An alternative approach—usinginformation for accountability—aims to change the relationships ofaccountability among the various actors in the education system to changebehaviors and thus improve outcomes.29
30 | <strong>Making</strong> <strong>Schools</strong> <strong>Work</strong>While some approaches focus on generating national-level data tospur debate and motivate change (as described in box 2.1), this chapterfocuses on approaches that have attempted to use information foraccountability at the school level. These approaches include reformsor interventions that generate information on roles and responsibilities,school inputs, outputs, or outcomes and disseminate that informationto local-level stakeholders. In the cases to date, there have been variantsalong a number of dimensions: the content, the level of aggregation,the data collection and compilation, and the way the informationis disseminated. The interventions, however, also have common elements:they involve collecting representative data, compiling and analyzingthose data, and disseminating them.The information disseminated varies from simply reporting test scoresto more comprehensive reporting of students’ socioeconomic characteristics;other measures of performance; students’ and parents’ satisfactionwith the school; school financing; audit findings; and the school’s recordof inputs, or expenditures. This information may be combined in differentways to produce a school report card, a ranking of schools within a geographicarea, a regional or national report card, or simply an article in thenewspaper. Some approaches have focused on simple, easy-to-understandmeasures, while others have tried to adjust for socioeconomic or otherfactors.Once compiled, information can be disseminated directly through meetingswith parents and parent and teacher associations; through notes andreports sent to parents’ homes or, more broadly, through public events withthe relevant government officials; and through public media (radio stationsand newspapers, for example).To date, the specific purpose and audience for information campaignshave varied—with the concomitant variation in content, style, and channelsof dissemination. The main stated goals typically have been to stimulateparental involvement and citizen demand for school performanceand to motivate education reform at multiple levels—school, community,region, and country (Winkler and Sevilla 2004).An important defining feature of information-for-accountability interventionsis that they focus on the use of information, in and of itself, asthe instrument of change. This focus stands in contrast to approachesthat use information as an input into a system of official rewards andsanctions in an incentive-based scheme. These incentives systems are discussedat more length in chapter 4, “<strong>Making</strong> Teachers Accountable.” Thischapter focuses instead on approaches that leverage information to affectthe behavior of households, teachers, and school and local governmentofficials directly. 1
Information for Accountability | 31BOX 2.1Using Aggregated Data for AccountabilityCentral and Latin America: National and Regional Report CardsIn 2001, the Partnership for Educational Revitalization in the Americas(PREAL) launched a report card initiative in several Central and LatinAmerican countries (Ortega 2006). PREAL report cards use countryleveldata on key education indicators and regional aggregates to providereliable and detailed information on the state and progress ofeducation in a country (or region) as a whole. The purpose is to remindgovernments that their work in education is being monitored and reportedto leaders outside the education sector; to give more controlover education to civil society and create a demand for information;and to foster dialogue, set priorities, and identify and evaluate policiesto improve schools.PREAL report cards are short, nontechnical summaries that presentinformation under three headings: results, reforms, and recommendations.The report cards present data in ranked order and include statisticalannexes with supplementary information. In addition, PREAL usesradio and television to disseminate findings more widely and to reachparents and school staff outside main cities. PREAL currently producesa Latin American report card, a Central American report card, andnational-level report cards in 10 countries. Common parameters areestablished for all report cards to ensure comparability. Anecdotal evidencesuggests that the PREAL report cards have increased publicawareness about the performance of their countries’ education systems.Southern and Eastern Africa: Consortium for Monitoring EducationalQualityIn the mid-1990s, the International Institute for Education Planning(IIEP) and a number of ministries of education in southern and easternAfrica launched an initiative known as the Southern and Eastern AfricaConsortium for Monitoring Educational Quality (SACMEQ). The purposewas to build the capacity of organizational providers and policymakers to monitor and evaluate basic education systems. Activitieshave concentrated on providing hands-on experience in applyingmodern survey research methodologies, collecting and analyzing data,producing data archives, and preparing and disseminating nationalevidence-based education policy reports. To date, three large-scale,cross-national studies have been produced. Findings have been widelydisseminated among policy makers in the member countries. The(continued next page)
32 | <strong>Making</strong> <strong>Schools</strong> <strong>Work</strong>BOX 2.1 continuedreports have played an important role in national debates concerningpolicies to improve the quality of education. Moreover, SACMEQ hasbecome an important source for training in quantitative researchmethods in the region (Ross 2006).International Comparisons: TIMSS, PIRLS, and PISAOver the past decades, a series of international assessments has beendeveloped to allow participating nations to compare students’ educationachievements across borders and, hence, quality differentialsacross education systems worldwide. The International Association forthe Evaluation of Educational Achievement (IEA) administers two ofthese standardized assessments: the Trends in International Mathematicsand Science Study (TIMSS), which tests knowledge of fourthandeighth-grade students in math and science, and the Progress inInternational Reading Literacy Study (PIRLS), which tests readingachievement of fourth graders. TIMSS was first administered in 1995and conducted every four years thereafter, whereas PIRLS was firstadministered in 2001 and conducted every five years thereafter. Havingtheir basis in the curricula of schools in tested countries, these testsaim to investigate three aspects: the intended curriculum, the implementedcurriculum, and the achieved curriculum.A similar exercise, which emphasizes problem-solving skills ratherthan curriculum, is the Programme for International Student Assessment(PISA). PISA was first carried out in 2000 by an internationalconsortium of research and education institutions led by the AustralianCouncil for Educational Research (ACER). Since then, it has continuedto be implemented every three years by the Organisation for EconomicCo-operation and Development (OECD). The subject of focus inPISA is rotated in each cycle: first, reading literacy; next, math andproblem solving; and finally science literacy. Nevertheless, in eachround, tests are administered in all subjects.Outputs of these assessments are rankings of aggregate countryperformance and a series of reports, which typically receive considerableattention in the media and among educators and researchers.Overall, standardized international assessments provide an empiricalbase to hold organizational providers and policy makers accountable,as they present the relative performance of the education system theymanage over time and with respect to other countries. As a result, theassessments increase transparency and give more control over educationto citizens/clients.
Information for Accountability | 33How Information Can Increase Accountability—andOutcomesWhen parents and students have little information about the performanceof the schools they have access to, or when they have little informationabout the inputs that schools are responsible for using, their position relativeto service providers is weak. They have limited basis for selectingbetween schools; they have limited ability to hold schools and teachersaccountable for either effort or efficiency in the use of resources; and theyhave limited empirical foundation to lobby governments, both national andlocal, for improvements in public support to their schools. In the terminologyof the <strong>World</strong> Development Report 2004, lack of information weakens clientpower (to hold providers accountable), and it weakens citizens’ voice (relativeto policy makers and politicians) (<strong>World</strong> <strong>Bank</strong> 2003). Figure 2.1 illustratesthe accountability framework based on this dynamic.There are three main accountability channels through which informationcan be expected to affect learning outcomes: increasing choice, participation,and voice. An alternative channel for information to affect outcomes isthrough its use in management.Increasing ChoiceIn many—although certainly not all—school systems, students face a choiceof schools. This choice may be between public schools, but it is oftenbetween public and private schools. Indeed, in some countries such asFigure 2.1 The Role of Information in the Accountability Frameworkthe statepoliticians policy makersvoice/politicscompact /incentivescitizens/clientsnon-poor poorclientpowerprovidersfrontline organizationsSource: <strong>World</strong> <strong>Bank</strong> 2003.Note: Arrows outlined in gray designate where information-based interventions affectrelationships of accountability in education.
34 | <strong>Making</strong> <strong>Schools</strong> <strong>Work</strong>Chile, Pakistan, and Zimbabwe, more than 50 percent of primary studentsattend private schools (Glewwe and Kremer 2006). When school performanceinformation was provided to low-income parents in one U.S. setting,parents used this information to select higher-performing schoolswhen faced with a choice of schools—and that translated into higher studenttest scores (Hastings and Weinstein 2008). The extent to which suchinformation is a factor will crucially depend on the degree of effectiveschool choice in any particular setting.In addition to optimal student-school matching, in contexts with schoolchoice, information may work to increase competition among schools. Tothe extent that funding follows students—either through public fundingformulas or through private fees—schools may compete to attract students.2 Therefore, by making information readily available, schools maywork to improve quality to draw in more students and thereby boostincome. This improved quality would then be reflected in measures oflearning outcomes.Increasing ParticipationSchool choice is only one mechanism by which information for accountabilitycould lead to improved outcomes. Lack of knowledge about schoolperformance may cause parents to believe that performance is adequateand prevent them from demanding improvements (Winkler and Herstein2005). By revealing shortfalls—relative to other schools in the village,district, province, or country—information can be a motivator for actionon the part of parents and other stakeholders. Indeed, some informationfor-accountabilityinterventions include social mobilization efforts toleverage the information for closer monitoring of school performance andservice delivery.One of the crucial roles for information in this channel is providing credibleevidence on school performance. This evidence can underpin pressurefor improvements in school quality and be one source of information formonitoring that quality. Parent participation and oversight potentiallyenables closer monitoring of resource allocation—ensuring alignmentbetween what parents want (which may include higher test scores) and theway resources are deployed. Participation also enables closer monitoring ofeffort on the part of teachers and other educators. 3 Both of these results—better deployed resources and greater effort—are, in turn, inputs intohigher learning outcomes.There are also “softer” reasons why information might positively affectschool processes and outcomes. Because information-for-accountabilitycampaigns may promote dialogue and consultation among all actors, theycan potentially alleviate information asymmetries and promote discussion
Information for Accountability | 35and communication, all of which might result in an environment moreconducive to learning.Increasing VoiceIn the context of decentralized service delivery, the idea of access to informationas a critical element to reduce the extent to which the rich can“capture” services (that is, structure delivery systems such that the richbenefit disproportionately) and thereby improve delivery for the poor hasstrong theoretical foundations (Bardhan 2002; Bardhan and Mookherjee2000, 2005). Information provides transparency to government actionsand the political process, and that transparency may promote better policiesand improve outcomes.But there is a more general way in which information can work throughlocal (and even national) governments to improve learning outcomes. Byproviding credible evidence, information could allow parents and otherstakeholders to effectively lobby governments for improved policies. It providescontent to the voice that citizens might use to pressure governmentsand enables them to hold those governments to account. While we focusin this chapter on school- and local-level approaches, one can also interpretnational-level information generation and dissemination as a way ofleveraging information for accountability by strengthening voice.Internationally, regionally, or even nationally benchmarked assessmentsystems—such as PISA, TIMSS, the Southern and Eastern AfricaConsortium for Monitoring Educational Quality (SACMEQ), or the U.S.National Assessment of Educational Progress (NAEP) all provide aggregateassessment data that can be used to promote the public accountability ofeducation systems. Likewise, internationally comparable national “reportcards” such as those developed in Latin America by the Partnership forEducational Revitalization in the Americas (PREAL) have leveraged summariesof a variety of data to promote debate and pressure for reform, asdescribed in box 2.1.In addition to empowering citizens’ voice, information can be leveragedfor political change through a competitive electoral process. Indeed,the political “market” is characterized by incomplete information, andthe generation and provision of information can fill that void (Keeferand Khemani 2005). Moreover, systematic bias in the availability ofinformation (for example, better information in urban areas than inrural areas) can lead to systematic bias in the provision of public services(Majumdar, Mani, and Mukand 2004). To the extent that local (oreven national) politicians might run on a platform of service deliveryperformance, credible information can potentially drive the politicaldebate. Improvements in indicators thereby become both the basis for
36 | <strong>Making</strong> <strong>Schools</strong> <strong>Work</strong>political argument and a measure of administrative performance(Khemani 2007).Using Information for ManagementThe focus in this chapter is on the use of information per se as anaccountability tool. However, perhaps one of the more straightforwarduses of information is to enable better decision making by managers. Ininformation-poor environments, access to better information could helpdirect resources where they are most needed and enable managers to betterunderstand whether the allocations they are making are achievingdesired results. Being effective in this context does not involve informationto leverage accountability but rather information to be used as aninput into technocratic decisions. Box 2.2 discusses two recent evaluationsthat tested whether school-level and school-specific informationprovided to school administrations affected outcomes—with modestimpacts in one case (Madagascar) and no impacts in another (AndhraPradesh, India).Another way that information can be used for management is as aninput into a strong accountability system. As discussed in more detailbelow, this is the way that information is used in the U.S. model under theNo Child Left Behind Act (NCLB). In that system, detailed, school-specificinformation on the performance and performance gains of students andsubgroups of students is measured. <strong>Schools</strong> that fail to meet performancetargets are subject to various sanctions, depending on how far short of thetargets they fall and how long they have failed to meet them. Sanctionsrange from a requirement to develop a school reform plan, to a requirementto allow students to transfer to other schools, to a requirement tocompletely restructure (that is, to close and reopen under new managementand staff). Information in this type of system is not being used for itsintrinsic contribution to the promotion of accountability but rather as partof a strategy of incentives.From Information to OutcomesEven though education interventions are typically justified on the basis ofjust one of these channels leading from information to outcomes (increasingchoice, participation, or voice), any specific intervention probablyworks through multiple channels. For example, school-specific informationmay promote more informed choice—but could also enable more, ormore effective, participation and monitoring on the part of parents. Orcredible information may enable parents to effectively pressure both schoolsand local governments.
Information for Accountability | 37BOX 2.2Using Information for ManagementThis chapter focuses on interventions that have aimed to leverage informationfor accountability, for change, and for improved outcomes.But another approach would be to view information as a managementtool—as an input into school-level decision making without bringing tobear the accountability aspect. Two new field experiments have evaluatedthe potential for this approach, with mixed findings.The first study is in Madagascar, where a set of tools was distributedto 909 randomly selected schools, including 303 randomly selectedcontrol schools (Lassibille and others 2010). The interventionconsisted of a management toolkit and guides, training, and “reportcards” for school directors and subdistrict- and district-level officers.The intervention ran for two school years, 2005 to 2007, and baselineand follow-up data were collected, including test scores fromstandardized tests in three subjects. The program showed quitelarge impacts on behaviors: the share of teachers who completed all“key” tasks increased from 42 percent to 63 percent, and the shareof schools in which all teachers performed all “key” tasks rose from22 percent to 43 percent. In addition, there were statistically significant,albeit small, impacts on student attendance and repetition. However,the impact on student learning was small and not statisticallysignificant.A second study focused on diagnostic feedback to teachers andlow-stakes monitoring of classroom processes in the Indian state ofAndhra Pradesh (Muralidharan and Sundararaman 2010). a A set of 100schools were randomly selected to receive the treatment, which consistedof the following:• An independently administered baseline test• A detailed, written diagnostic feedback report on the performanceof students at baseline• A note on how to interpret the feedback report along with benchmarks• An announcement that students would be retested at the end of theyear to monitor progress• Six low-stakes monitoring visits during the year to observe teachingprocesses and activity.An additional set of 300 schools were randomly selected to serve ascontrol schools. These control schools received one unannouncedvisit during the school year in which data on teacher absenteeism(continued next page)
38 | <strong>Making</strong> <strong>Schools</strong> <strong>Work</strong>BOX 2.2 continuedand classroom behavior were collected. To minimize the potential forcontamination, these schools received only one week’s notice beforeendline testing occurred in those schools. The study found substantialimpacts on behaviors—as observed during the visits—in thetreatment schools: teachers were more likely to be observed activelyengaged in teaching, using textbooks, engaging students, and usingthe blackboard. In addition, they were more likely to assign homeworkand to provide guidance on that homework. However, studentsin these schools did no better on independently administered teststhan students in schools that did not receive the program.a. This study was a corollary to a teacher incentives and school grant study,which is described in more detail in chapter 4, “<strong>Making</strong> Teachers Accountable.”Information for Accountability in High-Income CountriesReforms in the United StatesIn the 1990s, the education sector in the United States experienced a largescaleincrease in test-based accountability in which school- and teacher-levelincentives were based on pupils’ test scores (Loveless 2005). By 2001, onlytwo states did not have any measurement or accountability system in placein the education sector (Hanushek and Raymond 2003). Seventeen stateshad report cards at the school or district level, which provided limitedinformation on school performance. The remaining states had implementedsystems with simple performance measures that rated performanceas acceptable or unacceptable. In many states, these data systems wereaccompanied by explicit sanctions or rewards, but the extent to whichschools performing below standard would receive any sanction from stateauthorities varied. In some states, the model was close to what is beingdescribed here as information for accountability—commonly referred to as“school report cards” in the U.S. system.These early accountability systems paved the way for passage of federallegislation, the No Child Left Behind Act, in 2001. NCLB solidified both thetest-based information systems and the strong accountability measures thatflowed from them. The Act mandated state-approved student assessmentin mathematics and reading skills as well as the production and distributionof school-level reports—broken down by student sociodemographic background.
Information for Accountability | 39Much of the work on the effectiveness of these test-based accountabilityapproaches is based on the cross-state variation that existed beforeNCLB. Some national-level studies have found significant improvementsin student outcomes as a result of standardized-test-based accountability(Carnoy and Loeb 2002; Hanushek and Raymond 2005), although thelimited number of observations these studies are based on introduces someuncertainty. State-specific analyses produce ambiguous results. Whilesome analyses document positive short-run effects of accountability onstudent math scores (Figlio and Rouse 2006; West and Peterson 2006;Chakrabarti 2006), other results have been less compelling (Clark 2003;Haney 2000, 2002).Intriguingly, from the perspective of purely information-based approaches,some findings suggest that simply reporting information about averageschool test scores led to increased performance (Hoxby 2001, Hanushek andRaymond 2003). The results, however, are sensitive to how sanctions aremeasured and are not robust across specifications (Hanushek and Raymond2005).More recent work has begun to assess the impact of NCLB itself. Anecdotalreports have suggested that the NCLB report cards raise public awarenessand civic involvement when schools fall into one of the several “watchlist” categories (Loveless 2005). More systematic work (based on nationaldata exploiting the fact that some states in which NCLB was implementedalready had similar programs in place whereas others did not) has documentedsignificant gains in math test scores (Dee and Jacob 2009). A recentpaper that investigated principals’, teachers’, and students’ behavioralresponses to the pressures introduced by Florida’s education accountabilitysystem showed that schools focused on low-performing students by reorganizingteachers’ and students’ time and increasing the learning resourcesavailable to teachers (Rouse and others 2007). These responses haveresulted in test score gains in reading and math.Reforms in the United KingdomIn the United Kingdom, the government introduced greater accountabilityinto the government-funded school sector in 1988. <strong>Schools</strong> are requiredto publish information about their students’ performance on national testassessments at different ages in primary and secondary school. For example,public junior high schools are required to make available the proportionof students achieving a certain number of exam passes at a certainlevel. These data are compiled and published by the government and arealso used by the media to rank schools in nationally published school“league tables.”
40 | <strong>Making</strong> <strong>Schools</strong> <strong>Work</strong>These rankings are then used by central government to sanction poorlyperforming schools. This sanction takes the form of “naming and shaming”but can also involve the replacement of school management—or evenschool closure, in extreme situations. In addition, the information can beused by parents in choosing a school for their child. Poorly performingschools may lose students (which leads to a reduction in resources because,to an extent, public funds follow the students), while high-performingschools may gain pupils.Moreover, since the early 1990s, all English state schools have beeninspected by an independent government agency, the Office for Standardsin Education (Ofsted). There have been two rounds of inspection over thecourse of the first 10 years of this policy, through which most schoolshave been inspected. Starting in 2000, Ofsted produced ratings of schoolsconsisting of two elements: (1) test scores combined with backgroundcharacteristics and (2) qualitative evidence from the inspector reports. Aschool report for each school is also produced and publicly released immediatelyafter the inspection. 4 If a school fails the Ofsted standards, the localeducation authority can apply sanctions. These schools are also subject torepeat inspections and greater scrutiny. In turn, the governing board ofthe school can remove the school principal.Assessments of the impact of these reforms suggest improvement in rawexam scores. However, it is not clear to what extent such apparent improvementsare due to a change in performance as opposed to either changes inthe difficulty of the tests (Goldstein 2001; Tymms and Fitz-Gibbon 2001) orother schools’ responses (some perhaps salutary such as extra focus on studentswith difficulties, some detrimental such as excluding weak studentsfrom examinations). Evaluation is also hampered by the fact that otherreforms were implemented simultaneously, and it has been difficult to isolatewhich elements of the set of reforms introduced have had an impact onoutcomes (Bradley and others 2000).One study that has attempted to address these issues focuses on theimpacts of the accountability measures on the distribution of studentachievement within schools (Burgess and others 2005). The analysis foundthat the performance of marginal students (those on the threshold of meetingthe performance benchmark that feeds into the information system)improved but only when schools faced competition for students. Whenthere was no competition, these marginal students appeared to do no better.Worryingly, the study found that low-ability students fared particularlybadly under the reform, especially when a large number of students wereon the margin of meeting the threshold. While the magnitude of the effectswas small, the authors concluded that schools did react in the short run tothe incentives created by accountability measures—although not always tothe benefit of all students.
Information for Accountability | 41Reforms in New ZealandNew Zealand has introduced large institutional reforms to promoteinformation for accountability. To make sure that front-line providers anddecision makers act on the information generated, the governmentestablished an independent body: the Education Review Office (ERO). TheERO assesses individual schools approximately once every three yearsunless the performance of a school or service is so poor that it places theeducation or safety of the students at risk. 5 Reports on individual schoolsare freely available to the public: they are either posted online or on theschool walls, or they are distributed in the school. The focus of theassessments is on school improvement and on making recommendations toindividual boards of trustees concerning what they are doing well andwhere they need to improve.The focus of the school reforms in New Zealand was on empoweringschool boards and providing them with information for management aswell as introducing school choice into the education system. One assessmentfound that most schools did actively share the information with stakeholders(ERO 2007). While there have been assessments of the perceptions of thereforms on stakeholders (for example, Wiley 1999 on information andLadd and Fiske 2003 on choice), there have been no studies evaluating thereforms’ overall effect on test scores.Information for Accountability in MiddleandLow-Income CountriesThe accountability reforms in high-income countries, often accompaniedby information-for-accountability campaigns, provide insights into theissue for middle- and lower-income countries. However, there are twomain shortcomings that these experiences have for illuminating the issue inthe developing-country context. First, these campaigns were typicallyembedded in larger, multifaceted reform efforts. For example, theexperience in those U.S. states that implemented low-stakes school reportcards come closest to the notion of information for accountability that is thefocus here. However, these initiatives were soon overtaken by events, inthe form of the high-stakes national NCLB reform. Of course, a moregeneric concern is the extent to which lessons from such different contextsmight be relevant for substantially poorer countries.There have been attempts to generate and disseminate information toimprove the quality of service provision in developing countries. Often,these efforts outside of the education sector have explicitly aimed atmobilizing social action through the use of “citizen report cards,” as
42 | <strong>Making</strong> <strong>Schools</strong> <strong>Work</strong>discussed further in box 2.3. Only recently has there been a systematicapproach to evaluating the impact of those interventions using anexperimental or quasi-experimental counterfactual. Before turning to themore rigorously evaluated cases (in the later section about impactevaluations), this section focuses on descriptive accounts of interventionsthat have been tried in developing countries. The discussion is organizedaround three main approaches to the use of information: school-levelreport card programs, test-based score rankings, and participatory publicexpenditure or input-tracking interventions.School-Level Report CardsWhen thinking about information for accountability, school-level “reportcard” interventions come closest to the notion of creating and generatinginformation that can be used by parents to make better choices and canempower them to participate more effectively in school management orlobby local governments for action. This section describes five cases inwhich such an approach was used.Brazil: Paraná state school report cardPerhaps one of the most concrete and clear examples of a large-scaleinformation-for-accountability intervention in education in a developingcountry was in the Brazilian state of Paraná, which experimented withschool report cards between 1999 and 2002 (Winkler 2005; Brooke 2005).The stated goals of the initiative were to increase parental knowledgeabout the quality of instruction in schools and to raise parents’ voice inschool matters at the school council and state levels. The initiative alsoaimed to increase awareness among school personnel about their schools’instructional quality and academic performance.The report cards combined the following school data:• Test-based performance (fourth- and eighth-grade test scores)• Student flows (promotion, retention, and dropout rates)• School characteristics (average class size and teachers’ qualifications)• Parental opinion and satisfaction with several aspects of the school(facilities, security, teaching practices, quality of education, and parentalinvolvement)• Parental opinion on the availability of information on school performanceand activities.The cards also contained comparative municipal and state averages formost of the key indicators so that parents and teachers could compare the
Information for Accountability | 43BOX 2.3Citizen Report CardsThe notion of creating an information feedback loop—connecting thepublic service users, providers, and public-policy principals—cutsacross sectors.India: Citizen Report Cards in BangaloreIn 1994, a small nongovernmental organization (NGO) group launcheda survey to gather feedback on several public services, including education,in Bangalore (Paul 2002; Bures 2003). Data on service quality,corruption, and satisfaction with public services were collected fromnearly 1,200 middle- and low-income households and structured into a“report card.” The report card gave low ratings to all major serviceproviders and showed high levels of client dissatisfaction with staffbehavior in the provider agencies. It also showed that clients had toincur high direct costs (bribes) and indirect costs (individual investments)to compensate for missing or unreliable services. The findingsof the report card were widely publicized through the press and discussedwith the service providers, which created a sense of shame.Some of the providers acknowledged problems and took correctiveaction. Moreover, the growing public interest in the initiative led to theconstitution of a nonprofit body, the Public Affairs Center (PAC), tomanage and expand the report card initiative and provide advice toservice providers on ways to improve. In 1999, a second PAC reportcard indicated mild improvements in services but also an increase incorruption. In the education sector, for example, while 30 percent ofthe households noted an improvement in school infrastructure, another50 percent felt that school facilities, materials, and equipment had notchanged. This time, the findings from the report card were first sharedwith management teams from selected agencies and then disseminatedin public discussions involving citizen groups, the media, and leadersand staff of all the service providers. In these meetings, the headsof the agencies explained their plans to deal with the reported problems.These events and the report card findings were also covered inthe news media. Another report card in 2004 revealed substantial improvementin citizen satisfaction in almost all services and some declinein corruption.Following the Bangalore experience, citizen report cards haveevolved into a widely used tool for improving service delivery. Theyhave been scaled up to cover urban and rural services in 24 statesin India and have also spread to several cities in Albania, Kenya,(continued next page)
44 | <strong>Making</strong> <strong>Schools</strong> <strong>Work</strong>BOX 2.3 continuedMozambique, the Philippines, South Africa, Uganda, Ukraine, and—on a pilot basis—Vietnam.Ukraine: Ternopil and Ivano-Frankivsk Citizen Report CardsIn the Ukrainian cities of Ternopil and Ivano-Frankivsk, the People’sVoice Project started in 1999 to promote public participation to build anopen, accountable, and effective local government in several cities(Bures 2003). Household and entrepreneur surveys revealed widespreaddissatisfaction with service quality. However, only 93 percent ofthe citizens had ever filed a complaint because they believed that doingso would be futile. Dissemination and public discussion of the surveyfindings led citizens, NGOs, and public officials to engage in several actionsto improve public services. In the area of education—identified asa primary concern area—yearly education plans and education advisorycouncils were established to create an action plan for further educationreforms.The Philippines: Pro-Poor Services Report CardsGovernments can also use report cards to bring citizens directly intothe budget allocation process. For example, the Philippine governmentused findings from the Report Card on Pro-Poor Services to developnew poverty alleviation strategies and programs (Bhatnagar and others2003; Bures 2003). The survey was conducted in 2000 by the <strong>World</strong><strong>Bank</strong> in collaboration with Social Weather Stations, an independentsurvey research organization in the Philippines. The survey included1,200 households across four regions. It collected data on awareness,access, use, and satisfaction related to public services in five areas:health care, primary education, housing, water, and subsidized ricedistribution. On education, the report card collected and disseminateddata on school enrollment, dropout rates, perceived quality, tuitionfees, class size, textbook availability, and parent-teacher associations.The feedback showed a high degree of dissatisfaction with the educationsystem among the poor, resulting in relatively low enrollment inprimary school (90 percent for 7- to 12-year-old children) and substantialdropout rates.Uganda: Health Citizen Report CardsIn Uganda, citizen report cards focused on health service delivery wererandomly assigned to 50 rural communities across nine districts. In 25treatment communities, the quantitative information collected in thehealth citizen report cards was disseminated together with practical(continued next page)
Information for Accountability | 45BOX 2.3 continuedinformation on how to best use this information in meetings betweenusers and providers. A separate set of communities served as controlareas. Impact estimates of treatment show that the intervention improvedaverage health care use, increased infant weight, and reducedchild mortality among children under five (Björkman, Reinikka, andSvensson 2006; Björkman and Svensson 2007). The studies also foundevidence that staff in treatment communities increased efforts in healthprovision as a result of the increased community monitoring. In particular,staff in treatment clinics began to share information about treatmentpractices, availability of drugs, and service delivery in general.There was no evidence of increased government funding (financial orin-kind) or investments.performance of their schools with that of neighboring schools. This relativelysimple, three-page summary of indicators was disseminated to parentsand teachers through various local-level workshops. Results were alsopublished in the state education secretariat’s monthly newsletter andwidely disseminated through press releases and press conferences.While no rigorous evaluations of this experiment exist, anecdotal evidencesuggests positive effects. Parents engaged in discussions with teachersabout how they might improve school performance and, throughschool councils, increased their voice in policy debates about education(Winkler 2005). The report cards also acted as a management tool at theschool level and as a driver of wider education reforms (Winkler andSevilla 2004). One of the key aspects highlighted in reviews of the interventionis that the low-stakes nature of the report cards helped make thempolitically feasible despite a strong teachers’ union (Winkler 2005; Brooke2005). Nevertheless, a change of state government at the end of 2002—when a new state secretary for education was inaugurated—led to abandoningthe innovation.Central America: CERCA school report cardsMore recently, starting in 2004, the Civic Engagement for Education Reformin Central America (CERCA) began implementing a school-level reportcard model that combines information reporting with a proactiveparticipatory approach to school priority setting (Flórez, Chesterfield, andSiri 2006). Elected representatives of various stakeholders, parents, teachers,principals, students, and community leaders were involved in collectingdata and producing the school report card using simple indicators on school
46 | <strong>Making</strong> <strong>Schools</strong> <strong>Work</strong>characteristics, coverage, efficiency, quality of teaching, and learning.Subsequently, the group was tasked with a self-assessment exercise toanalyze the report card and to develop, implement, and monitor actions toimprove learning outcomes. 6 The school report card and action plan werethen disseminated and discussed within the entire school community.The model was implemented on a small scale—36 schools in poor andmostly rural areas of the Dominican Republic, El Salvador, Guatemala,Honduras, and Nicaragua. Again, the lack of a carefully constructed counterfactualand, in this case, the small scale of the intervention make it hardto draw strong conclusions. The anecdotal reports from the case studiesstate that, compared with nonparticipating schools with similar profiles,participating schools experienced higher involvement of community membersin school activities. CERCA-participating schools were also more likelyto have developed and implemented an action plan, and parents becamemore engaged in promoting reading and writing, even when they wereilliterate themselves (Flórez, Chesterfield, and Siri 2006). Those whoreviewed the intervention also highlighted its low cost and potential forsustainability (Flórez, Chesterfield, and Siri 2006).Sub-Saharan Africa: School Profiles, Report Cards, and Self-AssessmentsThe approach of collecting information and disseminating it to parents as away of promoting their participation in school-level decision making hasbeen tried in several Sub-Saharan African contexts. The following describesjust three of these interventions.School profiles in Uganda. Uganda’s Ministry of Education reforms, launchedin 2001, included the overhaul of its Education Management InformationSystem. One reform was to provide feedback from EMIS in the form of“school profiles.” These profiles were reported to have been well receivedby headmasters and to have provided useful input in the headmasters’ discussionswith parent-teacher associations and elected officials. The profileshave also been credited with positively altering the community mind-setregarding education provision. Additionally, school profiles were intendedto reassert a form of soft vertical accountability by signaling to schools howmuch the central government knew about them (Cameron, Moses, andGillies 2006).School report cards in Kano State, Nigeria. Communities in Kano State receivedschool report cards that included basic information about their schools (Winklerand Herstein 2005). The reports included easy-to-interpret graphs thatshowed how school-specific indicators compared with local-area and statewidedata. The dissemination included radio debates in which specialistsdiscussed the indicators and what they meant. Anecdotal reports suggest
Information for Accountability | 47that the information was being used by stakeholders and increased transparencyin the management of the system. It also helped strengthen the almostnonexistent accountability links between the communities and schools aswell as between the central and local governments.A school self-assessment system in Namibia. Another experience in six northernregions of Namibia involved parents and school councils in the writing oftheir own report cards and school improvement plans (Gillies 2004). Thesystem was designed to foster school-level discussion on school climate,management and planning, teacher attitudes, availability of inputs, continuousassessment, parental activities, and school support for parentalinvolvement. A team of inspectors used the same indicators to provide analternative assessment. The school report cards were disseminated to aschool management team made up of teachers, parents, and supervisors.Findings from the school assessment were also summarized at the regionallevels and used as a diagnostic tool for management at these levels. Anecdotalreports suggest that the initiative succeeded in mobilizing parents,communities, and schools to participate in the work and management oftheir schools. It also helped contribute to the creation of meaningful andcommon standards of performance and expectations. 7Test-Based RankingsWhile ranking schools based on test scores, as an accountability measure,originated largely in the United States, two developing countries have triedto use a similar approach: Brazil and Chile (the latter discussed in thesection below about impact evaluations).Ceará state’s new millennium school prizeSince 1992, the Brazilian state of Ceará has publicly rewarded the bestperformingschools with its New Millennium School Prize (Brooke 2005).All schools in the state are ranked according to the raw average performanceof their fourth- and eighth-grade students in math and Portuguesestandardized tests—an approach that does not account for variations instudent background. While awards are given to both school personnel andthe best-performing students, the main stated goal is to promote publicrecognition of high-performing schools. To date, there has been no rigorousevaluation of whether the program has been effective.Rio de Janeiro state’s new school programThe state of Rio de Janeiro, since 2000, has attempted to build on thisapproach with its New School Program (Brooke 2005). Longitudinal dataon students’ test scores in math and Portuguese and on students’
48 | <strong>Making</strong> <strong>Schools</strong> <strong>Work</strong>characteristics are used to construct a measure of individual value-addedperformance, conditional on observable indicators. An aggregate schoolefficiency index is constructed by combining this information with data onstudent flows (such as progression rates and age-grade distortion rates) andschool management. Within homogenous socioeconomic groups—basedon students’ mean family income—schools are ranked. Teachers andprincipals in the highest-ranked schools receive monetary rewards. Noevaluation of this program has occurred.Public Expenditure and Input TrackingThe discussion and cases so far have focused on approaches built aroundinformation about school-level performance. Another way that informationhas been used to increase accountability—with the goal of increasinglearning outcomes—is through its role in promoting public resourcetracking. Leaks in the flow of funds or in-kind resources—such that littlereaches front-line service providers—have been documented in manysettings (<strong>World</strong> <strong>Bank</strong> 2003). Publicly disseminating school-specificinformation on what resources to expect—thereby mobilizing communitiesto monitor the resource distribution—has been tried as an approach toreducing these leaks. Two notable experiences with this approach occurredin the Philippines and Uganda (the latter discussed below in the sectionbelow on impact evaluation).The Philippines: Textbook Count 1-2-3The Textbook Count 1-2-3 program in the Philippines was instituted tocombat corruption that had been documented at various levels of thePhilippine education sector at the end of the 1990s (Leung 2005; vander Linden 2007). Basic inputs, such as textbooks, were not reachingstudents—resulting in serious shortages at the school level—and thosetextbooks that were delivered were of substandard quality. According tosome studies, bribes in the provision of learning materials ranged from 20percent to 65 percent of the value of the contracts. Contractors werealleged to be charging the Department of Education for nonexistentdeliveries of books and then splitting payments with the officials whoapproved the invoices.Following a change in government in 2001, the school textbookprovision system was reformed. Starting in 2003 and for three yearsthereafter, the Textbook Count 1-2-3 program published a detailed list ofwhen textbooks were going to be delivered in each province. These listswere widely published in newspapers and “socialized” through meetingswith teachers, government officials, and NGOs. The meetings covered thenumbers and quality of textbooks, the specific delivery methods, and the
Information for Accountability | 49schedules, which took into account the geographical peculiarity of eacharea—an important consideration given the nature of the country as anarchipelago. In addition, the initiative engaged and trained a variety oforganizations such as parent-teacher associations and local NGOs to verifyand report on the delivery of the textbooks.Although no systematic data have been gathered on the process andfinal outcomes, anecdotal evidence suggests that the program was successfulin reducing corruption. By 2005, all textbooks produced were delivered(compared with an estimated loss of 40 percent in 2001), textbook priceswere reduced, and quality standards reportedly improved. Recent efforts toinstitutionalize and sustain the initiative have included creating a legalframework, ensuring its financial sustainability, and expanding it to otherprocurement areas such as school buildings and furniture.Evaluating the Impact of Information-for-AccountabilityInterventionsMost of what we know about the impacts of information-for-accountabilityreforms in developing countries comes from small pilots and case studies,such as those described above. This largely qualitative and anecdotalevidence suggests that information-for-accountability reforms might havepositive impacts: greater collaborations and better communications betweenparents and teachers, improved parental participation in school matters,better and more frequent data reporting mechanisms, better resource flows,and some suggestion of improved education outcomes.Evaluation Analysis to DateHowever, these descriptive analyses and case studies fall short of what onewould want as an evidence base for strongly advocating these types ofreforms, for the following reasons:• Each intervention has been custom-designed for the specific setting. Thisis obviously appropriate; it would be unreasonable to apply a standardizedapproach. But site-specificity makes it is hard to draw any generalconclusions.• Many of the interventions have been implemented on a small scale—forexample, the CERCA school report cards implemented in 36 schools inCentral America.• The indicators used vary substantially—from self-assessments in theNamibia case to sophisticated institutionalized assessment systems inBrazil.
50 | <strong>Making</strong> <strong>Schools</strong> <strong>Work</strong>• None of these cases attempts to establish a rigorous counterfactual—what would have happened in the absence of the intervention. Withoutsuch a counterfactual, it is impossible to attribute changes in outcomesto the interventions themselves. 8Two existing studies have tried to establish causality using nonexperimentalapproaches: evaluations of Chile’s test-based school rankings and ofUganda’s newspaper campaign.Chile: School rankingsChile has a long-standing history of publishing average test scores by school,a practice that has established the country as a regional leader in the applicationof standardized achievement tests and the dissemination of theirresults. Moreover, Chile has one of the most liberalized school markets inthe world since the introduction of a series of school finance reforms in1981—the best-known of which is an extensive education voucher system.In 1988, the Sistema Nacional de Medición de la Calidad de la Educación(National System for Measuring the Quality of Education, or SIMCE) wasestablished and, since the mid-1990s, its results have been widely disseminated,in part through newspaper listings of schools’ rankings. The motivatingidea was that a ranking of schools, along with linking school funding tothe number of students at each school, would stimulate competition thatwould, in turn, improve school quality. The government also began to useSIMCE results to allocate resources. Various commentators (notably Mizala,Romaguera, and Urquiola 2007) have pointed out that simple school rankingsfrom repeated cross-sections using SIMCE largely capture students’socioeconomic status and are not a good reflection of school effectiveness. 9The approach was subsequently revised, resulting in an approach thatused data on school type, location, and characteristics, and flows and dataon student socioeconomic characteristics, test score levels, and intercohortgains to rank schools within a predetermined “homogenous” group ofschools in each administrative region. The goal was for this Sistema Nacionalde Evaluación del Desempeño de los Establecimientos Educativos Subvencionados(National System for Performance Evaluation of Subsidized EducationalEstablishments, or SNED) to be an index that would compare only schoolsserving students of similar backgrounds. Since 1996, the system has identified“outstanding schools,” which became eligible for financial awards,every two years. During the two years the award is in force, SNED-winningschools receive two rewards: (1) an annual bonus for teachers, and (2)public identification as a high-performing school. (See chapter 4 on teacherincentives for a discussion of the impact of the SNED teacher bonuses.) Thepublicity happens through press releases, newspapers, parent-teacherassociation meetings, the Ministry of Education’s website and, in somemunicipalities, through banners posted on winning schools.
Information for Accountability | 51Mizala and Urquiola (2007), using a regression discontinuity design, analyzedthe extent to which parental choices, and therefore school markets,respond to signals of school effectiveness. The identification of impact comesfrom the fact that the cutoff for being identified as a well-performing schoolis clear: within the groups of schools serving students from similar socioeconomicbackgrounds, the top 25 schools are selected for the award in eachround. Intuitively, schools just above and just below the cutoff within eachgroup are virtually identical—except for the fact that those above the cutoffreceive the award. A comparison of differences in outcomes across the cutofftherefore provides an estimate of the impact of the program. 10 The studycaptured the impact on the education market through three sets of indicators:(1) enrollments in first and ninth grade, (2) the probability and amountof school fees, and (3) the heterogeneity of schools’ populations as given bya vulnerability index, household income, and parent education.None of the outcome measures showed any sensitivity to the availabilityof information—a result that is robust to restricting the sample to schoolsoperating in the same market, to parents of high socioeconomic status(who might be more sensitive to information), and to secondary schools (atwhich level students are more mobile). As a possible explanation, theauthors suggested that SNED might not have sufficiently registered withparents (despite its decade-long existence). Another possibility is that, evenif parents were familiar with SNED and valued its effectiveness, theirchoices might have been based on other characteristics of the school, suchas proximity or peer quality. 11Uganda: Newspaper campaignOne well-discussed example of information-for-accountability interventionsis the large-scale public information campaign around a capitationgrant to schools instituted in Uganda in the mid-1990s. The capitationgrant, financed and run by the central government and using provincialand district offices as distribution channels, was disbursed to public primaryschools to cover nonwage expenditures. The information campaigninvolved publishing budget flows to districts, including amounts and dates,in national newspapers—including local-language editions. Monitoring ofdistricts by the central government was also strengthened.This intervention has been credited with increasing the share of publicspending allocated to schools that actually reached schools from 20 percentin 1995 to around 80 percent in 2001 (Reinikka and Svensson 2006). It hasalso been credited with improving total enrollment in the schools whereexpenditure shares increased (Reinikka and Svensson 2005). In addition,Björkman (2006) argues that students in areas with high exposure to newspapercirculation scored better in the Primary Leaving Exam than studentsin districts with less exposure—with the channel for the impact being theincreased resources that reduced leakage enabled. Going from “low” to
52 | <strong>Making</strong> <strong>Schools</strong> <strong>Work</strong>“high” newspaper access was associated with an improvement of about a0.4 standard deviation on the exam—equivalent to an 11 percent increasein the test scores of the average student in Uganda.The identification of impacts in these analyses rests on differential exposureto newspapers—newspaper outlets and newspaper circulation in thetwo studies, respectively. The intuition is that the availability of newspapersaffected the information acquired, which affected behavior, which led toimproved resource flows, which in turn affected outcomes. The resultsfrom these studies are striking: information access substantially reducedleakage, increased enrollment, and led to an increase in test scores.A key assumption in this instrumental variables approach is that theavailability of newspapers is not related to outcomes through any otherchannel besides its effect through information. Since the approach assessesdifference-in-differences and therefore controls for fixed location-specificattributes, these effects would need to be dynamic to undermine the validityof the instrument. Specifically, time-varying factors related to newspaperaccess that also affect outcomes would undermine identification. Thearguments marshaled by the authors are compelling: newspaper access isrelated to knowledge about the grant program but not to knowledge aboutpolitical matters and is therefore unlikely to be picking up an ability tolobby politicians for resources. Newspaper access was not related to leakagebefore the information campaign and is therefore unlikely to be picking upan unobserved factor related to leakage. Last, newspaper access has aneffect over and above that of income and remoteness, so it is not simply aproxy for these variables. Nevertheless, the extent to which one believesthat the impacts can be attributed to information access is dependent onone’s acceptance of these arguments.Evidence from Four New Field ExperimentsFour more recent interventions were designed with the specific goal ofevaluating the impact of information on behaviors and outcomes. Throughcareful pre- and postintervention data analysis, combined with randomizedallocation of information dissemination, the studies enable substantial newinsights into the potential for information as a tool for promotingaccountability—and outcomes. Nevertheless, the small number of studiesand the location-specific nature of the findings suggest that there issubstantial scope for further work.Pakistan: Report cardsThe education system in Pakistan is characterized by a vibrant privatesector—one 2007 estimate put the share of students at the primary andsecondary levels at 31.2 percent and 31.4 percent, respectively. 12 Providing
Information for Accountability | 53information about school performance in such an environment has thepotential to especially affect outcomes through competition betweenprivate schools and between the public and private sector. A large-scalestudy of the education system in three districts of Pakistan’s Punjab Provincesought to evaluate what the effects of such an intervention wouldbe (Andrabi, Das, and Khwaja 2009). 13The specific sites of the information intervention were 112 randomlyselected villages within the three districts. Only villages with at least oneprivate school were included in the sample frame, corresponding to about50 percent of villages overall. In total, the study covered 823 public andprivate schools—on average, 7.3 schools per village. The study schoolsincluded roughly 9,900 students. Half of the villages in each district wereassigned “treatment” status, and half served as a control group, with theintervention running two years.The intervention itself consisted of a set of report cards distributed toparents and teachers. The content of the cards was based on the resultsfrom a set of tests in English, mathematics, and Urdu—the local language.Parents received two report cards: (1) The first card included the child’sindividual score in each subject, his or her quintile rank across all testedstudents, and the average scores for the child’s school and for his or her villageas well as the quintile rank for each of these. (2) The second cardincluded the average scores for each school in the village, its quintile rank,and the number of students tested. Teachers received an additional cardthat included a disaggregation of the scores across subtopics—for example,word recognition and sentence building in English. 14The cards were delivered through discussion groups in which most ofthe time was spent explaining how to interpret the cards. The approachintentionally avoided providing advice to parents or schools; the goal wasmerely to ensure that the participants could understand and interpret thecontent. 15 Families and schools received no financial benefits (for example,household transfers or school grants) for their participation in this program.A key feature of this intervention is that the investigators intended for itto be a villagewide intervention. All schools in all villages were a part of thestudy. The information campaign was intended to affect the whole marketfor education in the village—not just one (public) school.India: Jaunpur district in Uttar PradeshA different approach was taken in a field experiment of alternativeapproaches to promote community engagement and improve learning outcomesin the Jaunpur District of the Uttar Pradesh state of India (Banerjeeand others 2008). This large state—with a population roughly the size ofMexico’s—has economic and social indicators that are roughly in line withthe rest of the country. Teacher absenteeism, estimated at 26.3 percent
54 | <strong>Making</strong> <strong>Schools</strong> <strong>Work</strong>based on a survey in 2003, is likewise similar to the national average of 24.8percent (Kremer and others 2005).Three approaches were designed to build on an existing institution forcommunity engagement in education, the village education committee(VEC). While VECs exist in a de jure sense, a baseline survey found them tobe all but nonfunctional: a survey of 1,029 VEC members (identified assuch by school principals) revealed that only 38 percent spontaneously selfidentifiedas members, and only 25 percent responded that they weremembers when asked directly. VEC members, as well as parents of schoolagechildren in the study villages, knew little about the VEC’s roles andresponsibilities. These roles include both indirect authority—by monitoringschool performance, reporting to higher authorities, and requestingadditional resources—and direct authority by supervising the hiring andfiring of community-based contract teachers and allocating additionalresources to the school from a government-run program (the Sarva ShikhaAbhiyan [Education for All program]).This lack of engagement was concomitant with low indicators of learningachievement: 15 percent of village children ages 7–14 could not recognizea letter, 38 percent could not recognize numbers, and only 39 percent couldread and understand a simple story. At the same time, parents systematicallyoverestimated their children’s abilities.The three interventions also built on the experience of the collaboratingNGO (Pratham, a large Indian NGO focused on education improvement)with improving education outcomes. The first approach was based largelyon explaining and publicizing the role of the VEC—both to VEC membersand to the community at large. Through a series of small group meetings,culminating in a large village meeting, NGO facilitators held discussionsabout the structure and organization of local service delivery, with anemphasis on the role and activities of the VEC. Facilitators were tasked withensuring that specific facts about the public education system and the VEC’sroles and responsibilities were conveyed. After the two-day intervention,pamphlets outlining these roles and responsibilities were left with eachVEC member.The second approach built on the first. In addition to group discussions,local volunteers were trained in simple reading, writing, and mathassessment tools. They were tasked with administering these tests to schoolagevillagers and, in collaboration with parents and other communitymembers, were supposed to convert these test results into village“scorecards.” These scorecards then became inputs into the village meetings,helping to steer the discussion toward learning outcomes.The third approach added one more dimension. Local volunteers weresought to receive training in reading instruction. These trained volunteersthen held remedial reading classes, known as “reading camps,” after school
Information for Accountability | 55hours. NGO staffers provided ongoing support to the program in these villagesthrough periodic visits; an average village received seven of these visits.Each approach was implemented in 65 villages, with an additional85 villages serving as a control group. The 280 study villages were randomlyselected from four blocks within the Jaunpur district, and allocationinto each treatment approach was randomized within each block. Baselinedata were collected in March and April 2005, with follow-up data collectedone year later. The interventions were implemented from Septemberthrough December 2005. Data were collected from 2,800 households, 316schools, and more than 17,500 school-age children (ages 7–14).India: Three-state studyThe third new information-for-accountability field experiment is similar tothe simplest of the Uttar Pradesh approaches, although the interventiondiffered in important respects. This intervention was carried out in 12 districtsacross three Indian states: Uttar Pradesh (again), Madhya Pradesh,and Karnataka (Pandey, Goyal, and Sundararaman 2009, 2010). 16Indicators of service delivery are similar in the three states, with teacherabsenteeism estimated at 26.3 percent in Uttar Pradesh, 17.6 percent inMadhya Pradesh, and 21.7 percent in Karnataka in 2003 (Kremer and others2005). In general, however, Karnataka typically stands out as havinghigher economic and social indicators. Indeed, in the baseline survey forthis experiment, teacher attendance was 67 percent and 65 percent inUttar Pradesh and Madhya Pradesh, respectively, while it was 88 percent inKarnataka. At the time of the unannounced visit at baseline, 31 percentand 27 percent of teachers, respectively, were actively engaged in teachingin Uttar Pradesh and Madhya Pradesh, while 68 percent were doing so inKarnataka.Baseline indicators for the districts in this intervention also suggest a lackof knowledge and engagement by the formally established bodies supposedto oversee education matters: VECs in Uttar Pradesh, parent-teacher associations(PTAs) in Madhya Pradesh, and school development and monitoringcommittees (SDMCs) in Karnataka. Levels of learning (tested insecond-to-fourth-grade students in public schools) were extremely low inUttar Pradesh and Madhya Pradesh: only about 14 percent of students atbaseline could read a sentence in these states, and only about 16 percentcould correctly perform the addition tasks on the test. In Karnataka, thelevels of learning at baseline were substantially higher: 46 percent of studentscould read a sentence, and 75 percent could do the basic additionproblems correctly.The intervention in this study consisted of a set of information disseminationtools delivered repeatedly to selected villages. The tools consisted ofa six-minute film shown on a mobile screen, a set of posters, a large wall
56 | <strong>Making</strong> <strong>Schools</strong> <strong>Work</strong>painting, take-home calendars, and a learning assessment booklet. The goalwas to convey, in a systematic way and to a broad audience, the roles andresponsibilities of the relevant school oversight committees as well as aseries of facts about the rules, rights, and organization of those committees.The information was delivered in two rounds: September 2006 to January2007 and August 2007 to January 2009. In each case, the campaign wascarried out three times, separated by a period of two to three weeks. Eachcampaign consisted of up to three community meetings in various neighborhoodsof the gram panchayat (the local-government unit of intervention,consisting of approximately three villages) in which the film wasshown, posters displayed, the mural painted, and the take-home materialsdistributed.The intervention was implemented in randomly selected gram panchayatsin each district, stratified by block (an intermediate administrative level).The evaluation was based on a baseline survey carried out February–March2006, a first follow-up survey carried out February–April 2007, and a secondfollow-up survey carried out February–April 2009. By the second follow-up,therefore, exposure to the program was on the order of two years.The initial baseline survey was implemented in one public school in eachgram panchayat. In Uttar Pradesh and Madhya Pradesh, 15 students fromeach second-, third-, and fourth-grade class were tested. In Karnataka, 15students from each fourth- and fifth-grade class were tested. The associatedschool oversight committee members were then interviewed. At follow-up,fresh cohorts of third- and fourth-grade students were tested in UttarPradesh and Madhya Pradesh, and fresh cohorts of fourth- and fifth-gradestudents were tested in Karnataka. In Uttar Pradesh and Madhya Pradesh,the initial second-grade cohort was retested when the students would havebeen in fifth grade if they had proceeded at the expected pace.Liberia: Early grade reading assessmentThe fourth information intervention with a rigorous evaluation was carriedout in Liberia as a part of an Early Grade Reading Assessment (EGRA) exercise(Piper and Korda 2010). The setting is characterized by low schoolparticipation rates and extremely low levels of learning. The evaluationsought to study the impact—beyond the simple EGRA measurement—ofthree versions of follow-on activities:• In a first group of schools, the EGRA exercise was implemented, but theresults were not publicized or disseminated. This served as the controlgroup for the evaluation.• In a second group of schools, a “light” intervention was implemented. Inthese schools, parents and community members were provided with theresults of the literacy assessment and were informed that the tests would
Information for Accountability | 57be repeated. Teachers in these schools were trained in how to preparestudent report cards and instructed to distribute these four times a year.• In the third group of schools, a “full” version of the intervention wasimplemented. In these schools, teachers received intensive training onreading instructional strategies, over and above the “light” treatmentinterventions.The baseline EGRA was carried out in November 2008 and covered 2,957second- and third-grade students from 176 schools. Assignment to control,light, and full treatment was done randomly, with geographic clustering,targeting 60 schools in each group. A follow-up EGRA was administered inJune 2009, and a final assessment was carried out in June 2010. The resultsdiscussed here are from the final assessment. Notably, this was a study ofsequential cohorts of students rather than a longitudinal study of the samestudents over time (that is, in each assessment, a new group of second- andthird-grade students was selected).EGRA assessed students on a variety of reading tasks: letter-naming fluency,phonemic awareness, familiar word fluency, unfamiliar word fluency,connected-text oral reading fluency, reading comprehension, andlistening comprehension. In addition, an Early Grade Math Assessment(EGMA) was administered individually and orally, covering basic mathematicalskills. Neither the “light” nor the “full” interventions was gearedtoward math, but the rationale for including the math assessment was tosee whether there could be spillover effects from reading to math.Impact on Learning OutcomesPakistan: Report cardsThe evaluation strategy in Pakistan exploited the randomized design: testscore gains in the treatment and control villages could be compared aftereither one or two years of exposure to the intervention. Because treatmentoccurred at the village level, much of the analysis was carried out onaverage village test scores, although the results were not sensitive towhether village- or student-level data were used in the empirical analysis.The main result was that average test scores increased in the villageswhere the report cards were distributed: in those villages, test scoreswere 0.10–0.15 of a standard deviation higher than in the control villages.The results were sustained after two years of the program. Gainswere especially big in private schools that had low test scores to beginwith (increasing by more than a 0.3 standard deviation); gains were moderatein government schools (increasing by about a 0.1 standard deviation);and gains were small to insignificant in the private schools that hadhigh scores at baseline.
58 | <strong>Making</strong> <strong>Schools</strong> <strong>Work</strong>India: Jaunpur District in Uttar PradeshThe Uttar Pradesh study found little impact on learning outcomes. Theimpacts of the interventions that focused on raising awareness about theVEC’s roles and responsibilities and on self-assessment of learning achievementsthrough the use of community scorecards were estimated to besmall and statistically insignificantly different from zero. For example, 85.5percent of children could read at least letters at baseline; at follow-up, 89.2percent of the children in the control group could do so, while 89.6 percentof the children in the VEC awareness and scorecard intervention villagescould do so. Similarly, 32.7 percent of children could subtract or divide atbaseline, while at follow-up, 39.7 percent in the control group could do so,compared with 40.3 percent in the scorecard intervention villages.The study did find, however, that the reading clubs led to improvementsin reading ability—especially for children who could not read at baseline. Invillages where this intervention was implemented, children who could notread at baseline were almost 8 percentage points more likely to be able toread letters at follow-up than children in the other villages. Children whoenrolled in the reading clubs saw large reading gains: among those who hadnot previously been able to read, attending the classes made them 60 percentagepoints more likely to be able to read at follow-up. 17India: Three-state studyUnlike the Jaunpur District intervention in Uttar Pradesh, the three-statevillage information campaign intervention did lead to measurable impactson learning outcomes. In Uttar Pradesh, the third- and fourth-grade studentsscored about 16 percent at baseline in mathematical addition tasks, and theimpact of the treatment was to raise that score by about 5 percentage pointsmore than the control group. 18 Similar impacts were found for the othermath competencies. At baseline, about 14 percent of these students couldread a sentence and words, and the impact of the treatment was to raise thatby 4 percentage points more than the control group.In Madhya Pradesh, the impact of the program appears in the testscores of the fifth-grade students who were followed from the initialcohort of second-grade students. Among this group, the impact of theprogram was to raise math scores by 4 percentage points above the counterfactualperformance.In Karnataka, the impact of the program on fourth- and fifth-grade studentswas also large in math. For example, at baseline, about 28 percentcould perform division, and the intervention raised that competency by7 percentage points more than the control group.Liberia: Early grade reading assessmentDespite the randomized control design of the study, some (small) statisticallysignificant differences at baseline led the researchers to adopt a
Information for Accountability | 59difference-in-differences approach to estimating impact. That is, theystudied the difference after the intervention after subtracting out the differencesbefore the intervention.The information-only intervention—that is, the “light” intervention—increased only one of the seven indicators used in EGRA: the measure ofletter fluency. 19 The test scores for this indicator increased by a 0.24 standarddeviation as a result of the program. During the mid-term assessment, the“light” intervention also showed impacts on oral reading fluency, readingcomprehension, and listening comprehension. However, after the two yearsof the program had run their course, none of the indicators other than letterfluency was affected by this intervention.On the other hand, the “full” intervention—which included the informationdissemination as well as the teacher training components—had statisticallysignificant impacts on all the indicators measured. The effect sizeswere estimated to be large, from a 0.38 standard deviation in listening comprehensionto 1.40 standard deviations for unfamiliar word decoding.Intriguingly, of the nine mathematics indicators included in EGRA, sixwere statistically significantly positively increased by the “full” intervention(three were statistically significantly positively increased by the “light”intervention). 20Channels of ImpactPakistan: Report cardsThe Pakistan case is somewhat atypical in that it focused on all schools—both public and private—in a setting where private schools were a strongpresence and there was a substantial amount of school choice. Nevertheless,the study found little in the way of switching between schools. Publicdistribution of test scores and rankings via report cards did alter parents’perceptions of school quality: ex post perceptions were more aligned withtest scores than ex ante perceptions. Enrollment in government schoolsappears to have increased somewhat at the expense of private schools withlow initial test scores (which were more likely to close). However, therewas substantial stability across time regarding which schools individual studentsattended. The study found little impact of the intervention on othermeasures of household behavior; there was no change in parental timespent on education with children, no change in time spent on school workoutside of school, and no change in education expenditures (excludingschool fees).The study documents that while there was no learning impact in privateschools that had high test scores at baseline, school fees in these schools fell.The authors argue that both high-quality and low-quality private schoolswere adjusting to align the price-adjusted quality of schooling that theywere offering: low-quality schools responded by increasing quality, while
60 | <strong>Making</strong> <strong>Schools</strong> <strong>Work</strong>high-quality schools responded by reducing price (in part because theremay be diminishing returns to investments in quality). This latter adjustmentwas especially large in schools where the “cost-per-test score” washighest before the intervention.All of these findings are consistent with the increased competition thatinformation is introducing into the market. It is harder to use these competitiveforces to explain the change in government schools. Indeed, despitethe fact that there appears to have been limited direct competition for studentsbetween public and private schools (at least over the relatively shortperiod of the program implementation), public schools in villages thatreceived report cards posted gains in test scores of slightly less than a 0.1standard deviation.The study also offers some insights into how schools increased test scores.In villages that received report cards, schools were more likely to have textbooksand more likely to have more of them. In addition, schools appear tohave devoted more time to teaching and learning; the time spent on breakswas between 14 and 23 minutes less on average per day as a result of theintervention. This corresponds to a reported increase in the time thathouseholds reported that children spent in school, which increased by anaverage of 37 minutes per day as a result of the intervention.India: Jaunpur District in Uttar PradeshThe awareness-building and community mobilization interventions thatwere implemented in the Jaunpur District of Uttar Pradesh did indeed raisethe level of knowledge among the various stakeholders. VEC memberswere more likely to know about the VEC’s responsibilities and rights. Inaddition, VEC members became much more aware of the state of educationin the village. Knowledge among parents, however, did not increase bymuch. While the impacts were statistically significantly different from zero,they were small. Even in treatment villages, barely 7 percent of parentsreported being aware of the VEC after the interventions.Likewise, behaviors were not much affected by the information interventions.VECs in treatment villages did not report having complained tohigher authorities any more than those in control villages, nor were theymore likely to have requested more resources—either in the form of grantsor in the form of extra contract teachers. Similarly, parents did not engageany more in school activities as a result of the interventions; they did notvisit schools any more, they did not volunteer any more time, and therewere no additional school meetings organized.India: Three-state studyConsistent with the estimated impacts on learning, the three-state study inIndia found impacts on behavioral change and knowledge. In Uttar
Information for Accountability | 61Pradesh—where engagement was lowest at baseline—the intervention ledto more meetings, more participation in inspections, and greater knowledgeabout school matters (such as school accounts) as well as the roles andresponsibilities of the VECs. In Madhya Pradesh, PTA members reportedmore inspections, and greater participation in those inspections, althoughimpacts on reported knowledge were not statistically significantly differentfrom zero. In Karnataka, the impacts were detected most in the area ofknowledge—about school accounts and the role of the SDMCs.The impacts appear to have been mostly concentrated among the moreelite members of the school committees—that is, non-Scheduled Castemembers. Moreover, in Uttar Pradesh and Madhya Pradesh, the impactswere concentrated in villages with low proportions of Scheduled Caste orScheduled Tribe populations—that is, relatively better-off villages. Theseare presumably villages where literacy levels and other social and economicindicators are higher. Of particular note, in Karnataka there was evidencethat school committees took action as a result of the information: the programresulted in school committees letting go of contract teachers who hadhigh absenteeism.Similarly, the study found impacts on teacher effort in the two stateswhere it had been especially low at baseline: Uttar Pradesh and MadhyaPradesh. In both states, the intervention led to an increase in teacherattendance (of between 6 and 8 percentage points), and in MadhyaPradesh to an increase of teacher activity conditional on attendance (of8 percentage points). All of this effect comes from an impact on civil serviceteachers as opposed to contract teachers, for whom impacts were notstatistically significant.Liberia: Early grade reading assessmentInterpreting the Liberia results is made somewhat complicated for tworeasons:First, the “light” treatment was especially light compared with the fulltreatment. In particular, teachers in the “full” treatment received ongoingsupport and supervision. However, the communities in the “light” programonly received one-time information feedback from EGRA, with teachersbeing shown how to prepare report cards, and there was no verification ofwhether they actually distributed report cards.Second, the impacts went beyond reading—that is, math tests wereaffected by the “full” intervention. There are two potential explanations forthis: (1) possible spillover effects from reading to math (indeed, the abilityto decode and interpret written material may well affect math scores); and(2) the possibility that the ongoing support and engagement provided tothe schools, even though focused on reading, changed the motivation andeffort of teachers in a way that affected math scores.
62 | <strong>Making</strong> <strong>Schools</strong> <strong>Work</strong>Nevertheless, the impacts of the “full” intervention are striking. Thelarge effect sizes are greater than those typically found in the evaluations ofother education interventions, where an effect size of 0.2 is consideredlarge. 21 Given the study design, it is impossible to know whether the teachertraining and support, without the public information disseminated throughthe EGRA feedback and report cards, would have had an impact. Given thefrequently disappointing results with teacher training programs (see <strong>World</strong><strong>Bank</strong> 2003 for a discussion), it is likely that the combination of the two didmake a difference. Without the incentive to implement what they havelearned in the classroom, teachers often fall back on familiar teachingmethods. In this case, however, it is possible that the effect of the informationwas to give teachers an additional incentive to make that transition.Further research would be needed to validate this conjecture. 22What Have We Learned?The evidence to date clearly presents a mixed set of results about thepotential of information for accountability to improve learning outcomes.Consistent with the analyses of the U.S. experience with report-card-likeaccountability interventions, the developing country examples of interventionswith rigorous impact evaluation show similarly varied results.Table 2.1 summarizes the features and impacts estimated by these studies.Assessing the EvidenceThe interventions and findings share some similarities. All of the interventionsare of the “weak accountability” nature: no explicit sanctions are associatedwith poor performance. All of the interventions appear to haveaffected awareness and knowledge, with various actors typically becomingmore able to convey information about school quality in their localities aswell as the material specifically disseminated through the information campaigns(for example, in the India studies, information about the roles andresponsibilities of the school oversight committees).However, the dissimilarities are a more prominent feature of these evaluationstudies. The nature of the interventions varied substantially—fromexternally provided information about performance to the provision of selfassessmenttools; from media-based public dissemination of information toin-depth sustained community meetings to help explain the informationand help stakeholders to process it; from exposures as short as three to sixmonths to those as long as four years.While most of the studies used information to enhance client power relativeto front-line providers, one of the programs (the Uganda newspaper
Information for Accountability | 63Table 2.1 Impact Evaluation Studies of Information-for-AccountabilityInterventionsProgramChile:schoolrankingsUganda:newspapercampaignPakistan:report cardsIndia:JaunpurDistrict,UttarPradeshIndia:three-statestudyLiberia:Early GradeReadingAssessment(EGRA)Nature ofinterventionPublicizing topschools incomparison withschools that servesimilar populationsPublicizing throughthe media the amountsand timing ofcapitation-grantdistribution to districtsDetailed informationof externally collecteddata on performance,intensivelydisseminated toparents, teachers, andschool administratorsPromotingawareness aboutroles, rights, andresponsibilities ofschool oversightcommittees; creatingself-assessment toolsand village-specificscorecards; contractingremedial teachers forreading instructionPromotingawareness aboutroles, rights, andresponsibilities ofschool oversightcommitteesDisseminating EGRAresults to communities;training teachers inreading instructiontechniquesImpact summaryNo impact onlearning outcomes orbehaviorsReduced leakage inthe flow of resources;increased enrollmentand learningIncreased learningoutcomes in publicschools and initiallypoor-performing privateschools; reduced fees atinitially high-performingprivate schoolsSlightly increasedawareness ofroles, rights, andresponsibilities;no impact onbehaviors; no impacton learning outcomesin “information-only”interventionsIncreased awarenessof roles andresponsibilities,especially in highersocioeconomic groups;impacts on learningoutcomes detectedLarge impacts of the twoprograms combined(limited to no impact of“information-only”intervention)Exposureduration2 and4 yrs.Morethan2 yrs.1 and2 yrs.3–6mos.3–6mos.,2 yrs.EvaluationstrategyRDDIVRCTRCTRCT2 yrs. RCT, DDSources: Mizala and Urquiola 2007 for Chile; Reinikka and Svensson 2005, 2006, andBjörkman 2006 for Uganda; Andrabi, Das, and Khwaja 2009 for Pakistan; Banerjee andothers 2009 for Jaunpur District, India; Pandey, Goyal, and Sundararaman 2009, 2010 forIndia Three-State Study; Piper and Korda 2010 for Liberia.Note: RDD = regression discontinuity design. IV = instrumental variables. RCT = randomizedcontrol trial. DD = difference-in-differences analysis.
64 | <strong>Making</strong> <strong>Schools</strong> <strong>Work</strong>campaign) aimed to rebalance power between clients and politicians orpolicy makers, thereby affecting client voice. The variability across theseevaluation studies reflects the broader variability in the approaches used topromote information for accountability. Nevertheless, all of these variationsmake it difficult to draw too many strong general conclusions from thesestudies about the impact of information for accountability.One primary goal of impact evaluation studies is to investigate “proof ofconcept”—that is, to answer the question of whether an intervention, or atype of intervention, could have an impact on outcomes. The studies todate suggest that the answer to this question is yes, information for accountabilitycan improve outcomes. The examples of India (the three-statestudy), Liberia, Pakistan, and Uganda show that, under some configurations,information can be leveraged for change—change that results inincreased learning outcomes. In addition, the programs appear to be quitecost-effective, as box 2.4 explains.Notably, each of these interventions was positioned to leverage changein different ways. In Uganda, the goal was to provide information thatallowed stakeholders to hold local administrative units (districts) accountablefor the funds that they received. In Pakistan, the goal was to provideinformation to reduce asymmetric information within a vibrant local educationmarket. In the India three-state study, the goal was to provideBOX 2.4Cost-Effectiveness of Information InterventionsGenerating and disseminating information, if effective, should improvelearning at a relatively low cost. Hoxby (2002) discussed the low relativecost of generating and disseminating information about inputs,outputs, and especially outcomes in the United States.For the Pakistan report card impact evaluation, the authors calculatedthat the total cost of compiling and disseminating the reportcards for the entire population was roughly equal to the fee reductionin the initially well-performing schools (Andrabi, Das, and Khwaja2009).The India three-state study benchmarked the cost of the informationcampaign against the benefit reaped solely in terms of daysworked by teachers. The study’s authors showed that the effectivegain in the use of public resources (that is, the value of the increase inteacher attendance due to the project) was between 20 and 35 timesthe cost of the program (Pandey, Goyal, and Sundararaman 2010).
Information for Accountability | 65information to empower local education bodies to exercise their rights ofoversight and to empower parents to be aware of their direct role in monitoringschools. In Liberia, information appeared to leverage parentengagement to make teacher capacity-building effective. This variationsuggests that all four of these channels may be potential avenues for leveragingchange through information.One feature of these interventions that appears to be associated withsuccess was the clarity and authority associated with the information disseminated.The newspaper campaign in Uganda disseminated readilyunderstood information—dates and amounts of disbursements. The reportcards in Pakistan disseminated simple, externally validated indicators ofschool performance, which were then carefully explained to the targetaudiences. The three-state study in India emphasized the systematic natureof the information campaign; used creative approaches; repeated visits toensure that the messages “stuck”; and left behind posters, murals, and takehomematerials to ensure that the information dissemination outlasted thevisit from outsiders.Another feature that should be borne in mind when assessing thestrength of the evidence is the exposure time. Short exposure times arecommon in impact evaluation analysis, with potentially noxious impactson the validity of the findings (King and Behrman 2009). Learning outcomesare slow to change, and therefore it is perhaps unrealistic to expectto see impacts in as short a period as three months.But these features are not panaceas. Clear, externally validated informationthat is widely disseminated for a long period of time will not alwayslead to salutary impacts. The Chilean SNED example shows that wellunderstoodinformation about schools’ relative performance, widely publicizedthrough media and at schools, was insufficient to change educationmarkets—even after two or four years of exposure. By contrast, the Indiastudy in the Jaunpur District, Uttar Pradesh, showed that remedial readinglessons were able to increase reading abilities in a short time frame.In summary, these evaluation studies answer one big question—findingthat, yes, information appears to have the potential to leverage change forimproving learning outcomes—but they also raise many additional questions.Further research is likely needed to establish, more consistently andclearly, when and how information can be used most effectively.Designing an Information-for-Accountability SystemOne important aspect of information is that, once it has been created anddisseminated, it can be used by all—and one person’s use does not reduceanother person’s use. It has the attributes of what, in economics, is termeda public good. Public goods face the problem that since no one person or
66 | <strong>Making</strong> <strong>Schools</strong> <strong>Work</strong>entity reaps the full returns, there will be less than optimal investment intheir creation. If information is to be leveraged for outcomes, it is thereforelikely that its collection and dissemination will need to be subsidized andsupported.The limited evidence on information for accountability to date suggeststhat it is perhaps too soon to try to identify which specific aspects of theapproach may ensure the largest impact. As described above, there is agreat deal of heterogeneity across the cases described here regarding (a)which information was disseminated and how that information was presented,and (b) the extent to which the information was accompanied bycapacity-building efforts to ensure that the information was understood.Despite the limited information base, some principles do emerge from thecases so far.Which information to disseminate and how to present it?First, simplicity is an important goal to strive for. The report card interventionin Pakistan provides a model that shows substantial promise; the informationin the report cards was straightforward and related to an outcomeof overarching interest—learning. As figure 2.2 illustrates, each parent wasinformed about their child’s performance in math, Urdu, and English, withthese scores rated from “needing a lot of work” to “very good.” The equivalentinformation for the child’s school and village was also provided (leftpanel of figure 2.2). A separate card provided to parents listed averageresults for each school in the village (right panel of figure 2.2).In Paraná State, Brazil, which implemented a school report card between1999 and 2002, the information distributed was likewise kept simple,although it went beyond learning outcomes and included informationabout student flows and the numbers of teachers and students. In addition,it included feedback from a set of surveys carried out at the school levelwith responses from parents and students to questions about variousaspects of school functioning, as figure 2.3 shows.The additional information included in the Paraná report cards is of twotypes: (1) data available from regular data gathering sources such as EMIS,including information on students, student flows, and teachers as well ason infrastructure and the availability of certain types of resources at theschool level; and (2) data from specialized surveys, such as those collectinginformation about parents’ perceptions of the schools.The issue to address with the first type of data is where to draw the line:how much is too much? EMIS typically collect a large set of data, muchmore information than could be used in a report card exercise. To the extentthat report cards are a tool for mobilizing parents and stakeholders, includingthese data is probably of limited use. If report cards are to be used asmanagement and planning tools, however, then detailed information of
Figure 2.2 Report Cards Given to Parents in Pakistana. Child informationperformance in three subjects (math, Urdu, English)b. Village schools informationperformance of all primary schools in villlage(English translation)a. b.Mathematics English Urdu Mathematics English UrduNo. ofchildrentestedName ofschoolactual scorequintileactual scorequintileactual scorequintileactual scorequintileactual scorequintileactual scorequintile67child'sperformanceaverageperformance ofchildren in yourschoolaverageperformance ofchildren in yourvillageSource: Andrabi, Das, and Khwaja 2009.Note: Quintile descriptions range from “needing a lot of work” to “very good.”
68Figure 2.3 Report Card in Paraná State, Brazil, 1999–2000a. Original (Portuguese)b. Translation (English)School Performance Assessment, 2000This SchoolOther <strong>Schools</strong> inYour Municipality ParanáNumber Pupils Pupils Pupils PupilsNumberNumberof Pupils at at Level at Level at Levelof Pupilsof PupilsMean Assessed Level I II III IV Mean Assessed Mean AssessedPortuguese 4 th * 257 7,232 250 39,2398 th 258 AP 61 16% 25% 25% 34% 263 4,852 250 31,1258 th 251 AB 63 19% 30% 25% 25% 260 4,743 250 31,125Math 4 th * 255 7,101 250 38,4418 th 262 AC 56 23% 11% 27% 38% 261 4,710 250 31,007Science 4 th * 254 7,055 250 38,033Source: SEED/NIE, AVA 2000Note: School Effects:AC Average above the expected mean, given the profile of pupils assessed.AB Average below the expected mean, given the profile of pupils assessed.AP Average roughly equal to the expected mean, given the profile of pupils assessed.PromotionRepetitionDropoutGrade1-4***This SchoolGrade5-867%33%0%SecondaryEducation78%20%2%Promotion, Repetition, and DropoutOther <strong>Schools</strong> in Your MunicipalityGrade1-495%4%2%Grade5-879%16%5%SecondaryEducation71%13%15%Grade1-489%9%2%ParanáGrade5-881%9%2%SecondaryEducation75%10%15%Source: MEC/INEP/SSEC, Censo Escolar 2002 ( Resultados Preliminares ).Note: Data refer to the 2001 school year for public schools in formal education.* The school (or municipality) did not offer this level of education.TotalGrade1-4This SchoolGrade5-8Teachers and StudentsOther <strong>Schools</strong> in Your MunicipalitySecondaryEducationGrade1-4Grade5-8100,754SecondaryEducationGrade1-4825,850ParanáGrade5-8737,602SecondaryEducationPupils 2,192 * 1,381 811 113,57365,965408,020Average class* 37 39 30 35 38 27 34 37size39,25 37,46Teachers * 47 34 6,048 4,193 2,76522,9385 4Teachers w/higher education* 100% 100% 67% 98% 98% 46% 97% 97%Source: MEC/INEP/SSEC, Censo Escolar 2002 ( Resultados Preliminares )Note: Data from Public schools: total pupils in primary and secondary education.* The school (or municipality) did not offer this level of education.The state government standard for pupil class ratio varies from aminimum of 25 to a maximum of30 pupils per class for 1 st to 4 th grade, 30–40 pupils per class for 5 th to 8 th grade, 30–45 pupils perclass for secondary education.
a. Original (Portuguese)b. Translation (English)Parents’ opinions about this school regarding . . .Education quality59 out of 70 parents (84%) are satisfied with the quality of education their children receive.43 out of 68 parents (63%) believe the school buildings are well maintained.63 out of 69 parents (91%) believe the school infrastructure is appropriate to educational activities.50 out of 69 parents (72%) believe that school teachers are dedicated to teaching.57 out of 71 parents (80%) are satisfied with teachers’ punctuality.Parental involvement65 out of 69 parents (94%) would like to have greater involvement in school activities.64 out of 68 parents (94%) believe that the head teacher favors participation of the school community in school activities.50 out of 71 parents (70%) indicate that the school promoted parental involvement in education issues.31 of them participated in such activities.47 out of 68 parents (69%) indicate that the school promoted parental involvement in schooladministration issues. 23 of them participated in such activities.Information dissemination48 out of 72 parents (67%) report that the school promoted regular meetings between parents and teachers.55 out of 68 parents (81%) say a regular communication system with parents has been established.58 out of 65 parents (89%) say that teachers assign homework tasks that promote parents’ interestin their children’s education.47 out of 69 parents (72%) report receiving information about their children’s homework so they could follow up on it.Security51 out of 72 parents (71%) feel safe sending their children to school.47 out of 67 parents (70%) believe the school has discipline problems.47 out of 68 parents (69%) believe the school has internal security problems.60 out of 69 parents (87%) believe the school is subject to security problems in the neighborhood.School grade7.8 (mean attributed by 68 parents).Parent profile5 out of 70 parents (7%) reported participating in the School Board.7 out of 69 parents (10%) reported being members of the Parents and Teacher Association Secretariat.14 out of 68 parents (21%) reported being a volunteer at this school.22 out of 69 parents (32%) have more than one child at this school.Source: Survey submitted to parents during School Family Week, April 20–28, 2002.Note: Only schools with more than 160 pupils responded to the survey.The results reported represent only the opinions of those parents who answered the questionnaires and notthose whose children attend this school.The results are based on the total number of valid responses and not the total number of questionnaires received.69(continued next page)
70Figure 2.3 Report Card in Paraná State, Brazil, 1999–2000 (continued)a. Original (Portuguese)b. Translation (English)The pupils in this school say that . . .4 th Grade 8 th GradeHis/her parents always read his/herschool reports.* 74%His/her parents always go to theschool when requested.His/her parents always or almost66%always attend school events.15%He/she has never failed. 59%At least one of his/her parents hascompleted secondary education.He/she has a home computer. 21 %35%He/she has a car. 63%Portuguese Math Science Portuguese Math ScienceHe/she always or almost always requiredguidance with his/her homework.27% 29% 38%He/she enjoys very much the wayhis/her teacher teaches. 68% 37% 42%He/she likes the textbook used. 27% 44% 43%He/she did not have trouble learning. 42% 25% 19%Source: SEED/NIE, AVA 2000: Questionário do Aluno.Note: * The school did not offer (or had not assessed) this level of education.The school head teacher says that . . .During his/her administration, the head teacher dedicated most of his/her time to the organization of theschool management structure.During the general school meetings to which all parents were invited, the educational projects for the differentperiods of the school year were discussed. On average, parental attendance at these meetings was 75%.The School Board met every two months.Source: SEED/NIE, AVA 2000:Questionário do Escola.Sources: Original Portuguese version from Vasconcelos 2003; translation from Winkler and Sevilla 2004.
Information for Accountability | 71this type is likely to be useful. There is no one-size-fits-all approach, but ina given situation it is probably useful to separate out the management andplanning aspects of the report cards and provide those data to the schoolthrough a separate feedback method, as box 2.2 discussed above. This separationwould allow the report cards to be simpler and more focused onselected indicators.The issue with data on stakeholder perceptions is different. Some reportcardinterventions have included only this type of feedback—indeed, themultisectoral “Citizen Report Cards” in Bangalore, India, (as box 2.3described) included only perceptions and no “factual” data on learning orother school information. Collecting data about perceptions involves thefielding of a survey to representative samples of parents and students ateach school, which could be costly and hard to replicate on a regular basis.Of course, collecting information on learning outcomes could be costly aswell, but that kind of data gathering is narrowly focused on students in theclassroom, can be done in the context of regular classroom activities, anddoes not require tracking back to the students’ households to interviewparents.The apparent success of the Pakistan intervention suggests that the extraEMIS or perception-related information is not necessary to generate impact.The two India cases that included no learning information as a part of thefeedback showed mixed results. While it is substantially too soon to drawtoo many conclusions based on a limited number of cases, this pattern doessuggest that careful thought needs to be put into which information shouldbe included in each particular situation. The priority should be on simpleindicators that parents care about, that they understand, and that are likelyto motivate them to action. The indicators are likely to differ depending onthe socioeconomic context (in particular, the literacy level of the parents)and the specifics of the education market (recall that Pakistan had a particularlyvibrant private sector). Piloting various approaches should precedeany scale-up of a report card exercise.How much “socialization” do the report cards need?The notion that simply introducing information into a system is sufficientto upset an equilibrium—and lead to a stronger set of accountabilityrelationships—is an attractive one. If such an intervention has animpact, its cost-effectiveness would be large, as box 2.4 discusses.The studies reviewed here show a big range in the extent to which informationwas accompanied by additional interventions to ensure that it wasbeing understood and to maximize the chance that it would be acted on. Atone extreme is the Uganda case, where it was simply newspaper availabilitythat identified the impact. At the other extreme are the Pakistan andIndia three-state studies, which had more in-depth, community-based
72 | <strong>Making</strong> <strong>Schools</strong> <strong>Work</strong>dissemination strategies. Impacts of the campaigns were therefore found atboth extremes. While a relatively hands-off approach may work for somesituations, the case of Chile suggests that it is not always enough. The comparisonbetween the two India-based studies suggests that, at least for thecommunity mobilization efforts, a more sustained and comprehensiveapproach might have been necessary. The India three-state interventioninvolved more frequent visits and provided more subsequent follow-upvisits—which seem to have translated into greater impact.Björkman and Svensson (2007) described an intervention in Ugandathat provided information about health service delivery and local healthoutcomes along with an intensive community mobilization campaign thatincluded the development of action plans. The authors estimated that thisapproach had a large impact on improving service delivery and reducinginfant mortality.It is likely that there are many settings in developing countries where thecurrent equilibrium is that parents and local stakeholders feel disengagedfrom the education system (and perhaps disempowered from it). Simplymaking information available may not be enough to change that statusquo—at least in the initial phases of a report card scheme. Complementaryactivities might include community meetings at which the results of thereport cards are described item by item (such as in the Pakistan case). Theymight also include approaches that ensure that the stakeholders have aframework within which to channel their input into schools (such as in theUgandan health sector example). More-intensive interventions are likely tobe costlier—both in financial and human terms—and less easy to scale upthan less-intensive ones—but little is known about the tradeoff betweenthese approaches. Again, piloting alternative approaches within a given settingwould be important before large scaling up of activities.Downsides of Information for AccountabilityIt is hard to argue against greater access to accurate information. Nevertheless,it is important to keep in mind that the approach has several potentialshortcomings. Much of the research on potential downsides has focused onthe distortions that strong accountability approaches can engender.First, they could lead to strong opposition to reform—as discussed in thecase of Brazil (Brooke 2005). Second, they could have unintended consequences—manyof which undermine the validity of the exercise itself. Strategicbehavior on the part of schools undergoing an assessment was foundin the Chicago school system when a strong accountability system wasintroduced—from outright cheating on the part of teachers (Jacob and Levitt2003) to more subtle effects such as excluding students from the testing;retaining students in grades that were not subject to testing; or reducing the
Information for Accountability | 73scope of subjects taught, or the curriculum itself, away from nontested subjects(Jacob 2005). While these effects have been documented, Loveless(2005) concludes that the “harms” described to date appear temporary andmalleable.Elite capture is another potential problem with information campaignsthat rely on written communication, which is more likely to be understoodby educated parents. The India three-state study suggests that the potentialfor elite capture is real. Moreover, when combined with other interventions,information can have the potential to aggravate inequalities evenfurther. In Chile, vouchers provided to promote school choice, combinedwith information, facilitated an increase in the stratification of schools—with students of high socioeconomic status going to good schools and studentsof low socioeconomic status going to the lower-quality schools (Hsiehand Urquiola 2006). Contreras, Flores, and Lobato (2004) argue that theChilean SNED system exacerbated socioeconomic inequalities—with largerlearning gains associated with higher baseline household income andparental education levels.Yet another potential pitfall of information-for-accountability interventionsthat rely on test scores relates to measurement issues. Test scores measurea variety of factors. While teachers and schools matter, the role of theinnate endowments of students, their socioeconomic backgrounds, and thelevel of support they receive from their families for education are all important.To the extent that test-score-based campaigns do not take those factorsinto consideration, they may be misleading. While such variables couldbe taken into account to some extent—as was done in Chile and Pakistan—the measurement issues related to test scores can be quite problematic.Kane and Staiger (2002) describe the properties of school test score measuresand forcefully argue that they are less reliable than commonly recognized.In particular, the small samples underlying average test scores for agrade from a particular school make that average a noisy measure—even(or perhaps especially) if adjusted for previous-year scores or observedcharacteristics. Mean reversion in test scores—the fact that positive (or negative)school-specific shocks in one year will be reversed in the subsequentyear—will lead to misguided interpretation of the role of information basedon test scores or the interventions based on them (Chay, McEwan, andUrquiola 2005). Kane and Staiger (2002) argue for the use of test scoresaveraged over time—an approach available only if there is frequent testing.Conclusion: Beyond Proof of ConceptDespite the theoretical appeal of information for accountability, the experienceto date suggests that it does not offer a silver bullet for solving issues
74 | <strong>Making</strong> <strong>Schools</strong> <strong>Work</strong>of service delivery. But that is probably too tall an order for any singleapproach. The evidence to date in developing countries—which is admittedlythin—suggests that information can lead to improvements in outcomes.This happened because information promoted effective choice andcompetition, because it enabled more effective participation in school oversightand management, and because it enabled citizens to hold local governmentsaccountable.Many questions remain open—for example, on the most effective waysto design information programs, or on the factors that enable or disableimpacts on learning outcomes, or on the way to collect and disseminateinformation. Given the cost-effectiveness of the information-for-accountabilityapproach, research into these areas is likely to be valuable. Priorityareas for research include those discussed in this concluding section.What Is the Best Target Audience—and How Is InformationInterpreted?The cases to date suggest variability in the extent to which target populations“absorb” information that is being disseminated. This variability couldoccur for various reasons. For example, if the information provided is notadditional—in the sense that it merely confirms people’s prior beliefs—thenone might expect minimal impact. This is consistent with the Chile SNEDresults, although the study in Pakistan found that the information wasinstrumental in narrowing the range of opinions about the quality ofschools and, in so doing, reduced the “noise” of people’s prior perceptions.The issue that deserves more attention, therefore, is the extent to whichinformation is merely confirmatory or whether it alters beliefs in a way thatmay motivate action.This is not to say that confirmatory information would not necessarily bevalue added. One of the hypotheses behind information as an accountabilitytool is that externally validated performance indicators provide parentsand other community stakeholders the basis for lobbying and monitoringschools and local governments. Even merely confirmatory informationcould still perform this function. The Pakistan study suggests that this maybe occurring (as one explanation for the impacts found in public schools),but there are other explanations as well. Understanding more about thispotential role of information would provide insights into the channelsthrough which it could improve outcomes.An additional dimension in the targeting of information campaignsrelates to the potential “capture” of the information. One of the generalfears about decentralization efforts is that they result in elite capture—theuse of the new powers by local populations who have power to further theirown objections, sometimes at the expense of the less well-off (Bardhan and
Information for Accountability | 75Mookherjee 2000, 2005). Information may have a heterogeneous impacton stimulating choice, participation, or voice in a way that disproportionatelybenefits the already advantaged, thereby aggravating inequalities.The results from the studies to date provide contrasting results on thatscore. The results from the Uganda newspaper campaign showed that theschools with the least political power benefited the most from the newtransparency in terms of reduction in leakage (Reinikka and Svensson2004). On the other hand, the results from the India three-state studyshowed that the non-Scheduled Caste and non-Scheduled Tribe membersof the school oversight committees showed the greatest change as a resultof the intervention. Moreover, the impacts found in the latter study werelargest in villages with low shares of Scheduled Caste and Scheduled Tribemembers in the population—suggesting some degree of elite capture.The extent to which the nature of the information, its packaging, and disseminationstrategies might mitigate or exacerbate this effect is somethingimportant to find out.Another way in which the nature of the information and the characteristicsof the target population interact is the extent to which information isprovided into a setting where education is valued. The low levels of popularengagement and knowledge about VECs documented in the Jaunpur Districtof Uttar Pradesh attest to a disconnect between the population and theeducation system. The interventions in India were all aimed at raising thatengagement, through awareness and knowledge building. But if the perceivedvalue of education is low—or low relative to the opportunity cost ofthe time required to participate in school activities, monitor teachers, ororganize and lobby governments—then it should not be surprising if informationhas no impact. Likewise, if people have become conditioned tohave low expectations for service delivery and do not believe their actionswill change the behavior of providers, they might not be willing to makethe effort to bring about that change since it is perceived as futile.How Does Information Interact with Collective Action?Some of the rationales for information campaigns depend on the ability ofparents and potentially other community members to undertake collectiveaction. Information is an input into processes of participation and voice,which require groups of people to coordinate their actions to influencefront-line providers and local governments. But collective action is notautomatic and depends, among other things, on the characteristics of thepopulation involved—for example, its heterogeneity.In addition, the nature of the information and the way it is disseminatedmatters. Information that enables private action—such as the reportcards in Pakistan—might have more impact than information that is
76 | <strong>Making</strong> <strong>Schools</strong> <strong>Work</strong>geared primarily toward facilitating collective action. In discussing theirstudy results from the Jaunpur District of Uttar Pradesh, India, the authorsattributed the impact of the reading classes versus the nonimpact of theinformation campaigns to this effect (Banerjee and others 2008). The formerwas a largely private endeavor that provided private benefits, whilethe latter requires coordination, for which there are large externalities toany individual behavior.What Information Has the Most Impact?As described above, the studies so far are quite different in terms of thetypes of information disseminated. In Chile and Pakistan, the emphasis wason externally validated and verified data on learning outcomes. Both ofthose studies, however, were quite different from the scorecard approachused in the India examples. In India, villagers were provided with the toolsto assess learning levels, but these were meant to be self-assessment tools(that is, not externally validated), with no comparators available or provided.In the Jaunpur District in Uttar Pradesh, India, the self-assessmenttool appeared to provide no benefit over and above the information onrights, roles, and responsibilities. In the India three-state study, it was notpossible to disentangle these effects. Understanding the importance of thecredibility and external validation of information on learning outcomeswould be important for policy development.The different cases have also highlighted alternative ways of presentinginformation on learning outcomes. In Chile, SNED built on an earlier effortbased on “raw” scores (SIMCE) and combined test scores with other indicators,such as the socioeconomic background of the school’s students, todetermine school performance. In Pakistan, the data were presented raw,with village- and district-level comparators provided to give context.More generally, the extent to which raw or value-added scores would bethe most effective is unknown (“value added” being defined either as overtime for the same students, for the same schools, or in terms of performanceover and above what is predicted by observed characteristics). Whilegreater sophistication in the way data are manipulated may serve to conveytheir meaning more accurately, this sophistication must be weighed againstthe extent to which the target audience understands and interprets thedata. The cases to date provide little guidance on how to make this tradeoff.Is There a Role for Strong Accountability inDeveloping Countries?One of the features of the evaluation studies in developing countries is thelack of strong accountability models. All of the approaches rely only on
Information for Accountability | 77information itself as a tool for accountability rather than on any explicitsanctions or rewards associated with it. The studies of strong accountabilityin the United States suggest that such measures can have strong impacts onoutcomes, albeit with potentially distortionary impacts, as previously discussed.Indeed, Winkler and Sevilla (2004) point to the lack of sanctionsand rewards related to performance as one of the salient factors of accountabilitysystems in developing countries.While no evidence suggests that strong accountability is an appropriatestrategy for developing countries (although chapter 4 provides evidencethat incentives can affect teacher behavior), the lack of studies suggests thatthis is a potential area for further research.What Can Providers Do with the Information, or the Pressure,They Receive?The extent to which schools can respond to information, to competitivepressures, or to parent participation will determine the extent to which oneshould expect any impacts. Indeed, if schools have no (or extremely limited)decision-making authority, then it would not be surprising to findlimited impact. The Pakistan study showed that private schools were theones most affected by the intervention—either by increasing quality orreducing fees (an option not open to public schools, which are free in Pakistan).One might expect that the ability of schools to realign expendituresand efforts to improve quality would matter in determining the potentialfor impact. None of the studies to date can shed much light on the extentto which information acts only as a complement to school autonomy (consistentwith the choice and participation channels for change) or whether itcan be, to some extent, a substitute.A related issue is that, even if schools have the authority and the abilityto make decisions, schools and teachers may not know how to improvequality. School administrators may be resistant to change because theydon’t know any other way of acting. Teachers may be reluctant to changeteaching methods. There is undoubtedly some truth to this—if it were easyto improve quality, it would likely have already happened. But the cases sofar suggest that schools, even in these poor settings, were able to makerelatively easy adjustments that are associated with improvements in quality.In Pakistan, the effective school day increased by about 30 minutes ininitially low-performing private schools. In the India three-state study,teacher attendance and teacher activity conditional on attendance (that is,the likelihood of a teacher being engaged in teaching activities at the timeof the unannounced visit) increased substantially in the two states whereteacher attendance and activity were initially lowest (Uttar Pradesh andMadhya Pradesh). In Liberia, the explicit teacher training that was overlaid
78 | <strong>Making</strong> <strong>Schools</strong> <strong>Work</strong>on top of the information intervention yielded dramatic impacts on reading(and measurable impacts on math) ability.These issues—the extent to which information can feed into decisionmaking at the school level and the degree to which schools know whichchanges to make—are taken up more explicitly in the next chapter, devotedto the evidence on school-based management.Notes1. Another aspect of the use of information not discussed here is the use of informationas a tool to stimulate demand. For example, the perceived return toeducation was low among youth in the Dominican Republic (Jensen 2010).When information about average rates of return was made available to a randomlyselected group of youths, they ultimately completed between 0.20 and0.35 more years of schooling. Other studies of the impact of information aboutthe costs or benefits of education have shown consistent results (Nguyen 2008;Dinkelman and Martinez 2010).2. Friedman (1955), advocating the use of vouchers to promote money-followsthe-studentschool choice, is largely credited with framing the notion of schoolchoice as a way to improve outcomes. See Hoxby (2003) for a more recentreview of the issues related to school choice in the United States.3. An example of the impact of oversight is in Jimenez and Sawada (1999), whichstudied the impact of El Salvador’s Educación con Participación de la Comunidad(Education with Community Participation, or EDUCO) “community-managed”school program. In that case, student test scores were higher, in partbecause of greater teacher effort (Sawada 1999).4. These reports, along with performance tables, can be accessed from http://www.dcsf.gov.uk/performancetables/.5. See http://www.ero.govt.nz/ for more details.6. Action plans included activities such as involving parents and older students intutoring activities, teachers following up more closely with students with difficulties,organizing classrooms into smaller groups, and addressing child laboractivities that are incompatible with schooling.7. In addition to these experiences, EMIS-based report cards have been implementedin Benin, Madagascar, Niger, and Togo more recently. These exerciseshave aimed at increasing accountability at the school level through public displayof the information and by helping management—for example, throughthe determination of school grants or the prioritization of schools for inspection.8. Flórez, Chesterfield, and Siri (2006) assessed the impact of CERCA schools bycomparing outcomes in these schools to those in “similar” nonparticipatingschools. However, the authors were not specific about how this comparisongroup was selected, nor did they document how similar or dissimilar the groupswere in terms of observable (and potentially unobservable) characteristics.9. These findings are similar to those in Kane and Staiger (2001, 2002) using U.S.data.
Information for Accountability | 7910. The authors argue that the potentially confounding fact that teachers in awardwinningschools also received a bonus would have relatively small impact onthe results. They argue that, if anything, the potential bias would be upward ashigher teacher salaries might make schools more attractive to parents. Otheranalysts have focused on the teacher incentive aspect of the program and arguethat this has indeed generated returns in the form of increased test scores (seethe discussion in chapter 4 about teacher accountability).11. Contreras, Flores, and Lobato (2004) evaluated the impact of the SNED teacherbonuses on testing achievement. They showed that there is a positive and significantcorrelation between winning the award and subsequent student performance.Primary schools that received an award in 2002 had higher mathscores in 2004, even after controlling for mothers’ schooling and householdincome and for homogenous group dummies and testing performance in theprevious two years for which scores were available. The data suggested similarconclusions for secondary schools.12. Based on EdStats “Country Trends and Comparisons,” available at http://go.worldbank.org/ITABCOGIV1.13. The evaluation summarized here was a part of a broader effort to “understandhow much learning is taking place and to identify what factors determine thequality of the education children receive” (Andrabi, Das, and Khwaja 2009).Details of the broader effort are at http://www.leapsproject.org.14. The cards in the second year of the program included information based onlearning gains between the first and second years.15. There was an additional protocol for distributing cards to the relatively smallshare of parents who did not attend the meetings.16. Districts included in the study were Sitapur, Pratapgargh, Hathras, and KanpurDehat in Uttar Pradesh; Dhar, Guna, Katni, and Raisen in Madhya Pradesh;and Bellary, Gulberga, Kolar, and Chikmagalur in Karnataka.17. The study computes this by using exposure to the intervention as an instrumentfor class participation in an instrumental variables analysis of the impactof reading clubs.18. “Score” refers to the percentage of students who can perform a competencycorrectly.19. The seven indicators used were letter fluency (per minute), phonemic awareness(of 10), familiar words (per minute), unfamiliar words (per minute), oralreading fluency (per minute), reading comprehension (%), and listening comprehension(%).20. The nine indicators were number identification, quantity discrimination (perminute), missing number, addition 1 (per minute), addition 2 (per minute),subtraction 1 (per minute), subtraction 2 (per minute), multiplication, andfractions (%).21. It is possible that the narrow nature of the indicators measured—letter fluency,unfamiliar word decoding—as opposed to a broad-based index contributed tothese large effect sizes.22. Li and others (2010) document how parental communication works as a complementto tutoring in improving learning outcomes in a randomized fieldexperiment in China.
80 | <strong>Making</strong> <strong>Schools</strong> <strong>Work</strong>ReferencesAkyeampong, Kwame. 2004. “Whole School Development in Ghana.” Backgroundpaper for the Education for All Global Monitoring Report 2005: The Quality Imperative,UNESCO, New York. http://unesdoc.unesco.org/images/0014/001466/146616e.pdf.Andrabi, Tahir, Jishnu Das, and Asim Khwaja. 2009. “Report Cards: The Impact ofProviding School and Child Test Scores on Educational Markets.” Unpublishedmanuscript, <strong>World</strong> <strong>Bank</strong>, Washington, DC.Banerjee, Abhijit V., Rukmini Banerji, Esther Duflo, Rachel Glennerster, and StutiKhemani. 2008. “Pitfalls of Participatory Programs: Evidence from a RandomizedEvaluation in Education in India.” Policy Research <strong>Work</strong>ing Paper 4584,<strong>World</strong> <strong>Bank</strong>, Washington, DC.Bardhan, Pranab, and Dilip Mookherjee. 2000. “Capture and Governance at Localand National Levels.” American Economic Review 90 (2): 135–39.———. 2002. “Decentralization of Governance and Development.” Journal of EconomicPerspectives 16 (4): 185–205.———. 2005. “Decentralizing Antipoverty Program Delivery in Developing Countries.”Journal of Public Economics 89 (4): 675–704.Bhatnagar, Deepti, Animesh Rathore, Magüi Moreno Torres, and ParameetaKanungo. 2003. “Empowerment Case Studies: The Filipino Report Card on Pro-Poor Services.” Case study commissioned by the <strong>World</strong> <strong>Bank</strong>, Washington, DC.http://siteresources.worldbank.org/INTEMPOWERMENT/Resources/14875_FilipinoReportCard-web.pdf.Björkman, Martina. 2006. “Does Money Matter for Student Performance? Evidencefrom a Grant Program in Uganda.” <strong>Work</strong>ing Paper 326, Institute for InternationalEconomic Studies (IIES), Stockholm University, Sweden.Björkman, Martina, Ritva Reinikka, and Jakob Svensson. 2006. “Local Accountability.”Seminar Paper 749, IIES, Stockholm University, Sweden.Björkman, Martina, and Jakob Svensson. 2007. “Power to the People: Evidencefrom a Randomized Field Experiment of a Community-Based MonitoringProject in Uganda.” Policy Research <strong>Work</strong>ing Paper 4289, <strong>World</strong> <strong>Bank</strong>,Washington, DC.Bradley, Steve, Robert Crouchley, Jim Millington, and Jim Taylor. 2000. “Testing forQuasi-Market Forces in Secondary Education.” Oxford Bulletin of Economics andStatistics 62 (3): 357–90.Brooke, Nigel. 2005. “Accountability educacional en Brasil, una vision general.”Document 34, Partnership for Educational Revitalization in the Americas(PREAL), Santiago, Chile.Bures, Laura. 2003. “Empowerment and Poverty Reduction: A Sourcebook.” PREMTools and Practices 16, <strong>World</strong> <strong>Bank</strong>, Washington, DC. http://siteresources.worldbank.org/INTEMPOWERMENT/Resources/486312-1098123240580/tool16.pdf.Burgess, Simon, Carol Propper, Helen Slater, and Deborah Wilson. 2005. “WhoWins and Who Loses from School Accountability? The Distribution of EducationalGain in English Secondary <strong>Schools</strong>.” Centre for Market and Public Organization<strong>Work</strong>ing Paper Series 05/128, University of Bristol, England.
Information for Accountability | 81Cameron, Laurie, Kurt Moses, and John Gillies. 2006. “School Report Cards: SomeRecent Experiences.” EQUIP2 Policy Brief, U.S. Agency for InternationalDevelopment. Washington, DC. http://www.equip123.net/docs/e2-Report-Cards_WP.pdf.Carnoy, Martin, and Susana Loeb. 2002. “Does External Accountability Affect StudentOutcomes? A Cross-State Analysis.” Educational Evaluation and Policy Analysis.24 (4): 305–31.Chakrabarti, Rajashri. 2006. “Vouchers, Public School Response and the Role ofIncentives: Evidence from Florida.” <strong>Work</strong>ing paper, Federal Reserve <strong>Bank</strong> ofNew York.Chay, Kenneth Y., Patrick J. McEwan, and Miguel Urquiola. 2005. “The CentralRole of Noise in Evaluating Interventions that Use Test Scores to Rank <strong>Schools</strong>.”The American Economic Review 95 (4): 1237–58.Clark, Melissa. 2003. “Education Reform, Redistribution, and Student Achievement:Evidence from The Kentucky Education Reform Act.” PhD dissertationchapter, Economics Department, Princeton University.Contreras, Dante, Lorena Flores, and Felix Lobato. 2004. “Monetary Incentives forTeachers and School Performance: Evidence for Chile.” Unpublished manuscript,Universidad de Chile, Santiago.Dedu, Gabriel, and Gibwa Kajubi. 2005. “The Community Score Card Process inGambia.” Participatory and Civic Engagement Social Development Note 100,<strong>World</strong> <strong>Bank</strong>, Washington, DC.Dee, Thomas, and Brian Jacob. 2009. “The Impact of No Child Left Behind on StudentAchievement.” National Bureau of Economic Research <strong>Work</strong>ing Paper15531, NBER, Cambridge, MA. http://www.nber.org/papers/w15531.pdf.Dinkelman, Taryn, and Claudia Martinez. 2010. “Investing in (Secondary) Schoolingin Chile.” Unpublished manuscript, Princeton University and Universidadde Chile.EdStats (database). <strong>World</strong> <strong>Bank</strong>, Washington, DC. http://go.worldbank.org/ITAB-COGIV1.ERO (Education Review Office). 2007. “The Collection and Use of AssessmentInformation in <strong>Schools</strong>.” ERO, New Zealand. http://www.ero.govt.nz.Figlio, David, and Cecilia Rouse. 2006. “Do Accountability and Voucher ThreatsImprove Low-Performing <strong>Schools</strong>?” Journal of Public Economics 90 (1–2): 239–55.Flórez, Ana, Ray Chesterfield, and Carmen Siri. 2006. “The CERCA School ReportCard: Communities Creating Education Quality. Final Report.” Academy forEducation Development, Global Education Center, Washington, DC.Friedman, Milton. 1955. “The Role of Government in Education.” In Economics andthe Public Interest, ed. R. A. Solo. Piscataway, NJ: Rutgers University Press.Gillies, John. 2004. “Strengthening Accountability and Participation: School Self-Assessment in Namibia.” EQUIP2 Policy Brief. U.S. Agency for InternationalDevelopment, Washington, DC. http://www.equip123.net/docs/e2-AcctParticipation_Policy%20Brief.pdf.Glewwe, Paul, and Michael Kremer. 2006. “<strong>Schools</strong>, Teachers, and EducationOutcomes in Developing Countries.” In Handbook of the Economics of Education,Vol. 2, ed. Eric A. Hanushek and Finis Welch, 946–1017. Amsterdam: NorthHolland.
82 | <strong>Making</strong> <strong>Schools</strong> <strong>Work</strong>Goldstein, Harvey. 2001. “Using Pupil Performance Data for Judging <strong>Schools</strong> andTeachers: Scope and Limitations.” British Educational Research Journal 27 (4):433–42.Hamilton, Laura, and Daniel Koretz. 2002. “Tests and Their Use in Test-BasedAccountability Systems.” In <strong>Making</strong> Sense of Test-Based Accountability in Education,ed. Laura Hamilton, Brian Stecher, and Stephen Klein, 13–49. Santa Monica,CA: RAND.Haney, Walt. 2000. “The Myth of the Texas Miracle in Education.” Education PolicyAnalysis Archives 8 (41).———. 2002. “Lake Woebeguaranteed: Misuse of Test Scores in Massachusetts,Part I.” Education Policy Analysis Archives 10 (24).Hanushek, Eric, and Margaret Raymond. 2003. “Lessons about the Design of StateAccountability Systems.” In No Child Left Behind? The Politics and Practice ofAccountability, ed. Paul Peterson and Martin West, 127–51. Washington, DC:Brookings Institution Press.———. 2005. “Does School Accountability Lead to Improved Student Performance?”Journal of Policy Analysis and Management 24 (2): 297–327.Hastings, Justine S., and Jeffrey M. Weinstein. 2008. “Information, School Choiceand Academic Achievement: Evidence from Two Experiments.” The QuarterlyJournal of Economics 123 (4): 1373–1414.Hoxby, Caroline. 2001. “Testing Is about Openness and Openness <strong>Work</strong>s.” HooverDaily Report, July 30. http://www.hoover.org/news/daily-report/24960.———. 2002. “The Cost of Accountability.” National Bureau of Economic Research<strong>Work</strong>ing Paper 8855, NBER, Cambridge, MA.———. 2003. The Economics of School Choice. Chicago: University of Chicago Press.Hsieh, Chang Tai, and Miguel Urquiola. 2006. “The Effects of Generalized SchoolChoice on Achievement and Stratification: Evidence from Chile’s SchoolVoucher Program.” Journal of Public Economics 90 (8–9): 1477–1503.Jacob, Brian. 2005. “Accountability, Incentives and Behavior: The Impact of High-Stakes Testing in the Chicago Public <strong>Schools</strong>.” Journal of Public Economics 89(5–6): 761–96.Jacob, Brian, and Steven D. Levitt. 2003. “Rotten Apples: An Investigation of thePrevalence and Predictors of Teacher Cheating.” The Quarterly Journal ofEconomics 118 (3): 843–77.Jenkins, Rob, and Anne Marie Goetz. 1999. “Accounts and Accountability: TheoreticalImplications of the Right-to-Information Movement in India.” Third<strong>World</strong> Quarterly 20 (3): 603–22.Jensen, Robert. 2010. “The (Perceived) Returns to Education and the Demand forSchooling.” The Quarterly Journal of Economics 125 (2): 515–48.Jimenez, Emmanuel, and Yasuyuki Sawada. 1999. “Do Community-Managed<strong>Schools</strong> <strong>Work</strong>? An Evaluation of El Salvador’s EDUCO Program.” <strong>World</strong> <strong>Bank</strong>Economic Review 13 (3): 415–41.Kane, Thomas, and Douglas Staiger. 2001. “Improving School Accountability Measures.”National Bureau of Economic Research <strong>Work</strong>ing Paper 8156, NBER,Cambridge, MA.———. 2002. “The Promise and Pitfalls of Using Imprecise School AccountabilityMeasures.” Journal of Economic Perspectives 16 (4): 91–114.
Information for Accountability | 83Karim, Shahnaz. 2004. “Transparency in Education: Report Card in Bangladesh.”International Institute for Education Planning Report, UNESCO, Paris.Keefer, Philip, and Stuti Khemani. 2005. “Democracy, Public Expenditures, and thePoor: Understanding Political Incentives for Providing Public Services.” <strong>World</strong><strong>Bank</strong> Research Observer 20 (1): 1–28.Khemani, Stuti. 2007. “Can Information Campaigns Overcome Political Obstaclesto Serving the Poor?” In The Politics of Service Delivery in Democracies: Better Accessfor the Poor, ed. Shantayanan Devarajan and Ingrid Widlund. Stockholm:Expert Group on Development Issues Secretariat, Ministry for Foreign Affairs.http://citeseerx.ist.psu.edu/viewdoc/download?doi=10.1.1.133.7367&rep=rep1&type=pdf.King, Elizabeth M., and Jere R. Behrman. 2009. “Timing and Duration of Exposurein Evaluations of Social Programs.” <strong>World</strong> <strong>Bank</strong> Research Observer 24 (1): 55–82.Koretz, Daniel. 2002. “Limitations in the Use of Achievement Tests as Measures ofEducators’ Productivity.” In Designing Incentives to Promote Human Capital, ed.Eric Hanushek, James Heckman, and Derek Neal. Special issue of The Journal ofHuman Resources 37 (4): 752–77.Kremer, Michael, Nazmul Chaudhury, F. Halsey Rogers, Karthik Muralidharan, andJeffrey Hammer. 2005. “Teacher Absence in India: A Snapshot.” Journal of theEuropean Economic Association 3 (2–3): 658–67.Ladd, Helen F., and Edward B. Fiske. 2003. “Does Competition Improve Teachingand Learning? Evidence from New Zealand.” Educational Evaluation and PolicyAnalysis 25 (1): 97–112.Lassibille, Gérard, Jee-Peng Tan, Cornelia Jesse, and Trang Van Nguyen. 2010.“Managing for Results in Primary Education in Madagascar: Evaluating theImpact of Selected <strong>Work</strong>flow Interventions.” <strong>World</strong> <strong>Bank</strong> Economic Review 24(2): 303–29.Leung, Grace. 2005. “Textbook Count and Civil Society Participation: Effecting SystemReforms in the Department of Education.” Government Watch and AteneoSchool of Governance Policy Report, Makati, Philippines.Li, Tao, Li Han, Scott Rozelle, and Linxiu Zhang. 2010. “Cash Incentives, Peer Tutoring,and Parental Involvement: A Study of Three Educational Inputs in a RandomizedField Experiment in China.” Unpublished manuscript, Peking University,China. http://mitsloan.mit.edu/neudc/papers/paper_223.pdf.Loveless, Tom. 2005. “Test-Based Accountability: The Promise and the Perils.”Brookings Papers on Education Policy (2005): 7–45.Majumdar, Sumon, Anandi Mani, and Sharun Mukand. 2004. “Politics, Informationand the Urban Bias.” Journal of Development Economics 75 (1): 137–65.Malena, Carmen, Reiner Forster, and Janmejay Singh. 2004. “Social Accountability:An Introduction to the Concept and Emerging Practice.” Social DevelopmentPaper 76, <strong>World</strong> <strong>Bank</strong>, Washington, DC.Mizala, Alejandra, Pilar Romaguera, and Miguel Urquiola. 2007. “SocioeconomicStatus or Noise? Tradeoffs in the Generation of School Quality Information.”Journal of Development Economics 84: 61–75.Mizala, Alejandra, and Miguel Urquiola. 2007. “School Markets: The Impact ofInformation Approximating <strong>Schools</strong>’ Effectiveness.” National Bureau of EconomicResearch <strong>Work</strong>ing Paper 13676, NBER, Cambridge, MA.
84 | <strong>Making</strong> <strong>Schools</strong> <strong>Work</strong>Muralidharan, Karthik, and Venkatesh Sundararaman. 2010. “The Impact of DiagnosticFeedback to Teachers on Student Learning: Experimental Evidence fromIndia.” The Economic Journal 120 (546): F187–F203.Nguyen, Trang. 2008. “Information, Role Models and Perceived Returns to Education:Experimental Evidence from Madagascar.” Massachusetts Institute ofTechnology <strong>Work</strong>ing Paper, MIT, Cambridge, MA.Ortega, Tamara. 2006. “Using Report Cards to Promote Better Education Policy inLatin America. PREAL’s Experience.” Paper prepared for the “Latin Americaand the Caribbean: Lessons from Best Practices in Promoting Education for All”joint Inter-American Development <strong>Bank</strong> and <strong>World</strong> <strong>Bank</strong> conference, Cartagenade Indias, Colombia, October 9–11.Pandey, Priyanka, Sangeeta Goyal, and Venkatesh Sundararaman. 2009. “CommunityParticipation in Public <strong>Schools</strong>: Impact of Information Campaigns in ThreeIndian States.” Education Economics 17 (3): 355–75.———. 2010. “Community Participation in Public <strong>Schools</strong>: Impact of InformationCampaigns in Three Indian States.” Draft. <strong>World</strong> <strong>Bank</strong>, Washington, DC.Paul, Samuel. 2002. Holding the State to Account: Citizen Monitoring in Action. Bangalore,India: Books for Change.Piper, Benjamin, and Medina Korda. 2010. “EGRA Plus: Liberia.” Program EvaluationReport draft, RTI International, Research Triangle Park, NC.Porta Pallais, Emilio, and Jennifer Klein. 2010. “Increasing Education Data Availabilityfor Knowledge Generation.” Background paper for the Education SectorStrategy, Human Development Network, <strong>World</strong> <strong>Bank</strong>, Washington, DC.Raymond, Margaret E., and Eric A. Hanushek. 2003. “High-Stakes Research.” EducationNext 3 (3). http://educationnext.org/highstakes-research/.Reinikka, Ritva, and Jakob Svensson. 2004. “Local Capture: Evidence from a CentralGovernment Transfer Program in Uganda.” The Quarterly Journal of Economics119 (2): 679–705.———. 2005. “Fighting Corruption to Improve Schooling: Evidence from a NewspaperCampaign in Uganda.” Journal of the European Economic Association 3 (2–3):259–67.———. 2006. “The Power of Information: Evidence from a Newspaper Campaignto Reduce Capture of Public Funds.” Unpublished manuscript, Institute forInternational Economic Studies, Stockholm, Sweden; <strong>World</strong> <strong>Bank</strong>, Washington,DC. http://people.su.se/~jsven/information2006a.pdf.Reinikka, Ritva, Jakob Svensson, and Carolyn Winter. 2006. “South Africa. CitizenReport Cards to Improve Service Delivery.” Document prepared for the “Monitoringand Impact Evaluation Conference” by the Presidency and the <strong>World</strong><strong>Bank</strong>, June 19–23.Ross, Kenneth. 2006. “SACMEQ—From Project to Development Model.” InternationalInstitute for Educational Planning Newsletter (January–March), UNESCO,Paris. http://www.unesco.org/iiep/eng/newsletter/2006/jane06.pdf.Rouse Cecilia, Jane Hannaway, Dan Goldhaber, and David Figlio. 2007. “Feeling theFlorida Heat? How Low-Performing <strong>Schools</strong> Respond to Voucher and AccountabilityPressure.” National Bureau of Economic Research <strong>Work</strong>ing Paper 13681,NBER, Cambridge, MA.
Information for Accountability | 85Sawada, Yasuyuki. 1999. “Community Participation, Teacher Effort, and EducationalOutcome: The Case of El Salvador’s EDUCO Program.” <strong>Work</strong>ing Paper307, William Davidson Institute, University of Michigan, Ann Arbor. http://wdi.umich.edu/files/publications/workingpapers/wp307.pdf.Tymms, Peter, and Carol Fitz-Gibbon. 2001. “Standards, Achievements and EducationalPerformance: A Cause for Celebration?” In Education, Reform and theState: Twenty-five Years of Politics, Policy and Practice, ed. Robert Phillips and JohnFurlong, 156–73. London: Routledge.United Kingdom. 2005. “14–19 Education and Skills.” White Paper presented toParliament by the Secretary of State for Education and Skills by Command ofHer Majesty, February 2005. http://news.bbc.co.uk/nol/shared/bsp/hi/pdfs/23_02_05_1419whitepaper.pdf.van der Linden, Geert. 2007. “Philippines—Textbook Count 3: Project CompletionAssessment.” Assessment note by the Partnership for Transparency Fund forGovernment Watch, Manila, Philippines. http://www.partnershipfortransparency.info/uploads/project%20assessment%20reports/Philippines%20G-Watch%20TextBkCount2PCA26jan07%20inc%20appendices.doc.Vasconcelos, Alcyon. 2003. “Education Management by Results.” Presentation to theHuman Development Forum. <strong>World</strong> <strong>Bank</strong>. Washington, DC, November. http://www1.worldbank.org/publicsector/decentralization/HDForum/BdaEDC.ppt.Waglé, Swarmin, Janmejay Singh, and Parmesh Shah. 2004. “Citizen Report CardSurveys—A Note on Concept and Methodology.” Social Development Note 91,<strong>World</strong> <strong>Bank</strong>, Washington, DC. http://siteresources.worldbank.org/INTPCENG/1143380-1116506267488/20511066/reportcardnote.pdf.West, Martin, and Paul Peterson. 2006. “The Efficacy of Choice Threats withinSchool Accountability Systems: Results from Legislatively Induced Experiments.”The Economic Journal 116: C46–C62.Wiley, Cathy. 1999. “Ten Years On: How <strong>Schools</strong> View Educational Reform.” Reporton 1999 survey, New Zealand Council for Educational Research, Wellington,New Zealand. http://www.nzcer.org.nz/default.php?products_id=247.Winkler, Donald. 2005. “Increasing Accountability in Education in Paraná State, Brazil.”EQUIP2 Policy Brief, U.S. Agency for International Development, Washington,DC. http://www.equip123.net/docs/e2-Increasing%20Accountability%20in%20Parana_PB.pdf.Winkler, Donald, and Jon Herstein. 2005. “Information Use and DecentralizedEducation.” EQUIP2 Policy Brief, U.S. Agency for International Development,Washington, DC. http://www.equip123.net/docs/e2-Information%20Use_PB.pdf.Winkler, Donald, and Maribel Sevilla. 2004. “Report Cards and Accountability inDecentralized Education Systems.” EQUIP2 Policy Brief, U.S. Agency forInternational Development, Washington, DC. http://pdf.dec.org/pdf_docs/PNADA604.pdf.<strong>World</strong> <strong>Bank</strong>. 2003. <strong>World</strong> Development Report 2004: <strong>Making</strong> Services <strong>Work</strong> for Poor People.New York: Oxford University Press.
3School-Based ManagementGood education is not only about physical inputs such as classrooms, teachers,and textbooks, but also about incentives that lead to better instructionand learning. Education systems are extremely demanding of the managerial,technical, and financial capacity of governments, and thus, as a service,education is too complex to be efficiently produced and distributed in acentralized fashion (King and Cordeiro-Guerra 2005).Hanushek and Woessmann (2007) suggest that most of the incentivesthat affect learning outcomes are institutional in nature. They identify threein particular:• Choice and competition. When parents who are interested in maximizingtheir children’s learning outcomes can choose to send their children tothe most productive schools they can find (in terms of academicresults), this demand-side pressure will give all schools an incentive toimprove their performance if they want to compete for students.• School autonomy. Similarly, local decision making and fiscal decentralizationcan have positive effects on outcomes such as test scores or graduationrates by holding the schools accountable for the “outputs” theyproduce.• School accountability. Quality and timely service provision can be ensuredif service providers can be held accountable to their clients (in the case ofeducation, students, and their parents).The increasing decentralization in education includes trends towardincreasing autonomy, devolving responsibility, and encouraging responsivenessto local needs—all with the objective of raising performance87
88 | <strong>Making</strong> <strong>Schools</strong> <strong>Work</strong>levels—across Organisation for Economic Co-operation and Development(OECD) countries (OECD 2004). Most countries whose studentsperform well in international student achievement tests give their localauthorities and schools substantial autonomy over adapting and implementingeducation content and allocating and managing resources. Witha few exceptions, most students in OECD countries are enrolled inschools where teachers and stakeholders play a role in deciding whichcourses are offered and how money is spent within the schools. Moreover,greater school autonomy is not necessarily associated with widerdisparities in school performance among schools if governments providea framework in which poorer-performing schools receive the necessarysupport to help them improve. In fact, Finland and Sweden—which areamong those countries with the highest degree of school autonomy onmany Programme for International Student Assessment (PISA) measures—have (together with Iceland) the smallest performance differences amongschools (OECD 2004).Decentralization in School-Based ManagementSchool-based management (SBM) is a form of decentralization. There arefour sources of authority: central government; provincial, state, or regionalgoverning bodies; municipal, county, or district governments; and schools(McGinn and Welsh 1999). Decentralization can occur from central governmentto lower levels of government or from lower-level government toschools. There are other names for this concept, but they all refer to thedecentralization of authority from the central government to the schoollevel (Barrera-Osorio, Fasih, and Patrinos 2009; Caldwell 2005).In SBM, responsibility for, and decision-making authority over, schooloperations is transferred to local agents, which can be a combination ofprincipals, teachers, parents, sometimes students, and other school communitymembers. An increasing number of developing countries areintroducing SBM reforms aimed at empowering principals and teachersor strengthening their professional motivation, thereby enhancing theirsense of ownership of the school. Many of these reforms have alsostrengthened parental involvement in the schools, sometimes by meansof school councils.SBM usually works through a school committee (or a school council orschool management committee) that may• monitor the school’s performance in, for instance, test scores or teacherand student attendance;• raise funds and create endowments for the school;
School-Based Management | 89• appoint, suspend, dismiss, and remove teachers and ensure that teachers’salaries are paid regularly; and• approve (albeit rarely) annual budgets, including the development budget,and examine monthly financial statements.Several initiatives seek to strengthen parents’ involvement in school managementthrough their involvement in the school committee. Parents participatevoluntarily and take on various responsibilities, ranging from theassessment of student learning to financial management. In some cases,parents are directly involved in the school’s management by being custodiansof the funds received and verifying the purchases and contracts madeby the school. Other times, school committees are also required to developsome sort of school improvement plan.There are many different forms of SBM in terms of who has the powerto make decisions as well as the degree of decision making devolved to theschool level. In general, SBM programs devolve authority over one or moreactivities, such as• Budget allocations• Hiring and firing of teachers and other school staff• Curriculum development• Procurement of textbooks and other education material• Infrastructure improvement• Monitoring and evaluation of teacher performance and student learningoutcomes.As a strategy, SBM aims to improve the financing and delivery of educationservices and quality. It encourages demand and ensures that schools reflectlocal priorities and values. By giving a voice and decision-making power tolocal stakeholders who know more about the local education systems thancentral policy makers do, SBM can improve education outcomes andincrease client satisfaction. SBM emphasizes the individual school (as representedby any combination of principals, teachers, parents, students, andother members of the school community) as the primary unit for improvingeducation and focuses on the redistribution of decision-making authorityover school operations as the primary means by which this improvementcan be stimulated and sustained.The potential benefits of SBM may include the following:• More input and resources from parents (whether in cash or in-kind)• More effective use of resources
90 | <strong>Making</strong> <strong>Schools</strong> <strong>Work</strong>• A higher quality of education through more efficient and transparentuse of resources• A more open and welcoming school environment• Increased participation of all local stakeholders in decision-makingprocesses• Improved student performance (lower repetition and dropout rates andhigher test scores).Toward a Theory of School-Based ManagementSBM is used to increase school autonomy and accountability, which canhelp solve some of the most fundamental problems in schools. Accordingly,while increasing resource flows and other support to the education sectoris necessary to give the poor greater access to quality education, it is by nomeans sufficient. It is also necessary to translate these resources into basicservices that are accessible to the poor. Therefore, under SBM, schools aregiven some autonomy over the use of their inputs and are held accountablefor using these inputs efficiently.The theoretical literature that promotes the use of SBM recommendsfour tenets for improving service delivery to the poor: increasing choice andparticipation, giving citizens a stronger voice, making information aboutschool performance widely available, and strengthening the rewards toschools for delivering effective services to the poor and penalizing thosewho fail to deliver.Framework for AccountabilityThe framework for analyzing the provision of education services definesfour aspects of accountability:• Voice: how citizens hold politicians and policy makers accountable• Compact: how public education policy is communicated• Management: how to produce effective best providers within organizations• Client power: how citizens as clients increase accountability of schools andsystems.Effective solutions are likely to involve a mixture of voice, choice, directparticipation, and organizational command and control. Figure 3.1 presentsthe <strong>World</strong> Development Report 2004 framework as a three-cornered relationshipbetween citizens, politicians, and service providers (<strong>World</strong> <strong>Bank</strong> 2003).
School-Based Management | 91Figure 3.1 The Accountability Framework in School-Based Managementthe statevoice/politicslong route of accountabilitycompactcitizens/clients client power providersshort routeSource: <strong>World</strong> <strong>Bank</strong> 2003.The service provision and accountability relationships among theseactors are complex. Even within each group of actors, there are usuallyheterogeneous subgroups, and the incentives and accountability relationshipsthat work for one group may be different from those that work forother groups.Long and Short Routes of AccountabilityTheoretically, SBM models encompass all four aspects of accountability.“Compact” refers to the long route of accountability, whereby the central governmentdelegates responsibility to the line ministries, who in turn delegateit to schools to perform various tasks. In this sense, in certain models ofSBM, the accountability of school principals is upward, to the ministry thatholds them responsible for providing the services to the clients—who, inturn, have put the policy makers in power and thus have the voice to holdthe policy makers and politicians accountable for their performance.In most cases of SBM, the management mechanisms change under SBMreforms; that is, the clients themselves become part of the managementalong with the front-line providers. Thus, the short route of accountabilitybecomes even shorter as representatives of the clients—either parents orcommunity members—get the authority to make certain decisions andhave a voice in decisions that directly affect the students who attend theschool. In the framework presented in figure 3.1, the school managers
92 | <strong>Making</strong> <strong>Schools</strong> <strong>Work</strong>(whether the principal alone or a committee of parents and teachers) act asthe accountable entity.When accountability fails, the failure can be tracked either to the longroute or to the short route. Sometimes improving the long route is a longtermprocess and, in some situations, may not be doable. In these cases,strengthening the short route can hold service providers directly accountableto the citizens or clients. The clients can improve service delivery by (1)using their voice to ensure that services are tailored to meet their needs and(2) monitoring the providers. In cases where short-route improvements arealready being tested or where society is amenable to long-route improvements,these tactics should be adopted.Autonomy and ParticipationSBM programs are far from uniform and encompass a wide variety ofdifferent approaches. As the definition of SBM reflects, it is a form ofdecentralization that makes the school the centerpiece of educationimprovement and relies on the redistribution of responsibilities as theprimary way to bring about these improvements. This definition leavesplenty of room for interpretation, and the reality is that many differentkinds of SBM are now being implemented. SBM reforms are shaped bythe reformers’ objectives and by broader national policy and social contexts.SBM approaches differ in two main dimensions: the “what” (thedegree of autonomy that is devolved) and the “who” (to whom thedecision-making authority is devolved).The SBM programs lie along a continuum of the degree to which decisionmaking is devolved to the local level—from limited autonomy, to moreambitious programs that allow schools to hire and fire teachers, to programsthat give schools control over substantial resources, to programs thatpromote private and community management of schools, to programs thatmay eventually allow parents to create their own schools.The other dimension is who gets the decision-making power when it isdevolved to the school level. In a simple world, the following four modelswould be sufficient to define who is invested with decision-making powerin any SBM reform (Leithwood and Menzies 1998):• Administrative control. SBM devolves authority to the school principal. Thismodel aims to make each school more accountable to the central districtor board office. The benefits of this kind of SBM include increasing theefficiency of expenditures on personnel and curriculum and making oneperson at each school more accountable to the central authority.• Professional control. SBM devolves the main decision-making authority toteachers. This model aims to make better use of teachers’ knowledge of
School-Based Management | 93what the school needs at the classroom level. Participating fully in thedecision-making process can also motivate teachers to perform betterand can lead to greater efficiency and effectiveness in teaching.• Community control. SBM devolves the main decision-making authority toparents or the community. Under this model, teachers and principals areassumed to become more responsive to parents’ needs. Another benefitis that the curriculum can reflect local needs and preferences.• Balanced control. SBM balances decision-making authority between parentsand teachers, who are the two main stakeholders in any school. Itaims to take advantage of teachers’ detailed knowledge of the school toimprove school management and to make schools more accountable toparents.Existing models of SBM around the world are generally a blend of thesefour models. In most cases, power is devolved to a formal legal entity inthe form of a school council committee, which consists of teachers andthe principal. The administrative control model can never exist in its pureform because principals can never operate on their own in practice. Principalsneed other people to work for them and to help them to makedecisions for the school.In nearly all versions of SBM, community representatives also serve onthe committee. As a result, school personnel can get to know the localpeople to whom they are ultimately accountable and are thus more likelyto take local needs and wishes into account when making decisions, in theknowledge that local residents can monitor what the school professionalsare doing. Although community involvement can improve program planningand implementation in these ways, occasionally school personnelinvolve community members only superficially in a way that does notcomplicate the lives of principals and teachers (Cook 2007). Parents andcommunity members have roles to play in SBM, but these roles are notuniversally clear and not always central. In some cases, the legal entitythat has the main authority to implement SBM is a parents’ council,although it cannot operate successfully without the support of the teachersand the principal.The autonomy-participation nexus defines the essence of an SBMreform. Figure 3.2 illustrates where a few of the more popular SBM reformsaround the world fall within this nexus.Adding AccountabilityThere is another link to the autonomy-participation chain: accountability.In a number of countries, as shown in table 3.1, the main objectives of
94 | <strong>Making</strong> <strong>Schools</strong> <strong>Work</strong>Figure 3.2 The Autonomy-Participation Nexus, Selected SBM ProgramsNetherlandsU.S.Niger (Chicago)QatarNew ZealandMadagascarGuatemalaRwanda El SalvadorGhanaautonomySenegal IndonesiaKenyaMozambiqueMexico PECMexico AGEprincipalteacherparticipationcommunity andparentscombinationSource: Barrera-Osorio, Fasih, and Patrinos 2009.Note: SBM = school-based management. AGE = Apoyo a la Gestión Escolar (Support toSchool Management Program). PEC = Programa Escuelas de Calidad (Quality <strong>Schools</strong>Program).introducing SBM include making schools more accountable and their managementmore transparent.Anderson (2005) has suggested that there are three types of accountabilityin SBM—that is, that those who run schools must be• accountable for adhering to rules and accountable to the educationauthorities;• accountable for adhering to standards and accountable to their peers;and• accountable for student learning and accountable to the general public.SBM programs both strengthen and simplify these types of accountabilityby empowering those at the school level to make decisions collectively,thus increasing the transparency of the process. Consequently, students’learning achievement and other outcomes can be expected to improvebecause stakeholders at the school level can monitor school personnel,improve student evaluations, ensure a closer match between school needsand policies, and use resources more efficiently. Thus, by its very nature,
School-Based Management | 95Table 3.1 School-Based Management Reforms in Selected CountriesCountryYear firstimplementedReform objectives,motivationSBM type aBrazil 1982 Increase efficiency,intermediateparticipationCambodia 1998 Improve education intermediateEl Salvador 1991 Increase access,participation; improvequality of schoolingstrongGambia, The 2008 Increase quality,awareness, coordinationamong stakeholdersGuatemala 1996 Increase access;decentralize decision making,participationHonduras 1999 Increase access in rural areas;encourage participationIndonesia 2005 Increase accountability toparents; enhance role ofcouncilsKenya 2003 Increase accountabilitythrough incentives andmanagementintermediatestrongstrongintermediateintermediateMadagascar 2005 Improve education intermediateMexico 1996 Increase parentalweakparticipation in rural schoolsMozambique 1997 Improve quality through weakdecentralized managementNicaragua 1991 Increase participation,strongresources; increase efficiencyRwanda 2005 Hire contract teachers;increase involvementof PTAsintermediateSenegal 2008 Improve teacher training intermediateThailand 1997 Improve quality of schooling; intermediateincrease competitivenessSource: Authors’ compilation; Gamage and Sooksomchitra 2004.Note: SBM = school-based management.a. “SBM type” is classified as strong, intermediate, or weak. “Strong”: Almost full controlof schools by councils, parents, and school administrators (including full choice throughcreation of new public schools) or high degree of autonomy given to councils overstaffing and budgets. “Intermediate”: Councils have authority to set curricula but limitedautonomy regarding resources. “Weak”: School councils established but serve mainly inan advisory role.
96 | <strong>Making</strong> <strong>Schools</strong> <strong>Work</strong>SBM has the potential to hold school-level decision makers accountable fortheir actions. However, in many countries, it may be necessary to build thecapacity of community members, teachers, and principals to create or augmenta culture of accountability.SBM Results ChainFour policy instruments can be used to link increased autonomy and standardizedfinancing with changes in the behaviors of stakeholders and processesat the local level (intermediate outcomes) toward making decisionsthat eventually lead to improved quality of learning. The four policy instrumentsare• Increased understanding of the rules of the game by which all stakeholders(central, local, and school-level) participate and interact in the educationsystem• Incentives for high performance at the school-level and consequences forschools that are noncompliant with rules and regulations• Strong assessment tools for local policy makers and school principals toevaluate value added and manage learning outcomes• Formal channels of participation for parents and community members (schoolcommittees) to support the processes of decision making at the school.There are different ways in which SBM may translate into behavior andprocess changes among stakeholders at the school level (Barrera-Osorio,Fasih, and Patrinos 2009). Changes in the behavior of stakeholders andprocesses at the local and school levels are denominated as intermediateoutcomes (listed in table 3.2) because they are the channels by which policiesat the national level can be translated into better learning outcomesand cost-effective financial management. A way to determine whethernational policies result in changes at the local level is to track the following:• Participation of stakeholders in certain areas of decision making• Changes in decisions made by the stakeholder to whom responsibility isdevolved• Frequency of decisions made.The decisions regarding school management (by the responsible stakeholder)and the frequency with which these are taken can be tracked asfollows:• Key decisions about personnel. Which aspects of hiring, firing, rotation time,and teacher training have been devolved to the school level? Who makes
School-Based Management | 97Table 3.2 Intermediate Outcomes from SBM ReformsOutcome Principal CommitteeDecisions about personnel (hiring, firing,Xrotation time, teacher training)Key decisions about spendingXChanges in the education processXResource mobilizationXChannels of direct involvementXLinks between parental involvement andXdecisions at the schoolChanges in accountingXChanges in school climateXSource: Adapted from Barrera-Osorio, Fasih, and Patrinos 2009.Note: SBM = school-based management.these decisions, and how frequently are they made? And how do parentsinfluence these decisions?• Key decisions about spending. Which stakeholders make decisions aboutexpenditures in infrastructure, administration, and staff? How do parentsand the community influence budget allocations? And how frequentlyare decisions made in this area?• Changes in the education process. What changes have occurred in educationmethods, allocation of teacher’s time in the classroom and in administrativetasks, absenteeism rates, and meetings with parents?• Resource mobilization. What is the flow of private donations and grantsresulting from active engagement of the school principal and parents?How SBM policies promote active involvement of parents and communities(through school councils) in school decisions and the extent to whichthey influence outcomes can be tracked by following these channels andoutcomes through the flow illustrated in figure 3.3:• Channels of direct involvement of parents and community in the school. Determinethe type of formal mechanisms that enable school councils to participatein school decisions, the frequency of the meetings, and the issuesdiscussed.• Links between parental involvement and decisions at the school level. Uncoverthe extent to which parental suggestions or complaints voiced throughschool councils are translated into actual decisions.
98Figure 3.3 From School-Based Management to Measurable Results• devolved responsibilityto local stakeholders• transparent financing• clarity of rules andresponsibilities• flexible and smarterfinancingincreasedautonomypolicy changes• information dissemination• incentives for improvedperformance• strong tools to assess andmanage• formal channels of participationand accountabilityDecisions and behaviors• by principals concerningschool internal processes• by parents concerningmonitoring of principalsand participation in schooldecisionsintermediateoutcomesfinal outcomes• increased learning• cost-efficient spending• equitable opportunitySource: <strong>World</strong> <strong>Bank</strong> 2010b.
School-Based Management | 99• Changes in accounting. Ascertain the extent to which increased parentalparticipation translates into more transparent and enhanced informationsystems that track students’ academic progress and the use of financialresources.• Changes in school climate. Track the extent to which increased parentalinvolvement influences the attitudes of teachers and students positivelyor negatively.Increased autonomy at the school level translates into greater efficiencybased on the idea that those who work at the school level and are involvedin the day-to-day operation of the school have greater knowledge andmanagement control of the needs of the school and therefore have a betterability to make decisions that are productive in terms of academic resultsand efficient spending (Barrera-Osorio, Fasih, and Patrinos 2009). Theidea behind involving parents and community members in decisions atthe school level is that the parents of children enrolled in the school havethe ability to improve their children’s education and that this demandpressure is likely to drive improvements in student achievement. Also, thisdemand pressure ensures that the unique needs of the local communityare addressed by the school—for example, by meeting the particular learningneeds of minority groups.Several instruments exist to measure change (Bauer 1997; Bauer,Bogotch, and Park 1998). However, the instruments and the scale ofmeasurement are difficult to put into practice. For instance, several of theproposed measures are perceptions, which are subjective and difficult tocompare. Some indicators by which to measure internal changes in SBMschools are described in table 3.3. When inputs inside the school (what theliterature refers to as “inside the black box”) change, education outcomescan change as well.Influential Practices from High-Income CountriesExperience in high-income countries suggests that SBM programs are nota quick fix. In fact, evidence from U.S. programs implemented in variouscities and states since the 1970s and 1980s, ranging from intermediate tostrong types of reforms, suggest that it takes time to see results in terms ofincreasing student test scores. 1 In fact, it is shown that SBM needs aboutfive years to bring about fundamental changes at the school level and abouteight years to yield changes in difficult-to-modify indicators such as testscores (Borman and others 2003; Cook 2007), as box 3.1 explains.Several high-income countries have pioneered long-term SBMapproaches, beginning with Australia. In 1966, the Australian Capital Territory(ACT) established a representative committee to recommend an
100 | <strong>Making</strong> <strong>Schools</strong> <strong>Work</strong>Table 3.3 Inside the Black Box: How to Measure the Impact of SBMProgramsDimension Objective Question type Question or topic examplesA. Education literatureScope Clarity of goals andreal influence of theboardDecisionmakingTrustImplementationpracticesB. Economic literatureInformationat local levelAccountabilityandmonitoringInteraction amongmembersChanges in keydecisionsInvolvement ofparents andcommunityBetter accountabilityand monitoringSelf-diagnosis; “siteteam” (community,council, or schoolboard)Self-diagnosis; “siteteam”Self-diagnosis; “siteteam”Personnel(teachers andadministrative)SpendingChanges ineducation processResourcemobilizationsDirect involvementin schoolLinks betweenparental involvementand decisionsChanges in theaccounting systemsof the schoolChanges in theclimate of theschoolSite team members agreeon what kinds of decisionsteam may make, or siteteam has influence onimportant issues.Members work to implementdecisions made, or memberswork to correct problemsthat arise during implementation.Site team members haveequal opportunity to beinvolved in decisions, or siteteam communicates openly.Who makes decisions aboutfiring, hiring, rotation time,training?Spending on infrastructure,trainingChange in pedagogy,changes in time allocation,absenteeism of teachersAmount of resources fromcommunityPower of board, type andnumber of meetings,decisions in meetingsDo complaints or praiseabout teachers translate intodecisions about the teacher?Implementation of EMIS,changes in account trackingsystemChanges in attitude ofteachers and students aboutthe schoolSources: Bauer, Bogotch, and Park 1998; Gertler, Patrinos, and Rubio-Codina 2007.
School-Based Management | 101BOX 3.1Eight Years to See ResultsIn a meta-analysis of the effectiveness of SBM models in the UnitedStates—or Comprehensive School Reform (CSR)—Borman and others(2003) reviewed 232 studies with 1,111 independent observations, representing29 CSR programs in the United States. From these observations,they computed the size of the effect that these models had onstudent achievement.The researchers regressed weighted effect size on the moderatorvariables to obtain the residuals from the regression and added themean weighted effect size to each observation, thus calculating effectsizes that were statistically adjusted for all of the methodological variables.They found that the number of years of CSR implementation,shown in figure B3.1, was a statistically significant predictor of thestudent achievement effect size.0.600.500.50adjusted effect size(standard deviation)0.400.300.200.100.170.14 0.150.130.250.230.390.001 2 3 4 5 6 7 8–14years of SBM program implementationSource: Borman and others 2003.Note: SBM = school-based management.alternative model of school governance. The result was the Currie Report of1967, which recommended that each school have a representative governingbody consisting of teachers, parents, local community members and,in the case of secondary schools, students (Currie 1967). In 1974, the conceptwas implemented at ACT schools. By 1976, ACT, Victoria, and SouthAustralia were to establish school councils or boards as mandatory, corporategoverning bodies to manage their schools, with varying degrees ofauthority devolved to the school level. By the late 1990s, all eight Australianschool systems had enacted legislation introducing reforms involving SBM.
102 | <strong>Making</strong> <strong>Schools</strong> <strong>Work</strong>In 1988, New Zealand introduced SBM by establishing representativeboards of trustees at the school level. More than 90 percent of the cost ofrunning each school was devolved to schools in the form of school-basedbudgets with authority to govern the school, including recruitment andemployment of staff by the board.In the United States, A Nation at Risk (Gardner 1983) led to the adoptionof SBM in many schools and states—most radically in Illinois. In 1988, theSchool Reform Act instituted school councils as mandatory throughout theUnited States.In Great Britain, the 1988 Education Reform Act empowered schoolcommunities to establish boards as mandatory, corporate bodies consistingof the head teacher and governors elected by the parents, teachers, andnominees of the local authority. Under the Act, the Thatcher governmentgave public secondary schools the option of leaving local education authoritycontrol and becoming autonomous, grant-maintained (GM) schools.GM schools were funded by a new agency but were owned and managedby each school’s governing body, a new 10- to 15-member entity composedof the head teacher and teacher and parent representatives. Control over allstaff contracts and ownership of the buildings and grounds were takenfrom the local school district and given to GM schools.Between 1988 and 1997, among almost 1,000 schools holding votes onthe matter, most favored conversion to GM status. An important study,using regression discontinuity design, found large achievement gains atschools in which the vote barely won, compared with schools in which itbarely lost (Clark 2009). Student achievement improved by 0.25 of a standarddeviation in pass rates on standardized examinations.Assessing the EvidenceFrom the previous literature, there are a few well-documented cases ofSBM and some documented cases of success, but the sample of carefullydocumented, rigorous impact evaluations is small compared with the largenumber of known SBM programs around the world. Some studies foundthat SBM policies actually changed the dynamics of the school, eitherbecause parents got more involved or because teachers’ actions changed.Several studies presented evidence that SBM had a positive impact on repetitionrates, failure rates, and, to a lesser degree, dropout rates. The studiesthat had access to SBM’s impact on some variables—mainly in reducingrepetition and failure and improving attendance rates—in contrast to SBM’smixed results on test scores could be due to timing.Timing is important. As previously discussed, SBM reforms generallytake a long time to produce their expected outcomes. In the first year or so
School-Based Management | 103of an SBM reform, there is an adjustment period during which changesin personnel occur and management changes (for example, the creationof a school council) are gradually put into operation. In the short run,these adjustments can have a negative impact on education outcomes,but once the school adjusts to the changes, positive changes can beexpected. The speed of the effect depends as well on the type of outcomesbeing assessed. Some outcomes can be expected to change faster thanothers because the incentives that drive them are easier to change. Forinstance, attendance rates, measured by the number of days which studentsare present at school, are easier and faster to change than enrollmentrates. So, in the short run, an SBM intervention can have a positive impacton attendance, reducing repetition, and failure rates, but outcomes such asdropout rates or test scores take longer to change.Despite the difficulty of establishing the sizes of the outcome variables ofinterest due to the different metrics used in the various studies, it is neverthelesspossible to list some findings about the impact of SBM based onprevious rigorous analyses:• Some studies found that SBM policies actually changed the dynamics ofthe school, either because parents got more involved or because teachers’actions changed (King and Özler 1998; Jimenez and Sawada 1999;Gunnarsson and others 2004).• Several studies presented evidence that SBM had a positive impact onreducing repetition rates, failure rates, and, to a lesser degree, dropoutrates (Di Gropello and Marshall 2005; Jimenez and Sawada 2003;Gertler, Patrinos, and Rubio-Codina 2006; Paes de Barros and Mendonca1998; Skoufias and Shapiro 2006).• The studies that had access to standardized test scores presented mixedevidence, with countries like El Salvador, Kenya, Mexico, and Nicaraguashowing positive results (Jimenez and Sawada 2003; Sawada and Ragatz2005; Lopez-Calva and Espinosa 2006; King and Özler 1998). Otherreforms such as those in Brazil and Honduras appear to have had noeffects on test scores. Many of the more rigorous studies are still in earlystages of implementation. Therefore, few changes have been recordedthus far in terms of test scores, or the evidence presented is very preliminary.Three studies allowed at least eight years before measuring the effects ofthe SBM intervention on test scores (Paes de Barros and Mendonca1998; Lopez-Calva and Espinosa 2006; Parker 2005). Paes de Barros andMendonca (1988) found that the reform in Brazil had produced no testscore improvements after 11 years of implementation, but the other twostudies showed that the reforms in Nicaragua and Mexico had positive
104 | <strong>Making</strong> <strong>Schools</strong> <strong>Work</strong>effects on test scores after 11 and 8 years, respectively. Other studies measuredSBM’s impact on repetition and failure rates (intermediate indicators)closer to the initial implementation period. The authors of those studiesfound positive effects after only two years of implementation in the case ofrural Mexico (Gertler, Patrinos, and Rubio-Codina 2006) and after only twoto three years in urban Mexico (Skoufias and Shapiro 2006).New studies of SBM reforms have validated and expanded upon theprevious findings. Moreover, many of the new studies are based on randomizedcontrol trials, based on carefully designed experiments. Some ofthese experiments, especially in Mexico, are based on rather large samples.The presentation below of these results follows the typologies listed above—that is, beginning with strong versions of SBM (those where the schoolpersonnel can be hired and fired directly by the school councils), followedby the intermediate and weak versions of SBM.Evidence from Strong Forms of SBMOne of the senior versions and early evaluations in the SBM literature is theEDUCO model of El Salvador. The reform began in 1991 under the nameEducación con Participación de la Comunidad (Education with Community Participation,or EDUCO). EDUCO schools are publicly funded, and studentsreceive free tuition, textbooks, uniforms, registration, and basic school supplies.In return, parents are expected to contribute meals, time, and in somecases, their labor to improve schools. The distinguishing feature of EDUCOschools is the Association for Community Education (ACE). Each schoolhas an ACE, consisting of five community-elected members. ACEs receivefunds directly from the Ministry of Education and are responsible for enactingand implementing ministry and community policies and for the hiring,firing, and monitoring of teachers (Sawada and Ragatz 2005).Evaluations of the EDUCO schools found a steady increase in studentenrollments, which could be directly attributed to the program (Di Gropello2006). Student enrollments in EDUCO schools went from 8,500 students in1991 to more than 320,000 students in 2001. This represented 50 percentof rural enrollments and 37 percent of total enrollments in the first throughninth grades (Di Gropello 2006).In addition, Jimenez and Sawada (2003) found that, after controlling forchild, household, and school characteristics, third graders in EDUCO schoolswere more likely than third graders in traditional schools to be studying inthose same schools two years later. Jimenez and Sawada’s continuationProbit coefficient for EDUCO schools was 0.36. This suggested that attendingan EDUCO school raised the probability of continuing in school by64 percent compared with attending a non-EDUCO school. These resultsattempted to control for selection bias, and in addition they used 1996 test
School-Based Management | 105scores to control for initial differences in achievement between traditionaland EDUCO schools that might have affected dropout behavior. The studiesalso found that supply-side constraints were important in EDUCO schools;that is, most EDUCO schools do not offer the fourth through sixth grades,and this affects continuation rates. This is evident from the fact that, if thevariable measuring the number of second-cycle sections in the schools isdropped from the models, the EDUCO dummy loses significance. To investigatethe EDUCO effect further, the authors added a community participationvariable to the estimation. The EDUCO coefficient lost magnitude andsignificance, and at the same time community participation emerged as apositive and statistically significant variable. The authors thus concludedthat a significant portion of the EDUCO effect could be explained by communityparticipation (Jimenez and Sawada 2003).With respect to effects on teachers’ behavior, Jimenez and Sawada (1999)found that students in EDUCO schools were less likely to miss school due toteacher absences. A more recent study by Sawada (1999) measured teachers’effort in terms of their overall attendance and the number of hours theyspent on parent-teacher meetings. He found that EDUCO teachers mademore effort (only when effort was defined as hours of parent-teacher meetings)than teachers in traditional schools. Instrumental variables were usedto reduce the endogeneity between community participation and observedeffort.Sawada and Ragatz (2005) used propensity score matching to identifythe EDUCO effect on teacher behavior, administrative processes and, ultimately,student test scores. They found that community associations managingEDUCO schools felt that they had more influence in virtually everyadministrative process than did the equivalent associations in traditionalschools. In particular, the hiring and firing of teachers appeared to be oneof the administrative processes over which the associations had the mostinfluence. The authors also found that teachers in EDUCO schools spentmore time meeting with parents and more time teaching and were absentfor fewer days than teachers in traditional schools.Last, with respect to parental involvement, parent associations in EDUCOschools visited classrooms more than once a week on average, which wasalmost three to four times more than parent associations in traditionalschools (Jimenez and Sawada 2003). EDUCO schools also had better classroomenvironments (measured by smaller classroom sizes and the availabilityof a classroom library), leading to higher student test scores in thirdgrade (Sawada 1999).Impacts on learning outcomes are more limited. Jimenez and Sawada(1999) used a two-stage regression procedure to attempt to correct forselection bias. (In other words, schools that choose to become autonomousmay be different in some unobservable variables that can be correlated with
106 | <strong>Making</strong> <strong>Schools</strong> <strong>Work</strong>the outcome of interest.) They found that there were no statistically discernibleeffects of attending an EDUCO school on either math or languagetest scores among third graders. It should be noted that EDUCO schoolstend to be located in poor, rural, isolated communities. Therefore, it mightbe reasonable to expect to see lower test scores among EDUCO studentsbecause of their disadvantaged backgrounds. Nonetheless, these resultssupport the idea that devolving autonomy over decision making to theschool level leads to a closer monitoring of teachers, which in turn resultsin greater teacher effort.Similarly strong versions of SBM from other parts of Central Americahave been evaluated. The school autonomy reform in Nicaragua allowedcouncils to fire and hire school principals and become involved in maintainingschool facilities and ensuring academic quality (Parker 2005; Kingand Özler 1998). King and Özler (1998) studied the effects of school autonomyon student test scores in mathematics and Spanish using a matchedcomparison design based on selecting a sample of treatment schools (autonomousschools) and a comparison group of nonautonomous public schoolsand private schools. The authors found that de jure autonomy had no statisticallysignificant effects on student achievement. However, de facto autonomyhad positive effects on student promotion and student achievement inmath and language in primary school and in language in secondary school.Arcia, Porta Pallais, and Laguna (2004) also found that the SBM reformin Nicaragua had a positive effect on student achievement. An attitudinalsurvey of school directors, teachers, and school council members in autonomousschools determined that several factors related to school managementchanged for the better under autonomy. The results showed a broadconsensus among directors, teachers, and council members that schoolautonomy had brought improvements in teacher and student attendance,school discipline, and infrastructure. The director and council membersagreed that they shared equal power in matters relating to the annualschool plan and in the administration of the budget. Teachers seemed toagree that discipline and attendance had improved, but they felt that autonomyhad not improved their salaries (Arcia, Porta Pallais, and Laguna2004).A subsequent analysis looked at the effects on student achievement oftwo more refined measures of autonomy (King, Özler, and Rawlings 1999).The first variable measured the percentage of decisions made by the schoolcouncil concerning pedagogical issues (such as class size, curriculum, andtextbooks). The second variable was the percentage of decisions related toteachers (hiring and firing, evaluation, supervision, training, and relationswith the teachers’ union). The study’s findings about the influence ofautonomy over pedagogical issues on student achievement were mixed.This is not surprising given that the SBM reform did not have significant
School-Based Management | 107effects on schools’ decision making on pedagogical matters. However, itappeared that having more autonomy over teacher-related issues didhave a positive and significant effect on student achievement in both primaryschool (both subjects) and secondary school (language only).Increasing schools’ influence over teacher-related decision making wasthe area of the decentralization reform that appeared to have had thelargest effect on student achievement (King, Özler, and Rawlings 1999).Using more recent (and nationally representative) data from 2002, Parker(2005) found that school autonomy had positive effects on third-grademathematics test scores but negative effects on sixth-grade math scores.In Guatemala, after controlling for student, teacher, and school factors,SBM schools outperformed traditional schools in reading (Di Gropello2006). Teachers in autonomous schools resigned at a much higher rate(three times higher) than teachers in traditional schools, possibly becausethey found better salaries, working conditions, and job security in traditionalschools (Di Gropello 2006.).In Nepal, the government transferred responsibility for managing schoolsfrom the state to the community. Community schools in Nepal, workingthrough a school management committee consisting of parents and influentiallocal citizens, are given decision-making powers over various staffingand fiscal issues. Community-managed schools may repost regular (government)teachers back to the district headquarters, directly hire and firecommunity-recruited teachers, and index teacher salaries to school performance.The community-managed schools are also given more untied blockgrants so that the management committee has more control over discretionaryspending. Since participation in the program is under the discretionof the community, an exogenous instrument was introduced in the form ofan advocacy group working with randomly chosen communities to persuadethem to participate in the program (Chaudhury and Parajuli 2010).Short-run (2007–09) impact estimates (derived from an empirical strategythat combined instrumental variables and difference-in-differences methods)suggested that devolving management responsibility to communitieshad a significant impact on certain schooling outcomes related to accessand equity. There is yet no evidence of improved learning outcomes.Das (2008) studied a reform in Pakistan where a nongovernmentalorganization (NGO) was hired to manage a school together with the schoolcouncil. Both the managed school and the regular school received about$4,000 for school needs. The NGO was allowed to transfer teachers as well.Between 2004 and 2008, this randomized control trial (original randomizationwas not fully upheld, so analysis was performed using intent totreat) had yet to show any effects on student enrollment, teacher absenteeism,or the facilities index (infrastructure). It may be possible that theeffects of school council management will only be evident in the long term.
108 | <strong>Making</strong> <strong>Schools</strong> <strong>Work</strong>Nevertheless, the proportion of council members whose children wereattending the managed school significantly increased.Evidence from Intermediate Forms of SBMBeginning in 1982, several states in Brazil experimented with differentforms of SBM. Three key innovations stand out in the Brazilian experiencewith SBM:• <strong>Schools</strong> have been given financial autonomy.• Principals are elected democratically by school officials, parents, and students;competitively appointed by local governments through examinations;or selected through a combination of election and appointment.• Councils are established in the schools to coordinate and evaluate theirpedagogical, administrative, and financial activities.The school councils comprise the principal, representatives of teachers andother staff, and representatives of parents and students (Paes de Barros andMendonca 1998). Only four states implemented all three reforms in a coordinatedway: Minas Gerais, Rio Grande do Norte, Espirito Santo, and MatoGrosso do Sul (Paes de Barros and Mendonca 1998).Another set of SBM reforms began in 1998 and reached more than 5,600schools by 2001. These reforms, known as the Plano de Desenvolvimento daEscola (School Development Plan, or PDE), were designed to make schoolsmore responsive to students and their communities. Under PDE, schoolsengage in a self-evaluation, develop a school plan focusing on two or three“efficiency factors” (one of which has to be effective teaching and learning),and design actions intended to enhance those factors. A program created bythe Ministry of Education to strengthen the schools—Fundescola (Fund forStrengthening the School)—provides funds to support the goals and projectsof PDE schools (Carnoy and others 2008).Paes de Barros and Mendonca (1998) used census, household survey,and evaluation data from the National Basic Education System to carry outan empirical investigation into the effects of the three initial SBM innovationson student achievement. They measured the effects by assessing students’average performance in mathematics, language, and science in thefirst, third, fifth, and seventh grades in each school. (Test scores were averagedat the school level because not all grades were examined in thesethree subjects.)For the study, the authors included such control variables as mean percapita family income, average teacher quality, and average educationattainment. The unit of analysis was the state, and the time period for thestudy was 1981 to 1993 (some analyses used fewer years because of data
School-Based Management | 109restrictions). The authors’ empirical strategy was to compare the performanceon the states’ various outcomes by using the time variation in theimplementation of the innovations by each state. Their results suggestedthat the financial autonomy reforms did not lead to better student performance(Paes de Barros and Mendonca 1998). However, education performancetended to be better in places where principals were elected by schoolofficials, parents, and students over 16 years old; where schools had beengranted financial autonomy; or where school councils had been established.To control for unobserved heterogeneity, the authors included aseries of controls to try to capture any relevant omitted variables, whichreduced the magnitude and significance of the aforementioned effects. Theonly outcome for which the results appeared robust to the introduction ofadditional controls was repetition rates. The inclusion of additional controlshighlighted the fact that granting financial autonomy to schools was moresignificant than introducing school councils or electing principals. Theauthors concluded that their results showed that these innovations had hada generally positive but modest impact on education performance definedbroadly. As to which innovation was the most promising, the authorsattached more significance to financial autonomy and much less significanceto the election of principals (Paes de Barros and Mendonca 1998).The descriptive evaluation of the PDE by Carnoy and others (2008)found that although the program did affect what went on in schools (interms of such activities as planning, participation of parent-teacher associations,and suitable working conditions for teachers), it did not appear tohave any significant effect on reading and math scores.In Kenya, with the introduction of free primary schools in 2003, parentswere no longer required to pay fees. This change resulted in large increasesin student enrollment and increased pupil-teacher ratios significantly inprimary schools. It also meant that school committees could no longer raisesufficient funds to pay for parent-teacher association (PTA) teachers. Communitymembers participate in schools by serving on school committees orPTAs consisting of elected parents and representatives from the DistrictEducation Board. In general, the committee’s authority is limited to suggesting(to the Ministry of Education) promotions and transfers of teachers,overseeing expenditures from capitation grants, and participating in thedesign and implementation of school development plans.A recent pilot program in Kenya, called the Extra Teacher Program(ETP), provided funds to 140 schools randomly selected from a pool of210 schools to hire an extra teacher for first-grade classes. In half of these140 schools (nontracked ETP schools), first-grade students were randomlyassigned to either the contract teacher or a civil service teacher. In the otherhalf (tracked ETP schools), first-grade classes were divided into two classesby initial achievement, and those classes were randomly assigned to either
110 | <strong>Making</strong> <strong>Schools</strong> <strong>Work</strong>a civil service teacher or a contract teacher. The program was funded by the<strong>World</strong> <strong>Bank</strong> and International Child Support Africa (ICS), an NGO workingwith schools in the region.Among the 140 schools that received funding to hire a contract teacherfrom the local area, 70 schools were randomly selected to participate in anSBM intervention, in which school committees monitored the performanceof these contract teachers. In the SBM schools, the school committees helda formal review meeting at the end of the first school year of the program(2005) to assess the contract teacher’s performance and decide whether torenew the teacher’s contract or to replace him or her. To prepare the schoolcommittees for this task, the ICS provided members with a short, focusedtraining course on how to monitor the contract teacher’s performance,including techniques for soliciting input from parents and checking teacherattendance. A subcommittee of first-grade parents was formed to evaluatethe contract teacher and to deliver a performance report at the end of thefirst year (Duflo, Dupas, and Kremer 2007).Eighteen months into the program, students in all treatment schoolshad, on average, test scores that were a 0.23 standard deviation higher thanstudents assigned to civil service teachers. Also, the scores were a 0.3 standarddeviation higher than those of students in non-ETP schools. All differenceswere statistically significant at conventional levels. The effect of thecontract teacher appeared to be larger when the school committee wasgiven training in how to handle the contract teachers (Duflo, Dupas, andKremer 2007). The authors also reported evidence that the SBM initiativewas helpful in raising the test scores of the students of civil service teachers,just as it was successful in decreasing the classroom absence rates of theseteachers. Students with civil service teachers in ETP schools that participatedin the SBM program scored a 0.18–0.24 standard deviation higher inmathematics than their counterparts in ETP schools that did not participatein the SBM program.A more detailed look at the results suggests that, with respect to teacherabsences, civil service teachers in untracked schools that did not participatein the SBM program were more likely to be absent from class than the comparisongroup (teacher attendance fell by 21 percentage points). Theauthors argued that this finding suggested that civil service teachers tookadvantage of the presence of the extra contract teachers to work less. However,civil service teachers in untracked SBM schools were 7.8 percentagepoints more likely to be found teaching in class during random spot checksby the NGO. The authors argued that it is likely that the SBM initiativeemphasized the responsibility of the contract teacher with respect to thespecific class to which he or she was assigned and thus made it more difficultfor the principal or the civil service teachers in those schools to use theextra teacher to relieve themselves of their own duties when they actually
School-Based Management | 111did show up to school. Also, the contract teachers in these schools had agreater incentive to please the school committee and less of an incentive toplease the other teachers and the principal (Duflo, Dupas, and Kremer2007).The authors also argued that the SBM initiative reinforced the role ofparents (as opposed to principals, who often dominate the committees) inhiring, monitoring, and retaining the contract teachers. Although parentswere instructed in how to monitor the contract teachers, the SBM initiativedid not have a significant impact on the attendance records of, or the effortsmade by, the contract teachers (perhaps because this was already satisfactory),but the initiative did increase the efforts of civil service teachers.Furthermore, the authors argued that the superior performance of contractteachers might have resulted from either better teacher choice by theschool committees or the stronger incentives faced by contract teachers.Last, the authors noted that contract teachers might have viewed their owngood performance as a stepping stone to a tenured civil service position.The effect was larger when the school committees were trained in teachermanagement. Parental involvement in school management seemed to beeffective; civil service teachers were more likely to be in class and teachingduring random visits in schools where the school committee was empoweredto monitor teachers than in schools without the monitoring (Duflo,Dupas, and Kremer 2009). Furthermore, the authors found evidence thatsuggested the students of civil service teachers in schools with empoweredparent committees performed better (particularly in math) than their counterpartsin schools without empowered committees. This finding suggeststhe importance of a significant reform of the education system: paying lipservice to parents’ participation is not sufficient if parents are not givenconcrete means of being effective.In 2001, Mexico implemented the Programa Escuelas de Calidad (Quality<strong>Schools</strong> Program, or PEC). This program seeks to provide more autonomyto schools by giving them five-year grants of up to $15,000 to improve educationquality (Skoufias and Shapiro 2006). In exchange for PEC grants,schools must prepare an education improvement plan that outlines howthey intend to use the grant. Parent associations must be involved in thedesign, implementation, and monitoring of the plan. In the first four years,about 80 percent of the grant must be spent on school materials and facilities.In the fifth year, only part of the money must be spent on such goods,with a large proportion of the grant going to fund teacher training anddevelopment. Participation in PEC is voluntary, but the program targetsdisadvantaged urban schools.PEC has been credited with preventing and limiting corrupt practices inthe management of education funds (Karim, Santizo Rodall, and Mendoza2004) because the school councils are accountable both to their central
112 | <strong>Making</strong> <strong>Schools</strong> <strong>Work</strong>education authorities (vertical accountability) and to the school communityand donors (horizontal accountability). If expanded, this program hasthe potential to reduce petty corruption (Transparency International 2005;Patrinos and Kagia 2007).Skoufias and Shapiro (2006) used panel data regression analysis andpropensity score matching to evaluate the impact of PEC on student dropout,failure, and repetition rates using a nationally representative panel dataset covering the 2001/02 and 2003/04 school years. To establish a comparisongroup, they used student outcome data for the years 2000 (the yearbefore the first schools joined PEC) and 2003. Their difference-in- differencesapproach assumed no differences in time trends in student outcomes. Tosupport this assumption, the authors included several controls at the schooland municipal levels taken from 2000 data, such as teacher-student ratio,school type, and participation in poverty reduction programs. They alsoused propensity score modeling to match treatment to comparison schoolsbased on these same data.The authors found that PEC participation decreased dropout rates by0.24 points, failure rates by 0.24 points, and repetition rates by 0.31 points.To explore what brought about these results in PEC schools, the authorsused qualitative data on PEC school effectiveness and parental involvement.They found that parents had increased their participation in theschools and their supervision of students’ homework. Moreover, studentsenrolled in PEC schools and their parents expected that these studentswould progress to more advanced education levels (Skoufias and Shapiro2006). Unfortunately, the authors did not have qualitative data on non-PEC schools and so were not able to investigate whether the changes thathad occurred at PEC schools were unique and could reasonably be thecause of improvements in outcomes. Therefore, it cannot be concluded thatthese qualitative changes could be attributed solely to the participation ofthe schools in the PEC program.Murnane, Willet, and Cardenas (2006) suggested that they could not.Using longitudinal data from the seven full academic years of PEC (Skoufiasand Shapiro used only two years of outcome data), they found that PECschools had a different outcome trend than non-PEC schools in the yearsbefore participating in the program. To avoid violating this key assumption,Murnane, Willet, and Cardenas used the schools that entered PEC in theprogram’s second year of operation (the second cohort of PEC, or “PEC2,”schools) as the treatment schools. Unlike the schools that entered PEC in itsfirst year, PEC2 schools had no pre-PEC outcome trends that were significantlydifferent from the comparison schools; the PEC2 schools, thus, representa more credible counterfactual. The authors’ results showed thatparticipation in PEC decreased school dropout rates significantly (about0.11 of a percentage point for each year of program participation). Given
School-Based Management | 113that the average dropout rate in their sample was 4.75 percent, three yearsof PEC would have reduced an average school’s dropout rate by about6 percent. The authors did not find that PEC had had any significant effectson repetition rates. Last, they found that PEC had its greatest impact instates with medium levels of development (according to the HumanDevelopment Index) and its lowest impact in states with low levels ofdevelopment. The authors hypothesized that this was because departmentsof education in these low-development states had less capacity thanthe more-developed states to support PEC schools (Murnane, Willet, andCardenas 2006).In the Mexican state of Colima, the federal SBM program PEC grantswere randomly assigned in 2006. After three years of implementation, preliminaryanalysis suggested that, in terms of the education process, theprincipal and the president of the parents association reported no observedchanges in monthly time spent on school-related administrative tasks(Gertler and others 2010). Yet, teachers reported an increase in the timethey devoted to administrative tasks. Moreover, there was a significantincrease in the total amount of hours per week that teachers reportedspending to support students who were lagging behind and to meet withparents to discuss student performance.On average, there was no observed significant change in the numberof meetings held by the different school agents during the academic year.However, in terms of principal and teacher absenteeism, self-reports suggestedlow levels of absences—at odds with the perceptions of otheragents, parents, and students. Indeed, when agents were asked to ratethe others’ levels of absenteeism, teachers believed that principals’absenteeism was “moderate,” and principals considered teachers’ absencesto be “high.” Parents considered both principals’ and teachers’ absenteeismto be “high” to “very high.” In treatment schools, parents reported a significantlylower level of teacher absenteeism than the parents reported incontrol schools. Overall, there was a high reported participation of teachersand principals in meetings over school matters. Moreover, the participationrates reported were similar regardless of the identity of the informants.There was a significant increase in principals’ engagement in meetings tosolve school conflicts as reported by teachers.In terms of student achievement, the preliminary analysis suggested thattest scores increased overall in Colima, in both treatment and controlschools. Overall, the differences were small. But when analyzed by grade,one observes a higher achievement trend for the cohort that was exposedto the treatment the longest: students who were in third grade in the baselineyear, 2005/06. The treated students scored an average of 483 points inthird grade (2005/06), 518 in fourth grade (2006/07), 504 in fifth grade(2007/08), and 511 in sixth grade (2008/09), for an overall increase of
114 | <strong>Making</strong> <strong>Schools</strong> <strong>Work</strong>46 points, almost half a standard deviation. The control-school studentswent from an average of 482 points in third grade (2005/06), to 551 infourth grade, to 505 in fifth grade, and to 512 in sixth grade (2008/09), foran overall increase of 30 points, about one-third of a standard deviation.Therefore, the difference-in-differences estimate is 16 points, or 0.16 of astandard deviation (Gertler and others 2010).A variation of the Mexican program is the PEC-FIDE model. In 2008, thefederal Secretariat of Public Education, with the state governments of Coahuila,Chihuahua, Quintana Roo, Hidalgo, Guanajuato, and the State ofMexico, implemented a pilot project derived from PEC and largely supportedby the same operational structure. The pilot project, called Programade Fortalecimiento e Inversión Directa a las Escuelas (Program of Strengtheningand Direct Investment in <strong>Schools</strong>, or PEC-FIDE), attempts to motivate collectivework in the schools to generate processes of school improvement andinclusion through a greater alignment between resources and school activities.An impact evaluation of the program using difference-in-differencesand propensity score matching suggested that PEC-FIDE produced favorableeffects in terms of increasing pass rates and improving test scores, especiallyin reading. Effects were more notable in schools that participated in PEC-FIDE for the first time and in primary schools in states that targeted theprogram better (Abreu and others 2010).Evidence from Weak Forms of SBMAnother SBM reform undertaken in Mexico was Apoyo a la Gestión Escolar(Support to School Management Program, or AGE). AGE is part of abroader compensatory education program designed to improve the supplyand quality of education in schools in highly disadvantaged communities.The larger program consists of small civil works (infrastructureimprovement), provision of school equipment, materials for students(such as notebooks and pens), pedagogical training, performance-basedmonetary incentives for teachers, and AGE. However, not all of the subinterventionswere introduced at the same time, and not all of the schoolsreceived all of the subinterventions. The overall program progressivelyexpanded from more-disadvantaged to less-disadvantaged areas. Between1992 and 1995, the program was introduced in the poorest municipalitiesof the poorest 23 states, as defined according to the index developed bythe National Population Council (CONAPO). Coverage was extended todisadvantaged schools in the eight remaining Mexican states in 1998.These states have lower poverty rates and better education outcomesthan the states incorporated earlier. Each state then decided which subinterventionswould be allocated to each school based on the school’s budgetaryand logistical capacity.
School-Based Management | 115AGE as a subintervention was introduced in the 1996/97 school year.AGE finances and supports the schools’ parent associations. The monetarysupport varies from $500 to $700 per year depending on school size. Theuse of funds is restricted and subject to annual financial audits of a randomsample of schools. Among other things, the parents are not allowed tospend money on wages and salaries for teachers. Most of the money goesto infrastructure improvements and small civil works. In return, parentsmust commit to greater involvement in school activities, participate inthe infrastructure works, and attend training sessions delivered by stateeducation authorities. In these sessions, parents receive instruction inthe management of the funds and in participatory skills to increase theirinvolvement in the school. Parents also receive information on theschool, the role of the school’s parent associations, and their children’seducation achievements as well as advice on how to help their childrenlearn. While parent associations exist by law, they are rather dysfunctionaland typically have little or no access to schools. AGE creates both a needand a right for parents to have access to schools to decide on the allocationof the grant, manage the funds (establish a feasible budget, record expenses,and so on), and participate in infrastructure works directly. Hence, AGErepresents the first time that parents have been granted full access to theschools and certain, albeit limited, authority over school matters. In 2005,more than 45 percent of primary schools in Mexico had a parent association(Gertler, Patrinos, and Rubio-Codina 2006).A study of the impact of the AGE program on intrayear dropouts, graderepetition, and grade failure in rural primary schools found that AGE had asignificant effect in reducing grade failure and repetition (Gertler, Patrinos,and Rubio-Codina 2006). The authors found that AGE did not have anysignificant effects on intrayear dropout rates. Their study was conductedbetween 1998 and 2001 on a sample of 6,038 rural, nonindigenous primaryschools, some participating in AGE and some not. They used a difference-in-differencesregression approach to evaluate the intervention’simpact. All outcomes were measured at the end of the school year, on theexplicit assumption that AGE needs to have been in operation for sometime to be effective. The authors used the phasing of schools into the AGEprogram to generate sufficient variation in the treatment variable to achieveidentification. <strong>Schools</strong> participating in AGE before 2002 were the treatmentgroup, while schools participating in AGE from 2002 on served as a comparisongroup. Gertler, Patrinos, and Rubio-Codina (2006) found that AGEreduced grade failure by 7.4 percent and grade repetition by 5.5 percent inthe first through third grades.To test the validity of the comparison group, the authors compared preinterventiontrends in the outcome variables controlling for school andstate fixed effects and a dummy variable measuring whether the school is a
116 | <strong>Making</strong> <strong>Schools</strong> <strong>Work</strong>potential AGE school. This analysis did not reveal significant differences inpreintervention trends for schools participating in AGE in earlier and lateryears. Although the insignificant differences in preintervention trendsshould have alleviated any concerns about bias resulting from endogenousprogram placement, the authors used school fixed effects to address anypotential bias arising from time-invariant sources. The authors also testedfor biases arising from changes in the distribution of students in schools butdid not find any evidence for concern (Gertler, Patrinos, and Rubio-Codina2006).Lopez-Calva and Espinosa (2006) yielded additional evidence to supportthe earlier studies. They found that participating in AGE had a positiveeffect on student test scores in the fourth through sixth grades (in primaryschool) for both Spanish and math. The authors used a propensity scorematching strategy to identify their results. The results are robust to controlsfor such relevant socioeconomic variables as participation in Mexico’sProgresa-Oportunidades conditional cash transfer program, teacher and schoolcharacteristics, and alternative stratification strategies.The AGE 125 impact evaluation—a randomized control trial in fourMexican states that doubled the resources that AGE schools receive—tests whether the additional funding makes any difference (Gertler, Patrinos,and Rodríguez-Oreggia 2010). Another group of schools receivedthe parental training but not the funding, which tests whether participationon its own is effective. Finally, a control group of schools received notreatment.The preliminary analysis carried out thus far compared the doublefundedAGE schools with the other AGE schools. After one year of implementation,the comparison of baseline and first follow-up surveys revealedthat the interaction among school agents (directors, teachers, and parents)had changed. This could be observed through the participation of schoolagents in the design and execution of the School Improvement Plan (SIP).In the treatment schools, even though the simultaneous participation ofthe school directors, teachers, and parents in SIP design decreased from2007 to 2008, the joint involvement of all three groups remained the mainsource of participation, followed by the participation of directors and parents.For the SIP execution, the main source of participation for both yearswas composed of directors, teachers, and parents (at 76 percent in 2007 and70 percent in 2008). The interaction among directors and parents was second,increasing from 15 percent in 2007 to 21 percent in 2008. Analyzingthe same information for the control schools, one observes that the participationof parents had decreased. The participation of directors, teachers,and parents in SIP design was about 68 percent in both 2007 and 2008. Thesecond mechanism of participation, composed only of directors and parents,decreased by 7 percent from 2007 to 2008.
School-Based Management | 117Analyzing both groups (treatment and control), one observes that themain expenditure item was school materials and that this expenditureincreased by about 7 percent from 2007 to 2008 for both groups—risingfrom 45 percent to 52 percent for treatment schools and from 44 percent to50 percent for control schools. In 2007, about one-third of AGE resourceswere spent on infrastructure improvements (painting supplies, classroommaintenance, furniture repair, maintenance of electricity and hydrauliclines, fans and heating, real estate, and so on). But the amount devoted toinfrastructure improvement decreased by 3 percent for treatment schoolsand by 7 percent for control schools in the first year. In 2007, around22 percent of the AGE grants were spent on health and hygiene materials(first-aid and hygiene products and toilet repair). In 2008, the expenditureon health and hygiene materials decreased by 4 percent for the treatmentschools and increased by 1 percent for control schools.The interest of parents in their children’s school performance could bemeasured through their interaction with teachers—an indicator of parentalinvolvement. The extent to which parents asked teachers about their children’sperformance had improved. The parents’ interest increased from oneyear to the next among both treatment and control schools. The participationof teachers showed an improvement from 2007 to 2008 as well. Classtime, preparation, and reinforcement classes increased more in the treatmentschools than in the control schools. In the treatment schools, only thetime for grading assignments and exams decreased, by 0.08 hours (less than5 minutes).To measure the improvement of the quality of education in these 250schools for third-, fourth-, and fifth-grade students, Gertler, Patrinos, andRodríguez-Oreggia (2010) used intermediate indicators: repetition, failure,and dropout rates. On learning outcomes, the national standardized test(ENLACE) was used for Spanish and mathematics. Unfortunately, ENLACEscores were published at the school level for 2007 and 2009 but not for2008. Therefore, the 2009 scores were used to observe the improvementsin education quality for the first follow-up.Using a difference-in-differences approach with random and fixed effectsand controlling by schools’, directors’, parents’, and teachers’ characteristics,the authors reported that the double-funded AGE program had a significantimpact on the total dropout rate and on Spanish and mathematicsscores of treatment schools. The estimates suggest that the AGE 125 projectcaused the treatment schools’ dropout rate to decrease by 1.5–1.7 percentagepoints compared with control schools during the project’s first year ofimplementation. At the same time, the double-funded AGE interventionhad not revealed any effects on repetition or failure rates. It also seems likethis project had a positive impact on Spanish and mathematics test scores,mostly for third-grade students. The results suggest that the double-funded
118 | <strong>Making</strong> <strong>Schools</strong> <strong>Work</strong>AGE program caused an increase of about 5.0–5.6 percent in Spanish scoresand an increase of about 6.3–8.0 percent in mathematics scores for thirdgradestudents in treatment schools (Gertler, Patrinos, and Rodríguez-Oreggia 2010).In Cambodia, the SBM program is called the Education Quality ImprovementProject (EQIP) School Grants Program. It began in Takeo Province in1998 with a pilot group of 10 clusters and expanded to include roughly1,000 schools in three provinces between 1998 and 2003. EQIP schoolsreceive cash grants that are invested in priorities determined by the localcluster committee—representing six schools on average—as part of a clusterplan. The grants program is designed to improve school quality in two ways.The first is simply a resource effect, as school clusters receive money theycan use to buy additional inputs such as new equipment, teacher training,and student libraries. The second involves building the schools’ managementcapacities by giving cluster schools valuable experience in participativeplanning and the execution of school plans. With decentralized planningand execution, the grants program is expected to result in a more efficientuse of funds than standard, top-down education interventions achieve.Qualitative reviews of the program have, so far, been positive (Geeves andothers 2002). The EQIP project has delivered the money in a timely fashion,and donors are generally satisfied with how the money has been spent.Preliminary results of EQIP program evaluations showed systematicvariation in spending by school clusters associated with specific schoolcharacteristics and parental participation (Benveniste and Marshall 2004).Nonetheless, the largest variation was associated with the year and provincevariables, suggesting that central forces exerted considerable influenceon local choices. Regarding outcomes, preliminary results suggested thatparticipation in EQIP was associated with marginally lower dropout rates,higher pass rates, and better academic achievement. These results wererobust to the inclusion of controls for school and community characteristicsand province-level fixed effects. For this analysis, the authors used regressionanalysis with five years of data and took advantage of the phase-instrategy to decrease the potential for selection bias. The empirical strategywas to regress student test scores on student, teacher, and school characteristics,plus controls for province and year. All community, school, director,and teacher characteristics were set at their pre-EQIP levels (1998). Costeffectivenesscomparisons were also generally favorable, as EQIP moneyspent on specific activities such as teacher development and infrastructureimprovements have been associated with higher returns than other possibleinterventions.In Indonesia, a limited form of SBM is operating. Under the program,school committees were set up in 2005 to run SBM programs. All schoolsin Indonesia receive block grants based on a per-student formula, but
School-Based Management | 119school committees have control only over nonsalary operational expenditures.Over the past decade, the government of Indonesia has introducedelements of SBM into its education system by involving school personnel(principals, teachers, and other staff) and parents in the management ofschools to make them more accountable and responsive to parents andstudents (<strong>World</strong> <strong>Bank</strong> 2008b). However, it was not until the introductionof the Bantuan Operasional Sekolah (School Operational Assistance Program,or BOS) in 2005 that school committees had any discretionary money toexercise their mandated role.Based on the BOS experience, the government has taken another steptoward cementing SBM and parental involvement with a regulation thatenhances the role of school committees. Successful examples of communityinvolvement in Indonesian projects—such as the National Programfor Community Empowerment (PNPM), the Urban Poverty Program(UPP), and the Kecamatan Development Program (KDP)—all indicate thatsocial pressure from an informed local community can help to reduce corruptionand the misuse of funds. The design of the BOS program alreadyclosely parallels the institutional and implementation arrangements pioneeredby these community-driven programs. A modified version of theprogram, the School Operational Assistance Knowledge Improvement forTransparency and Accountability (BOS-KITA) program, will expand andbuild on these lessons, enhancing the role of parents and the local communityin planning (and approving) school budgets for BOS funds andmonitoring BOS expenditures.The BOS program disburses block grants to all schools throughout Indonesiabased on a per-student formula. It is Indonesia’s most significant policyreform in education financing in two important aspects: (1) Block grantsto schools are based on a per-pupil formula, which provides incentives forprincipals and teachers to focus on maintaining and increasing enrollment.(2) Funds are directly channeled to the schools, which empowers schoolmanagers by allowing them to choose how best to allocate the BOS grants.School committees are tasked with assisting in the selection of scholarshipstudents and overseeing school spending on grants. The committeesconsist of representatives of parents, community leaders, education professionals,the private sector, education associations, teachers, NGOs, and villageofficials. Each committee must have a minimum of nine members, andthe chairperson must come from outside the school. All public and privateelementary and junior high schools in Indonesia are eligible to apply forBOS funding. School committees have control only over nonsalary operationalexpenditures. They are not allowed to hire or fire teachers or evenhave any control over capital expenditures. A pre-BOS comparison of datafrom 94 schools in 16 districts participating in the first Governance andDecentralization Survey module indicated that as much as one-third of the
120 | <strong>Making</strong> <strong>Schools</strong> <strong>Work</strong>allocated resources may have failed to reach schools. The BOS programuses a simple, transparent formula and provides mechanisms for scrutinyboth from the top (through the internal audit) and from the bottom(through community mobilization and oversight). Under the BOS program,in which schools receive operational funds directly and the funds areallocated independently, opportunities for further SBM are created.Using data from various household surveys and the Ministry of Education’sinformation system, a 2008 technical assessment carried out by <strong>World</strong><strong>Bank</strong> staff identified a number of positive developments to which the BOSprogram contributed during its first years of operation. The BOS programhas been important for promoting and facilitating SBM and parental andlocal community involvement. In a survey of 1,250 schools, 68 percentreported that they had implemented SBM principles. Of these schools,95 percent claimed to have experienced positive benefits. Most schools hadseen improvements in their students’ grades (66 percent of schools surveyed),their attendance (29 percent of schools surveyed), and discipline(43 percent of schools surveyed). These results however, must be takenwith caution as they are based neither on standardized tests (or other measures)nor on a rigorous (or even semirigorous) evaluation strategy.Four randomized interventions—each aiming to strengthen school committeesin public primary schools in Indonesia—have been evaluated(Pradhan and others 2010). Single and combined methods were experimentedwith, including giving the school committee a grant, trainingschool committee members, linking school committee members with thevillage representative council, and democratically electing school committeemembers. After one year of implementation, elections in combinationwith the committee-council links—and, to a lesser extent, in combinationwith committee training—had substantial positive effects on learning. Thecommittee-council link was the most cost-effective intervention, increasinglanguage scores by a 0.12 standard deviation.In the Philippines, SBM was implemented in 2003 in 23 districts. Theproject funded infrastructure, training, curriculum development, and textbooks.Participating schools were required to design a five-year SchoolImprovement Plan in partnership with parents and the community, usingdata on student achievement, with the school principal leading the process.Khattri, Ling, and Jha (2010) evaluated the program using retrospectivedata, difference-in-differences, and propensity score matching. In threeyears, the SBM schools improved scores in math by 16 percentage points,in science by 11 percentage points, and in English by 18 percentage points;the corresponding improvements in non-SBM schools were 15, 10, and 16percentage points. The effect sizes, however, were 0.10, 0.13, 0.09, and0.07 of a standard deviation in overall scores, science, English, and math,respectively.
School-Based Management | 121BOX 3.2Ongoing SBM Experiments in AfricaThere are various SBM reforms under way in Africa. Some are implementinginitiatives similar to those that have been adopted in CentralAmerica. Mozambique, for example, was an early mover in SBM reformsand now makes small grants to schools that participate in the SBMprogram (<strong>World</strong> <strong>Bank</strong> 2008c). These schools are managed by a schoolcommittee that is able to spend funds on basic classroom inputs andteaching materials. As part of the reform, participating schools have topublish student achievement data and how the money is being spent.The introduction of free primary education meant abolishing schoolfees that had previously been paid by parents. The expenditures thatused to be covered by these fees are now funded by grants (sometimescalled capitation grants) from the central government. For example,in countries such as Benin, The Gambia, Ghana, Madagascar,Niger, Rwanda, and Senegal, the government gives a direct grant toschools, the amount of which is calculated on a per-student basis.These capitation grants can be used by school councils to purchaseschool supplies, fund teacher training, and improve facilities. In somecases (as in Ghana and Rwanda), the grants can be used to give teachersbonus allowances (dependent on the successful completion of requirementsset between teacher and principal) or support the full cost(salary and bonus) of teachers hired on a fixed-term contract (in Ghana,Niger, Rwanda, and in some forms of SBM in Madagascar).In The Gambia, the first follow-up survey of the Whole School Development(WSD) program showed that, on an array of intermediate outcomesvariables, the WSD group scored higher, and the differenceobserved against the control school was statistically significant in manycases. Both the WSD schools and the control schools have scored higheron many dimensions compared with the baseline a year previously.In terms of student performance (fourth and sixth grades), the level ofperformance was low and on a par with the outcomes of the baselinetest to third- and fifth-grade students. However, substantial learningdid occur from one grade to the next (<strong>World</strong> <strong>Bank</strong> 2010a).In Senegal, the baseline report for the experiment showed the testresults of children at the start of the second and fourth grades on writtenFrench and math tests and an oral test. The population served hasvery low levels of education, very low literacy rates (particularly forwomen), and low employment rates and hours of work. In terms of theexperimental evaluation, the baseline data revealed that the treatmentand control group were as near perfectly balanced as one could hope(Carneiro and others 2010).
122 | <strong>Making</strong> <strong>Schools</strong> <strong>Work</strong>ConclusionsIt is important to highlight two ideas from the outset before reviewing theempirical literature on SBM. First, only a very few rigorous studies of theimpact of SBM exist. 2 General descriptions of the most rigorous evaluationsof SBM programs that have been conducted in recent years are presentedin table 3.4.It is also challenging to evaluate the size effect of the programs becauseof the heterogeneous presentation of metrics and results in the differentstudies. Several studies reported only the estimated coefficient of impactand, therefore, it is difficult to translate these into a size because theydepend on the specific measurement of both the independent and dependentvariables. Other studies presented information on the percentagechanges in some outcome variables due to the intervention. Again, themetric of the output variables varies considerably among studies. Nonetheless,the size effects for those studies that have a clear interpretation of theresults are reported; otherwise, only the direction and significance of thecoefficient of impact is reported.SBM Program DesignOne of the noteworthy aspects of SBM programs is their diverse nature.Cook (2007) calls this their “modest entitivity.” From the narrow managementprograms to the broad comprehensive schooling models, they varygreatly. But there are fundamentals of the narrower form of SBM. Thefocus on autonomous school strategic planning, multiple groups setting thegoals, changes in teacher pedagogic practices, and stronger relations withparents and the surrounding community are mainstays.In the United States, SBM practice led to the 1999 passage of the ComprehensiveSchool Reform Act, which outlined 11 components of a moreautonomous school:1. Each school adopts a model known to be successful (or has the promiseto be so).2. Proven methods of teaching, learning, and management should be usedin the school—implying that management change is not sufficient forcomprehensive school reform; also needed are plans for changing teachingand learning.3. Methods for teaching, learning, and management should be integratedin a meaningful way.4. Staff should have continual professional development.
Table 3.4 Evaluations and Impacts: SBM Evidence from Recent Rigorous Studies123Study Country ProgramDate ofprogramRandomization and regression discontinuity designDuflo, Dupas,and Kremer2007Chaudhuryand Parajuli2010KenyaNepalExtra TeachersProgramNepalCommunitySupportProjectDate ofdata2006–08 2005–08 Randomizedevaluation2007–09 2005–09 Quasi-experimentalrandomizationapproach (IV and DD);through exogenousinstrument in form ofadvocacy group;advocacy campaignrandomly assigned;intent to treatDas 2008 Pakistan NGO hired tomanage schooltogether withschool council;funds ($4,000)per school given for2004–08 RCT in principle,though originalrandomization notfully upheld;analysis performedusing intent to treatEstimation oridentificationstrategy Limitations ResultsExternal validity;pilot conditionsmight not be ableto be duplicated innoncontrolledsettingsSmall-scale pilot;not purerandomizationSample size notclearly defined foreach part ofintervention;randomizationaltered due tofield conditions(district-level(1) Higher studenttest scores(2) Lower teacherabsenteeism(3) Small changein student dropout rate(1) Reduced number ofout-of-school children(2) Reduced repetition(3) Increased progression(4) Increased equity(disadvantaged castesperformed better)(1) No effects on studentenrollment, teacherabsenteeism, orfacilities index(infrastructure)(continued next page)
124Table 3.4 Evaluations and Impacts: SBM Evidence from Recent Rigorous Studies (continued)Study Country ProgramPradhan andothers 2010Gertler,Patrinos, andRodríguez-Oreggia 2010IndonesiaMexicoschool needs; NGOin initial experimentallowed totransfer teachers aswell (2004)school-basedmanagementAGE 125; doublingof grantDate ofprogramDate ofdataEstimation oridentificationstrategy Limitations Resultsofficials did notuphold originalrandomization asthey wanted totarget funds toschools thatneeded themmost; unclearto what extentrandomizationaltered)2007–08 2007–08 RCT Pathways notidentified2007–10 2006–10 RCT 4 states, might notbe replicable;required privatefunding to double(2) In treatment schools,significantly increasedpercentage of councilmembers whose childrenwere students(1) Improved learningoutcomes(2) Strongest impactfrom elections incombination with link(3) Increased languagescores by a 0.51 standarddeviation, increased mathscores by 0.46(1) Increased participation infirst year(2) Reduced dropout rate(3) Improved reading scoresfor third grade only in year 2
Propensity score matching; instrumental variables; Heckman correction modelsDi Gropelloand Marshall2005severalGunnarsson2004 aand others countriesJimenez andSawada 1999Jimenez andSawada 2003Gertler,Patrinos, andRubio-Codina2006Honduras PROHECO 1999 2003 Heckman correctionmodel; exclusionrestriction: presenceof potable water andcommunity servicesElSalvadorElSalvadorseveralprogramsseveralyears1997 IV: principal’s attributesand legal structureEDUCO 1991 1996 Heckman correctionmodel; exclusionrestriction:governmentprioritizing targetingformulaEDUCO 1991 panel:1996 and2003Mexico AGE 1996 schoolpanel:1998–2002Heckman correctionmodel; exclusionrestriction:governmentprioritizing targetingformulaDD fixed effects;preintervention trendsNot a solidexclusionrestrictionNot a solidinstrumentNot a solidexclusionrestrictionNot a solidexclusionrestrictionDid not control fortime-variantunobservableeffects(1) Small changes indropout rates(2) No effects on testscores(1) No effects on testscores(2) Increased participation(1) Increased readingscores(2) Decreasedabsenteeism(1) Increased probabilityof students staying inschool(1) Reduced failure andrepetition rates(2) No effects ondropout rate(continued next page)125
126Table 3.4 Evaluations and Impacts: SBM Evidence from Recent Rigorous Studies (continued)Study Country ProgramKing andÖzler 1998Lopez-Calvaand Espinosa2006Murnane,Willet, andCardenas2006Abreu andothers 2010Gertler andothers 2010Nicaragua ASP 1991,1993Date ofprogramDate ofdatapseudopanel:1995, 1997Estimation oridentificationstrategy Limitations ResultsMatching, panel dataMexico AGE 1996 2003–04 Matching,cross-sectionMexico PEC 2001 severalsources:2000–04DD: more systematiccheck of equal trendsbetween treatmentand control groupsMexico PEC-FIDE 2008–09 2008–09 DD, propensity scorematchingMexicoPEC (Colimaonly)No pretrendvalidationNo baseline dataNot controlled fortime-variantunobservableeffects2006–09 2005–09 RCT Not strictlyobserved(1) De jure autonomy: noimpact(2) Real autonomy (hire/fireteachers): increased testscoresIncreased test scores(1) Reduced dropout rates(2) No effect on repetition(1) Increased promotionrates(2) Increased test scores
Paes deBarros andMendonca1998Brazil decentralization 1982 panel,statelevel:1981–1993DD; no preinterventiontrendsAggregation ofdata; no pretrendvalidationParker 2005 Nicaragua ASP 1991–93 2002 Matching, panel data No pretrendvalidationSawada andRagatz 2005Skoufias andShapiro 2006Khattri, Ling,and Jha 2010Benvenisteand Marshall2004ElSalvadorEDUCO 1991 1996 Matching, crosssectionMexico PEC 2001 2000–03 Matching estimationwith DD; one-yearpreintervention trendPhilippinesschool-basedmanagementCambodia EQIP 1998–20042003– 2003– DD; propensity scorematching1999–2003Program randomlyimplemented bydistrict in province;fixed effects regression,DD, matchingNo baseline dataNo pretrendvalidationNo pretrendvalidationCannot testparticipationper se(1) Reduced repetitionand dropout rates(2) No impact on testscoresIncreased test scoresIncreased test scoresReduced dropout, failure,and repetition ratesSignificant but smalleffects on test scores(1) Increased pass rates(2) Reduced dropout rates(3) Improved achievementSource: Authors’ compilation.Note: IV = instrumental variables. DD = difference-in-differences. RCT = randomized control trial. NGO = nongovernmental organization.a. School self-reported levels of autonomy.127
128 | <strong>Making</strong> <strong>Schools</strong> <strong>Work</strong>5. Staff should support the initiative.6. Formal and informal leadership should be distributed widely withinthe school.7. Parents and the local community are involved in the school.8. There will be external technical support for whatever change the schoolis making.9. Use measurable benchmarks on a short-term basis.10. Conduct annual evaluations.11. Mechanisms are needed for identifying and gathering needed resourcesfrom external sources.While not all 11 components need be in place for a school to be labeled anSBM school (nor are a minimum or core number of attributes needed), it isnonetheless obvious that the more of these components an SBM planincludes, the more integral is the change being promoted. In most developingcountries, there is no inventory of what works—yet. So basing themodel on positive cases proves difficult; thus, programs are invented orborrowed from other countries. Many of the programs in developing countries,even those designed to improve quality, are more participatory thanmanagement-centered. That is, there are hopes for high levels of participationbut little empowerment of the actors to affect core education functionssuch as teaching and learning. Professional development or training—ofstaff (teachers or directors), in a few cases, and of parents in others—isbecoming a usual function. The level of staff support seems to vary. In somecases, the programs empower the principals but do not really affect theteachers. Often the leadership model is not well distributed widely throughoutthe school.Programs in developing countries are heavy on parental or communityparticipation—even if that is only a stated objective. The level of externaltechnical support varies. Some programs build it in effectively, while otherstake a more informal approach.The use of measurable benchmarks—performance metrics or informationin general—is a relatively recent phenomenon. The programs describedhere have been subject to rigorous evaluation. But there are some 53 suchprograms known around the world, and few of those were evaluatedbecause few had any performance benchmarks in the design. It seems obvious,in a report on accountability, to discuss performance measures, but thefact is that many SBM programs were designed without appropriate attentionto results. Thus, there are few evaluations (at least from the old generation)of any level of rigor.
School-Based Management | 129Despite the limited evidence base, one can offer a few specific ideasabout the design of SBM projects based on the large number of programsthat exist around the world. There are clearly a few key issues that shouldbe settled before embarking on an SBM initiative:• Specify what is meant by SBM. The autonomy and accountability definitionsmust be explicit. The functions to be transferred must be delineated,and the entities to which they are to be transferred should bedescribed. A clear account of the resources that will be available, howthey will be used, and the model to be developed (administrative, professional,community, balanced, or a combination) should be given.• Take account of capacity issues. In all models and types of SBM, capacityconsiderations are crucial. Thus, SBM projects should include a componentto build the managerial capacity of parents, teachers, and other keyplayers.• Clearly state what is to be achieved, how, and in what time frame. A good ruleof thumb is that SBM reforms need about five years before any fundamentalchanges occur at the school level, and only after eight years ofimplementation can changes be seen in indicators such as student testscores. This has been the experience in the United States. Therefore, it isimportant to ensure that the time frame is understood by all involved sothat their expectations are realistic.• Establish goals, including short-term process goals, intermediate output goals,and longer-term outcome goals. Most important, the relevant indicatorsneed to be measured before, during, and after the experimental stageof the reform to make it possible to evaluate the impact of the reform.The high standards that usually apply to SBM programs in developedcountries will be difficult to meet in developing countries. However,even in developed countries, SBM reforms tend to take several years tohave any substantial impact, depending on the country’s institutionalcontext.• Spell out what will have to happen at different stages for the reform to reachits goals. There are many ways in which the components (autonomyparticipationand accountability) of SBM can be combined andimplemented—that is, who gets what powers to do what—that makeeach SBM reform unique. Therefore, it is important to be clear and preciseabout the goals of each SBM program from the outset. The mostcommon goals of SBM programs so far have been (1) to increase theparticipation of parents and communities in schools; (2) to empowerprincipals and teachers; (3) to improve student achievement levels (as inmost OECD countries); (4) to make school management more accountable;and (5) to increase the transparency of education decision making
130 | <strong>Making</strong> <strong>Schools</strong> <strong>Work</strong>(in most cases). These different goals have significant implications forhow each program is designed.• Base interventions on whatever evidence is available, and include a strong impactevaluation component that is appropriate for the program, its duration, and itstime frame. There are three evaluation approaches: (1) evaluations thatrandomly select treatment schools (those that will implement an SBMproject) and control schools; (2) evaluations that randomize the order inwhich schools enter into the program; and (3) evaluations that encourageschools to participate in the program.The ideal evaluation will involve some form of randomization. However,if randomization is not an option, there are two alternative ways of estimatingthe impact of an SBM reform. First, a regression discontinuitydesign procedure can be used when the SBM program is targeted, usingsome continuous variable as the entry criterion. The estimation yieldsthe true effect of the intervention without the need for randomization inthe design of the program. The second nonrandomized way to evaluateimpact uses a nonrandom phase-in strategy. For this evaluation methodto be technically sound, it is critical to show that the group of schoolsthat is treated later is the right counterfactual for the group of schoolsthat initially enters the program; in other words, they need to have similarpretreatment observable characteristics. This method highlights theneed for both good preintervention data and good postintervention datato be able to compare the values of the outcome variables both beforeand after the program to measure its effects.SBM models have many positive benefits, many of which can be characterizedas improved school quality. However, learning outcomes, as measuredby standardized test scores and examination results, are medium- to longtermbenefits. That is, SBM, though not a costly investment and one thatcan even produce savings, is not a quick fix. In fact, it is shown that in theUnited States, in a meta-analysis of 232 studies with over 1,000 observationsof 29 programs, SBM needs five years to bring about fundamentalchanges at the school level and about eight years to yield significant changesin test scores.SummaryEducation systems are extremely demanding of the managerial, technical,and financial capacity of governments and, thus, as a service, education istoo complex to be efficiently produced and distributed in a centralizedfashion. Most of the incentives that affect learning outcomes are institutionalin nature. Local decision making and fiscal decentralization canhave positive effects on outcomes such as test scores or graduation rates by
School-Based Management | 131holding the schools accountable for the outputs they produce. High-quality,timely service provision can be ensured if service providers can be heldaccountable to their clients—who, in the case of education, are studentsand their parents.There is a trend toward increasing autonomy, devolving responsibility,and encouraging responsiveness to local needs, all with the objective ofraising performance levels. Most countries whose students perform well oninternational student achievement tests give their local authorities andschools substantial autonomy over adapting and implementing educationcontent or allocating and managing resources. Moreover, greater schoolautonomy is not necessarily associated with wider disparities in school performanceif governments provide a framework in which poorer-performingschools receive the necessary support to help them improve.The argument in favor of decentralized decision making in schools is thatit fosters demand at the local level and ensures that schools provide thekind of education that reflects local priorities and values. By giving voiceand power to local stakeholders, decentralization increases client satisfactionand improves education outcomes. School autonomy and accountabilitycan help to solve some of the fundamental problems in education. Ifschools are given some autonomy over the use of their inputs, they can beheld accountable for using them in an efficient manner. Decentralizingpower to the school level can also improve service delivery to the poor bygiving poor families a say in how local schools operate and by giving schoolsan incentive to ensure that they deliver effective services to the poor and bypenalizing those who fail to do so.Past studies found that SBM policies actually changed the dynamics ofthe schools, either because parents got more involved or because teachers’actions changed (King and Özler 1998; Jimenez and Sawada 1999). Severalstudies showed that SBM led to reduction in repetition rates, failure rates,and, to a lesser degree, dropout rates (Di Gropello and Marshall 2005;Jimenez and Sawada 2003; Gertler, Patrinos, and Rubio-Codina 2006; Paesde Barros and Mendonca 1998; Skoufias and Shapiro 2006). The studiesthat had access to standardized test scores presented mixed evidence, withcountries such as El Salvador, Mexico, and Nicaragua showing positiveresults (Jimenez and Sawada 2003; King and Özler 1998; Sawada andRagatz 2005; Lopez-Calva and Espinosa 2006). Other reforms such as thosein Brazil and Honduras appear to have had no effects on test scores.The new evaluations, mostly randomized control trials—and, in almostall cases, preliminary results only—substantiate earlier studies, strengthenand expand the knowledge base, and provide new information on impactsthat are substantially different from past studies in some respects.SBM forms with weak autonomy or accountability produce smalleffects. Evidence from two new evaluations in Mexico showed small
132 | <strong>Making</strong> <strong>Schools</strong> <strong>Work</strong>positive impacts on outcomes, mostly in the early grades of primary school.However, they also showed changes in school climate, parental perceptionsand participation, and engagement between actors. The implications arethat a larger dose of autonomy, especially in terms of labor control, wouldgarner larger gains in terms of student learning. The AGE 125 project had apositive impact on test scores in reading and math, mostly for third-gradestudents. But even those significant gains did not bring the students in AGEschools—largely disadvantaged, rural, indigenous populations—close tothe national average in test scores.Strong SBM forms—meaning those affecting teacher hiring and firingdecisions—have shown positive effects in improving test scores but onlywhen it was clear what parents were supposed to do or when the SBM wascombined with other incentives such as reduced class size, as in Kenya. Onthe other hand, a strong SBM form in Nepal has yet to show an impact twoyears into implementation. However, devolving management responsibilityto communities has had a significant impact on certain schooling outcomesrelated to access and equity.On balance, SBM has been shown to be a useful reform for a number ofreasons. Yet it is better when integrated with other interventions.Still, there are unanswered questions. For instance, do administrativecontrolSBMs work better than, say, more participatory models—and, if so,under what situations? Put another way, does vesting decision-makingpowers in the principal serve the same purposes? Or is parental participationor oversight required to instill a level of accountability? Does moreautonomy need to be devolved to the school level to improve intermediateand long-term outcomes? In other words, do weak-form SBMs need tobecome stronger forms to have sustained impacts on learning over time?Also, more cost-benefit analysis is needed. Clearly, SBM is an inexpensiveinitiative since it constitutes a change in the locus of decision making andnot necessarily in the amount of resources in the system. If the few positiveimpact evaluations dominate, then SBM can be regarded as a cost-effectiveinitiative. For example, in Mexico, the rural SBM program is estimated tocost about $6.50 per student (which, in unit cost terms, is only about 8 percentof primary education unit expenditures, estimated at over $800 in2006). Moreover, the $6.50 figure includes the allocation of resources to theparent associations and the training imparted to the parents. It also comparesfavorably to other common interventions, such as computers ($500per student, 10 computers per class), teacher salary increases ($240 per student),or annual school building costs ($160 per student); only studentassessments have a similar unit cost, at $6 (Patrinos 2009).Other elements that will need more analysis as the study of SBMreforms evolves are political economy issues, such as the roles played byteachers’ unions and political elites. These issues could explain why we are
School-Based Management | 133getting ambiguous results in some cases. SBM, like any other kind ofreform, requires some level of political support from the government.Political support may be more important than technical merit in the successor failure of a strong SBM reform. Teachers and their unions maywant to resist SBM reforms that give parents and community membersmore power. How they will react to the reform is a crucial factor in itseventual success or failure. Typically, bureaucrats and teachers’ unionsfavor increased budgets and spending on teacher-related inputs ratherthan on non-teacher-related investments. Thus, unions and perhaps alsobureaucrats may try to limit the extent of school autonomy, especiallythose models that empower school councils or even just school principalsto hire and fire teachers. If this is the case, then one could expect only mildforms of SBM (such as the participatory models in rural Mexico, aroundsince the mid-1990s) to survive, challenging the existence of strong versionssuch as EDUCO in El Salvador. Also, the impact of such programswill be limited by design, wherein true decision making is muted in strongmodels and the participatory models never confront the true causes ofeducation disadvantage.Elite capture is another potential problem. If the programs are dominatedby certain groups, they may not be working to improve outcomes forall, especially for the least able. Even local authorities can react negativelyto what they perceive to be the capture of governance at the various levelsby elite groups, particularly if these groups use SBM reforms as a means tofurther their political agendas. When local democracy and political accountabilityare weak, as is the case in many developing countries, especially inrural areas, then decentralization reforms can lead to elite capture (Bardhan2002; Bardhan and Mookherjee 2000, 2005). In more traditional andrural areas, the poor or ethnic minorities, such as the indigenous peoples ofrural Mexico, feel the need for a strong central authority to ensure thatthey are able to access services as well as more powerful local citizens. Thiscentralization would tend to limit the amount of local decision making andreduce the overall impact of the programs. A related issue may be the lackof a culture of accountability within communities, meaning that no onewould think to question any actions taken by the group running the school(De Grauwe 2005), something that was detected in focus group interviewsin rural Mexico (Patrinos 2006).Finally, there are often challenges involved in implementing SBMreforms that can undermine their potential. These challenges include theneed for all the relevant actors to accept and support the reform, the factthat more time and work demands are put on teachers and parents, and theneed for more local district support. The participatory models may sufferespecially from the latter because they demand from parents a great investmentof time, which is costly to them. In addition, if parents need to prepare
134 | <strong>Making</strong> <strong>Schools</strong> <strong>Work</strong>for meetings or need to understand documents required for preparingschool improvement plans, these requirements place the poorest and leasteducatedat the greatest disadvantage and limit the potential of the programto help the most deserving and neediest students.Notes1. Given the U.S. evidence, one might wonder whether charter schools (aroundsince the 1990s, which one might think of as an ultimate form of SBM—that is,a public school with autonomy over personnel, budget, and pedagogical decisions)might perform any better than public schools. Indeed, the evidence isusually considered mixed, with a variety of authors showing vastly differentresults (Patrinos, Barrera-Osorio, and Guáqueta 2009). However, newer studieson the topic in the United States include a report by the Center for Research onEducation Outcomes (CREDO) at Stanford University, which found a wide variancein the quality of charter schools, with, in the aggregate, students in charterschools not faring as well as students in traditional public schools (CREDO2009). The study found that 17 percent of charter schools reported academicgains that were significantly better than traditional public schools, 37 percentshowed gains that were worse than traditional public schools, and 46 percentdemonstrated no significant difference. Hoxby (2009) claims that a statisticalmistake in the CREDO study forced an underestimation of the effect of charterschools. A study of New York charter schools—where most students are admittedbased on a lottery, thus representing clear evidence—found that, on average,a student who attended a charter school for all of grades kindergarten througheight would close about 86 percent of the achievement gap in math and 66 percentof the achievement gap in English (Hoxby, Murarka, and Kang 2009). Afollow-up study by CREDO showed that most New York City charter schoolstudents were showing academic growth in math that was statistically largerthan what non-charter school students would achieve (CREDO 2010). A recentstudy of Boston schools found that each year of attendance in middle-schoolcharters raised student achievement by a 0.09–0.17 standard deviation in Englishand a 0.18–0.54 standard deviation in math relative to those attending traditionalschools in Boston (Abdulkadiroglu and others 2009). Dobbie and Fryer(2009) studied Harlem Children’s Zone, a 97-block area in central Harlem, NewYork, where charter schools offering a web of community services for childrenoperate. A randomized evaluation found that students enrolled in sixth gradegained more than a full standard deviation in math and a 0.3–0.5 standard deviationin English by eighth grade—enough to reverse the black-white achievementgap. Angrist and others (2010) studied KIPP (Knowledge Is Power Program),the largest charter management organization, and found reading gains ofa 0.12 standard deviation for each year and larger gains for special-educationand limited-English students in the range of a 0.3–0.4 standard deviation.2. Santibañez (2006) consists of a literature review of the 53 evaluations carriedout since 1995 of the impact of SBM programs on educational outcomes.
School-Based Management | 135ReferencesAbdulkadiroglu, A., J. Angrist, S. Cohodes, S. Dynarski, J. Fullerton, T. Kane, andP. Pathak. 2009. “Informing the Debate: Comparing Boston’s Charter, Pilot andTraditional <strong>Schools</strong>.” Report for the Boston Foundation, Boston.Abreu, R., M. Caudillo, L. Santibañez, and E. Serván-Mori. 2010. “Evaluación deimpacto del proyecto piloto PEC-FIDE.” Impact evaluation, Fundación Idea,Mexico City.Anderson, J. A. 2005. Accountability in Education. Education Policy Series. Paris:International Institute for Educational Planning; Brussels: International Academyof Education.Angrist, J. D., S. M. Dynarski, T. J. Kane, P. A. Pathak, and C. R. Walters. 2010.“Inputs and Impacts in Charter <strong>Schools</strong>: KIPP Lynn.” American Economic Review100 (2): 239–43.Arcia, G., E. Porta Pallais, and J. R. Laguna. 2004. “Otro vistazo a la autonomíaescolar de Nicaragua: aceptación y percepción en 2004.” Study for the Ministryof Education, Culture and Sports, Managua, Nicaragua.Bardhan, Pranab. 2002. “Decentralization of Governance and Development.”Journal of Economic Perspectives 16 (4): 185–205.Bardhan, Pranab, and Dilip Mookherjee. 2000. “Capture and Governance at Localand National Levels.” American Economic Review 90 (2): 135–39.———. 2005. “Decentralizing Antipoverty Program Delivery in Developing Countries.”Journal of Public Economics 89 (4): 675–704.Barrera-Osorio, F., T. Fasih, and H. A. Patrinos. 2009. Decentralized Decision-<strong>Making</strong> in<strong>Schools</strong>: The Theory and Evidence on School-Based Management. Directions in DevelopmentSeries. Washington, DC: <strong>World</strong> <strong>Bank</strong>.Bauer, S. 1997. “Designing Site-Based Systems, Deriving a Theory of Practice.” InternationalJournal of Educational Reform 7 (2): 108–21Bauer, S. C., I. E. Bogotch, and H. S. Park. 1998. “Modeling Site-Based Decision<strong>Making</strong>: The Relationship between Inputs, Site Council Practices, and Outcomes.”Paper presented at the Annual Meeting of the American EducationalResearch Association, San Diego, April 13–17.Benveniste, L., and J. Marshall. 2004. “School Grants and Student Performance:Evidence from the EQIP Project in Cambodia.” Unpublished manuscript, <strong>World</strong><strong>Bank</strong>, Washington, DC.Borman, G. D., G. M. Hewes, L. T. Overman, and S. Brown. 2003. “ComprehensiveSchool Reform and Achievement: A Meta-Analysis.” Review of EducationalResearch 73 (2): 125–230.Caldwell, B. J. 2005. School-based Management. Education Policy Series. Paris: InternationalInstitute for Educational Planning; Brussels: International Academy ofEducation.Carneiro, P., O. Koussihouèdé, N. Lahire, and C. Meghir. 2010. “Senegal: Evaluationof the Impact of School Grants on Educational Achievement: BaselineReport.” Unpublished manuscript, <strong>World</strong> <strong>Bank</strong>, Washington, DC.Carnoy, M., A. Gove, S. Loeb, J. Marshall, and M. Socias. 2008. “How <strong>Schools</strong> andStudents Respond to School Improvement Programs: The Case of Brazil’s PDE.”Economics of Education Review 27 (1): 22–38.
136 | <strong>Making</strong> <strong>Schools</strong> <strong>Work</strong>Chaudhury, N., and D. Parajuli. 2010. “Giving It Back: Evaluating the Impact ofDevolution of School Management to Communities in Nepal.” Unpublishedmanuscript, <strong>World</strong> <strong>Bank</strong>, Washington, DC.Clark, D. 2009. “The Performance and Competitive Effects of School Autonomy.”Journal of Political Economy 117 (4): 745–83.Cook, T. D. 2007. “School-Based Management in the United States.” Backgroundpaper, <strong>World</strong> <strong>Bank</strong>, Washington, DC.CREDO (Center for Research on Education Outcomes). 2009. “Multiple Choice:Charter School Performance in 16 States.” Study report, CREDO, Stanford, CA.———. 2010. “Charter School Performance in New York City.” Study report,CREDO, Stanford, CA.Currie, George. 1967. “An Independent Education Authority for Australian CapitalTerritory: Report of a <strong>Work</strong>ing Party (Currie Report).” Department of AdultEducation, Australian National University, Canberra.Das, J. 2008. “The Impact of Contracting Out School Management to NGOs and ofTransferring Budgets to School Councils.” PowerPoint presentation, <strong>World</strong><strong>Bank</strong>, Washington, DC.De Grauwe, A. 2005. “Improving the Quality of Education through School-BasedManagement: Learning from International Experiences. International Review ofEducation 51 (4): 269–87.Di Gropello, E. 2006. “A Comparative Analysis of School-based Management inCentral America.” <strong>Work</strong>ing Paper 72, <strong>World</strong> <strong>Bank</strong>, Washington, DC.Di Gropello, E., and J. H. Marshall. 2005. “Teacher Effort and Schooling Outcomesin Rural Honduras.” In Incentives to Improve Teaching, ed. E. Vegas. Washington,DC: <strong>World</strong> <strong>Bank</strong>.Dobbie, W., and R. G. Fryer Jr. 2009. “Are High-Quality <strong>Schools</strong> Enough to Closethe Achievement Gap? Evidence from a Bold Social Experiment in Harlem.”Unpublished manuscript, Harvard University, Cambridge, MA.Duflo, E., P. Dupas, and M. Kremer. 2007. “Peer Effects, Pupil-Teacher Ratios, andTeacher Incentives: Evidence from a Randomization Evaluation in Kenya.”Unpublished manuscript, Abdul Latif Jameel Poverty Action Lab (JPAL),Massachusetts Institute of Technology, Cambridge, MA.———. 2009. “Additional Resources versus Organizational Changes in Education:Experimental Evidence from Kenya.” Unpbulished manuscript, Abdul LatifJameel Poverty Action Lab (JPAL), Massachusetts Institute of Technology,Cambridge, MA.Gamage, D. T., and P. Sooksomchitra. 2004. “Decentralisation and School-BasedManagement in Thailand.” International Review of Education 50: 289–305.Gardner, D. P. 1983. “A Nation at Risk: The Imperative for Educational Reform.”Report to the U.S. Department of Education, National Commission on Excellencein Education, Washington, DC.Geeves, R., C. Vanny, K. Pharin, L. Sereyrith, S. Heng, and T. Panhcharun. 2002.Evaluation of the Impact of the Education Quality Improvement Project (EQIP) of theMinistry of Education, Youth and Sport of the Royal Government of Cambodia. PhnomPenh, Cambodia: <strong>World</strong> Education Cambodia.Gertler, P., H. A. Patrinos, and E. Rodríguez-Oreggia. 2010. “Parental Empowermentin Mexico: Randomized Experiment of the Apoyo a la Gestión Escolar
School-Based Management | 137(AGE) in Rural Primary <strong>Schools</strong> in Mexico: Preliminary Findings.” Unpublishedmanuscript, <strong>World</strong> <strong>Bank</strong>, Washington, DC.Gertler, P., H. A. Patrinos, and M. Rubio-Codina. 2006. “Empowering Parents toImprove Education. Evidence from Rural Mexico.” Policy Research <strong>Work</strong>ingPaper 3935, <strong>World</strong> <strong>Bank</strong>, Washington, DC.———. 2007. “Methodological Issues in the Evaluation of School-Based ManagementReforms.” Doing Impact Evaluation No. 10, <strong>World</strong> <strong>Bank</strong>, Washington,DC.Gertler, P., H. A. Patrinos, M. Rubio-Codina, and V. Garcia-Moreno. 2010. “ImpactEvaluation of a School-Based Management Program in Colima, Mexico: PreliminaryAnalysis.” Unpublished manuscript, <strong>World</strong> <strong>Bank</strong>, Washington, DC.Gunnarsson, V., P. F. Orazem, M. Sánchez, and A. Verdisco. 2004. “Does SchoolDecentralization Raise Student Outcomes? Theory and Evidence on the Rolesof School Autonomy and Community Participation.” <strong>Work</strong>ing paper, IowaState University, Ames.Hanushek, E., and L. Woessmann. 2007. “The Role of Education Quality for EconomicGrowth.” Policy Research <strong>Work</strong>ing Paper 4122, <strong>World</strong> <strong>Bank</strong>, Washington, DC.Heckman, J. 1976. “The Common Structure of Statistical Models of Truncation,Sample Selection, and Limited Dependent Variables and a Simple Estimator forSuch Models.” Annals of Economic and Social Measurement 5 (4): 475–92.Heckman, J., H. Ichimura, and P. Todd. 1998. “Matching as an Econometric EvaluationEstimator.” Review of Economic Studies 65: 261–94.Hoxby, C. M. 2009. “A Statistical Mistake in the CREDO Study of Charter <strong>Schools</strong>.”Unpublished manuscript, Stanford University, Stanford, CA, and NationalBureau of Economic Research, Cambridge, MA.Hoxby, C. M., S. Murarka, and J. Kang. 2009. “How New York City’s Charter <strong>Schools</strong>Affect Achievement, August 2009 Report.” Second report for the New YorkCity Charter <strong>Schools</strong> Evaluation Project, Cambridge, MA.Jimenez, E., and Y. Sawada. 1999. “Do Community-Managed <strong>Schools</strong> <strong>Work</strong>? AnEvaluation of El Salvador’s EDUCO Program.” <strong>World</strong> <strong>Bank</strong> Economic Review13 (3): 415–41.———. 2003. “Does Community Management Help Keep Kids in <strong>Schools</strong>? EvidenceUsing Panel Data from El Salvador’s EDUCO Program.” Discussion paper,Center for International Research on the Japanese Economy, University ofTokyo.Karim, S., C. A. Santizo Rodall, and E. C. Mendoza. 2004. Transparency in Education.Paris: International Institute for Educational Planning and UNESCO; Brussels:International Academy of Education.Khattri, N., C. Ling, and S. Jha. 2010. “The Effects of School-Based Management inthe Philippines: An Initial Assessment Using Administrative Data.” PolicyResearch <strong>Work</strong>ing Paper 5248, <strong>World</strong> <strong>Bank</strong>, Washington, DC.King, E., and S. Cordeiro-Guerra. 2005. “Education Reforms in East Asia: Policy,Process, and Impact.” In East Asia Decentralizes: <strong>Making</strong> Local Government <strong>Work</strong>,179–207. Washington, DC: <strong>World</strong> <strong>Bank</strong>.King, E. M., and B. Özler. 1998. “What’s Decentralization Got to Do with Learning?The Case of Nicaragua’s School Autonomy Reform.” Unpublished manuscript,Development Research Group, <strong>World</strong> <strong>Bank</strong>, Washington, DC.
138 | <strong>Making</strong> <strong>Schools</strong> <strong>Work</strong>King, E. M., B. Özler, and L. B. Rawlings. 1999. “Nicaragua’s School AutonomyReform: Fact or Fiction?” <strong>Work</strong>ing Paper 19, Impact Evaluation of EducationReforms Series, <strong>World</strong> <strong>Bank</strong>, Washington, DC.Leithwood, K., and T. Menzies. 1998. “Forms and Effects of School-Based Management:A Review.” Educational Policy 12 (3): 325.Lopez-Calva, L. F., and L. D. Espinosa. 2006. “Efectos diferenciales de los programascompensatorios del CONAFE en el aprovechamiento escolar.” In Efectos delImpulso a la Participación de los Padres de Familia en la Escuela, ed. CONAFE. Mexico:CONAFE.McGinn, N., and T. Welsh. 1999. “Decentralization of Education: Why, When, Whatand How?” Fundamentals of Educational Planning No. 64, International Institutefor Educational Planning, UNESCO, Paris.Murnane, R. J., J. B. Willet, and S. Cardenas. 2006. “Did the Participation of <strong>Schools</strong>in Programa Escuelas de Calidad (PEC) Influence Student Outcomes?” <strong>Work</strong>ingpaper, Harvard University Graduate School of Education, Cambridge, MA.OECD (Organisation for Economic Co-operation and Development). 2004. “Raisingthe Quality of Educational Performance at School.” Policy brief, OECD, Paris.www.oecd.org/dataoecd/17/8/29472036.pdf.Paes de Barros, R., and R. Mendonca. 1998. “The Impact of Three InstitutionalInnovations in Brazilian Education.” In Organization Matters: Agency Problems inHealth and Education in Latin America, ed. W. D. Savedoff. Washington, DC:Inter-American Development <strong>Bank</strong>.Parker, C. E. 2005. “Teacher Incentives and Student Achievement in NicaraguanAutonomous <strong>Schools</strong>.” In Incentives to Improve Teaching, ed. E. Vegas. Washington,DC: <strong>World</strong> <strong>Bank</strong>.Patrinos, H. A. 2006. “Mexico: AGE (Apoyo a la Gestión Escolar)—School ManagementSupport: A Qualitative Assessment.” Unpublished manuscript, <strong>World</strong><strong>Bank</strong>, Washington, DC.———. 2009. “School-Based Management.” Unpublished manuscript, <strong>World</strong> <strong>Bank</strong>,Washington, DC.Patrinos, Harry Anthony, Felipe Barrera-Osorio, and Juliana Guáqueta. 2009. TheRole and Impact of Public-Private Partnerships in Education. Washington, DC: <strong>World</strong><strong>Bank</strong>.Patrinos, H., and R. Kagia. 2007. “Maximizing the Performance of Education Systems:The Case of Teacher Absenteeism.” In The Many Faces of Corruption: TrackingVulnerabilities at the Sector Level, ed. J. E. Campos and S. Pradhan. Washington,DC: <strong>World</strong> <strong>Bank</strong>.Pradhan, M., D. Suryadarma, A. Beatty, and R. P. Artha. 2010. “Improving EducationalQuality through Enhancing Community Participation: Results from aRandomized Field Experiment in Indonesia.” Unpublished manuscript, <strong>World</strong><strong>Bank</strong>, Washington, DC.Santibañez, F. 2006. “School-Based Management Effects on Educational Outcomes:A Literature Review and Assessment of the Evidence Base.” <strong>Work</strong>ing paper,<strong>World</strong> <strong>Bank</strong>, Washington, DC.Sawada, Y. 1999. “Community Participation, Teacher Effort, and Educational Outcome:The Case of El Salvador’s EDUCO Program.” <strong>Work</strong>ing Paper 307, WilliamDavidson Institute, University of Michigan, Ann Arbor.
School-Based Management | 139Sawada, Y., and A. B. Ragatz. 2005. “Decentralization of Education, Teacher Behavior,and Outcomes.” In Incentives to Improve Teaching, ed., E. Vegas. Washington,DC: <strong>World</strong> <strong>Bank</strong>.Skoufias, E., and J. Shapiro. 2006. “The Pitfalls of Evaluating a School Grants ProgramUsing Non-Experimental Data.” Policy Research <strong>Work</strong>ing Paper 4036,<strong>World</strong> <strong>Bank</strong>, Washington, DC.Transparency International. 2005. Stealing the Future: Corruption in the Classroom. Berlin:Transparency International.Word <strong>Bank</strong>. 2003. Wo rld Development Report 2004: <strong>Making</strong> Services <strong>Work</strong> for Poor People.Washington, DC: <strong>World</strong> <strong>Bank</strong>.———. 2008a. “Devolving Power to the Local Level: The Role of Information andCapacity Building in Empowering Community-based Organizations.” ConceptNote on Ghana, <strong>World</strong> <strong>Bank</strong>, Washington, DC.———. 2008b. “Indonesia: BOS and BOS-KITA Project Appraisal Document.”Report 45043-ID, <strong>World</strong> <strong>Bank</strong>, Washington, DC.———. 2008c. “Mozambique DSSP.” Case study for the Africa School-Based ManagementReport, Human Development Network, <strong>World</strong> <strong>Bank</strong>, Washington,DC.———. 2008d. “Rwanda Impact Evaluation Incentives and Performance for Teacherson Fixed Contracts.” Concept Note, <strong>World</strong> <strong>Bank</strong>, Washington, DC.———. 2008e. “Senegal: Evaluation of the Impact of School Grants on EducationAchievement.” Concept Note, <strong>World</strong> <strong>Bank</strong>, Washington, DC.———. 2010a. “Education Impact Evaluation in The Gambia: The Whole SchoolDevelopment: An Interim Progress Report.” Unpublished manuscript, <strong>World</strong><strong>Bank</strong>, Washington, DC.———. 2010b. “A Review of the Bulgaria School Autonomy Reforms. Europe andCentral Asia Region.” Report 54890-BG, Human Development Department,<strong>World</strong> <strong>Bank</strong>, Washington, DC.
4<strong>Making</strong> Teachers Accountable<strong>Making</strong> schools and teachers more accountable for results, especially studentlearning outcomes, has become a central challenge for education policymakers in both developed and developing countries. The quantity andvariety of policy innovations in this area has increased significantly over thepast decade, with an especially striking increase in the developing world.This chapter reviews both the theory and the evidence base around twokey types of reform focused on teacher accountability: contract tenurereforms and pay-for-performance reforms.The first section summarizes the theoretical and empirical rationales forteacher accountability reforms. The second section reviews recent globalexperience with these reforms. The third and fourth sections put forth atypology of contract tenure and pay-for-performance approaches beingadopted in developing countries and review the evaluation evidencearound each type of reform. The fifth section compares the empirical evidencewith the theoretical literature on performance incentives to identifykey design issues. The final section draws cautious conclusions from existingevidence on how to design effective incentives for better teaching.Throughout the chapter, the developing country experience and researchliterature are surveyed broadly, but emphasis is placed on recent evidencefrom well-evaluated reforms in the developing world.Teacher Accountability Reforms: Why?Growing interest in teacher accountability reforms stems from a confluenceof factors. First, an increasing number of countries are convinced that141
142 | <strong>Making</strong> <strong>Schools</strong> <strong>Work</strong>student learning outcomes are the core barometer of education systemperformance. In developing countries, the use of nationally standardizedtests has increased substantially over the past 10 years, as has the numberof developing countries participating in internationally benchmarkedassessments such as the Organisation for Economic Co-operation andDevelopment’s (OECD’s) Programme for International Student Assessment(PISA). The latest wave of education research on long-term correlationsbetween (internationally benchmarked) student learning levels andgross domestic product (GDP) growth supports this focus. Studies concludethat education investments contribute to faster GDP growth only if schoolingis effective in raising student learning—and the higher the learninglevels, the faster the growth (Hanushek and Woessmann 2007). In short,an increase in the quantity and quality of student learning data in developingcountries has created a capacity that did not exist earlier to monitor andpotentially reward school-level learning improvements.Second, there is increasing evidence that teachers’ ability to generatestudent learning is highly variable. Recent careful studies of the “valueadded” of individual teachers working in the same grade in the same schoolhave begun to document that while students with a weak teacher maymaster 50 percent or less of the curriculum for that grade over a singleschool year, students with a good teacher can get an average gain of oneyear, and students with great teachers may advance 1.5 grade levels ormore (Hanushek and Rivkin 2010; Farr 2010). A series of great or badteachers over several years compounds these effects and can lead tounbridgeable gaps in student learning levels. The most rigorous research todate in this area is from the United States, and it may not proxy the variancein teacher effectiveness in other settings. But new research in Brazil, discussedlater in this chapter, suggests that teachers’ classroom performanceand effectiveness spans a large spectrum in at least some developing countrysettings as well.Third, education policy makers wishing to recruit or groom “great teachers”to raise overall learning results confront the empirical reality of recruitmentand compensation systems with weak links, if any, between rewardsand performance. The vast majority of education systems are characterizedby fixed salary schedules, lifetime job tenure, and flat labor hierarchies,which create rigid labor environments where extra effort, innovation, andgood results are not rewarded. Nor is it possible to sanction poor performance;the percentage of tenured teachers ever dismissed for poor performanceis exceedingly small (Weisberg and others 2009).Almost universally, teacher recruitment and promotion are based on thenumber of years of preservice training, formal certificates, and years in service.Yet an extensive body of research has documented the lack of correlationbetween these “observable” factors and teachers’ actual effectiveness
<strong>Making</strong> Teachers Accountable | 143in the classroom, measured by their ability to produce learning improvementin their students (Hanushek and others 2005). The record on inserviceprofessional development leading to measurable improvements inteacher performance is also strikingly poor (Borko 2004; Garet and others2001; Cohen and Hill 2001). The clear implication of available research isthat most school systems are recruiting and rewarding teachers for thewrong things, failing to encourage the capacities and behaviors that contributemost directly to student learning results, and unable to sanctionineffective performance.A disconnect between the incentives teachers face and the results schoolsystems seek is manifest in many developing countries by egregious performancefailures. A study of teacher absenteeism across six different developingcountries in 2004 found that, on average, 20 percent of the teachingforce was absent on any given day, suggesting low accountability for attendanceand performance (Chaudhury and others 2005). Classroom observationsin representative samples of schools in Latin America in 2009 foundmore than 30 percent of instructional time lost because teachers arrivedlate, left early, or otherwise failed to engage in teaching (Bruns, Evans, andLuque 2010). PISA 2006 data show that teacher applicants in most developingcountries are drawn from the weakest students in secondary andhigher education, even as the cognitive content of basic education becomesmore demanding. Above all, average learning outcomes in developingcountries are low and, in most countries, have failed to improve.Developing countries today spend an average of 5 percent of GDP oneducation, and many countries are on track to increase this. The impact ofthis investment on their subsequent economic growth hangs largely onhow effectively they use the 4 percent of GDP (80 percent of total educationspending) that goes to pay teachers. In a growing number of countries,the drive to improve student learning outcomes is translating into creativeand sometimes radical policy reforms aimed at changing the incentives forteachers. While the share of reforms being rigorously evaluated remainssmall, the evidence base to guide the design of new efforts is becomingmore robust. This chapter aims to distill that evidence and its implicationsfor policy.Recent Global Experience with TeacherAccountability ReformsAs Vegas (2005) and others have pointed out, individuals are attracted intothe teaching profession and gain satisfaction from their work for a widerange of reasons. All of these factors, shown in figure 4.1, constitute part ofthe incentives for teaching. Correspondingly, school systems have numerous
144 | <strong>Making</strong> <strong>Schools</strong> <strong>Work</strong>Figure 4.1 Teacher Performance Incentivesintrinsicmotivationrecognitionand prestigebonus payrespondingto clientsmasteryqualified,motivated,effectiveteacherssalarydifferentialsjobstabilityadequateinfrastructure andteaching materialsprofessionalgrowthpensions andbenefitsSource: Adapted from Vegas 2005.monetary and nonmonetary levers to use in attracting and rewarding effectiveteachers.Beyond the policies that touch teachers directly, broader education policiesthat shape the school environment also affect whether high-capacityteachers are attracted into a school system and motivated to perform. It isrelatively common for private schools and charter schools to recruit teacherswith qualifications equivalent to those of public school teachers whilepaying lower salaries or offering less job security. Teacher surveys reportthat attractive features of the school environment—including the qualityof infrastructure, class size, availability of teaching materials, quality ofprincipals, engagement of parents, time for collective work with otherteachers, and opportunities for professional growth—influence employmentdecisions and can offset lower wage and benefit compensation.This chapter zeroes in on two of the incentives pictured in figure 4.1: jobstability (that is, teacher contract tenure) and bonus pay or pay-for-performanceprograms.We differentiate bonus pay from other policies affecting salary differentialsin that bonus programs generally leave base salaries and the salaryscale intact but create incentives at the margin, with the offer of anannual (or monthly) bonus based on some measure of teacher performance.The performance measure may be an input measure, such asteacher attendance; an outcome measure, such as school or student results;
<strong>Making</strong> Teachers Accountable | 145or a combination of the two. The distinguishing feature of pay for performanceis that it rewards teachers for what they do or achieve during aspecified period (typically the prior school year). In this way, pay for performanceis conceptually distinct from the factors that generally determineother teacher salary differentials, such as teachers’ qualifications,geographic posting, type of service (that is, hardship pay for teaching incertain schools or disciplines), or even tests of skills and capacity—all ofwhich reward teachers for what they are capable of doing.In contrast to most of the other incentives for teachers, both contractswithout guaranteed tenure and pay-for-performance programs establishdirect links between teachers’ performance and their rewards or sanctions.Thus, contract tenure and pay-for-performance reforms are potentially twoof the strongest instruments at the disposal of education policy makers toincrease teachers’ accountability for results. These reforms are also of specialpolicy interest for several other reasons:• They are important. While there is evidence that intrinsic motivation playsa stronger role in the teaching profession than in many other occupations,there is also evidence that compensation and contract status arekey determinants of who goes into teaching, how long they remain, andhow they perform (Chapman, Snyder, and Burchfield 1993; Guarino,Santibañez, and Daley 2006; Rivkin, Hanushek, and Kain 2005; Murnaneand others 1991).• They are expensive. Teacher contracting and pay policies are importantdrivers of the overall teacher wage bill, which is by far the largest componentof education spending. As such, these policies have ripple effectson the resources available for all other education investments. In mostdeveloping countries, the teacher wage bill is also a large enough shareof public spending to have implications for overall fiscal policy.• They present major challenges for policy makers in most countries. Historicallyrigid policies tying teacher recruitment, tenure, and compensation toformal certification processes and seniority typically leave educationofficials with limited room to maneuver to either “de-select” teacherswho are not effective or reward high performers. While there may be along-term need in many countries to adjust the base wage and salaryscale for teachers relative to other categories of public or private sectoremployment, policy makers struggle with the recognition that the impactof across-the-board increases is fiscally prohibitive and may still fail tocreate stronger incentives for performance.These factors are inspiring increased experimentation in developingcountries with reforms that use the levers of contract tenure and bonus payto try to make teachers more accountable for performance. Of the two, pay
146 | <strong>Making</strong> <strong>Schools</strong> <strong>Work</strong>for performance has the largest number of experiences under way that arebeing subjected to rigorous impact evaluation, in both developing anddeveloped countries. However, both strategies are increasingly being usedin both low- and middle-income developing countries. The next two sectionsreview the leading developing-country experiences and emergingevidence base for each type of reform.Contract Tenure ReformsAlternative contracting, in its broadest form, means recruiting teachers oncontracts that do not grant the civil service status and tenure protectionoffered to regular teachers. Contract tenure reforms thus can overcome therigidity of existing teacher policies by establishing a parallel teacher corps orcareer stream with different rules of the game alongside the existing teacherstream.Although fairly uncommon in most European countries, alternativecontracting is used in Australia, the United Kingdom, the United States,some other OECD countries, and most developing countries. Alternativecontracts are typically for one year and renewable based on performance.Alternative contracting in developing-country settings is often—but notalways—associated with entry standards and pay levels that are lower thanfor regular civil service teachers. In OECD contexts, such contracting isoften used to bring highly qualified mid-career professionals from otherfields into teaching at comparable salaries.The rationale for alternative contracting in the developing world is usuallyeither a shortage of teachers who meet the civil service entry standardsor a shortage of public sector funding for the more expensive civil servicecontracts. Tightening teacher accountability for performance is rarely theexplicit rationale. However, being on a short-term, renewable contract canclearly generate stronger incentives for an individual teacher to meet theperformance goals of the contracting unit. The share of civil service teachersdismissed on performance grounds is extremely low in most systems,and these dismissals are almost always for egregious abuses, not simply forpoor effectiveness in producing student learning outcomes. Good data onturnover of contract teachers unfortunately do not exist, but in the mostcarefully studied environments turnover has been substantially higher—inthe range of 20–40 percent annually. However, there are no data on theshare of contract teacher exits strictly related to performance, and manyother factors are also typically at play.The core policy innovation is the creation of a parallel teacher cadrehired on short-term contracts, typically covering a single school year andrenewable based on performance. In a large share of cases, the hiring of
<strong>Making</strong> Teachers Accountable | 147contract teachers is also devolved to a lower level of the education system—the school or village level—than the hiring of civil service teachers, who aretypically hired at the national level. This creates potential for more effectivemonitoring of teacher performance by the contracting unit.Despite this potentially tight link between contract renewal and teacherperformance, goals or targets in such contracts are rarely precise or explicit.There are few developing-country cases of explicit links between contractteachers’ renewal and student learning improvements. If specific metricsare mentioned at all, they are more commonly teacher attendance or communitysatisfaction measurements, defined fairly broadly and somewhatsubjectively. Student learning progress, however, may be an implicit factorin school managers’ or community satisfaction with a contract teacher’sperformance. Table 4.1 summarizes the evidence base from rigorously evaluatedcases in the developing world.Confounding analysis of the pure accountability effects of less-securecontract terms and possibly closer performance monitoring is the fact thatboth the background characteristics (level of education and socioeconomicstatus) and pay levels of contract teachers can be different and sometimeslower than those of civil service teachers. While economic theory predictsthat contracts renewable annually based on performance and monitoredlocally will increase teachers’ motivation to perform in line with performancemeasures established by the hiring unit, both teacher effort andresults may be decreased by the lower compensation embodied in many ofthese contracts or by lower teacher capacity (at least in terms of formalpreparation). How these competing tendencies play out in practice, andhow they affect learning outcomes for students, has been a subject of muchdebate. Only recently has enough robust evidence from diverse settingsbegun to offer some answers.Impact Evaluation EvidenceIndia: Balsakhi contract teacher programThe Balsakhi (“child’s friend”) program, implemented in two cities in India(Mumbai and Vadodara), paid locally recruited young women with a tenthgrade(secondary school) education roughly 10 percent of a regular civilservice teacher’s salary to teach basic literacy and numeracy skills to thirdandfourth-grade children who needed remedial support. The targeted childrenleft the classroom in the afternoon and received tutoring for two hoursper day. The program was highly effective in boosting the learning of thesechildren, to the extent that average math and reading test scores in the treatmentschools increased by a 0.14 standard deviation in the first year and a0.28 standard deviation after two years over the averages in the comparisonschools (Banerjee and others 2007). Most of the gains were attributable
148 | <strong>Making</strong> <strong>Schools</strong> <strong>Work</strong>Table 4.1 Summary of Evaluated Contract Tenure ReformsCountry(evaluation date)India: Balsakhi teacherprogram (Banerjee andothers 2007)Design,coveragepilot program,two citiesPerformancemeasurestudent test scores;teacher absenceContract teacherrelative wage10% of civil servicewage; lower educationallevelKenya: contractteachers (Duflo, Dupas,and Kremer 2009)pilot program,140 schools inrural Kenyastudent test scores;teacher attendanceand time spent activelyteaching; studentattendance30% of civil servicewage; sameeducational levelIndia: Andhra Pradesh(Muralidharan andSundararaman 2010a)pilot program,100 schools inrural AndhraPradeshstudent test scores;teacher attendanceand time spent activelyteaching20% of civil servicewage; lower educationallevelMali, Niger, and Togo(Bourdon, Frölich,and Michaelowa, 2007)nationalprogramsstudent test scores —Peru (Alcazar andothers 2006)provincialprogramteacher absence —
<strong>Making</strong> Teachers Accountable | 149Locus ofcontractinglocal NGOschoolcouncilsschoolcommitteesschoolcouncilsContracttermannual,renewableannual,renewableannual,renewableannual,renewablePeriodobservedEvaluationmethodResults3 yrs. RCT (1) Test scores for schools withBalsakhi program 0.14 SD higherin first year, 0.28 SD higher insecond year, and 0.1 SD higherone year after program end.(2) Largest gains by children atbottom of initial test scoredistribution and by childrenreceiving remedial teaching.3 yrs. (2 ofintervention,1 of follow up)RCT2 yrs. RCT andmatching(1) Test scores for students ofcontract teachers were 0.21 SDhigher than students of civilservice teachers within the sameschool. (2) Contract teachers30 percentage points morelikely to be found in classteaching than were civil serviceteachers. (3) 11% drop inabsence rates for students ofcontract teachers. (4) Long-termimpacts persisted only whereschool councils had receivedmanagement training.(1) Test scores 0.15–0.13 SDhigher in math and language,respectively, for students inschools with an extra contractteacher. (2) Contract teachersabsent 16% vs. 27% of time forregular teachers. (3) Contractteachers found teaching 49% oftime vs. 43% for regular teachersduring spot visits. (4) Nonexperimentalestimation findscontract teachers as effective inproducing learning gains, atone-fifth the cost of regularteachers.— matching Contract teachers had positiveeffect on low-ability students inlow grades and negative effecton high-ability students in highgrades.— — — matching Contract teachers 12–13% morelikely to be absent.(continued next page)
150 | <strong>Making</strong> <strong>Schools</strong> <strong>Work</strong>Table 4.1 Summary of Evaluated Contract Tenure Reforms ContinuedCountry(evaluation date)Design,coveragePerformancemeasureContract teacherrelative wageIndia: MadhyaPradesh (Goyal andPandey 2009a)statewideprogram,200 schoolsstudent test scores;teacher attendanceand activity20–25% of civil servicewage; higher educationallevelIndia: UttarPradesh (Goyal andPandey 2009a)statewideprogram,200 schoolsteacher attendanceand activity20–25% of civil servicewage; higher educationallevelSource: Authors’ compilation.Note: RCT= Randomized control trial. NGO = nongovernmental organization.— = not available. SD = standard deviation(s).
<strong>Making</strong> Teachers Accountable | 151Locus ofcontractingdistrictofficevillageeducationcommitteeContractterm3 yrs.,renewable10 mos.,renewablePeriodobservedEvaluationmethodResults2 yrs. matching (1) Contract teachers absent27% of time vs. 37% for regularteachers. (2) Contract teachersfound teaching 37% of time vs.25% for regular teachers duringspot visits. (3) Student testscores positively associated withteacher effort. (4) Contractteachers’ absence and activityrates worsen in second contractyear but still better than regularteachers.2 yrs. matching (1) Contract teachers absent26% of time vs. 39% for regularteachers. (2) Contract teachersfound teaching 36% of time vs.19% of time for regular teachersduring spot visits. (3) Studenttest scores positively associatedwith teacher effort. (4) Contractteachers’ absence and activityrates worsen in second contractyear to similar levels as regularteachers.
152 | <strong>Making</strong> <strong>Schools</strong> <strong>Work</strong>to increases in learning by the children who had received remedial tutoring.Even one year after the program ended, the average student in theBalsakhi schools had test scores that were 0.1 of a standard deviation higherthan the average student in comparison schools.Although the program was clearly effective as a targeted, complementaryinstruction strategy using low-cost community-based tutors, it was notdesigned as a “head-to-head” trial of the cost-effectiveness of contractteachers as opposed to civil service teachers. In addition to their differentcontract status and pay levels, the Balsakhi teachers had different curriculumgoals, teaching hours, and class sizes from those of the regular schools.Due to the design of the study, intermediate variables of teacher effort, suchas absence rates and use of instructional time, were not monitored. However,the large learning gains produced by teachers contracted at 10 percentof the prevailing civil service teacher salary provides evidence that, at leastin some contexts, contract teachers’ lower average qualifications, lowerpay, and lack of long-term contract security do not impede effective performance.Kenya: Extra Teacher ProgramThe Extra Teacher Program (ETP) in western Kenya provided funding to arandomly selected set of schools to allow their school committees to hire alocal contract teacher. Given an excess supply of graduates from Kenyanteacher training schools, contract teachers in Kenya, unlike India, have thesame academic qualifications as civil service teachers (Duflo, Dupas, andKremer 2009). However, the contract teachers were paid less than onethirdof the civil service pay and could be fired by the school committeeafter each annual performance review.The evaluation found that contract teachers were 15 percentage pointsmore likely to be in class and teaching during unannounced visits thanwere civil service teachers in the comparison schools. The attendancerecord of contract teachers was even more impressive—30 percentagepoints higher—when compared with that of civil service teachers in theirown schools, whose absence rates increased when the contract teachersbegan working. However, training programs for the school committees inhow to monitor teacher attendance and performance mitigated the“shirking” behavior of civil service teachers over time.The overall ETP program involved a number of different school-levelinterventions, including cutting class size in half (through the hiring ofcontract teachers) and assigning students to smaller classes, either randomlyor tracked by ability. Overall, the program produced significantlyhigher student test scores. Among the program’s results was clear evidencethat students randomly assigned to contract teachers scored a 0.21 standard
<strong>Making</strong> Teachers Accountable | 153deviation higher on reading and math tests than their schoolmates assignedto civil service teachers. Students assigned to contract teachers also attendedschool more regularly (88 percent of the time versus 86 percent, correspondingto an 11 percent drop in absence rates). The stronger learningoutcomes produced by contract teachers provides evidence of higher—orat least more effective—teaching effort than that of civil service teachers,despite the contract teachers’ lower salaries. However, the fact that contractteachers were assigned to a single class of students and stayed withthose students for two successive years (unlike the typical pattern of a newteacher each year) may have played a role as well.The evaluation evidence was less clear on why students of Kenyan contractteachers performed better. The contract teachers were absent lessand their students’ attendance was slightly better, but relatively fewschool committees exercised the option not to renew a teacher’s contracton performance grounds. Nonetheless, provision of school-based management(SBM) training to school committees (on how to manage thehiring, performance monitoring, and renewal decisions for contractteachers) was correlated with positive long-term impacts of the program.At the three-year follow-up, only students of contract teachers in schoolswhose committees had been trained performed significantly better thanstudents in control schools. The SBM schools were also more likely to usefunding from the community to retain the contract teacher once programfunding ended; 43 percent of them did so, compared with 34 percent ofnon-SBM schools.As in other country cases, the authors noted questions around the longtermsustainability of the contract teacher advantage. The superior performanceof these teachers could have been the result of better choice ofteachers by the local school committees or the stronger incentives thoseteachers faced. But the contract teachers’ performance could also havereflected their motivation to perform well as a stepping stone towardhigher-paid civil service teaching positions. While the ETP program did notprovide a formal pathway to civil service status, it did allow teachers toacquire valuable experience; by the end of the program, 32 percent of thecontract teachers did, in fact, acquire civil service teaching positions. Duflo,Dupas, and Kremer (2009) cautioned against assuming that averageteacher performance, in Kenya or elsewhere, would match the performanceof contract teachers in their study if all teachers were placed onalternative tenure contracts. In every setting where they were used, contractteachers worked alongside civil service teachers with higher pay andjob security; the possibility of parlaying contract teaching experience intoeventual civil service positions was a part of the incentive structure thatcontract teachers faced.
154 | <strong>Making</strong> <strong>Schools</strong> <strong>Work</strong>Andhra Pradesh, India: Contract teacher programAs part of a broader study of teacher incentives, contract teachers werehired in 2005 for a randomly selected set of schools across the state ofAndhra Pradesh, India. As in the Balsakhi program, the contract teachershad lower average education than the civil service teachers in these schoolsand also tended to be younger, female, and more likely to live in the localvillages. Whereas 84 percent of civil service teachers had a college degreeand 99 percent had a formal teaching certificate, only 47 percent of contractteachers had completed college and only 12 percent had a teachingcertificate. Eighty-one percent of the contract teachers lived in the localvillage, compared with 9 percent of the civil service teachers. Seventy-twopercent of the contract teachers were female, with an average age of 24,while only 34 percent of the civil service teachers were female, with anaverage age of 39. The contract teachers’ pay was also dramatically lower:less than one-fifth of the civil service wage.Over the two years of the program, the contract teachers were absentsignificantly less—16 percent of the time, compared with 27 percent forcivil service teachers in the same school, with the performance differentialhigher in the second year than in the first (Muralidharan and Sundararaman2010a). In both years, the contract teachers were also more likely to befound teaching during spot visits by observers. Among contract teachers,those with lower absence rates and higher rates of observed teaching activityin the first year of their contract had higher rates of contract renewal forthe second year.Higher effort from the contract teachers (measured by absence rates andobserved teaching activity) plus the reduction in average class size thattheir recruitment permitted had positive effects on student learning. Aftertwo years, students in schools assigned a contract teacher scored a 0.15standard deviation higher in math and a 0.13 standard deviation higher inlanguage than their counterparts in the same grade in schools without contractteachers (Muralidharan and Sundararaman 2010a). In short, lesseducatedteachers who were paid a small fraction of the civil service wagein Andhra Pradesh appeared to be more accountable for performance thantheir civil service counterparts—in terms of both attendance and teachingactivity—and helped boost overall school outcomes.Although the study was a randomized trial, the recruitment of a contractteacher also had a major effect on class size in these small schools, so it isdifficult to disentangle how much student learning outcomes were drivenby the smaller classes rather than the differential effort or effectiveness ofcontract as opposed to regular teachers. Muralidharan and Sundararamanconducted a number of persuasive nonexperimental tests and concludedthat the contract teachers were as effective as the regular teachers in improvingtheir students’ learning. Given the contract teachers’ dramatically lower
<strong>Making</strong> Teachers Accountable | 155wages, they were five times more cost-effective in producing educationalresults.Other contract teacher studiesNo other randomized evaluations have directly compared the performanceof contract teachers and civil service teachers, but several other developingcountry studies have used matching methods to explore these issues. Contractteachers are widely used in West Africa, and Bourdon, Frölich, andMichaelowa (2007) compared the experience in Mali, Niger, and Togo,updating an earlier study of Togo by Vegas and De Laat (2003). They foundthat the presence of a contract teacher was positively correlated with thelearning performance of low-ability students in the early grades but negativelycorrelated with the results of high-ability students in the uppergrades.A study in a rural province in Peru was the only study to date to documenthigher absence rates for contract teachers than for civil service teachers,by 12–13 percentage points (Alcazar and others 2006). The authorsspeculated that the lower salaries of contract teachers, in a context of weaklocal supervision, were a major reason for those teachers’ apparently lowereffort. Unfortunately, the study did not include any data on the studentlearning performance of contract and civil service teachers.In two additional states in India that made extensive use of contractteachers—Madhya Pradesh and Uttar Pradesh—Goyal and Pandey (2009a)carried out a nonexperimental analysis of the relative performance ofcontract and civil service teachers. In these states, unlike Andhra Pradesh,contract teachers typically were more educated than regular teachers,although they were much younger, had much less teaching experience,and were more likely to come from the local community. Consistent withthe results of experimental studies in India, the contract teachers workingin Madhya Pradesh and Uttar Pradesh public schools consistentlydemonstrated higher effort than regular teachers, whether measured asdaily attendance or as the likelihood of being actively engaged in teachingduring an unannounced visit. This higher effort was also correlatedwith significantly better learning outcomes for their students on languageand math tests after controlling for other school, teacher, and studentcharacteristics.Goyal and Pandey followed the performance of the contract teachersover two years and noted that effort levels (attendance rates and likelihoodof being found teaching) declined for teachers in their secondcontract period in both states and, in the case of Uttar Pradesh, becameindistinguishable from regular teachers. They speculated that weak defacto oversight by school-level committees significantly reduced contractteachers’ incentives to perform. In both states, less than 6 percent of school
156 | <strong>Making</strong> <strong>Schools</strong> <strong>Work</strong>committee members were even aware that selection and oversight of contractteachers was one of their core responsibilities. In practice, most contractteachers were rehired after their first year, and a number of contract teachersin Madhya Pradesh were able to move into the regular teacher stream(although at a reduced salary).Weak de facto performance oversight, high likelihood of contract renewal,and opportunities for transfer into the regular civil service stream (or ofsuccessful union mobilization to equalize contract and regular teachers’employment terms) all reduced the differential in performance incentivesbetween contract teachers and regular teachers and thus weakened thepotential power of alternative contracting to strengthen teacher accountabilityfor results. While there is uncertainty in the Indian context, as elsewhere,about the long-term sustainability of contract teacher policies, theevidence on their cost-effectiveness as a strategy for improving educationaccountability and outcomes is strong.Contract Teacher Programs: The Balance of EvidenceThe most rigorous of the available studies found contract teachers to bemore cost-effective than regular civil service teachers—in India, dramaticallyso. In both Kenya and India, randomized trials have found learningoutcomes for students of contract teachers to be better than those of civilservice teachers, despite contract teachers’ much lower salaries. Nonexperimentalstudies in India have found similar results. Earlier evidence oncommunity-hired teachers in Central America (not included here but summarizedthoroughly in Vegas 2005) was less robust, but that evidence alsosuggested that contract teachers achieved similar or better student gradeprogression and learning outcomes (controlling for student background) atlower cost.Although contract teachers almost always work for lower salaries thantheir civil service counterparts, the cost-effectiveness of a contract teacherpolicy is likely to depend on country characteristics and the level of educationinvolved. For example, all of the recent cases cited involved contractteachers at the primary level (where the supply of potential teachers withadequate capacity is not as likely to be constrained as at the secondary levelor for specialty subjects such as sciences and math). It cannot be assumedthat in all contexts it will be possible to recruit adequately qualified teachersat lower salaries.In addition, there are major questions about the sustainability of thispolicy over time. Most of the evaluated cases suggested that contractteachers may have accepted the lower salaries and insecure tenure becausethey were queuing for civil service positions. Teachers’ unions have alsoaided contract teachers in some African countries and in Central America
<strong>Making</strong> Teachers Accountable | 157to press successfully not only for tenure but also for equivalent wages—undermining the rationale for alternative contracting. In many of thecases evaluated, a large share of contract teachers do end up entering thecivil service.Nonetheless, the new wave of evidence on the short-term impacts ofcontract teacher reforms is fairly consistent: the use of contract teachers canstrengthen the scope for local monitoring of teacher performance by parentsand school councils, which results in higher teacher effort, whichresults in better student learning outcomes. In contexts where the supply ofadequately trained teachers is not constrained, these positive outcomes canalso be achieved at lower costs per student.The evidence supports a theory of action in which the positive impactsof contract teacher reforms hinge on the de facto effectiveness of local monitoring.In evaluated cases where decisions about the hiring and retentionof contract teachers were made higher up the administrative chain and notat the school level, or where local school committees were not equipped orempowered to put “teeth” into contract renewal decisions, impacts havebeen lower or have broken down relatively quickly. Alternative contractingcan stimulate higher teacher effort and resulting improvements in studentlearning, but only if the hiring authority actually exercises the scope forholding teachers more accountable for performance.Pay-for-Performance ReformsSalary scales for teachers, unlike salary scales in most other sectors of theeconomy, are typically highly compressed, and movement across salarybands is rarely linked to individual results. These facts are all the more strikinggiven the research evidence that individual teachers’ ability to produceeducational results varies widely. There is less consistent evidence acrosscountries (and over time) on whether the average level of teacher salaries issufficiently competitive with those of comparable occupations to attracthigh-capacity individuals to teaching. But there is remarkable concurrencein the literature that the widespread pattern of relatively flat salary progressionover teachers’ careers plus promotion policies rigidly linked to senioritycombine to create weak incentives for teachers to perform to the best oftheir abilities and for high performers to remain in teaching. Indeed, inanalyzing the large-scale migration of high-ability women out of the teachingprofession in the United States between 1960 and 2010, Hoxby andLeigh (2004) argued that the “push” of compressed pay scales played astronger role than the “pull” of more lucrative jobs in other sectors (Ballouand Podgursky 2002; Delannoy and Sedlacek 2001; Odden and Kelley1997, cited in Umansky 2005).
158 | <strong>Making</strong> <strong>Schools</strong> <strong>Work</strong>To address these issues, school systems—and, indeed, other sectors andemployers trying to stimulate higher worker productivity and efficiency—have resorted to bonus or “merit pay” schemes that establish a direct financialreward for the desired performance. In the United States alone, therehave been hundreds of merit pay programs in education over the past century(Murnane and Cohen 1986). These programs typically share theobjective of introducing some degree of variable annual compensation forteachers based on a measure of relative performance. The rewards can bebased on input measures of performance (such as teacher attendance) oroutcome or results measures (such as student learning progress). They can betargeted to either individual teachers or groups of teachers, typically at theschool level.Most of the cases reviewed in this chapter award bonus pay based onoutcomes. The increased availability of student assessment data appears to beleading more school systems to try to link teacher pay directly to the performancemeasure they value most: student learning progress. Bonus payis an attractive format because it does not increase the base salary bill andmaintains the annual carrot of an incentive. Group bonuses, which rewardall staff in a school for the school’s average results, are more common thanindividual teacher bonuses. One reason for this is sheer practicality; individual(classroom-level) teacher bonuses require the ability to measurelearning gains for every subject and grade, which is costly administratively.An interesting new model being used in Brazil is a combined approach.The core bonus is a group reward (for all school personnel, includingadministrative staff), calculated based on average school learning results,but downward adjustments are made in the amounts paid to individualteachers and staff based on their individual absence rates.Impact Evaluation EvidenceThere is tremendous policy innovation and interest in education pay forperformance currently, in the OECD as well as the developing world,and a complete review is beyond the scope of this chapter. We focus on(1) developing-country experiences that have been rigorously evaluatedand (2) important or innovative developing-country cases that are currentlybeing rigorously evaluated, even if final results are not yet available.To organize the diverse experiences, we use a typology based on twodimensions: what is rewarded, and whether the rewards are individual- orgroup-based. Table 4.2 presents a summary of data from the followingreviewed cases:• Bonuses based on student learning outcomes— Individual bonus (Andhra Pradesh, India 2009; Israel 2009)— Group bonus (Andhra Pradesh, India 2009; Kenya 2010)
<strong>Making</strong> Teachers Accountable | 159• Bonuses based on student learning plus other student outcomes— Group bonus (Pernambuco, Rio de Janeiro, Sao Paulo, and MinasGerais, Brazil forthcoming; Israel 2002)• Bonuses based on student outcomes and teacher input measures— Group bonus (Chile 2009)• Bonuses based on teacher input measures only— Individual bonus (Rajasthan, India 2010; Kenya 2001)Bonuses Based on Student Learning OutcomesIndia: Andhra PradeshAn ongoing randomized study in the Indian state of Andhra Pradesh offersthe most persuasive evidence to date of the potential for individual andgroup bonuses for teachers to motivate more effective teacher performancein a developing-country setting. In a statewide representative sample of500 schools, Muralidharan and Sundararaman (2009) carefully measuredthe impact of four alternative treatments applied in 100 schools each:• An individual teacher bonus• A group teacher bonus• Provision of one extra contract teacher (input strategy)• A block grant to the school (input strategy)One hundred schools, not eligible to receive either incentives or inputs,served as the comparison group. To minimize Hawthorne effects, all schools(including the comparison schools) received the same amount of monitoringand measurement, differing only in the treatment received. Beginningand end-of-year tests were administered to all students and used to estimatevalue-added (gain) scores.All interventions were designed to cost the same: Rs 10,000 per school(around $200), roughly equivalent to a teacher’s monthly salary (includingbenefits). 1 Even though the four interventions were calibrated to cost thesame, in practice the group incentive treatment ended up costing less—about Rs 6,000 ($125) per school. 2The teacher incentive bonus was structured as a fixed performancestandard, meaning that awards were distributed to any teacher or schoolthat raised test scores by 5 percentage points or more over their baselinetest scores. Below this threshold, the bonus was zero. Above this threshold,the bonus was calculated as the percentage additional gain in averagetest scores, multiplied by a slope of Rs 500 ($10). The average bonus wascalibrated to be around 35 percent of a typical teacher’s monthly salary.Individual bonus payments were based on the average improvement intest scores for that teacher’s particular class. In group-incentive schools,teachers received the same bonus, based on the average school-level
160 | <strong>Making</strong> <strong>Schools</strong> <strong>Work</strong>Table 4.2 Summary of Evaluated Pay-for-Performance (Bonus Pay) ReformsCountry(evaluation date)BonustypeDesign,coverageBonus based on student learning outcomes—IndividualIndia: AndhraPradesh(Muralidharan andSundararaman 2009)Performancemeasureindiv. pilot, 100 schools gain in student TS (endof-yr.vs. start-of-yr. TSfor each classroom)Israel (Lavy 2009) indiv. pilot, 629 teachersin 49 high schoolsBonus based on student learning outcomes—GroupIndia: AndhraPradesh(Muralidharan andSundararaman 2009)avg. student scores onmatriculation exams andavg. pass rate relative topredicted scores(adjusted for studentSES)group pilot, 100 schools avg. gain in student testscores at school levelrelative to baselinescoresAwardprocesspiecewise formula:bonus a function of% gain in TS, abovea threshold of 5%gainrank order ofteacherspiecewise formula(see above)Predictability60% of teachers infirst yr. got somebonus302 of 629 (48%)teachers got someaward(most teachers gotsome award)Kenya (Glewwe,Ilias, and Kremer 2010)group pilot, 50 schools avg. gain in student testscores at school levelrelative to baselinescoresrank order of“top-scoring” and“most-improved”(schools can win inonly one category)24 of 50 schools gotawardBonus based on student learning plus other student outcomes—GroupBrazil: Pernambuco(Ferraz and Bruns,forthcoming)groupstatewide,950 schoolsschool-level targets forimprovement in IDEPE(state TS and studentgrade progression);individuals’ bonusesdiscounted based onabsence ratespiecewise formula:above threshold of50% of targetattained, up to limitof 100% of target479 of 929 schools(52%) in 2009; 758of 954 schools(79%) in 2010received bonusBrazil: Sao Paulo(Ferraz and Bruns,forthcoming)groupstatewide,5,500 schoolsschool-level targets forimprovement in IDESP(state TS and studentgrade progression);individuals’ bonusesdiscounted based onabsence ratespiecewise formula:from 1% of targetattained, up to limitof 120% of schooltarget2009: 100% ofschools, 87% ofpersonnel got somebonus (13% ofpersonnel receivednone for excessabsence); 2010: 73%of schools, 77% ofpersonnel got somebonusBrazil: MinasGerais (Ferrazand Bruns,forthcoming)groupstatewide,3,972 schoolsschool-level targets forimprovement in IDEMG(state TS and studentgrade progression);individuals’ bonusesdiscounted based onabsence rates; schooltargets negotiatedannually with regionaladmin.piecewise formula: 33% of schools inabove threshold of 200960% of targetattained on firstphase of institutionalevaluation, cappedat 100% of target
<strong>Making</strong> Teachers Accountable | 161Monitoring andsupportBonus size,distributionBonusfrequencyCostEvaluationmethodResultssubstantial:feedback on testresults, interviews,classroommonitoring35% of MW annual during2-yr. experimentRs 1.9 million($42,200)RCT0.27 SD improvement inlearning outcomes comparedwith control schools bysecond yr.limited: someinterviewsconducted$1,750–$7,500per teacher persubject(70–300% ofMW)annual, 1-yr.experiment—(est. $1.5 million)quasirandomizedtrial, RDD(1) 14% higher math pass rateand 10% higher scores (2) 5%higher English pass rate and4% higher scoressubstantial(see above)$125/schooldistributedequally acrossteachers (about35% of MW)annual during2-yr. experimentRs 1.8 million($40,000)RCT0.16 SD higher test scorescompared with controlschools by second yr.limited: one roundof interviewsconducted21–43% of MW one-time K Sh 1.8 million($30,700)RCT(1) 0.14 SD higher test scorescompared with controlschools in first yr. (2) Gainsnot sustained one yr. after(3) No decrease in teacherabsence (4) Increase in examprep sessionsschool directorsurveys andclassroomobservations insample of220–300 schoolsall schoolpersonneleligible, teachingor nonteachingavg. bonuses:180% of MW(2009), 140% ofMW (2010)annual2009: R$28.8 million($15.3 million)2010: R$40 million($21.3 million)RDD<strong>Schools</strong> with more ambitioustargets improved 0.15–0.31 SDmore than comparableschools with lower targetsschool director andteacher surveysall schoolpersonneleligible, teachingor nonteachingavg. bonuses:150% of MW(2009), 150% ofMW (2010)annual2009: R$600 million($319 million)2010: R$655 million($350 million)DD —school director andteacher surveys;classroomobservations insample of 600schoolsall schoolpersonneleligible, teachingor nonteachingannual2009: R$311 million($173 million)2010: R$371 million($206 million)DD —(continued next page)
162 | <strong>Making</strong> <strong>Schools</strong> <strong>Work</strong>Table 4.2 Summary of Evaluated Pay-for-Performance (Bonus Pay) ReformsContinuedCountry(evaluation date)Brazil: Rio deJaneiro City (Ferrazand Bruns,forthcoming)Israel(Lavy 2002)groupgroupmunicipality-wide,922 schoolspilot, 62 highschoolsschool-level targets forimprovement in IDERio(municipal TS andstudent gradeprogression); individuals’bonuses discountedbased on absence ratesBonus based on student learning outcomes and teacher or school input measures—GroupChile: SNED (Rau andContreras 2009)BonustypegroupDesign,coveragenational (all publicand publiclysubsidized basiceducation schools)Performancemeasurethreshold of 100% of —target for earlygrades, at least 50%of target for uppergrades, and ceilingof 110% of targets;no bonus for personnelwith more than 5days’ total absences(excused orunexcused)avg. credits taken, rank order of schools top 33% earnedpercentage of studentsawardreceiving matriculationcertificates, school dropoutrates, school scores relativeto predicted scoresadjusted for student SESavg. student TS onnational exam(SIMCE) (37%), SIMCEgains (28%), otherschool factors (35%)Awardprocessrank ordertournament forschools stratified byregion, urbanicity,grade level, and SESPredictabilitytop 25–35% ofschools get awardsBonus based on teacher input measures only—IndividualIndia: Rajasthan (Duflo,Hanna, and Ryan 2010)Kenya: preschools(Kremer and others2001)indiv.pilot, 113 rural NGOschoolsteacher daily attendancemonitored with adate-stamped cameraindiv. pilot; 50 preschools school headmastersgiven resources toaward teachers bonusesfor good attendancepiecewise formula:bonus of 50 rupeesper day foradditional daysworked over10-day-per-monththresholdpiecewise formula:deduction frommaximum potentialbonus based ondays of absence;remaining fundswent to schoolgeneral accountbonus attainmentautomatic uponattendanceheadmasters grantedfull bonuses to allteachers, regardlessof their actualattendanceSource: Authors’ compilation.Note: RCT = randomized control trial. RDD = regression discontinuity design.DD = difference-in-differences. PSM = propensity score matching. SD = standarddeviation(s). SES = socioeconomic status. TS = test scores. MW = monthly wage.— = not available. IDEPE = Index of Basic Education Development, Pernambuco (Brazil).IDESP = Index of Basic Education Development, Sao Paulo (Brazil). IDEMG = Index of BasicEducation Development, Minas Gerais (Brazil). IDERio = Index of Basic Education Development,Rio de Janeiro (Brazil). SNED = National System for Performance Evaluation of SubsidizedEducational Establishments (Sistema Nacional de Evaluación del Desempeño delos Establecimientos Educativos Subvencionados). SIMCE = National System for Measuringthe Quality of Education (Sistema Nacional de Medición de la Calidad de la Educación).NGO = nongovernmental organization.
<strong>Making</strong> Teachers Accountable | 163Monitoring andsupportBonus size,distributionBonusfrequencyCostEvaluationmethodResultsschool director andteacher surveysand classroomobservations insample of 200schoolsall schoolpersonneleligible, teachingor nonteachingindividualbonuses heavilydiscounted forabsenceannual2010: R$14.6 million($8 million)RDD, DD —limited $13,250–$105,000 perschool; teachersgot $250–$1,000(10–40% of MW)one-time $1.44 million RDD (1) 0.13 SD improvement inlearning outcomes(2) Modest increases incredits earned and % ofstudents taking matriculationexamChile has numerousteacher evaluation,observation, andschool supportprograms not directlyrelated to SNEDInitially 40% ofMW, currently70–80% of MW;90% of award toteachers, 10% toschoolannual for2 yrs., thennew tournamentstarts— DD withPSM, RDD(1) 0.07–0.12 SD increase inaverage learning outcomesassociated with introductionof SNED (2) No evidencethat winning bonusstimulated subsequentimprovementteacher surveysand spot visits,classroomobservationup to 25% ofMW each monthmonthly — RCT (1) Teacher absence in“camera” schools fell from42% to 23% (2) Student TSincreased by 0.17 SD (3)Grade completion increasedspot schoolmonitoring visits;teacher interviewsup to 300% ofMWper term(3 terms in eachschool yr.)K Sh 4.6 million($61,700)RCT(1) No decline in teacherabsence rate (29%) (2) Nochange in pupil attendanceor TS
164 | <strong>Making</strong> <strong>Schools</strong> <strong>Work</strong>improvement in test scores. Teachers in all incentive schools were toldthat bonuses would be paid at the beginning of the next school year, conditionalon average improvements during the current school year (firstyear of the experiment). Inputs (a block grant or an extra teacher) wereprovided unconditionally to selected schools at the beginning of theschool year.At the end of two years of the program, both the individual and groupteacher incentives were effective in improving student test scores. Studentsin incentive treatment schools had considerably higher test scores thanthose attending comparison schools, by 0.28 and 0.16 of a standard deviationin math and language, respectively. The qualitative analysis suggestedthat the main mechanism for the incentive effects was not increased teacherattendance but greater, and more effective, teaching effort conditional onbeing present. In particular, teachers in incentive schools were significantlymore likely to have assigned homework and class work, conducted extraclasses beyond regular school hours, given practice tests, and paid specialattention to weaker children. These results were obtained from self-reports—that is, answers to unprompted interview questions with treatment-schooland control-school teachers. These behaviors, however, were not independentlyverified or observed in the classroom. 3At the end of the two years of the study, there were significant (at the 10percent level) differences between individual and group incentives, andbetween incentive schools and input schools. Individual incentives producedan average increase in student test scores of a 0.27 standard deviation,compared with a 0.16 standard deviation in group incentive schools.The input strategies also yielded positive effects when compared to controlschools, but their magnitude (a 0.08 standard deviation) was substantiallylower than incentive schools. In terms of cost-effectiveness, both the groupand individual bonus programs were more cost-effective than the inputprograms, and they were roughly equal to each other in cost-effectiveness.Although the group bonus had a weaker impact on student learning results,this was offset by its lower costs.To analyze the possibility that bonus payments induced negative impactson student learning in other subjects, the researchers also studied learningoutcomes in science and social studies, which did not enter into the calculationof the bonus. Test scores in these subjects in the incentive schoolswere also higher (0.11 and 0.18 of a standard deviation in science andsocial studies, respectively) at the end of two years of the program. Contraryto concerns that bonus pay can lead teachers to “teach to the test” atthe expense of nontested subjects, at least in some contexts there mayactually have been positive externalities from bonus programs. In contextsof low average literacy and numeracy skills, the researchers hypothesizedthat teacher efforts to increase test scores in math and language can have
<strong>Making</strong> Teachers Accountable | 165positive spillover effects on students’ mastery of other subjects (Muralidharanand Sundararaman 2009).In a related experiment in the same setting, the researchers analyzedwhether providing teachers with more detailed feedback on their students’performance could increase the power of bonus incentives to improve testscores. The NGO running the project provided individual teachers withwritten diagnostic feedback on the performance of their class of students, inboth absolute and relative terms, at the beginning of the school year. Thereports also included specific suggestions on how to improve learning levelsin specific areas of weakness. 4 The program was implemented in 100 ruralprimary schools that were randomly selected from the previous treatmentschools across the state of Andhra Pradesh.The authors found that, by itself, the feedback treatment did not appearto have any significant effects. However, feedback combined with teacherincentives had a significant effect on student test scores. 5 Based on indicatorsof teacher activity, the researchers concluded that while teachers in all ofthe feedback schools could have used the reports effectively if they hadwanted to, only teachers in the incentive schools seemed to have done so.This suggests positive interactions between incentives and inputs and thepossibility for incentives to also raise the effectiveness of other school inputssuch as teacher capacity building (Muralidharan and Sundararaman 2010b).No other research to date provides a direct comparison of the impact ofindividual and group-based teacher bonuses in the same context. But thereis additional experimental evidence on individual teacher bonuses based onstudent learning results from Israel and a group-based bonus program inKenya.Israel: Individual teacher incentive experimentLavy (2009) evaluated a tournament-type bonus program in Israel thatranked teachers on the basis of value-added contributions to their students’test scores on high school matriculation exams, above and beyondthe predicted scores for those students based on their socioeconomic characteristics,their level of study in the relevant subject, grade level, and afixed school-level effect. Thus, teachers competed against each other in afair way to produce learning gains in their classes.The program covered 629 teachers, of whom 207 competed in Englishand 237 in math. 6 Relative to other incentive programs, the bonuses for thisprogram were large and could amount to $7,500 per class (one teacherwon two first-place awards totaling $15,000—equal to six months of salary).Due to a measurement error in the way schools were assigned into theprogram, it was possible to approximate a randomized trial of the incentiveoffer. Lavy found that the program had significant positive effects on studentachievement by increasing the test-taking rate among high school
166 | <strong>Making</strong> <strong>Schools</strong> <strong>Work</strong>seniors as well as the average pass rates and average test scores in bothmath and English.Postprogram interviews with participating teachers generated interestinginsights into how they responded to the incentives. Compared withteachers in schools not eligible for the program, teachers offered the incentivemodified their teaching methods in several ways. They were significantlymore likely to add after-school classes, to track students by abilitywithin the classroom, and to tailor instruction to the needs of individualstudents, with special focus on students of weaker ability. These actionsresulted in a higher share of students taking the matriculation exams thanotherwise would have and higher pass rates and average scores across alltest takers.Lavy also found that teachers’ effectiveness (measured by their successin achieving the bonus) was not highly correlated with “observable” teachercharacteristics such as age, education level, teaching certification, or yearsof experience. However, teacher performance was correlated with the caliberof university attended; teachers who had graduated from top-rankedIsraeli universities were significantly more effective than those who hadattended less-prestigious universities or teachers’ colleges. Unfortunately,although the program was initially designed to run for three years, a changeof government caused its cancellation after a single school year.Kenya: ICS teacher incentive programA program in Kenya provided a group-based incentive to teachers, basedon improvements in average student performance (Glewwe, Ilias, andKremer 2010). Fifty rural schools were randomly selected (out of 100) forthe incentive program, which was implemented over two years with oneadditional year of follow-up to observe long-term effects. Each year theprogram provided in-kind prizes, such as bicycles, valued at up to 43 percentof a typical fourth- to eighth-grade teacher’s monthly salary. The prizeswere awarded based on the performance of the school as a whole on theKenyan government’s districtwide exams. Performance was measured relativeto baseline test scores at the beginning of the school year. 7 Awards wereoffered to “top-scoring” or “most-improved” schools (schools could win inonly one of the two categories). In each category, prizes were awarded forfirst place (three prizes), second place (three prizes), third place (threeprizes), and fourth place (three prizes). Overall, 24 of the 50 selected schoolsreceived a prize of some kind, and teachers in most schools felt they had areasonable chance of winning a prize (Glewwe, Ilias, and Kremer 2010).The program was careful to track the students initially enrolled ineach school to ensure that new (potentially talented) students could notbe recruited to take the exam and that poor-performing students werenot held back from taking the exam. During the two years the program
<strong>Making</strong> Teachers Accountable | 167operated, a higher share of students in treatment schools than in comparisonschools took the exam, which did generate gains in test scores.By the second year, students in the bonus schools scored, on average, a0.14 standard deviation higher on the exams than did students in comparisonschools, with the strongest improvements seen in geography, history,and religion (around a 0.34 standard deviation during the first andsecond years versus the baseline [“year 0”] on the district exam, and a0.20 standard deviation versus the comparison schools in the second yearon the district exam). The next-largest effects were in science and math(0.20 and 0.15, respectively, of a standard deviation on the district examversus the baseline year), with no significant effects in other subjects.However, these gains proved short-lived. One year after the programended, there were no significant differences in test performance across theschools. Glewwe, Ilias, and Kremer (2010) speculated that teachers’ strategiesfor achieving the bonus focused on short-run efforts to boost performanceon the government tests, such as after-school tutoring in test-takingtechniques, rather than changes in their core pedagogy or effort levels thatmight have had a higher chance of promoting long-term learning. Forexample, teacher absence rates did not decline from the baseline level of20 percent of school days missed. Classroom observations did not detectany changes in homework assigned or use of learning materials. But by thesecond year of the program, bonus-eligible schools were 7.4 percentagepoints more likely than comparison schools to conduct exam preparationsessions. The benefits of this strategy were narrow, however. Whenresearchers applied tests using a format different from those of the governmentexams, they found no difference in student performance betweentreatment and comparison schools.Bonuses Based on Learning Improvement Plus OtherOutcomes (Group-Based)We know of no evaluated pay-for-performance programs based on multiplestudent outcomes that reward individual teachers, but the evidence ongroup-based bonuses of this type is increasing, thanks to a wave of innovationin this area in Brazil. Part of the reform stimulus is a conviction amongBrazilian policy makers that low teacher quality is the binding constraint toeducation improvement and that restructuring the incentives for teachersmust be part of the solution.Another factor appears to be the federal government’s establishment ofthe IDEB (Index of Basic Education Development) in 2007 (discussedfurther in box 4.1), which has provided states and municipalities with aconvenient, transparent, and universally accepted metric for setting andmonitoring annual school-level targets for improvement. Between 2008
168 | <strong>Making</strong> <strong>Schools</strong> <strong>Work</strong>BOX 4.1Targets that Avoid Perverse Incentives: Brazil’sIndex of Basic Education DevelopmentThe Brazilian Ministry of Education in 2007 introduced an innovativetool for systematic annual monitoring of basic education progress inevery school, municipality, state, and region of the country: the Índicede Desenvolvimento da Educação Básica (Index of Basic EducationDevelopment, or IDEB). The innovation lies in IDEB’s combined measureof student learning results and student flows (grade progression,repetition, and graduation rates). Because the index is the product ofboth test scores and pass rates, it discourages automatic promotion ofchildren who are not learning. However, it also discourages schoolsfrom holding children back to boost learning scores. Avoiding incentivesfor grade retention is important in Brazil, where the average repetitionrate in primary school is approximately 20 percent, the highestin Latin America.IDEB builds on the progress Brazil has made in scaling up its nationalstudent assessment system to a technically well-regarded learningassessment of math and language—called the Prova Brasil (BrazilTest)—that is applied every two years to every fifth-, ninth-, and twelfthgradestudent. The IDEB measure combines Prova Brasil test resultswith administrative data on school enrollments, repetition, and gradepromotion. The raw scale of the exams varies from 0 to 500, and thestandardized scale ranges from 0 to 10. Pass rates are calculated basedon the information reported by each school to the National SchoolCensus, applied yearly by the Ministry of Education.The IDEB for each grade-subject is calculated as the product of thestandardized Prova Brasil score and the average pass rate for the cycleevaluated (π):IDEB asj= ProvaBrasil asj*π asj(4.1)where a is the subject evaluated (Portuguese or mathematics),s is the cycle evaluated,j is the school.The average pass rate in the cycle varies between 0 and 1 (1 if thepass rate equals 100 percent). The standardized IDEB measure thusvaries between 0 and 10.The index has become rapidly accepted in Brazil as the leading metricfor gauging the relative performance of individual schools as well asmunicipal, state, and private school systems. Biannual IDEB results are(continued next page)
<strong>Making</strong> Teachers Accountable | 169BOX 4.1 continuedwidely reported in the media, and the federal government has establishedtargets for IDEB improvement for all of Brazil’s 26 state and5,564 municipal school systems.IDEB has also facilitated the implementation of teacher bonus programsat both the state and municipal levels over the past three years.Although the different state and municipal programs in operation havea number of alternative design features, all are based on the IDEB metrics(states typically apply state-level tests that are equated with theProva Brasil in the off years to generate a corresponding annual measureof performance). From the standpoint of federal education policy,IDEB has created a powerful platform for comparative analysis of stateand municipal innovations in basic education.Source: Fernandes 2007.and 2010, six states and one large municipality in Brazil adopted annualteacher bonus programs based on IDEB results.Because each of the Brazilian programs is being implemented systemwide,it is not possible to evaluate rigorously the fundamental questionof whether introducing a bonus program causes the education system toimprove. In these systems, there are no schools operating outside of thebonus regime and thus no perfectly valid comparison group. However,researchers plan to track the evolution of results in the “bonus” andneighboring nonbonus states and municipalities over time, using difference-in-differencesanalysis. And rigorous evidence on how differentdesign features of the bonus programs affect school performance isbeing generated, exploiting discontinuities in the ways that school-leveltargets have been set. The “rules of the game” for the bonus programsin Pernambuco state and Rio de Janeiro municipality are most conduciveto this approach. Although both evaluations are in an early stage,some first-round results from Pernambuco are discussed here.Pernambuco, Brazil: Group-based teacher bonus programIn 2008, Pernambuco became the third state in Brazil to introduce a payfor-performancesystem that rewards school personnel for the attainmentof annual school improvement targets. All schools that achieve atleast 50 percent of their targets receive a proportional bonus, up to a capof 100 percent. Because the state budgets one month’s education payrollfor the program annually, the average bonus will exceed one month’s
170 | <strong>Making</strong> <strong>Schools</strong> <strong>Work</strong>salary if less than 100 percent of schools achieve it. In the first year of theprogram, 52 percent of schools achieved over 50 percent of their targets,and the awards averaged 1.8 months of salary for most recipients. In thesecond year, 79 percent of schools received the bonus, and the averageaward was 1.4 months of salary.This is a relatively large incentive compared with other programs internationally.Pernambuco’s rule that schools achieving less than 50 percent oftheir targets receive nothing also creates a strong incentive. In some otherBrazilian states, the rules of the game allow every school to receive somedegree of bonus proportional to results, no matter how slight. Although thebonus is group-based (in that it rewards the whole school for its results),school directors have no discretion in how the funds are distributed. Eachmember of the school staff (teaching and nonteaching) receives the equivalentpercentage bonus applied to the staff member’s monthly salary.The “strength” of the incentives embedded in the Pernambuco program’sdesign make it an important case to analyze. The rules used to setthe initial targets in Pernambuco—based on whether schools fell in thebottom 25 percent, 26–50 percent, 51–75 percent, or 76–100 percent of theperformance distribution in 2007—created discontinuities in the targetsthat permit rigorous evaluation of their effects. Similarly performing schoolshad more or less ambitious targets depending on which side of these cutoffsthey happened to fall. These discontinuities permit research on a numberof important questions: How, in the short run, do schools respond to targetsfor improvement that are more or less ambitious? Do “stretch” targetsmotivate higher effort, or do they cause schools to give up?Pernambuco’s rule restricting bonus payments to schools that achieve atleast 50 percent of their targets allows analysis of how achieving or notachieving a bonus payment in a given year affects a school’s effort and strategiesin subsequent years—including adverse impacts such as encouragingmore time on tested subjects, teaching narrowly to the test, or inducingteachers to migrate to schools that are successful in achieving the bonus.Finally, as the evolution of Pernambuco’s student outcomes can be comparedover time to those of other states without bonus programs (usingdifference-in-differences analysis), the comparison will shed some light onthe ultimate question: how does introducing a system of pay for performanceaffect student learning, pass rates, and teaching practices?Results reported here are preliminary (Ferraz and Bruns, forthcoming).The first bonus was awarded in June 2009, based on schools’ performancerelative to their targets for the end-2008 school year (measured on standardizedtests and administrative data collected by the federal governmentin December 2008). Fifty-two percent of Pernambuco’s 929 schoolsachieved the bonus. A new set of targets was established for each schoolfor the 2009 school year, and in mid-2010 the second round of bonus
<strong>Making</strong> Teachers Accountable | 171payments was made. This time, 79 percent of schools (and 81 percent ofPernambuco’s 41,337 school-level personnel) received the bonus. Thekey findings thus far from the Pernambuco study are summarized below.Acceptance of the program was relatively high. Sixty-four percent of schooldirectors surveyed believed that the policy is an appropriate one, and 66percent believed the program was having a positive impact on their school—whether or not they received the first-year bonus.<strong>Schools</strong> with more ambitious targets achieved more progress (other things beingequal). In almost every performance category (fourth-, eighth-, or twelfthgrademath or Portuguese), schools falling on the “higher target” side of theperformance cutoffs made larger test score gains than the comparisonschools just below the cutoffs. The differential learning gains were sharpestfor schools just above the 25th percentile of performance. For the eighthgrade in 2008, for example, schools on the “higher target” side of the cutoffimproved average Portuguese scores by a 0.31 standard deviation morethan the schools just below the cutoff (with less-ambitious targets). Inmath, the differential gain was a 0.15 standard deviation. At the secondcutoff, just above and below the 50th percentile in the performance distribution,improvements were also higher for the schools with more ambitioustargets, but they were also of smaller magnitude. For the other testedgrades (fourth and eleventh), impacts were in similar ranges but variedacross subjects and, in a few cases, by cutoff point. Overall, however, theevidence was consistent—at least over the very short term—that highertargets in the presence of an attractive incentive in Pernambuco inducedhigher learning results by schools. 8Learning levels across the state improved significantly. By the end of 2009,the second year of the bonus program, Pernambuco’s state schools as awhole registered significant average improvements in learning, especiallyin Portuguese. Average Portuguese scores in the eighth and eleventhgrades increased by 0.44 and 0.57 of a standard deviation, respectively.Math scores in the eighth and eleventh grades rose by 0.27 and 0.31 of astandard deviation, respectively. These learning gains are large relative toobserved results from other teacher incentive programs. However, sincethis was a universally applied program within the state, these are rawgains, not gains relative to a comparison group. Difference-in-differencesanalysis will be needed to bound these gains. As Pernambuco ranked lastamong Brazil’s 26 states on the 2007 IDEB rankings for primary schools(through eighth grade) and 19th for secondary schools, a significant partof these gains likely reflects reversion to the mean.<strong>Schools</strong> that just missed receiving the bonus in 2008 improved more in the followingyear than schools that barely achieved the bonus. A key research question iswhether schools that received the bonus in 2008 would be more motivatedin 2009, or would they exert less effort and coast. To examine this,
172 | <strong>Making</strong> <strong>Schools</strong> <strong>Work</strong>the performance of schools that fell just short of 50 percent of their 2008targets (and did not receive the bonus) was compared with the performanceof schools that achieved just over 50 percent of their targets and didget the bonus. Controlling for schools’ 2008 test results and other schoolcharacteristics, schools that barely missed the bonus in 2008 improvedmore than schools that barely achieved it. It appears that—at least forschools that came fairly close in 2008—not getting the bonus had a positiveeffect on schools’ motivation and performance.<strong>Schools</strong> whose teachers spent more time on instruction were much more likely toachieve the bonus. In contrast to studies that have found no clear evidence ofchanges in teacher classroom practice to explain student learning improvementscaused by the bonus, researchers in Brazil found significant correlations.A novel feature of the research is use of the Stallings “classroomsnapshot” instrument (Abadzi 2009; Bruns, Evans, and Luque 2010) togenerate detailed data on the pathways through which teacher incentiveprograms such as Pernambuco’s bonus affect teacher practice in the classroom.In theory, if an incentive causes an improvement in student outcomes,it should operate through changes in teacher behavior that areinduced by the incentive, such as increased or more-effective teachingeffort.Periodic observations are tracking comprehensive indicators of classroomdynamics (teachers’ use of instructional time, materials, interactionwith students, and student engagement) in a large sample of Pernambuco’s950 schools (1,800 classrooms in close to 300 schools, with oversampling ofschools just above and below the original target discontinuities). Bothtested and nontested subjects are being observed to try to capture adverseeffects, such as diversion of school time from nontested subjects.The first of several unannounced observations was carried out onemonth before the end-of-year tests that entered into the second-year bonuscalculation. The data, shown in table 4.3, uncovered two main findings.First, average teacher practice diverges widely from norms observed inthe United States, where the Stallings instrument has been most extensivelyused. Against a U.S. good-practice benchmark of 85 percent of total classtime effectively applied to instruction, the average observed in Pernambucoschools was 61 percent. Against a good-practice benchmark of 15 percentof time spent on routine classroom processes (such as taking attendance,passing out papers, or cleaning the blackboard), schools in Pernambucoaveraged 28 percent.A second finding, however, was that significant disparities existed acrossschools, and these were highly correlated with schools’ likelihood ofachieving the 2009 bonus (paid in 2010 based on year-end performance in2009). While teachers were off-task a very high 12 percent of the timeacross the whole sample—either out of the classroom due to late arrival or
<strong>Making</strong> Teachers Accountable | 173Table 4.3 Classroom Dynamics in 220 Pernambuco <strong>Schools</strong>,November 2009Teacher use ofclassroom timeLearningactivitiesClassroommanagementU.S.goodpracticebenchmarks(percent)Overall PEsample(percent)Achieved2009bonus(percent)Didn’tAchieve2009bonus(percent)Difference,bonus Vs.nonbonusschools85 61 62 53 0.09 (0.04)**15 28 27 30 –0.03 (0.03)Teacher off-task 0 12 10 17 –0.04 (0.02)***Teacher out of 0 8 8 12 –0.04 (0.02)***classroomSource: Bruns, Evans, and Luque 2010.Note: PE = Pernambuco.Standard errors in parentheses: ** significant at the 5% level; ***significant at the 1% level.early departure or engaged in social interaction with students or colleagues—such time loss was much more significant in the schools that did notsubsequently achieve the bonus (17 percent of total class time) than inthose that did (10 percent of time lost).Teachers in both successful (bonus-achiever) and less-successful schoolsspent a high share of total class time on routine management processes byU.S. standards. However, teachers in the bonus schools registeredsignificantly less time off-task and were able to devote this time toinstruction: learning activities absorbed 62 percent of total class time inschools that did go on to achieve their targets, compared with only 53percent of time in schools that did not. There is also evidence of moreintensive use of learning materials and higher rates of student engagement.The research as yet cannot determine whether these teacher behaviorscaused students to improve more or whether the behaviors simply reflectedthe fact that better students are easier to manage and teach. But the sampleof bonus achievers included schools from all parts of the performancedistribution, including a large number of low-income and low-performingschools, because the targets measured improvement from a school’s ownbaseline. The second year of observations will measure whether and howteachers’ practice and classroom dynamics evolve after schools process the“information shocks” and incentives of either achieving or not achievingthe bonus.The evaluation of Pernambuco’s pay-for-performance program isexpected to continue for several more years, permitting deeper analysis of
174 | <strong>Making</strong> <strong>Schools</strong> <strong>Work</strong>how annual targets and past rewards affect schools’ improvement strategies,teacher behaviors, and overall system progress. Pernambuco’s resultswill also be directly comparable with the new program in the municipalityof Rio de Janeiro, which also sets targets for improvements in IDEB outcomesas the basis for the bonus and which also has established performancebands that generate discontinuities in school targets around severaldifferent thresholds. As in Pernambuco, a large sample of schools is beingfollowed in a panel study that includes systematic classroom observation,using the Stallings instrument. The Rio program design is additionallyinteresting because it embodies strong sanctions against teacher absence:only employees with five or fewer absences for the entire school year(whether excused or not) receive the bonus. In 2010, 290 of Rio’s 1,044municipal schools qualified for the bonus based on their schools’ 2009IDEB improvements, but more than one-fourth of these schools’ 11,000employees did not meet the bar for individual attendance. Rio’s program iscurrently the strongest effort to attack absenteeism; it will be important tomeasure how the bonus incentives affect these rates over time.These and the other new Brazilian experiences offer a promising opportunityto generate comparative evidence on some key issues in the designof teacher pay-for-performance programs. Before the new wave of programsin Brazil, however, the main evidence on group-based bonus incentivesfor improvements in student outcomes was a small-scale programimplemented in the 1990s in Israel.Israel: Ministry of education school performance programLavy (2002) examined a tournament-type program implemented in 1995that provided a group incentive to teachers in 62 nonrandomly selectedsecondary schools. 9 The objective of the program was to reduce dropoutrates and improve academic achievement. The program used three performancemeasures: average number of credit units per student, proportion ofstudents receiving a matriculation certificate, 10 and the school dropout rate.Participating schools competed for a total of $1.44 million in awards.School performance was measured in two stages. First, school averageoutcomes (the three performance measures used in the program) werenormalized relative to an expected score, estimated using regressions thatcontrolled for socioeconomic background of the students. Second, schoolswere ranked according to improvement in average outcomes. The top thirdof schools won awards. In 1996, the highest-scoring of these schools won$105,000, and the lowest-scoring won $13,250. Seventy-five percent ofthe award was distributed among teachers in the school, and the remaining25 percent could be used for schoolwide improvements (for example,teacher common rooms). Teachers’ individual share of the school-levelbonuses ranged from $250 to $1,000 (10–40 percent of the average monthly
<strong>Making</strong> Teachers Accountable | 175wage) depending on the size of the school’s award. 11 All teachers in a schoolreceived the same award, regardless of individual contribution to theschool’s average results.Lavy used a regression discontinuity approach to compare student outcomesin the 62 treatment secondary schools with 119 similar schools thatjust missed the program’s eligibility rules. Lavy’s results suggested that themonetary incentives had some effect in the first year of implementation(mainly in religious schools) and by the second year caused significantgains in student outcomes in all schools. The program led to improvementsin the number of credit units taken by students and average test scores inmatriculation exams. Average exam scores across treated schools in thesecond year of the program increased 2.4 points more than in the comparisongroup. From Lavy’s descriptive statistics, this can be estimated asapproximately .12 of a standard deviation. In addition, Lavy reported thatmore students in treatment schools gained matriculation certificates, andthese schools also reduced dropout rates in the transition from middleschool (grades 7–9) to high school (grades 10–12).An interesting feature of the Lavy (2002) paper is that it comparedthe incentive intervention with a “resource” intervention. The resourceintervention was a separate program that rewarded schools showingimprovement with in-kind resources, such as teacher training, of identicalmonetary value to the bonus program. Twenty-two schools were selectedfor the resource-intervention program. A comparison group of schools notadmitted into the resource program served as the basis for identification ofprogram effects. The results of the resource program (evaluated only forsecular schools) suggested that it also led to statistically significant improvementsin student performance, but of much smaller magnitude. Lavy concludedthat the school bonus program was more cost-effective.Bonuses Based on Student Learning Outcomes Plus TeacherInput Measures (Individual)Several new teacher bonus programs being implemented in Chile and atthe state level in Mexico use a very different—and quite interesting—model. They provide individual rewards to teachers based on a combinationof student outcomes and evaluation of teachers’ individual merit (includingtests of teachers’ content mastery, direct observation of their classroompractice, and written assessments by principals and master teachers.)The 2004 Chilean Asignación Variable por Desempeño Individual (VariableAllocation for Individual Performance, or AVDI) program is the mostsophisticated example, given its use of comprehensive, high-stakes performancereviews (including videotapes of teachers’ classroom practice) and asignificant bonus in the form of a four-year increase in base pay for teachers
176 | <strong>Making</strong> <strong>Schools</strong> <strong>Work</strong>who are rated highly. New programs in the state of Mexico (PROEBB andSer Maestro) and the Premio al Merito Docente (Teaching Award of Merit) inthe state of Nuevo Leon also combine evaluation of teachers’ individualperformance with student outcome measures. Unfortunately, none of thesepromising experiences is being evaluated rigorously.Bonuses Based on Student Learning Outcomes Plus TeacherInput Measures (Group-Based)Chile: National System for Performance Evaluation of SubsidizedEducational Establishments (SNED)One of the earliest experiences with performance pay in Latin America wasChile’s Sistema Nacional de Evaluación del Desempeño de los Establecimientos EducativosSubvencionados (National System for Performance Evaluation of SubsidizedEducational Establishments) or SNED. The program was introducedin 1996 and offers group bonuses to schools every two years based on anindex that combines student learning results with other indicators of schooland teacher performance.Student learning counts for 65 percent of the total score through acombined measure of a school’s results on the current year’s nationalassessment (37 percent) plus a value-added measure of the difference inits average scores over the past two cycles (28 percent). The other indicatorsinclude schools’ initiative (6 percent, based on school surveys); laborconditions (2 percent, based on presence of a complete teaching staff,replacement of absent teachers, and other indicators); equality of opportunities(22 percent, based on the school’s retention and passing ratesand lack of discriminatory practices, also measured through survey data);and integration of parents and guardians (5 percent, also based on surveydata).SNED is conducted as a tournament. Once the SNED index is estimated,schools are ranked within homogenous groups. 12 <strong>Schools</strong> in the top 25percent of the ranking within each group receive the SNED award of excellence.13 Ninety percent of the bonus is distributed to teachers, while 10percent is distributed by the principal. The bonus for teachers typically representsan annual increase equal to approximately 40 percent of a teacher’smonthly salary. About 20–30 percent of schools win the award.The most recent evaluation of SNED estimated the impact of the incentiveprogram by comparing its effects on privately managed, governmentsubsidizedschools (about 30 percent of total enrollment) that are eligiblefor the incentive with results for privately unsubsidized schools, which arenot eligible (Rau and Contreras 2009). Controlling for all other differencesacross these schools, the researchers found that the introduction of SNEDin 1996 stimulated a statistically significant 0.12 standard deviation
<strong>Making</strong> Teachers Accountable | 177improvement in average student learning outcomes in the eligible schoolsrelative to schools not covered by the program. Rau and Contreras (2009)also explored the effects of winning the SNED award on subsequent schoolperformance. Over six rounds of SNED awards, however, they found nostatistically significant evidence that schools winning the award performedbetter in the next period. They did, however, find that although SNED’sstratified “homogenous group” performance bands are designed to helpequalize schools’ chances of winning the bonus, almost 40 percent ofschools have not yet done so.Bonuses Based on Teacher InputTwo rigorously evaluated programs, in India and Kenya, have explored theimpact of bonus pay for teachers based on attendance.Kenya: Pre-school teacher bonus programKremer and others (2001) evaluated a program that allowed school headmastersin rural Kenya to award individual teachers bonus pay for regularattendance. The size of the bonus was large—up to three months’ salary forno absences. They found that the program had no impact on actual teacherattendance (measured by unannounced random visits). Absence ratesremained at 29 percent. There was also no evidence of change in teachers’pedagogy, pupil attendance, or pupil test scores, although it could be arguedthat both pedagogy and test performance at the preschool level may benoisy measures.Researchers also found that headmasters simply distributed the fullbonus to all teachers regardless of attendance. Even though there was afinancial incentive for headmasters to hold back part of the funding (anyfunds not allocated to teacher bonuses reverted to the schools’ generalfund), they chose not to do so. School headmasters clearly found it difficultto play a strict monitoring role at the school level.Rajasthan, India: “Camera” programAn innovative program in rural India produced very different results (Duflo,Hanna, and Ryan 2010). In a randomly selected set of rural, NGO-runschools in Rajasthan, a schedule of monthly teacher bonuses and fines basedon attendance was monitored in a creative way—with daily date- and timestampedphotographs. A student was asked to photograph the teacher andthe children in the class at the beginning and end of each school day. Teachers’salaries were a function of the number of “valid school days,” in whichthe school was open for at least five hours and at least eight studentsappeared in each picture. Unannounced visits to the “camera” and comparisonschools measured actual absence rates and observed teacher activity.
178 | <strong>Making</strong> <strong>Schools</strong> <strong>Work</strong>The maximum bonus for a teacher with no days absent was approximately25 percent of a month’s salary. The program over three years had adramatic effect on teacher absenteeism, which fell from 42 percent to23 percent in the treatment schools. While there were no observed changesin teachers’ classroom behavior and pedagogy (other than greater presence),student test scores rose by a 0.17 standard deviation, and graduation rates tothe next level of education also rose significantly. While students’ attendancerates (conditional on the school being open) did not increase, therewas a significant increase in the total amount of time children in treatmentschools spent in classes: on average, 2.7 more days of schooling per month.Duflo, Hanna, and Ryan (2010) noted that the intervention was quitecost-effective. The base salary for teachers in the treatment and comparisonschools (Rs 1,000 per month) was the same. All of the other costs ofthe program (the bonuses, the cameras, and monitoring) totaled roughly$6 per child per year. In terms of raising test scores, the per-child cost of a0.10 standard deviation increase in test scores was only $3.58.These contrasting experiences suggest that it is possible to stimulatehigher teacher attendance with bonus pay, but the credibility of the systemfor monitoring performance is important. At least in the rural Indiasetting—a context of very high teacher absence—teacher attendance alsoappears to be an important correlate of the desired education outcome:student learning. In other high-absenteeism settings, or settings wherestandardized annual student learning data is not available, bonus pay linkedto teacher attendance is a reasonable approach, although it would be goodto have additional evaluation evidence confirming its impact on learning.Pay-for-Performance Programs: The Balance of EvidenceThe most recent and robust developing-country evidence on pay-forperformanceprograms suggests that bonus pay incentives can improvelearning outcomes, at least in the contexts studied most carefully to date.This evidence is in contrast to the more mixed, but less rigorous, developingcountryevidence that existed just five years ago. It is also in sharp contrastto the most recent evaluation evidence from U.S. programs. In carefullyconducted randomized trials of relatively generous bonuses aimed at bothindividual teachers (Nashville public schools) and schools (group-basedbonuses in New York City public schools), researchers have failed to findany impact on student learning outcomes.Under the aegis of the National Center on Performance Incentives, animpressive number of new U.S. education pay-for-performance programsare being evaluated experimentally. A three-year randomized trial of anindividual bonus for 297 math teachers in Nashville public schools thatoffered large bonuses (up to $15,000 per year or 400 percent of a teacher’smonthly wage) found no difference in average learning outcomes among
<strong>Making</strong> Teachers Accountable | 179students of the teachers who were and were not eligible for the bonuses. Thefirst-year results from a randomized trial of a school (group-based) bonusprogram in 323 schools in New York City, which also offered a relativelylarge award (up to $3,000 per staff member), have also shown no studenttest-score differences between treatment and comparison schools. However,in the New York case, the tests were administered only three months afterthe program was announced, and the researchers note that it is logical toexpect that impacts from incentives may take more time to develop.In no study to date have long-term effects of performance-based pay beenanalyzed. Both theory and experience with performance-based rewards inother sectors indicate that the scope for perverse behaviors, such as gaming,cheating, or teaching to the test, can rise with time as system actors becomemore familiar with the rules of the game. As performance-based pay becomesincreasingly—and logically—linked to student test results in many countries,the validity of those tests and the legitimacy of their application becomecentrally important challenges for education systems.In a context of persistently low education outcomes and widespread evidenceof “accountability failures” on the part of teachers and other educationsystem actors, the evidence that pay-for-performance programs and the useof contract teachers can raise student outcomes in developing-country contextsis important. But the contrasting U.S. evidence suggests that it is importantto note that these developing-country contexts are characterized by• Weak systems for performance monitoring and accountability—evidenced byrelatively high teacher absence rates, low teacher dismissal rates, andlow student learning performance• Relatively weak teacher professionalism—evidenced, in most cases, by lowstandards for entry• Relatively large bonus size—for example, an annual bonus equaling 30–300percent of a month’s salary• Focused performance metrics—emphasis on a small number of key, measurableresults, notably student learning improvements or relatively easilymeasured teacher “inputs” such as monthly attendance, rather thanmore complex, subjective, and comprehensive performance evaluations• “Fair” performance metrics—rewards to schools on a value-added basis(for progress relative to their starting point) or compared with schoolswith similar geographic and student socioeconomic conditions, not forabsolute levels of performance• Rewards clearly linked to prior-period results—annual bonuses directly linkedto results for the previous school year, such as school-level learningimprovement, or monthly bonuses for input measures monitored overthe previous month, such as attendance.
180 | <strong>Making</strong> <strong>Schools</strong> <strong>Work</strong>These pay-for-performance programs in developing countries have“worked” in the sense that student learning outcomes improved in thepresence of the bonus. In the most careful studies, the size of the effect—a0.19–0.27 standard deviation increase in average student learning—isimpressively large compared with the effects typically measured for othertypes of education programs.The sole developing-country evaluation to date designed as a “head-tohead”comparison of individual bonus pay (rewarding each teacher for hisor her own classroom’s average learning progress over the course of aschool year) with “group” bonus pay (rewarding schools for their averagelearning improvement) showed similar results in the first year but a strongereffect on learning outcomes from the individual bonus by the secondyear. The impact measured in that program in rural Andhra Pradesh,India—a 0.27 standard deviation increase in language scores—remains thelargest reported causal impact from an education pay-for-performanceprogram. However, the group bonus alternative proved to be more costeffectivebecause the average amounts awarded were smaller. In general,school systems will likely find group bonus pay more technically feasiblethan individual bonus pay, which requires the ability to test students inevery grade, subject, and classroom and thus presents significant technicalchallenges and costs.Our understanding of the mechanisms through which bonus payimproves student outcomes is still weak. In several randomized trials, atleast over the short term, the bonus program did not induce any reductionin teacher absence rates, which is one of the most obvious ways teacherscan increase their efforts in response to an incentive. These teachers didnonetheless produce statistically significant improvements in their students’learning outcomes relative to comparison groups of teachers whowere not offered a bonus. Most did so by increasing the intensity of theirwork during school hours (assigning more homework and class work) andconducting test preparation sessions outside of school hours.In Brazil, where all programs to date have been implemented systemwide,it is not possible to estimate how the introduction of a bonus per seaffects schools’ performance. At the end of the day, this is the critical questionfor policy makers: how cost-effective is the bonus program as a wholerelative to alternative uses of education funds? But the Brazil studies canhelp elucidate both the pathways through which bonus incentives canchange teacher behavior and the kinds of changes that are most effectivein improving learning. There is intriguing evidence from Pernambuco thatmore-ambitious targets stimulated larger increases in student learning thanless-ambitious targets did in comparable schools. This evidence suggeststhat, in the presence of an attractive performance award, schools focus onand are motivated to try to achieve specific targets. The Brazil research has
<strong>Making</strong> Teachers Accountable | 181also generated evidence of more efficient use of instructional time by teachersin the schools that subsequently earned the bonus. Teachers in bonusearningschools lost less time due to late arrival or early departure, spentmore time on instruction, made more intensive use of classroom resourcessuch as learning materials, and kept a higher share of students engaged inlearning.Designing Teacher Accountability ReformsWhat can recent experience tell us about the design of effective teacherincentives? How does the latest developing-country evidence square withissues that have long been associated with pay-for-performance programs,both in theory and in practice? In the United States alone, there is a longhistory of merit pay efforts in the education sector, and few have survived(Murnane and Cohen 1986). In this section, we review the theory on performanceincentives and try to unpack the evidence from recent programexperience to generate practical guidance for policy makers.Principal-Agent TheoryMany of the issues in designing effective performance contracts transcendthe education sector. As discussed in chapter 1, “principal-agent” (oremployer-employee) relationships are a central topic of economics andindustrial relations research because while employers (principals) needemployees (agents) to help achieve organizational objectives, the two partieshave divergent interests. Employees want to maximize compensationand minimize effort, and employers want the opposite. The two parties alsohave asymmetric information: the employer cannot perfectly monitor theeffort and activities of the employee.Under these circumstances, the role of the contract between the principaland the agent is to align their objectives by specifying the activities andresults wanted and the compensation offered for these. An effective contractwill motivate the agent to focus his or her efforts on efficiently achievingthe principal’s objectives. On the other hand, if the contract is structuredso that agents are paid a flat rate irrespective of their level of effort or ability,or if job tenure is guaranteed irrespective of performance, it is unlikely thatemployees will exert additional effort or focus on doing the things thatmatter to the principal. It is striking how closely this textbook definition ofan ineffective performance contract parallels the typical teacher contract(Prendergast 1999, cited in Courty and Marschke 2003).Some issues in designing effective performance-based contracts in educationare shared more broadly by public or nonprofit sectors. In contrast to
182 | <strong>Making</strong> <strong>Schools</strong> <strong>Work</strong>firms that operate in a competitive environment, public sector agenciesoften face difficulties in specifying performance goals. Even when theyhave clear objectives, they can have difficulty establishing a clear hierarchyamong competing objectives—something that is straightforward for firms,which seek to maximize profits or shareholder value. Baker (2002) arguesthat “the difficulty in defining ‘good’ performance measures in nonprofitorganizations is one reason for the weak incentives that so often characterizeorganizations of this type, and for the dysfunctional consequences thatoften arise when these types of organizations try to use strong incentives.”In addition, agents may not “know the technology” for achieving complexorganizational goals. Vegas (2005), among others, has questioned whetherteachers in many developing-country settings have the core content masteryand teaching skills required to produce desired learning improvements,no matter how strong their incentives to do so.On the other hand, the assumption that agents work only for extrinsic(financial) rewards has come under scrutiny in both the psychology andeconomics literature in recent years. In their review of the economics andindustrial relations literature on contracting, Fehr and Falk (2002) observedthat “while it is certainly true that [agents’] desires to avoid risk and toachieve income through effort are important, it is equally true that thereare powerful non-pecuniary motives that shape human behavior”—suchas the desire to reciprocate, the desire for social approval, and the desire towork in interesting tasks.Pink (2006) has argued that once a certain threshold level of financialremuneration is achieved in knowledge professions, the most powerfulincentives are individual workers’ own desires for autonomy, mastery, anda sense of contribution. It is interesting to note that all three of these incentivesfigure prominently in the core “industrial model” of the school: Teachersenjoy substantial autonomy within their own classrooms. The processof intellectual mastery is at the core of the work, for both teachers and theirstudents. And abundant survey and other literature documents the attractionof the education profession for individuals seeking to make a socialcontribution.These different strands of the academic literature suggest two hypothesesabout performance contracts in education.Hypothesis 1: Other things equal, it may be easier to attract individuals intoteaching than into equivalently remunerated professionsThe experience of Teach for America and its recent Teach for All offshootsin European and developing countries provides some support for thishypothesis. These programs have found it possible to attract high-capacityindividuals to teach in disadvantaged schools (at prevailing wages) bystressing the scope for social contribution and offering strong organizational
<strong>Making</strong> Teachers Accountable | 183support for professional growth and mastery. However, the numbers ofteachers recruited through these or parallel programs remain small relativeto the system as a whole; after 20 years of experience, Teach forAmerica placements represent only 7,000 of 3.2 million teachers in theUnited States.The broader lesson for public sector school systems is the power of theselevers. The “intrinsic” rewards of teaching—even if they are explicitly maximizedby a well-managed school system—cannot substitute indefinitelyfor financial remuneration. But public education systems in developingcountries likely have more scope than they are currently exploiting toincorporate appeals to the intrinsic motivation of prospective teachers intotheir human resources policies.Hypothesis 2: Agents’ (teachers’) performance in education may be enhanced byclearer expression of performance goals and feedbackResearch shows that public and nonprofit agencies in general have difficultyin specifying or prioritizing performance goals. In this context, improvingthe quality of performance feedback to teachers and the clarity of targetsand goals, in theory, should enhance the efficiency of agents’ performance.This belief is an important driver of the standards and accountability-basedreforms in education seen in many OECD countries (such as Australia, NewZealand, the United Kingdom, and the United States) and some of thedeveloping-country cases discussed in this chapter.Measuring Performance in EducationThe growing availability of nationally and internationally standardized dataon student learning results over the past 20 years has reshaped the landscapeon performance measurement in education systems. Despite deepcontroversies over the quality, credibility, and implementation of specifictests or testing in general, there is broad acknowledgment that learningoutcomes are appropriate metrics for school system results. Education systemstoday in most countries are more advanced than other parts of thepublic sector in being able to track a meaningful indicator of system progresson an annual basis and, often, to be able to disaggregate results forspecific subnational regions and target groups.This advantage has clear implications for the design of effective incentiveprograms in education. Much of the theoretical literature on principalagentcontracts centers on the challenge of identifying an appropriate performancemeasure that will align the employer’s goals with the employee’sefforts. Not only must the measure be appropriate and meaningful, it mustalso be something that can be adequately measured—meaning regularly,inexpensively, and credibly. The scope for gaming (efforts by the employee
184 | <strong>Making</strong> <strong>Schools</strong> <strong>Work</strong>to set artificially low targets), outright cheating, and other perverse behaviorsmust be managed. Psychologists argue that even valid and informativeperformance measures have a tendency to “degrade” or become dysfunctionalby the mere act of being used for incentive purposes (Darley 1991,cited in Baker 2002).None of these challenges is easy. But it is increasingly evident that, in thecontext of education, a core performance measure in most incentive programswill be student learning outcomes. Thus, the sheer identification of ameaningful and appropriate performance measure—which presents majorproblems for many public sector and nonprofit actors—is less of a challengein education. This does not mean that learning outcomes are, or should be,the only performance measure used by school systems. There are clearlyother important goals (building children’s self-esteem, appreciation for cultureand the arts, physical development, citizenship, and so on), and concernsare often expressed that these goals are shortchanged by excessivefocus on learning outcomes. School systems must manage this tension. Butwhat seems increasingly accepted is that a central task for every 21stcenturyschool system is ensuring that well-designed and legitimately managedtesting systems to track student learning progress are in place.While high validity, well-administered testing programs are importantfor education systems irrespective of incentives, there is evidence that thestakes around test legitimacy and the scope for abuses become higher whenincentives are introduced (Jacob and Levitt 2002). Rivkin (2009) recentlyarticulated this point well:Over the long run, the success of [accountability and pay-for-performance]reforms hinges on a number of factors, but the validity of the teacher effectiveness(a term I use interchangeably with teacher quality) measures is oneof the most important. Unless the quality estimates are accepted as informativeand fair, opposition will remain strong. Moreover, inaccurate or inadequatequality measures and poorly designed pay-for-performance programswill introduce adverse incentives to teach narrowly to test content, concentrateon only a fraction of the students, forgo important non-tested outcomes,or elicit frustration and distrust in response to reward structures with systemicflaws.Design Elements of Teacher Incentives: A Preliminary TypologyOur review of 15 different teacher incentive programs implemented indeveloping countries and Israel over the past decade offers an opportunityto analyze some of their design features. In doing so, we try to move beyondthe basic taxonomy most commonly used in the education literature—forexample, group or individual; input-based or outcome-based, and so on. Infocusing on additional aspects of incentive design that theory predicts are
<strong>Making</strong> Teachers Accountable | 185important for effective performance-based contracts, we also hope to createa framework that can be tested as the evidence from these experiencesaccumulates. Because the current set of cases remains too small for anydefinitive conclusions, this is an exploratory exercise only.Based on the evaluation evidence reviewed, three key dimensions maypredict an incentive program’s effectiveness: controllability, predictability, andbonus size. We assess these features of different programs and examine thecorrelations with available empirical evidence of program impact.Transcending these features is something that might be termed the legitimacyor credibility of the incentive program as a whole. Achieving thislegitimacy involves, in Rivkin’s (2009) words, ensuring that the specificperformance measures used are perceived as “informative” and “fair.” Butlegitimacy also speaks to the perception that all aspects of the program aremanaged honestly and transparently. Further, legitimacy implies an acceptancethat the rules of the game will be stable over time or that adaptationswill be undertaken with due process and consultation, rather than throughad hoc adjustments. Murnane and Cohen’s (1986) observation that thelongest-standing pay-for-performance programs in the United States typicallyhave been redesigned several times, with teacher input, suggests thatsustaining credibility over time requires effort and processes that are perceivedas legitimate.We have argued that improved measurement of student learning outcomesin many countries has created an expanded political space for payfor-performanceprograms because the technical platform—a relevant andmeaningful source of data on schooling outcomes—has been established. Awell-designed and cleanly administered national or subnational studentassessment program could provide a ready anchor for pay-for-performanceschemes. Brazil’s IDEB goes one step further by establishing a high-qualitynational data source on both student learning outcomes and grade progression.The combined measure mitigates at least one undesired teacherbehavior that may be induced by a high-stakes focus on test scores: the riskthat teachers trying to boost average student learning outcomes will holdback slower students. By combining the two measures of learning outcomesand grade progression, IDEB builds in protection against this form ofdistortion. The degree of legitimacy that Brazil’s high-quality national testingsystem and IDEB have achieved over the past five years appears to be afactor in the increasing adoption of pay-for-performance programs there. Itis interesting to note that several earlier pay-for-performance programs inBrazil, based on individual states’ testing programs, had difficulty withcredibility issues and were not sustained long.Perceived legitimacy may be the single most important factor in theimpact and sustainability of teacher incentive programs, but it is difficult toassess objectively and especially difficult to assess ex ante. 14 Our typology,
186 | <strong>Making</strong> <strong>Schools</strong> <strong>Work</strong>therefore, focuses on more specific and tractable design features. However,it bears noting that the experimental design programs reviewed here—which constitute a strong part of the current evidence base on teacherincentives in developing countries—have special characteristics that positivelyaffect their legitimacy. 15Given the context for teacher incentive reforms in most developingcountries—a status quo of poor education results—the potential for undesiredconsequences is not per se an argument against teacher incentives somuch as a call for eyes-open efforts to manage known risks. Some of theserisks relate to specific choices in the design of incentives in the three areaswe identified: controllability, predictability, and bonus size.Table 4.4 shows the hypotheses regarding program effects that can bederived from the principal-agent model and our typology.Controllability in Incentive Program DesignControllability refers to how much of the measured outcome depends onactions taken by an individual teacher (or employee). Performance measuresrelated to a teacher’s own behavior, such as attendance or trainingcourse participation, are directly dependent on the teacher’s actions.Awards based on such measures create incentives with a high degree ofcontrollability from the standpoint of the employee or, conversely, lowrisks. Theory predicts that riskier contracts, based on less controllable factors,either demand a larger incentive (other things being equal) or will notbe as effective.However, while school systems could reward many behaviors that arehighly controllable from a teacher’s perspective, these may not be the mostimportant behaviors for producing the results school systems desire most.The problem for incentives design is that teacher behaviors that contributeto student learning improvement are more difficult to specify, observe, andmeasure directly across an entire school system. On the other hand, it iseasy to see why basing incentive programs on system results, especiallystudent learning outcomes, is often resisted by teachers; these outcomes areless controllable—that is, riskier for the agent.The sources of risk can be unpacked into at least two dimensions thatpolicy makers need to consider and manage: noise and locality.The noise factor“Noise” refers to the degree to which the specific performance measure isaffected by factors outside of the agent’s control. Student learning resultsfor a particular classroom, for example, cannot be completely attributedto a teacher; they are also influenced by noise from other variables suchas students’ prior grade preparation, socioeconomic level, or distractions
<strong>Making</strong> Teachers Accountable | 187Table 4.4 Incentive Program Design Features and Possible EffectsFeature Description HypothesisControllabilityNoiseLocalityPredictabilityBonus sizeSource: Authors’ compilation.The degree to which factors otherthan the teacher’s behavior (forexample, student characteristics orthe actions of other teachers) canaffect the performance measure,therefore making it a less credibleand adequate measure of ateacher’s individual contributionThe degree to which an individualteacher’s performance affects theresult relative to other actors beingincentivized. Measures based onindividual performance (groupsize = 1) are maximally local. If groupperformance is being measured, asgroup size grows larger, the measurebecomes less local.An individual teacher’s likelihood ofachieving the bonusBonus payment as a proportion ofmonthly wagesThe less noise in the measure, themore controllable it is and themore effective the incentive willbe (at least in the short term).The more local the measure, themore controllable it is and themore effective the incentive willbe.If probability of earning the bonusis close to either zero or 100%, theincentive will not be effective.Piecewise formulations (whichallow workers to earn some bonusin line with their production) willcreate stronger incentives thantournament-style awards (whichset an ex ante cap on the share ofschools or teachers that can win).The larger the bonus, the moreeffective the incentive will be, allthings being equal. But largerbonus size can also stimulatecheating and other undesirablebehaviors and can make bonusprograms fiscally unsustainable orless cost-effective.on the day of the exam. A specific test instrument can be noisy if it is notwell mapped onto curriculum goals or fails to discriminate between studentswho have and have not mastered the content. The noisier a performancemeasure, the less responsive it is to the agent’s behavior andeffort. Even on the same test instrument, cross-sectional student scoresare noisier than longitudinal (value-added) measures that can identify
188 | <strong>Making</strong> <strong>Schools</strong> <strong>Work</strong>learning gains for individual teachers’ classrooms. Finally, test scores forsmall classes are inherently much noisier than for larger classes (Kaneand Staiger 2001). 16School systems can reduce the noise involved in test scores by groupingschools into comparative strata on socioeconomic grounds (as in Chile’sSNED) or using school-level targets (as in Pernambuco and other Brazilianstates) that measure each school’s progress relative to its own baseline. Anoteworthy feature of many of the new bonus programs is sensitivity tothis issue, with built-in adjustments for schools’ baseline performance levelsor performance comparisons for schools grouped by socioeconomic andgeographic strata.The locality factor“Locality” refers to the scope for an individual teacher to influence theresults being rewarded. If the result is produced by a group of teachers orschools, it will be less controllable from the standpoint of an individualteacher because the teacher’s actions will contribute only a fraction tothe result. As the group gets larger, the individual’s contribution getssmaller, and he or she is less able to control the final outcome. Controllabilityis higher (all things being equal) in highly local measures, such asclassroom-level learning outcomes or individual contract teachers’ attendancerecords.An important issue with group rewards (typically schoolwide rewards,in the case of education) is not only that they are less controllable from theperspective of an individual teacher but also that they can motivate freeriderbehavior. Free riders are members of a group who refuse to exerteffort while counting on others to produce the group result (Holmstrom1979). In large schools, where an entire staff’s achievement of a schoollevelbonus may depend on the results of a small handful of tested subjectsand grades, free-riding can become an important issue. If teachers perceivethat others are free-riding on their efforts—that is, the locality and thuscontrollability of the incentive is lower—the effectiveness of the incentivewill be weaker.Does this mean that education incentives should be focused on outcomesat the teacher level? More sophisticated testing data in developingcountries is opening the possibility of measuring classroom-level learninggains for individual teachers, as is now possible in the United States andother OECD countries. Rewarding individual teachers can provide strongwork incentives and negate free-riding. But on the other hand, individualrewards can discourage collaboration and teamwork to the detriment ofoverall school results. They also create incentives within a school for teachersto avoid weaker students. This can complicate the work of principals;matching the more effective teachers with more difficult students might be
<strong>Making</strong> Teachers Accountable | 189in the best interest of those students and the school’s overall results, but itwould impede those teachers’ ability to earn fair rewards for their talentand effort.The question for policy makers is whether focusing incentives at theschool level creates benefits—in terms of stimulating collaborative workamong school personnel—that outweigh the free-rider concerns. Hybridapproaches (which reward school-level outcomes but adjust the awardreceived by individual employees within the school for some measure oftheir individual effort, such as attendance) are an interesting alternative.Most of the experimental teacher incentive programs in developing countriesto date have been in settings with very small schools (three to fiveteachers, on average). Therefore, the new wave of research on the Brazilianprograms (where urban schools can have 40 or more teachers) that isfocusing research attention on the measurement of free-rider behavior maybe a useful contribution.Predictability in Incentive Program DesignFor an incentive to be effective, agents must perceive realistic scope toachieve it. If the likelihood of achieving a bonus is close to zero, teacherswill have little incentive to exert effort. On the other hand, teachers withnear certainty of receiving a bonus will also have little incentive to increaseeffort. Theory predicts that if performance-based contracts result in awardsdistributed to a share of workers nearer the midpoint of 0 and 1, ratherthan at the extremes, they will elicit the most effort. Dampening or enhancingthis effect, however, would be the agents’ assessment of controllabilityor risk and the amount of payoff expected.For incentive programs that include sanctions—such as the prospect ofcontract nonrenewal for poorly performing contract teachers—the strengthof the incentive is proportional to the likelihood of enforcement.Bonus Size in Incentive Program DesignTheory predicts that larger bonuses elicit stronger responses, conditional onthe degree of risk inherent in the contract, the chance of earning the bonusor being sanctioned, and the cost of the effort. Even if teachers are intrinsicallymotivated, incentive contracts must still offer payoffs that exceed themarginal cost of effort, although this cost might be lower than it wouldhave been for less intrinsically motivated individuals. The incentive powerof a given financial bonus is, of course, relative to the base wage and pricelevels in a given country context. Therefore, we attempt to standardizebonus size in relation to average monthly wages. We find significant divergenceacross programs, with annual bonuses ranging from 35 percent of a
190 | <strong>Making</strong> <strong>Schools</strong> <strong>Work</strong>monthly wage (Andhra Pradesh, India) to 150–200 percent (Brazil) andeven to 300 percent in one of the programs in Israel.Table 4.5 categorizes the incentive programs reviewed for which there issome impact evidence. Categorizations of this kind always involve a degreeof subjectivity, and the small number of programs makes this typology preliminaryand illustrative only. But this framework and the associated impactevidence may assist policy makers in thinking through the design featuresof new pay-for-performance programs. The impacts presented are typicallyfor student learning outcomes, expressed as the average improvement inlearning for the treated schools or classrooms compared to control groups,as a proportion of one standard deviation in the test score distribution. Ourratings of program design elements are on a standard Likert-type scale,from 1 (very low) to 5 (very high). The annex at the end of the chapterexplains in further detail how the ratings for each feature were assigned.Core Design FeaturesThe strength of a program’s core design features (controllability and predictability)is, to some extent, complementary to the financial size of thebonus. In other words, an incentive program with high controllability andpredictability—such as an individual incentive that teachers have a reasonablechance of attaining and that is based on student learning progress on awell-designed test—will induce stronger performance than a programoffering an equivalent financial reward with lower controllability and predictability.The implication for policy makers is that what matters is thebalance of these factors. The fiscal costs of an incentive program can tosome extent be reduced by attention to the complementary design featuresof controllability and predictability. To put it another way, for every pay-forperformanceprogram, there is an optimal design that bundles these featuresto stimulate the maximum performance response from teachers andschools at minimum fiscal cost.We explore this hypothesis in table 4.5 by averaging the ratings for aprogram’s noise, locality, and predictability features into a separate score,labeled “core design” (in column 4)—which is a simple average of the threepreceding subscores. We compare programs’ scores on the strength of theircore design with the size of the bonus. We then generate a combined measurethat averages the scores for all of the program design features, includingthe size of the bonus. This overall score is the program’s “predictedoverall incentive strength.” We compare this predicted incentive strengthwith the observed impacts that the different bonus programs had on desirededucational outcomes.In table 4.5, the programs are ordered by the strength of their “predictedoverall incentive strength,” from lowest to highest. Comparing
Table 4.5 Pay-for-Performance Programs by Core Design Features and Effect SizeLikert-scale ratings (1–5) except where otherwise specifiedPredictedStrength,Average BonusProgram Noise a Locality b Predictability c Core Design Bonus Size d Value (% MW)PredictedOverallIncentiveStrengthObserved EffectSize (Max.) eIsrael (group) (Lavy 2002) 5 1 2 2.7 2 40 2.5 0.13Chile SNED (group)4 3 2 3 2 40 f 2.8 0.12(Rau and Contreras 2009)Brazil (group) (Ferraz andBruns, forthcoming)4 2 3 3 5 180 3.5 0.31–0.57 gKenya (group) (Glewwe, Ilias,and Kremer 2010)India (group) (Muralidharanand Sundararaman 2009)India (individual) (Muralidharanand Sundararaman 2009)5 4 3 4 2 43 3.5 0.145 4 4 4.3 2 36 3.8 0.165 5 4 4.7 2 36 4 0.27(continued next page)191
192Table 4.5 Pay-for-Performance Programs by Core Design Features and Effect Size (continued)PredictedStrength,Average BonusProgram Noise a Locality b Predictability c Core Design Bonus Size d Value (% MW)PredictedOverallIncentiveStrengthObserved EffectSize (Max.) eIndia (attendance) (individual) 5 5 4 4.7 2 30 4 0.17(Duflo, Hanna, and Ryan 2010)Israel (individual) (Lavy 2009) 5 5 3 4.3 5 300 4.5 14% higher passrates and 10%higher test scoresSource: Authors’ compilation.Note: MW = monthly wage. SNED = National System for Performance Evaluation of Subsidized Educational Establishments (Sistema Nacional de Evaluacióndel Desempeño de los Estab lecimientos Educativos Subvencionados).a. Some programs used multidimensional performance measures. In these cases, each measure was rated separately and then averaged out.b. Average group sizes are as follows: Brazil: 43 teachers; Chile: 18 teachers (figures from 2004); India: 3 teachers; Israel: 80 teachers; and Kenya: 6 teachers.c. Predictability was based on actual award rates as follows: In Brazil, 51 percent of schools got the bonus in 2009. In Chile, 20–28 percent of schools gotthe awards (est. 2004). In the India programs, most teachers under all programs got some award. In Israel (both programs), about 33 percent of teachersgot awards. In Kenya, about 48 percent of participating schools got the award.d. See annex for description of Likert scale used for bonus size.e. Effect size typically represents the increase in learning caused by the program expressed in terms of standard deviation. For the Israel group incentiveprogram, the authors converted Lavy’s (2002) reported impact into standard deviations, drawing on descriptive data presented. For the Israel individualbonus, this was not possible, so the outcomes presented are not strictly comparable to the others in the table.f. Average award during the initial years of the program, which was the period evaluated. More recently, the average award is 70–80 percent of MW.g. Impact estimates for Pernambuco, Brazil, are not rigorously estimated and thus not directly comparable to other estimated program impacts.
<strong>Making</strong> Teachers Accountable | 193the scores for “core design” features with the bonus size does suggestsome complementarity. Except for the 2002 individual bonus programin Israel, in all cases where programs’ core design features rated a(strong) score of 4 or higher, the size of the bonus adopted was relativelylow.However, programs with core design features rated lower than 4, such asChile’s SNED, the Brazilian bonus program, and the Israel group incentive,show no clear pattern. In all three cases, the performance measures onwhich the bonus is based are rated highly for being designed in a way tominimize noise; Chile’s SNED pays careful attention to schools’ socioeconomiccontexts, and Brazil’s target-based system effectively focuses eachschool on improvement relative to its own prior-year performance. Butlocality and predictability ratings are relatively low because these bonusesare school-based rewards and typical school size is relatively large. In theIsrael and Chilean cases, moreover, the tournament-style programs rewarda relatively small share of schools.In the Brazil case, a relatively large bonus size (average awards morethan one month’s salary) compensates for the relatively weaker incentivescreated by these core design features. It is interesting to note that Chile’sSNED program has increased the average bonus size significantly over theyears as well—from an initial 40 percent to a current 80 percent of theaverage monthly teacher wage. The Israel group bonus program appearsexceptional in this regard. It is the only program in which the bonus sizedoes not compensate for a relatively low score on core design features;instead, the relatively small maximum bonus further lowers the predictedstrength of the incentive.Both of the Israel programs, in fact, are striking in that they are the onlytwo programs where the bonus size does not exert a moderating effect onthe strength of the “core design” but instead exacerbates it—making arather weak incentive program weaker in the case of the group bonus andmaking an already strong incentive stronger in the case of the individualdesign. One might ask what is wrong with making a strong design stronger.In the context of our comparators, the answer appears to be that it makes abonus program more expensive than it needs to be—an important concernfrom a policy standpoint.The overarching question is whether the “predicted strength” of a bonusprogram based on these design features is correlated with its impact. All ofthese programs were associated with positive outcomes and, in many cases,causality has been rigorously established. But the small number of programsand the limited years of observation for most of them make thecomparisons here illustrative only. Figure 4.2 provide a simple visual mappingof how program impacts compare with estimates of predicted incentivestrength.
194 | <strong>Making</strong> <strong>Schools</strong> <strong>Work</strong>Figure 4.2 Comparison of Bonus-Pay Programs by Impact Size andPredicted Incentive StrengthEffect size0.11ChileIsrael(group)0.15 0.2 0.25 0.3IndiaKenya India (attend.)(group)Israel(indiv.)3 4India(indiv.)5Israel(group)Predicted incentive strength from1(lowest) to 5 (strongest)2ChileKenyaIndia(group)India(indiv.)India(attend.)Israel(indiv.)Source: Authors.Note: “Indiv.” designates individual teacher bonus. “Group” designates group bonus (orschool-level). “Attend.” indicates a study of programs rewarding teacher input (attendance)rather than student outcomes. Relative effect size (upper axis) ranges from a loweffect on learning outcomes (less than a 0.1 SD) on the left to a high effect (almost a 0.3SD) on the right. Relative strength (5-point scale along lower axis) indicates the overall“predicted strength” of each bonus-pay program according to the authors’ framework.Programs are presented below the axis along the scale derived from table4.5, which predicts the overall strength of the incentives. Note that the scaleis purely illustrative. Programs are presented above the axis in terms of thereported size of their effects on student outcomes. This continuum rangesfrom low effects (less than 0.1 of a standard deviation) to high effects (closeto 0.3 of a standard deviation) relative to those usually seen in the economicsof education and development literature. The Brazil program is not includedhere as it does not yet have equivalently rigorous impact estimates. Theestimated impacts on student learning range from a 0.12 standard deviationfor Chile’s SNED to a 0.27 standard deviation for the Andhra Pradesh, India,individual bonus program by the second year of implementation.A few cautious observations may be made. First, these pay-forperformanceprograms have had positive effects on student learning, ofroughly a 0.15 standard deviation. In comparison with the evaluation evidenceon other types of education interventions, it is noteworthy that theseeffects are statistically significant and consistently positive across differentbonus program designs and very different country contexts. But the effects
<strong>Making</strong> Teachers Accountable | 195are not huge. The one exception is the second-year impact observed in theAndhra Pradesh, India, program, which offered schools individual teacherincentives. It stands out, having produced a very large 0.27 standard deviationincrease in average math and language learning outcomes comparedwith randomly selected schools that were not eligible for an incentive.Second, according to the metrics constructed for predicting the strengthof a pay-for-performance incentive program, most of the programs clusterfairly closely around a rating of between 3 and 4 in our schema. The twooutliers are the Israel programs. Across the entire set of programs, however,there does not appear to be any obvious correlation between the“overall incentive strength” of a program and its impact—at least in oursimple ratings scheme and for this small sample of programs. In connectionwith our earlier observation that strength of these programs’ coredesign features tended to be dampened or balanced by the decisions on theaverage bonus size, there is an intriguing suggestion that there may besome kind of threshold incentive strength for a pay-for-performance programto “work.” However, beyond this point, there may not be any payoffto making programs more generous. At least in the two Israel cases, thereis no evidence that the considerably stronger and more expensive individualbonus scheme produced better results than the “weaker” groupbonus program.These observations, however, are highly speculative. The number ofevaluated programs is small, and most of the impact data come from twoyears or less of program experience. Both positive and negative features ofperformance-pay programs develop with experience and can exert potentiallystrong effects on their impact. On the positive side, agents’ awarenessof programs and the experience of actually seeing benefits paid out willincrease the credibility of the incentive and presumably its strength. Indeed,interviews with teachers and school directors in the first year of Pernambuco’sbonus program showed that schools were not universally aware oftheir performance targets and had quite uncertain expectations about thepotential size of performance bonuses. In the second year of the program,awareness was, as expected, much higher.On the other hand, schools’ and teachers’ ability to “game” the systemalso rises as their understanding of the rules of the game deepens with time.Evidence of gaming, cheating, scandals in test administration or the otherperformance measurement processes, or general perceptions of unfairnessin the mechanics underlying a bonus program will undermine its credibility,in turn dampening its incentive effects.There is much to be gained from additional, careful evaluations of newpay-for-performance programs in education—perhaps especially in developingcountries, where the challenges of improving teachers’ performanceare most acute. The framework presented here is simple, but it is grounded
196 | <strong>Making</strong> <strong>Schools</strong> <strong>Work</strong>in key elements of principal-agent theory. It appears to map well ontothe types of pay-for-performance programs being developed in experimentalpilot studies as well as systemwide education reforms. If thisframework can assist policy makers in thinking through key design issuesand encourage the systematic analysis of future programs, it will serve apurpose.Summary and ConclusionsTeachers and school-level administrators are the front-line providers ofeducation services. Their work determines the quality of services deliveredand their results—above all, how well students learn. New research showsconvincingly that student learning outcomes drive the overall benefits fromeducation investments. If rising access and schooling attainment do notresult in higher learning levels on globally benchmarked assessments,national investments may be largely wasted.Recent research has also established that individual teachers vary widelyin their ability to help their students learn. This evidence is leading countriesto reexamine how they select, groom, and motivate teachers. It is alsoraising awareness of disconnects between the incentives teachers face andthe results school systems want. Most school systems recruit teachersbased on criteria that are not correlated with real effectiveness in the classroom,fail to reward the capacities and behaviors that are correlated witheffectiveness, and are unable to sanction teachers who do not perform. Adisconnect between teacher incentives and accountability for performanceoccurs in OECD countries as well as in low- and middle-income countries.But the failures are deepest in the developing world, manifested in highteacher absenteeism and persistently low learning results by internationalstandards.Countries are not standing still, however. Innovative, sometimes radical,reforms of teacher contracting and compensation policies are springing upin developing countries—reforms aimed at linking teacher incentives moreclosely to performance. An encouraging number of reforms are being rigorouslyevaluated. Although the number of country cases is still small andmost programs are still in the initial years of implementation, evidence isbeginning to accumulate about their impact.This chapter reviewed the experience with two types of policies that canmake teachers more accountable for results: contract tenure reforms andpay-for-performance reforms. Both have the advantage of overcoming therigidity of existing teacher policies without requiring wholesale reform.Alternative contracting establishes different rules of the game for a newteacher cadre that works alongside the existing teacher stream. The new
<strong>Making</strong> Teachers Accountable | 197teacher cadre is hired on fixed-term (usually one-year) contracts withoutthe job stability that regular teachers enjoy.Pay-for-performance programs leave core salary policies intact but createan incentive at the margin with the offer of an annual bonus based on somemeasure of teacher performance—be it an input measure, such as teacherattendance; an outcome measure, such as school or student results; or acombination.The most rigorous of the seven available evaluations of contract teachersall found them to be more cost-effective than regular civil service teachers,and in India dramatically so. In both Kenya and India, randomized trialshave found learning outcomes for students of contract teachers to be equalto or better than those of civil service teachers, despite contract teachers’much lower salaries. Nonexperimental studies in two additional states inIndia have found similar results. Earlier evidence on community-hiredteachers in Central America (not included here but summarized thoroughlyin Vegas 2005) was less robust but also suggested that contract teachersachieve similar or better student grade progression and learning outcomes(controlling for student background) at lower cost.Although contract teachers usually work for lower salaries than theircivil service counterparts, the cost-effectiveness of a contract teacher policyis likely to depend on country characteristics and the level of educationinvolved. All of the evaluated cases involved contract teachers at the primarylevel, for example, where the supply of potential teachers with adequateskills is not as likely to be constrained as at the secondary level, or forspecialty subjects such as sciences and math. Second, there are naggingquestions about the sustainability of this policy over time. Many of theevaluated cases suggest that contract teachers may accept the lower salariesand insecure tenure because they are queuing for civil service positions.Teachers’ unions have also aided contract teachers in some African countriesto press successfully for tenure and, in many cases, a large share doend up entering the civil service.Nonetheless, the new wave of evidence on the short-term impacts ofcontract teacher reforms is fairly strong and consistent: the use of contractteachers can strengthen the scope for local monitoring of teacher performance,which results in higher teacher effort, which produces equal orbetter student learning outcomes than for regular teachers. And all of thisis achieved at lower costs per student.Teacher bonus initiatives in developing countries have proliferated overthe past several years, both as small-scale experiments and as high-profile,systemwide reforms. In contrast to the situation just five years ago, and incontrast to recent U.S. evidence, a growing body of developing-countrystudies suggests that bonus pay incentives can work—at least in contextscharacterized by
198 | <strong>Making</strong> <strong>Schools</strong> <strong>Work</strong>• Weak systems for performance monitoring and accountability—evidenced byrelatively high teacher absence rates, low teacher dismissal rates, andlow student learning performance• Relatively weak teacher professionalism—evidenced in most cases by lowstandards for entry• Relatively large bonus size—for example, an annual bonus of 30–300 percentof monthly salary• Focused performance metrics—emphasis on a small number of key, measurableresults, notably student learning improvements or relatively easilymeasured teacher “inputs” such as monthly attendance, rather thanmore complex, subjective, and comprehensive performance evaluations• “Fair” performance metrics—rewards to schools on a value-added basis(for progress relative to their starting point) or compared with schoolswith similar geographic and student socioeconomic conditions, not forabsolute levels of performance• Rewards clearly linked to prior period results—annual bonuses directly linkedto test or other results for the previous school year or monthly bonusesfor input measures monitored over the previous month, such as teacherattendance.These programs “work” in the sense that student learning outcomesimprove in the presence of the bonus. Across the eight most carefully evaluatedcases, the bonus program raised average learning outcomes in incentiveschools relative to control schools by about a 0.15 standard deviation;in the highest case, learning outcomes by the second year of the programwere a 0.27 standard deviation higher. Although not huge, effects on thisorder of magnitude are relatively rare across other types of education interventions,and the consistency of positive impacts, across a wide variety ofcountry contexts, is noteworthy.Our understanding of the mechanisms through which bonus payimproves student outcomes is still weak, however. In Brazil, classroomobservations found evidence of more efficient use of instructional time byteachers in schools that subsequently earned the bonus. Teachers in theseschools also lost less time due to late arrival or early departure, made moreintensive use of learning materials, and kept a higher share of students “ontask.” These patterns are consistent with Lavy’s observations in Israel. Butin some randomized trials in Kenya and India, at least over the short term,the bonus program did not induce any reduction in teacher absence rates,which is one of the most obvious ways teachers can increase their effort inresponse to an incentive. These teachers did nonetheless produce statisticallysignificant improvements in their students’ learning outcomes relativeto comparison groups of teachers who were not offered a bonus; the likely
<strong>Making</strong> Teachers Accountable | 199channel is through offering extra homework and class work and conductingout-of-school sessions for test preparation.In Brazil, where bonuses were available statewide, there is intriguingevidence that more-ambitious targets stimulated larger increases in studentlearning than in comparable schools with less-ambitious targets. This evidencesuggests that in the presence of an attractive performance award,schools focus on and are motivated to try to achieve specific targets. However,the fact that under this program 50 percent of all schools earned thebonus during the first year, and 70 percent in the second year, suggests thatthe targets, overall, were relatively accessible.Looking across pay-for-performance programs, several features derivedfrom principal-agent theory appear important for the design of effectiveincentives. These include the controllability of the specific performancemeasure(s) being incentivized, from the standpoint of individual teachers;the predictability of the incentive (that is, what share of those eligible willachieve it); and bonus size.Controllability, in our framework, is affected by two dimensions: “noise”in the performance measure and “locality” (that is, whether the bonus is anindividual or group-based incentive). For group incentives, school sizeappears important. If a school has a large number of teachers, yet the bonusis based on results produced by only a handful of its teachers (typically,those teaching subjects and grades that are subjected to annual testing),there is room for free-riding—in other words, some teachers coasting onthe work of the others.The experience to date lends some support to the theory that core designfeatures such as controllability and predictability affect the strength of theincentives in a pay-for-performance program. Particularly interesting froma policy standpoint is that these features appear complementary to thefinancial size of the bonus. In other words, bonus programs that pay attentionto the design of performance measures that are perceived to reflectteachers’ work fairly (for example, student test scores for schools areadjusted for socioeconomic differences) and are reasonably predictable may(all other things being equal) achieve stronger impacts. Much longer-termand deeper analysis of experience with these and other education pay-forperformanceprograms is needed for any conclusive observations, but theexperience to date at least suggests the usefulness of considering a set ofcore elements systematically in the design of new programs.In conclusion, a growing number of school systems across the developingworld are adopting two specific reforms aimed at strengthening therewards and sanctions for teacher performance: the use of contract teachersand bonus pay linked to teacher performance. These programs have differentdesigns, costs, and primary objectives, but both address a deep issue ofweak incentives for performance in education systems across the developingworld.
200 | <strong>Making</strong> <strong>Schools</strong> <strong>Work</strong>Our review of the best-evaluated cases to date shows that the design ofeffective incentives presents challenges and that the impacts vary significantly.An encouraging number of recent studies show positive impactsof incentive reforms on student learning outcomes. The number ofdeveloping-country reform experiences is still small, and most are fairlyrecent. But they permit a preliminary typology of examples that merit considerationby any education policy maker concerned with raising studentlearning as well as a framework for the generation of further research evidenceon “what works” to make schools more accountable for results.Annex: Rating the Design Features ofPay-for-Performance ProgramsControllability RatingsWe measure each of the two elements of controllability—noise andlocality—on a 5-point scale, ranging from very low (1) to very high (5), asdescribed below. In some cases, programs measure results on more thanone indicator, such as test scores and matriculation rates or grade progressionrates. In these cases, we constructed a simple average of the noise andlocality ratings for each of the different elements.Noise ratings1. (very low controllability): programs whose performance measures arelikely to exhibit high noise (for example, programs using only crosssectionallearning data with no adjustments for schools’ socioeconomiccontext or other factors) and programs that measure performancebased on outcomes for a very small group (for example, testscores calculated over fewer than 10 students)2–4. (moderate controllability): programs with measures less likely to exhibitnoise5. (very high controllability): programs with performance measuresdesigned to be as noise-free as possible—for example, programs usinglongitudinal data that are rich enough to produce value-added measuresof teacher performance at the classroom level; programs thatinclude adjustments for schools’ socioeconomic status and other contextualfactors; programs with performance measures that are inherentlycontrollable (such as seniority, attendance, and participation inprofessional development); 17 and programs that avoid measuring performanceof very small groups of students (less than 30) to reduce thepotential for exogenous shocks or variation.
<strong>Making</strong> Teachers Accountable | 201Locality ratings1. (very low locality): programs based on group performance in very largegroups of more than 50 teachers2. (low locality): programs based on group performance in groups of 25–503. (moderate locality): programs based on group performance in groups of10–254. (high locality): programs based on group performance in small groups of2–105. (very high locality): programs based on individual performancePredictability RatingsPredictability refers to the degree to which the agent or teacher can expectto earn the reward. A predictability rating thus ranges from 0 percent (totalcertainty that the bonus will not be attained) to 100 percent (total certaintyit will be obtained). Theory predicts that if an individual’s chance of attaininga bonus is at either of these extremes, the motivation to perform will beweaker. In the one case, there is no point; in the other, there is no need. Notsurprisingly, few bonus programs in reality operate at these extremes.Most—including all of the programs reviewed here—have rules of thegame that ensure that somewhere between 20 percent and 80 percent ofeligible schools or teachers achieve the bonus. One might hypothesize that,all other things being equal, programs near the mid-point of predictability(about 50 percent of participants earn the bonus) would exert the strongestincentive effects, but there is little empirical evidence on this.The programs we reviewed use two different models of bonus assignment:“piecewise” formulations and “tournaments.” In piecewise formulations,each individual school or teacher’s award is determined by the valueof the results they produce. In the case of Andhra Pradesh, India, teacherswere rewarded for every student whose test scores increased by more than5 percent over the school year—and the higher the scores, the higher thereward. Under the tournaments used in the Israel programs and Chile’sSNED, awards are restricted to a certain percentage of schools or individuals,ranked in order of their performance. In the case of Chile’s SNED, thetop 25 percent of schools in each socioeconomic band are rewarded,whether average scores go up or down.Both the average share of schools or teachers rewarded and the specificmodel will, in practice, enter into an agent’s estimation of the “predictability”of a program—that is, his or her chance of actually earning the bonus.
202 | <strong>Making</strong> <strong>Schools</strong> <strong>Work</strong>Figure 4A.1 Bonus Predictability RatingsLikert scale ratings (below axis) compared with reported sharesof schools/teachers rewarded (above axis)0% 25%15%ChileIsrael(group)40%Israel(indiv.)KenyaBrazil(group)India50% (group)65%India(indiv.)75%India(attend.)90%100%12 3 4 5Source: Authors.Notes: “Predictability” is the degree to which a teacher/school can expect to earn thebonus—rated from 1 (low probability) to 5 (total certainty that the award will be attained).Our ratings are divided into quartiles aligned with the reported shares of eligible teachers/schools actually receiving the awards in the programs evaluated (except for India-Attendance, for which the actual figures are not available, and thus estimated fromthe discussion in the text).In other words, piecewise and tournament-style bonus programs mightboth result in the same numerical share of all teachers earning the bonus,but they may incentivize agents slightly differently ex ante because of differencesin each individual’s levels of realism and risk aversion. Also, theevolution of a piecewise program over time will enable agents to refinetheir perceptions of predictability as evidence about the annual share of“winners” and average award size accrues.While the theoretical literature predicts that tournament models willinduce all individuals to make the same effort, the underlying assumptionsare quite strong (that all agents have symmetric information, risk neutrality,and equal abilities) (Lazear 2000). Other theoretical literature speculatesthat piecewise (linear) bonus contracts have the advantage of being moreresistant to gaming—but again, under strong assumptions of exponentialutility for the agent and normally distributed noise (Holmstron and Milgrom1987). Again, the empirical evidence is limited.For the purposes of this exercise, therefore, we use a limited but straightforwardmetric for assigning predictability ratings: the observed share ofteachers or schools that accessed the bonus, on average, each year. Fortournament programs, of course, this is a stable share. For the piecewiseprograms, the share will typically vary, but for many programs in our sample,only one year of experience was available. Figure 4A.1 indicates how
<strong>Making</strong> Teachers Accountable | 203Figure 4A.2 Bonus Size Ratingssize of bonuses as a percentage of average monthly wage0%15%25%40%50%65%75%90%100%12345Source: Authors.we assigned Likert-scale ratings from 1 (low predictability) to 5 (high predictability)for these programs, in line with reported data on the averageshare of participants (whether schools or teachers) that actually receivedthe award. These percentages along map onto a 100-percentile scale.Size-of-Bonus RatingsWe express the size of all bonuses in terms of their proportion of the averagemonthly wage. Since most programs award a range of bonuses dependingon the outcome achieved, we take the maximum bonus size as the mainreference point to assign ratings. In doing this, we assume that all teachershave some ex ante awareness of the maximum size of the bonus and, further,that they perceive the maximum bonus as attainable. 18 As shown infigure 4A.2, we divide the 5-point rating scale into quartiles, with a bonusof 0–25 percent of a monthly wage rated as 1 (very low) to 90 percent ormore of a monthly wage rated as 5 (very high). For reference, availabledata on the actual maximum and average bonus size for each program arealso presented.Notes1. When describing this experiment, all Indian rupee-to-dollar conversions usethe exchange rate reported by the authors: Rs 48 per $1.2. The bonus payment in the group-incentive schools ended up being lower thanthe individual incentives because the treatment effect was smaller (that is, thepercentage gain in average scores was lower) and also because classes withscores below their targets brought down the average school gain, while teacherswith negative gains (relative to targets) did not hurt teachers with positivegains in the individual-incentive schools (Muralidharan and Sundararaman2009).3. In fact, the authors argued that these kinds of behaviors would not be readilycaptured during classroom observations since many of these activities would betaking place after school or outside of the classroom.
204 | <strong>Making</strong> <strong>Schools</strong> <strong>Work</strong>4. More specifically, the material received by the “feedback” schools consisted ofan independently administered baseline test at the start of the school year; adetailed written diagnostic feedback report on the performance of students onthe baseline test; a note on how to read and use the performance reports andbenchmarks; an announcement that students would be tested again at the endof the year to monitor progress in student performance; and low-stakes monitoringof classrooms during the school year to observe teaching processes andactivity. In the feedback experiment, 100 schools received only the feedbacktreatment, while another set of randomly selected schools in the main experiment(those receiving incentives) also received feedback (Muralidharan andSundararaman 2010b).5. Because these are the results of the main experiment, the magnitude correspondsto the effects discussed above in Muralidharan and Sundararaman(2009).6. Other subjects (Hebrew and Arabic) were tested as well, and their teachers alsoparticipated in the incentive program.7. For the baseline, test scores in 1996 (Year 0) were used because there were notest scores for 1997. The first program year was 1998, and the second year was1999.8. A different model used to instrument the targets for the discontinuities alsoshowed evidence that higher targets—all other things being equal—led tolarger improvements in learning results over the short term.9. To be eligible for the program, schools had to be comprehensive (offer grades7–12) and be the only one of its kind in the community.10. Students in Israel high schools must take matriculation exams in core andelective subjects for each grade of high school (grades 10–12) but have theoption of taking all of the tests in their last year of high school, which moststudents choose to do. Matriculation exams are national exams that awardcredits for a particular subject. A minimum of 20 credits is required to qualifyfor a matriculation certificate, which is a necessary, although not sufficient,requirement for admission to a university (Lavy 2002).11. The average annual starting teacher salary of a high school teacher in Israel is$20,000. Mean high school teacher salaries are $30,000 (Lavy 2002).12. “Homogenous” groups are constructed based on geographical locations, educationallevels, and student socioeconomic characteristics (such as parents’ educationlevels). The result is about 100 homogenous groups composed of schoolsthat compete against each other (Romaguera 2008).13. <strong>Schools</strong> ranked between 25 percent and 35 percent receive 60 percent of thebonus.14. There is significant literature documenting undesired behaviors associated withhigh-stakes testing and teacher incentives programs in developed countries,notably in the United States, including cheating on exams (Jacob and Levitt2002), increasing student caloric intake on the day of the exam (Figlio andWinicki 2002), and removing low-achieving students from the classroom(Murnane and Cohen 1986). The developing-country literature on these issuesis less extensive, but the Kenya and India evaluations reviewed in this chapterdocumented increases in test preparation tutorials offered by teachers after
<strong>Making</strong> Teachers Accountable | 205school—rather than improvements in pedagogy during school hours—as oneof the main teacher behaviors stimulated by pay for performance.15. First, a significant number of these programs have been run on a pilot scale, asexperiments managed closely by academic researchers. Under these conditions,the scope for poorly designed tests of student learning or abuses in testadministration are minimal. Second, of the government-run initiatives beingimplemented at scale, several are very new. There has been little time forinconsistencies in administration to surface that may undermine the credibilityand power of the incentives. Nor has there been time for system actors todevelop the perverse behaviors that both theory and empirical experience predictwill arise as school personnel gain better awareness of the stakes and familiaritywith the rules of the game.16. There are arguments against noise being such an important measure because itcould average out in the long run. However, our rankings are based on grossdifferences across programs, such as having baseline exams, adjusting for studentsocioeconomic status and other characteristics, or having a value-addedframework that, even if not perfect, is technically more sound than a simplecross-section performance measure with no baseline to use for comparison.17. Note that rating a measure as relatively noise-free does not imply that it is notsusceptible to cheating or gaming. Attendance records, for example, are notoriousfor their manipulability.18. It is likely that if the experiments or programs are repeated over time, teacherscan adjust their perceptions based on previous results. But most of these programswere present for only one year or two years at the most (with the exceptionof Chile’s SNED, which is ongoing).ReferencesAbadzi, H. 2009. “Instructional Time Loss in Developing Countries: Concepts, Measurement,and Implications.” <strong>World</strong> <strong>Bank</strong> Research Observer 24 (2): 267–90.Alcazar, Lorena, F. Halsey Rogers, Nazmul Chaudhury, Jeffrey Hammer, MichaelKremer, Karthik Muralidharan. 2006. “Why Are Teachers Absent? ProbingService Delivery in Peruvian Primary <strong>Schools</strong>.” International Journal of EducationalResearch 45: 117–36.Atherton P., and G. Kingdon. 2010. “The Relative Effectiveness and Costs of Contractand Regular Teachers in India.” <strong>Work</strong>ing Paper 2010-15, Centre for theStudy of African Economies, University of Oxford, UK.Bacolod, M., J. DiNardo, and M. Jacobson. 2009. “Beyond Incentives: Do <strong>Schools</strong>Use Accountability Rewards Productively?” National Bureau of EconomicResearch <strong>Work</strong>ing Paper 14775, NBER, Cambridge, MA.Baker, G. 1992. “Incentive Contracts and Performance Measurement.” Journal ofPolitical Economy 100 (3): 598–614.———. 2002. “Distortion and Risk in Optimal Incentive Contracts.” Journal ofHuman Resources 37 (4): 728–51.Ballou, D., and M. Podgursky. 2002. “Returns to Seniority Among Public SchoolTeachers.” Journal of Human Resources 37 (4): 892–912.
206 | <strong>Making</strong> <strong>Schools</strong> <strong>Work</strong>Banerjee, A. V., S. Cole, E. Duflo, and L. Linden. 2007. “Remedying Education:Evidence from Two Randomized Experiments in India.” The Quarterly Journal ofEconomics 122 (3): 1235–64.Basinga, P., P. J. Gertler, A. Binagwaho, A. L. Soucat, J. R. Sturdy, and C. M.Vermeersch. 2010. “Paying Primary Health Care Centers for Perfomance inRwanda.” Policy Research <strong>Work</strong>ing Paper 5190, <strong>World</strong> <strong>Bank</strong>, Washington, DC.Borko, H. 2004. “Professional Development and Teacher Learning: Mapping theTerrain.” Educational Researcher 33 (8): 3–15.Bourdon, J., M. Frölich, and K. Michaelowa. 2007. “Teacher Shortages, TeacherContracts and their Impact on Education in Africa.” IZA Discussion Paper No.2844, Institute for the Study of Labor, Bonn, Germany.Bruns, B., D. Evans, and J. Luque. 2010. Achieving <strong>World</strong> Class Education in Brazil: TheNext Agenda. Washington, DC: <strong>World</strong> <strong>Bank</strong>.Burgess, S., and M. Ratto. 2003. “The Role of Incentives in the Public Sector: Issuesand Evidence.” Oxford Review of Economic Policy 19 (2): 285–300.Chapman, D. W., C. W. Snyder, and S. A. Burchfield. 1993. “Teacher Incentives inthe Third <strong>World</strong>.” Teaching and Teacher Education 9 (3): 301–16.Chaudhury, N., M. Kremer, F. H. Rogers, J. Hammer, and K. Muralidharan. 2005.“Teacher Absence in India: A Snapshot.” Journal of the European Economic Association3 (2–3): 658–67.Cohen, D. K., and H. Hill. 2001. Learning Policy: When State Education Reform <strong>Work</strong>s.New Haven: Yale University Press.Courty, P., and G. Marschke. 2003. “Dynamics of Performance-Measurement Systems.”Oxford Review of Economic Policy 19 (2): 268–84.Darley, J. 1991. “Setting Standards Seeks Control, Risks Distortion.” Institute ofGovernment Studies Public Affairs Report 32 (4), University of California,Berkeley.Deci, E. L., R. Koestner, and R. M. Ryan. 2001. “Extrinsic Rewards and IntrinsicMotivation in Education: Reconsidered Once Again.” Review of EducationalResearch 71 (1): 1–27.Delannoy, F., and G. Sedlacek. 2001. “Brazil—Teachers Development and Incentives:A Strategic Framework.” Human Development Department Report20408-BR, <strong>World</strong> <strong>Bank</strong>, Washington, DC.Duflo, E., P. Dupas, and M. Kremer. 2008. “Peer Effects, Teacher Incentives, and theImpact of Tracking: Evidence from a Randomized Evaluation in Kenya.”National Bureau of Economic Research <strong>Work</strong>ing Paper 14475, NBER,Cambridge, MA.———. 2009. “Additional Resources versus Organizational Changes in Education:Experimental Evidence from Kenya.” Unpublished manuscript, Abdul LatifJameel Poverty Action Lab (JPAL), Massachusetts Institute of Technology,Cambridge, MA.Duflo, E., R. Hanna, and S. Ryan. 2010. “Incentives <strong>Work</strong>: Getting Teachers toCome to School.” Unpublished manuscript, Abdul Latif Jameel PovertyAction Lab (JPAL), Massachusetts Institute of Technology, Cambridge, MA.Farr, S. 2010. Teaching as Leadership: The Highly Effective Teacher’s Guide to Closing theAchievement Gap. San Francisco: Jossey-Bass.
<strong>Making</strong> Teachers Accountable | 207Fehr, E., and A. Falk. 2002. “Psychological Foundations of Incentives.” EuropeanEconomic Review 46 (4–5): 687–724.Fernandes, R. 2007. “Índice de Desenvolvimento da Educação Básica (IDEB): metasintermediárias para a sua trajetória no Brasil, estados, municípios e escolas.”National Institute of Educational Studies ‘Texeira’ (INEP), Ministry of Education,Government of Brazil.Ferraz, C., and B. Bruns. Forthcoming. “Incentives to Teach: The Effects of PerformancePay in Brazilian <strong>Schools</strong>.” <strong>World</strong> <strong>Bank</strong>, Washington, DC.Figlio, D. N., and J. Winicki. 2005. “Food for Thought: The Effects of SchoolAccountability Plans on School Nutrition.” Journal of Public Economics 89:381–94.Fudenberg, D., B. Holmstrom, and P. Milgrom. 1990. “Short-Term Contracts andLong-Term Agency Relationships.” Journal of Economic Theory 51 (1): 1–31.Gallego, F. A. 2008. “Efectos del SNED en resultados del proceso educativo.” Unpublishedmanuscript.Garet, M., A. Porter, L. Desimone, B. Birman, and K. S. Yoon. 2001. “What MakesProfessional Development Effective? Results From a National Sample of Teachers.”American Education Research Journal 38 (4): 915–45.Glewwe, P., N. Ilias, and M. Kremer. 2010. “Teacher Incentives.” American EconomicJournal: Applied Economics 2 (3): 205–27.Goldhaber, D., and Jane Hannaway. 2009. Creating a New Teaching Profession. Washington,DC: The Urban Institute Press.Goyal, S., and P. Pandey. 2009a. “Contract Teachers.” South Asia Human DevelopmentSector Report 28, <strong>World</strong> <strong>Bank</strong>, Washington, DC.———. 2009b. “How Do Government and Private <strong>Schools</strong> Differ? Findings fromTwo Large Indian States.” South Asia Human Development Sector Report 30,<strong>World</strong> <strong>Bank</strong>, Washington, DC.Guarino, C. A., L. Santibañez, and G. A. Daley. 2006. “Teacher Recruitment andRetention: A Review of the Recent Empirical Literature.” Review of EducationalResearch 76 (2): 173–208.Hanushek, E. A., J. F. Kain, D. M. O’Brien, and S. G. Rivkin. 2005. “The Market forTeacher Quality.” National Bureau of Economic Research <strong>Work</strong>ing Paper11154, NBER, Cambridge, MA.Hanushek, E. A., and S. G. Rivkin. 2010. “Generalizations about Using Value-Added Measures of Teacher Quality.” American Economic Review 100 (2):267–71.Hanushek, E. A., and L. Woessmann. 2007. “The Role of Education Quality forEconomic Growth.” Policy Research <strong>Work</strong>ing Paper 4122, <strong>World</strong> <strong>Bank</strong>,Washington, DC.Heinrich, C. J., and G. Marschke. 2010. “Incentives and Their Dynamics in PublicSector Performance Management Systems.” Journal of Policy Analysis and Management29 (1): 183–208.Holmstrom, B. 1979. “Moral Hazard and Observability.” Bell Journal of Economics10 (1): 74–91.Holmstrom. B., and P. Milgrom. 1987. “Aggregation and Linearity in the Provisionof Intertemporal lncentives.” Econometrica 55: 303–28.
208 | <strong>Making</strong> <strong>Schools</strong> <strong>Work</strong>Hoxby, C. M., and A. Leigh. 2004. “Pulled Away or Pushed Out? Explaining theDecline of Teacher Aptitude in the United States.” American Economic Review94 (2): 236–46.Jacob, B. A., and S. D. Levitt. 2002. “Rotten Apples: An Investigation of the Prevalenceand Predictors of Teacher Cheating.” National Bureau of EconomicResearch <strong>Work</strong>ing Paper 9413, NBER, Cambridge, MA.Kane, Thomas J., and Douglas O. Staiger. 2001. “Improving School AccountabilityMeasures.” National Bureau of Economic Research <strong>Work</strong>ing Paper 8156,NBER, Cambridge, MA.Kerr, S. 1975. “On the Folly of Rewarding A, While Hoping for B.” Academy of ManagementJournal 18 (4): 769–83.Kremer, M. E., D. Chen, P. Glewwe, and S. Moulin. 2001. “Interim Report on aTeacher Incentive Program in Kenya.” Unpublished paper, Harvard University,Cambridge, MA.Kremer, M., E. Miguel, R. Thorton, and O. Ozier. 2005. “Incentives to Learn.” PolicyResearch <strong>Work</strong>ing Paper 3546, <strong>World</strong> <strong>Bank</strong>, Washington, DC.Lavy, V. 2002. “Evaluating the Effect of Teachers’ Group Performance Incentives onPupil Achievement.” The Journal of Political Economy 110 (6): 1286–317.———. 2009. “Performance Pay and Teachers’ Effort, Productivity, and GradingEthics.” The American Economic Review 99 (5): 1979–2011.Lazear, E. P. 2000. “Performance Pay and Productivity.” The American EconomicReview 90 (5): 1346–1361.———. 2003. “Teacher Incentives.” Swedish Economic Policy Review 10 (2): 179–214.Lemieux, T., W. B. Macleod, and D. Parent. 2009. “Performance Pay and WageInequality.” The Quarterly Journal of Economics 124: 1–49.Manzi, J. 2008. “Individual Incentives and Teacher Evaluation: The Chilean Case.”Paper prepared for the “Quality of Education” International OECD and MexicoJoint Conference, Teacher Incentives and Stimuli Session, Mexico City.McCaffrey, D. F., J. Lockwood, T. R. Sass, and K. Mihaly. 2009. “The Inter-temporalVariability of Teacher Effect Estimates.” Unpublished paper.McEwan, P., and L. Santibáñez. 2005. “Teacher and Principal Incentives in Mexico.”In Incentives to Improve Teaching: Lessons from Latin America, ed. E. Vegas, 213–53.Washington, DC: <strong>World</strong> <strong>Bank</strong>.Miller, R. T., R. J. Murnane, and J. B. Willett. 2007. “Do Teacher Absences ImpactStudent Achievement? Longitudinal Evidence from One Urban School District.”National Bureau of Economic Research <strong>Work</strong>ing Paper 13356, NBER,Cambridge, MA.Ministry of Education, Government of Chile. 2010. Programa Asignación Variablepor Desempeño Individual. http://www.avdi.mineduc.cl.Mizala, A., and P. Romaguera. 1999. “El Sistema Nacional de Evaluación del DesempeñoDocente en Chile.” Paper prepared for the “Los Maestros en AméricaLatina: Nuevas Perspectivas Sobre su Desarrollo y Desempeño” conference,San José, Costa Rica.Mizala, A., P. Romaguera, and M. Urquiola. 2007. “Socioeconomic Status or Noise?Tradeoffs in the Generation of School Quality Information.” Journal of DevelopmentEconomics 84 (1): 61–75.
<strong>Making</strong> Teachers Accountable | 209Muralidharan, K., and V. Sundararaman. 2009. “Teacher Performance Pay: ExperimentalEvidence from India.” National Bureau of Economic Research <strong>Work</strong>ingPaper 15323, NBER, Cambridge, MA.———. 2010a. “Contract Teachers: Experimental Evidence from India.” Unpublishedpaper, <strong>World</strong> <strong>Bank</strong>, Washington, DC.———. 2010b. “The Impact of Diagnostic Feedback to Teachers on Student Learning:Experimental Evidence from India.” The Economic Journal 120 (546):F187–F203.———. 2010c. “Teacher Opinions on Performance Pay: Evidence from India.”Unpublished paper, <strong>World</strong> <strong>Bank</strong>, Washington, DC.Murnane, R. J., and D. K. Cohen. 1986. “Merit Pay and the Evaluation Problem:Why Most Merit Pay Plans Fail and a Few Survive.” Harvard Educational Review56 (1): 3–17.Murnane, R. J., J. Singer, J. Willett, and R. Olsen. 1991. Who Will Teach? Policies thatMatter. Cambridge, MA: Harvard University Press.Odden, A., and C. Kelley. 1997. Paying Teachers for What They Know and Do. ThousandOaks, CA: Corwin Press.Pandey, P., S. Goyal, and V. Sundararaman. 2009. “Community Participation inPublic <strong>Schools</strong>: Impact of Information Campaigns in Three Indian States.” EducationEconomics 17 (3): 355–75.Pink, D. H. 2006. A Whole New Mind: Moving from the Information Age to the ConceptualAge. New York: Riverhead Books.Podgursky, M. J., and M. G. Springer. 2007. “Teacher Performance Pay: A Review.”Journal of Policy Analysis and Management 26 (4): 909–49.Prendergast, C. 1999. “The Provision of Incentives in Firms.” Journal of EconomicLiterature 37 (1): 7–63.Rau, T., and D. Contreras. 2009. “Tournaments, Gift Exchanges, and the Effect ofMonetary Incentives for Teachers: The Case of Chile.” Department of Economics<strong>Work</strong>ing Paper 305, University of Chile, Santiago.Rivkin, S. G. 2009. “The Estimation of Teacher Value-Added as a Determinant ofPerformance Pay.” In Creating a New Teaching Profession, ed. Don Goldhaber andJane Hannaway. Washington, DC: The Urban Institute Press.Rivkin, S. G., E. A. Haunshek, and J. F. Kain. 2005. “Teachers, <strong>Schools</strong> and AcademicAchievement.” Econometrica 73 (2): 417–58.Romaguera, P. 2008. “Incentives and Stimuli for Teachers: The Case of Chile.” Paperprepared for the “Quality of Education” International OECD and Mexico JointConference, Teacher Incentives and Stimuli Session, Mexico City.Santibañez, L., J. F. Martínez, P. J. McEwan, C. Messan-Setodji, and R. Basurto-Dávila. 2007. Haciendo Camino: Análisis del Sistema de Evaluación y del Impactodel Programa de Estímulos Docentes Carrera Magisterial en México. Santa Monica,CA: RAND Education.Solmon, L. C., and M. Podgursky. 2000. “The Pros and Cons of Performance-Based Compensation.” Opinion Paper 120, Milken Family Foundation, SantaMonica, CA.Springer, Matthew G., ed. 2009. Performance Incentives: Their Growing Impact on AmericanK–12 Education. Washington, DC: Brookings Institution.
210 | <strong>Making</strong> <strong>Schools</strong> <strong>Work</strong>Stallings, J. 1985. “Instructional Time and Staff Development.” In Perspectives onInstructional Time, ed. C. W. Fisher and D. C. Berliner, 283–98. New York:Longman.Steele, J. L., R. J. Murnane, and J. B. Willett. 2009. “Do Financial Incentives HelpLow-Performing <strong>Schools</strong> Attract and Keep Academically Talented Teachers?Evidence from California.” National Bureau of Economic Research <strong>Work</strong>ingPaper 14780, NBER, Cambridge, MA.Umansky, I. 2005. “A Literature Review of Teacher Quality and Incentives: Theoryand Evidence.” In Incentives to Improve Teaching: Lessons from Latin America, ed.E. Vegas, 21–61. Washington, DC: <strong>World</strong> <strong>Bank</strong>.Valenzuela, J. P., A. Sevilla, C. Bellei, and D.d. Ríos. 2010. “Remuneraciones de losDocentes en Chile: Resolviendo una Aparente Paradoja.” Iniciativa CientíficaMilenio Serie Documentos de Orientación para Políticas Públicas. Santiago,Chile.Vegas, E., ed. 2005. Incentives to Improve Teaching: Lessons from Latin America. Washington,DC: <strong>World</strong> <strong>Bank</strong>.Vegas, Emiliana, and Joost de Laat. 2003. “Do Differences in Teacher ContractsAffect Student Performance? Evidence from Togo.” <strong>Work</strong>ing Paper No. 26955,<strong>World</strong> <strong>Bank</strong>, Washington, DC.Vegas, E., S. Loeb, P. Romaguera, A. Paglayan, and N. Goldstein. 2010. “TeacherPolicies Around the <strong>World</strong>: Objectives, Rationale, Methodological Approach,and Products.” Education Department, <strong>World</strong> <strong>Bank</strong>, Washington, DC.Weisberg, D., S. Sexton, J. Mulhern, and D. Keeling. 2009. The Widget Effect: OurNational Failure to Acknowledge and Act on Differences in Teacher Effectiveness.Brooklyn, NY: The New Teacher Project. http://widgeteffect.org/downloads/TheWidgetEffect.pdf.
5<strong>Making</strong> <strong>Schools</strong> <strong>Work</strong> throughAccountability ReformsDrawing on new evidence from 22 rigorous impact evaluations across 11developing countries, this book has examined how three key strategies tostrengthen accountability relationships in school systems—informationfor accountability, school-based management, and teacher incentives—can affect school enrollment, completion, and student learning. Overall, theevidence base has increased significantly, but broader country experienceis needed, including much more experience in moving from efficacy trials(pilot programs) to systemwide reform implementation.This chapter reviews the major conclusions and caveats that we drawfrom the evidence base to date in each of the three areas. It also looks acrossthese three accountability reform strategies to consider how they may complementeach other when implemented in combination. We review thetechnical issues posed by extrapolating from small-scale pilot evaluations tobroader program design and the political economy issues of implementingor scaling up these three types of accountability reforms. We conclude withsome suggested directions for future research.Information-for-Accountability StrategiesImpact evaluations are an important tool for establishing “proof ofconcept”—that an intervention or type of intervention can have an impacton outcomes. The studies to date suggest that information for accountability211
212 | <strong>Making</strong> <strong>Schools</strong> <strong>Work</strong>can improve outcomes (see box 5.1). The three-state study in India and thestudies in Liberia, Pakistan, and Uganda show that, under some configurations,information provision can stimulate actions on the part of schoolstakeholders, or politicians, that result in increased learning outcomes.Such positive change can come through a variety of channels. In India,client power led to increased community oversight and increased effort onthe part of teachers. In Liberia, information appeared to leverage parentengagement to make teacher capacity building effective. In Pakistan, informationdistributed to parents and teachers strengthened the village marketsfor education. In Uganda, empowering the school community with knowledgeof school budgets affected both their “voice” and their “client power.”However, the evidence also suggests that information is not a panacea.The Jaunpur study in India, the Chilean example, and the Liberian“ information-only” intervention all had no, or very limited, impacts.Clearly, school-based information can be used effectively for change, but itseffectiveness will depend on a variety of factors—not all of which are wellunderstood. The four new field studies, along with the two retrospectiveevaluations, do not provide a rich enough information base to parse outwhat makes information “work.” Nevertheless, two questions related tointervention design appear to be important and merit serious thought inany new program:1. What information should be disseminated? Simplicity seems to be animportant feature. The Pakistan case, which had some of the largestimpacts identified here, involved limited information—focused only ontest score results. This is not to say that all school report cards shouldlimit themselves to test scores only. But the fact that the information wasnarrow made it relatively easy for parents to understand and made theschools’ comparative performance unambiguous.2. How should information be disseminated? The two India cases documenteda high degree of disengagement on the part of village-level educationstakeholders. In this context, it is unlikely that a “hands-off”approach to providing information will have large impacts. Finding waysto ensure that these stakeholders absorb and understand the information,and also understand the actions they can potentially take, is likely crucial.This may need to be done creatively—and several of the interventionssuggest it may need to be done repeatedly—to effect change. In somecontexts, ensuring that information feeds into the political process, andfinding ways to make that happen, will be the key to effecting change.When designing information-for-accountability interventions, it is alsoimportant to keep in mind potential downsides. First, information canexacerbate, rather than reduce, inequalities in the voice and power ofdifferent socioeconomic groups. If the most highly educated or politically
<strong>Making</strong> <strong>Schools</strong> <strong>Work</strong> through Accountability Reforms | 213BOX 5.1New Evidence on Information for AccountabilityPakistan: Report CardsIn the context of a school management reform in the Punjab provinceof Pakistan, student and school “report cards” were produced and disseminatedto parents and students in randomly selected villages—asetting in which a substantial number of students attended privateschools (Andrabi, Das, and Khwaja 2009). The content of the cardswas based on the results from a set of tests in English, mathematics,and Urdu—the local language. Parents received information abouttheir child’s individual scores and quintile rank, the school’s averagescores and quintile rank, and the average scores and quintile ranks ofall other public and private schools in the village. Cards were deliveredthrough discussion groups in which most of the time was spent explaininghow to interpret the cards—with little advice provided as towhat parents should do with the information. The evaluation ran overthe course of two years.The impact of the program rippled through local education markets.Learning achievement increased by between 0.10 and 0.3 of a standarddeviation in government and lower-quality private schools, and thefees charged at higher-quality private schools fell by 21 percent. Amongprivate schools, the results were consistent with the increased competitionthat information was introducing into the market: initially poorlyperforming schools responded by increasing the quality of teaching,and initially high-quality schools responded by reducing fees. It is lessclear why learning increased in government schools. Unpacking thechanges, the researchers found that schools in villages that receivedreport cards were more likely to have textbooks by the end of thestudy, and they devoted around 30 more minutes per day to teachingand learning activities.India: Jaunpur District and Three-State StudiesTwo studies in India evaluated the impact of providing villagers withinformation about their rights and responsibilities regarding educationprovision and oversight. The settings were communities suffering froma substantial disconnect between the users and the providers ofschooling—despite the existence of formal community oversightgroups. Indeed, one of the studies found that most members of theVillage Education Committees (VECs) did not even know they weremembers or what the role of the council was.(continued next page)
214 | <strong>Making</strong> <strong>Schools</strong> <strong>Work</strong>BOX 5.1 continuedThe first study, carried out in the Jaunpur district of Uttar Pradesh(Banerjee and others 2008), included a three-arm research design—with villages randomly assigned to each arm or to a comparison group.In the first arm, community members were informed of the structure ofservice provision and of the role and responsibilities of VECs. The secondarm added an activity in which local volunteers were trained toadminister a simple learning assessment to all children in the villageand to publicize the results. The third arm added a component in whichlocal volunteers were trained to provide reading instruction to villagechildren. The study impacts were evaluated after a period of three tosix months after the initial intervention.The second study was carried out in selected districts in three IndianStates—Uttar Pradesh, Madhya Pradesh, and Karnataka (Pandey,Goyal, and Sundararaman 2009, 2010). The intervention was similar tothat of the first arm of the Jaunpur study, although the modalities fordelivery of the information differed. For example, videos were shownon a mobile video screen, banners were erected in villages, and materialsuch as calendars were distributed to parents. Impacts were evaluatedover the course of two years (within which a “refresher” interventiontook place).The two evaluations came to different findings. The Jaunpur studyfound virtually no impact of the first two intervention arms—those thatemphasized information alone. At the six-month follow-up, villagemembers did know more about the role of the VEC and of the state ofeducation in the village, although the magnitude of the increase inknowledge was small. But children in these villages performed no betteron a range of tests designed to measure basic reading and mathabilities.The results from the three-state study were more pronounced.While the impacts were not consistent across all states and grades,they were measurable in several. For example, about 16 percent ofthird- and fourth-grade students in Uttar Pradesh had mastered one ormore of the math competencies tested at baseline; the impact of theprogram was to raise that by about 5 percentage points more than thecontrol group. Digging deeper into the sources of change, the studyfound that both knowledge and behaviors were affected by the intervention.Community members tended to know more about schooloversight committee functions and other school matters, such asschool accounts. Teacher effort, as measured by teacher attendanceand by teaching activity conditional on attendance, also increasedmeasurably.(continued next page)
<strong>Making</strong> <strong>Schools</strong> <strong>Work</strong> through Accountability Reforms | 215BOX 5.1 continuedLiberia: Early Grade Reading AssessmentIn the context of an Early Grade Reading Assessment (EGRA) inLiberia, two strategies for improving reading outcomes were evaluatedand compared with a control group (Piper and Korda 2010). Assignmentto each of the treatment groups or the comparison group wasrandom. The first evaluated approach consisted of publicizing theEGRA results to parents and communities and showing teachers howto prepare quarterly report cards for parents. The second approachadded an intensive teacher-training component focused on methodsfor reading instruction.After two years of the program, the “information-only” interventionhad very small impacts. Only one of nine measures of children’s readingskills (letter fluency) was affected by the intervention. On the otherhand, the “full” intervention had large impacts on reading abilities—ranging from a 0.38 standard deviation in listening comprehension to1.4 standard deviations for unfamiliar word decoding. Intriguingly, thestudy also found large and significant impacts on an assessment ofmath skills, even though math instruction was not a part of the teachertraining. Given the study design, it is impossible to know whether theteacher training without the information would have had a similar impact.However, given the typically disappointing results from in-serviceteacher-training programs (<strong>World</strong> <strong>Bank</strong> 2003) and the spillover effectsto math skills, it is possible that the increased accountability associatedwith the dissemination of scores, as well as the interaction (and supervision)associated with the “full” program, contributed to the adoptionof more effective teaching methods and the resulting higher learningachievements. aUganda: Public Information CampaignAn alternative type of information intervention concerned not rights,responsibilities, or test scores but rather focused on inputs. Educationfunding in Uganda in the early 1990s was plagued by the fact that fewof the resources allocated to schools actually reached them. A largescaleinformation campaign was launched to sensitize parents andcommunities to the exact amount of operational funding each schoolcould expect and the date when the transfer to the school would bemade. Two main information channels were used: (1) posting of schoolbudgets in prominent locations on school grounds and (2) local newspaperlistings of the amounts and dates of the school grant distributions.Importantly, these reforms were undertaken in the context of a(continued next page)
216 | <strong>Making</strong> <strong>Schools</strong> <strong>Work</strong>BOX 5.1 continuedlarger-scale political focus on the education sector, including a drive touniversalize public primary education by eliminating school fees. Retrospectiveevaluations of the information campaign have used exposureto media as an instrumental variable (Reinikka and Svensson2005, 2006; Björkman 2006). Assuming that exposure is exogenous(conditional on other observed characteristics), the impacts of disseminatingthis information through the media can be identified in this way.The studies found large impacts from the information campaigns onseveral outcomes. First, as mentioned earlier, the public media campaignwas associated with a sharp reduction in the leakage of schoolgrant expenditures; by the early 2000s, more than 80 percent of fundsspent on the school grants program actually reached schools. The researchersalso documented that schools in districts with higher mediaexposure—and therefore more information conveyed—experiencedgreater increases in enrollments and higher test scores on the primaryschool exit exam than schools in districts with lower exposure.Chile: School RankingsA very different study exploited the long history of student testing andpublic dissemination of school-level results in Chile—the first country inLatin America to introduce standardized student testing. Since 1996,Chile’s Sistema Nacional de Evaluación del Desempeño de los EstablecimientosEducativos Subvencionados (National System for PerformanceEvaluation of Subsidized Educational Establishments, or SNED)program of school-level bonuses has also provided cash rewards toschools that show the largest improvements in student scores and otheroutcomes. The impact of these incentives on school performance isdiscussed in Chapter 4 and summarized elsewhere in this chapter, inthe context of evidence on pay-for-performance reforms. But researchersMizala and Urquiola (2007) recently analyzed the SNED experiencefrom another angle, asking whether the program may also produceseparate impacts through an information channel. SNED’s identificationof “outstanding” schools and rankings of school quality by administrativeregion, adjusted for student socioeconomic characteristics, arewidely publicized in Chile. Does this information affect parents’ choiceof school? To analyze the extent to which this information disseminationaffects school enrollments, the level of school fees, and the degreeof socioeconomic heterogeneity in schools, Mizala and Urquiola (2007)exploited the fact that, within each “homogenous” group of schools, 25are selected as winners in each round of the program. <strong>Schools</strong> “just(continued next page)
<strong>Making</strong> <strong>Schools</strong> <strong>Work</strong> through Accountability Reforms | 217BOX 5.1 continuedabove” and “just below” the cutoff can be considered similar, althoughthe former receives publicity associated with being a winner.The researchers found that none of the outcome measures appearedto be affected by the program. A variety of robustness checksconfirmed that this was not because of low literacy among parents(the result held for more-educated parents) nor because of limitedstudent mobility across schools (the results also held for the secondarylevel, where students move more freely). Instead, the authors hypothesizedthat the program may fail to register with parents, leadingto limited impact on their choices. Or other factors—such as schoolproximity or peer group preferences—may play a more dominant rolethan school performance information in school choices in Chile.a. Li and others (2010) document how parental communication worked as acomplement to tutoring in improving learning outcomes in a randomized fieldexperiment in China.powerful members of society are better positioned to use information fortheir own benefit (to the detriment of others), then information provisionmay foster elite capture.Second, a number of different studies in the context of high-stakes informationand testing (primarily in the United States) have documented strategicbehavior on the part of schools—for example, manipulating whotakes the test or outright cheating—that undermines the validity of theinformation intervention.Third, the validity of test scores themselves as a fair and accurate signalof learning progress and the relative performance of schools is subject todebate. Test scores can be a noisy measure, especially in small schools whichare common in much of the developing world.Last, for information to have an impact, school-level actors must knowhow to improve service delivery. Some behavior changes may bestraightforward—for example, improved teacher attendance—but others,such as more effective instructional techniques, are harder to achieve.Unless agents possess the tools and the scope for change, additionalinformation may produce only frustration.In summary, information for accountability—on its own—is a potentiallyuseful tool for improving learning outcomes but one whose successat leveraging change is sensitive to many factors. For information provisionto be effective, service providers must have the ability to change in
218 | <strong>Making</strong> <strong>Schools</strong> <strong>Work</strong>response to the accountability pressures it can induce. If providers are circumscribedin their ability to take action, it is unsurprising if informationhas no impact. Information is therefore critically linked to local decisionmakingauthority—a theme explored more extensively in the discussion ofschool-based management. The impact of information is also likely to behigher if it is linked to performance rewards or sanctions, which we considerin the discussion of teacher incentives.School-Based Management StrategiesSchool-based management (SBM) models may have many positive benefits,all of which are associated with an improved and inclusive learning environment.At the same time, it is important to keep in mind that the institutionalchanges implied by SBM reforms may take time to affect test scores—bothbecause it may take time for the new institutional arrangements to solidifyand because it may take time for those changes to translate into test scoresor examination results. That is, SBM is not a “quick fix.” A meta-analysis of232 studies with over 1,000 observations from 29 programs implementedin the United States showed that SBM reforms need at least five years tobring about fundamental changes at the school level and about eight yearsto yield significant changes in test scores, as figure 5.1 illustrates.Figure 5.1 SBM Results: A Meta-Analysis of U.S. Modelsstandard deviations of improvement in student achievement,year-over-year0.600.500.50adjusted effect size(standard deviation)0.400.300.200.100.170.14 0.150.130.250.230.390.001 2 3 4 5 6 7 8–14years of SBM program implementationSource: Borman and others 2003.Notes: SBM = school-based management.
<strong>Making</strong> <strong>Schools</strong> <strong>Work</strong> through Accountability Reforms | 219Autonomy and participation, key dimensions of SBM, vary substantiallyin implementation. But from the variety of experiences, certain fundamentalsemerge as key for effective reform. These elements include a focus onautonomous school strategic planning, involvement of multiple groups ingoal setting, changes in teacher pedagogic practices, and stronger relationswith parents and the surrounding community, all of which are mainstaysof strong programs in the United States. Many of the programs in developingcountries, including those designed to improve quality, emphasize theparticipatory aspects of SBM rather than the management aspects. To beeffective, programs likely need to move beyond participation and involveempowerment of the actors to affect core education functions, such asteaching and learning.The evidence to date is that SBM can improve learning outcomes, thoughthe results are mixed (see box 5.2). It is likely that for SBM to be effective,it must entail a real transfer of authority (that is, provide school committeesBOX 5.2New Evidence on School-Based ManagementKenya: Extra Teacher ProjectIn western Kenya, an innovative project was designed to investigate avariety of issues related to resource allocation and learning outcomesin primary education (Duflo, Dupas, and Kremer 2008). One aspect ofthe project was to explicitly test whether parental oversight of teachersleads to significant gains in test scores. Out of 210 schools in theproject, 140 were randomly selected to receive funding for a locallyhired contract teacher. Of these, 70 schools were randomly selected toparticipate in an SBM initiative designed to empower the school committeesto monitor teachers’ performance. In those schools, schoolcommittees held a formal review meeting at the end of the first schoolyear of the program to assess the contract teacher’s performance andto decide whether to renew the teacher’s contract or to replace him orher. To assist the school committee, the project provided its memberswith a short, focused training on monitoring the contract teacher’s performance.The school committee members were taught techniques forsoliciting input from parents and checking teacher attendance. A formalsubcommittee of first-grade parents was formed to evaluate thecontract teacher and deliver a performance report at the end of thefirst year.(continued next page)
220 | <strong>Making</strong> <strong>Schools</strong> <strong>Work</strong>BOX 5.2 continuedThe evaluation found that the impact of parental oversight ofteachers—that is, the SBM aspect of the intervention—was strong whencombined with other reforms. The effect of reducing pupil-teacher ratiosfrom 80 to 1 to 46 to 1, absent other interventions, led to reducedteacher effort (two teachers could share the job previously done byone teacher) and to small and insignificant increases in test scores. Incontrast, combining the extra teacher with better incentives; local hiringof teachers on short-term, renewable contracts; or increasing parentaloversight led to significant test score gains. Eighteen monthsinto the program, students in treatment schools had test scores a 0.22standard deviation higher than students in comparison schools. Inschools where the school committee training was absent, however, theimpact was smaller—only a 0.13 standard deviation—and statisticallyinsignificant. The effect of the extra teacher was therefore largestwhen school committees were given training on how to supervise andmanage teachers, and this effect was largest among the students assignedto a contract teacher instead of a civil service teacher. Overall,students assigned to a contract teacher in SBM schools scored a 0.30standard deviation higher than students in the nonprogram schools. Inthis case, the SBM initiative enhanced the effect of the other interventions.Mexico: School Quality and Management Support ProgramsTwo new evaluations in Mexico study the impacts of autonomy reformsthat can be described as weak to intermediate. Although both SBMinterventions are early in program implementation and analysis, theyshow small impacts on outcomes, mostly in the early grades of primaryschool. However, they also show changes in school climate, parental(low-income, rural, indigenous) perceptions and participation,and engagement among actors.Quality <strong>Schools</strong> Program (PEC). In the Mexican state of Colima, thefederal SBM program Programa Escuelas de Calidad (Quality <strong>Schools</strong>Program, or PEC) was randomly assigned in 2006. The study found amixed set of results on intermediate indicators (Gertler, Patrinos, andRodríguez-Oreggia 2010). Teachers reported an increase in the timethey devoted to administrative tasks. There was a significant increasein the total number of hours per week that teachers reported spendingon supporting students who were lagging behind and on meetingswith parents to discuss student performance. There was a significantincrease in principals’ engagement in meetings to solve school conflictsas reported by teachers (overall, there was a very high reported(continued next page)
<strong>Making</strong> <strong>Schools</strong> <strong>Work</strong> through Accountability Reforms | 221BOX 5.2 continuedparticipation of teachers and principals in meetings over school matters).On the other hand, there was no observed significant change inthe number of meetings held by the different school agents during theacademic year.In terms of student achievement, preliminary analysis suggests thattest scores increased overall in Colima, for both treatment and controlschools, although the differences were small. When disaggregated bygrade, however, the cohort that was exposed to treatment the longestexperienced the largest gains—students who were in third grade in thebaseline year (2005/06). These students’ scores increased by a 0.5standard deviation between third and sixth grade if they were in thetreated schools, while those in control schools increased by a 0.34standard deviation—for a difference-in-differences estimated programimpact of a 0.16 standard deviation.School Management Support program (AGE 125). Another evaluationfocused on the Apoyo a la Gestión Escolar 125 (Support to SchoolManagement Program, or AGE 125) program in four Mexican states,which doubled the resources that AGE 125 schools received. a After justone year of implementation, a first follow-up survey revealed severalimpacts. First, interaction among directors, teachers, and parentschanged—in particular, through the increased participation of schoolagents in the design and execution of school improvement plans. Second,class time, preparation, and extra classes for lagging pupils allincreased more in the treatment schools than in the control schools.After the first year of implementation, the AGE 125 project caused adropout-rate decrease of between 1.56 and 1.73 percentage points inthe treatment schools compared with the control schools. Amongthird-graders, the program had a positive impact on Spanish andmathematics test scores. The results suggest that the AGE 125 causedan increase of about 5.0–5.6 percent in Spanish scores and of about6.3–8.0 percent in mathematics scores for third-grade students(Gertler, Patrinos, and Rodríguez-Oreggia 2010).Nepal: Community-Managed <strong>Schools</strong>The Government of Nepal notionally transferred responsibility formanaging schools from the state to the community in 2001. Communityschools, working through the school management committeeconsisting of parents and influential local citizens, were given de juredecision-making powers over various staffing and fiscal issues. In addition,community-managed schools were given more untied blockgrants so that the management committee had more control over(continued next page)
222 | <strong>Making</strong> <strong>Schools</strong> <strong>Work</strong>BOX 5.2 continueddiscretionary spending. An evaluation of SBM in this context exploiteda “randomized encouragement” design in which an advocacy campaignby a nongovernmental organization (NGO) encouraged a randomsubset of schools and school management committees to take defacto management control (Chaudhury and Parajuli 2010).Short-run impact estimates suggest that the devolution of managementresponsibilities to communities had significant impacts on certainschooling outcomes related to access and equity. The impact onschool governance measures was mixed, with important regional variationin outcomes. There is no evidence yet that these changes wereassociated with improvements in learning outcomes.Pakistan: NGO-Managed <strong>Schools</strong>A reform in Pakistan involved hiring an NGO to manage schools togetherwith the school councils (Das 2008). Each school received agrant on the order of $4,000 for school needs. In addition to assistingwith managing these funds, the NGO was allowed to transfer teachers.The program ran from 2004 to 2008, but the randomized controlledevaluation has yet to show any effects on student enrollment, teacherabsenteeism, or an index of facilities (infrastructure). It may be possiblethat the effects of school council management will only be in thelong term. In addition, the results are weakened because the originalrandomization was not fully upheld, and the analysis uses an intent-totreatapproach. Intriguingly, the results showed that the proportion ofcouncil members whose children are students in the school significantlyincreased in treatment schools.a. This randomized trial built on the retrospective evaluation conducted earlieron AGE schools (Gertler, Patrinos, and Rubio-Codina 2006).and parents with real tasks) and the building of capacity to carry out thosetasks. Importantly, the transfer of authority should be accompanied byresources. Two critical elements—information and teacher incentives—relate to the other topics touched on in this book.For SBM to work beyond merely engendering participation, as inmeetings of the parent association, information is vital. When SBM requiresschool councils to develop school development plans, those plans have ahigher likelihood of success. When goals are related to student well-beingand academic success and can be based on accurate and timely informationon schooling outcomes, this helps channel efforts. This information may betest scores but can be broader than that, and all can be benchmarked againstother schools—either locally or nationally.
<strong>Making</strong> <strong>Schools</strong> <strong>Work</strong> through Accountability Reforms | 223Access to relevant information, adequate resources, clear goals and pathways,and a participatory council are some of the main ingredients of a successfulSBM initiative. Weak forms of SBM that do not involve personneldecisions will likely not suffice to affect learning outcomes. The programsthat can significantly improve outcomes, especially for the poorest andmost-lagging schools, empower parents and councils to affect personneldecisions. A critical aspect of SBM effectiveness is management of teachers,for example, the ability to establish incentives and to fire nonperformingteachers.SBM is, of course, not without controversy. Decentralization may notnecessarily give more power to the general public because the powerdevolved by the reform is susceptible to being captured by elites. Localcontrol over resource allocation or decision making may not yield thedesired outcomes for three main reasons (Bardhan 2002; Bardhan andMookherjee 2000, 2005):• Local democracy and political accountability are often weak in developingcountries and can lead to elite capture.• In more traditional and rural areas with a history of feudalism, sometimesthe poor or minorities feel the need for a strong central authorityto ensure that they are able to access services as well as more powerfullocal citizens can. A related issue may be the lack of a culture ofaccountability within communities, meaning that no one would thinkto question any actions taken by the group running the school (DeGrauwe 2005).• Challenges often arise in the implementation of SBM reforms that canundermine their potential.Teacher Contracting and Pay-for-Performance StrategiesContract Teacher Policy ReformsThe newest wave of evidence on the short-term impacts of contract teacherreforms in low-income developing countries is fairly consistent: the use ofcontract teachers can strengthen the scope for local monitoring of teacherperformance by parents and school councils, which results in higher teachereffort, with positive impacts on student learning. In contexts where thesupply of adequately trained teachers is not constrained, these positive outcomescan be achieved at sometimes dramatically lower costs per student.The evidence supports a theory of action in which the positive impactsof contract teacher reforms hinge on the de facto effectiveness of localmonitoring (see box 5.3). Where decisions about the hiring and retentionof contract teachers are made higher up the administrative chain and not
224 | <strong>Making</strong> <strong>Schools</strong> <strong>Work</strong>BOX 5.3New Evidence on Contract TeachersIndia: Contract Teachers in Andhra PradeshAs part of a broader study of teacher incentives, contract teacherswere hired in 2005 for a randomly selected set of schools across thestate of Andhra Pradesh (Muralidharan and Sundararaman 2010a). Ingeneral, the contract teachers were less educated than the civil serviceteachers working in the same schools and also tended to be younger,female, and more likely to live in the local villages. The contract teachers’pay was less than one-fifth of the civil service wage.Despite the lower pay, the researchers found contract teachers absentsignificantly less—16 percent of the time, compared with 27 percentfor civil service teachers. Contract teachers were also more likelyto be found teaching during spot visits by observers. As theory wouldpredict, contract teachers with lower absence rates and higher rates ofobserved teaching activity in the first year of their contract also hadhigher rates of contract renewal for the second year.Student test scores support the hypothesis that this higher effort bycontract teachers plus the reduction in class size that their recruitmentpermitted had positive effects on student learning. After two years,students in schools assigned a contract teacher scored a 0.15 standarddeviation higher in math and a 0.13 standard deviation higher in languagethan same-grade students in schools without contract teachers.In short, less-educated teachers who were paid a small fraction of thecivil service wage in Andhra Pradesh appeared to be more accountablefor performance than their civil service counterparts, in terms ofattendance and teaching activity, and helped boost overall school outcomes.The researchers concluded that, in this context of very low accountability,contract teachers were five times more cost-effectivethan regular teachers in producing education results.India: Balsakhi Contract TeachersIn two cities in India (Mumbai and Vadodara), the Balsakhi (“child’sfriend”) program paid locally recruited young women with a secondaryschool education (grade 10) roughly 10 percent of a regular civil serviceteacher’s salary to teach basic literacy and numeracy skills tothird- and fourth-grade children who needed remedial support. Thetargeted children left the classroom in the afternoon and received tutoringfor two hours per day. The program was highly effective inboosting the learning of these children, to the extent that average(continued next page)
<strong>Making</strong> <strong>Schools</strong> <strong>Work</strong> through Accountability Reforms | 225BOX 5.3 continuedmath and reading test scores in the treatment schools increased by a0.14 standard deviation in the first year and a 0.28 standard deviationafter two years over the averages in the comparison schools (Banerjeeand others 2007). Most of the gains were attributable to increases inlearning by the children who had received remedial tutoring. Even oneyear after the program ended, the average student in the Balsakhischools had test scores that were a 0.1 standard deviation higher thanthe average student in comparison schools.The program was not designed as a “head-to-head” trial of thecost-effectiveness of contract teachers vs. civil service teachers. In additionto their different contract status and pay levels, the Balsakhiteachers had different curriculum goals, teaching hours, and class sizesfrom those of the regular schools. Due to the design of the study,intermediate variables of teacher effort, such as absence rates and useof instructional time, were not monitored. However, the large learninggains produced by teachers contracted at one-tenth of the prevailingcivil service teacher salary provides evidence that, at least in somecontexts, contract teachers’ lower average qualifications, lower pay,and lack of long-term contract security do not impede effective teachingperformance.Kenya: Contract TeachersThe Extra Teacher Program (ETP) in western Kenya provided fundingto a randomly selected set of schools to allow their school committeesto hire a local contract teacher (Duflo, Dupas, and Kremer 2008). Unlikethe India cases, these contract teachers had the same academicqualifications as civil service teachers. However, they were paid lessthan one-third of the civil service pay and could be fired by the schoolcommittee after each annual performance review. Researchers foundcontract teachers significantly more likely to be in class and teachingduring unannounced visits: 74 percent of the time versus 59 percent ofthe time for civil service teachers in comparison schools. The attendancerecord of contract teachers was even more impressive whencompared to civil service teachers in their own schools, whose absencerates increased when the contract teachers began working. However,training programs for school committees in how to monitor teacherattendance and performance mitigated the “shirking” behavior of civilservice teachers over time.Students randomly assigned to contract teachers under the ETPprogram scored a 0.21 standard deviation higher on reading andmath tests than their schoolmates assigned to civil service teachers,(continued next page)
226 | <strong>Making</strong> <strong>Schools</strong> <strong>Work</strong>BOX 5.3 continuedsuggesting higher—or at least more effective—teaching effort by thecontract teachers despite their lower salaries. However, the fact thatcontract teachers were assigned to a single class of students andstayed with those students for two successive years (unlike the typicalpattern of a different teacher each year) may have played a roleas well.As discussed in the previous section on SBM, the Kenya researchersalso found that training school committees on how to manage the hiring,performance monitoring, and renewal decisions for contractteachers was correlated with positive long-term impacts of the program.At the three-year follow-up, only students of contract teachersin schools whose committees had been trained (“SBM schools”) performedsignificantly better than students in control schools. The SBMschools were also more likely to use funding from the community toretain the contract teacher once program funding ended; 43 percentof them did so, compared with 34 percent of non-SBM schools.Other Contract Teacher StudiesMali, Niger, and Togo. Contract teachers are widely used in West Africa.Bourdon, Frölich, and Michaelowa (2007) compared the experiencesin Mali, Niger, and Togo, updating an earlier study of Togo by Vegasand De Laat (2003). They found that the presence of a contract teacherwas positively correlated with the learning performance of low-abilitystudents in the early grades but negatively correlated with the resultsof high-ability students in the upper grades.Peru. A study in a rural province in Peru carried out by Alcazar andothers (2006) is the only study to date to document higher absencerates for contract teachers than for civil service teachers, by 12–13 percentagepoints. The authors speculate that the lower salaries of contractteachers, in a context of weak local supervision, are a major reasonfor these teachers’ apparently lower effort. Unfortunately, thestudy does not include any data on the student learning performanceof contract and civil service teachers.India: Madhya Pradesh and Uttar Pradesh. In two additional statesin India that made extensive use of contract teachers—Madhya Pradeshand Uttar Pradesh—Goyal and Pandey (2009) carried out a nonexperimentalanalysis of the relative performance of contract and civilservice teachers. In these states, unlike Andhra Pradesh, contractteachers typically were more educated than regular teachers, althoughthey were much younger, had much less teaching experience, and weremore likely to come from the local community. Consistent with the(continued next page)
<strong>Making</strong> <strong>Schools</strong> <strong>Work</strong> through Accountability Reforms | 227BOX 5.3 continuedresults of the experimental studies in India cited previously, the contractteachers working in Madhya Pradesh and Uttar Pradesh publicschools consistently demonstrated higher effort than regular teachers,whether measured as daily attendance or as the likelihood of beingactively engaged in teaching during an unannounced visit. This highereffort was also correlated with significantly better learning outcomesfor their students on language and math tests, after controlling forother school, teacher, and student characteristics.However, the researchers followed the performance of the contractteachers over two years and noted that effort levels (attendance ratesand likelihood of being found teaching) declined for teachers in theirsecond contract period in both states—and, in Uttar Pradesh, becameindistinguishable from the effort levels of regular teachers (Goyal andPandey 2009). They speculated that very weak de facto oversight byschool-level committees significantly weakened contract teachers’ incentivesto perform. Fewer than 6 percent of school committee memberswere even aware that selection and oversight of contract teacherswas one of their core responsibilities.at the school level, or where local school committees are not equipped orempowered to put “teeth” into annual renewal decisions, impacts havebeen lower or break down relatively quickly.The current evidence base does not answer some key questions, however.Although contract teachers almost always work for lower salariesthan their civil service counterparts do, the cost-effectiveness of a contractteacher policy is likely to depend on country characteristics and the level ofeducation involved. All of the cases cited involved contract teachers at theprimary level, where the supply of potential teachers with adequate capacityis not as likely to be constrained as at the secondary level or for specialtysubjects such as sciences and math. It cannot be assumed that in all contextsit will be possible to recruit adequately qualified teachers at lower salaries.There are also questions about the sustainability of this policy over time.Contract teachers may accept lower salaries and insecure tenure becausethey are queuing for regular positions. In the Kenya Extra Teacher Program(further described in box 5.3), 32 percent of the contract teacherssubsequently obtained relatively highly paid civil service positions. In WestAfrican countries, where contract teachers have reached a critical mass,teachers’ unions have made the extension of job stability to contract teachersa political goal. Duflo, Dupas, and Kremer (2008), among other
228 | <strong>Making</strong> <strong>Schools</strong> <strong>Work</strong>researchers, caution against assuming that average teacher performancewould match the performance of contract teachers if all teachers wereplaced on alternative tenure contracts. Nonetheless, in developing countriesstruggling to achieve universal access to primary education at sustainablefiscal costs, the evidence to date clearly supports the use of contractteachers as a cost-effective policy.Pay-for-Performance ReformsThe most recent and robust developing-country evidence on pay-forperformanceprograms suggests that bonus-pay incentives can improvelearning outcomes, at least in the contexts studied most carefully to date(see box 5.4). This evidence is in contrast to the more mixed, but less rigorous,developing-country evidence that existed just five years ago—and insharp contrast to the most recent evaluation evidence from U.S. programs.In carefully conducted randomized trials of relatively generous bonusesaimed at both individual teachers (Nashville public schools) and schools(group-based bonuses in New York City public schools), researchers havefailed to find any impact on student learning outcomes.BOX 5.4New Evidence on Pay for PerformanceIndia: Andhra PradeshAn ongoing randomized study in the Indian state of Andhra Pradeshoffers the most persuasive evidence to date of the potential forperformance-based pay to motivate more effective teacher performancein a developing-country setting. In a statewide representativesample of 500 schools, Muralidharan and Sundararaman (2009) measuredthe relative impacts of both individual and group (school-based)teacher bonuses compared with other equivalent-cost input strategies(such as books, materials, and infrastructure improvements) and withcomparison schools that received no interventions. Bonuses werelinked to improvements in student learning over the course of a schoolyear, and the average bonus was around 35 percent of a typical teacher’smonthly salary.(continued next page)
<strong>Making</strong> <strong>Schools</strong> <strong>Work</strong> through Accountability Reforms | 229BOX 5.4 continuedBy the end of the first year, students in both the individual andgroup-bonus treatment schools performed significantly better thanstudents in comparison schools. By the end of two years, researchersalso observed differentiated results between the individual- and groupincentivesschools, with the former registering an average increase instudent test scores of a 0.27 standard deviation compared with a 0.16standard deviation in group-incentive schools. The input-only strategiesalso yielded positive effects when compared with control schools,but their magnitude (a 0.08 standard deviation) was substantially lowerthan in incentive schools. Both the group and individual bonus programswere more cost-effective than the input programs and wereroughly equal to each other in cost-effectiveness. Although the groupbonus had a weaker impact on student learning results, this was offsetby its lower costs.Qualitative analysis suggests that the main mechanisms for theincentive effects was not increased teacher attendance but greater,and more effective, teaching effort conditional on being present.In particular, teachers in incentive schools were significantly morelikely to have assigned homework and classwork, conducted extraclasses beyond regular school hours, given practice tests, and paidspecial attention to weaker children. The researchers also found thatproviding teachers with more detailed feedback on their students’performance increased the power of bonus incentives to raise testscores, while the same feedback provided to teachers in comparisonschools had no effect. This suggests positive interactions betweenincentives and input and the possibility for incentives also toraise the effectiveness of other school inputs such as feedback reportsor teacher capacity building (Muralidharan and Sundararaman2010b).Israel: Individual Teacher Incentive ExperimentLavy (2009) evaluated a tournament-type bonus program in Israelthat ranked teachers on the basis of value-added contributions totheir students’ test scores on high school matriculation exams. Relativeto other incentive programs, the bonuses for this program werelarge (up to several months of salary). The program had positive effectson student achievement by increasing the test-taking rateamong high school seniors as well as the pass rate and test scores inmath and English. However, the experiment was maintained for onlyone school year.(continued next page)
230 | <strong>Making</strong> <strong>Schools</strong> <strong>Work</strong>BOX 5.4 continuedKenya: ICS Teacher Incentive ProgramGlewwe, Ilias, and Kremer (2010) evaluated a randomized program inKenya that provided a group-based incentive to teachers (equivalentto about 40 percent of a month’s salary) based on improvements instudent learning. By the second year, students in the bonus schoolsscored an average of a 0.14 standard deviation higher on the examsthan did students in the comparison schools. However, the gains provedshort-lived. One year after the program ended, there were no significantdifferences in test performance across the schools. The researchersspeculated that teachers’ strategies for achieving the bonus focusedon short-run efforts to boost performance on the governmenttests, such as after-school tutoring in test-taking techniques, ratherthan on changes in their core pedagogy or effort levels that might havea higher chance of promoting long-term learning. Other puzzling findingswere that teacher absence rates did not decline from the baselinelevel of 20 percent of school days missed, and classroom observationsdid not detect any changes in homework assigned or use of learningmaterials.Brazil (Pernambuco): Teacher Bonus ProgramOngoing evaluations are studying recently adopted teacher bonusprograms in four different states in Brazil and in the municipality of Riode Janeiro (Ferraz and Bruns, forthcoming). All of the programs areschool-based (group) incentives, and the typical bonus size is fairlylarge (one to two months of salary). As the programs are implementedsystemwide, the evaluations use regression discontinuity designs tocompare results for similar schools that face stronger or weaker performanceincentives as a result of the rules for setting individualschools’ performance targets. Targets are for value-added studentlearning improvements in math and language and student grade progression.In Pernambuco (the state with the most advanced results to date) inthe first year, schools with more ambitious targets made significantlylarger test score gains than similarly performing comparison schoolsthat had been assigned lower targets (a 0.31 standard deviation higherin language and a 0.15 standard deviation higher in math). In the secondyear, researchers also found that—controlling for schools’ 2008 testresults and other school characteristics—schools that barely missedthe threshold for achieving the bonus in 2008 (at least 50 percent(continued next page)
<strong>Making</strong> <strong>Schools</strong> <strong>Work</strong> through Accountability Reforms | 231BOX 5.4 continuedachievement of the school’s target) improved more than schools thatbarely achieved it. It appears that both higher targets and barely missingthe bonus created incentives that had a positive effect on schools’motivation and performance.In contrast to some of the studies in India and Kenya, classroomobservations in a sample of over 200 of Pernambuco’s 900-plusschools found significant differences in teacher practice that werehighly correlated with schools’ likelihood of achieving the bonus(Bruns and others 2010). Teachers in schools that went on to earn thebonus registered significantly less time off-task and were able to devotethis time to instruction; learning activities absorbed 62 percentof total class time in these schools compared with 53 percent of classtime in schools that did not earn the bonus. While teachers were offtask12 percent of the time across the whole sample (either out of theclassroom due to late arrival or early departure or engaged in socialinteraction with students or colleagues), such time loss was muchmore significant in the schools that did not subsequently achieve thebonus (17 percent of total class time) than in those that did achievethe bonus (10 percent of total class time). There is also evidence ofmore intensive use of learning materials and higher rates of studentengagement in the schools that subsequently earned the bonus.Israel: Ministry of Education School Performance ProgramLavy (2002) examined a tournament-type program implemented in1995 that provided a group incentive to schools for progress in reducingstudent dropout rates and improving academic achievement. Usinga regression discontinuity approach, Lavy’s results suggested thatmonetary incentives had some effect in the first year of implementation(mainly in religious schools) and by the second year caused significantgains in student outcomes in all schools. The program led toimprovements in the number of credit units taken by students andaverage test scores in matriculation exams. In addition, more studentsgained matriculation certificates, and schools reduced dropout ratesin the transition from middle school (grades 7–9) to high school(grades 10–12).Comparing the incentive program with a “resource” intervention(such as direct provision of teacher training) of equivalent overall cost,Lavy found that the resource program produced much smaller improvementsin student performance; the school bonus program wasmore cost-effective.(continued next page)
232 | <strong>Making</strong> <strong>Schools</strong> <strong>Work</strong>BOX 5.4 continuedChile: National System for Performance Evaluation of SubsidizedEducational Establishments (SNED)Chile’s SNED program offers group bonuses to schools based on acombination of student learning results and other indicators of schooland teacher performance. It is conducted as a tournament every twoyears; the bonus represents an annual increase of around 70 percentof one month’s salary, and approximately 25 percent of schools inChile typically receive the award. The most recent evaluation of SNED(Rau and Contreras, 2009) concluded that the program’s introductionin 1996 stimulated an overall increase in student learning outcomesof approximately a 0.12 standard deviation. The researchersalso explored the effects of winning the SNED award on subsequentschool performance and found, over six rounds of SNED awards, noconsistent evidence that schools gaining the award performed betterin the next period.In contrast to the above programs, which rewarded schools andteachers for improving student outcomes, two programs—in Kenyaand India—rewarded teachers for attendance.Kenya: Preschool Teacher Bonus ProgramKremer and others (2001) evaluated a program that allowed schoolheadmasters in rural Kenya to give individual teachers bonus pay forregular attendance. The size of the bonus was relatively large: up tothree months’ salary for no absences. They found that the program hadno impact on actual teacher attendance (measured by unannouncedrandom visits); absence rates remained at 29 percent. There was alsono evidence of change in teachers’ pedagogy, pupil attendance, or pupiltest scores, although it could be argued that both pedagogy andtest performance at the preschool level may be noisy measures. Researchersfound that headmasters simply distributed the full bonus toall teachers regardless of actual attendance. Even though there was afinancial incentive for headmasters to hold back part of the funding(any funds not allocated to teacher bonuses reverted to the schools’general fund), they chose not to do so. School headmasters clearlyfound it difficult to play a strict monitoring role at the school level.India: Rajasthan “Camera” ProgramA program in rural India evaluated by Duflo, Hanna, and Ryan (2010)produced very different results. In randomly selected rural, NGO-run(continued next page)
<strong>Making</strong> <strong>Schools</strong> <strong>Work</strong> through Accountability Reforms | 233BOX 5.4 continuedschools, a schedule of monthly teacher bonuses and fines based onattendance was monitored in a creative way with daily date- and timestampedphotographs. A student was asked to photograph the teacherand the children in the class at the beginning and end of each schoolday. Teachers’ pay was a function of the number of “valid schooldays”—in which the school was open for at least five hours and at leasteight students appeared in each picture. Unannounced visits to the“camera” and comparison schools measured actual absence rates andobserved teacher activity.The maximum bonus for a teacher with no days absent was approximately25 percent of a month’s salary. The program over threeyears had a dramatic effect on teacher absenteeism, which fell from42 percent to 23 percent in the treatment schools. While there wereno observed changes in teachers’ classroom behavior and pedagogy(other than greater presence), student test scores rose by a 0.17 standarddeviation, and graduation rates to the next level of educationalso rose significantly. While students’ attendance rates (conditionalon the school being open) did not increase, there was a significantincrease in the total amount of time that children in treatment schoolsspent in classes because schools were open, on average, 2.7 moredays per month.Duflo, Hanna, and Ryan (2010) note that the intervention was quitecost-effective. As the base salary for teachers in the treatment andcomparison schools was the same, the incremental costs of the programconsisted of the bonus, the cameras, and monitoring—totalingroughly $6 per child per year. In terms of raising test scores, the researchersestimate the per-child cost of a 0.10 standard deviation increasein test scores was only $3.58.In no study to date have long-term effects of performance-based paybeen analyzed. And both theory and experience with performance-basedrewards in other sectors clearly indicate that the scope for perverse behaviors(such as gaming, cheating, or teaching to the test) can rise with time assystem actors become more familiar with the rules of the game. Asperformance-based pay becomes increasingly—and logically—linked to studenttest results in many countries, the validity of those tests and thelegitimacy of their application become centrally important challenges foreducation systems.Still, in a context of persistently low education outcomes and widespreadevidence of “accountability failures” on the part of teachers and other
234 | <strong>Making</strong> <strong>Schools</strong> <strong>Work</strong>education system actors, the evidence that pay-for-performance programsand the use of contract teachers can raise student outcomes in developingcountrycontexts is important. But the contrasting U.S. evidence suggeststhat it is important to note that these developing-country contexts are characterizedby• Weak systems for performance monitoring and accountability—evidenced byrelatively high teacher absence rates, low teacher dismissal rates, andlow student learning performance• Relatively weak teacher professionalism—evidenced by low standards forentry• Relatively large bonus size—for example, an annual bonus equaling 30–300percent of a month’s salary• Focused performance metrics—emphasis on a small number of key results,usually school-level improvements in student learning measured onannual standardized tests or relatively easily measured teacher “inputs”such as monthly attendance• “Fair” performance metrics—rewards to schools on a value-added basis(for progress relative to their starting points) or compared with schoolswith similar geographic and student socioeconomic conditions, not forabsolute levels of performance• Rewards clearly linked to prior period results—annual bonuses directly basedon test scores or other results for the previous school year, or monthlybonuses for input measures monitored over the prior month, such asteacher attendanceIn these contexts, the most recent developing-country bonus programsappear to “work” in the sense that student learning outcomesimprove in the presence of the bonus. In the most careful studies, the sizeof the effect—a 0.19–0.27 standard deviation increase in average studentlearning—is impressively large compared with the effects typically measuredfor other types of education programs.The sole developing-country evaluation to date designed as a “headto-head”comparison of individual bonus pay (that is, rewarding eachteacher for his or her own classroom’s average learning progress over thecourse of a school year) with group-based bonus pay (rewarding schoolsfor their average learning improvement) showed similar results in thefirst year but a stronger effect on learning outcomes from the individualbonus by the second year. The impact measured in that program, in ruralAndhra Pradesh, India—a 0.27 standard deviation increase in languagescores—remains the largest reported causal impact from an education
<strong>Making</strong> <strong>Schools</strong> <strong>Work</strong> through Accountability Reforms | 235pay-for-performance program. However, the group bonus alternativeproved to be more cost-effective because the average awards were smaller.In general, school systems will likely find group bonus pay more technicallyfeasible than individual bonus pay, which requires the ability to teststudents in every grade, subject, and classroom. The latter presents significanttechnical challenges and costs.Our understanding of the mechanisms through which bonus payimproves student outcomes is still weak. In several evaluations, at least overthe short term, the bonus program did not induce any reduction in teacherabsence rates, which is one of the most obvious ways teachers can increasetheir effort in response to an incentive. These teachers did nonetheless producestatistically significant improvements in their students’ learning outcomesrelative to comparison groups of teachers who were not offered abonus, but the evidence suggests that a key channel was out-of-schooltutoring, which is not a wholly desirable effect.In Brazil, where bonus programs have been implemented systemwide,it is not possible to estimate how the introduction of a bonus per se affectsschools’ performance. But detailed classroom observations in Brazil arehelping to elucidate the pathways through which bonus incentives canchange teacher behavior and the kinds of changes that are most effective inraising learning. There is clear evidence of more time spent on instructionby teachers in schools that subsequently earned the bonus, with less timelost by teachers due to late arrival or early departure. There is also evidenceof more intensive use of learning materials and higher rates of studentengagement in the successful schools.Looking across pay-for-performance programs, several features drawnfrom classical principal-agent theory appear important for the design ofeffective incentives. These include (1) the controllability of the specific performancemeasure(s) being incentivized, from the standpoint of individualteachers; (2) the predictability or “coverage” of the incentive (that is, whatshare of those eligible will achieve it); and (3) bonus size.Controllability is, in turn, affected by two dimensions—“noise” in theperformance measure and “locality” (whether the bonus is an individual orgroup [school]-based incentive). For group incentives, school size appearsimportant. If a school has a large number of teachers, yet the bonus is basedon results produced by only a handful of its teachers (typically, those teachingsubjects and grades that are subjected to annual testing), there is roomfor free-riding (some teachers coasting on the work of the others).The experience to date supports a hypothesis that core design featuressuch as controllability and predictability affect the strength of the incentivesin a pay-for-performance program. Particularly interesting from a policystandpoint is that these features appear to be complementary to the financialsize of the bonus. In other words, bonus programs that pay attention to
236 | <strong>Making</strong> <strong>Schools</strong> <strong>Work</strong>the design of performance measures so that these are perceived to reflectteachers’ work fairly (for example, student test scores for schools areadjusted for socioeconomic differences) may—all other things beingequal—achieve larger impacts. Much longer-term and deeper analysis ofexperience with these and other education pay-for-performance programsis needed for any conclusive observations, but the experience to date atleast suggests the usefulness of considering these three core elements systematicallyin the design of new programs: controllability, predictability orcoverage, and bonus size.In conclusion, a growing number of school systems across the developingworld are adopting two specific reforms aimed at strengthening therewards and sanctions for teacher performance: the use of contract teachersand bonus pay linked to teacher performance. These programs have differentdesigns, costs, and primary objectives, but all address a deep issue ofweak incentives for performance in education systems across the developingworld. The best-evaluated cases to date show that the design of effectiveincentives presents challenges, and their impacts can vary significantly.But an encouraging number of recent studies show consistently positiveimpacts of incentive reforms on student learning outcomes. The number ofdeveloping-country reform experiences is still small, and most are still verynew. But they offer examples that merit consideration by any educationpolicy maker concerned with raising student learning as well as a frameworkfor the generation of further research evidence on “what works” tomake teachers more accountable for results.Linking Accountability ReformsThe accountability-oriented education reforms reviewed in this book producedimpacts on learning achievement, as measured by test scores, rangingfrom 0 to about 0.3 of a standard deviation. This is consistent with otherassessments of education interventions, which point to a 0.2 standard deviationas a “respectable” impact (Kremer and Holla 2009). As illustrated inchapter 1, however, developing countries are currently far from Organisationfor Economic Co-operation and Development (OECD) average levelson internationally comparable assessments such as the Programme forInternational Student Assessment (PISA) or the Trends in InternationalMathematics and Science Study (TIMSS), with mean scores that are morethan 1 standard deviation lower than the OECD average. Clearly, theshort-run impacts measured in the individual evaluations documentedhere will make only a limited dent in the performance gap. Allowingreforms to solidify, and impacts to accumulate over time (as shown infigure 5.1), may help.
<strong>Making</strong> <strong>Schools</strong> <strong>Work</strong> through Accountability Reforms | 237However, even accumulated “respectable” gains may not be enough toaddress the challenges that developing—and especially the lowest-income—countries are facing. Multiple challenges likely need to be addressed simultaneouslyin a sustained manner. The three approaches to promotingaccountability described here can reinforce one another as well as reinforceother strategies to improve learning outcomes. Some of the evaluationsreviewed here provide insights into those reinforcing effects. For example,information dissemination seems to have enhanced the impact of teachertraining in Liberia. SBM, in the form of trained school committees, enhancedthe impact of locally hired contract teachers in Kenya. Information, in theform of a new national system for monitoring student learning and gradeprogression, has played a critical part in the implementation of teacherincentive reforms in Brazil.Information for AccountabilityInformation about schooling outcomes will likely be at the heart of anyprogram that tries to improve school quality through accountability interventions.Information can come in many forms, and strengthening administrativedata systems—particularly data on outcomes—can potentially laythe foundation for a range of reforms. Because of its public-good nature,information will tend to be underproduced relative to the optimal level,and reaching that level will require subsidies—domestically from governmentsand internationally from donors. Information underpins knowledgeof what the situation is and where more effort is needed; it also providesthe means to monitor progress. Information can be an accountability toolin and of itself, but its role is also broader.The potential for information to strengthen accountability is sensitive toseveral factors. First, of course, is the content and presentation of the information:it needs to be understandable. In addition, while information canhighlight problems and spur action, it is also unsurprising if its impacts arelimited where the scope for decision making is heavily circumscribed. Providinginformation on school quality to actors who lack authority over theallocation or use of inputs will have limited impact.School-Based ManagementSBM can have an impact, but only if it is meaningful, in the sense that itgoes beyond simply socializing parents—generating “participation” withoutauthority. While participation may have intrinsic merits (creating activecitizens, empowering poor and indigenous peoples, promoting democracy,instilling voice, and so on), these merits may have limited power to improveschooling outcomes. SBM initiatives, to matter, need to create effective
238 | <strong>Making</strong> <strong>Schools</strong> <strong>Work</strong>opportunities for school management committees to improve quality—forexample, by increasing their ability to shape adequately resourced schoolimprovement plans.Successful models consistently show that clarity in the role of participation,adequate resources, and capacity building can create positive change.One of the most critical elements, however, is likely to be the ability tooversee teachers. As the Kenya school committee evaluation showed,lower pupil-teacher ratios had little effect on learning without an appropriateincentive framework for teachers.Contract Tenure and Pay-for-Performance ReformsLinking teacher tenure or pay for performance has potential in developingcountrycontexts, where monitoring and performance incentives are generallyweak. The cases presented in this book suggest that, given the rightset of arrangements, teacher incentive reforms can result in increasedteacher effort and improved student learning. When combined with localautonomy—allowing parents to hire teachers on renewable contracts outsidethe civil service system and to influence those teachers’ tenure—theimpacts may be reinforcing.Complementarity of Accountability InterventionsFigure 5.2 illustrates the complementarities of these reforms. Information isa fundamental building block. It signals problems in the education system,serves as an instrument to measure subsequent progress, and can be usedto set goals. On its own, however, it is likely to have limited potential whennot linked to changes in how inputs are allocated. SBM, in turn, offers thepotential to effect change but requires an information base. And even withinformation, the potential impacts of SBM are limited if it does not includeoversight of teachers.Incentives that affect teachers—the most vital and expensive schoolinginput—have the greatest potential to affect student learning, but they alsodepend on information. Student test score data allows teachers to benchmarktheir students’ current performance and to work toward specificimprovement targets. The studies in this book provide evidence that informationprovision can be a critical input to teacher effectiveness and thatits power is also increased in the presence of incentives. For example,teachers who were offered bonus pay in Andhra Pradesh, India, mademore effective use of detailed feedback on their students’ performancethan did teachers not offered a performance incentive. In Pernambuco,Brazil, the teachers given more-ambitious targets for student learninggains produced greater improvements than comparable teachers given
<strong>Making</strong> <strong>Schools</strong> <strong>Work</strong> through Accountability Reforms | 239Figure 5.2 Complementarities in Accountability Reformschool-basedmanagementteacherincentivesinformationSource: Authors.less-ambitious targets. This research base is still nascent, but it points toimportant interactions.The complementarities between information for accountability, SBM,and teacher incentive reforms mirror a broader set of complementarities—those embodied in the accountability framework first described in chapter 1.Reforms that aim only at affecting citizen voice may be ineffective atimproving outcomes if the compact between policy makers and front-lineservice providers is broken. Similarly, improvements to the compact mayhave perverse consequences if the priorities of citizens—or subsets ofcitizens such as the poor, for example—are not reflected in policy priorities.External Validity: From Evaluated Programsto National ReformsThe Perils of Scaling UpThis synthesis has drawn from a variety of types of impact evaluations.Some were undertaken in relatively small sets of schools (sometimes lessthan 100) under tightly monitored conditions—for example, report cardsin Pakistan, the training of school committees in Kenya, and teacher incentivesin Israel. Others dealt with reforms on a systemwide scale—for example,SBM reforms in Mexico, information reforms in Chile, and teacherincentive reforms in Brazil. All impact evaluations, however, raise the issueof external validity: to what extent are the study findings relevant for other
240 | <strong>Making</strong> <strong>Schools</strong> <strong>Work</strong>contexts or countries or for programs that are implemented at substantiallylarger—or smaller—scale?The studies included in this volume all meet a fairly high bar for internalvalidity: they used evaluation methods that credibly established thatmeasured impacts were indeed caused by the program. However, as wenoted in chapter 1, while internal validity is necessary for external validity,it is not sufficient. Establishing external validity allows us to say thatresults are generalizable and replicable and to project how the size of theimpacts measured in these evaluations would carry over to other samplesor populations.Any single impact evaluation raises questions of external validity. Combiningtheory with meta-analysis—or the systematic review of a significantbody of comparable impact evaluations—is the only true strategy for establishingexternal validity over time. While our review takes careful stock ofthe current state of knowledge on these types of education accountabilityreforms, the number and range of cases are still too small to support conclusivemeta-analysis, as we have emphasized throughout.One concern is the limited geographic scope of the evidence to date. Wehave rigorous impact studies from just 11 countries, and a disproportionateshare of the most compelling evidence comes from a single country: India.Second, most of the studies reviewed (15 of 22 cases) are pilot programsimplemented under careful supervision by international research teams. Ina number of cases, the programs were implemented in schools run by localNGOs rather than in regular public sector schools. The reforms thereforeplayed out within unique administrative arrangements that may not reflectthe broader public sector reality in those countries, let alone in others.Third, particularly in the case of reforms aimed at strengthening accountability,an inherently important contextual issue is the local political situation.In different countries—and even across different states in countriessuch as Brazil or India—the relative power of principals, teachers, and parentsand community members varies. This is an especially important factorfor programs that aim to change the power relations among these stakeholders,as in SBM programs. A program to make teachers more accountablefor performance may be successful in one country because teachers’unions are relatively weak relative to other stakeholders. Where teachersare more organized and politically active, the same program might be lesssuccessful or even impossible to implement. Particularly for accountabilityorientedreforms, understanding the local political context is critical.A fourth variable that can affect external validity is the baseline qualityof teachers and students—the objects of change for most programs. Evenif a program improves learning outcomes by 0.20 of a standard deviationon average in one context, it does not follow that it will have the sameimpact if it is targeted to students from only the bottom 20 percent of
<strong>Making</strong> <strong>Schools</strong> <strong>Work</strong> through Accountability Reforms | 241performers—or the top 20 percent. The “average treatment effect” of aprogram may be a poor guide to the impact it will have on different categoriesof students, different groups of teachers, or different sets ofschools. Is it easier to improve student performance for weak students?Do pay-for-performance targets motivate teachers to focus on the betterstudents or “bubble students” (those at the threshold for incentivized performance)rather than on others? Will SBM programs have weakerimpacts in poor communities than in others? There is much still to learnabout how programs differentially affect different groups of system actorsand beneficiaries.Finally, taking any reform to new contexts or to scale within a givencontext generates questions of general versus partial equilibrium effects.From a political economy standpoint, as we discuss in the next section,experimentation on a pilot scale versus moving to statewide or nationalimplementation pose very different challenges. But even on a technicallevel, since impact evaluations typically compare the difference betweentreatment and comparison populations in a given localized area, they arenot able to pick up general equilibrium effects (Duflo, Glennerster, andKremer 2008). These effects may be particularly important for scaling up aprogram. A pilot in one region of a country may work well, but it might notbe possible—for technical, human capacity, or financial reasons—to replicateit on a large scale and achieve the same results. From a political economystandpoint, opponents of reform may not object to a pilot on a smallscale but would mobilize against national implementation of the program ifit threatened their interests.One way to deal with these replication or generalization issues is topromote systematic experimentation with successful interventions at progressivelylarger scale. That is, if a small pilot works in one region of acountry, then expansion would take it to the next administrative level (say,from a municipal pilot to a regional trial) before considering nationalexpansion. Similarly, while the evaluation of national or statewide programsin Mexico or Brazil may support a judgment of their effectiveness at scalein those settings, the recommendation for other countries might still be toadapt the programs and trial them on a smaller scale first.The generation of solid evidence on the replicability and impacts ofaccountability reforms and other important interventions in educationwould be greatly facilitated by more comprehensive and consistent crosscountrydata on education outcomes. One of the largest costs in any impactevaluation is the collection of outcome data—above all, on student learning.When countries have standardized national assessments in place to trackstudent learning on a census basis every year or two years, an invaluableplatform for evaluation of all types of education programs is created. Equallyimportant, the costs of conducting good impact evaluations are radically
242 | <strong>Making</strong> <strong>Schools</strong> <strong>Work</strong>lower. Even if national learning assessments are sample-based rather thanuniversally applied, they are a boon to rigorous evaluation.Global efforts to coordinate the definitions and quality of administrativedata (including enrollments, completion, student-teacher ratios, andfinancing) and to expand developing-country participation in globallybenchmarked learning assessments such as PISA, TIMSS, and the Progressin International Reading Literacy Study (PIRLS) will have payoffs forcross-country impact evaluation and our knowledge of what works underdifferent country conditions. While the size of national test samples inmost international assessments may not support evaluation of pilotprograms in all areas, there are interesting examples of countries that specificallyoversample certain populations to support program impact evaluations.Mexico, for example, has oversampled and stratified its sample of15-year-old students in the OECD’s PISA test to make it representative atthe level of its 32 states and make it possible to evaluate state-level implementationof programs (Álvarez, García, and Patrinos 2007). Brazil hasdone the same. Poland has extended the application of PISA also to 16-and 17-year-olds, thus allowing researchers to evaluate the cumulativeimpact of some key reforms over time (Jakubowski and others 2010). Inthe context of its participation in TIMSS, Jordan has oversampled schoolswhere costly information and communication technology programs areapplied to measure the impact of these on learning outcomes (Patrinosand others, forthcoming).Costs and Cost-EffectivenessA key reason why impact evaluations are important is that they are criticalinputs into cost-effectiveness analysis, or the comparison of how muchalternative strategies cost to achieve the same degree of education improvement.For education policy makers and the development agencies that supportthem, the crucial question is not necessarily whether an intervention“works”; it is how well it works in relation to its cost and in comparison withalternative uses of those resources. Despite the centrality of this question,education economics is still far away from answers. As this book has madeclear, the global evidence on programs’ impact (even in areas such as SBM,which has been the subject of decades of policy experimentation across theworld) is still limited by the relatively small number of rigorous studies.A critical constraint to the cost-effectiveness analysis of alternative interventionsis the lack of comparable outcome measures. While it is meaningfulto compare a percentage-point increase in school enrollment or completion,an improvement of 1 standard deviation in a particular test is notnecessarily equivalent to an increase of 1 standard deviation in anothertest. 1 Therefore, a simple comparison of “dollars per standard deviation of
<strong>Making</strong> <strong>Schools</strong> <strong>Work</strong> through Accountability Reforms | 243test score increase” across different evaluations is not necessarily meaningful.To the extent that evaluations use internationally benchmarked tests,or apply tests whose scale can be anchored to those of an internationallybenchmarked test (as was done in Brazil and Mexico), this limitation can beovercome. But doing this can be logistically difficult and technicallydemanding. This calls for caution in comparing learning impacts acrossevaluations.Even if it were possible to find a common outcome metric across evaluations,few studies track program implementation costs carefully and comprehensivelyenough to support the cost side of a full cost-effectivenessanalysis. But even without good data, we can recognize that average implementationcosts vary considerably across the three types of reforms analyzedin this book. Information interventions are likely the cheapest toimplement—especially if they can draw from existing data collection systems.Those systems can be costly, but they serve multiple purposes. Ifinformation dissemination is accompanied by effective “socialization” ofthe results, costs also rise. Two of the studies reviewed attempted to benchmarkthe cost-effectiveness of the intervention internally. The Pakistanreport cards study found the cost of the intervention roughly equal to thetotal reduction in school fees that it generated. The three-state study inIndia showed that the salary equivalent of the increase in teacher attendancewas orders of magnitude greater than the cost of the informationprogram.SBM interventions are also relatively low-cost to implement—with mostof the costs associated with one-time training and the dissemination ofinformation. Costs can be higher if programs are tailored to the specificneeds of dispersed rural populations, indigenous groups, illiterate parents,or other groups with special communications needs. Nevertheless, the ruralSBM program in Mexico is estimated to cost about $6.50 per student—including both the training and grants allocated to parent associations.Compared with the per-student cost of schooling (estimated at over $800 in2006), this is low (Patrinos 2009). The costs are also low compared withother potential spending on alternative classroom inputs in these schools,such as computers ($500 per student, 10 computers per class), teacher salaryincreases ($240 per student), or annual school building costs ($160 perstudent). Only the implementation of student assessments has a similarunit cost, at $6 per student (Patrinos 2009). However, because SBM involvesparent participation—and therefore time—a full cost accounting wouldinclude the estimated opportunity cost of parents’ time.Contract teachers typically earn lower salaries than public sector teachers.Given clear research evidence that they can produce student learningimprovements on par with regular teachers, they offer scope for net savingsin public education expenditure. The political economy issues of sustained
244 | <strong>Making</strong> <strong>Schools</strong> <strong>Work</strong>use of contract teachers must figure into such cost-effectiveness analysis,too, however—as discussed in chapter 4 and in the next section of thischapter. Political pressure to regularize contract teachers (after a net expansionof the teaching force) would raise overall education costs and wipe outefficiency gains.Teacher bonus incentives, on the other hand, are inherently costly. Evenif average awards are relatively small and relatively few schools or teachersachieve them, there is a net payroll cost that must be exceeded by the gainin desired outcomes for the program to be cost-effective. The cases reviewedin this book had annual bonuses ranging from 30 percent to 300 percent ofa month’s salary. At the high end of this range, programs are undeniablycostly to implement on a broad scale.However, in Brazil and many other developing counties, teachers’salaries are low in relation to other sectors of the economy, and there isevidence this is constraining the education system’s ability to attractadequate talent. In such contexts, the counterfactual policy to a teacherbonus program might well be across-the-board wage increases. Thesecould be as or more expensive than a bonus program and fail to createincentives for better performance. Indeed, research in the U.S. contextsuggests that the compression of teacher pay scales over time (eliminatingdifferential rewards for performance) was the most important driverof high-ability women out of the teaching profession (Hoxby and Leigh2004).Therefore, although teacher bonus programs are costly, they may bemore cost-effective than alternative wage policies. But another dimensionto the cost-effectiveness of pay-for-performance programs, which is difficultto assess on current evidence, is the cost of distortions that may arise inthe medium to long term, such as attempts to game the system. These distortionscould be costly to overcome—for example, requiring increasinglyelaborate efforts to protect the security of student testing instruments andadministration. Or they could generate long-term distortions in system performance(such as “teaching to the test” and neglect of other subjects) thatare difficult not only to detect but also to “cost.” What is the value of thelearning lost if teachers deliver a narrower curriculum? How does this valuecompare to the value of learning gains in the core subjects (math and language)that are typically tested? Ultimately, the cost-effectiveness of payfor-performanceprograms in education may hinge on the social utilityassigned to these and other possible tradeoffs. But given the relatively limiteddeveloping-country experience with such programs and the even morelimited longevity of these experiences, we are still in an early stage ofresearch, trying to build basic data on the extent to which these issues doarise over time, under different pay-for-performance program designs, andin different country contexts.
<strong>Making</strong> <strong>Schools</strong> <strong>Work</strong> through Accountability Reforms | 245The Political Economy of Service Delivery ReformService delivery failures stemming from weak public sector accountabilityare, at root, a political economy challenge as much as a technical one. Thecommon thread behind the three strategies highlighted in this book is thatthey all aim to realign the incentives of education system actors so thathigher-quality service provision to citizens is the result. As such, they arereforms that touch the broader political economy of education servicedelivery. The political dynamics of implementing these types of reforms isnot the focus of this book, but it cannot be ignored. First, the politicaldynamics determine the potential types and pace of reform in a givencountry context. But, second, an important feature of the accountabilityorientedreforms reviewed here is that they themselves can alter the politicaleconomy of education service provision.The politics of public service delivery are complex, even in democracieswhere citizens can ostensibly hold politicians accountable through the ballotbox (Devarajan and Widlund 2007; Keefer and Khemani 2005). Just ascomplex is the political economy of education reform. Direct incentives toteachers and school personnel in the form of performance pay, SBM programsthat extend autonomy at the school level, or programs that empowerparents with oversight over teacher performance can face resistance fromeducation bureaucracies and teachers’ unions. Indeed, Grindle’s 2004 analysisof key education reforms in Latin America during the 1990s showedhow reform movements stimulated counterreform movements in countryafter country. Education bureaucracies and teachers’ unions typically favorexpanded budgets in efforts to maintain or enlarge the size of the teachingforce (Hoxby 1996). For a given budget, unions and bureaucracies will alsotypically favor investments in teacher-related rather than nonteacherrelatedinvestments (Pritchett and Filmer 1999). Reform movements challengethese interests, which tend to resist even experimentation withchanges (Hanushek and Woessmann 2007).Finding systematic ways to overcome these political economy hurdlesis challenging. Grindle (2004) found it difficult to identify characteristicsthat could predict ex ante which reform efforts would be successful inLatin America. In most cases of major reform, the process was characterizedby stop-and-go efforts where reform proposals were put forward,faced pushback, in many cases were scaled down, and then only in somecases were successfully put in place. The process was idiosyncratic. Butmajor reforms have taken place. Despite having one of the region’s strongestteachers’ unions, the Mexican government has been able to introducestronger accountability for teachers through tests and to decentralizesignificant decision making to local levels (Álvarez, Garcia, and Patrinos2007).
246 | <strong>Making</strong> <strong>Schools</strong> <strong>Work</strong>Information can play a critical role in breaking the political deadlock. Itcan expose shortcomings and biases, and its wide dissemination can overcomeinformation asymmetries that perpetuate inequalities (Keefer andKhemani 2005; Majumdar, Mani, and Mukand 2004). Information aboutoutcomes, such as test scores, can become a basis for political competition,either at a national or local level (Khemani 2007). In addition, informationcan bolster change agents—those who might lead reform efforts.Strategic issues of sequencing, bundling, and packaging are bound to beimportant in any reform effort. Brazil’s radical 1997 education financingreform—Fundo para Manutenção e Desenvolvimento do Ensino Fundamental eValorização do Magistério (Fund for Primary Education Development andMaintenance and Enhancement of the Teaching Profession, or FUNDEF)—attacked sharp regional disparities in education funding by mandatingstates to share their resources with municipal education systems (Melo2007). Despite large scope for political resistance from states that wouldlose direct control over a substantial part of their revenues, FUNDEF’sdesign cleverly built a countervailing pro-reform constituency. First, thecapitation funding formula introduced by the reform created strong incentivesfor enrollment expansion, which implied hiring more teachers andbuilding more schools—generally the most politically salable reforms.Second, a mandate that 60 percent of the capitation funding go to teachersalaries implied increased salaries in many regions and got teachers onboard. Most important, by mandating a shift in resources to municipalschool systems, many of Brazil’s 5,000-plus mayors became importantpro-reform agents. <strong>Making</strong> this radical reform work required building asufficiently large coalition of actors who could expect to benefit politicallyand fiscally from the reform to balance the more concentrated oppositionfrom Brazil’s 26 states and the federal district.Reforms that involve teacher incentives—whether indirectly throughSBM or directly through performance pay—are among the most politicallysensitive. The reforms need to address issues of intrinsic motivation as wellas the level of pay. In the case of contract teachers, they also need to foreseethe likely demand for eventual regularization. Clearly some teachers havehigh intrinsic motivation to teach, and financial incentives that appear todemean that intrinsic motivation may create demoralization and backlash.Likewise, a perception that contract teachers are second-class—doing thesame work for less pay and less security—may cause frustration and resistanceto grow over time.It is important to recognize up-front that accountability-oriented reformsimplemented at any scale will likely face challenges, from both teachers’unions and education bureaucracies. <strong>Work</strong>ing as much as possible to createcoalitions for reform—and using information and communications channelsto drive home the goals and benefits of the reforms—is critical.
<strong>Making</strong> <strong>Schools</strong> <strong>Work</strong> through Accountability Reforms | 247But humility and flexibility may be equally important factors. As documentedin this book, not all interventions have produced improvements inlearning. Policy makers—and researchers—need to be willing to admit thatthis is the case and be ready to try alternatives. The policy process should befed by credible public information on inputs and outcomes so that progresscan be monitored transparently. Rigorous impact evaluations managed bythird parties can help establish the credibility of implementing agencies inseeking reforms that truly “work” rather than advancing an agenda. It isinteresting to note that despite heated controversy around education payfor performance in the United States, randomized trials of individual andgroup-based teacher bonus programs in three U.S. school districts gainedthe support of local teachers’ unions through the credible promise of methodologicallyrigorous, third-party evaluations and transparent reporting ofresults.Future DirectionsRigorous evaluations of education interventions in the developing world area relatively new phenomenon, but the number of cases is increasing rapidly.For example, a large and important set of evaluations in Sub-SaharanAfrica that have not yet generated results are not reported here. This bookwill not be the last word on accountability-focused interventions. But ourreview of the evidence to date suggests that future work should be encouragedalong at least two dimensions.First, given a sound theoretical framework—that is, a logical chain forhow an intervention might work to effect change—replication is an importanttool for deepening our understanding of what works, where, and why.The number and range of evaluations to date do not support a satisfyingsynthesis. Replicating successful models in different contexts is necessary toquantify the extent to which programs work under varying circumstances.Replicating interventions that have been successful in small-scale settingsat a regional or national level is necessary for confidence about what works“in the real world.”Second, the research discussed here points to the potential benefits ofinterventions that combine information, SBM, and teacher incentivereforms. There will be a high payoff to research designs that test variouscombinations and extensions of these approaches. Some of the studiesreviewed here had solid crossover designs, and these have played an outsizedrole in advancing our understanding. It is not easy to organize suchresearch; crossover designs require larger sample sizes and greater supervision.But given the evidence generated to date that reforms that make educationactors more accountable for results can motivate increased uptake
248 | <strong>Making</strong> <strong>Schools</strong> <strong>Work</strong>and more effective use of other education resources, this seems the mostpromising route to “making schools work.”Note1. Even percentage-point increases in attendance are hard to compare across settings:attending a school where little learning takes place is not the same asattending a school where a lot of learning takes place.ReferencesAlcazar, L., F. H. Rogers, N. Chaudhury, J. Hammer, M. Kremer, and K. Muralidharan.2006. “Why Are Teachers Absent? Probing Service Delivery in PeruvianPrimary <strong>Schools</strong>.” Development Economics Department, <strong>World</strong> <strong>Bank</strong>,Washington, DC.Álvarez, Jesus, Vicente Garcia, and Harry A. Patrinos. 2007. “Institutional Effects asDeterminants of Learning Outcomes: Exploring State Variations in Mexico.”Well-Being and Social Policy 3 (1): 47–68.Andrabi, Tahir, Jishnu Das, and Asim Khwaja. 2009. “Report Cards: The Impact ofProviding School and Child Test Scores on Educational Markets.” Unpublishedmanuscript, <strong>World</strong> <strong>Bank</strong>, Washington, DC.Banerjee, Abhijit V., Rukmini Banerji, Esther Duflo, Rachel Glennerster, and StutiKhemani. 2008. “Pitfalls of Participatory Programs: Evidence from a RandomizedEvaluation in Education in India.” Policy Research <strong>Work</strong>ing Paper 4584, <strong>World</strong><strong>Bank</strong>, Washington, DC.Banerjee, A. V., S. Cole, E. Duflo, and L. Linden. 2007. “Remedying Education:Evidence from Two Randomized Experiments in India.” The Quarterly Journal ofEconomics 122 (3): 1235–64.Bardhan, Pranab. 2002. “Decentralization of Governance and Development.” Journalof Economic Perspectives 16 (4): 185–205.Bardhan, Pranab, and Dilip Mookherjee. 2000. “Capture and Governance at Localand National Levels.” American Economic Review 90 (2): 135–39.———. 2005. “Decentralizing Antipoverty Program Delivery in Developing Countries.”Journal of Public Economics 89 (4): 675–704.Björkman, Martina. 2006. “Does Money Matter for Student Performance? Evidencefrom a Grant Program in Uganda.” <strong>Work</strong>ing Paper 326, IIES, StockholmUniversity, Sweden.Borman, G. D., G. M. Hewes, L. T. Overman, and S. Brown. 2003. “ComprehensiveSchool Reform and Achievement: A Meta-Analysis.” Review of EducationalResearch 73 (2): 125–230.Bourdon, Jean, Markus Frölich, and Katharina Michaelowa. 2007. “Teacher Shortages,Teacher Contracts and Their Impact on Education in Africa.” Institute for
<strong>Making</strong> <strong>Schools</strong> <strong>Work</strong> through Accountability Reforms | 249the Study of Labor (IZA) Discussion Paper 2844, IZA, Bonn, Germany. http://ideas.repec.org/p/iza/izadps/dp2844.html.Bruns, B., D. Evans, and J. Luque. 2010. Achieving <strong>World</strong> Class Education in Brazil: TheNext Agenda. Washington, DC: <strong>World</strong> <strong>Bank</strong>.Chaudhury, Nazmul, and Dilip Parajuli. 2010. “Giving It Back: Evaluating the Impactof Devolution of School Management to Communities in Nepal.” Unpublishedmanuscript, <strong>World</strong> <strong>Bank</strong>, Washington, DC.Das, J. 2008. “The Impact of Contracting Out School Management to NGOs and ofTransferring Budgets to School Councils.” PowerPoint presentation, <strong>World</strong><strong>Bank</strong>, Washington, DC.De Grauwe, A. 2005. “Improving the Quality of Education through School-BasedManagement: Learning from International Experiences. International Review ofEducation 51 (4): 269–87.Devarajan, Shantayanan, and Ingrid Widlund, eds. 2007. The Politics of Service Deliveryin Democracies. Better Access for the Poor. Expert Group on Development IssuesSecretariat, Ministry for Foreign Affairs, Stockholm, Sweden. http:// citeseerx.ist.psu.edu/viewdoc/download?doi=10.1.1.133.7367&rep=rep1&type=pdf.Duflo, E., P. Dupas, and M. Kremer. 2008. “Peer Effects, Pupil-Teacher Ratios, andTeacher Incentives: Evidence from a Randomization Evaluation in Kenya.”Unpublished manuscript, Abdul Latif Jameel Poverty Action Lab (JPAL), MassachusettsInstitute of Technology, Cambridge, MA.———. 2009. “Additional Resources versus Organizational Changes in Education:Experimental Evidence from Kenya.” Unpublished manuscript, AbdulLatif Jameel Poverty Action Lab (JPAL), Massachusetts Institute of Technology,Cambridge, MA.Duflo, E., R. Glennerster, and M. Kremer. 2008. “Using Randomization in DevelopmentEconomics Research: A Toolkit.” In Handbook of Development Economics,Vol. 4, ed. K. J. Arrow and M. D. Intriligator, 3895–962. Amsterdam:Elsevier.Duflo, E., R. Hanna, and S. Ryan. 2010. “Incentives <strong>Work</strong>: Getting Teachers toCome to School.” Unpublished manuscript, Abdul Latif Jameel Poverty ActionLab (JPAL), Massachusetts Institute of Technology, Cambridge, MA.Ferraz, C., and B. Bruns. Forthcoming. “Incentives to Teach: The Effects of PerformancePay in Brazilian <strong>Schools</strong>.” <strong>World</strong> <strong>Bank</strong>, Washington, DC.Gertler, P., H. A. Patrinos, and E. Rodríguez-Oreggia. 2010. “Parental Empowermentin Mexico: Randomized Experiment of the Apoyo a la Gestión Escolar(AGE) in Rural Primary <strong>Schools</strong> in Mexico: Preliminary Findings.” Unpublishedmanuscript, <strong>World</strong> <strong>Bank</strong>, Washington, DC.Gertler, P., H. A. Patrinos, and M. Rubio-Codina. 2006. “Empowering Parents toImprove Education. Evidence from Rural Mexico.” Policy Research <strong>Work</strong>ingPaper 3935, <strong>World</strong> <strong>Bank</strong>, Washington, DC.———. 2007. “Methodological Issues in the Evaluation of School-Based ManagementReforms.” Doing Impact Evaluation No. 10, <strong>World</strong> <strong>Bank</strong>, Washington,DC.Glewwe, P., N. Ilias, and M. Kremer. 2010. “Teacher Incentives.” American EconomicJournal: Applied Economics 2 (3): 205–27.
250 | <strong>Making</strong> <strong>Schools</strong> <strong>Work</strong>Grindle, Merilee. 2004. Despite the Odds: The Contentious Politics of Educational Reform.Princeton, NJ: Princeton University Press.Goyal, S., and P. Pandey. 2009. “How Do Government and Private <strong>Schools</strong> Differ?Findings from Two Large Indian States.” South Asia Human Development SectorReport 30, <strong>World</strong> <strong>Bank</strong>, Washington, DC.Hanushek, Eric A., and Ludger Woessmann. 2007. “The Role of Education Qualityfor Economic Growth.” Policy Research <strong>Work</strong>ing Paper 4122, <strong>World</strong> <strong>Bank</strong>,Washington, DC.Hoxby, Caroline. 1996. “How Teachers’ Unions Affect Education Production.” TheQuarterly Journal of Economics 111 (3): 671–718.Hoxby, C. M., and A. Leigh. 2004. “Pulled Away or Pushed Out? Explaining theDecline of Teacher Aptitude in the United States.” American Economic Review 94(2): 236–46.Jakubowski, M., H. A. Patrinos, E. E. Porta, and J. Wisniewski. 2010. “The Impactof the 1999 Education Reform in Poland.” Policy Research <strong>Work</strong>ing Paper5263, <strong>World</strong> <strong>Bank</strong>, Washington, DC.Keefer, Philip, and Stuti Khemani. 2005. “Democracy, Public Expenditures, and thePoor: Understanding Political Incentives for Providing Public Services.” <strong>World</strong><strong>Bank</strong> Research Observer 20 (1): 1–28.Khemani, Stuti. 2007. “Can Information Campaigns Overcome Political Obstaclesto Serving the Poor?” In The Politics of Service Delivery in Democracies. Better Accessfor the Poor, ed. Shantayanan Devarajan and Ingrid Widlund. Expert Groupon Development Issues Secretariat, Ministry for Foreign Affairs, Stockholm,Sweden. http://citeseerx.ist.psu.edu/viewdoc/download?doi=10.1.1.133.7367&rep=rep1&type=pdf.Kremer, M. E., P. Glewwe, D. Chen, and S. Moulin. 2001. “Interim Report on aTeacher Incentive Program in Kenya.” Unpublished paper, Harvard University,Cambridge, MA.Kremer, M., and A. Holla. 2009. “Improving Education in the Developing <strong>World</strong>:What Have We Learned from Randomized Evaluations?” Annual Review of Economics1: 513–42.Lavy, V. 2002. “Evaluating the Effect of Teachers’ Group Performance Incentives onPupil Achievement.” The Journal of Political Economy 110 (6): 1286–317.———. 2009. “Performance Pay and Teachers’ Effort, Productivity, and GradingEthics.” The American Economic Review 99 (5): 1979–2011.Li, Tao, Li Han, Scott Rozelle, and Linxiu Zhang. 2010. “Cash Incentives, PeerTutoring, and Parental Involvement: A Study of Three Educational Inputsin a Randomized Field Experiment in China.” Unpublished manuscript,Peking University, Beijing, China. http://mitsloan.mit.edu/neudc/papers/paper_223.pdf.Majumdar, Sumon, Anandi Mani, and Sharun Mukand. 2004. “Politics, Informationand the Urban Bias.” Journal of Development Economics 75 (1): 137–65.Melo, Marcus André. 2007. “The Politics of Service Delivery Reform: ImprovingBasic Education in Brazil.” In The Politics of Service Delivery in Democracies. BetterAccess for the Poor, ed. Shantayanan Devarajan and Ingrid Widlund. Expert Groupon Development Issues Secretariat, Ministry for Foreign Affairs, Stockholm,
<strong>Making</strong> <strong>Schools</strong> <strong>Work</strong> through Accountability Reforms | 251Sweden. http://citeseerx.ist.psu.edu/viewdoc/download?doi=10.1.1.133.7367&rep=rep1&type=pdf.Mizala, Alejandra, and Miguel Urquiola. 2007. “School Markets: The Impact ofInformation Approximating <strong>Schools</strong>’ Effectiveness.” National Bureau of EconomicResearch <strong>Work</strong>ing Paper 13676, NBER, Cambridge, MA.Muralidharan, K., and V. Sundararaman. 2009. “Teacher Performance Pay: ExperimentalEvidence from India.” National Bureau of Economic Research <strong>Work</strong>ingPaper 15323, NBER, Cambridge, MA.———. 2010a. “Contract Teachers: Experimental Evidence from India.” Unpublishedpaper, <strong>World</strong> <strong>Bank</strong>, Washington, DC.———. 2010b. “The Impact of Diagnostic Feedback to Teachers on Student Learning:Experimental Evidence from India.” The Economic Journal 120 (546):F187–F203.Pandey, Priyanka, Sangeeta Goyal, and Venkatesh Sundararaman. 2009. “CommunityParticipation in Public <strong>Schools</strong>: Impact of Information Campaigns in ThreeIndian States.” Education Economics 17 (3): 355–75.———. 2010. “Community Participation in Public <strong>Schools</strong>: Impact of InformationCampaigns in Three Indian States.” Draft, <strong>World</strong> <strong>Bank</strong>, Washington, DC.Patrinos, H. A. 2009. “School-Based Management.” Unpublished manuscript,<strong>World</strong> <strong>Bank</strong>, Washington, DC.Patrinos, H. A., J. Guáqueta, H. Bannayan, O. Obeidat, and E. Porta. Forthcoming.“Case Study: Jordan Education Initiative.” In Public-Private Partnerships in Education:The Role of Private Donor Philanthropy in Education Systems, ed. F. Barrera-Osorio and J. Guáqueta. Washington, DC: <strong>World</strong> <strong>Bank</strong>.Paul, Samuel, 2002. Holding the State to Account: Citizen Monitoring in Action. Bangalore,India: Books for Change.Piper, Benjamin, and Medina Korda. 2010. “EGRA Plus: Liberia.” Program EvaluationReport draft, RTI International, Research Triangle Park, NC.Pritchett, Lant, and Deon Filmer. 1999. “What Education Production FunctionsReally Show: A Positive Theory of Education Expenditures.” Economics of EducationReview 18 (2): 223–39.Rau, T., and D. Contreras. 2009. “Tournaments, Gift Exchanges, and the Effect ofMonetary Incentives for Teachers: The Case of Chile.” Department of Economics<strong>Work</strong>ing Paper 305, University of Chile, Santiago.Reinikka, Ritva, and Jakob Svensson. 2005. “Fighting Corruption to ImproveSchooling: Evidence from a Newspaper Campaign in Uganda.” Journal of theEuropean Economic Association 3 (2–3): 259–67.———. 2006. “The Power of Information: Evidence from a Newspaper Campaignto Reduce Capture of Public Funds.” Unpublished manuscript, Institute forInternational Economic Studies, Stockholm, Sweden; <strong>World</strong> <strong>Bank</strong>, Washington,DC. http://people.su.se/~jsven/information2006a.pdf.Vegas, Emiliana, and Joost De Laat. 2003. “Do Differences in Teacher ContractsAffect Student Performance? Evidence from Togo.” Policy Research <strong>Work</strong>ingPaper No. 26955, <strong>World</strong> <strong>Bank</strong>, Washington, DC.<strong>World</strong> <strong>Bank</strong>. 2003. <strong>World</strong> Development Report 2004: <strong>Making</strong> Services <strong>Work</strong> for Poor People.Washington, DC: <strong>World</strong> <strong>Bank</strong>.
ECO-AUDITEnvironmental Benefits StatementThe <strong>World</strong> <strong>Bank</strong> is committed to preservingendangered forests and natural resources.The Office of the Publisher has chosen toprint <strong>Making</strong> <strong>Schools</strong> <strong>Work</strong>: New Evidenceon Accountability Reforms on recycledpaper with 50 percent postconsumer fiberin accordance with the recommended standardsfor paper usage set by the Green PressInitiative, a nonprofit program supportingpublishers in using fiber that is not sourcedfrom endangered forests. For more information,visit www.greenpressinitiative.org.Saved:• 9 trees• 3 million BTUsof total energy• 850 pounds of netgreenhouse gases• 4,096 gallons ofwaste water• 249 pounds ofsolid waste
“ This book comes along at a critical juncture, as one of the most important issues facingcountries today is how to improve school performance. What distinguishes the book fromothers is that it is based on proven evidence about what works, as opposed to well-meaningspeculation. This is a must-read for anyone interested in improving school performance.”Paul J. Gertler, Li Ka Shing Professor of Economics and Policy Analysis, Haas School ofBusiness, University of California, Berkeley“ Debate rages in the development community: Do rigorous micro-studies of specific interventionsin single settings generate any useful evidence on the big questions about growth andtransformation in low-income countries? The authors of this book manage brilliantly the trickof finding transferable meta-policy lessons from the micro-evidence. They bring honestyand clarity to the search for answers to what is a dilemma for rich as well as poor countries:How can school systems be made to work for children? A must-read for economists andeducators everywhere.”Nancy Birdsall, President, Center for Global Development“ Bruns, Filmer, and Patrinos assemble and bring to light a range of evidence on the importantand controversial topic of school accountability. The authors set forth their perspective ina readable, accessible way. This will be an influential piece in the field.”Michael Kremer, Gates Professor of Developing Societies, Department of Economics,Harvard University“ This important book takes stock of a decade of research on education reform in developingcountries. It is remarkable for the care it takes to account for all the evidence, weighting eachstudy for its reliability rather than whether or not the results fit a preconceived point of view.If you are looking for a magic bullet to fix schools in developing countries, this is not thebook for you. For what the book shows is that none has been found yet. This is not to saythere is no hope: information, teacher incentives, school-based management: all have thepotential to make a difference. But details matter crucially, and this book masterfully showshow, and why.”Esther Duflo, Abdul Latif Jameel Professor of Poverty Alleviation and DevelopmentEconomics, Massachusetts Institute of Technology, and Director of the Abdul Latif JameelPoverty Action Lab (J-PAL)“ This is a landmark book on education in developing countries. Thanks to better knowledgeon the determinants of education quality, to national and international student learningassessment, and to decades of support for basic education in developing countries,a number of experiences around the world are producing positive results. This is preciselythe ground on which this book moves. It reports the latest evidence on innovative initiativesto improve education results in the developing world that can serve as examples forcountries that still lag behind.”Paulo Renato Souza, former Minister of Education of Brazil and former Secretary ofEducation of the State of São Paulo, BrazilISBN 978-0-8213-8679-8SKU 18679