Railway Safety Performance in the European Union - ERA - Europa
Railway Safety Performance in the European Union - ERA - Europa
Railway Safety Performance in the European Union - ERA - Europa

You also want an ePaper? Increase the reach of your titles
YUMPU automatically turns print PDFs into web optimized ePapers that Google loves.
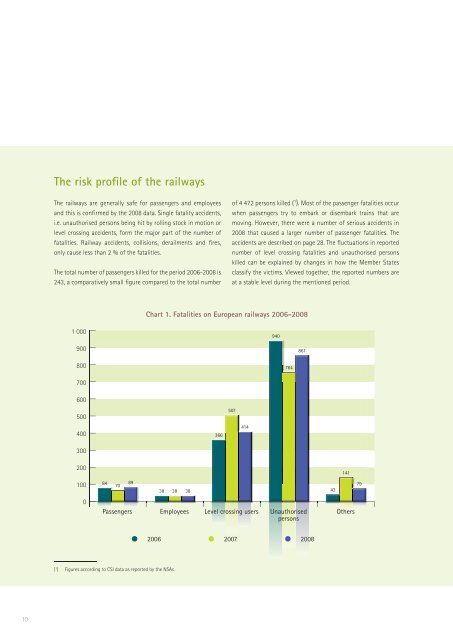
The risk profile of <strong>the</strong> railways<br />
The railways are generally safe for passengers and employees<br />
and this is confirmed by <strong>the</strong> 2008 data. S<strong>in</strong>gle fatality accidents,<br />
i.e. unauthorised persons be<strong>in</strong>g hit by roll<strong>in</strong>g stock <strong>in</strong> motion or<br />
level cross<strong>in</strong>g accidents, form <strong>the</strong> major part of <strong>the</strong> number of<br />
fatalities. <strong>Railway</strong> accidents, collisions, derailments and fires,<br />
only cause less than 2 % of <strong>the</strong> fatalities.<br />
The total number of passengers killed for <strong>the</strong> period 2006-2008 is<br />
243, a comparatively small figure compared to <strong>the</strong> total number<br />
of 4 472 persons killed ( 1 ). Most of <strong>the</strong> passenger fatalities occur<br />
when passengers try to embark or disembark tra<strong>in</strong>s that are<br />
mov<strong>in</strong>g. However, <strong>the</strong>re were a number of serious accidents <strong>in</strong><br />
2008 that caused a larger number of passenger fatalities. The<br />
accidents are described on page 28. The fluctuations <strong>in</strong> reported<br />
number of level cross<strong>in</strong>g fatalities and unauthorised persons<br />
killed can be expla<strong>in</strong>ed by changes <strong>in</strong> how <strong>the</strong> Member States<br />
classify <strong>the</strong> victims. Viewed toge<strong>the</strong>r, <strong>the</strong> reported numbers are<br />
at a stable level dur<strong>in</strong>g <strong>the</strong> mentioned period.<br />
Chart 1. Fatalities on <strong>European</strong> railways 2006-2008<br />
1 000<br />
940<br />
900<br />
861<br />
800<br />
764<br />
700<br />
600<br />
500<br />
400<br />
300<br />
366<br />
507<br />
414<br />
200<br />
100<br />
0<br />
84<br />
70<br />
89<br />
38 38 38<br />
Passengers Employees Level cross<strong>in</strong>g users Unauthorised<br />
persons<br />
141<br />
79<br />
43<br />
O<strong>the</strong>rs<br />
• 2006 • 2007 • 2008<br />
( 1 ) Figures accord<strong>in</strong>g to CSI data as reported by <strong>the</strong> NSAs.<br />
10