Cableways Impact Assessment Study - Final Report - saferail.nl
Cableways Impact Assessment Study - Final Report - saferail.nl
Cableways Impact Assessment Study - Final Report - saferail.nl

You also want an ePaper? Increase the reach of your titles
YUMPU automatically turns print PDFs into web optimized ePapers that Google loves.
Risk & Policy Analysts<br />
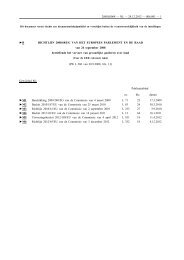
Figure 2.1: Proportion (in %) of New Cableway Installations Accounted for by Region<br />
Table 2.3: Number of <strong>Cableways</strong> Installed by Region (2001-2010)<br />
2001 2002 2003 2004 2005 2006 2007 2008 2009 2010<br />
The Alps 172 161 194 186 218 167 136 117 127 108<br />
Western Europe<br />
(excl. the Alps)<br />
16 29 27 46 35 38 31 20 19 22<br />
The Americas 37 27 40 55 37 47 46 46 26 28<br />
Asia and Pacific 8 14 10 7 16 24 16 22 15 10<br />
Eastern Europe<br />
and Central Asia<br />
26 12 42 35 55 80 47 47 40 57<br />
Other 2 1 0 1 5 0 0 1 3 1<br />
Total 261 244 313 330 366 356 276 253 230 226<br />
Source: Lift-World (nd)<br />
2.2.2 European Cableway Market<br />
Overview<br />
Table 2.3 shows that Europe is the largest market for cableways in the world, with<br />
around 80% of new cableway installations being constructed in Europe and Central<br />
Asia (which is assumed to account for a very small part of the market).<br />
Data by OITAF (published in DARE, 2009) indicate that there are around 17,500<br />
cableway installations in Europe; these make up around 60% of the estimated 30,000<br />
cableway installations worldwide. The main European markets for cableways are<br />
France, Austria, Italy, Germany and Switzerland; together these markets account for<br />
over 50% of all cableway installations in Europe and are considered further below.<br />
Page 5