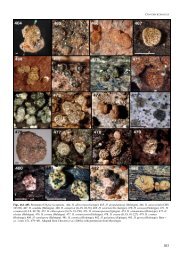
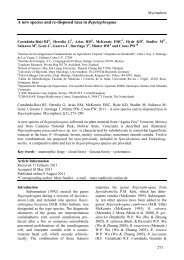
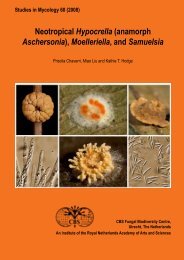
Crous et al. Fig. 3. Morphological structures of Pseudocercospora spp. A. Synnematous conidiophore. B. Densely aggregated fascicle of conidiophores with well-developed brown stroma. C, D. Loosely branched fascicles of conidiophores with moderate (C) and poorly (D) developed brown stroma. E. Fascicle reduced to conidiogenous cells. F. Conidiophore fascicles aris<strong>in</strong>g from stomata. G, H. Solitary conidiogenous cells on superficial hyphae. I. Geniculate conidiophore (arrow) with truncate apical locus. J, K. Conidiophores branched below (arrows). L. Conidiogenous cells with percurrent proliferations (arrows). M, N. Conidiophores with sympodial proliferation. O. Conidiophores with conidiogenous cells (note m<strong>in</strong>utely thickened scars, arrows). P. Subcyl<strong>in</strong>drical conidium with subacute apex and truncate base. Q. Conidia with constrictions at septa. R. Conidium with guttules. S. Cyl<strong>in</strong>drical conidium with obtuse apex, and truncate base. T. Undulate conidia. U. Curved conidium. Aseptate to 1-septate conidia. V. 1-septate conidia. W, X. Obclavate conidia with obconical base. Y. Obclavate conidium with short obconical base. Z. Dark brown, muriformly euseptate conidia (thick-walled, not distoseptate). 40
Phylogenetic l<strong>in</strong>eages <strong>in</strong> Pseudocercospora MATERIALS AND METHODS Isolates Direct isolations were made from fascicles of conidiophores on leaves. Some leaves were <strong>in</strong>cubated <strong>in</strong> moist chambers for up to 1 wk to enhance sporulation before s<strong>in</strong>gle conidial colonies were established on 2 % malt extract agar (MEA) (Crous 2002). Leaf spots bear<strong>in</strong>g ascomata were soaked <strong>in</strong> water for approximately 2 h, after which they were attached to the <strong>in</strong>ner surface of Petri dish lids over plates conta<strong>in</strong><strong>in</strong>g MEA. Ascospore germ<strong>in</strong>ation patterns were exam<strong>in</strong>ed after 24 h, and s<strong>in</strong>gle ascospore and conidial cultures established as described previously (Crous et al. 1991, Crous 1998). Colonies were sub-cultured onto synthetic nutrient-poor agar (SNA), potato-dextrose agar (PDA), oatmeal agar (OA), and MEA (Crous et al. 2009d), and <strong>in</strong>cubated at 25 °C under cont<strong>in</strong>uous near-ultraviolet light to promote sporulation. Isolates were also sourced from the culture collections of the <strong>CBS</strong>-KNAW Fungal Biodiversity Centre (<strong>CBS</strong>), the work<strong>in</strong>g collection of Pedro Crous (CPC), Chiharu Nakashima (CNS) and the culture collection of the laboratory of plant pathology, Mie University, Japan (MUCC), and the mycological herbarium of Mie University (MUMH). Furthermore, isolates represent<strong>in</strong>g fungal species from genera allied to Pseudocercospora, e.g. Cercospora, Cercostigm<strong>in</strong>a, Cyphellophora, Davidiella, Dissoconium, Miuraea, Mycocentrospora, Passalora, Phaeoisariopsis, Phleospora, Septoria, Strelitziana, Stigm<strong>in</strong>a, Teratosphaeria, Thedgonia, Trochophora, and Xenostigm<strong>in</strong>a, were <strong>in</strong>cluded <strong>in</strong> this study (Table 1). DNA isolation Mycelium from actively grow<strong>in</strong>g fungal cultures was scraped from the surface of MEA or PDA plates us<strong>in</strong>g a sterile scalpel blade. Harvested mycelium was ground to a f<strong>in</strong>e powder us<strong>in</strong>g liquid nitrogen and DNA was isolated us<strong>in</strong>g the CTAB extraction protocol as outl<strong>in</strong>ed by Crous et al. (2009d) or the UltraClean TM Microbial DNA Isolation Kit (MoBio Laboratories, Inc., Solana Beach, CA, USA) follow<strong>in</strong>g the manufacturers’ protocols. Isolated DNA was visualised by electrophoresis <strong>in</strong> 1 % agarose gels (w/v) sta<strong>in</strong>ed with ethidium bromide and viewed under near ultra-violet light. DNA concentrations were determ<strong>in</strong>ed by measur<strong>in</strong>g electrophoresed DNA samples aga<strong>in</strong>st a HyperLadder TM I molecular marker (BIOLINE) or alternatively by a NanoDrop quantification as outl<strong>in</strong>ed by the manufacturer. PCR amplification DNA isolated from fungal isolates was used as template for further Polymerase Cha<strong>in</strong> Reaction (PCR) amplifications. Four nuclear gene regions were targeted for PCR amplification and subsequent sequenc<strong>in</strong>g. These regions <strong>in</strong>cluded the Internal Transcribed Spacer regions ITS-1, ITS-2 and the 5.8S nrRNA gene regions (ITS), the first 900 bp of the Large Subunit (28S, LSU) (doma<strong>in</strong>s D1–D3) of the rDNA operon and partial gene regions of the translation elongation factor 1-alpha (EF-1α) and the act<strong>in</strong> (ACT) genes. The ITS region was amplified us<strong>in</strong>g primers ITS-1 or ITS-5 and ITS-4 (White et al. 1990) while primers used for amplification of the LSU region were LR0R (Rehner & Samuels 1994) or LSU1Fd (Crous et al. 2009b) and LR5 or LR7 (Vilgalys & Hester 1990). Primers employed for the amplification of EF-1α <strong>in</strong>cluded EF1- 728F and EF1-986R (Carbone & Kohn 1999) or EF-2 (O’Donnell et al. 1998) while ACT-512F and ACT-783R (Carbone & Kohn 1999) were used to amplify a portion of the ACT gene. All PCR reaction mixtures and conditions followed those outl<strong>in</strong>ed by Hunter et al. (2006b). Follow<strong>in</strong>g PCR amplification, amplicons were visualized on 1.5 % agarose gels sta<strong>in</strong>ed with ethidium bromide and viewed under ultra-violet light and sizes of amplicons were determ<strong>in</strong>ed aga<strong>in</strong>st a HyperLadder TM I molecular marker (BIOLINE). The PCR amplicons for the four loci were subsequently diluted 1 to 10 times <strong>in</strong> preparation for further DNA sequenc<strong>in</strong>g reactions. DNA sequenc<strong>in</strong>g and phylogenetic <strong>in</strong>ference PCR amplicons of the four gene regions targeted <strong>in</strong> this study served as templates for DNA sequenc<strong>in</strong>g reactions with the BigDye® Term<strong>in</strong>ator Cycle Sequenc<strong>in</strong>g Kit v. 3.1 (Applied Biosystems Life Technologies, Carlsbad, CA, USA) follow<strong>in</strong>g the protocol of the manufacturer. DNA sequenc<strong>in</strong>g reactions used the same primers as those for the PCR reactions. However, additional <strong>in</strong>ternal primers LR3R (http://www.biology.duke.edu/fungi/mycolab/ primers.htm), LR16 (Moncalvo et al. 1993) and LR5 were used to sequence the LSU <strong>in</strong> order to obta<strong>in</strong> reliable sequences spann<strong>in</strong>g the entire D1-D3 region. DNA sequenc<strong>in</strong>g amplicons were purified through Sephadex® G-50 Superf<strong>in</strong>e columns (Sigma Aldrich, St. Louis, MO) <strong>in</strong> MultiScreen HV plates (Millipore, Billerica, MA). Purified sequence reactions were run on an ABI Prism 3730xl DNA Sequencer (Life Technologies, Carlsbad, CA, USA). Generated DNA sequence electropherograms were analysed us<strong>in</strong>g MEGA (Molecular Evolutionary Genetics Analysis) v. 4.0 (Tamura et al. 2007), 4Peaks v. 1.7.2 (http://www.mekentosj.com/) and SeqMan v. 8.0.2. from the DNASTAR Lasergene® software package. Consensus sequences were generated and imported <strong>in</strong>to MEGA for <strong>in</strong>itial alignment and the construction of sequence datasets. DNA sequences represent<strong>in</strong>g isolates of closely allied genera, for which material could not be obta<strong>in</strong>ed were downloaded from the NCBI GenBank nucleotide database (www.ncbi.nlm.nih. gov) and added to the DNA sequence datasets generated <strong>in</strong> this study. Sequence datasets for the four genomic loci were aligned <strong>in</strong> MAFFT (“Multiple alignment program for am<strong>in</strong>o acids or nucleotide sequences”) v. 6.0 (Katoh & Toh 2006, Katoh et al. 2005; http:// mafft.cbrc.jp/alignment/server/<strong>in</strong>dex.html) us<strong>in</strong>g the Auto alignment strategy with the 200PAM/ K=2 scor<strong>in</strong>g matrix and a gap open<strong>in</strong>g penalty of 1.53 with an offset value of 0.0. Result<strong>in</strong>g sequence alignments were manually evaluated and adjusted <strong>in</strong> MEGA, MacClade v.4.08 (Maddison & Maddison 2000) or Sequence Alignment Editor v. 2.0a11 (Rambaut 2002). A phylogenetic re-construction was conducted for the aligned LSU data set to determ<strong>in</strong>e generic relationships us<strong>in</strong>g MrBayes v. 3.1.2 (Ronquist & Huelsenbeck 2003). Subsequently, a species level phylogeny was derived from the comb<strong>in</strong>ed ITS, ACT and EF- 1α alignment of Pseudocercospora s. str. sequences us<strong>in</strong>g PAUP v. 4.0b10 (Swofford 2003). For the LSU alignment, MrModeltest v. 2.2 (Nylander 2004) was used to determ<strong>in</strong>e the best nucleotide substitution model sett<strong>in</strong>gs for MrBayes. Based on the results of the MrModeltest, a phylogenetic analysis was performed with MrBayes v. 3.1.2 apply<strong>in</strong>g a general time-reversible (GTR) substitution model with <strong>in</strong>verse gamma rates and dirichlet base frequencies and a heat<strong>in</strong>g parameter set at 0.3. The Markov Cha<strong>in</strong> Monte Carlo (MCMC) analysis of 4 cha<strong>in</strong>s started <strong>in</strong> parallel from a random tree topology and had 8 000 000 generations. Trees were saved each www.studies<strong>in</strong>mycology.org 41