Annual Report 2012 - Cadogan
Annual Report 2012 - Cadogan Annual Report 2012 - Cadogan
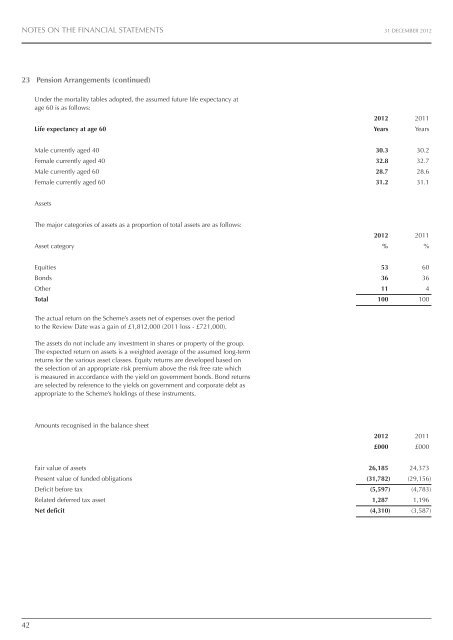
NOTES ON THE FINANCIAL STATEMENTS 31 DECEMBER 2012 23 Pension arrangements (continued) Under the mortality tables adopted, the assumed future life expectancy at age 60 is as follows: life expectancy at age 60 2012 2011 Years Years Male currently aged 40 Female currently aged 40 Male currently aged 60 Female currently aged 60 30.3 30.2 32.8 32.7 28.7 28.6 31.2 31.1 Assets The major categories of assets as a proportion of total assets are as follows: Asset category 2012 2011 % % Equities Bonds Other total 53 60 36 36 11 4 100 100 The actual return on the Scheme’s assets net of expenses over the period to the Review Date was a gain of £1,812,000 (2011 loss - £721,000). The assets do not include any investment in shares or property of the group. The expected return on assets is a weighted average of the assumed long-term returns for the various asset classes. Equity returns are developed based on the selection of an appropriate risk premium above the risk free rate which is measured in accordance with the yield on government bonds. Bond returns are selected by reference to the yields on government and corporate debt as appropriate to the Scheme’s holdings of these instruments. Amounts recognised in the balance sheet 2012 2011 £000 £000 Fair value of assets Present value of funded obligations Deficit before tax Related deferred tax asset net deficit 26,185 24,373 (31,782) (29,156) (5,597) (4,783) 1,287 1,196 (4,310) (3,587) 42
NOTES ON THE FINANCIAL STATEMENTS 31 DECEMBER 2012 23 Pension arrangements (continued) Amounts recognised in the statement of total recognised gains and losses over the year 2012 2011 £000 £000 Actuarial gains and losses Effect of limit on recognisable surplus total amount recognised in statement of total recognised gains and losses (1,240) (5,845) – – (1,240) (5,845) Amounts recognised in the profit and loss account over the year 2012 2011 £000 £000 Current service cost Interest cost Expected return on assets total amounts recognised in the profit and loss account over the year (159) (248) (1,357) (1,318) 1,219 1,556 (297) 10 Reconciliation of assets and defined benefit obligation The change in assets over the year was: 2012 2011 £000 £000 Fair value of assets at 1 January Expected return on assets Employer contributions Benefits paid Actuarial gain/(loss) on assets Fair value of assets at 31 December 24,373 25,094 1,219 1,556 723 537 (723) (537) 593 (2,277) 26,185 24,373 The change in defined benefit obligation over the year was: 2012 2011 £000 £000 Defined benefit obligation at 1 January Current service cost Interest cost Benefits paid Actuarial loss Defined benefit obligation at 31 December 29,156 24,559 159 248 1,357 1,318 (723) (537) 1,833 3,568 31,782 29,156 43
- Page 1 and 2: CADOGAN GROUP LIMITED Annual Report
- Page 3 and 4: CHAIRMAN’S STATEMENT 31 DECEMBER
- Page 5 and 6: Financial Highlights GROSS RENTS AN
- Page 8: CHIEF ExECUTIVE’S REVIEW 31 DECEM
- Page 12: CHIEF ExECUTIVE’S REVIEW 31 DECEM
- Page 16 and 17: CHIEF ExECUTIVE’S REVIEW 31 DECEM
- Page 18: CHIEF ExECUTIVE’S REVIEW 31 DECEM
- Page 21 and 22: 20 DIRECTORS’ REPORT 31 DECEMBER
- Page 23 and 24: INDEPENDENT AUDITOR’S REPORT 31 D
- Page 25 and 26: CONSOLIDATED BALANCE SHEET 31 DECEM
- Page 27 and 28: COMPANY BALANCE SHEET 31 DECEMBER 2
- Page 29 and 30: NOTES ON THE FINANCIAL STATEMENTS 3
- Page 31 and 32: NOTES ON THE FINANCIAL STATEMENTS 3
- Page 33 and 34: NOTES ON THE FINANCIAL STATEMENTS 3
- Page 35 and 36: NOTES ON THE FINANCIAL STATEMENTS 3
- Page 37 and 38: NOTES ON THE FINANCIAL STATEMENTS 3
- Page 39 and 40: NOTES ON THE FINANCIAL STATEMENTS 3
- Page 41 and 42: NOTES ON THE FINANCIAL STATEMENTS 3
- Page 43: NOTES ON THE FINANCIAL STATEMENTS 3
- Page 47 and 48: FIVE YEAR SUMMARY 31 DECEMBER 2012
NOTES ON THE FINANCIAL STATEMENTS 31 DECEMBER <strong>2012</strong><br />
23 Pension arrangements (continued)<br />
Under the mortality tables adopted, the assumed future life expectancy at<br />
age 60 is as follows:<br />
life expectancy at age 60<br />
<strong>2012</strong> 2011<br />
Years Years<br />
Male currently aged 40<br />
Female currently aged 40<br />
Male currently aged 60<br />
Female currently aged 60<br />
30.3 30.2<br />
32.8 32.7<br />
28.7 28.6<br />
31.2 31.1<br />
Assets<br />
The major categories of assets as a proportion of total assets are as follows:<br />
Asset category<br />
<strong>2012</strong> 2011<br />
% %<br />
Equities<br />
Bonds<br />
Other<br />
total<br />
53 60<br />
36 36<br />
11 4<br />
100 100<br />
The actual return on the Scheme’s assets net of expenses over the period<br />
to the Review Date was a gain of £1,812,000 (2011 loss - £721,000).<br />
The assets do not include any investment in shares or property of the group.<br />
The expected return on assets is a weighted average of the assumed long-term<br />
returns for the various asset classes. Equity returns are developed based on<br />
the selection of an appropriate risk premium above the risk free rate which<br />
is measured in accordance with the yield on government bonds. Bond returns<br />
are selected by reference to the yields on government and corporate debt as<br />
appropriate to the Scheme’s holdings of these instruments.<br />
Amounts recognised in the balance sheet<br />
<strong>2012</strong> 2011<br />
£000 £000<br />
Fair value of assets<br />
Present value of funded obligations<br />
Deficit before tax<br />
Related deferred tax asset<br />
net deficit<br />
26,185 24,373<br />
(31,782) (29,156)<br />
(5,597) (4,783)<br />
1,287 1,196<br />
(4,310) (3,587)<br />
42


